the Creative Commons Attribution 4.0 License.
the Creative Commons Attribution 4.0 License.
 | 14 Dec 2020
Assessments of land subsidence along the Rizhao–Lankao high-speed railway at Heze, China, between 2015 and 2019 with Sentinel-1 data
Wenhao Wu
Mahdi Motagh
Liya Zhang
Zongli Jiang
Sichun Long
The Heze section of Rizhao–Lankao high-speed railway (RLHR-HZ) has been under construction since 2018 and will be in operation by the end of 2021. However, there is a concern that land subsidence in the Heze region may affect the regular operation of RLHR-HZ. In this study, we investigate the contemporary ground deformation in the region between 2015 and 2019 by using more than 350 C-band interferograms constructed from two tracks of Sentinel-1 data over the region. The small baseline subset (SBAS) technique is adopted to compile the time-series displacement. We find that the RLHR-HZ runs through two main subsidence areas: one is located east of the Heze region with rates ranging from −4 to −1 cm yr−1, and another one is located in the coalfield with rates ranging from −8 to −2 cm yr−1. A total length of 35 km of RLHR-HZ is affected by the two subsidence basins. Considering the previous investigation and the monthly precipitation, we infer that the subsidence bowl east of the Heze region is due to massive extraction of deep groundwater. Close inspections of the relative locations between the second subsidence area and the underground mining reveals that the subsidence there is probably caused by the groundwater outflow and fault instability due to mining, rather than being directly caused by mining. The InSAR-derived ground subsidence implies that it is necessary to continue monitoring the ground deformation along RLHR-HZ.
- Article
(30858 KB) - Full-text XML
- BibTeX
- EndNote


The Heze region, lying in the North China Plain, has been adversely affected for decades by ground subsidence, mainly caused by the soil compaction and consolidation due to the excessive exploitation of aquifer (Cui, 2018; Hu et al., 2004; Guo et al., 2019; Xue et al., 2005). To slow down the subsidence, the local governments have proposed new regulations on exploitation of groundwater. However, groundwater extraction is still greater than recharge due to the urban sprawl and industrial development, which results in continuous ground subsidence. In addition, underground mining activities have also exacerbated the problems of subsidence in recent years (Wang, 2014; Yang et al., 2010). The resulting subsidence has already caused some environment hazards, e.g., collapse of roads, buildings and other infrastructures (Yue, 2020).
The RLHR-HZ, with a length of 150 km and a speed of 300 km h−1, has been under construction since December 2018 and will be operative by the end of 2021. The ground subsidence may menace the RLHR-HZ and therefore currently is a matter of major safety concern. It is crucial to monitor ground deformation along the RLHR-HZ to avoid potential hazards in the future.
Field surveying based on a few sparse points, using spirit leveling and a global position system (GPS) for example, is the main method for measuring ground deformation in the Heze region. However, it is difficult to obtain detailed and comprehensive deformation based on these sparse points. Moreover, these geodetic measurements are very time-consuming and highly labor intensive, especially for the RLHR-HZ extending over a large region. More advanced methods are required to retrieve the latest temporal and spatial evolution of ground deformation along the RLHR-HZ.
Utilizing the conjugate product (i.e., interferogram) of two co-registered SAR images, interferometric synthetic aperture radar (InSAR) can remotely map the ground deformation over a large area (Gabriel et al., 1989; Massonnet and Feigl, 1998). However, several factors such as atmospheric effect, orbit, topography error and other noise limit the accuracy of InSAR. Multi-temporal InSAR (MT-InSAR), such as persistent scatter interferometry (PSI) (Ferretti et al., 2000, 2001; Hooper et al., 2007; Kampes, 2006) and a small baseline subset (SBAS) algorithm (Berardino et al., 2002; Hooper, 2008; Mora et al., 2003), is introduced to overcome these limitations by utilizing the pixels that contain coherent information in time-series co-registered SAR images. In recent years, MT-InSAR plays an important role in mapping ground deformation with high precision and spatial resolution over a large area (Vervoort, 2016; Du et al., 2018; Haghighi et al., 2019; Miller and Shirzaei, 2019; Motagh et al., 2017; Zhang et al, 2019).
Generally, PSI is suitable in urban areas where many human-made structures provide the vast majority of persistent scatterers (PSs). However, most of the area through which RLHR-HZ runs is covered by farmlands, which leads to a low density of PSs. Distributed scatterers (DSs), also referred to as Gaussian scatterers with a random scattering mechanism (Bamler and Hart, 1998; Goodman, 1976), are widespread in natural landscapes such as bare soils and agricultural fields and can be used in the SBAS method to increase the density of measurement points (Hooper, 2008; Samiei-Esfahany, 2017). SqueeSAR (Ferretti et al., 2011) is another advanced approach that allows us to extract the signal from both PS and DS. SqueeSAR extracts information by exploiting all the possible interferograms rather than a set of SBAS interferograms (Ferretti et al., 2011; Samiei-Esfahany, 2017; Shamshiri et al., 2018; Wang et al., 2012). This may lead to an underestimation of deformation due to large temporal baseline.
In this paper, the SBAS method implemented in the Stanford method for persistent scatter (referred to as StaMPS-SB for simplicity) (Hooper, 2008) is adopted and improved. StaMPS-SB has some advantages as follows. First, it has the potential for limiting the effects of topographic errors and the decorrelation by concentrating only on these interferograms with small geometric and temporal baselines (Chen et al., 2012; Goel and Adam, 2012). This contributes to the reduction of phase aliasing and thereby increases the chances of successful phase unwrapping (Hooper, 2008). Second, StaMPS-SB can operate on single-look images (Hooper, 2008), by which we can avoid smoothing any change in deformation and retain the deformation in the highest spatial resolution offered by the satellite. Finally, StaMPS-SB can produce the temporal evolution of deformation without any prior information about its temporal evolution (Hooper et al., 2007; Hooper, 2008; Sousa et al., 2011). This is very useful as there is no prior knowledge about the variations of deformation over the study region. However, standard StaMPS-SB adopts spectral filtering to discard the non-overlapping Doppler spectrum in azimuth and to reduce the geometric decorrelation in range (Hooper, 2008), which leads to a coarsening of resolution and some loss of information. Thus, an adaptive spatial filtering algorithm (Ferretti et al., 2011; Goel and Adam, 2011; Parizzi and Brcic, 2011) is introduced in place of the spectral filtering to improve the interferometric coherence while maintaining the spatial resolution. We utilize the improved StaMPS-SB to investigate the ground deformation along RLHR-HZ using 124 C-band Sentinel-1 SAR images acquired from two tracks between July 2015 and November 2019. Having retrieved the pattern of ground deformation, the potential causes for instability along RLHR-HZ are discussed to better understand the deriving forces contributing to subsidence process. Such information is the key for the safe operation and maintenance of RLHR-HZ.
2.1 Study area
The Heze region, an important part of the North China subsidence basin, is located in the lower reaches of the Yellow River. This area has a relatively flat landform with altitude varying from 37 to 68 m and is covered by vast areas of farmland. It is characterized by a semi-humid monsoon climate with a mean annual precipitation of approximately 663 mm, which is the main recharge source of groundwater. The monsoon climate makes large seasonal variations of precipitation; i.e., most of precipitation (approximately 391 mm) is concentrated in the summer (Shandong Provincial Bureau of Statistics, 2020).
Groundwater has been a key resource for the development of agriculture and industry in Heze. More than 1 billion metric tons of groundwater are exploited every year in the region by more than 110 deep wells in urban areas and more than 137 000 wells in rural areas (Xu et al., 2017). Due to the abundant extraction of groundwater, the level of shallow and deep groundwater declined by more than 8 and 80 m between 1980 and 2013, with an average rate of 0.5 and 5 m yr−1, respectively (Feng et al., 2015). As well as this, the Heze region is rich in coal resources with a cumulative reserve of about 10.2 billion tons spreading over an area of 2700 km2. Due to underground mining, an area more than 40 km2 has suffered from severe subsidence.
RLHR-HZ, with a length of about 150 km running through the Heze region from southwest to northeast (shown in Fig. 1), has been under construction since December 2018 and will be in operation by the end of 2021. Taking advantage of ballastless track, the speed reaches up to 300 km h−1. This means that a very high stability of foundation is required for safety. It is crucial to accurately and continuously monitor the ground subsidence along RLHR-HZ to assess the risk.
2.2 SAR data
Our dataset includes 124 C-band Sentinel-1A SAR images in terrain observation by progressive scan (TOPS) mode covering more than 4 years between July 2015 and November 2019. A total of 63 of these images were collected from track 40 (referred to as S1-40), and 61 from track 142 (referred to as S1-142). There is no descending SAR data over this region, all these images are acquired in an ascending orbit. The ground resolution of these images is approximately 20 m in azimuth and 5 m in range (Geudtner et al., 2014). The details of the Sentinel-1A datasets are summarized in Table 1. Figure 2 shows the temporal and spatial baselines of 192 interferograms generated from the S1-40 dataset and 171 interferograms generated from the S1-142 dataset. It can be seen that the perpendicular baselines vary between −150 and 150 m. External digital elevation model (DEM) data acquired from TanDEM-X with a pixel spacing of 3 arcsec are used for removal of topographic phase components (Wessel et al., 2018) and for geometrical coregistration of TOPS data (Yague-Martinez et al., 2016).
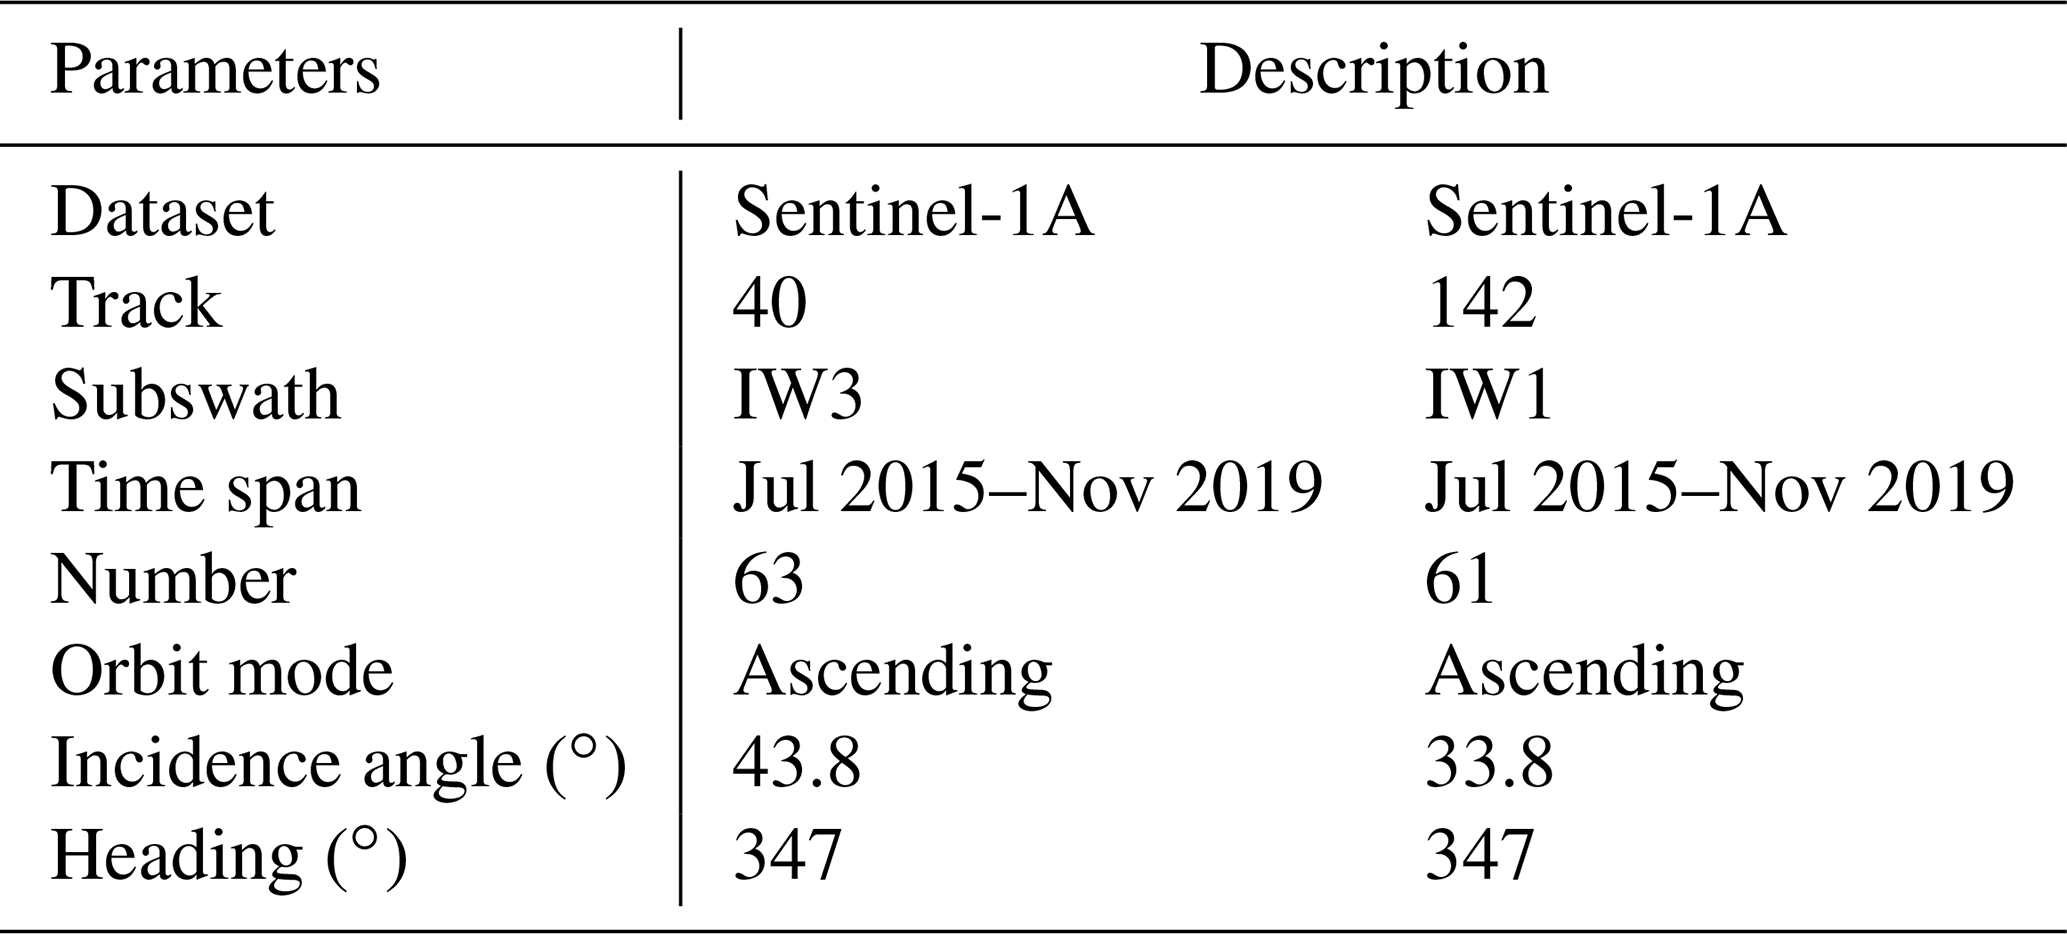

Figure 1Study area and outline of Sentinel-1 acquisitions superimposed on a Google Earth optical image (© Google Maps). Black polygon represents the boundary of the Heze region.
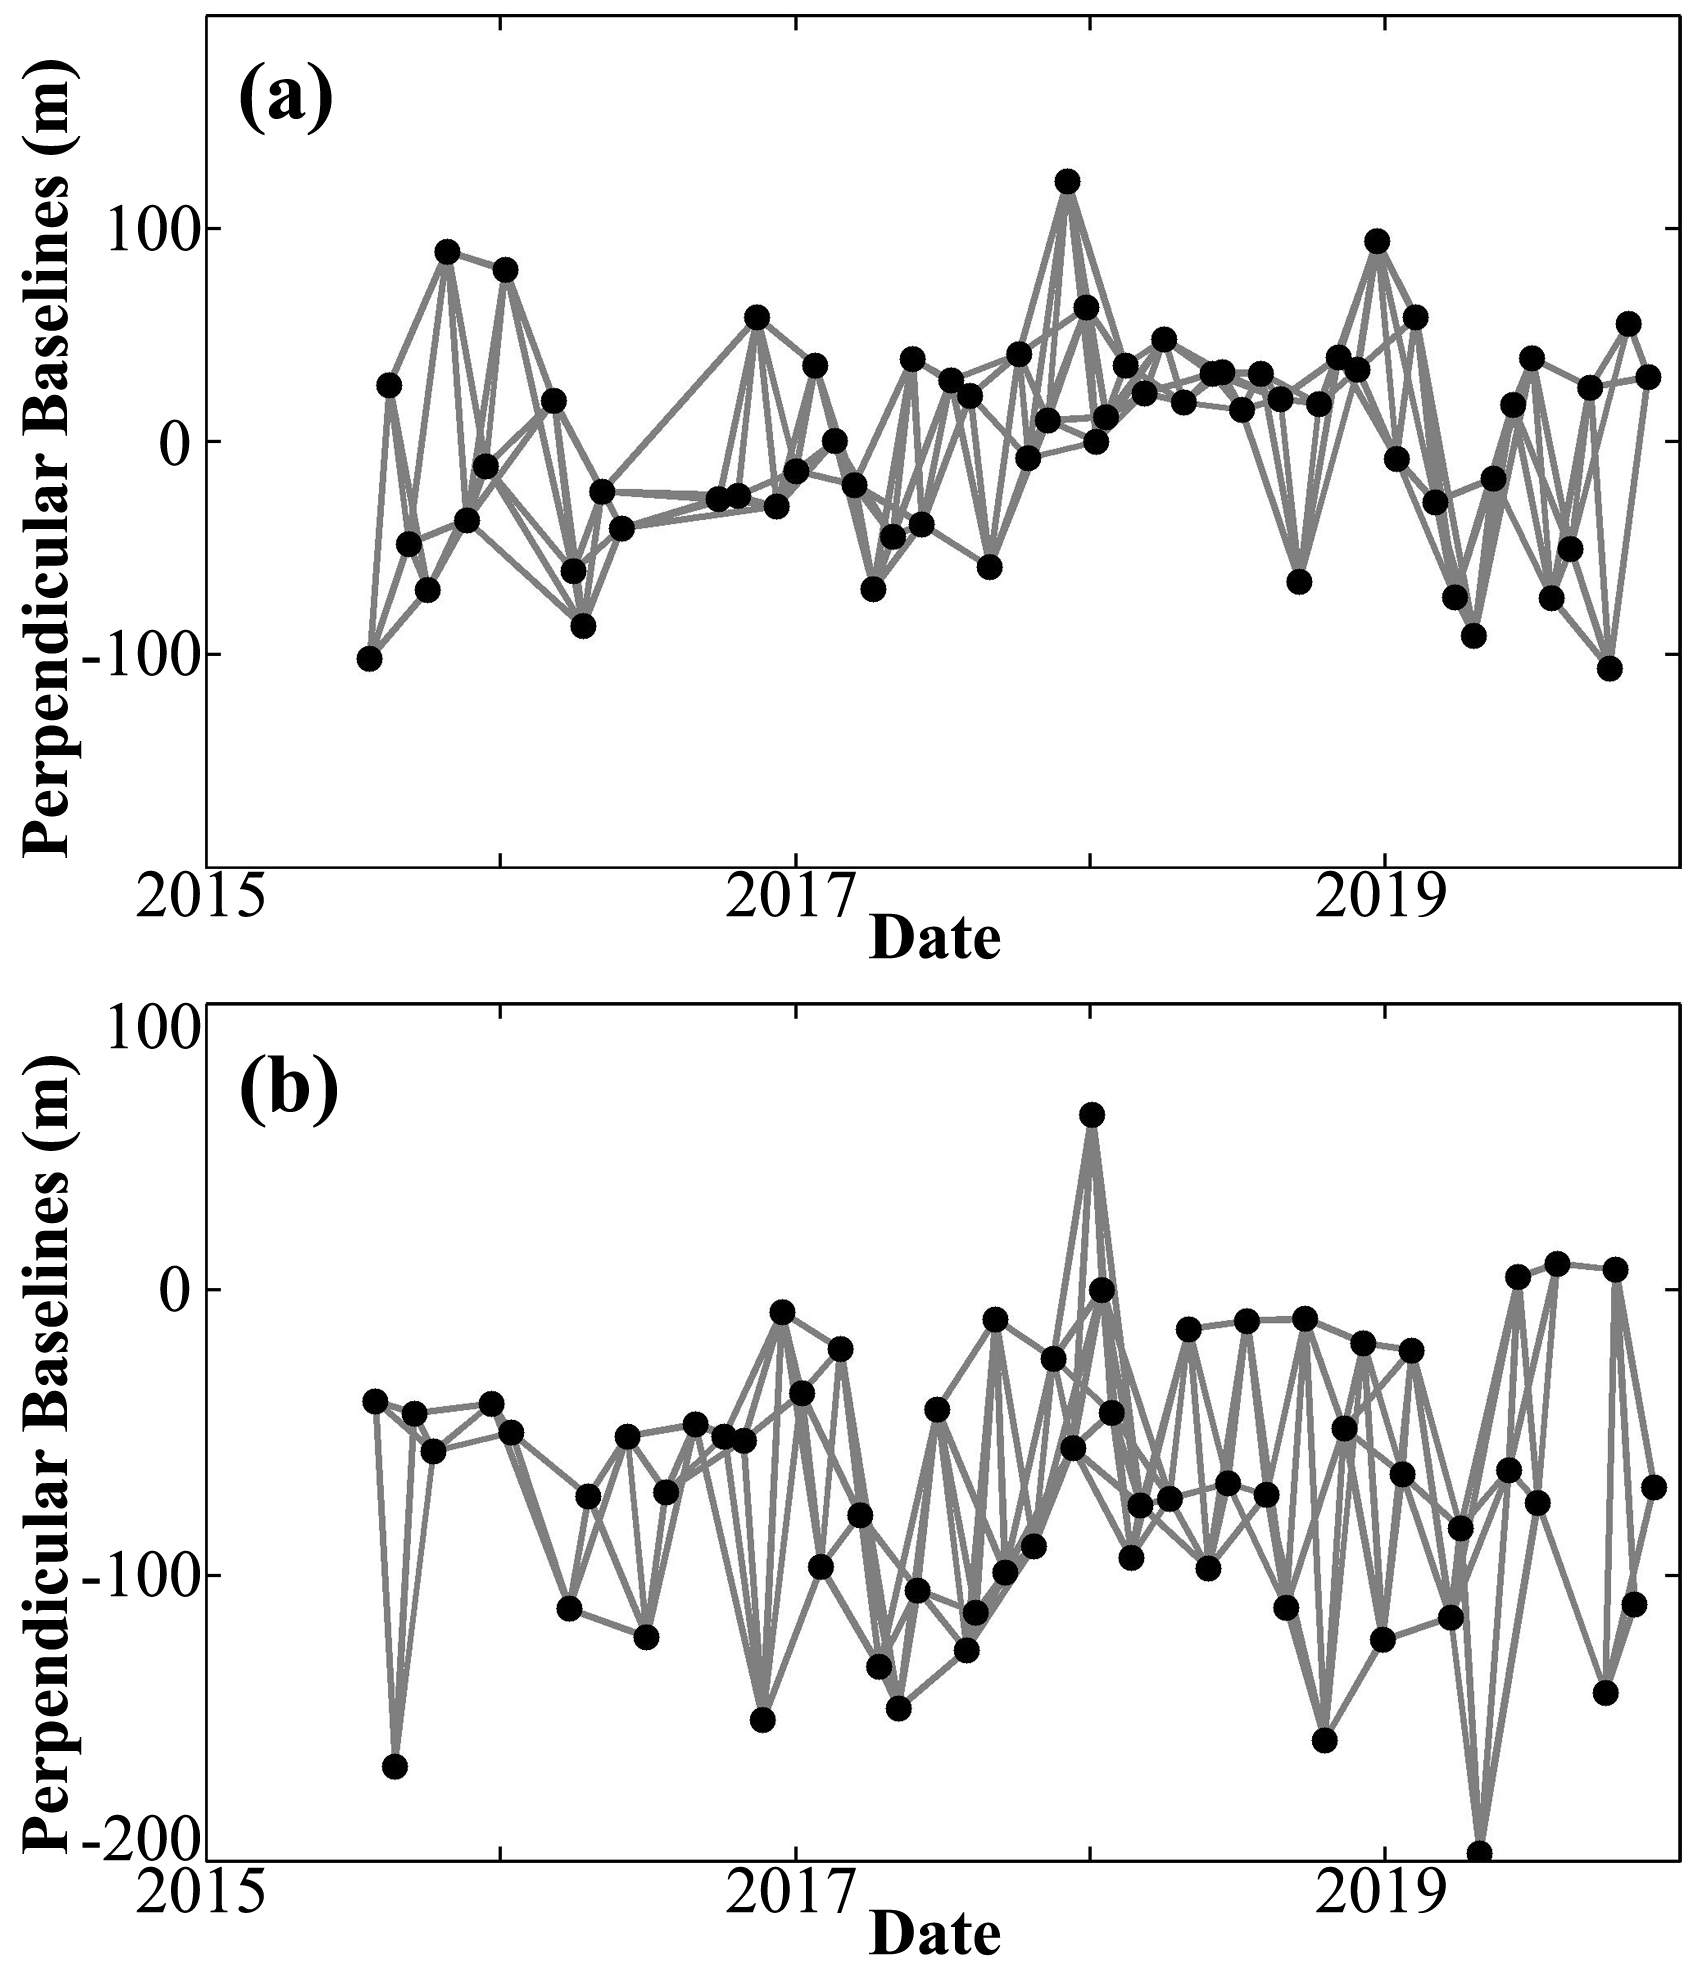
Figure 2Connected network of interferograms for (a) S1-40 and (b) S1-142 datasets. Black dots and grey lines denote the Sentinel-1 acquisitions and interferograms, respectively.
In this study, StaMPS-SB is improved and conducted to derive the time-series displacement from multi-temporal Sentinel-1 acquisitions. Compared with a single-master approach (e.g., PSI), StaMPS-SB can minimize the decorrelation effects caused by a long interval of SAR acquisitions and dense farmlands over this study area (Hooper, 2008).
First, the S1-40 and S1-142 datasets are coregistered and resampled with respect to the reference images acquired on 8 January and 15 January 2018, respectively. The reference image should have the capability to maximize the quality index in the coregistration strategy, which is dependent on the temporal and spatial baselines, the difference of the Doppler centroid, and thermal noise (Hooper et al., 2007). Here, we assume the thermal noise is constant for simplicity (Hooper et al., 2007).
Note that higher accuracy is required for the azimuth coregistration due to the significant Doppler frequency variation which can result in failure for traditional methods. A unique strategy combining geometric coregistration and an enhanced spectral diversity (ESD) (Prats-Iraola et al., 2012) technique is used in this paper. We first perform the geometric coregistration using the precise orbit with an accuracy of 5 cm and the TanDEM-X DEM with a 3 arcsec pixel spacing. Then, the azimuth coregistration accuracy is refined using an ESD technique which exploits the differential phase in the overlap areas of consecutive bursts (Prats-Iraola et al., 2012; Yague-Martinez et al., 2016). Let Δy be the coregistration error of pixel p. According to the rationale of ESD, Δy can be estimated by the following (Yague-Martinez et al., 2016):
where Ω denotes the overlap area between adjacent bursts. φESD,p is the double differential phase between adjacent bursts. and faz are the Doppler centroid frequency difference and the azimuth sampling frequency, respectively.
After that, all the images (i.e., the resampled images and the reference image) are recombined with each other to generate interferograms as long as the geometric and temporal baselines are less than a predefined threshold. A small orbital separation (i.e., 150 m) is specified as the geometric baseline threshold in order to restrain the effect of spatial decorrelation noise and topographic errors. Meanwhile, a short interval (i.e., 84 d) is specified as the temporal baseline threshold in order to restrain the effect of temporal decorrelation noise and accumulative deformation on a wrapped phase. Then, all the interferograms are inspected to distinguish the noisy interferograms which will be excluded from the network. In addition, the temporal intervals of interferograms are not very uniform. Some gaps are longer than 84 d, which results in a disconnected network for the auto-generated interferograms. Therefore, some interferograms with high coherence are manually appended to the original stacks to form a connected network which is essential for StaMPS-SB. Finally, two connected networks containing 192 interferograms for S1-40 and 171 interferograms for S1-142 are generated (shown in Fig. 2). In these networks, each image is connected to at least two other images, by which the temporal sampling rate is increased by an average factor of 2.9. Taking advantage of the adequate interferograms, the model parameters such as deformation, topographic errors and atmospheric artifacts can be estimated more accurately comparing with single-master approach.
Generally, multi-looking (Berardino et al., 2002) and spectral filtering (Hooper, 2008) are the common approaches to improving interferometric coherence and reducing noise. Standard StaMPS-SB adopts spectral filtering to discard the non-overlapping Doppler spectrum in azimuth and to reduce the geometric decorrelation in range. However, the spectral filtering operation leads to a coarsening of resolution (Hooper, 2008), which therefore may cause some loss of deformation information. In fact, the differences in Doppler frequency of Sentinel-1 data are only a few hertz (Yague-Martinez et al., 2016) and the common Doppler bandwidth is more than 95 % in most cases. Additionally, the range bandwidth is larger than 40 MHz and almost all of the geometric baselines are shorter than 150 m. As a result no spectral filtering is applied to avoid coarsening the resolution. In contrast, an adaptive spatial filtering algorithm (Ferretti et al., 2011; Goel and Adam, 2011; Parizzi and Brcic, 2011) is introduced and implemented to improve the interferometric phase and coherence while preserving the image details. The key element of adaptive spatial filtering is the identification of statistically homogenous pixels (SHPs). Let Ap be the amplitudes of pixel p:
where M is the number of SAR images. Let Aq be the amplitudes of pixel q located in the estimation window centered on p, and . We can use statistical hypothesis testing to evaluate whether p and q are SHP (Samiei-Esfahany, 2017):
where and are the cumulative distribution function of amplitudes of p and q, respectively. In this paper, the Kolmogorov–Smirnov (KS) test is used to identify the SHP in a rectangular window with dimensions of 19×13 (azimuth × range). The adaptive spatial filtering will only be carried out if the number of SHPs is greater than 18, which will preserve PS information.
StaMPS-SB selects coherent targets based on the phase characteristics (Hooper, 2008),
where ϕx,i is the wrapped phase of candidate pixel x in the ith filtered interferogram. is the estimated spatially correlated terms. is the spatially uncorrelated terms related to the look angle error due to the inaccuracy of DEM and the lateral offset of the phase center, which is correlated with the perpendicular baseline. N is the number of interferograms. Candidate pixels are firstly selected using the amplitude difference dispersion (a threshold of 0.6 is adopted). Then, these candidates will be filtered in small patches, such as 50 m×50 m, to estimate . Finally, coherent targets will be determined through an iterative procedure estimating the noise (γx) of each candidate by implementing the inversion of as a search of parameter space. Further details on the selection method can be found in Hooper et al. (2007) and Hooper (2008).
Once the coherent targets have been determined, the differential interferometric phase of each coherent target is corrected using the estimated spatially uncorrelated terms (i.e., ) in Eq. (4). After removal of , the residual phase mainly consists of ground deformation, atmospheric artifacts and orbit error and then can be unwrapped using the three-dimensional (3-D) algorithm (Hooper and Zebker, 2007). Firstly, the difference phase between neighboring coherent targets is preliminarily unwrapped in time under the Nyquist assumption (Hooper, 2010). An a priori probability density function (PDF) can be built in each interferogram based on the unwrapped difference phase in time dimension. These PDFs are then used to search for the optimization routines of unwrapping in space to achieve the final unwrapped results (Hooper, 2010). Subsequently, the time-series deformation of each coherent target can be extracted by temporal and spatial filtering based on the characteristics of each phase term.
Note that InSAR is a relative measure to reference point. In order to derive the absolute results, the deformation of the reference point should be known. However, there is no available prior information about the deformation in the Heze region. In contrast to the standard procedure of StaMPS-SB, which only selects one reference area, we identify some possible areas not affected by deformation based on the differential phase in time series. By using multiple reference areas, we can minimize the error of the InSAR-derived deformation due to the misplacement of a single area (Fiaschi et al., 2017).
4.1 Cross-validation of the displacement
Figure 3 shows the displacement rates derived from S1-40 and S1-142. The negative displacement indicates that the ground was subjected to subsidence during this period.

Figure 3The average rates of land displacement results from (a) S1-40 and (b) S1-142, superimposed on a Google Earth optical image (© Google Maps). The two white boxes indicated by box (a) and box (b) indicate the locations of subsidence areas related to underground mining, shown in Figs. 9 and 10 and analyzed in Sect. 5.2.
As no in situ data are publicly available, we assess the consistency and precision of InSAR results by a cross-comparison (shown in Fig. 4) of the displacement rates derived from the S1-40 and S1-142. Although the sensor's physical parameters are the same, the location of two sets of measurement points (MPs, consisting of PS and DS pixels) is slightly different due to the different geometric parameters. In order to identify the common MPs, results from both S1-40 and S1-142 are resampled to a grid with a spacing of 50 m. The displacement rates are averaged if multiple MPs are located in the same grid. As well as this, the displacements are converted to vertical direction assuming that the horizontal displacements are negligible. A total of 232 984 common MPs are finally identified after the above procedure. Based on these common MPs, we estimate the Pearson correlation of the two measurements, getting a correlation of 0.9 (shown in Fig. 4a). We also calculate the root mean square error (RMSE) of the two InSAR results, getting a RMSE of 0.5 cm yr−1. The low RMSE and high correlation demonstrates the consistency of the InSAR results.
The variation in the difference between the two measurements illustrated in Fig. 4b provides an estimation about the precision of S1-40 and S1-142 InSAR results. We calculate the mean (μ) and standard deviation (σ) of the difference of displacement rates, getting values of 0.03 and 0.5 cm yr−1, respectively. Therefore, we conclude that the two InSAR results agree well with each other, and the precision (i.e., 1σ uncertainty) of the two measurements is about 0.5 cm yr−1.
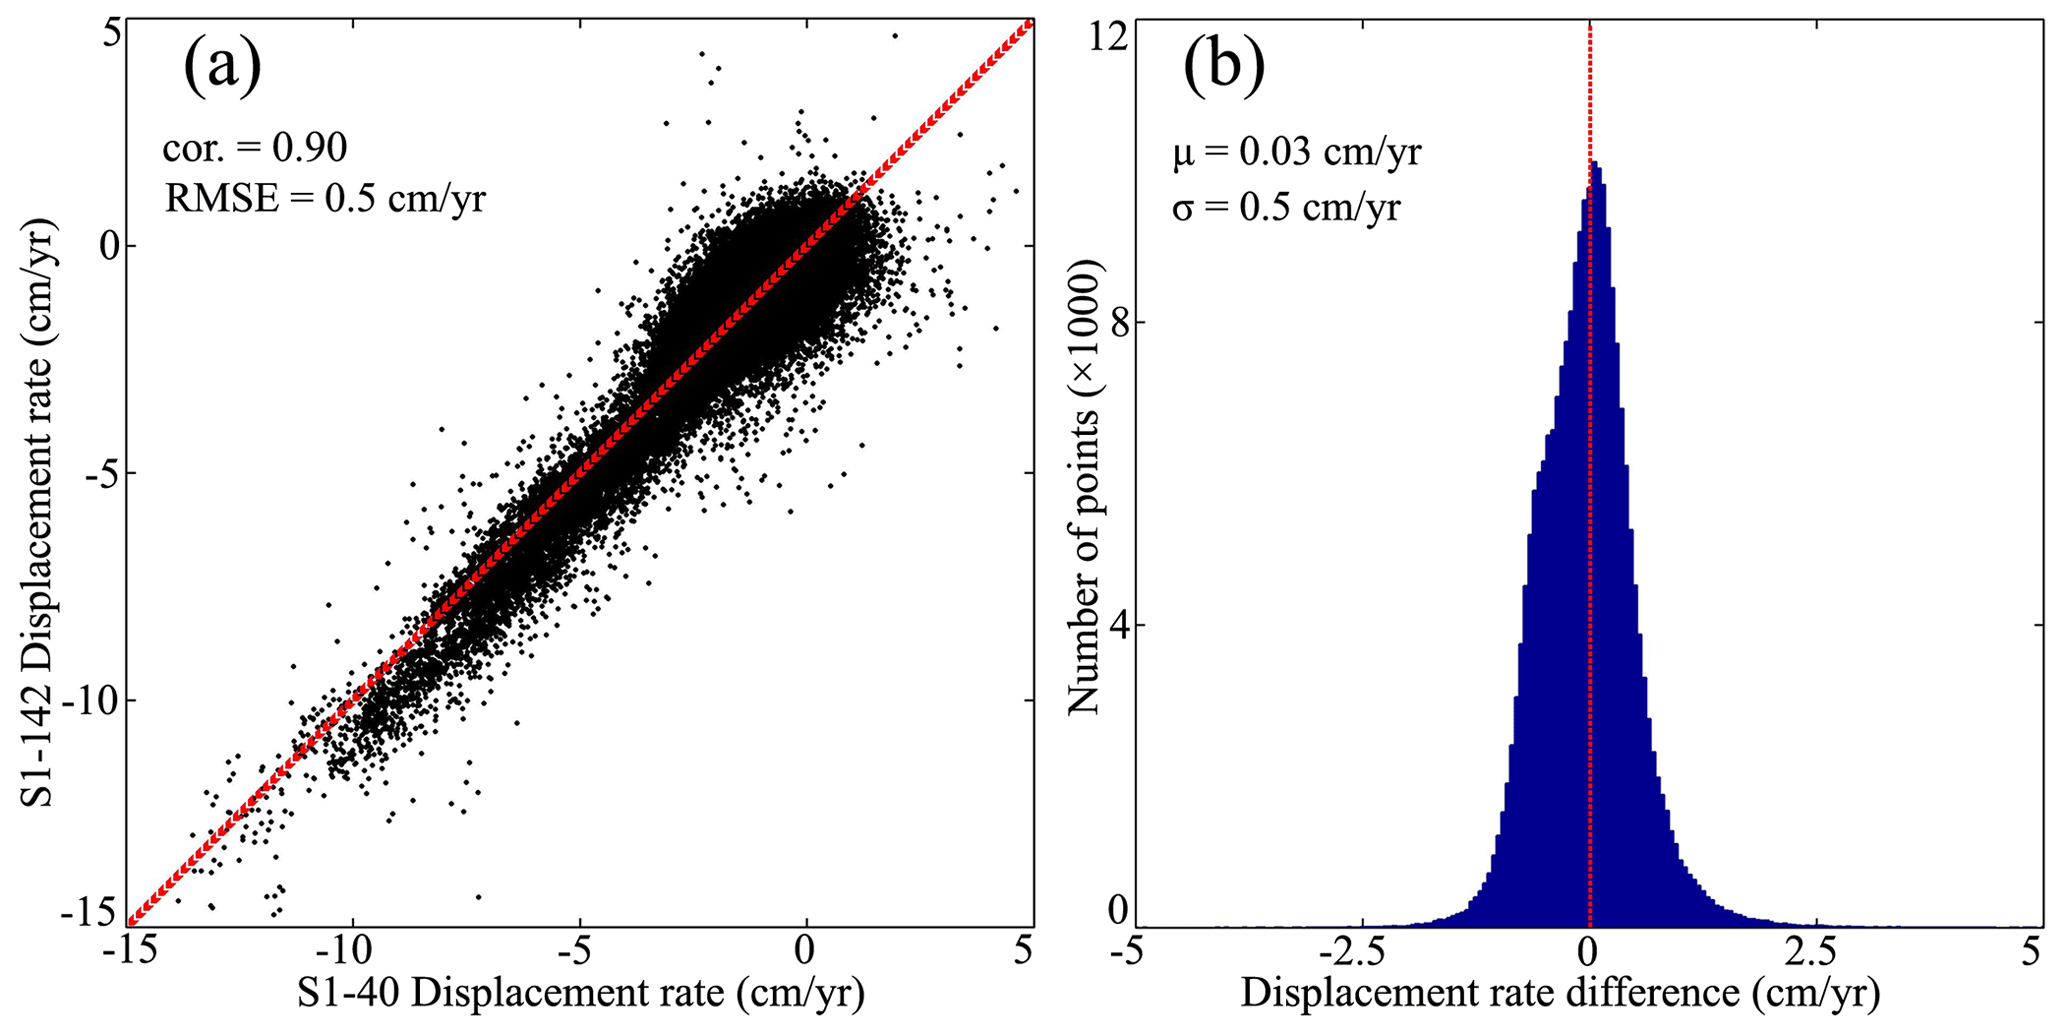
Figure 4The cross-validation of InSAR results from S1-40 and S1-142. The correlation and the difference between the two measurements are shown in (a) and (b), respectively.
4.2 Land displacement along the RLHR-HZ
The displacement rates within a radius of 3 km along the RLHR-HZ are illustrated in Fig. 5. The total numbers of MPs from the two sets of data are up to 312 702 and 261 397, resulting in an average density of approximately 473 and 375 MPs km−2, respectively. With the advantage of dense MPs, ground deformation along the RLHR-HZ can be represented in detail compared to conventional methods. Note that the spatial density of MPs is not homogeneous due to different ground scatterer characteristics. The MPs are evenly distributed in urban areas because of dense hard objects while sparsely distributed in rural areas due to the vegetation cover. To increase the density of MPs, the two measurements derived from S1-40 and S1-142 datasets are both shown in Fig. 5. Thus, there are more MPs in the overlapping area.
Figure 5a shows the displacement rates along the designed RLHR-HZ. It can be seen that the RLHR-HZ runs through two subsidence zones (two black ellipses in Fig. 5a), one of which (zone 1) is located in the east of Heze city and another one (zone 2) in the mining area. In zone 1, the displacement rates range from −4 to −1 cm yr−1. The subsidence pattern is smooth and homogeneous in space. A length of approximately 20 km of RLHR-HZ will be affected by the subsidence. In contrast, a stronger subsidence is observed in zone 2, and a length of approximately 15 km of RLHR-HZ will be affected. The displacement rates detected by InSAR range from −8 to −2 cm yr−1.
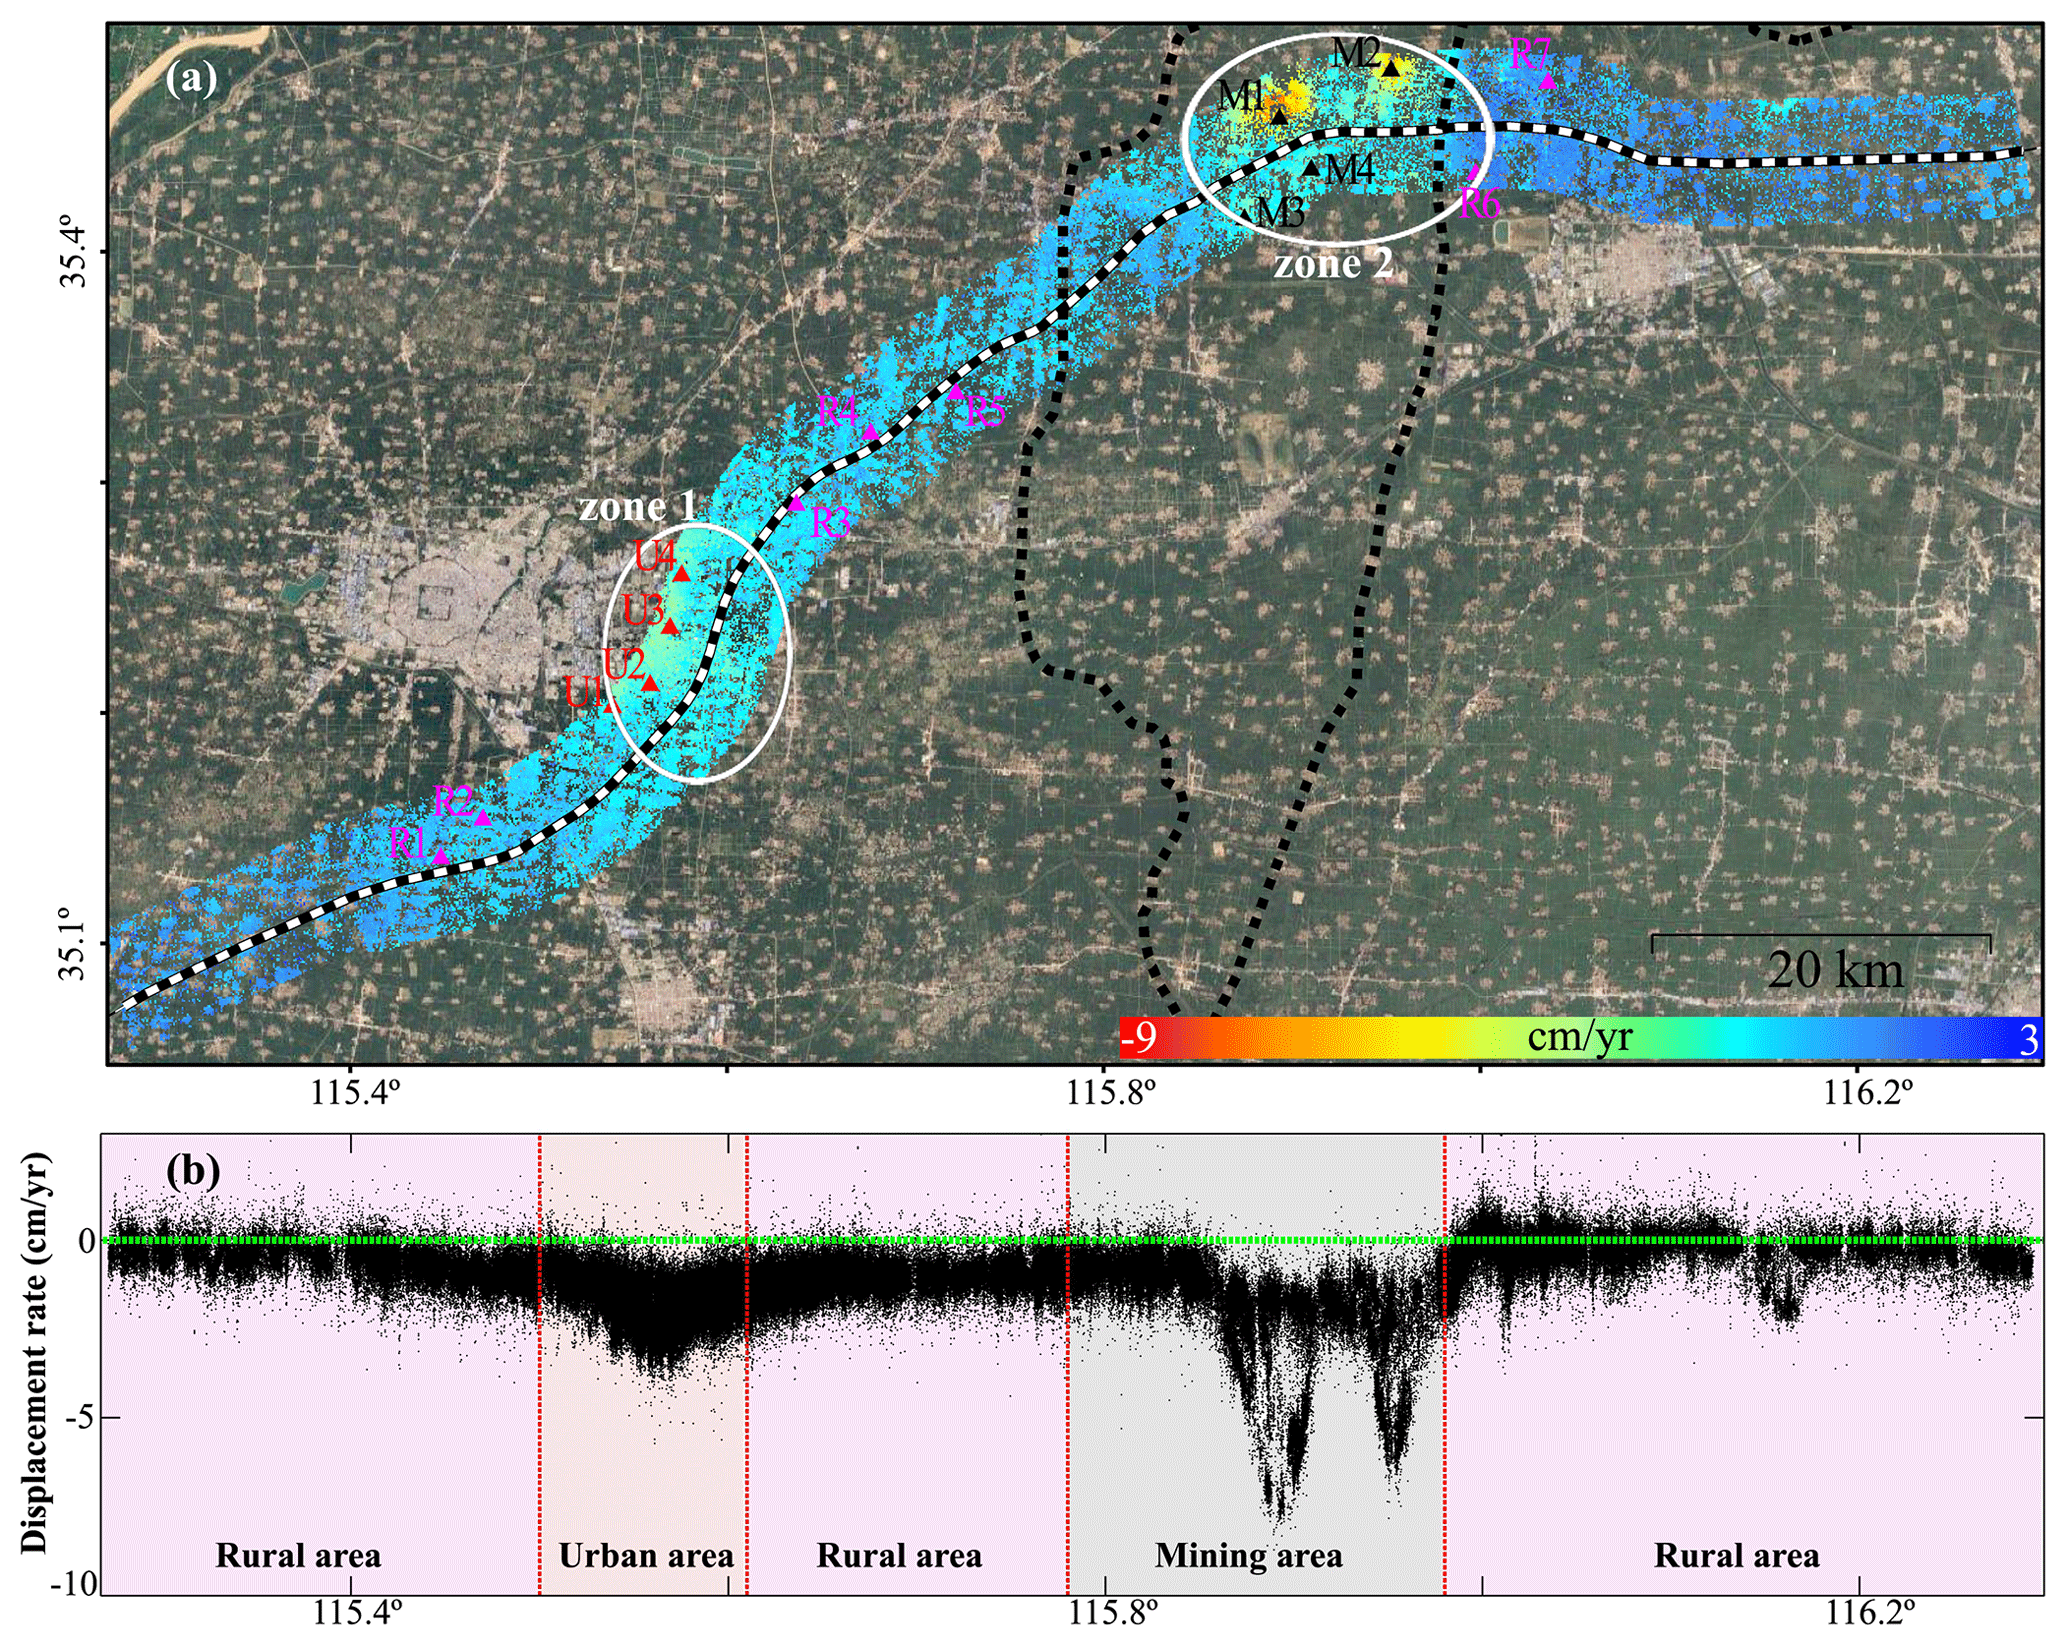
Figure 5(a) The spatial distribution and (b) the profile of average displacement rates along RLHR-HZ. The results from both S1-40 and S1-142 are shown, which leads to denser MPs in the overlapping area. Two ellipses show the major subsidence area. The triangles (i.e., pink triangles named as R1–R7, red triangles named as U1–U4 and black triangle named as M1–M4) delineate the displacement features in rural areas, urban areas and mining areas, discussed in detail in Figs. 6–8, respectively. The base map in (a) is from a Google Earth optical image (© Google Maps).
To investigate the ongoing settlement further, we estimate the displacement profile along the RLHR-HZ and show the results in Fig. 5b. It can be seen that the deformation pattern is not homogenous along the RLHR-HZ. The ground experiences the strongest subsidence in the underground mining area, followed by the urban areas. We also observe slightly deformation in rural areas, where the displacement rates range between −2 and 1 cm yr−1. However, another subsidence area with maximum rates of up to −3 cm yr−1 appears near 116.16∘. This area is offset from the coalfield by 3.5 km, so the subsidence phenomenon there might be related to the underground mining.
4.3 Heze Mudan Airport
Another remarkable subsidence feature is a localized area around the Heze Mudan Airport (HMA) (shown in Fig. 3). HMA has been under construction since 2017 and will open and serve Shandong with domestic flights in 2020 according to the schedule. InSAR deformation maps (Fig. 3) show a subsidence feature near the airport with a maximal displacement rate of approximately −3 cm yr−1. The ancillary facilities of the airport, such as the runway and terminal buildings, are also affected by nonuniform subsidence ranging from −3 to −0.5 cm yr−1.
Several possible causes, including natural factors and anthropogenic activities, could be related to the deformation patterns observed in Heze. Tectonic movement and underground caves can cause ground deformation. However, the high displacement rates, which exceed 5 cm yr−1 at many locations, are not in agreement with the tectonic movement rates, which are estimated to be less than 0.5 cm yr−1 (Guo et al., 2019). In addition, there are no known underground caves associated with sinkholes or karst landforms in this region. In contrast, according to close inspections of the subsidence area and considering the underground mining coupled with the decreasing hydraulic heads in this region, we infer that this deformation is mainly caused by extensive extraction of groundwater and coal. This will be elaborated more in the following.
5.1 Correlation between ground deformation and groundwater withdraw
Groundwater has been exploited for agricultural irrigation, industrial and residential use in the Heze region since the early 1970s. Long-term exploitation of groundwater brings about a compaction of the fine clay layer and finally results in the ground subsidence. Previous research indicates that the excessive groundwater withdrawal is one of the main reasons for ground deformation in this area (Hu et al., 2004; Guo et al., 2019; Xue et al., 2005).
To better understand the ground motion, the time-series displacements of MPs located within a 50 m radius around 11 points (marked by red and pink triangles in Fig. 5) are shown in Fig. 6. It can be seen that most of these locations suffer from ground subsidence in the period from July 2015 to November 2019. It suggests that the groundwater is still excessively exploited and the groundwater recharge is insufficient to supply the exploitation. Figure 7a and b shows that both the shallow and deep groundwater level declined in recent years. Xu et al. (2017) pointed out that more than 1 billion tons of groundwater is over-extracted annually by more than 137 000 wells in the Heze region.
As well as this, Fig. 6 shows that the behavior of the time-series displacement significantly differs between rural areas and urban areas. Compared with rural areas, the ground experiences more serious subsidence in urban areas. One reason for the large settlement in urban areas is that large quantities of the deep groundwater (over 200 m depth) are extracted to meet industrial needs, while shallow groundwater is extracted for domestic use. It can be seen from Fig. 7a and b that the shallow groundwater level declined by 0.5 m from July 2016 to July 2017, while the deep groundwater level declined by approximately 6 m from July 2015 to October 2017. Approximately 0.16 billion tons of groundwater is over-extracted annually by more than 110 deep wells in urban areas of Heze (Xu et al., 2017; Shandong Provincial Bureau of Statistics, 2020). The level of deep groundwater declined by more than 100 m between 1980 and 2018 (Feng et al., 2015; Yue, 2020). However, many thick clay layers over the confined aquifer restrict the flow for aquifer recharging from precipitation in the vertical direction. Meanwhile, the recharge rates of deep groundwater in the horizontal direction, i.e., runoff along the topography from west to east, is very slow (Qiao and Lin, 2006; Zhang, 2013).

Figure 6Time-series displacement of MPs located in rural areas (R1–R7) and urban areas (U1–U4) shown in Fig. 5.
As the aquifer's detailed information is not public, we cannot obtain enough information to investigate the detailed relationship between the subsidence and the groundwater level. However, the precipitation is the main recharge source of shallow groundwater (accounting for 85 % of the total supply) in this region and directly determines the level of shallow groundwater (Jia, 2015; Ma and Feng, 2014; Yu et al., 2001). Therefore, we switch to investigate the relationship between the subsidence and the precipitation.
The precipitation from July 2015 to December 2019 is presented in Fig. 7c. We can infer the variation of shallow groundwater according to the precipitation. Generally, there is little precipitation, exploitation and evaporation of groundwater from January to February in the Heze region. During this period, the groundwater level is relatively stable and rises slowly until the beginning of March. In addition, the freezing of water contained in the soil due to the low temperatures can also increase the groundwater volume and results in an inflation. From March to June, the small amount of precipitation and massive groundwater extraction to irrigate crops result in a continuous decline of groundwater level until the beginning of the rainy season. The water level rebounds from July to September due to lots of precipitation (see Fig. 7a) and maintains a relatively stable rate due to the decreasing of extraction from October to December (Jia, 2015).
The average time-series displacement of all points located in rural areas, after removing its trend, is used as an average representation of the variations of rural areas and shown in Fig. 7d, while the average variations of urban areas is shown in Fig. 7e.
The deviation in rural areas (Fig. 7d) indicates that the ground fluctuates by approximately ±0.5 cm with a significant seasonal variation. The latter may be related to the seasonal variation of aquifer water level, which is determined by the seasonal precipitation (see Fig. 7a and c). In addition, as shown in Fig. 7d, the variations of displacement in rural areas have a significant correlation with precipitation with a time lag of approximately 2 months. According to Fig. 7a, c and d, we may hypothesize that the ground subsidence is caused by both the hydraulic head change and the seasonal groundwater variations. Moreover, the time lag is induced by the groundwater level increases arising from the seasonal precipitation.
In contrast, Fig. 7e shows that there is no straightforward relationship between the precipitation and the variations of displacement in urban area. It may be due to the extraction of deep rather than shallow groundwater, as the deep groundwater is difficult to recharge due to the complicated geological conditions in this region (Qiao and Lin, 2006; Zhang, 2013). H. Zhang et al. (2018) found that the subsidence has a significant correlation (up to 0.96) with the decline of deep groundwater level in another city near Heze.
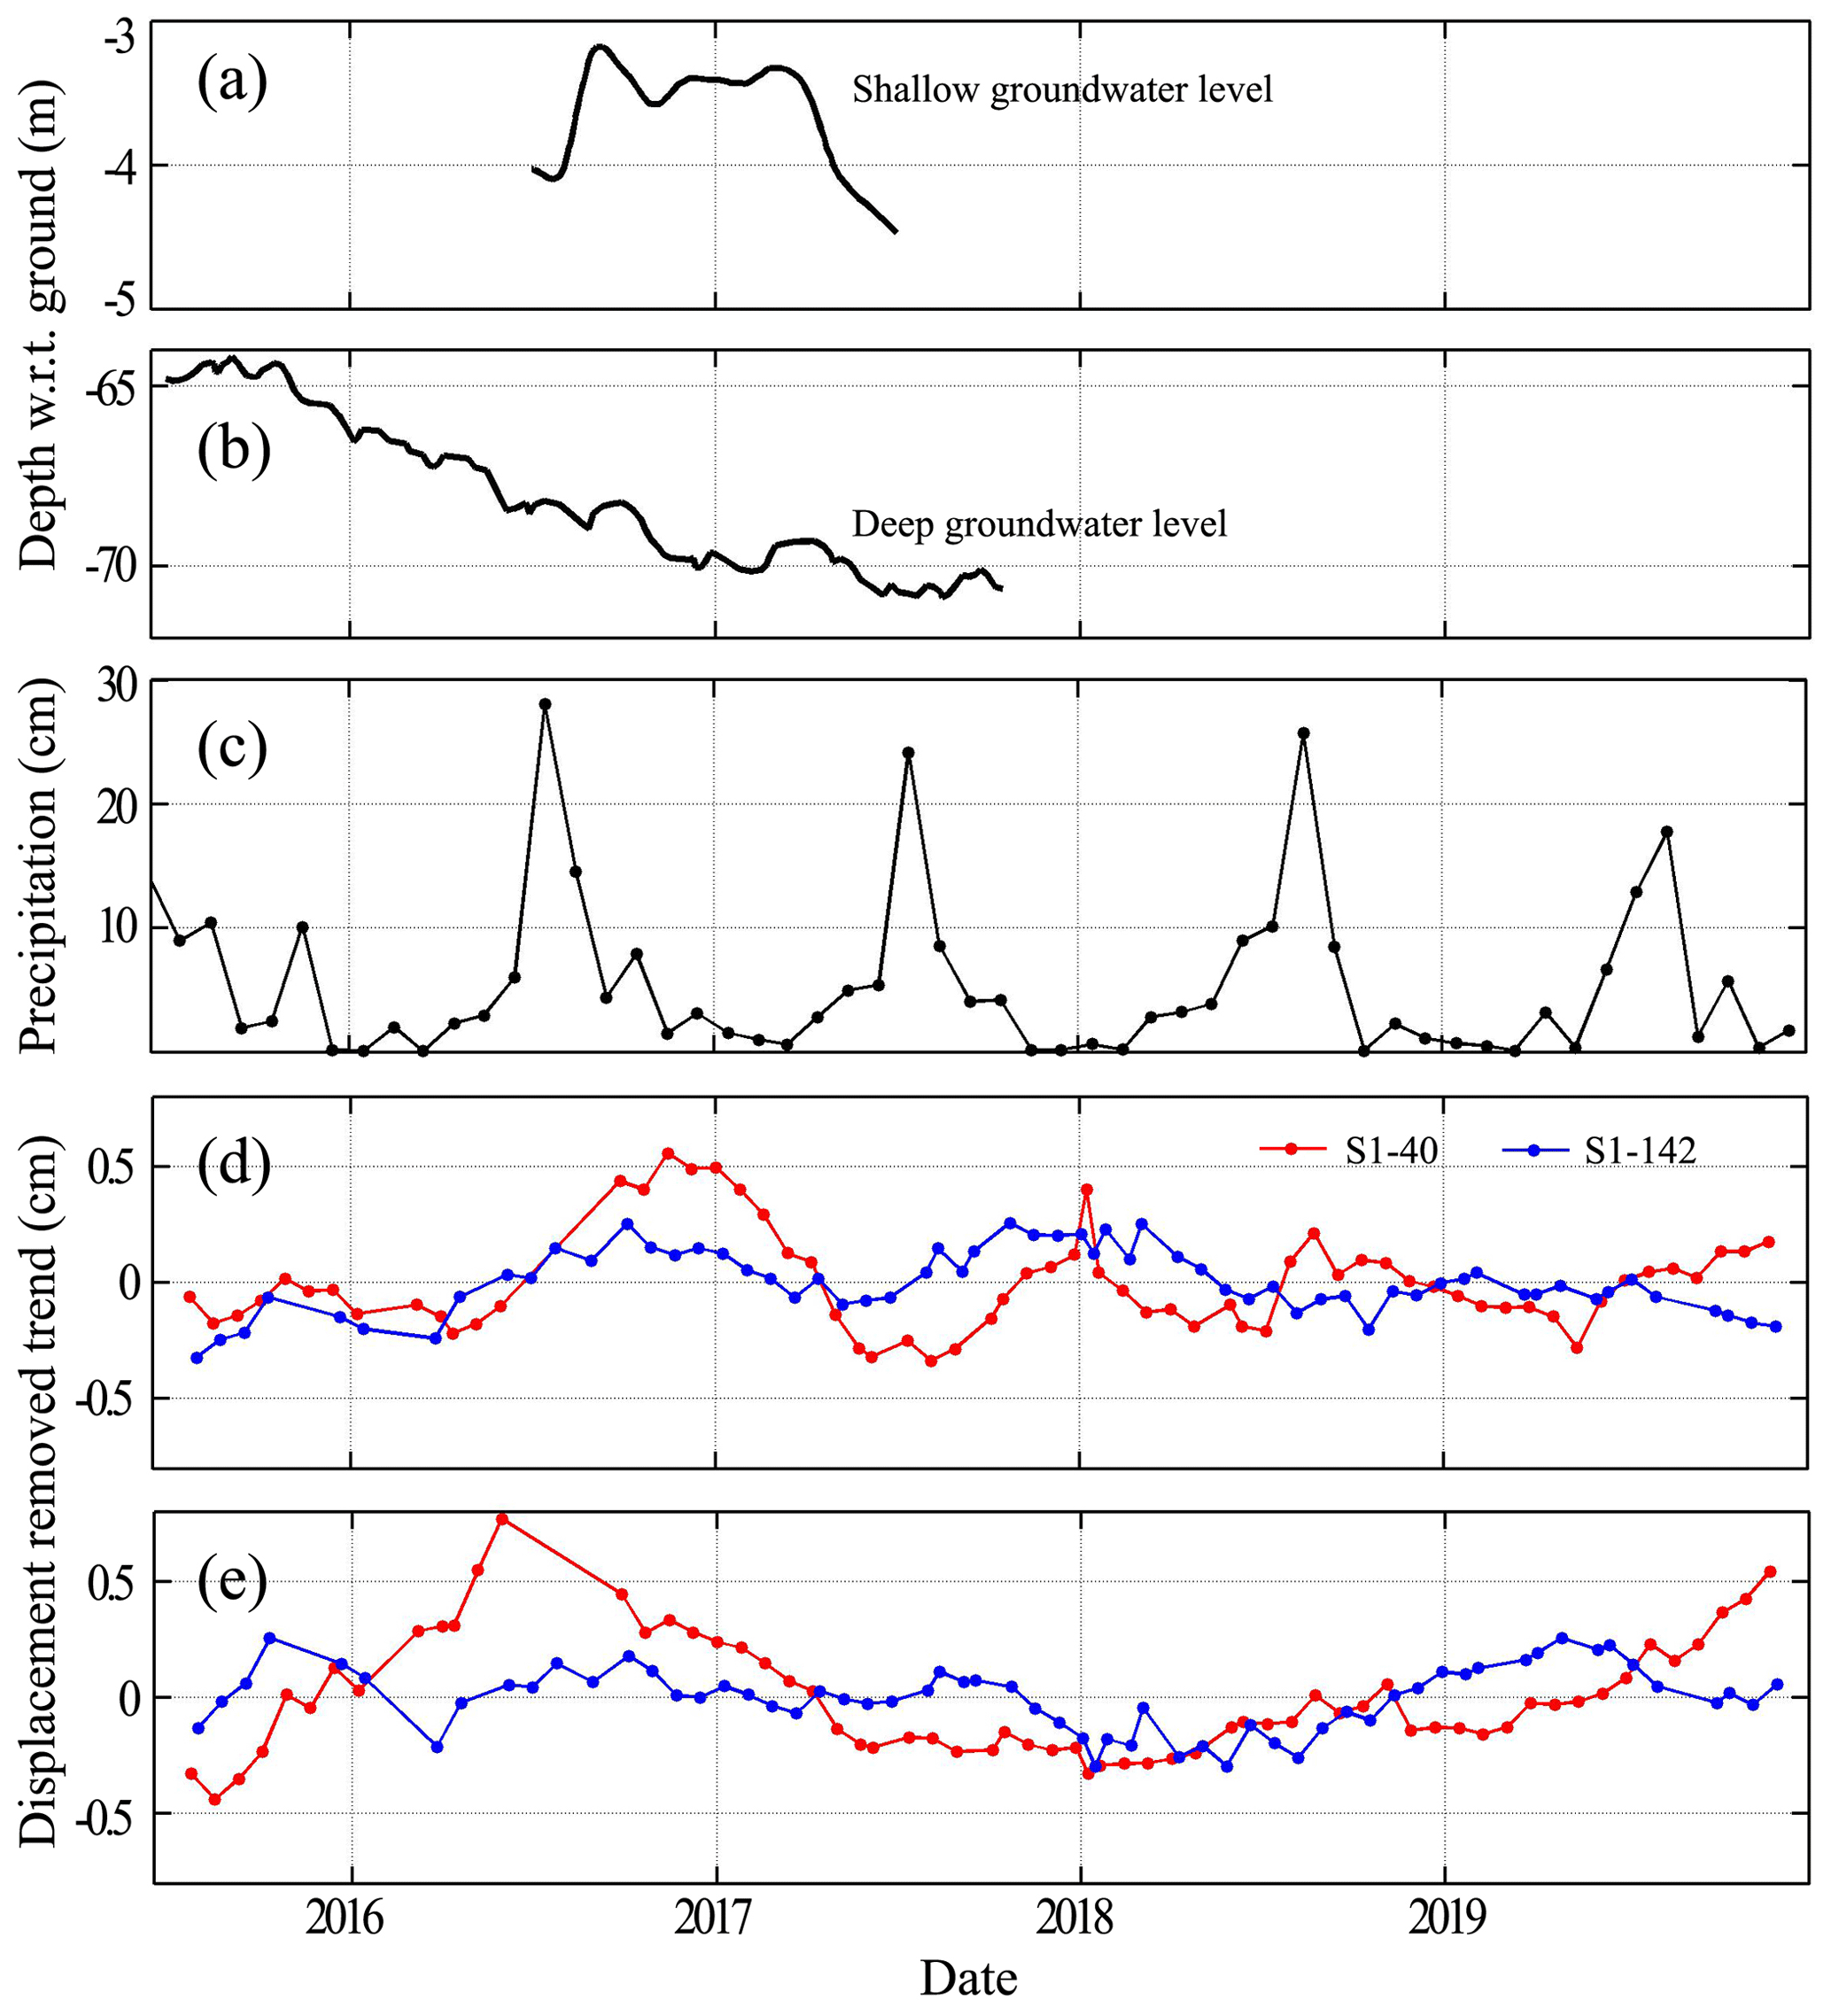
Figure 7(a) Shallow and (b) deep ground level with respect to the ground. (c) Monthly precipitation for the Heze region during July 2015 and December 2019. After removing the linear trend, the average of residual time-series displacement of (d) R1–R7 in rural areas and (e) U1–U4 in urban areas.
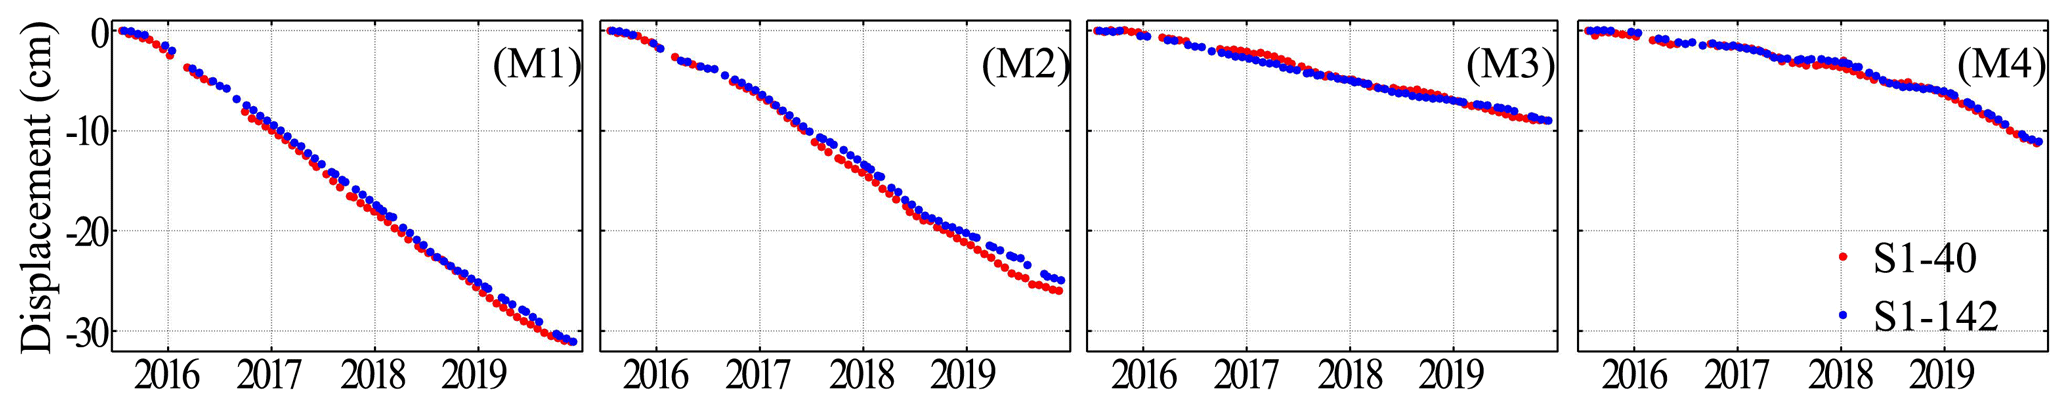
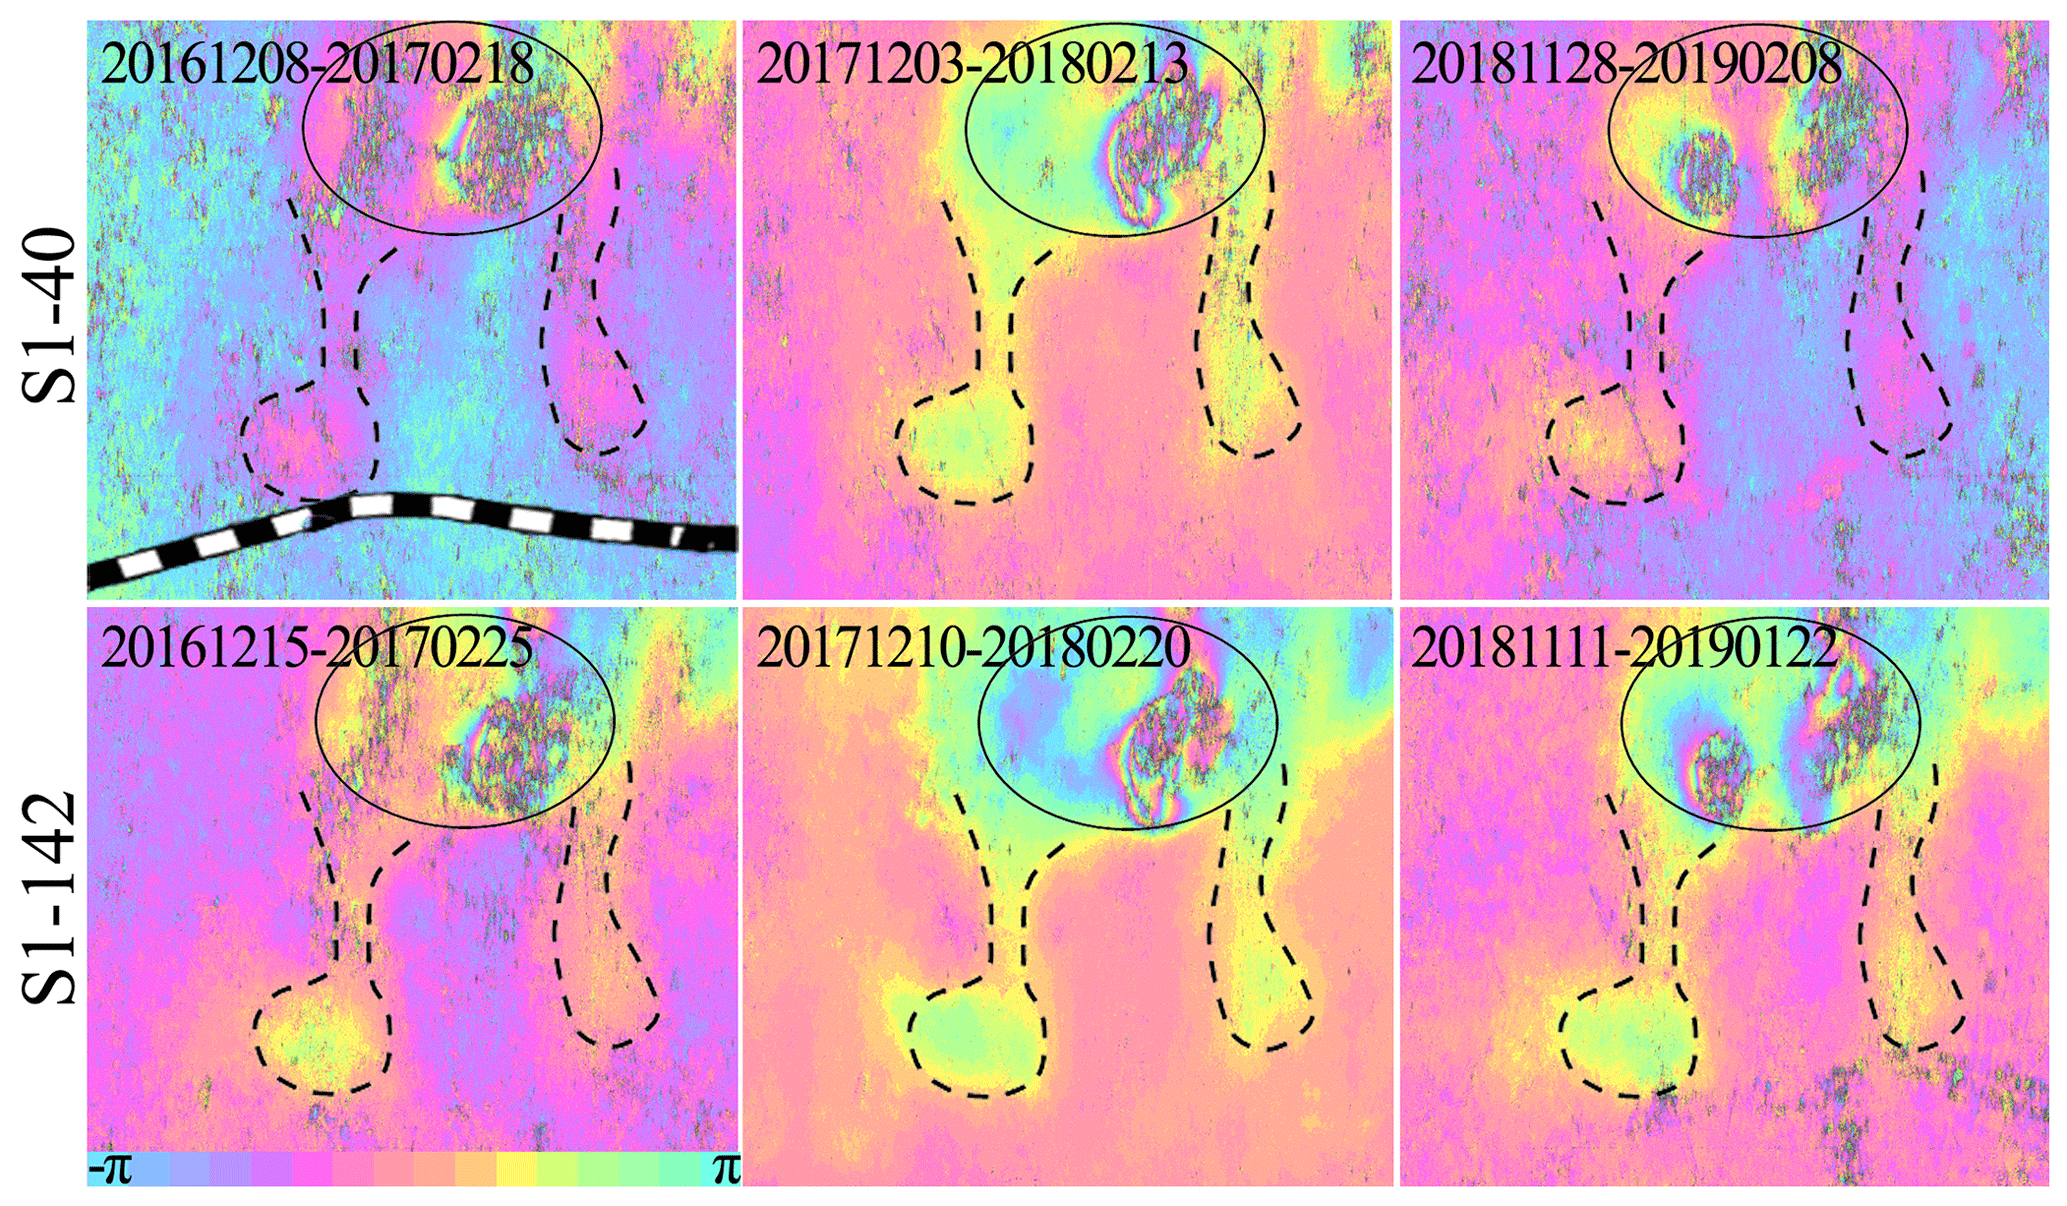
Figure 9Example of interferograms produced from S1-40 and S1-142 of box (a) in Fig. 3. The ellipses show the primary subsidence area induced by underground mining. One color fringe stands for approximately 2.8 cm displacement in the LOS. The dashed lines show the secondary subsidence area caused by complicated factors, e.g., groundwater drain out and/or fault activation due to underground mining.
5.2 Correlation between ground deformation and underground mining
Figure 8 shows the time-series displacements at four locations (M1–M4 in Fig. 5) above coalfields. Figures 5 and 8 show that the cumulative subsidence above coal does not exceed 50 cm for more than 4 years. In addition, Fig. 8 reveals a significant linear displacement trend. In fact, the mining-induced subsidence is generally nonlinear with high rates, which can reach up to several meters in a short time (e.g., several months). These characteristics indicate that the subsidence near M1–M4 locations may not be directly induced by underground mining.
Note that the underground mining inevitably produces many fracture fields which may be interconnected with the faults, forming a vast interconnected network. The groundwater flows into the working planes through fractures and is drained out (Rapantova et al., 2007; Xu et al., 2018), which finally results in the ground subsidence. Also, underground mining may destroy the stability of faults and induce fault slipping (Islam and Shinjo, 2009; Wang et al., 2016; Y. H. Zhang et al., 2018), which can also lead to ground subsidence.
Figure 9 shows six interferograms of box (a) in Fig. 3a. We observe that there are several active subsidence areas, represented by dense fringes (ellipses in Fig. 9), located 5–8 km north of M1 and M2 locations. The loss of signal in the center of these subsidence areas is probably due to the displacement, being too large to be detected by MT-InSAR with the C-band Sentinel-1 data. This conforms to the mining-induced displacement field which presents a bowl-shaped subsidence pattern, as observed in other studies (He et al., 1994; Litwiniszyn, 1956; Zhu et al., 2020). The dense fringes, i.e., strong deformation, suggests active underground mining just below this subsidence basin (referred to as primary subsidence basin and denoted by ellipses in Fig. 9). In contrast, all the six interferograms and the corresponding displacement rates shown in Fig. 3 reveal a relatively slight subsidence near M1 and M2 locations (referred to as a secondary subsidence basin) in comparison to the primary subsidence basin. Close inspections of fringe distribution in Fig. 9 show that the ground deformation seems to progress to M1 and M2 area along with two “galleries” (dashed line in Fig. 9). A plausible explanation of this deformation near M1 and M2 locations could be the groundwater outflow to working panels and its drainage, which finally triggers the ground subsidence.
In addition, a similar phenomenon is observed in an area (box (b) in Fig. 3a) 5–11 km south of RLHR-HZ. Figure 10 shows six interferograms of this area. On the right of each panel (ellipses in Fig. 10), the dense fringes in this primary subsidence area imply active underground mining. However, an arc-shaped secondary subsidence area (dashed line in Fig. 10) with a length of about 14 km is observed within 3 km to the left of the primary subsidence area. The arc-shaped subsidence does not agree with the law of the ground movement induced by underground mining. Figure 3 shows the arc-shaped subsidence is consistent with the fault, which implies that the underground mining causes the fault activation and results in ground deformation. Unfortunately, it is difficult to investigate the interactions among the underground mining, fault activation and ground deformation, since we do not have detailed information, such as the distribution of unknown faults and abandoned mines, the relative position of the faults, and mining sites. Nevertheless, the concomitant ground deformation (i.e., secondary subsidence basin) induced by underground mining suggests that coal extraction must be carried out very carefully, especially when there are widespread faults.
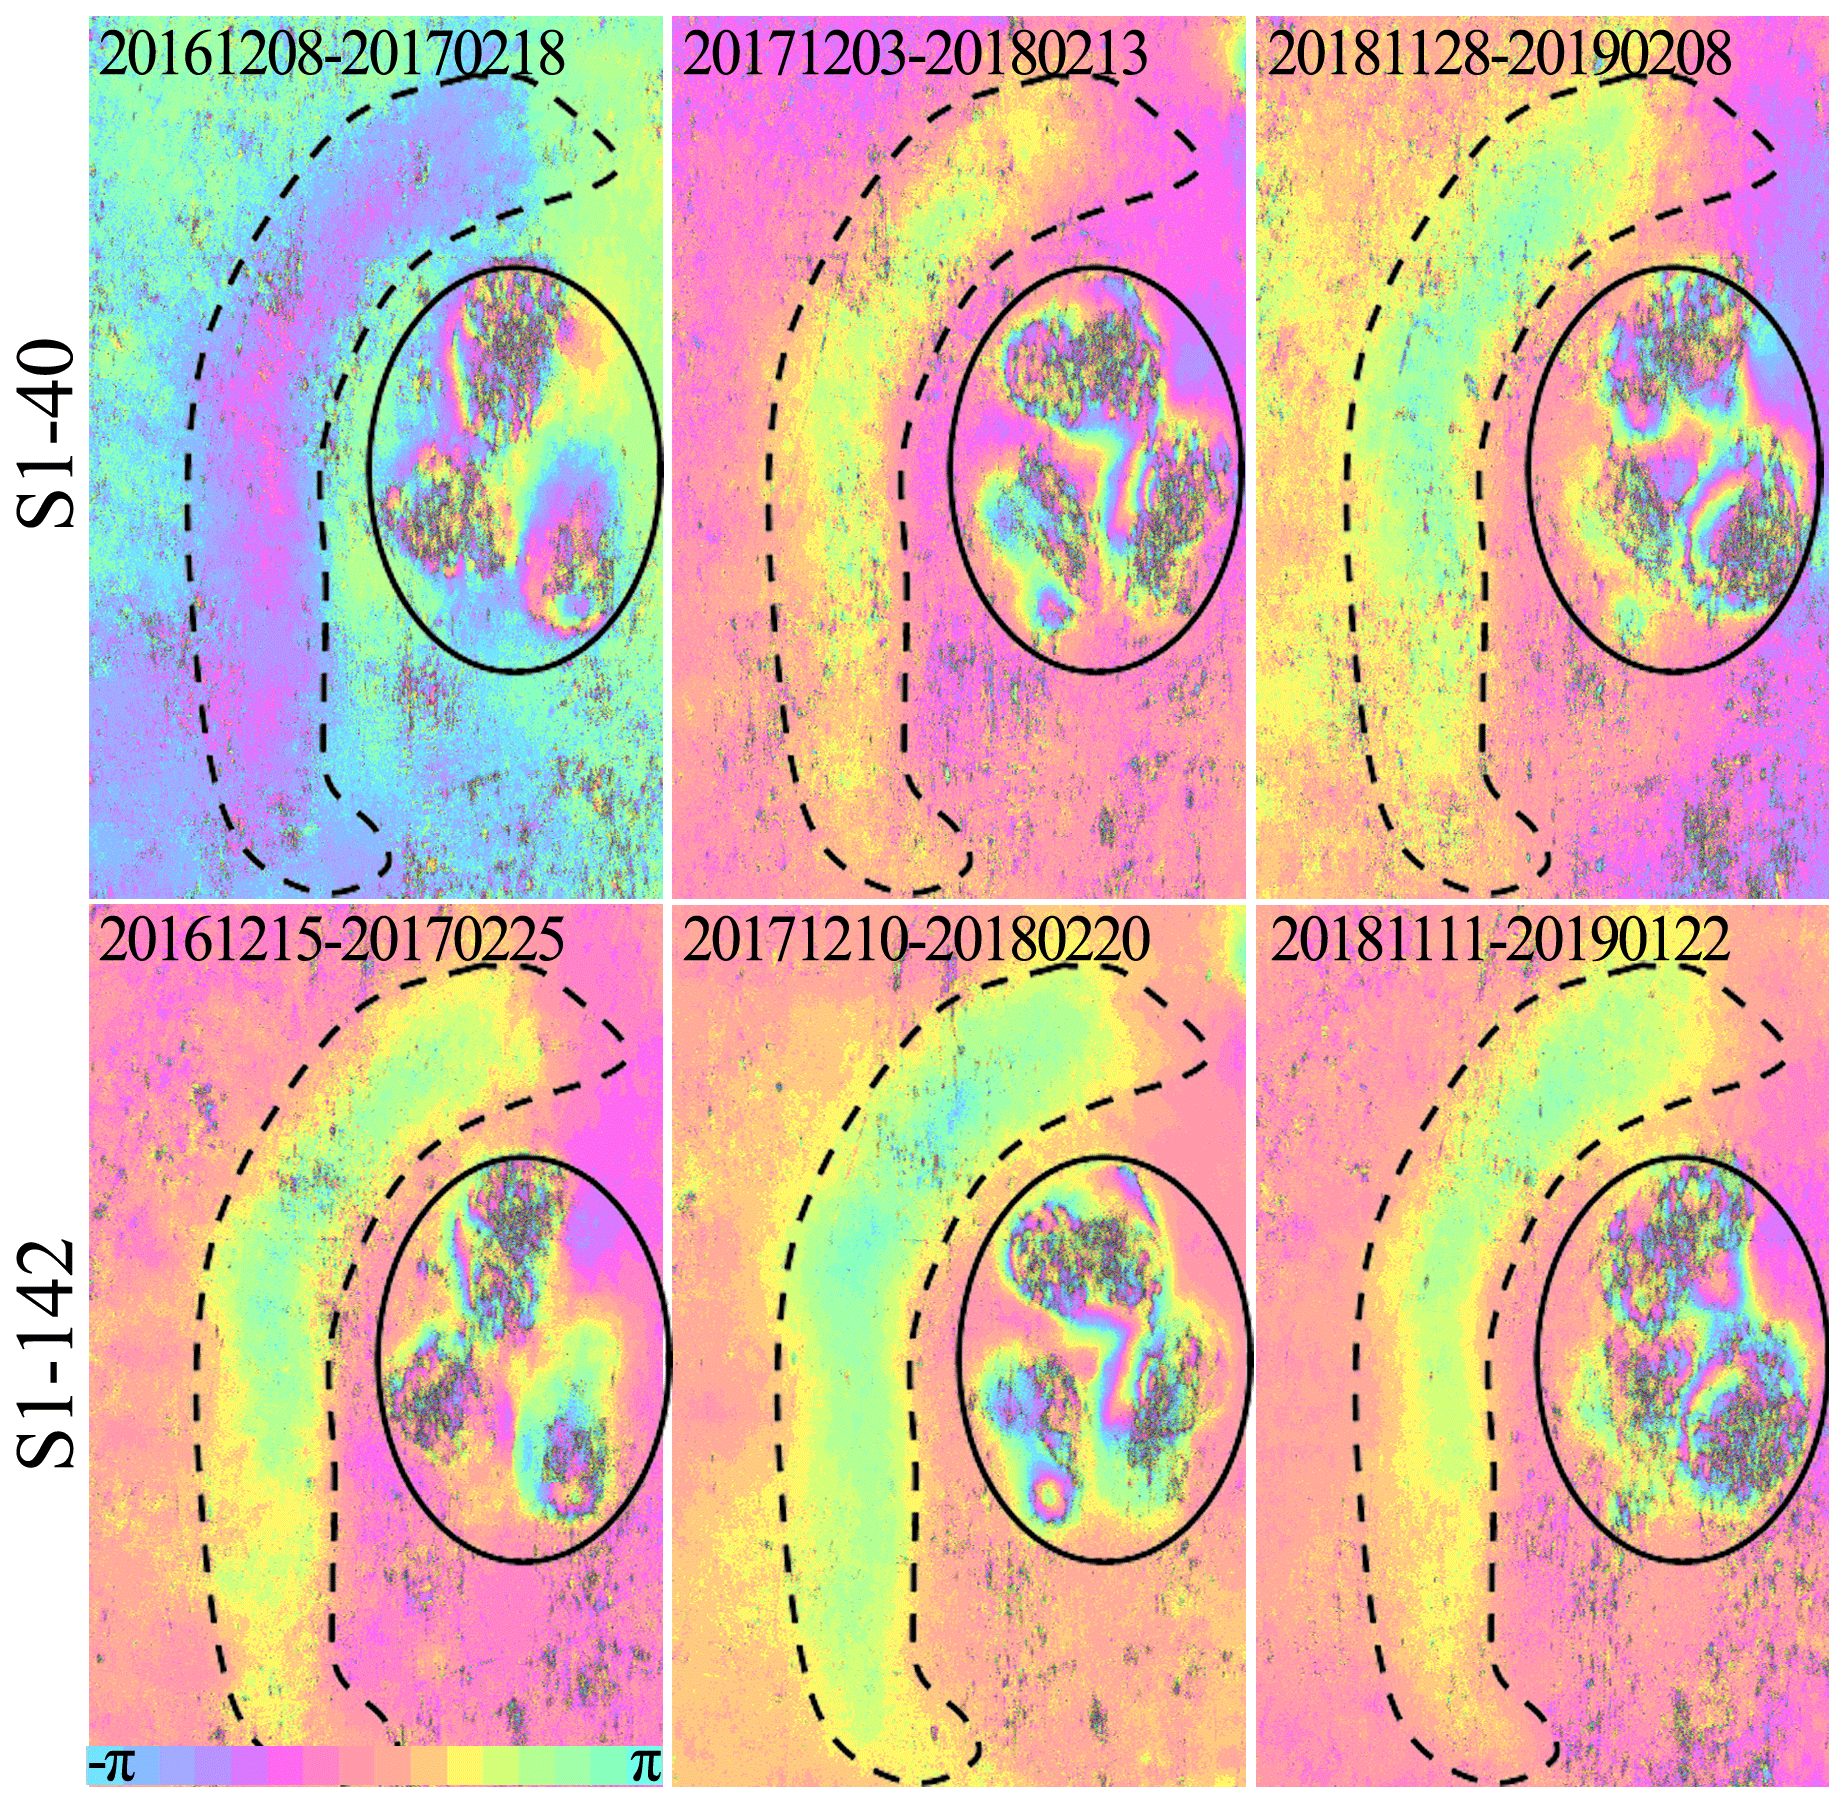
Figure 10Example of interferograms produced from S1-40 and S1-142 of box (b) in Fig. 3. The ellipses show the primary subsidence area induced by underground mining. One color fringe stands for approximately 2.8 cm displacement in the LOS. The dashed lines show the secondary subsidence area caused by complicated factors, e.g., groundwater drain out and/or fault activation due to underground mining.
This study investigates the time-series displacement over the Heze region in 2015–2019 using MT-InSAR based on two sets of Sentinel-1A datasets. The two independent MT-InSAR results agree well with each other with 1σ uncertainty of approximately ±0.5 cm yr−1. Focusing on the ground displacement along RLHR-HZ, we find that there are two main ground subsidence zones:
-
One subsidence zone is located in the east of Heze city (115.5–115.6∘ E) with displacement rates ranging from −4 to −1 cm yr−1. A length of approximately 20 km of RLHR-HZ will be affected by this subsidence.
-
One subsidence zone is located in the coalfield (115.8–116.0∘ E) with displacement rates ranging from −8 to −2 cm yr−1. A length of approximately 15 km of RLHR-HZ will be affected by this subsidence.
Considering the previous investigation coupled with information of human activities, we conclude that the subsidence is mainly caused by extraction of groundwater and underground mining:
-
By combining the known previous investigations and the monthly precipitation, we find two patterns of subsidence: a long-term subsidence due to the extraction of deep groundwater mainly in the urban area, and short-term variations related to the seasonal precipitation in the rural areas.
-
Underground mining is another cause of ground subsidence, which can reach up to several meters. However, we found an interesting phenomenon of a secondary subsidence basin further away (about 3–7 km) from the primary subsidence basin (Figs. 9 and 10). Considering the known faults and the unknown mining-induced fracture fields, we infer that the secondary subsidence is very probably caused by the groundwater outflow and fault instability due to mining, rather than being directly caused by mining. It will be interesting to further investigate the cause of secondary subsidence when more data become available.
It is very difficult to restore the surface elevation and the foundation stability after extracting deep groundwater and coal. The ongoing subsidence will severely damage the infrastructure of RLHR-HZ, particularly when the RLHR-HZ will be operational by the end of 2021. Effective management of groundwater and coal mining is urgently needed. Hence, it is very meaningful to continue the monitoring of ground deformation along RLHR-HZ using multiple SAR data.
Sentinel-1A/B data are available at https://scihub.copernicus.eu/ (last access: 4 December 2020) (European Space Agency, 2020). TanDEM-X are free to download from https://sso.eoc.dlr.de/eoc/auth/login?service=https://download.geoservice.dlr.de/TDM90/files/ (last access: 4 December 2020) (Deutsches Zentrum für Luft- und Raumfahrt, 2020). The monthly precipitation are available at http://data.cma.cn/data/cdcdetail/dataCode/A.0012.0001.html (last access: 4 December 2020) (China Meteorological Data Service Centre, 2020). The information about the annual exploitation of groundwater is provided by Shandong Provincial Bureau of Statistics from http://tjj.shandong.gov.cn/ (last access: 4 December 2020) (Shandong Provincial Bureau of Statistics, 2020).
CZ initiated the study and wrote the paper. WW provided python scripts for analysis. CZ and MM analyzed the data. MM, LZ, ZJ and SL provided advice and reviewed the paper.
The authors declare that they have no conflict of interest.
This article is part of the special issue “Remote sensing and Earth observation data in natural hazard and risk studies”. It is not associated with a conference.
Thanks go to the providers of StaMPS software that can be downloaded from http://homepages.see.leeds.ac.uk/~earahoo/stamps/index.html (last access: 4 December 2020). The authors would also like to thank the editor Antonio Montuori and reviewers Darvishi Mehdi and Argyrakis Panagiotis for their careful work and insightful suggestions.
This research has been supported by the National Natural Science Foundation of China (grant nos. 41901373 and 41877283) and the Natural Science Foundation of Hunan Province (grant no. 2019JJ50190).
This paper was edited by Antonio Montuori and reviewed by Panagiotis Argyrakis and Mehdi Darvishi.
Bamler, R. and Hartl, P.: Synthetic aperture radar interferometry, Inverse Problems, 14, R1–R54, https://doi.org/10.1088/0266-5611/14/4/001, 1998.
Berardino, P., Fornaro, G., Lanari, R., and Sansosti, E.: A New Algorithm for Surface Deformation Monitoring Based on Small Baseline Differential SAR Interferograms, IEEE T. Geosci. Remote, 40, 2375–2383, https://doi.org/10.1109/TGRS.2002.803792, 2002.
Chen, F. L., Lin, H., Li, Z., Chen, Q., and Zhou, J. M.: Interaction between permafrost and infrastructure along the Qinghai-Tibet Railway detected via jointly analysis of C- and L-band small baseline SAR interferometry, Remote Sens. Environ., 123, 532–540, https://doi.org/10.1016/j.rse.2012.04.020, 2012.
China Meteorological Data Service Centre: Observation of China surface meteorological station, available at: http://data.cma.cn/data/cdcdetail/dataCode/A.0012.0001.html, last access: 4 December 2020.
Cui, Z. D.: Land Subsidence Induced by the Engineering-Environmental Effect, Springer, Singapore, 2018.
Deutsches Zentrum für Luft- und Raumfahrt: TanDEM-X 90 m – Download Service, available at: https://sso.eoc.dlr.de/eoc/auth/login?service=https://download.geoservice.dlr.de/TDM90/files/, last access: 4 December 2020.
Du, Z. Y., Ge, L. L., Ng, H. M., and Li, X. J.: Investigation on mining subsidence over Appin-West Cliff colliery using time-series SAR interferometry, Int. J. Remote Sens., 39, 1528–1547, https://doi.org/10.1080/01431161.2017.1407501, 2018.
European Space Agency: Sentinel missions data, available at: https://scihub.copernicus.eu/, last access: 4 December 2020.
Feng, C. C., Ma, X. F., and Huang, W. F.: Analysis on land subsidence survey and trend in Heze city, in: 13th Geoscience and Technology Forum of East China, 1 November 2015, Nanchang, China, 383–387, 2015.
Ferretti, A., Prati, C., and Rocca, F.: Permanent Scatterers in SAR Interferometry, IEEE T. Geosci. Remote, 39, 8–20, https://doi.org/10.1109/36.898661, 2001.
Ferretti, A., Prati, C., and Rocca, F.: Non-linear Subsidence Rate Estimation Using Permanent Scatterers in Differential SAR Interferometry, IEEE T. Geosci. Remote, 38, 2202–2212, https://doi.org/10.1109/36.868878, 2000.
Ferretti, A., Fumagalli, A., Novali, F., Prati, C., Rucci, A., and Rucci, A.: A new algorithm for processing interferometric data-stacks: squeesar, IEEE T. Geosci. Remote, 499, 3460–3470, https://doi.org/10.1109/TGRS.2011.2124465, 2011.
Fiaschi, S., Closson, D., Karaki, N. A., Pasquali, P., Riccardi, P., and Floris, M.: The complex karst dynamics of the Lisan Peninsula revealed by 25 years of DInSAR observations. Dead Sea, Jordan, ISPRS J. Photogramm. Remote Sens., 130, 358–369, https://doi.org/10.1016/j.isprsjprs.2017.06.008, 2017.
Gabriel, A. K., Goldstein, R. M., and Zebker, H. A.: Mapping Small Elevation Changes over Large Areas: Differential Radar Interferometry, J. Geophys. Res., 94, 9183–9191, https://doi.org/10.1029/JB094iB07p09183, 1989.
Geudtner, D., Torres, R., Snoeij, P., Davidson, M., and Rommen, B.: Sentinel-1 System capabilities and applications, in: Proceedings of IEEE International Conference on Geoscience and Remote Sensing Symposium, IGARSS 2014, 13–18 July 2014, Quebec, Canada, 1457–1460, 2014.
Goel, K. and Adam, N.: High resolution differential interferometric stacking via adaptive spatial phase filtering, in: Proceedings of IEEE International Conference on Geoscience and Remote Sensing Symposium, IGARSS 2011, 24–29 July 2011, Vancouver, Canada, 1341–1344, 2011.
Goel, K. and Adam, N.: An advanced algorithm for deformation estimation in non-urban areas, ISPRS J. Photogramm. Remote Sens., 73, 100–110, https://doi.org/10.1016/j.isprsjprs.2012.06.001, 2012.
Goodman, J. W.: Some fundamental properties of speckle, J. Opt. Soc. Am., 66, 1145–1150, https://doi.org/10.1364/JOSA.66.001145, 1976.
Guo, C. X., Nie, J. L., Tian, J., Wang, W. L., Cheng, C. L., Wang, B., Yin, H. F., and Zhang, H. P.: Vertical ground displacements in the Shandong Province derived from long-term GNSS and leveling surveying, Adv. Space Res., 64, 1388–1397, https://doi.org/10.1016/j.asr.2019.06.035, 2019.
Haghighi, M. H. and Motagh, M.: Ground surface response to continuous compaction of aquifer system in Tehran, Iran: Results from a long-term multi-sensor InSAR analysis, Remote Sens. Environ., 221, 534–550, https://doi.org/10.1016/j.rse.2018.11.003, 2019.
He, G. Q., Yang, L., Lin, G. D., Jia, F. C., and Hong, D.: Mining Subsidence Engineering, Press China Univ. Mining Technol., Xuzhou, China, 1994.
Hooper, A.: A Multi-Temporal InSAR Method Incorporating Both Persistent Scatterer and Small Baseline Approaches, Geophys. Res. Lett., 35, L16302, https://doi.org/10.1029/2008GL034654, 2008.
Hooper, A.: A statistical-cost approach to unwrapping the phase of InSAR time series, in: Proceedings of the International Workshop on ERS SAR Interferometry, 30 November–4 December 2010, Frascati, Italy, 1–4, 2010.
Hooper, A. and Zebker, H.: Phase unwrapping in three dimensions with application to InSAR time series, J. Opt. Soc. Am., 24, 2737–2747, https://doi.org/10.1364/JOSAA.24.002737, 2007.
Hooper, A., Segall, P., and Zebker, H.: Persistent Scatterer Interferometric Synthetic Aperture Radar for Crustal Deformation Analysis, with Application to Volcán Alcedo, Galápagos, J. Geophys. Res., 112, B07407, https://doi.org/10.1029/2006JB004763, 2007.
Hu, R. L., Yue, Z. Q., Wang, L. C., and Wang, S. J.: Review on current status and challenging issues of land subsidence in China, Eng. Geol., 76, 65–77, 2004.
Islam, M. R. and Shinjo, R.: Mining-induced fault reactivation associated with the main conveyor belt roadway and safety of the Barapukuria Coal Mine in Bangladesh: Constraints from BEM simulations, Int. J. Coal Geol., 79, 115–130, https://doi.org/10.1016/j.coal.2009.06.007, 2009.
Jia, P. Y.: Investigation and evaluation of groundwater environment in Heze City, Zhihuai, 1, 83–84, 2015.
Kampes, B.: Radar Interferometry: Persistent Scatterer Technique, Springer Netherlands, the Netherlands, 2006.
Litwiniszyn, J.: Application of the equation of stochastic processes to mechanics of loose bodies, Arch. Mech., 8, 393–411, 1956.
Ma, L. and Feng, C. C.: Analysis on sustainable utilization and exploitation potentiality of shallow groundwater resources in Heze Yellow River flood plain areas, Shandong Land Resour., 30, 43–45, 2014.
Massonnet, D. and Feigl, K.: Radar interferometry and its application to changes in the Earth surface, Rev. Geophys., 36, 441–5000, https://doi.org/10.1029/97RG03139, 1998.
Miller, M. M. and Shirzaei, M.: Land subsidence in Houston correlated with flooding from Hurricane Harvey, Remote Sens. Environ., 225, 368–378, https://doi.org/10.1016/j.rse.2019.03.022, 2019.
Mora, O., Mallorqui, J. J., and Broquetas, A.: Linear and nonlinear terrain deformation maps from a reduced set of interferometric SAR images, IEEE T. Geosci. Remote, 41, 2243–2253, https://doi.org/10.1109/TGRS.2003.814657, 2003.
Motagh, M., Shamshiri, R., Haghighi, M. H., Wetzel, H. U., Akbari, B., Nahavandchi, H., Roessner, S. and Arabi, S.: Quantifying groundwater exploitation induced subsidence in the Rafsanjan plain, southeastern Iran, using InSAR time-series and in situ measurements, Eng. Geol., 218, 134–151, https://doi.org/10.1016/j.enggeo.2017.01.011, 2017.
Parizzi, A. and Brcic, R.: Adaptive InSAR Stack Multilooking Exploiting Amplitude Statistics: A Comparison Between Different Techniques and Practical Results, IEEE Geosci. Remote Sens. Lett., 8, 441–445, https://doi.org/10.1109/LGRS.2010.2083631, 2011.
Prats-Iraola, P., Scheiber, R., Marotti, L., Wollstadt, S., and Reigber, A.: TOPS Interferometry With TerraSAR-X, IEEE T. Geosci. Remote, 50, 3179–3188, https://doi.org/10.1109/TGRS.2011.2178247, 2012.
Qiao, G. and Lin, H. J.: Evaluation and analysis of deep groundwater in Heze City, Shandong Water Resour., 8, 99–100, 2006.
Rapantova, N., Grmela, A., Vojtek, D., Halir, J., and Michalek, B.: Groundwater flow modeling applications in mining hydrogeology, in: IMWA Symposium 2007: Water in Mining Environments, 27–31 May 2007, Cagilari, Italy, 349–353, 2007.
Samiei-Esfahany, S.: Exploition of distributed scatterers in synthetic aperture radar interferometry, PhD thesis, Delft University of Technology, Delft, the Netherlands, 2017.
Shamshiri, R., Nahavandchi, H., Motagh, M., and Hooper, A.: Efficient ground surface displacement monitoring using sentinel-1 data: integrating distributed scatterers (DS) identified using two-sample t-test with persistent scatterers (PS), Remote Sens., 10, 794, https://doi.org/10.3390/rs10050794, 2018.
Shandong Provincial Bureau of Statistics: Shandong Statistical Yearbook, Beijing, China Statistics Press, China, 2010–2019, available at: http://tjj.shandong.gov.cn/, last access: 4 December 2020.
Sousa, J. J., Hooper, A. J., Hanssen, R. F., Bastos, L. C., and Ruiz, A. M.: Persistent Scatterer InSAR: A comparison of methodologies based on a model of temporal deformation vs. spatial correlation selection criteria, Remote Sens. Environ., 115, 2652–2663, https://doi.org/10.1016/j.rse.2011.05.021, 2011.
Vervoort, A.: Surface movement above an underground coal longwall mine after closure, Nat. Hazards Earth Syst. Sci., 16, 2107–2121, https://doi.org/10.5194/nhess-16-2107-2016, 2016.
Wang, H. Q.: Mining subsidence monitoring around Longgu coal mine based on remote sensing, Adv. Mater. Res., 1010–1012, 489–495, https://doi.org/10.4028/www.scientific.net/AMR.1010-1012.489, 2014.
Wang, H. W., Jiang, Y. D., Xue, S., Mao, L. T., Lin, Z. N., Deng, D. X., and Zhang, D. Q.: Influence of fault slip on mining-induced pressure and optimization of roadway support design in fault-influenced zone, J. Rock Mech. Geotech. Eng., 8, 660–671, https://doi.org/10.1016/j.jrmge.2016.03.005, 2016.
Wang, Y., Zhu, X. X., and Bamler, R.: Retrieval of phase history parameters from distributed scatterers in urban areas using very high resolution SAR data, ISPRS J. Photogramm. Remote Sens., 73, 89–99, https://doi.org/10.1016/j.isprsjprs.2012.06.007, 2012.
Wessel, B., Huber, M., Wohlfart, C., Marschalk, U., Kosmann, D., and Roth, A.: Accuracy assessment of the global TanDEM-X Digital Elevation Model with GPS data, ISPRS J. Photogramm. Remote Sens., 139, 171–182, https://doi.org/10.1016/j.isprsjprs.2018.02.017, 2018.
Xu, J. Y., Mao, L., Zhang, T., and Wang, Z. S.: The development and utilization of water resources and security assurance planning study in Heze City, China Population, Resour. Environ., 27, 200–203, 2017.
Xu, S. Y., Zhang, Y. B., Shi, H., Wang, K., Geng, Y. P., and Chen, J. F.: Physical Simulation of Strata Failure and Its Impacton Overlying Unconsolidated Aquifer at Various Mining Depths, Water, 10, 650–667, https://doi.org/10.3390/w10050650, 2018.
Xue, Y. Q., Zhang, Y., Ye, S. J., Wu, J. C., and Li, Q. F.: Land subsidence in China, Environ. Geol., 48, 713–720, https://doi.org/10.1007/s00254-005-0010-6, 2005.
Yague-Martinez, N., Prats-Iraola, P., Rodriguez, G. F., Brcic, R., Shau, R., Geudtner, D., Eineder, M., and Bamler, R.: Interferometric Processing of Sentinel-1 TOPS Data, IEEE T. Geosci. Remote, 54, 2220–2234, https://doi.org/10.1109/TGRS.2015.2497902, 2016.
Yang, S. Y., Yang, H. C., Jing, C. Q., Yue, X. L., and Jie, J.: Comprehensive Control of the Coal Mine Subsidence Area: A Case of the Subsidence Area of Chenman Village in Heze of Shandong Province, China Population, Resour. Environ., 20, 194–196, 2010.
Yu, C. J., Jia, P. Y., Lv, S. G., Yuan, X. A., and Zang, X. L.: Analysis of shallow groundwater in Heze city, Shandong Water Resour., 4, 14–15, 2001.
Yue, J. G.: Analysis on the current situation and causes of land subsidence along the Lunan high speed railway, Rail. Inv. Survey., 2, 60–65, 2020.
Zhang, H., Dong, M., Ma, J., Liu, Y. H., and Liu, K.: Relationship between the deep groundwater exploitation and land subsidence in Changyi district of Shandong province, China Earthq. Eng. J., 40, 214–218, 2018.
Zhang, L. L.: Study on land subsidence prevention and control along the Jingjiu Railway (Shandong Section), PhD thesis, China University of Geosciences (Beijing), Beijing, China, 2013.
Zhang, Q., Li, Y., Zhang, J., and Luo, Y.: InSAR technique applied to the monitoring of the Qinghai–Tibet Railway, Nat. Hazards Earth Syst. Sci., 19, 2229–2240, https://doi.org/10.5194/nhess-19-2229-2019, 2019.
Zhang, Y. H., Underschultz, J., Langhi, L., Mallants, D., and Strand, J.: Numerical modelling of coal seam depressurization during coal seam gas production and its effect on the geomechanical stability of faults and coal beds, Int. J. Coal Geol., 195, 1–13, https://doi.org/10.1016/j.coal.2018.05.008, 2018.
Zhu, C. G., Wang, Z. S., Li, P. X., Motagh, M., Zhang, L. Y., Jiang, Z. L., and Long, S. C.: Retrieval and Prediction of Three-Dimensional Displacements by Combining the DInSAR and Probability Integral Method in a Mining Area, IEEE J. Sel. Top. Appl. Earth Observ. Remote Sens., 13, 1206–1217, https://doi.org/10.1109/JSTARS.2020.2978288, 2020.