the Creative Commons Attribution 4.0 License.
the Creative Commons Attribution 4.0 License.
 | 10 Dec 2020
Experimental assessment of the relationship between rainfall intensity and sinkholes caused by damaged sewer pipes
Tae-Young Kwak
Sang-Inn Woo
Choong-Ki Chung
Joonyoung Kim
In several countries, the rising occurrence of sinkholes has led to severe social and economic damage. Based on the mechanism of sinkhole development, researchers have investigated the correlation between rainfall intensity and sinkholes caused by damaged sewer pipes. In this study, the effect of rainfall intensity on the formation of eroded zones, as well as the occurrence of sinkholes caused by soil erosion due to groundwater infiltration through pipe defects, has been analyzed through model tests. The ground materials in Seoul were represented by weathered granite soil, which is generally used for backfill sewer pipes, and groundwater levels corresponding to three different rainfall intensity conditions were considered. The ground level changes and ground displacements were measured continuously, and the particle image velocimetry (PIV) algorithm was applied to measure the displacement at each position of the model ground. The results indicate that impeding the excessive rise in groundwater levels by securing sufficient sewage treatment facilities can effectively prevent the development of sinkholes caused by pipe defects.
- Article
(44932 KB) - Full-text XML
- BibTeX
- EndNote


In recent times, cases of sinkholes have been reported in several countries, such as the USA, Japan, Italy, South Africa, China, Spain, and South Korea. Major social and economic issues have ensued owing to the resulting structural problems, such as the collapse of buildings and road erosion (Galloway et al., 1999; Waltham et al., 2005; Gutierrez et al., 2008; Kuwano et al., 2010a; Oosthuizen and Richardson, 2011; Beck et al., 2012; Guarino and Nisio, 2012; Yokota et al., 2012; Gao et al., 2013; Intrieri et al., 2015; Bae et al., 2016; Parise, 2019). In general, sinkholes can be classified into two types: (1) natural sinkholes and (2) anthropogenic sinkholes (Guarino and Nisio, 2012; Gutierrez et al., 2008, 2014; Beck, 2012; Parise, 2019). Natural sinkholes occur when the underlying ground layer (e.g., karst landscape) is easily soluble in water, whereas anthropogenic sinkholes may occur also in a nonkarst environment (Parise, 2015), caused by human activity such as sewage damage, inadvertent excavation, or groundwater lowering.
Both types of sinkholes have similar mechanisms, and the detailed process of occurrence is as follows (Rogers, 1986; Brinkmann et al., 2008; Caramanna et al., 2008; Kuwano et al., 2010a; Oosthuizen and Richardson, 2011; Martinotti et al., 2017): (1) a cavity is formed underground by external factors (the water-soluble ground layer dissolves in groundwater to cause a natural sinkhole, or soil erosion occurs along with the groundwater outflow due to sewage damage or excavation to cause an anthropogenic sinkhole). (2) The groundwater level rises during rainfall and falls after the rainfall, causing the soil around the cavity to be lost and the cavity to expand. (3) A sinkhole is finally generated because of the repeated increase and decrease in the groundwater level.
Based on the mechanism for both types of sinkholes (natural and anthropogenic), a direct relationship can be inferred between the rainfall intensity, which leads to the transition of the groundwater level (rise and fall) and the occurrence of sinkholes. Notably, the change in climate due to global warming has resulted in higher rainfall intensity with fewer rainy days (Alpert et al., 2002; Kristo et al., 2017; Rahardjo et al., 2019). In South Korea, the maximum daily rainfall has increased over the decades in most regions and is expected to increase significantly in the future (Nadarajah and Choi, 2007; Wi et al., 2016; Choi et al., 2017). For landslides, many studies have established the influences of rainfall on those geological hazards (Peruccacci et al., 2012; Rossi et al., 2012; Vessia et al., 2012). In this context, there is a growing need to study the correlation between rainfall intensity and sinkhole occurrence.
Martinotti et al. (2017) and Parise et al. (2018) showed that a period of torrential rain and the rainfall intensity triggered natural sinkholes in Italy. Gao et al. (2013) confirmed that the groundwater level rise due to extremely heavy rainfall has a significant effect on sinkhole generation in a karst environment in China. Van Den Eeckhaut et al. (2007) showed that the formation of numerous natural sinkholes in Belgium corresponded with periods of high rainfall and high groundwater recharge, which commonly increased the weight of the overburden and decreased its cohesion.
A majority of sinkholes in nonkarst environments are known to occur because of damaged sewer pipes. In Seoul, South Korea, an average of 677 sinkholes and subsidence occurred annually from 2010 to 2015, of which 81.4 % were due to damage to old sewer pipes (Bae et al., 2016). In Japan, local governments in sewage projects were surveyed to identify cases of subsidence due to damage to sewer pipes. As a result, a total of 17 000 data were reported from 2006 to 2009 (Yokota et al., 2012).
Considering these factors, several researchers have conducted statistical analysis and model experiments to investigate the correlation between rainfall intensity and sinkholes caused by damaged sewer pipes. Kwak et al. (2016) showed that the number of anthropogenic sinkhole cases increased with the increase in total monthly precipitation. In addition, it was confirmed that anthropogenic sinkholes are prone to occur after exceptionally heavy rains. By quantifying Pearson's correlation coefficient between two relevant observations, Choi et al. (2017) showed that the monthly accumulated precipitation and the quantity of subsidence are related to a certain extent. Guo et al. (2013) and Tang et al. (2017) used model experiments and evaluated the effect of the defect size, groundwater level, and particle size on soil erosion due to groundwater infiltration through pipe defects. However, they only used noncohesive soils and covered extreme cases with groundwater levels significantly exceeding the ground level.
In this study, the urban area in Seoul has been simulated, and model tests have been conducted to analyze the effect of rainfall intensity on the formation of eroded zones, as well as the occurrence of sinkholes caused by soil erosion due to groundwater infiltration through pipe defects. The model ground was constructed using weathered granite soil (which is generally cohesive), mainly used to backfill the sewer pipes in Seoul. Three rainfall intensity conditions (heavy rainfall, very heavy rainfall, and extremely heavy rainfall) were set for the groundwater level, based on summer rainfall patterns in Korea, to be applied in the model tests. The groundwater level change, discharged soil volume, and ground displacement were measured continuously throughout the tests. In particular, the particle image velocimetry (PIV) method, which can continuously measure and analyze the displacements in the ground, was applied to quantify the ground deformation with the occurrence and expansion of underground cavities.
The remainder of this paper is organized as follows. Section 2 describes the model test device, model grounds, and test conditions. Section 3 discusses the model test results. Finally, Sect. 4 presents the conclusions.

2.1 Experiment apparatus
In this study, experiments were performed using the model tester developed by Kwak et al. (2019) to simulate ground subsidence (Fig. 1). The distance between each pipe in the sewer pipe network in Seoul was examined and found to be around 1.2 m. In order to exclude the effects of unnecessary boundary conditions, the width of the model soil was set to 1.4 m, with respective left and right margins of 0.1 m. Considering that the average landfill depth of a sewage pipe in Seoul is 0.9 m (Kim et al., 2018), the soil chamber was built to a height of 1.0 m, including a 0.1 m clearance to facilitate sample composition. The depth of the soil chamber was set to 0.1 m to simulate the plane strain condition, and the front plate of the chamber was made of acrylic plate to allow the inside of the ground to be photographed during the test.
Table 1Relation between rainfall intensity and hydraulic head applied to sewer pipes (National Disaster Management Institute of Korea, 2014).
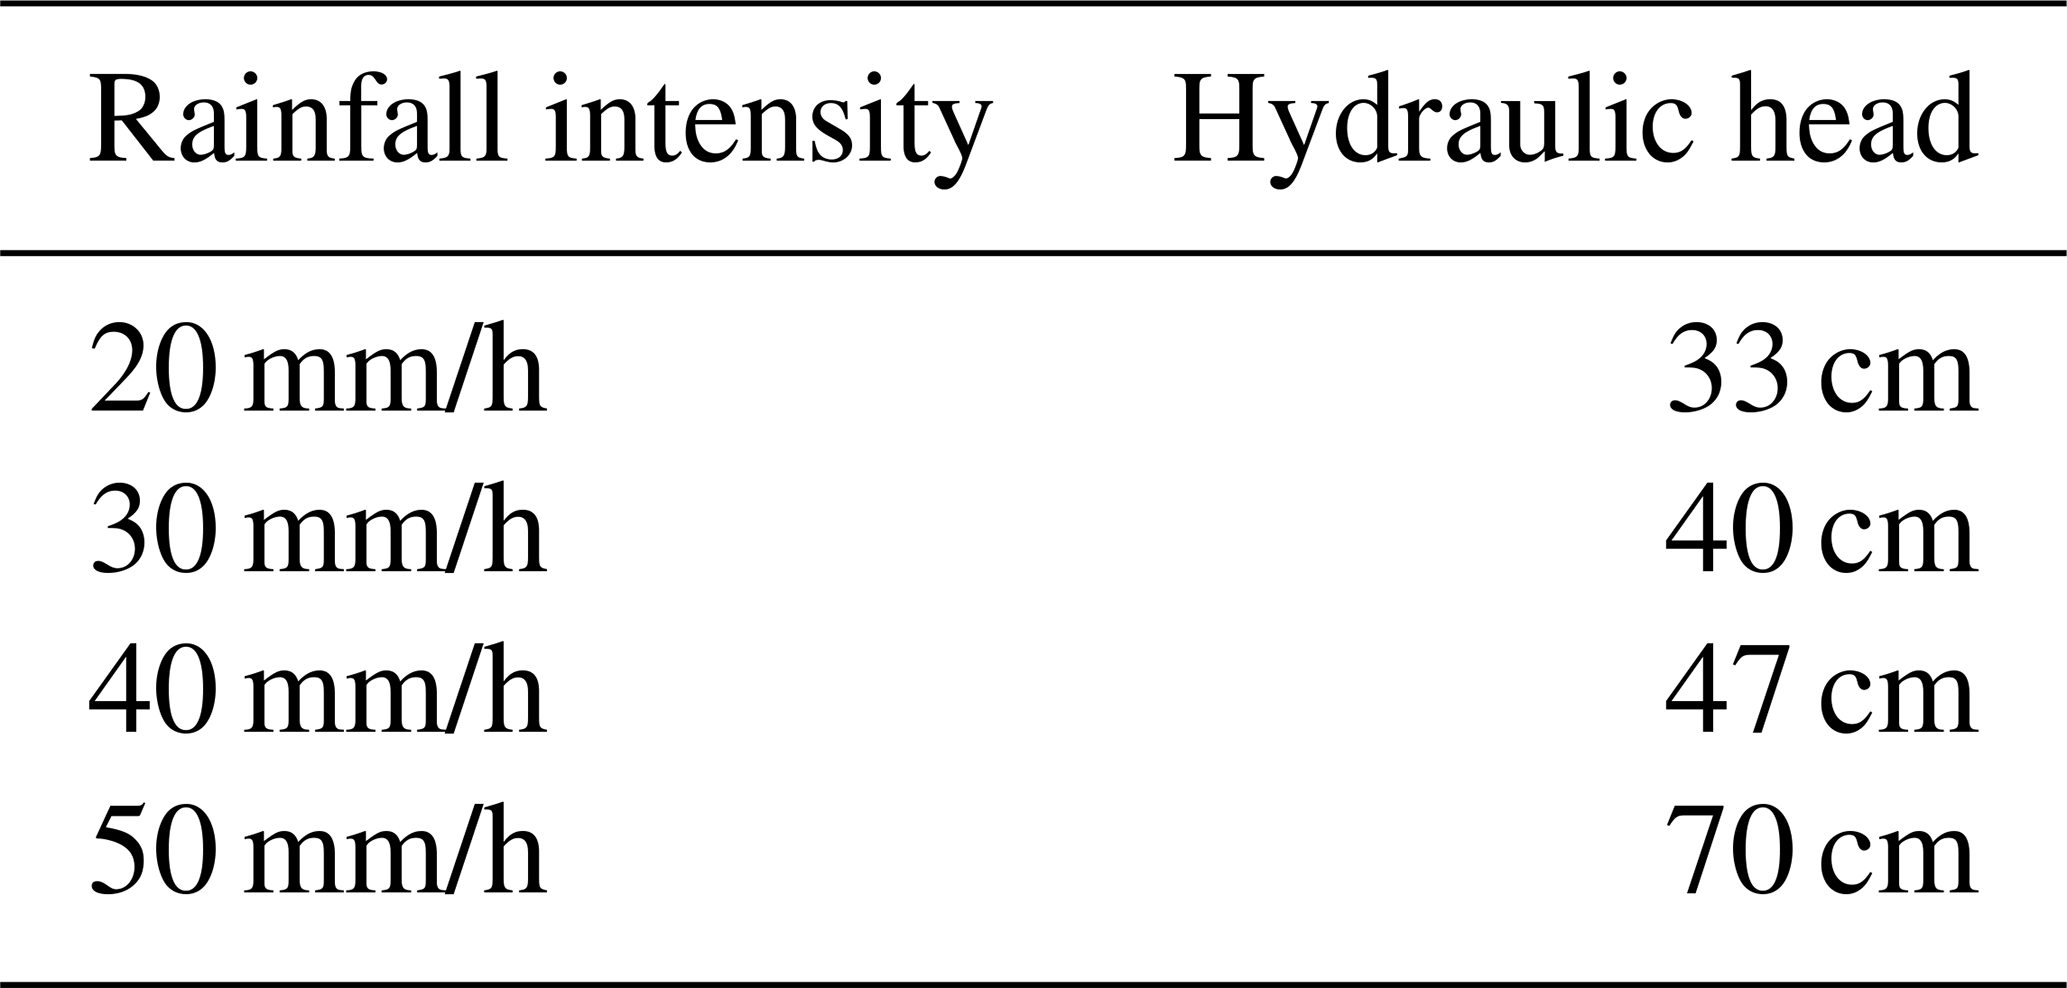
A slit was installed at the bottom of the soil chamber to simulate the damage of the sewer pipe, allowing the inflow and outflow of sewage and the outflow of soil during the model test. The width of the slit (B) was set to 2 cm, based on the study by Mukunoki et al. (2012), such that B∕Dmax was 4.2 (maximum particle diameter of weathered soil Dmax=4.76 mm). A supply valve and a drain valve were installed under the slit to control the inflow and outflow of groundwater as well as the outflow of eroded soil. The external water tank connected to the inlet valve was designed to maintain a constant level even when water is continuously supplied to the model ground. Through experimental assessment (Table 1), the National Disaster Management Institute of Korea (2014) suggested a relationship between the rainfall intensity and the hydraulic head in the sewage network conditions near Gangnam station (sewer pipe with 1000 mm of diameter was simulated). It should be noted that the hydraulic head increases linearly with the rainfall strength until the rainfall strength is 40 mm/h but thereafter increases sharply. In the present study, the height of the external tank was made adjustable to simulate the various rainfall intensities (related to hydraulic head).
2.2 Model ground
The vast majority of prior studies that have experimentally assessed the ground subsidence and sinkhole due to sewer pipe damage have been conducted on poorly graded noncohesive soils (Kuwano et al., 2010a, b; Guo et al., 2013; Sato and Kuwano, 2015; Indiketiya et al., 2017; Tang et al., 2017). However, in several countries, the sewage reclamation specifications allow the landfill soil to contain 15 %–25 % of fine contents. There are no restrictions on particle size distribution apart from the maximum particle size (Japan Road Association, 1990; Ministry of Environment of Korea, 2010). In the present study, to simulate the ground in Seoul in which weathered granite soil, which is a well-graded cohesive soil, is widely distributed, the model ground was created by collecting Gwanak weathered soil and adjusting the fine content to 7.5 % to meet the fine content standard. The degree of compaction was also set to 93 % of the standard maximum unit dry weight γd,max to satisfy the sewer pipe landfill standards, and the model ground was constructed with the optimum moisture content. Figure 2 shows the particle size distributions of the adjusted and natural Gwanak soil in comparison with the sewer pipe landfill standards in South Korea and Japan. Table 2 lists the basic physical properties, strength parameters and saturated permeability coefficient of the adjusted Gwanak soil used in the model test.
Table 2Properties of adjusted Gwanak soil.
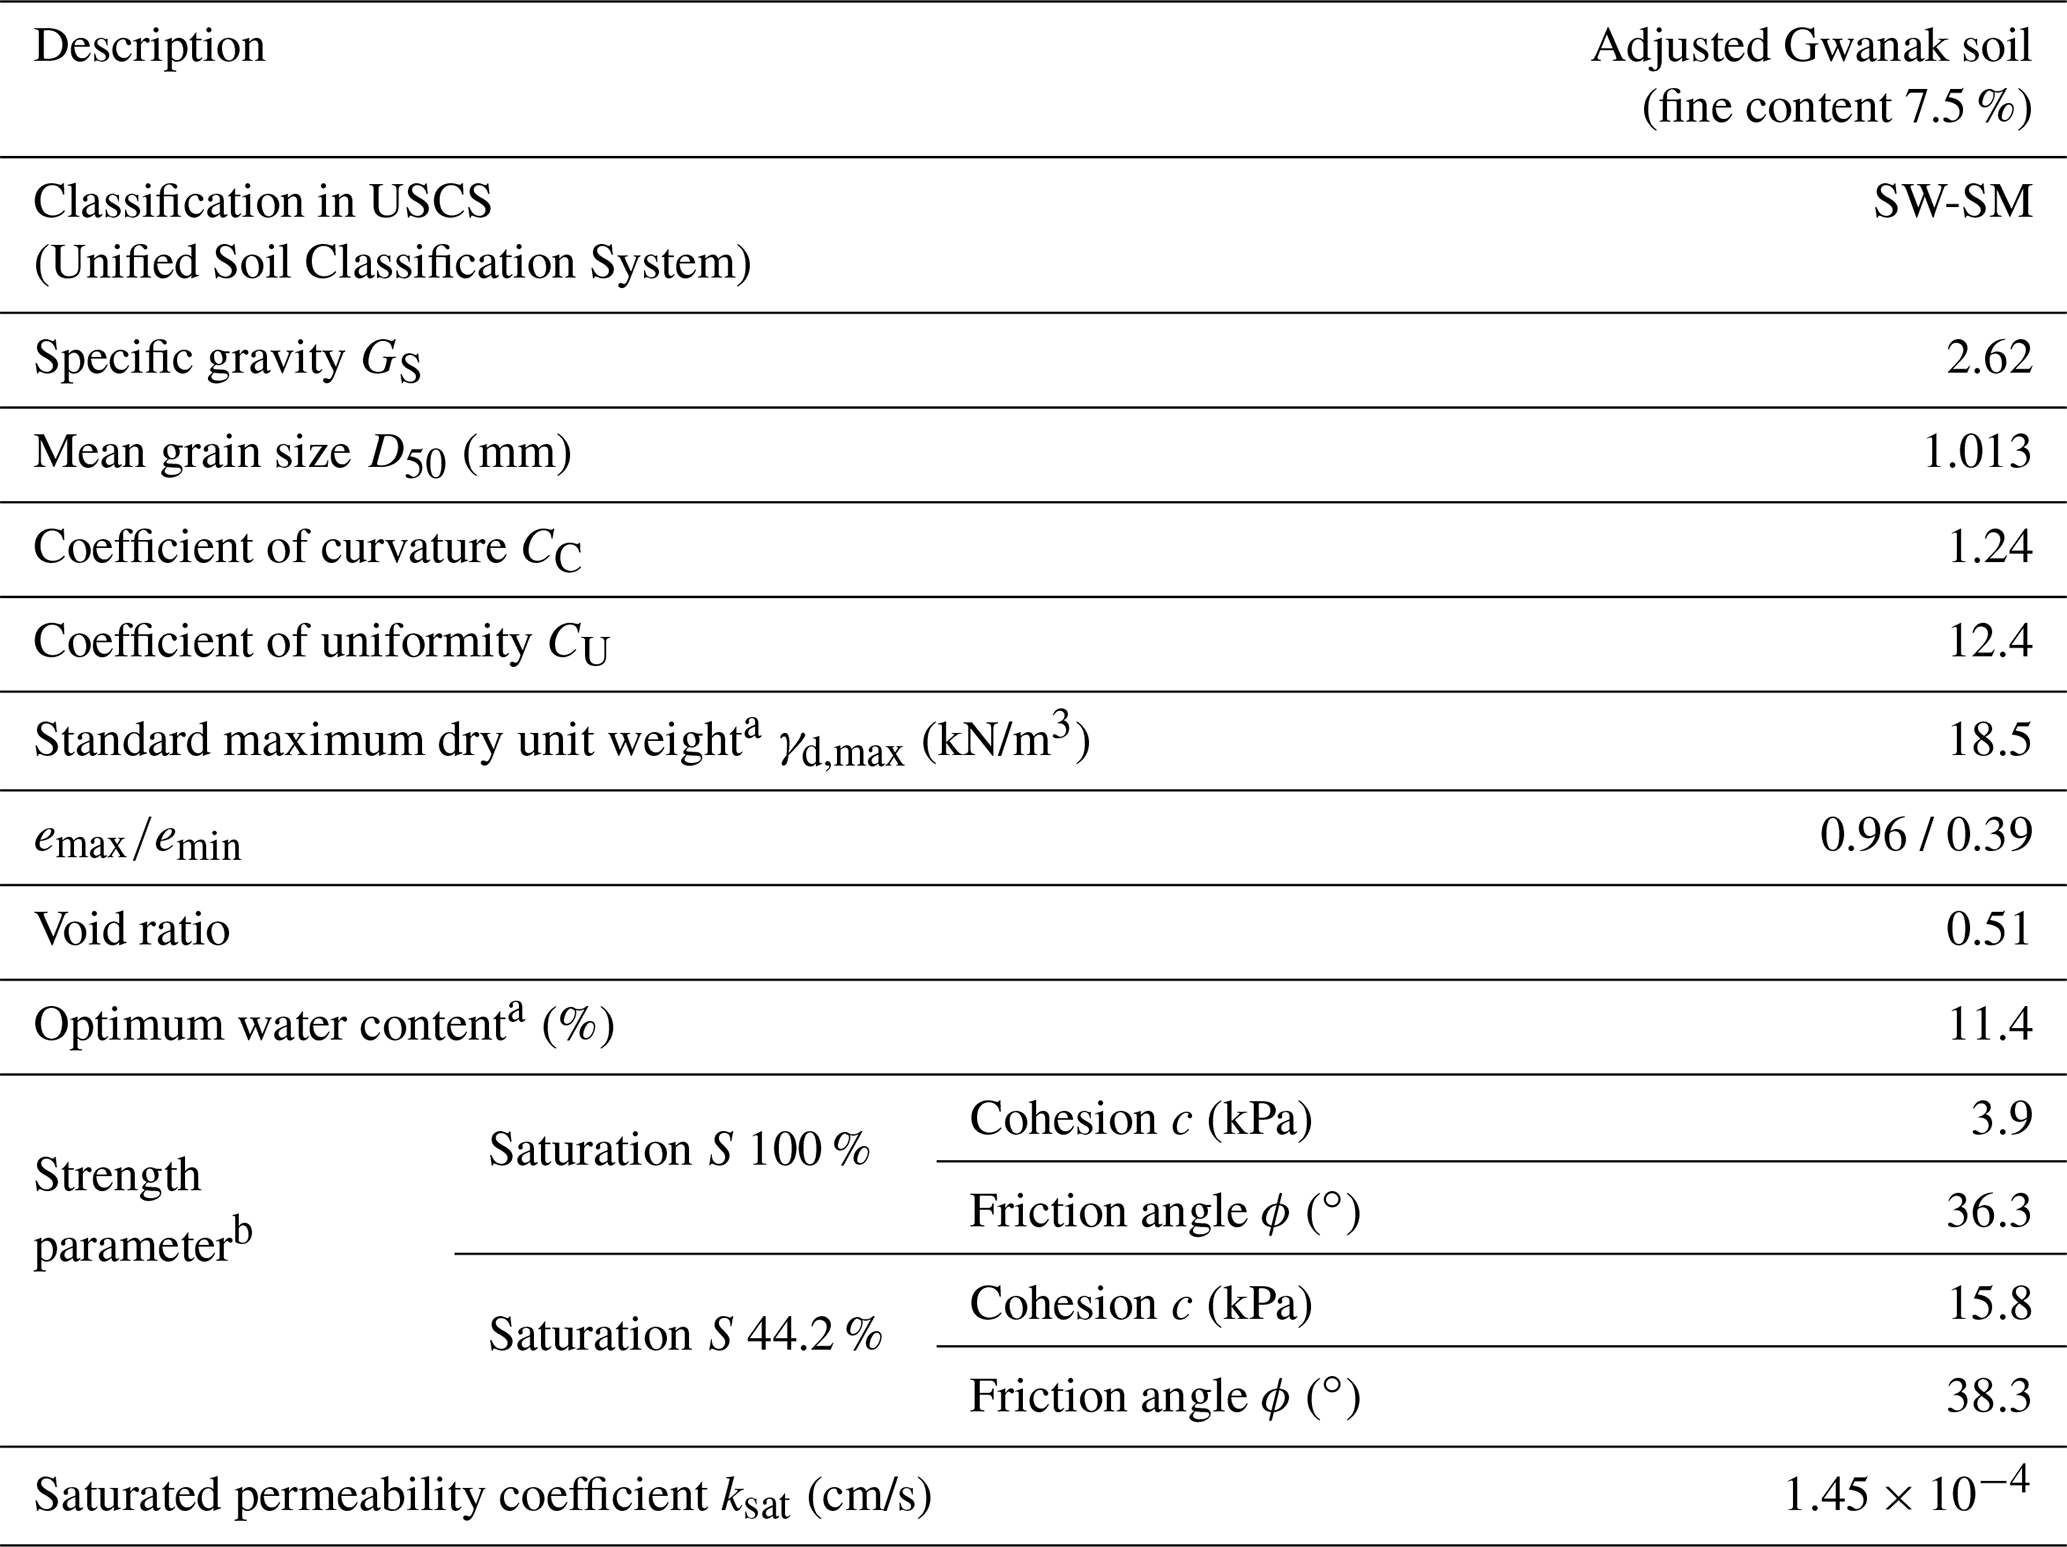
a Estimated from the standard compaction tests. b Estimated from the direct shear tests. S= 44.2 % corresponds to wopt obtained from the standard compaction tests.
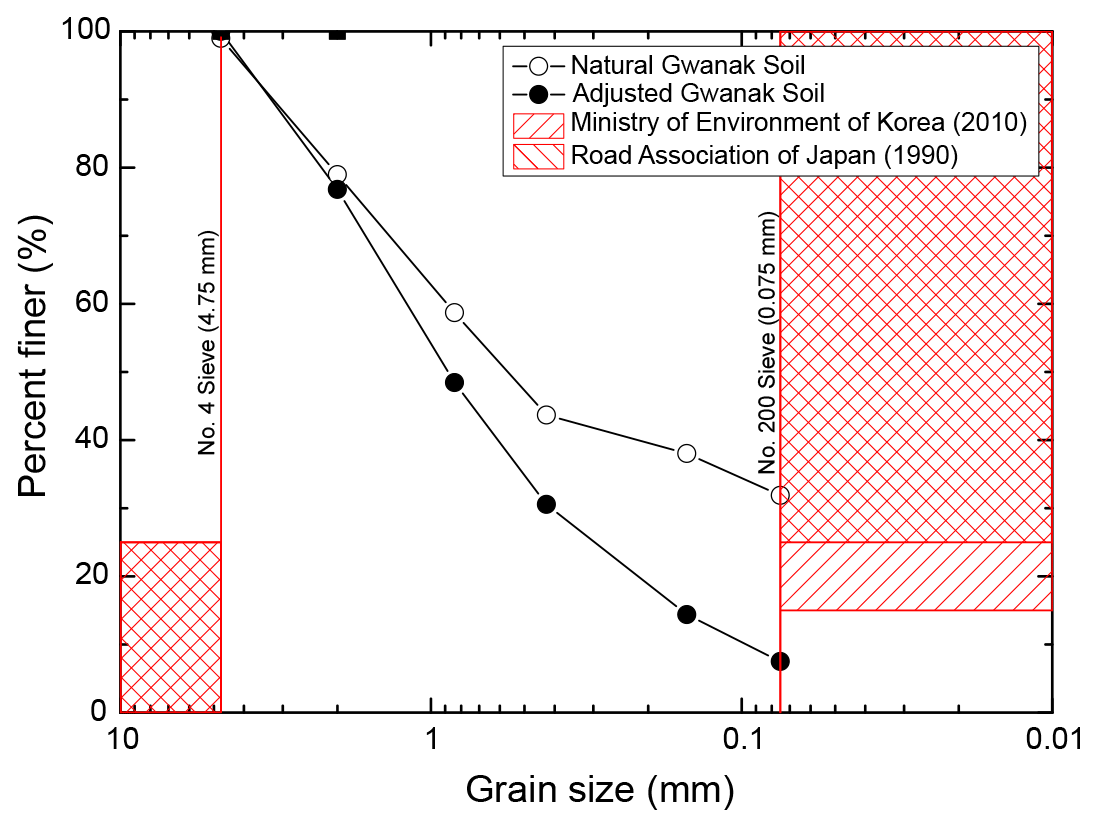
Figure 2Grain distribution of the natural Gwanak soil and the Gwanak soil adjusted as per the requirements for backfill materials in South Korea (Ministry of Environment of Korea, 2010) and Japan (Japan Road Association, 1990).
2.3 Digital image analysis
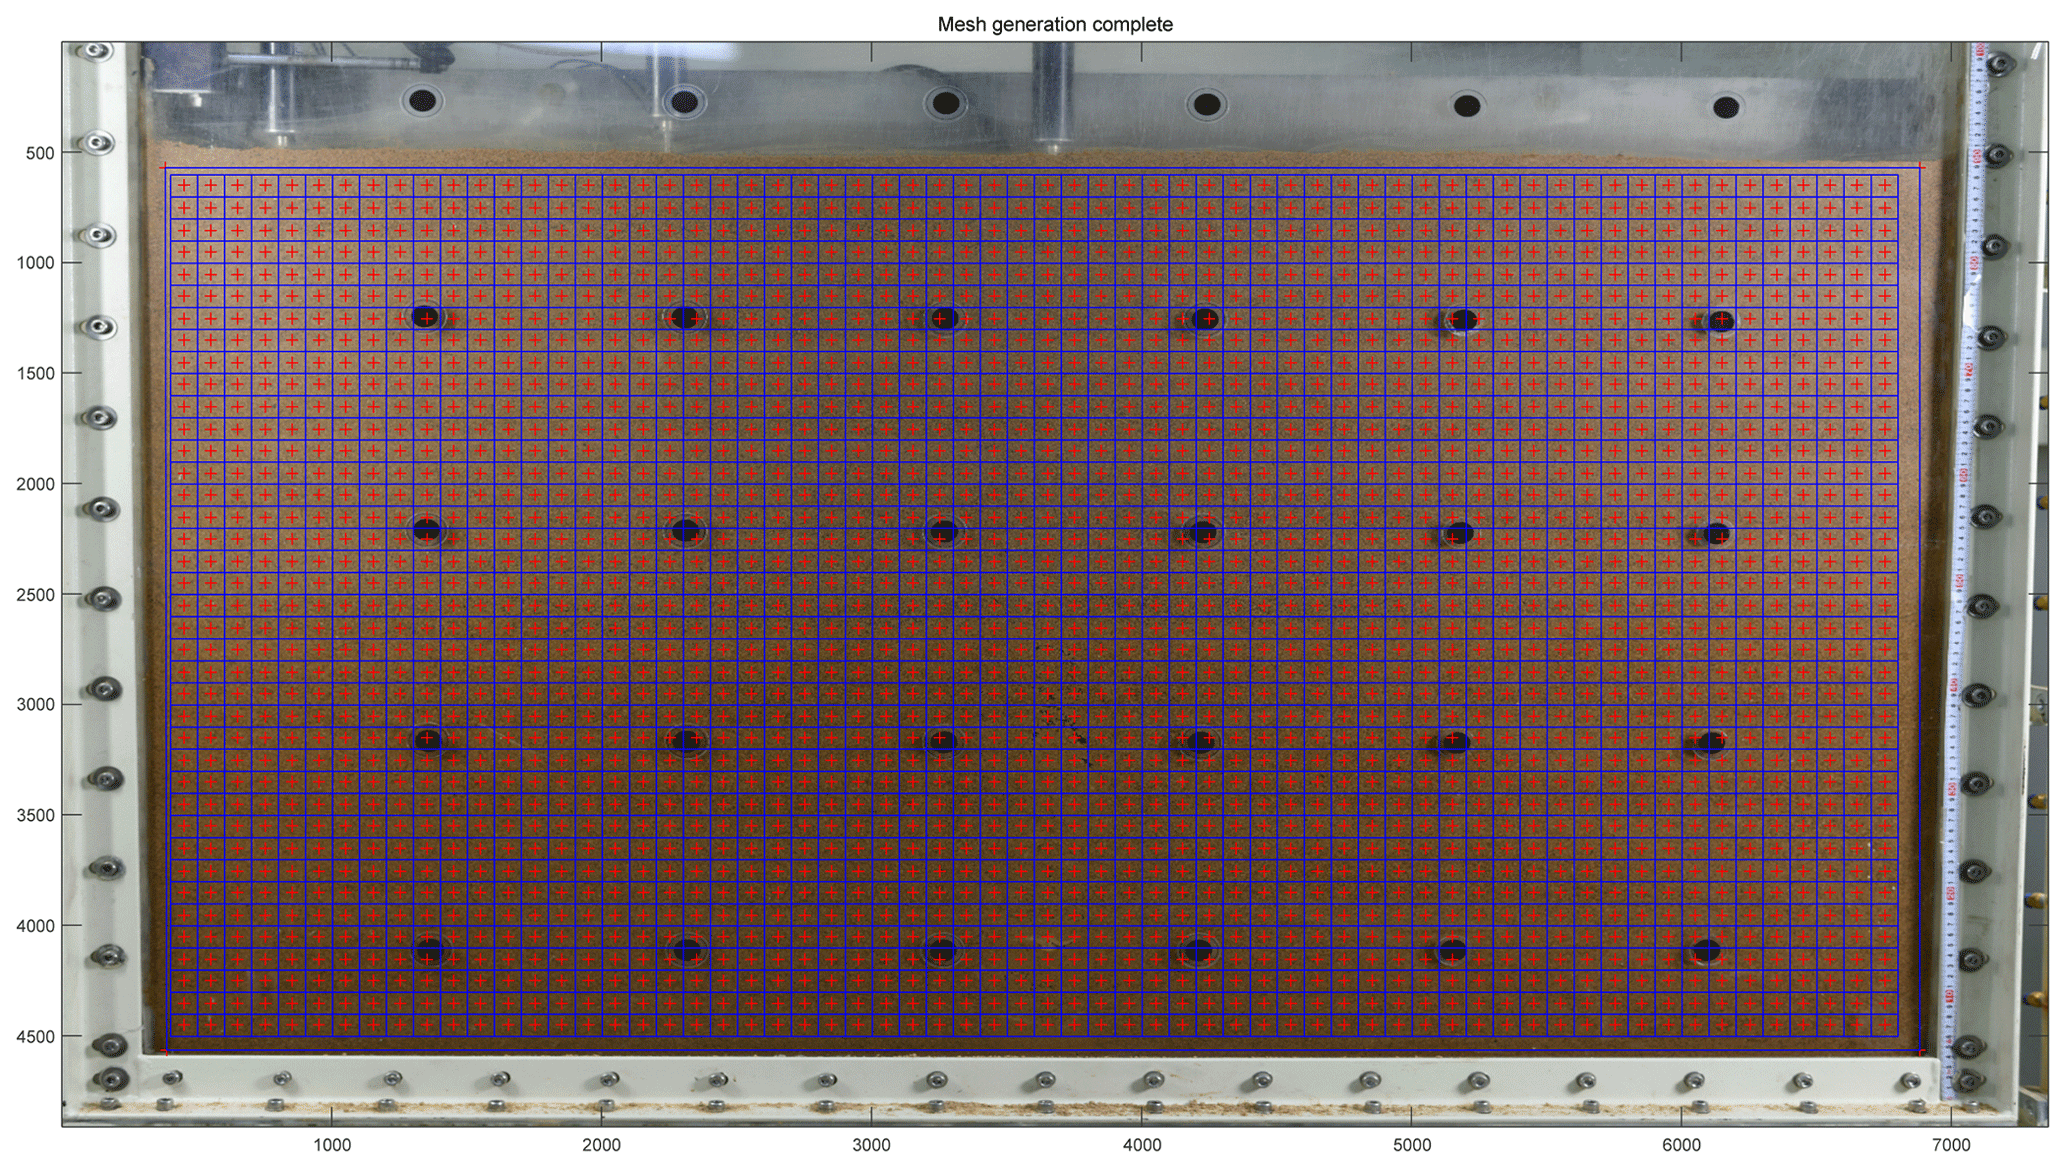
In geotechnical engineering, digital imaging techniques are primarily used to measure the deformation of target samples (Alshibli and Sture, 1999; White et al., 2003; Indiketiya et al., 2017; Kim et al., 2017; Kwak et al., 2019). In the present study, the displacement at each position of the model ground was measured by applying the PIV algorithm (Adrian, 1991), which is the most widely used technique in the field of geotechnical engineering. The PIV cross-correlation on the pixel sets of the predeformation and postdeformation images was calculated to obtain the point with the highest correlation. The position of the sample set with the highest correlation is used to estimate the relative displacement at each position of the sample (Kim et al., 2011; White et al., 2003). In this study, the internal displacement of the sample was evaluated using GeoPIV (White and Take, 2002), a commercial program that is widely used to apply the PIV technique in geotechnical engineering. With the displacement, the volume and shear strain are estimated together for the analysis.
In general, when applying the PIV technique, high-accuracy analysis results can be obtained when the uniqueness of the pixel set increases with the size of the pixel set. However, in order to calculate displacements at various positions, it is necessary to set an appropriate size for the set of pixels. Accuracy and precision verification of the GeoPIV program was performed for various-sized pixel subsets (40×40, 60×60, 80×80, 100×100, and 120×120) by comparing two digital images: the original image of the model ground and the image artificially shifted by 10 pixels at the four edges of the model ground. The optimum size of the pixel set was chosen as 100 pixels by 100 pixels, which shows a 0.0069-pixel maximum error in accuracy and precision. As shown in Fig. 3, the PIV technique was applied to the positions of a total of 2600 pixel subsets (65 by 40). To minimize the boundary effect between the interface of the sample and the soil chamber, the vicinity of the wall was excluded from the analysis. In addition, any excessive relative displacement due to soil erosion (no highly correlated pixel sets found in the postdeformation image) was excluded from the analysis.
2.4 Test procedures
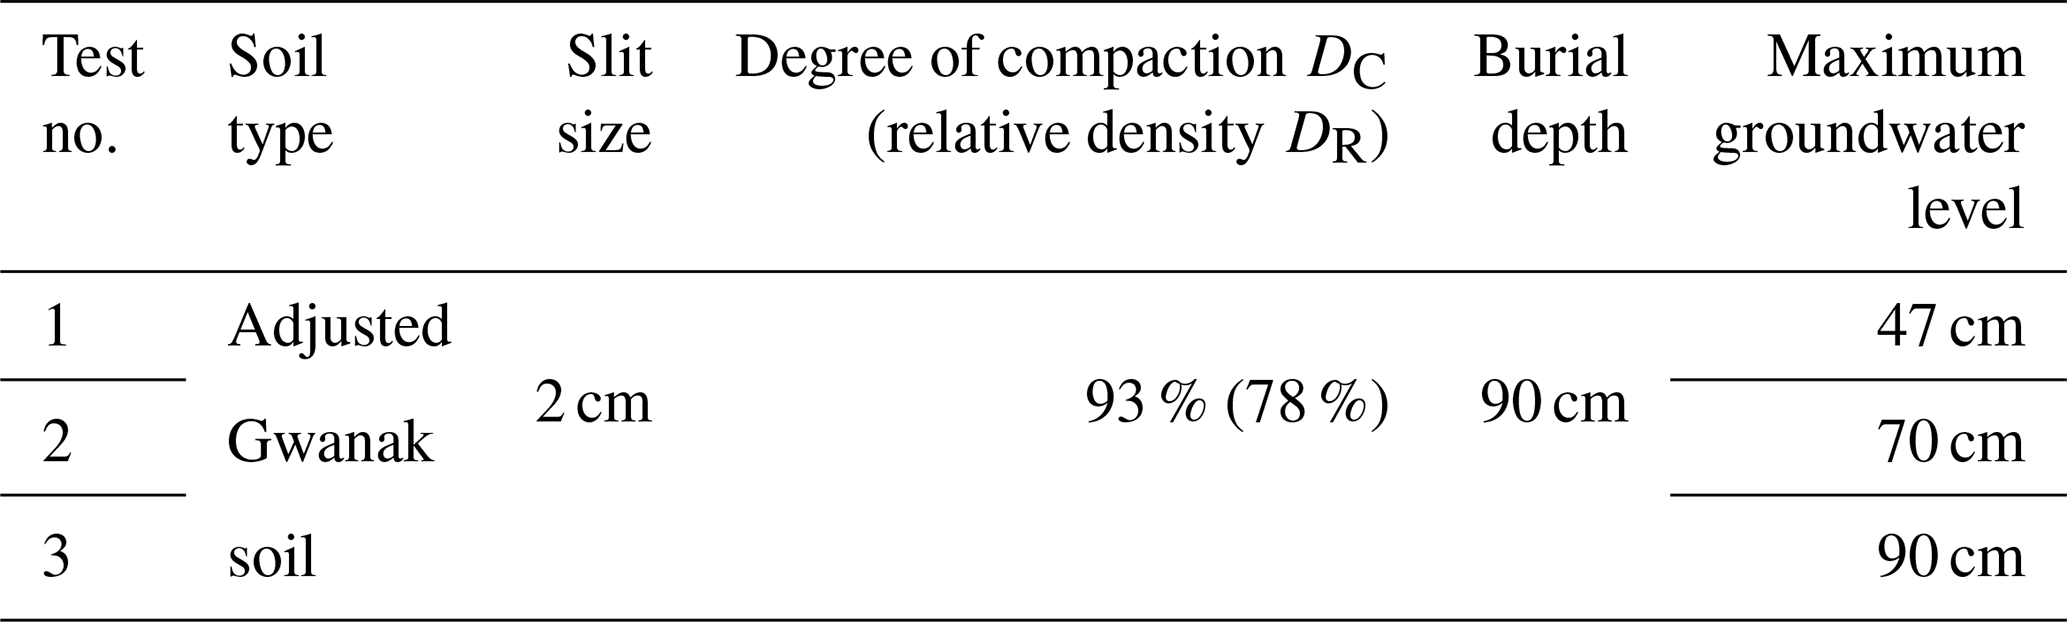
Once the model ground was created, the model tests which consisted of a water supply stage and a water drainage stage were conducted. The water supply stage represents the infiltration of sewer water from the pipes to the ground through damaged sections during heavy-rainfall periods. This phenomenon was simulated in the model test by introducing water from the external water tank into the soil chamber through the supply valve and slit to reach the target groundwater level (i.e., hydraulic head). After heavy rainfall, the hydraulic pressure of a sewer pipe becomes lower (as the sewer pipe becomes vacant); thus, it is most likely that the groundwater will flow back through the damaged section. The water drainage stage simulates the drainage of groundwater into the sewer pipes through the damaged sections after heavy-rainfall periods by closing the supply valve and opening the drainage valve. The soil also discharged through the lower slit along with the water drainage. Table 3 shows the conditions of the three model tests conducted in this study, simulating cases with rainfall intensities of 40 mm/h (representing the rainfall intensity of a heavy-rain watch in South Korea) and 50 mm/h (representing the rainfall intensity of heavy-rain warning in South Korea) presented in Table 1, as well as that with the groundwater level rising to the ground surface.
Linear variable displacement transducers (LVDTs) were installed at three locations on the surface of the ground, at 0, 30, and 60 cm from the center of the soil chamber, to measure the surface displacement during the tests (Fig. 1). During the model tests, digital images of the ground were continuously captured, and the PIV technique was applied to analyze the displacement and deformation (Adrian, 1991; Alshibli and Akbas, 2007; Kim et al., 2017; Kwak et al., 2019). In addition, the amount of soil discharged through the slit was measured after the water supply and water drainage stages of each test.
3.1 Test 1 – heavy-rainfall intensity (47 cm hydraulic head)
3.1.1 Water supply stage
Test 1 was conducted by introducing groundwater to a 47 cm initial hydraulic head (the height difference between the slit and weir in the water tank) to simulate a heavy-rainfall intensity of 40 mm/h. In the water supply stage of Test 1, no soil deformation occurred on the ground surface (measured by the LVDTs) and in the ground (measured by the PIV technique) as the groundwater level approached 47 cm. Immediately after opening the slit, the water pressure acting on the ground directly above the slit was 4.5 kPa and the vertical earth pressure generated by the upper soil was about 16.7 kPa. Therefore, under this condition, the soil always had a positive effective stress, and the piping phenomenon did not occur. In this study, since the model ground was densely constructed (DR=78 %) with a sufficient degree of compaction (RC=93 %) according to domestic specification, no water compaction (Kwak et al., 2019), which occurs mainly when sewage flows into a loose sandy soil, was observed. From these results, it was confirmed in this experimental case that the resistance factor (due to the soil strength parameter) was greater than the sum of the drag force (upward force by infiltration pressure during water supply) and the gravity (downward force).

Figure 4Displacement increment vectors inside the model ground for Test 1 during the water drainage stage: (a) 0–30 s, (b) 30–60 s, (c) 60–90 s, (d) 90–120 s, (e) 120–150 s, and (f) 150–180 s.
3.1.2 Water drainage stage
In the water drainage stage of Test 1, no soil deformation was observed on the ground surface as in the water supply stage. The deformation in the ground was evaluated by applying PIV to the images captured during the test. Figures 4, 5, and 6 are the PIV analysis results showing the estimated displacement vector, volume, and shear strain increments in six phases: (a) 0–30 s, (b) 30–60 s, (c) 60–90 s, (d) 90–120 s, (e) 120–150 s, and (f) 150–180 s. For the volumetric strain, the red grid (the area with positive values) indicates that the area has expanded and the blue grid (the area with negative values) indicates that the area has been compressed.
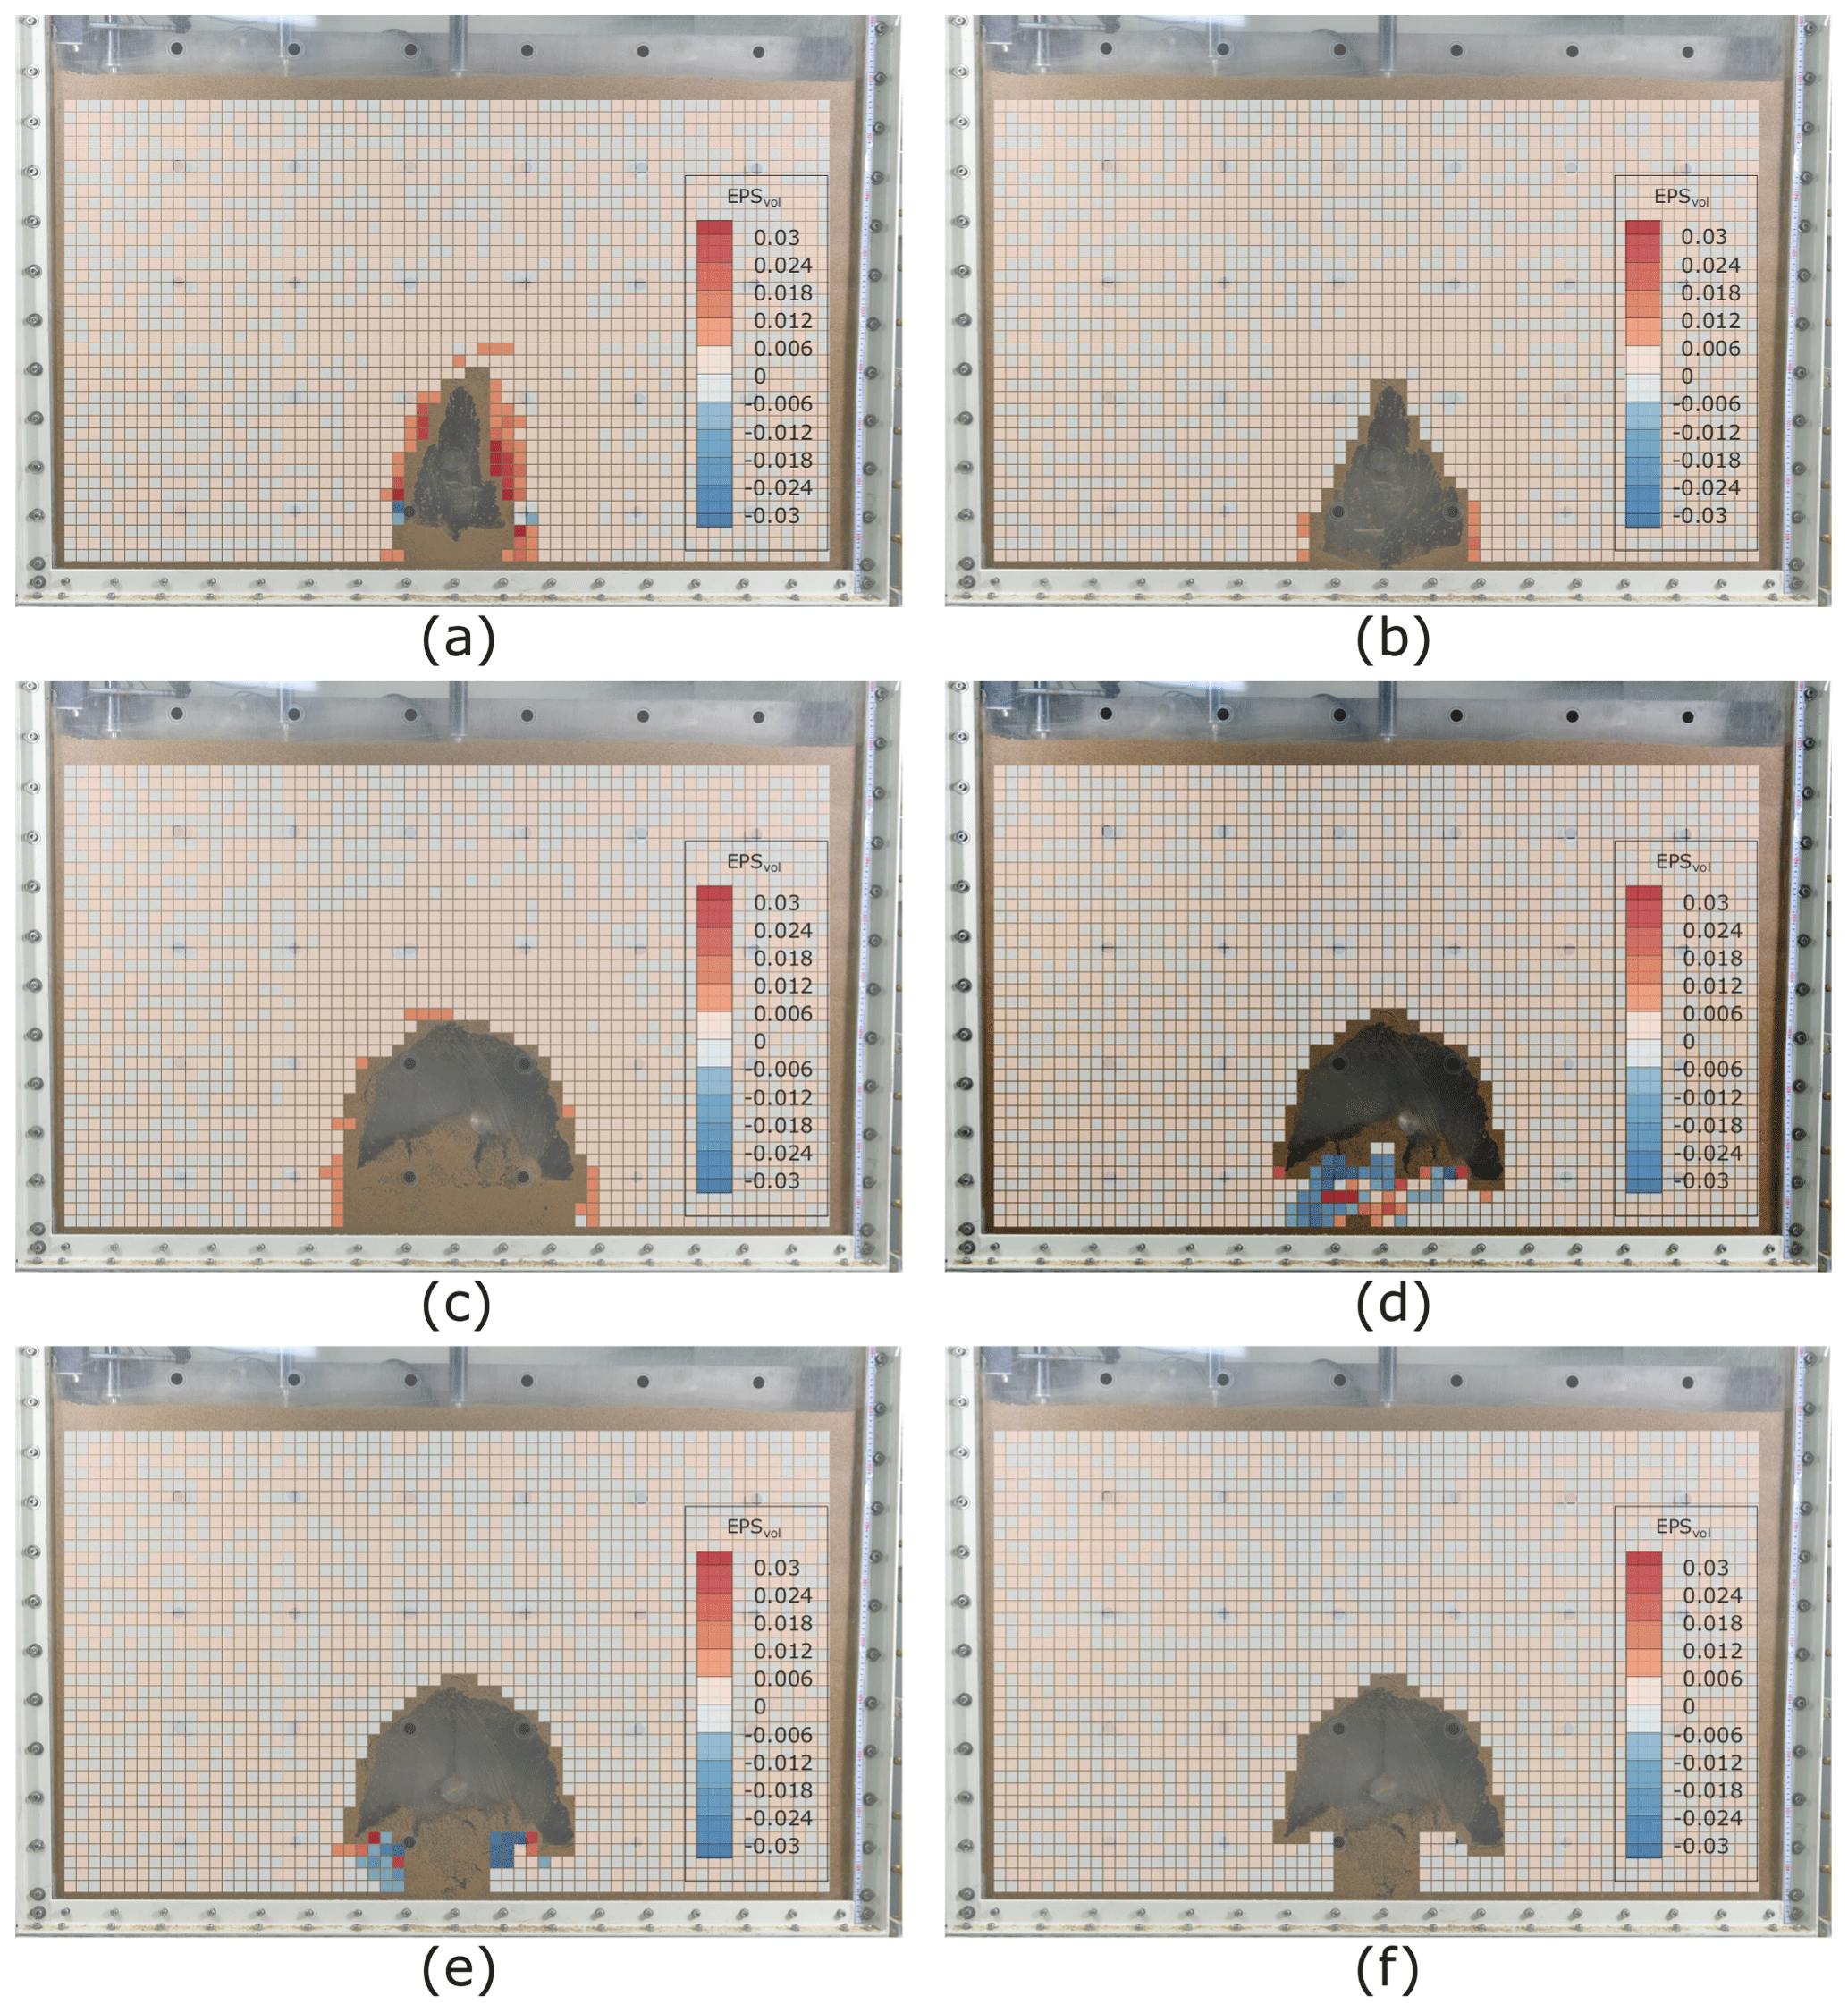
Figure 5Volumetric strain inside the model ground for Test 1 during the water drainage stage: (a) 0–30 s, (b) 30–60 s, (c) 60–90 s, (d) 90–120 s, (e) 120–150 s, and (f) 150–180 s.
In the water drainage stage, the water pressure applied through the slit disappeared, and the groundwater in the soil chamber was discharged quickly through the slit. Unlike in the water supply stage, the ground below the groundwater level became saturated and lost its apparent cohesion. The rapid outflow of groundwater resulted in a downward infiltration into the ground, and the soil was discharged from the area immediately above the slit, where there was no active restraining pressure (and thus, no shear strength), along with the groundwater.
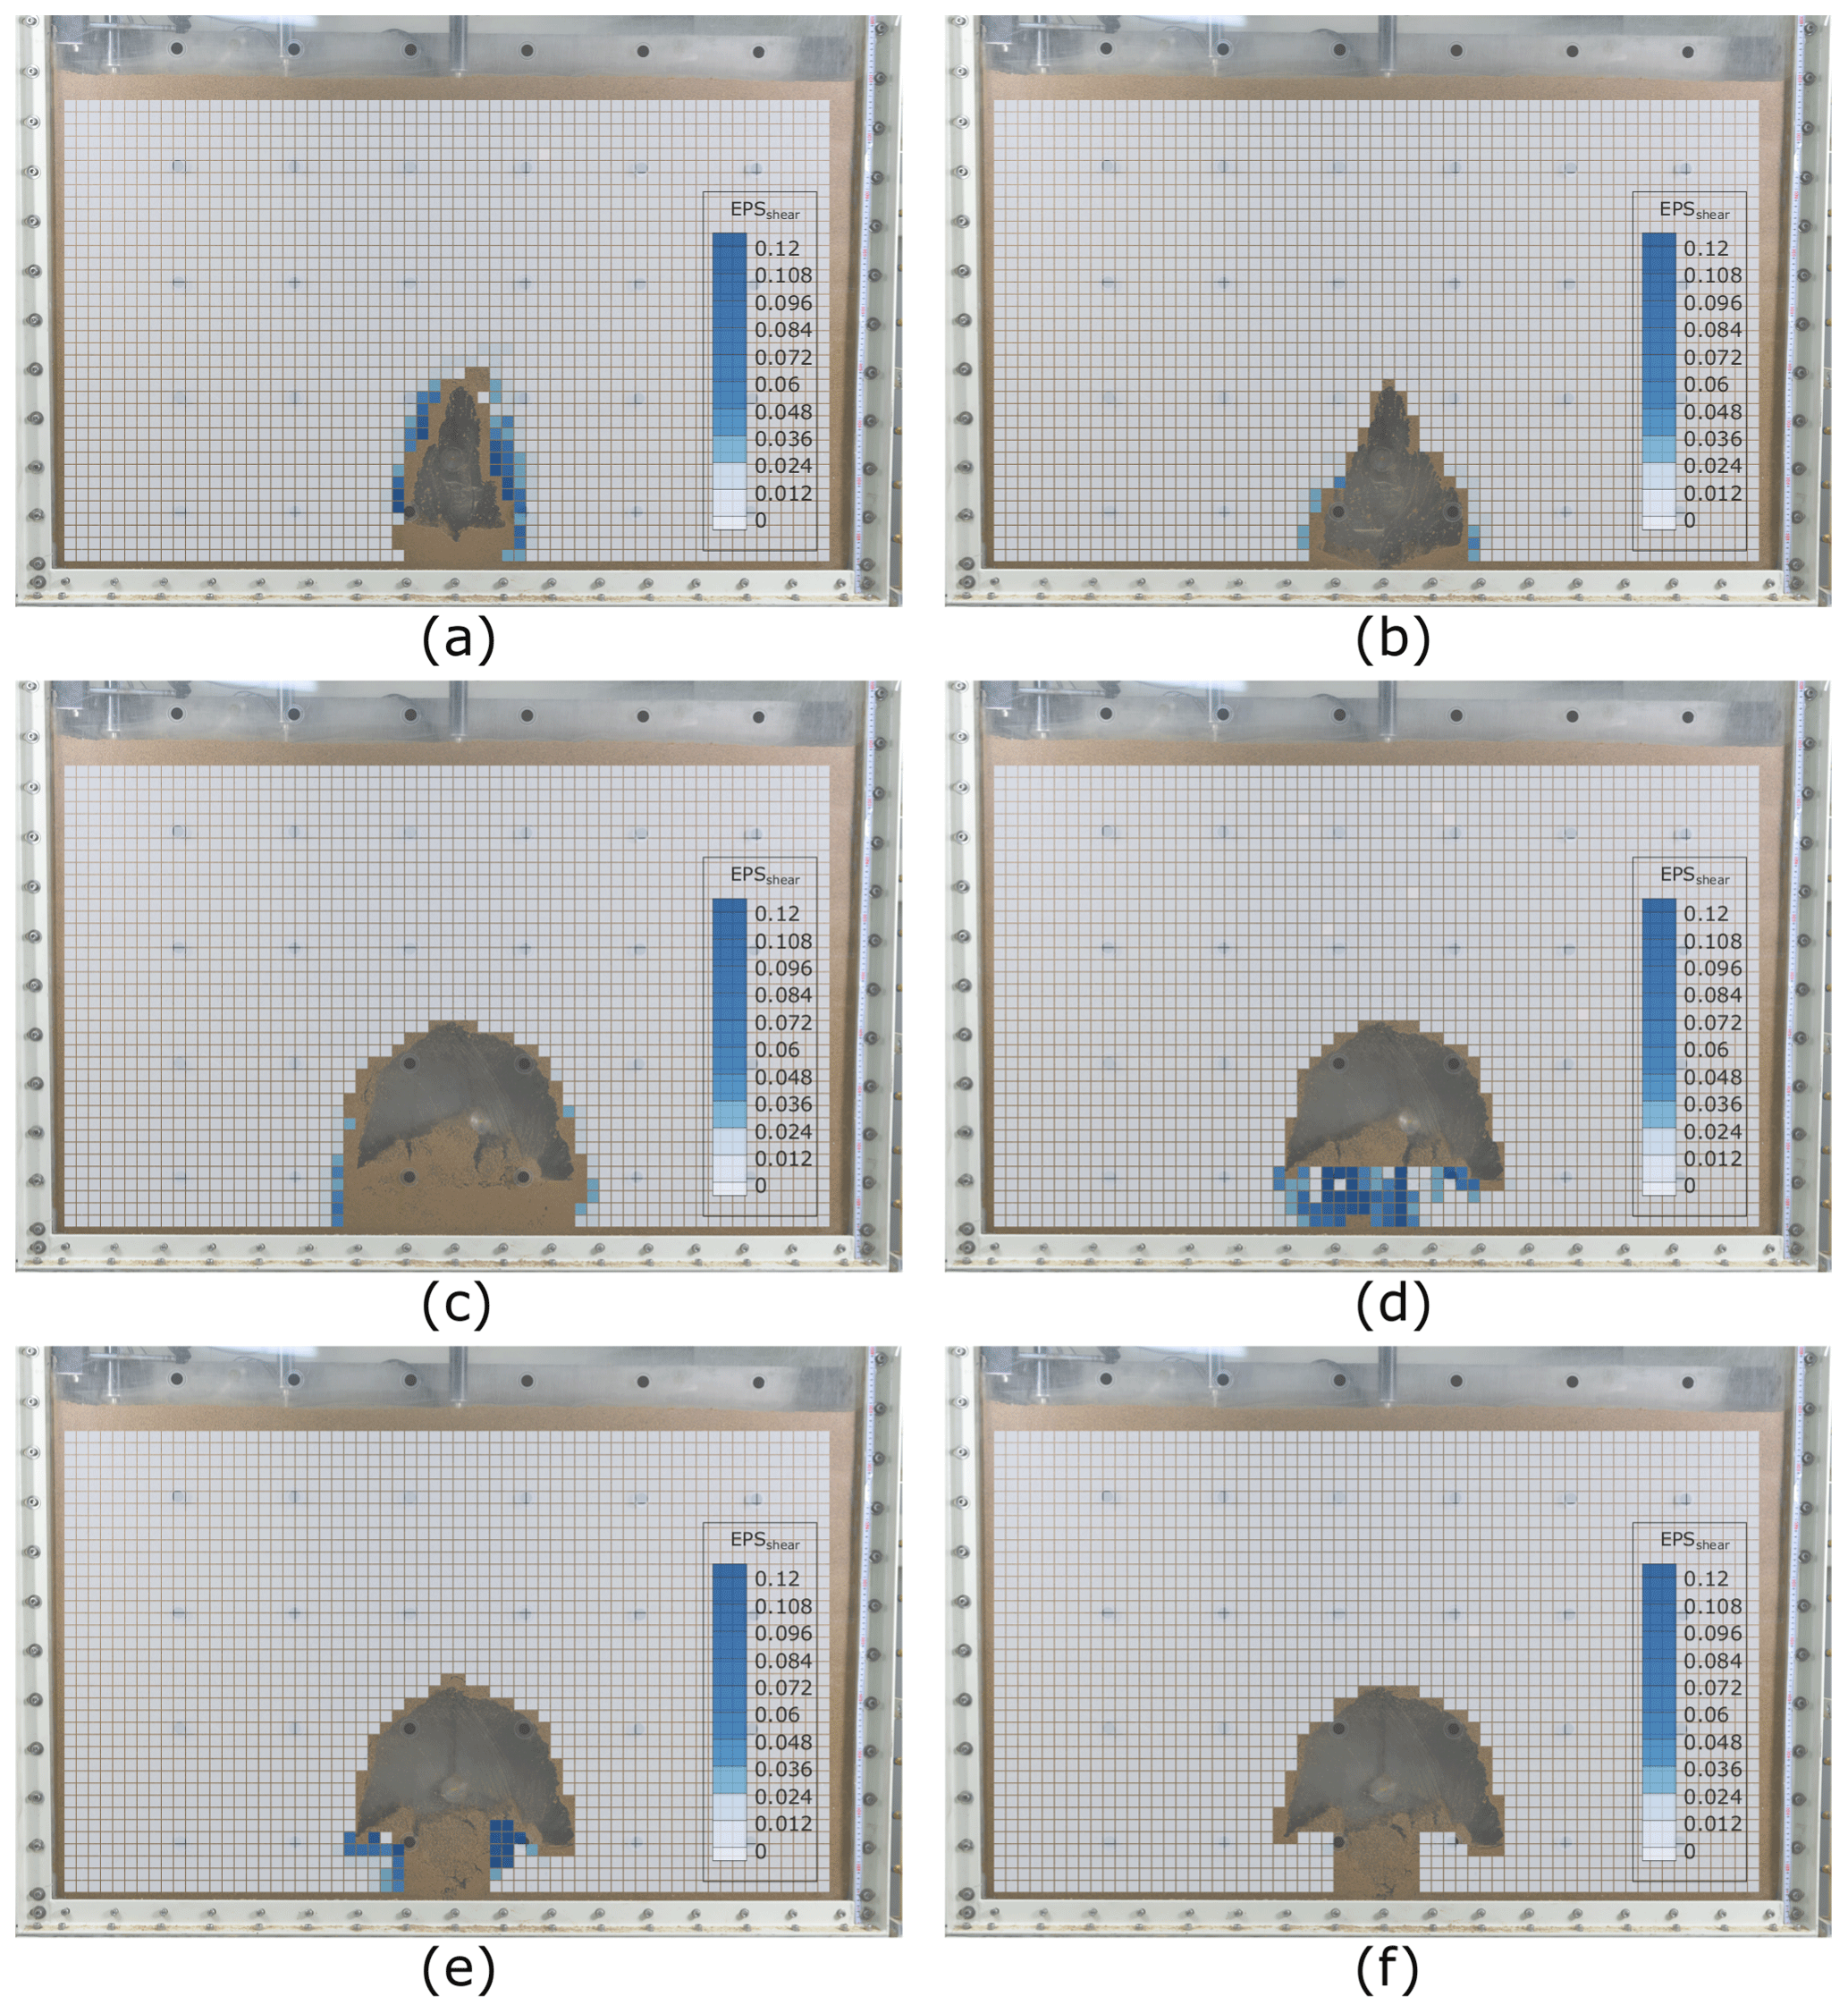
Figure 6Shear strain inside the model ground for Test 1 during the water drainage stage: (a) 0–30 s, (b) 30–60 s, (c) 60–90 s, (d) 90–120 s, (e) 120–150 s, and (f) 150–180 s.
During the initial phase of the water drainage stage (0–60 s), the soil was discharged through the slit, causing a downward displacement in the periphery of the cavity, and a triangular cavity was formed just above the slit (Fig. 4a and b). In addition, volume and shear strain increments occurred intensively around the cavity (Figs. 5a–b, 6a–b). In the 60–90 s interval of the water drainage stage, as shown in Fig. 4c, the soils on both sides of the cavity collapsed, and the cavity expanded laterally. The volume and shear strain increments were concentrated in small areas near the cavity, similarly to the initial stage (Figs. 5c and 6c).
As shown in Fig. 4d, during the 90–120 s interval of the groundwater drainage stage, the lateral expansion of the cavity inside the ground was completed, and no downward displacement was observed in the upper part of the cavity and the soils on the sides. The volume and shear strain increments were also not observed in the outer region of the cavity (Figs. 5d and 6d). In this phase, the cavity collapsed; the soil accumulated near the slit gradually shifted to escape into the slit, and the deformation was concentrated near the slit. After 120 s, the soil regained its apparent adhesion due to surface tension, and its outflow stabilized as the drainage completed. Finally, a mushroom-shaped cavity was formed (Fig. 4e and f).
3.2 Test 2 – very heavy rainfall intensity (70 cm hydraulic head)
3.2.1 Water supply stage
Test 2 was conducted by setting the maximum groundwater level to 70 cm to simulate a high rainfall intensity of 50 mm/h. During the water supply stage of Test 2, no soil deformation was observed on the ground surface and in the ground by both LVDT and PIV analyses. As a result, owing to the soil strength parameter, the resistance factor was found to remain greater than the sum of the drag force (upward force by infiltration pressure during water supply) and the gravity (downward force), despite the application of a higher hydraulic pressure in Test 2 as compared to that in Test 1.
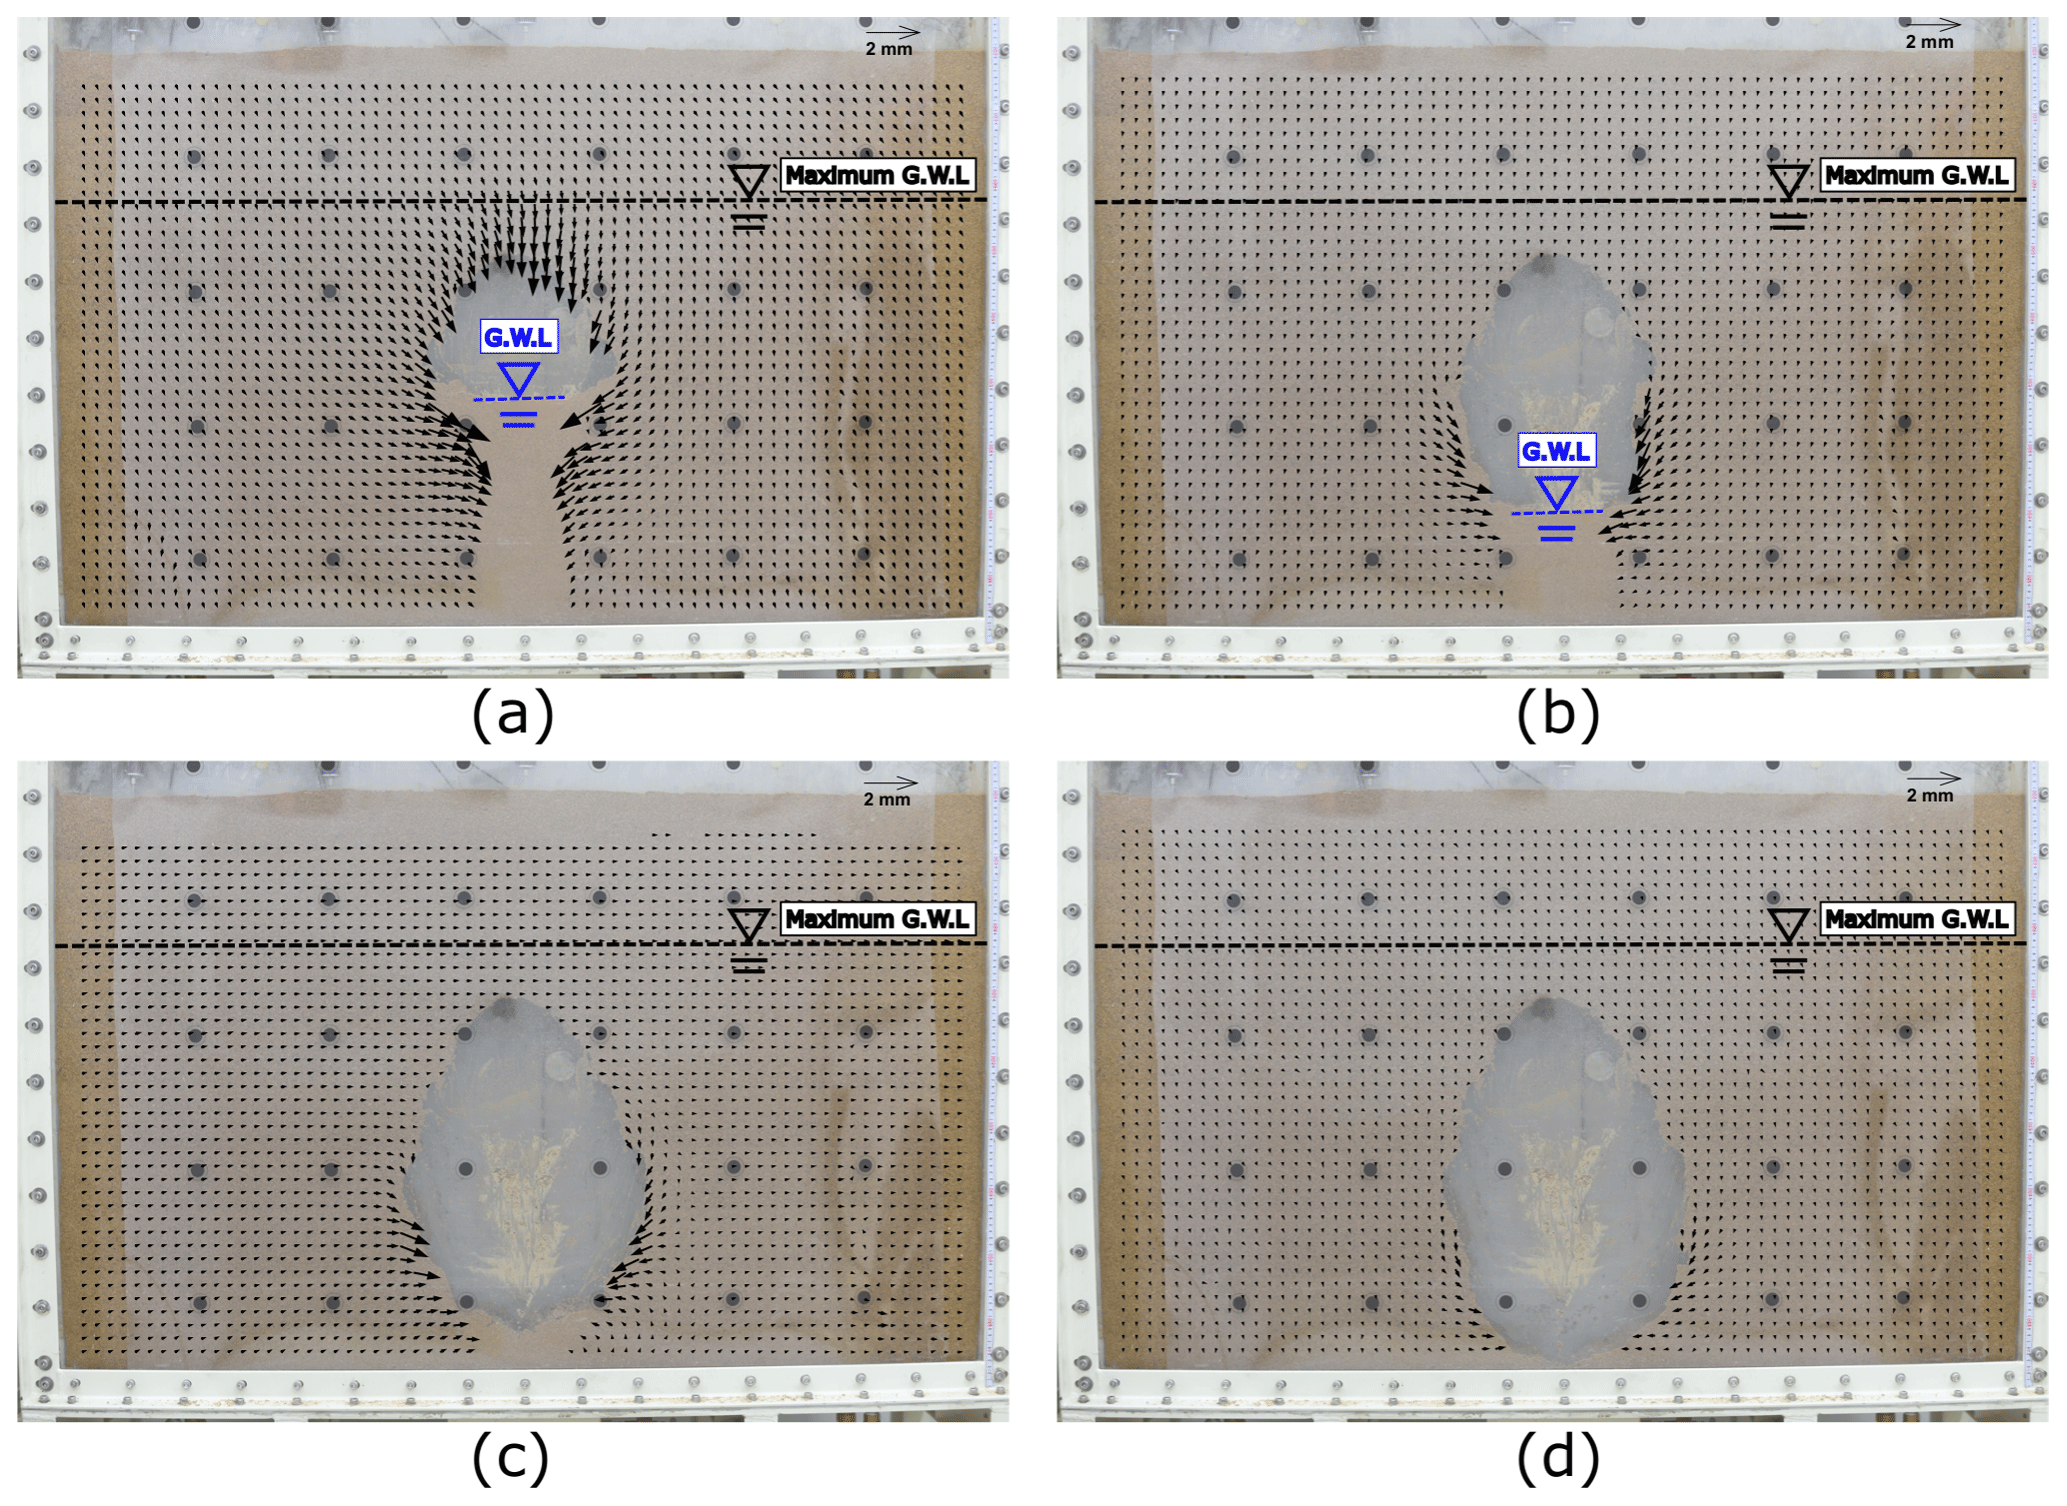
Figure 7Displacement increment vectors inside the model ground for Test 2 during the water drainage stage: (a) 0–30 s, (b) 30–60 s, (c) 60–90 s, and (d) 90–120 s.
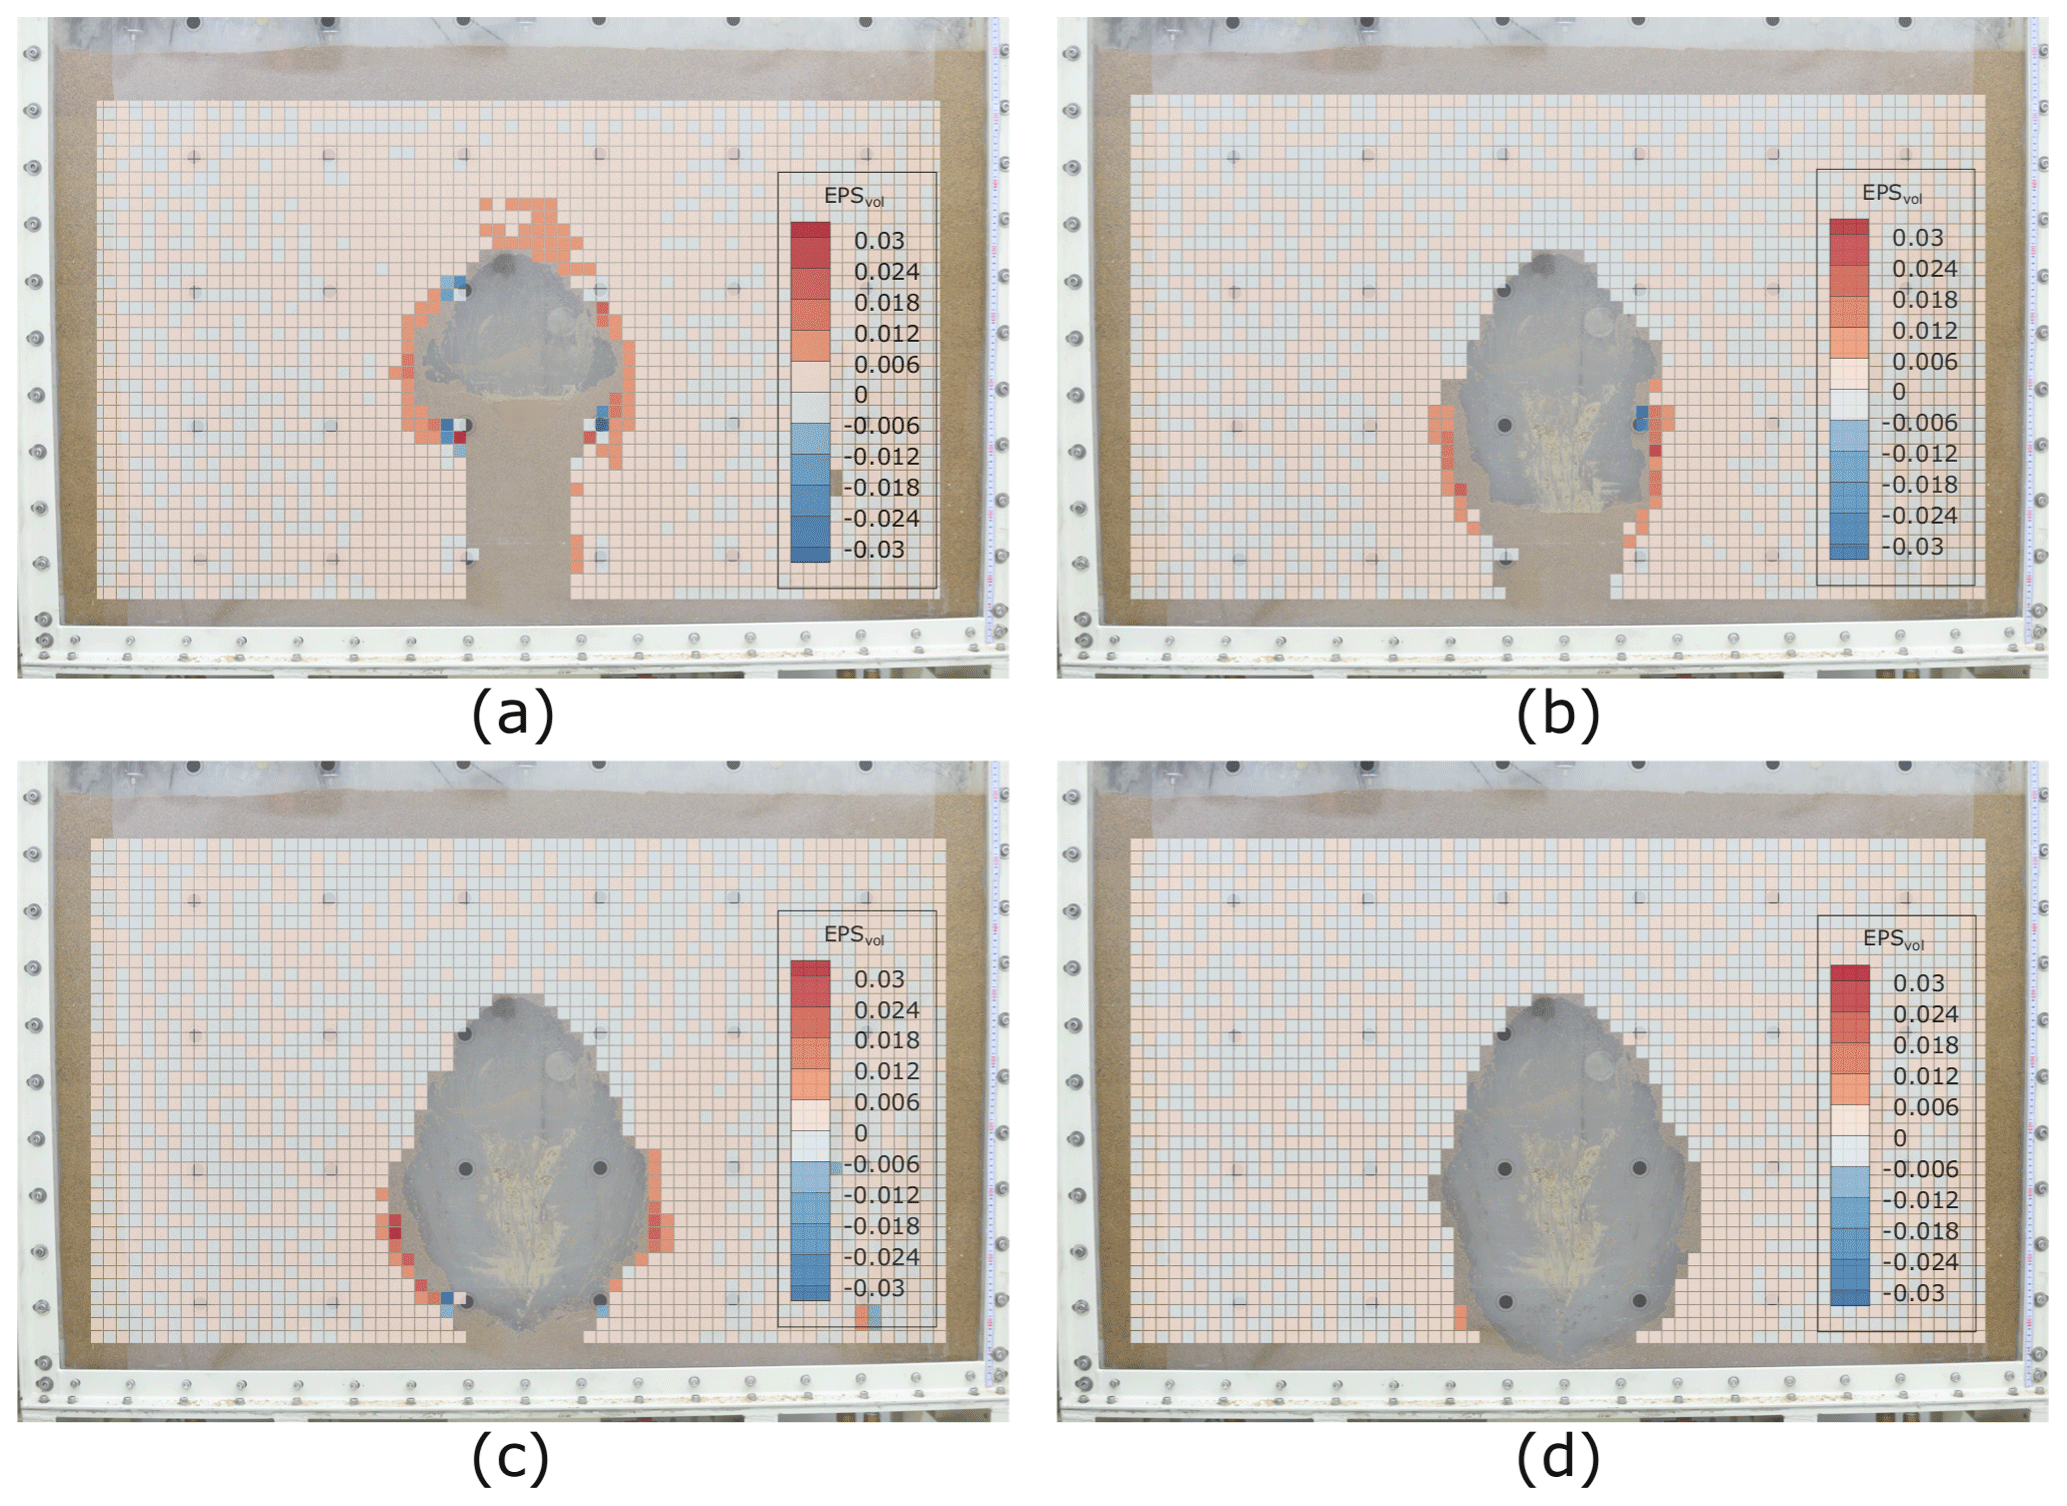
Figure 8Volumetric strain inside the model ground for Test 2 during the water drainage stage: (a) 0–30 s, (b) 30–60 s, (c) 60–90 s, and (d) 90–120 s.
3.2.2 Water drainage stage
During the water drainage stage of Test 2, no vertical displacement was observed on the surface of the model ground. The displacement of the soil element according to the development of the underground cavity was observed by the PIV technique. Figures 7, 8, and 9 show the displacement increment vectors, incremental volumetric strain distribution, and incremental shear strain distribution, respectively; the analysis was conducted in four phases: 0–30 s, (b) 30–60 s, (c) 60–90 s, and (d) 90–120 s (the displacement ended within 120 s).
In the initial phase of the water drainage stage (0–30 s), the soil was discharged through the slit, causing an internal collapse near the slit. Thus, an underground cavity was formed (Fig. 7a), differing from that in Test 1 in terms of shape as well as location; it was located close to the maximum groundwater level (about 60 cm from the bottom plate). These results indicate that the hydraulic pressure (related to rainfall intensity) affects the shape and location of the underground cavity in the water drainage stage. In Test 1, the eroded zone was formed at up to about 89 % of the maximum groundwater level. In Test 2, it developed at up to about 86 %. When a poorly graded noncohesive soil was used under the same experimental conditions, the cavity developed at up to 107 % of the maximum groundwater level (Kwak et al., 2019). This shows that the well-graded cohesive soil used in this study has a greater resistance to soil erosion. In addition, during the initial stage (0–30 s), the incremental volumetric and shear strains were found to be concentrated in the upper area of the underground cavity (Figs. 8a and 9a).

Figure 9Shear strain inside the model ground for Test 2 during the water drainage stage: (a) 0–30 s, (b) 30–60 s, (c) 60–90 s, and (d) 90–120 s.
During the 30–90 s phase, downward displacement was no longer observed at the top of the cavity; displacement in the slit direction occurred only in the left and right areas adjacent to the cavity (Fig. 7b and c). The volumetric and shear strains also showed a tendency to be concentrated in the left and right areas where the displacement occurred, indicating that the cavity gradually increased laterally (Figs. 8b–c, 9b–c). In the process of forming a cavity, the downward infiltration pressure was low, and the soil that had lost strength accumulated near the slit. On the other hand, when the downward infiltration pressure was higher, all the soil that had lost strength escaped, resulting in the formation of an oval cavity. After 90 s, as the groundwater level was exhausted, the unsaturated strength of the ground was restored, and no further displacement or deformation were observed inside the ground (Figs. 7d, 8d, and 9d).
3.3 Test 3 – extremely heavy rainfall intensity (90 cm hydraulic head)
3.3.1 Water supply stage
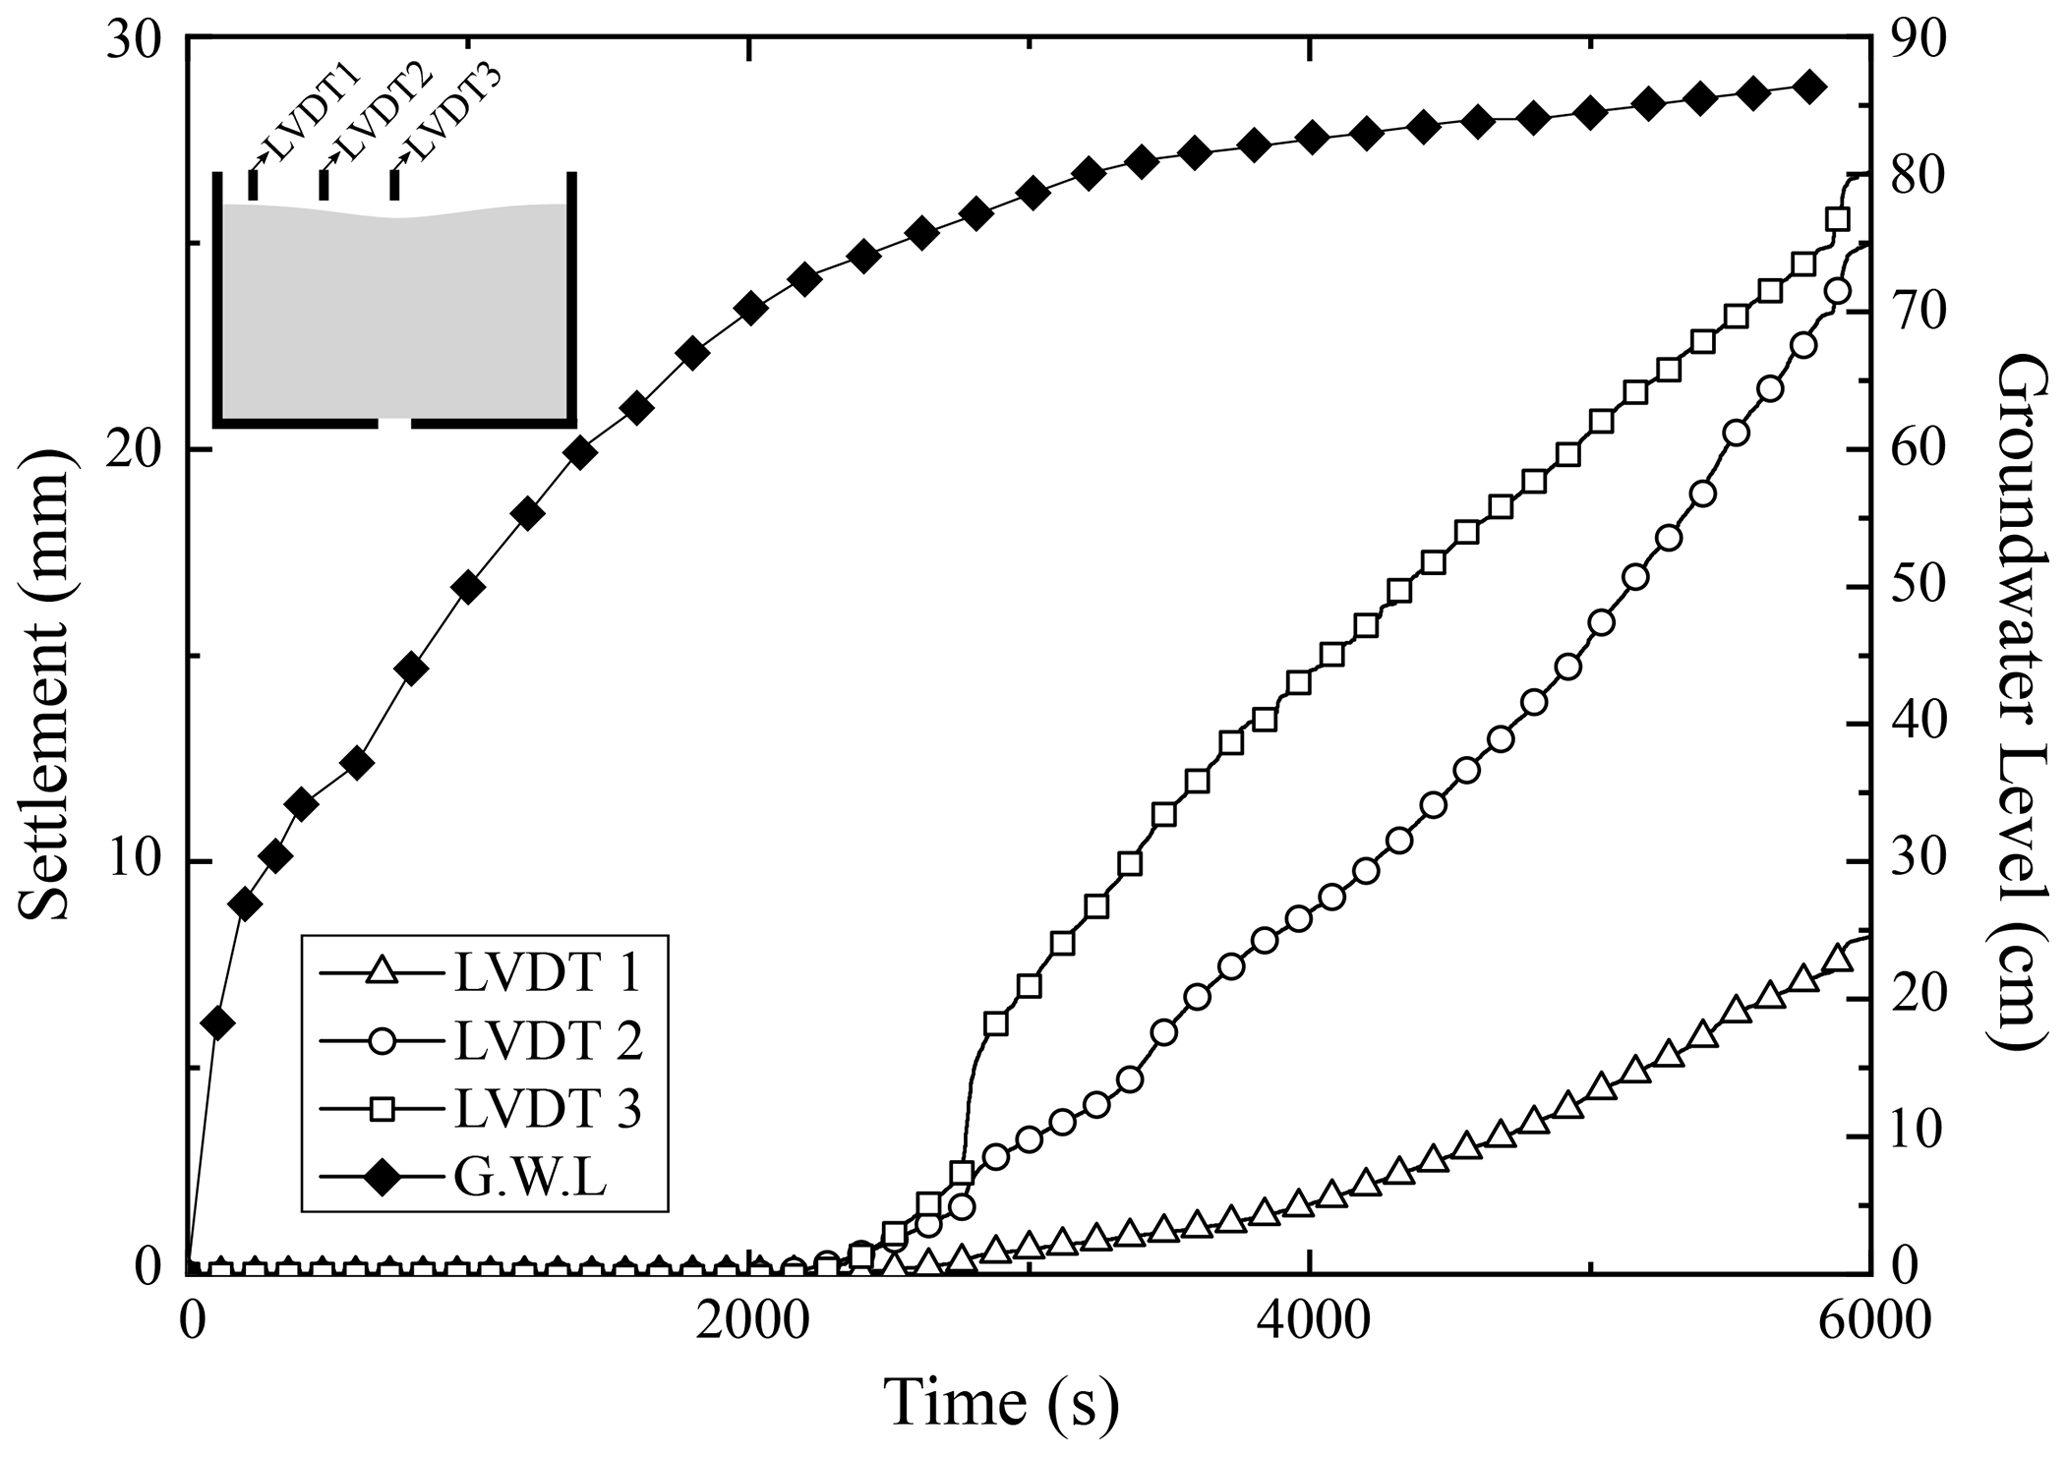
Test 3 was conducted to simulate the intensity of extremely heavy rainfall that causes the groundwater level to rise up to the surface of the ground. In the water supply stage of Test 3, significant displacements were measured on the surface (LVDTs) and inside the model ground (PIV). Figure 10 shows the surface displacement over time, with a gradual subsidence after approximately 2400 s. The ground displacements identified by the PIV technique from 0 to 2000 s also showed no specific behaviors. Therefore, the internal displacement vectors identified as a result of the PIV technique after 2000 s are shown in Fig. 11, overlaid onto the final photograph of each step: (a) 2000–2400 s, (b) 2400–2800 s, (c) 2800–3200 s, and (d) 3200–3600 s.
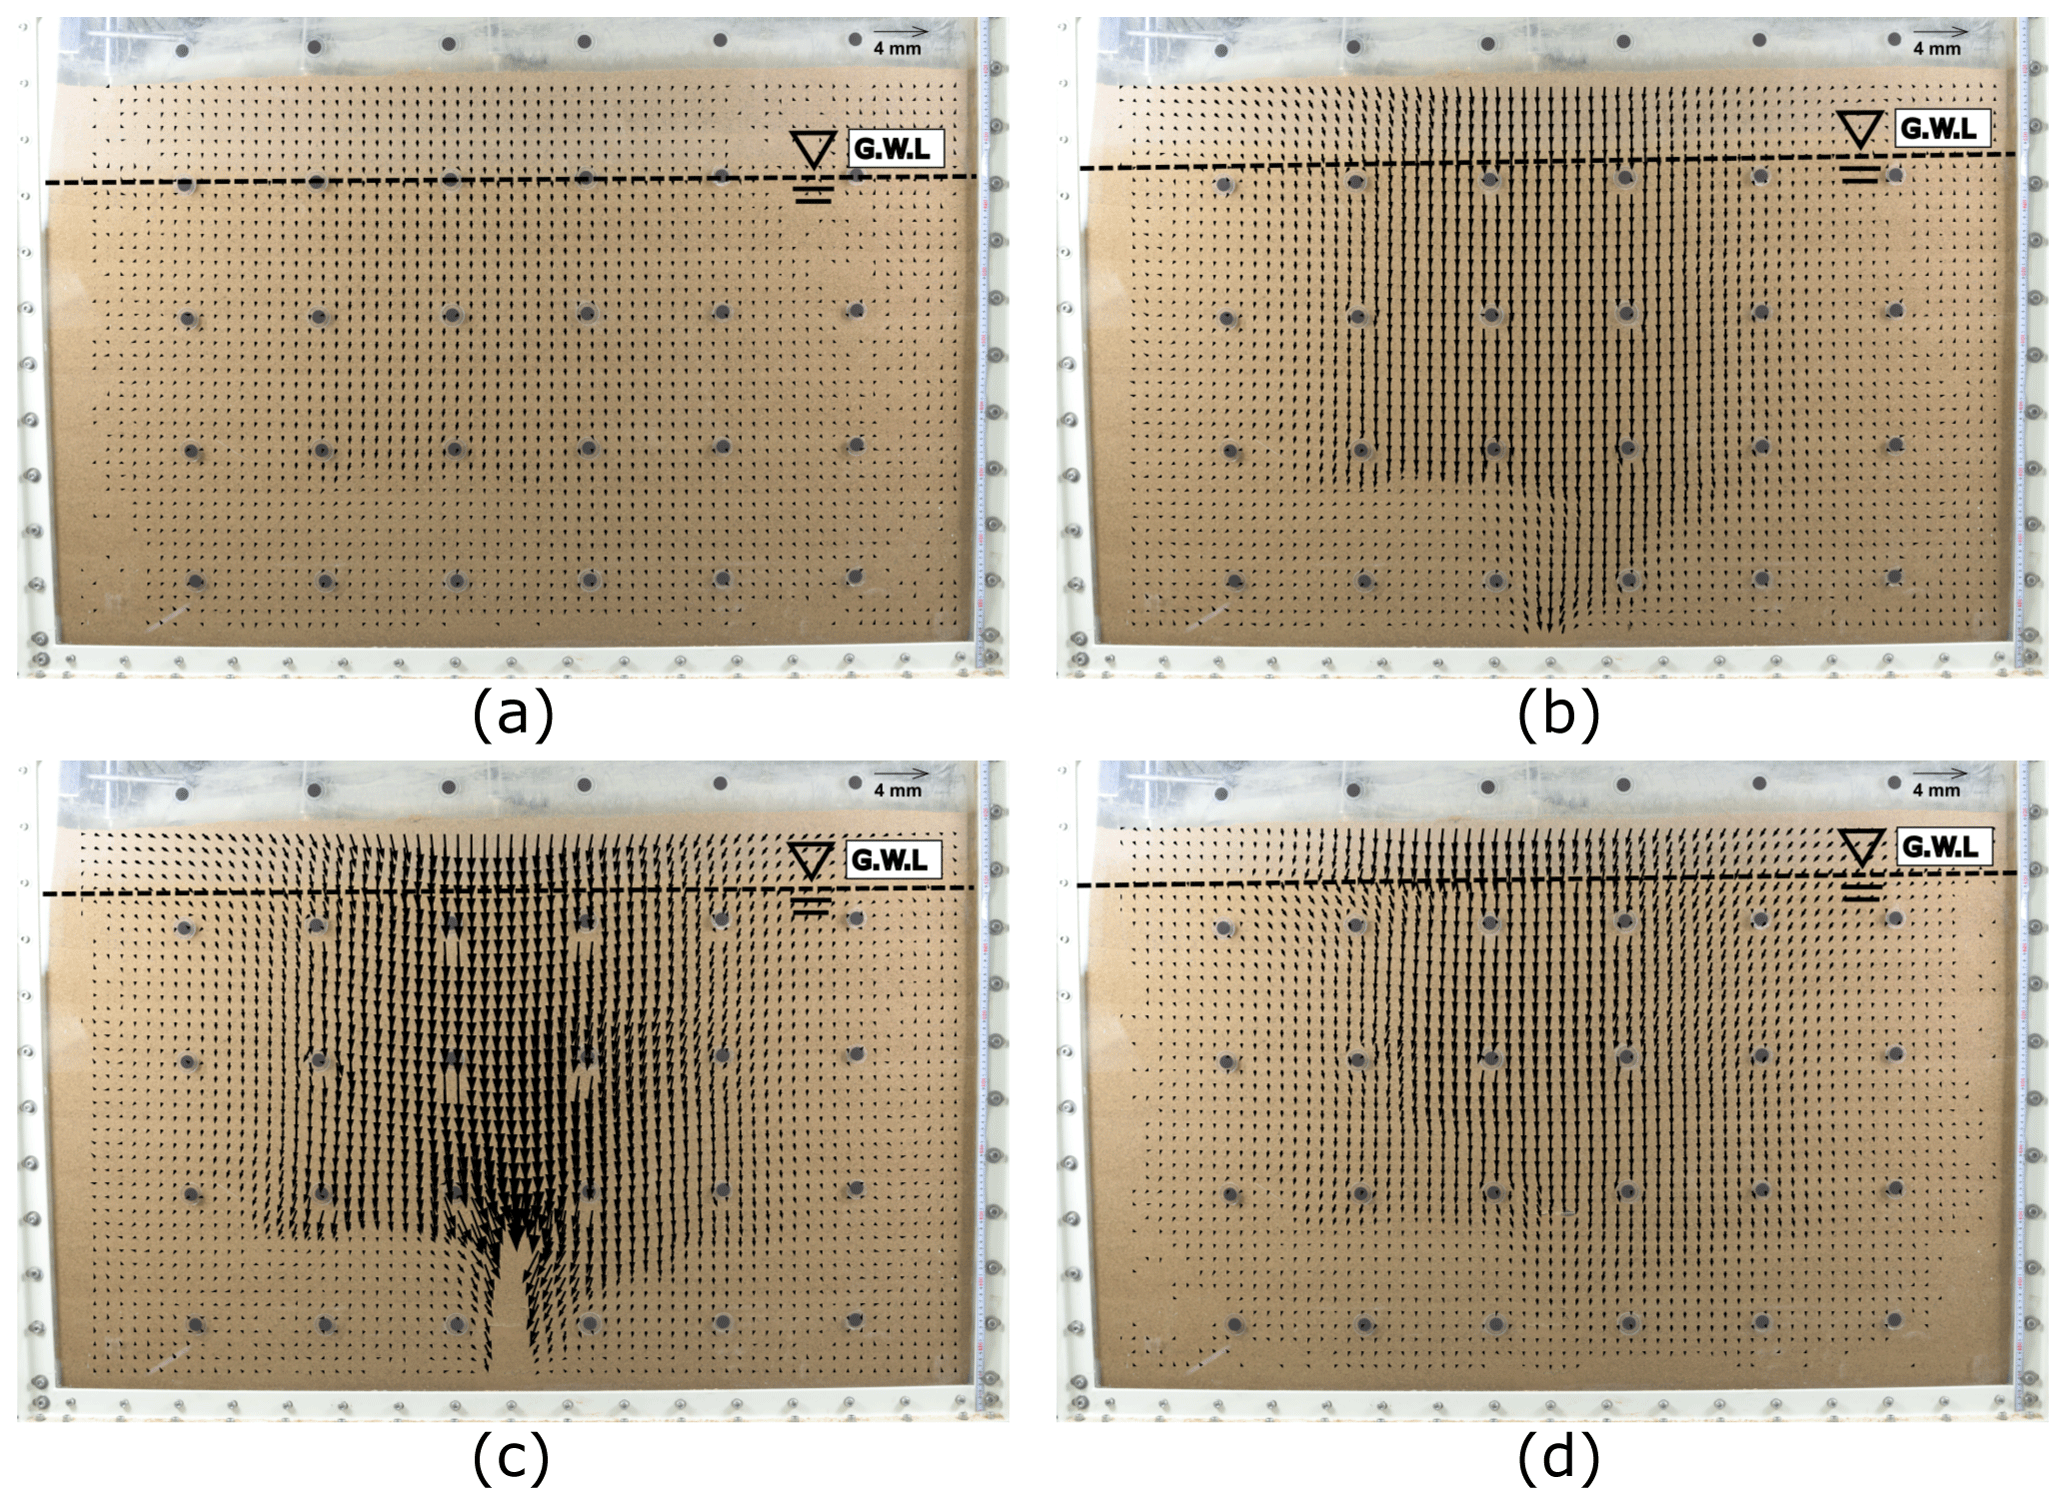
Figure 11Displacement increment vectors inside the model ground for Test 3 during the water supply stage: (a) 2000–2400 s, (b) 2400–2800 s, (c) 2800–3200 s, and (d) 3200–3600 s.
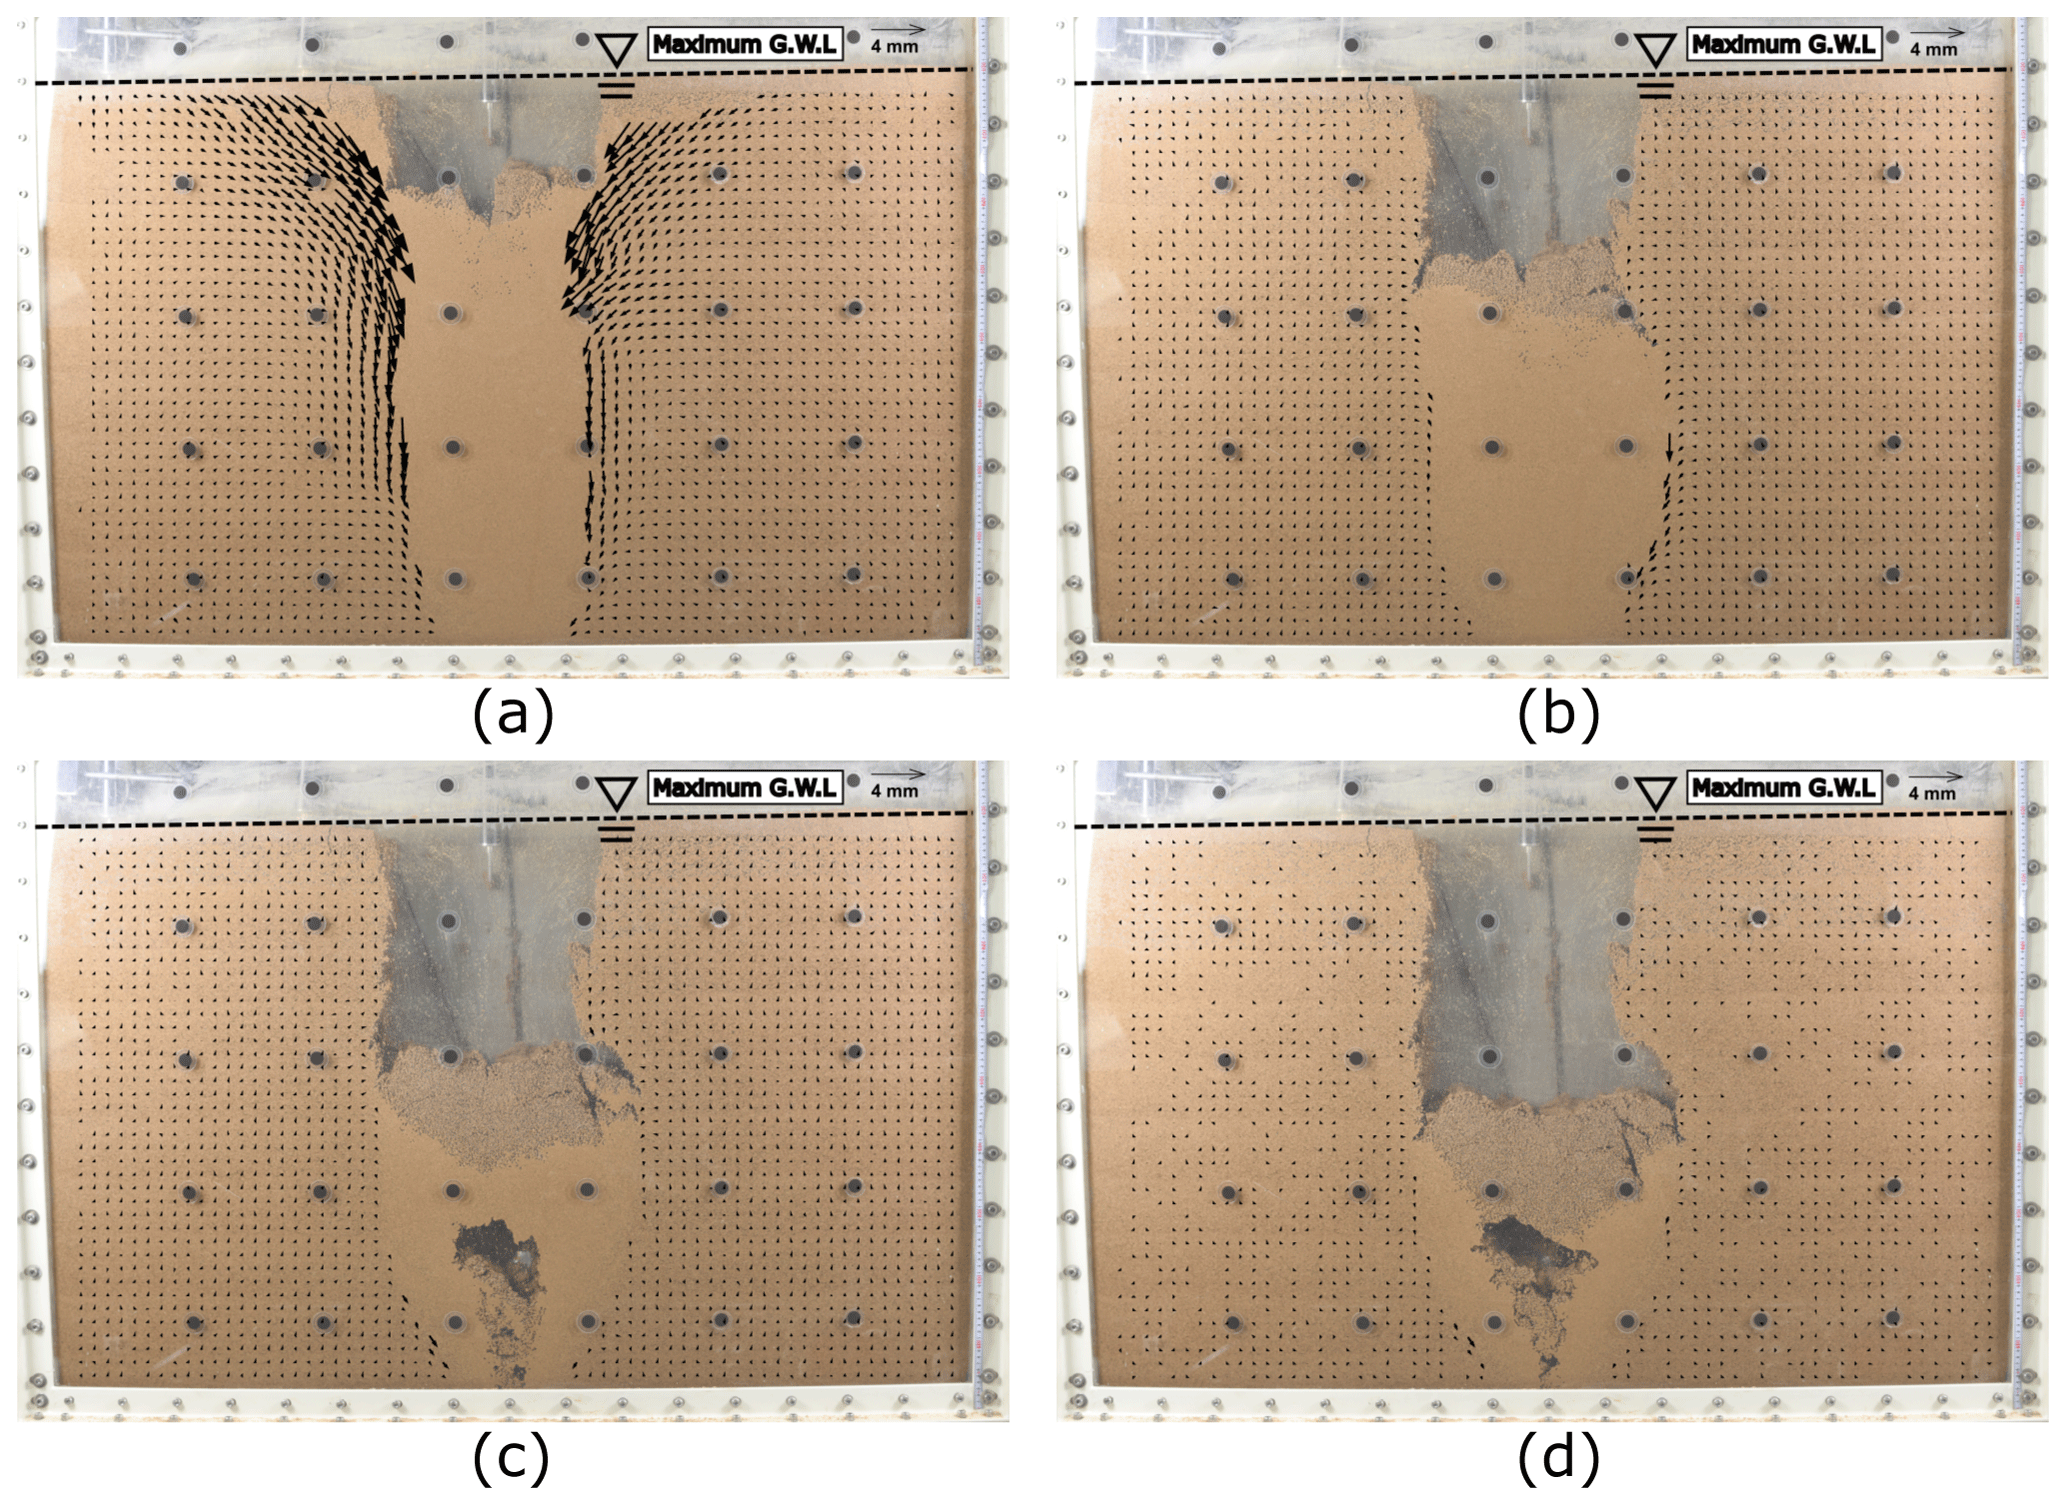
Figure 12Displacement increment vectors inside the model ground for Test 3 during the water drainage stage: (a) 0–30 s, (b) 30–60 s, (c) 60–90 s, and (d) 90–120 s.
As the groundwater level reached about 75 cm (83 % of ground height), soil particle displacement was observed in the soil from 2000 to 2400 s. This result indicates that, owing to the strength of the soil, the resistance factor becomes smaller as the model ground is saturated, and the weight of the soil in the saturated region cannot be supported. Since the soil in the upper part of the groundwater level still maintained its unsaturated strength, the downward displacement appeared only in the area adjacent to the groundwater level. There was still no subsidence observed on the surface (Fig. 11a).
From 2400 to 2800 s, downward displacement towards the slit was observed throughout the soil area. In particular, a larger downward displacement was observed in the inverted triangle region above the slit, which was significantly affected by the inflow of groundwater (Fig. 11b). As the groundwater level rose, the matric suction expressed in the unsaturated region of the ground decreased. Therefore, the subsidence on the ground surface was also measured from this phase. From 2800 to 3200 s, the groundwater level reached 80 cm from the bottom (89 % of ground height), and the maximum downward displacement of the entire water supply stage was observed during this phase (Fig. 11c). This indicates that infiltration occurs when the groundwater level approaches the ground surface, and the soil structure is no longer supported as there is no longer sufficient matric suction in the ground directly above the groundwater level. After 3200 s, downward displacement occurred continuously throughout the soil area until the groundwater level reached the target level (Fig. 11d).
3.3.2 Water drainage stage
The water drainage stage of Test 3 was divided into four phases for the analysis: (a) 0–30 s, (b) 30–60 s, (c) 60–90 s, and (d) 90–120 s. The displacement increment vectors, incremental volumetric strain distributions, and incremental shear strain distributions of each stage are shown in Figs. 12, 13, and 14, respectively, overlaid onto the photograph of the target ground taken at the end of each phase.
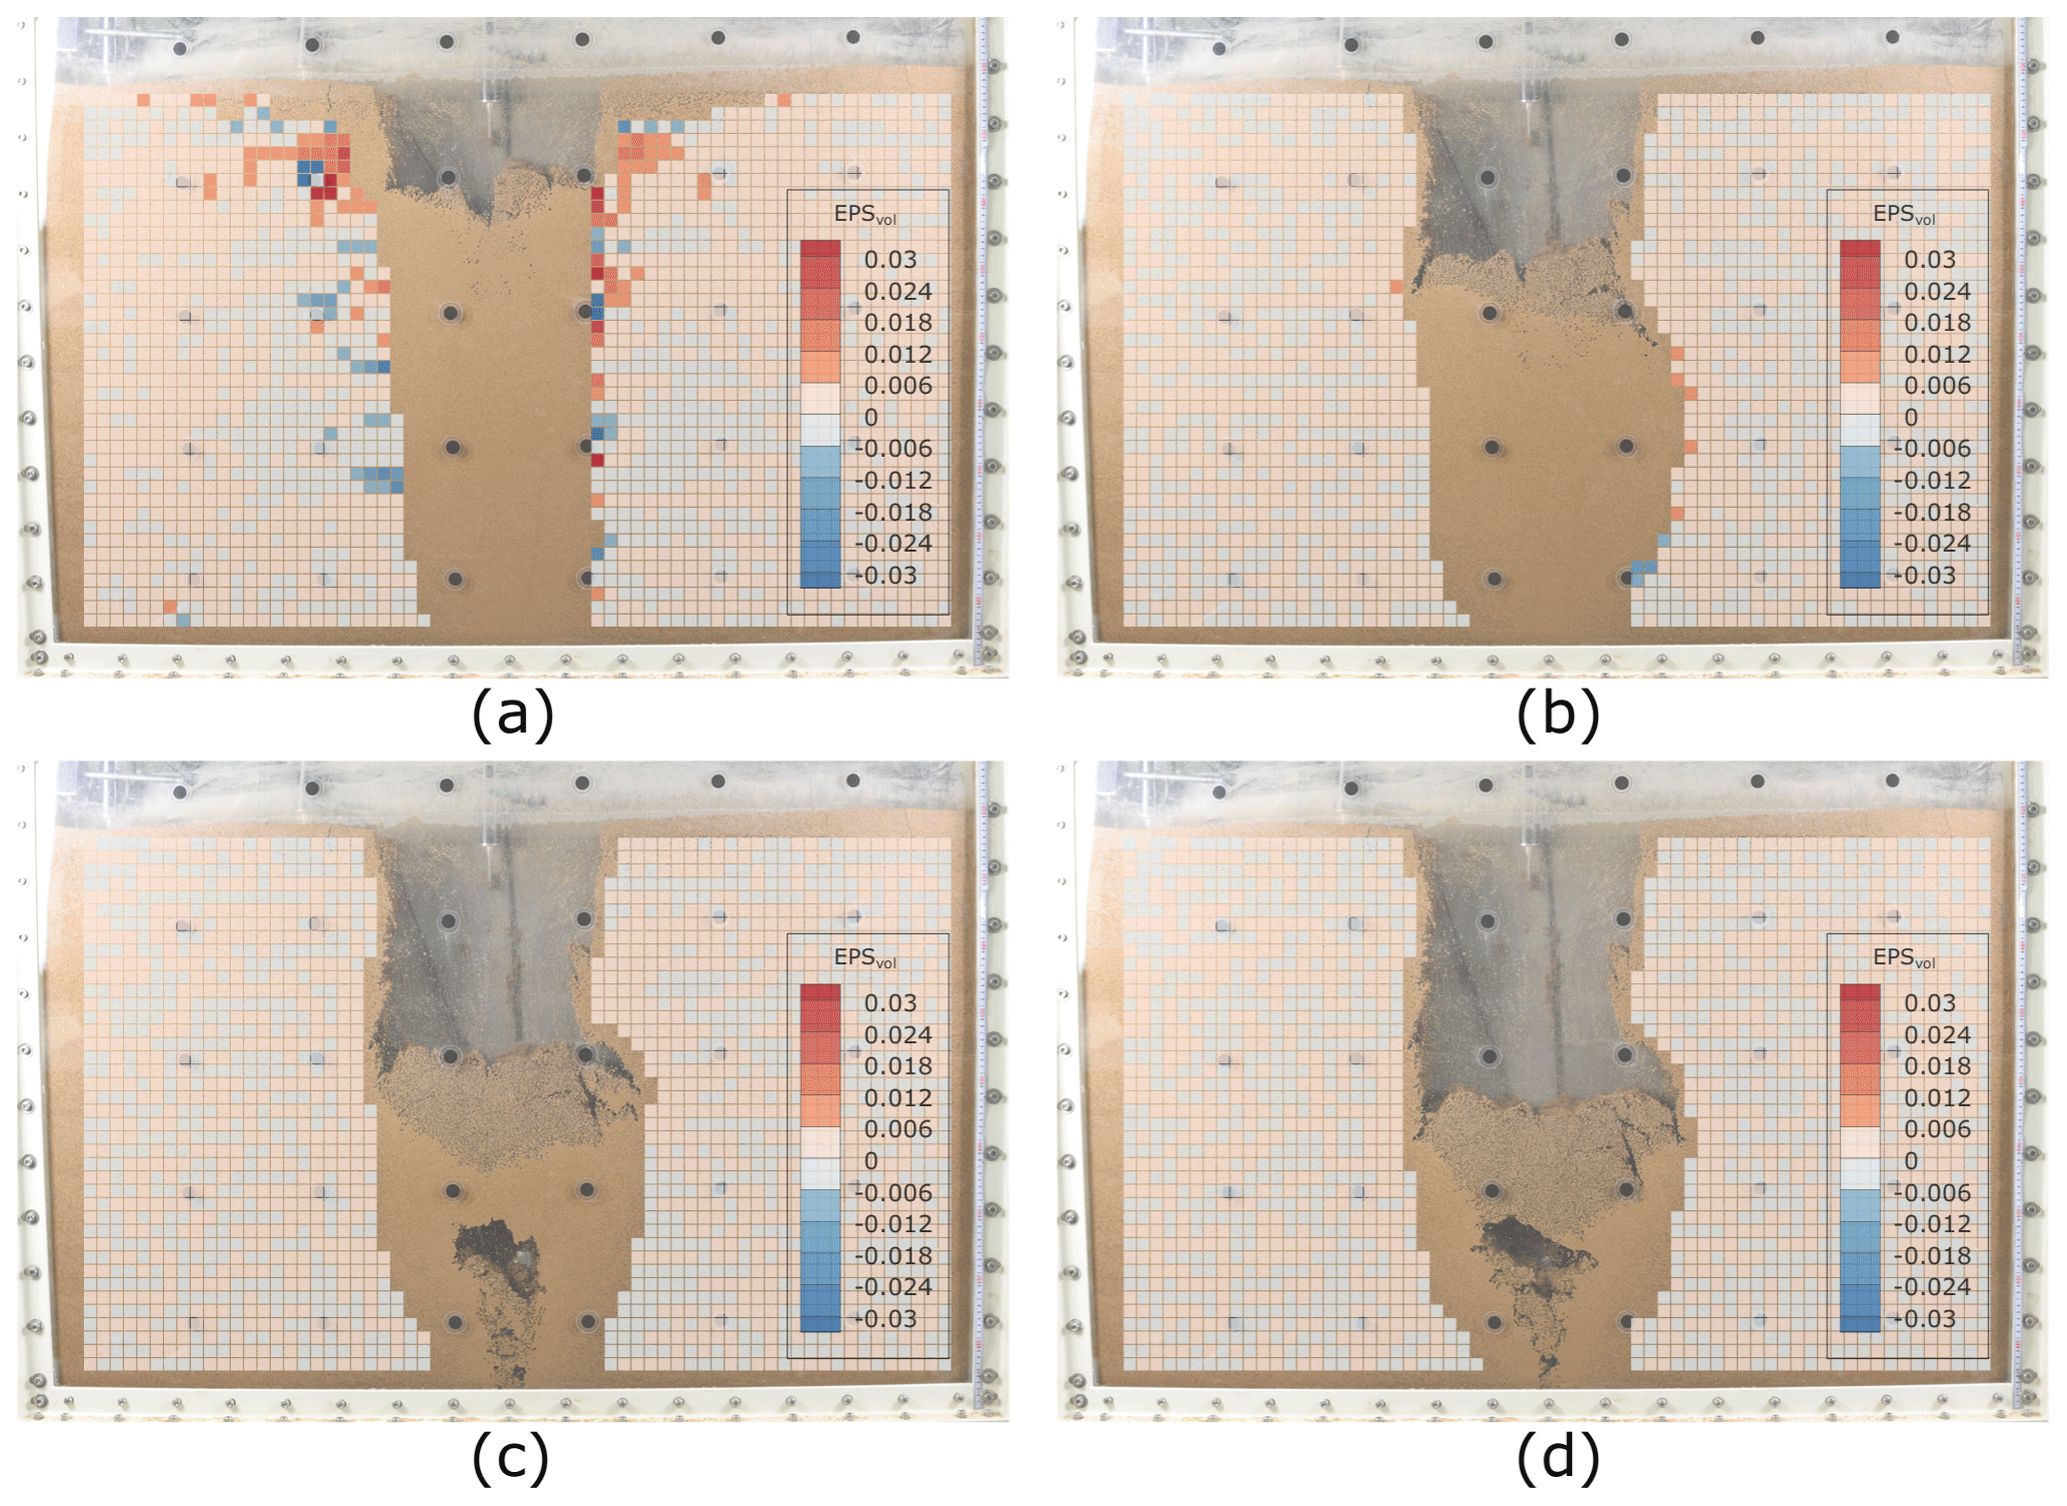
Figure 13Volumetric strain inside the model ground for Test 3 during the water drainage stage: (a) 0–30 s, (b) 30–60 s, (c) 60–90 s, and (d) 90–120 s.
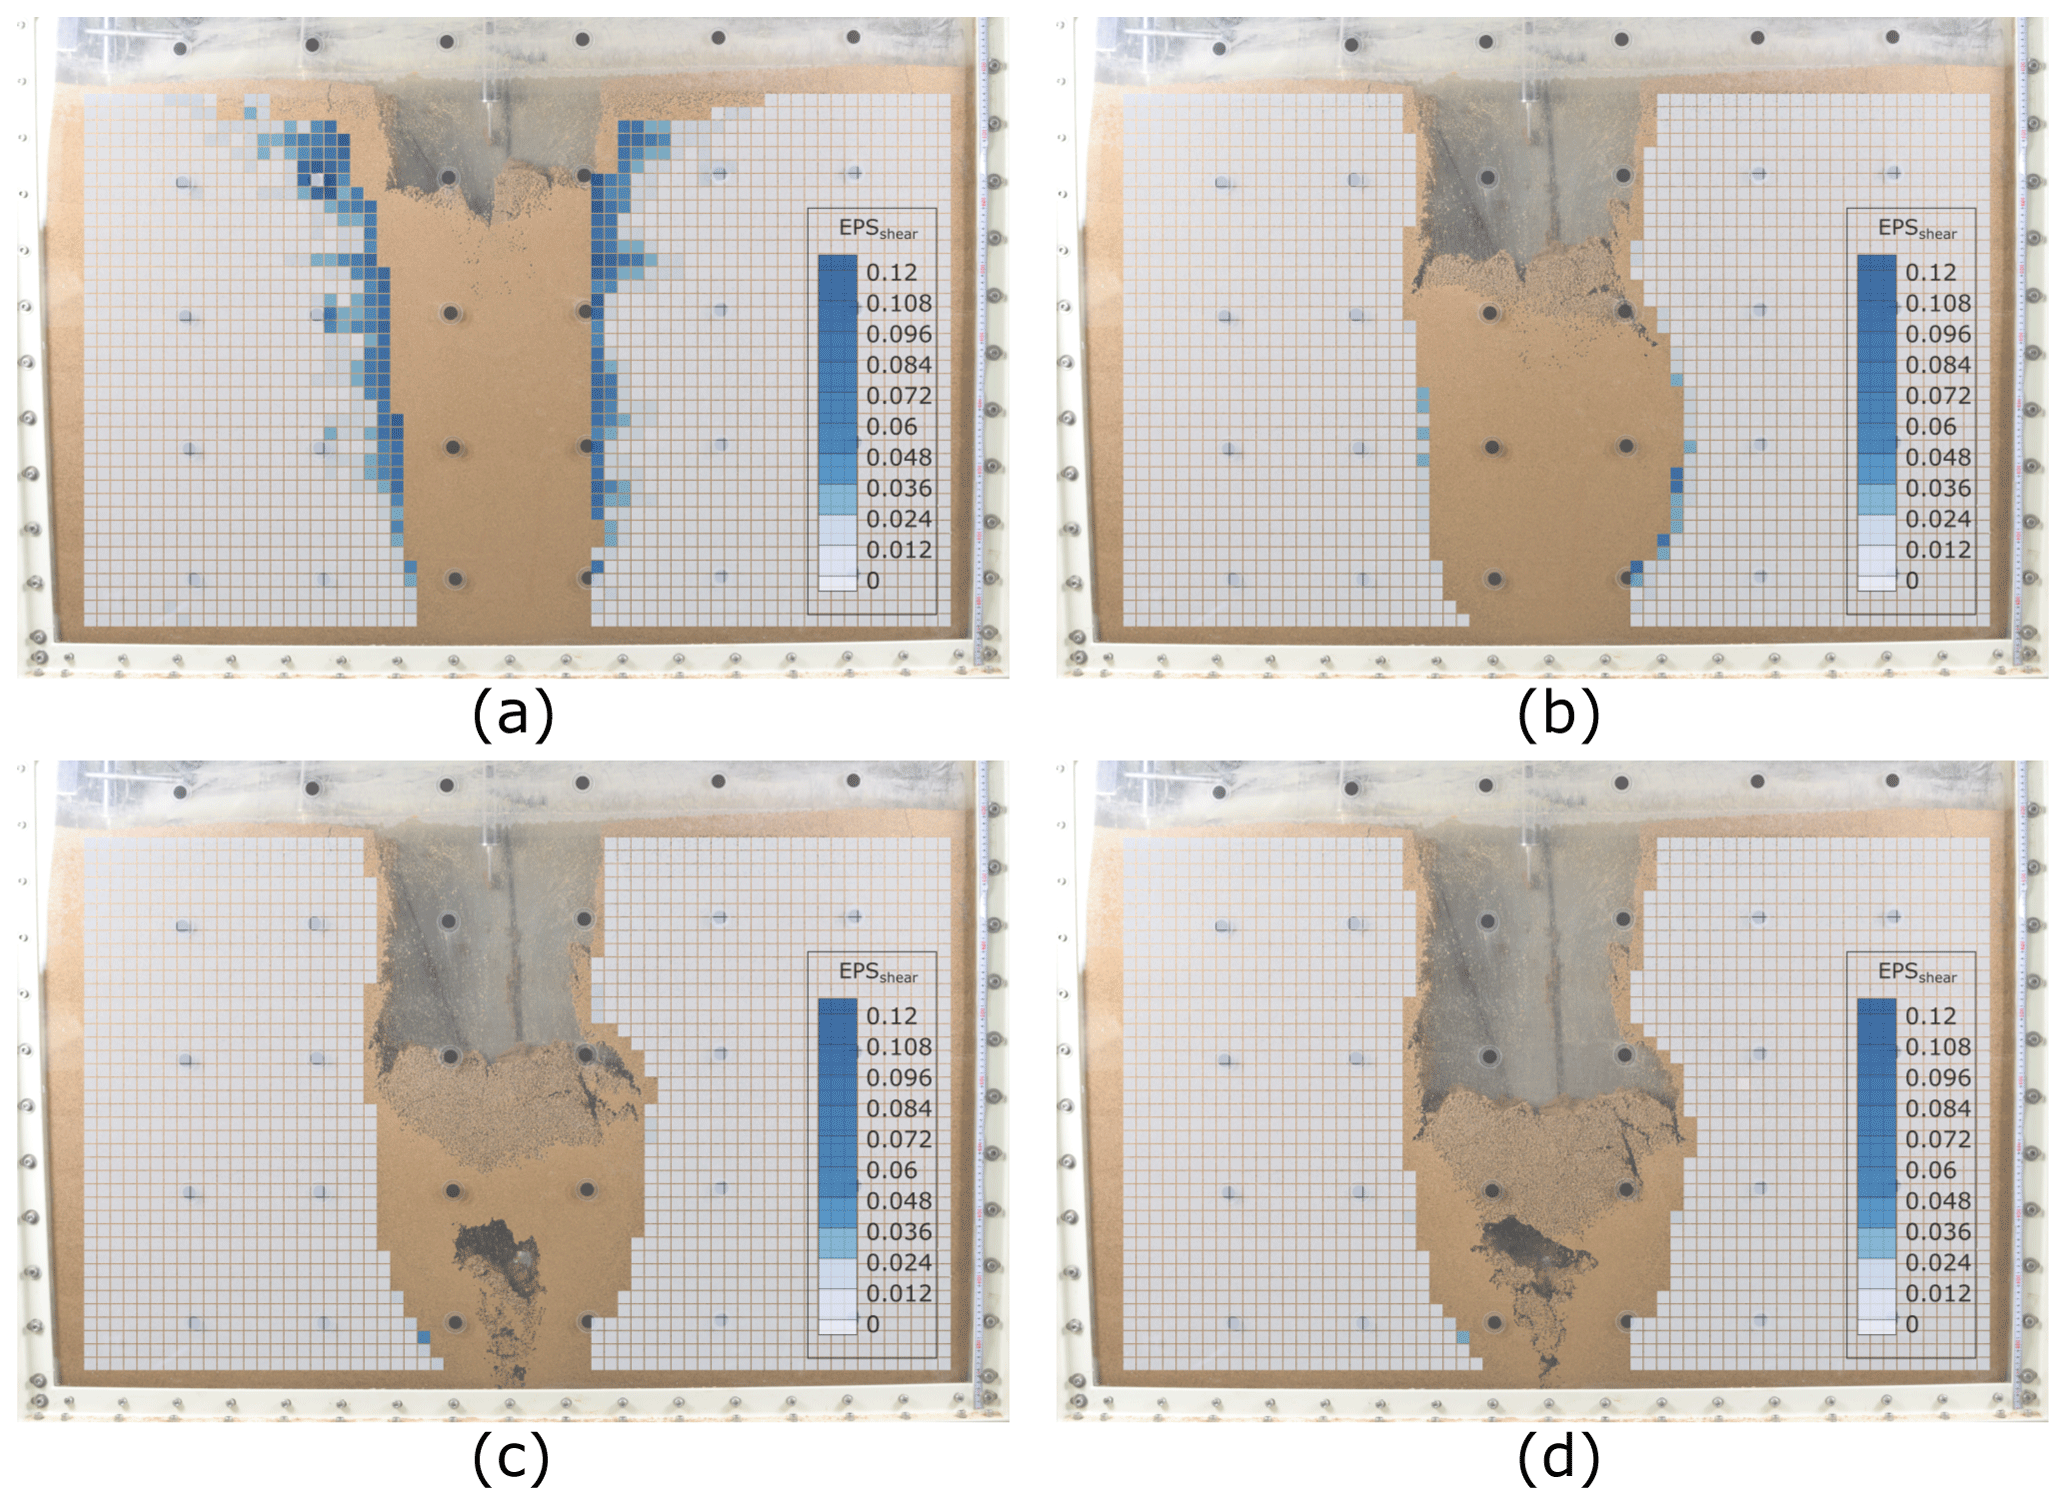
Figure 14Shear strain inside the model ground for Test 3 during the water drainage stage: (a) 0–30 s, (b) 30–60 s, (c) 60–90 s, and (d) 90–120 s.
In the initial phase (0–30 s) of the water drainage stage of Test 3, the groundwater was rapidly discharged into the slit owing to high downward infiltration pressure. As the soil particles escaped along with the groundwater discharge, the upper ground collapsed, forming an anthropogenic sinkhole similar in shape to the punching-shear failure (Fig. 12a). In the previous tests, the cavities formed at up to about 86 % and 89 % of the maximum groundwater level. The shape of the anthropogenic sinkhole formed indicated significant downward displacement (of the soil that had lost strength) towards the slit. The sudden collapse of the ground clogged the slit, which in turn prevented soil discharge. At this time, the shear deformation also showed a tendency to be concentrated around the collapsed soil (Fig. 14a). After the soil was completely drained, no significant deformation inside the ground and on the ground surface were observed via the PIV technique and the LVDTs after 30 s, as the matric suction allowed the ground to recover its unsaturated strength.
3.4 Comparative study
To quantitatively analyze the effect of rainfall intensity on ground cavity and sinkhole development, the evolution of the cavity size with time in the water drainage stage was obtained for each test, and the time at which the water was completely drained was also displayed, as shown in Fig. 15. For the hydraulic pressure of 45 and 70 cm, the time taken for the groundwater to drain completely was 70 and 90 s, respectively. However, in Test 3, although the groundwater level was higher, the soil collapsed instantly, resulting in an anthropogenic sinkhole, and the time taken for complete drainage was 80 s, which was faster than that in Test 2. After the drainage was completed, the cavity sizes measured in Test 1 and Test 2 were 497 cm2 (66 % of the final cavity size of 742 cm2) and 1286 cm2 (87 % of the final cavity size of 1482 cm2), respectively. In both tests 1 and 2, the cavity expanded for about 30 s after the drainage was completed, at which time its size tended to stabilize. In Test 3, where the anthropogenic sinkhole occurred, a cavity of 1207 cm2 (56 % of the final cavity size of 2171 cm2) was formed after the drainage was completed, after which the cavity continued to expand for approximately 200 s.

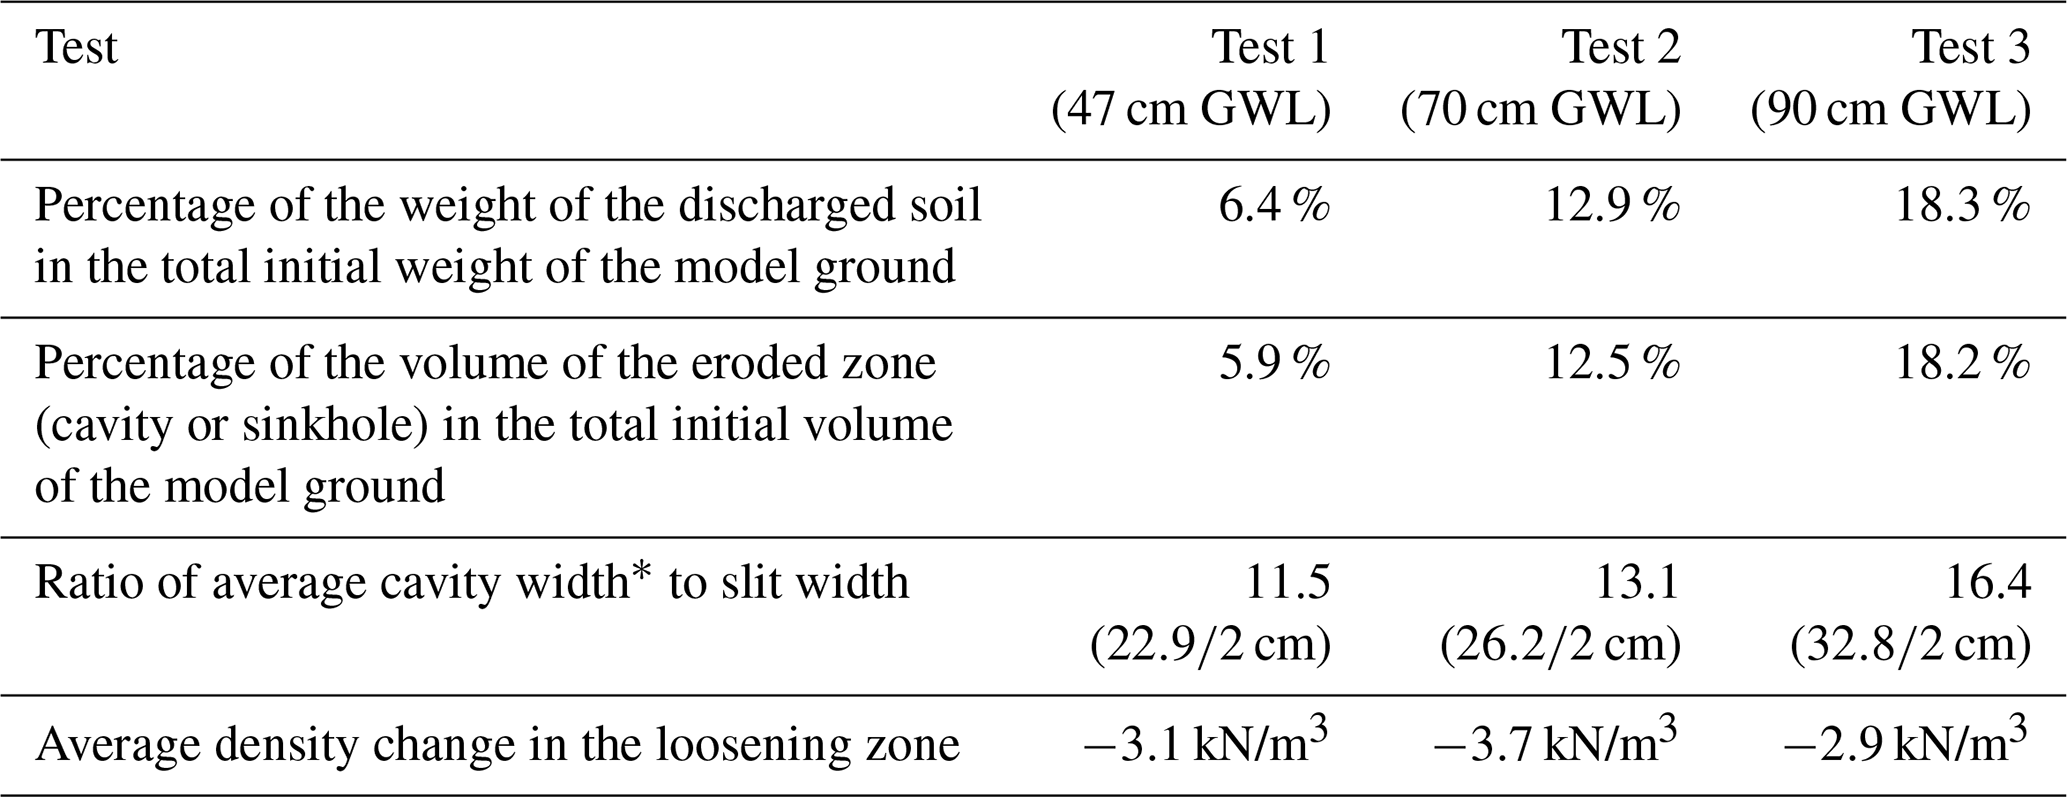
Table 4Comparative studies of the model tests. GWL denotes groundwater level.
∗ Calculated by dividing the cavity size (via Image J software) by the height of cavity.
Table 4 shows the ratio of the weight of the total soil volume to the weight of the discharged soil volume, the volume ratio of the area corresponding to the cavity, and the weight ratio of the loosening zone. The size and internal density change of the loosening zone were calculated by the following method. (1) After completion of the test, the discharged soil was dried to measure the weight. (2) The weight of the area corresponding to the cavity was calculated by multiplying the calculated volume of the cavity by the initial density of the soil. The soil weight corresponding to the loosening zone was calculated through the difference between the results of steps (1) and (2). (3) The size of the loosening zone was calculated by excluding the area corresponding to the cavity from the area overlapping with the volumetric strain calculated in each step. (4) The internal density change was confirmed using the results of steps (2) and (3).
On the one hand, as shown in Table 4, the size and density change of the loosening area were found to be nearly identical in the three tests. On the other hand, as the hydraulic head increased, the weight and volume of the eroded zone and the average width of the cavity relative to the slit width increased linearly. However, recalling the fact that the hydraulic head increases drastically when the rainfall intensity exceeds a certain threshold, it can be inferred that the volume of the discharged soil and the size of the eroded zone may also increase exponentially with rainfall intensity. The threshold value is definitely specific to a given sewer system. Thus the experimental results of this study suggest that to prevent sinkholes caused by pipe defects and to inhibit the rapid rise in groundwater levels in preparation for increased torrential rain caused by climate change, sewage pipe network facilities need to be expanded.
In this study, model tests were used to analyze the effects of rainfall intensity on the formation of the eroded zone and the occurrence of sinkholes caused by soil erosion due to groundwater infiltration through pipe defects. The model tests were conducted to simulate the actual site conditions as far as possible by using the soil used around sewer pipe networks and the sewer pipe landfill standards as well as a large-scale soil chamber. The groundwater level was applied to the model tests by setting three hydraulic heads based on the heavy-rainfall characteristics of South Korea: (1) heavy-rainfall intensity (47 cm hydraulic head), (2) very heavy rainfall intensity (70 cm hydraulic head), and (3) extremely heavy rainfall intensity (90 cm hydraulic head). Throughout the model tests, the groundwater level changed and the ground surface displacements were measured continuously from the start to the end of the tests. In addition, the PIV technique, which can continuously measure and analyze the displacement of the entire ground, was applied to quantify the ground deformation (volumetric strain and shear strain), generation, and expansion of the underground cavity. Based on the results of the three tests, the following observations were drawn:
-
The rainfall intensity considerably affected on-the-ground deformation during and after rainfall.
-
Under conditions of heavy-rainfall and very heavy rainfall intensity , no internal soil deformation occurred while the groundwater level was rising. However, under extremely heavy rainfall intensity conditions, ground subsidence was observed. This result indicates that the resistance factor (due to the soil strength parameter) becomes smaller than the sum of the drag force (upward force by infiltration pressure during water supply) and the gravity (downward force) when the rainfall intensity exceeds a certain threshold, which was found to have a hydraulic head of between 70 and 90 cm under the given system.
-
After heavy rainfall (that leads to the rise in the groundwater level due to the infiltration of groundwater through the sewer pipe defects), the soil was discharged from the area above the slit with the rapid outflow of groundwater, where there was no active restraining pressure. During the formation and development of a cavity along with the drop in the groundwater level, the incremental volumetric and shear strains were concentrated in the vicinity of the underground cavity.
-
The height and average width of cavities increased linearly with the applied hydraulic head, and notably, sinkholes opened under extremely heavy rainfall intensity. Referring to the previous study which showed the relationship between the hydraulic head and rainfall intensity, the discharged soil and the size of the eroded zone may increase exponentially with rainfall intensity.
It should be noted that the hydraulic head–rainfall intensity relationship used in this study is site-specific. The induced hydraulic head under the same rainfall intensity can be different from site to site. Nevertheless, the experimental observations of this study confirm the influence of rainfall intensity on the soil erosion near the sewer pipe defects as well as sinkhole occurrence and suggest a necessity for sewage pipe network facility rehabilitation in preparation for increased torrential rain caused by climate change.
Data from this research are not publicly available. Interested researchers can contact the corresponding author of this article.
The conceptualization was by TYK and CKC, and JK planned the methodology. TYK performed the analysis using software, and validation was performed by SIW and CKC. JK performed formal analysis. TYK prepared the original draft, while all authors contributed to the review and editing. Visualization and graphics were designed by TYK and JK. SIW and CKC supervised the research work.
The authors declare that they have no conflict of interest.
This research was supported by a National Research Foundation of Korea (NRF) grant funded by the South Korean government (MSIP) (no. 2015R1A2A1A01007980) and the Research Institute at the College of Engineering of Seoul National University. In addition, the support of Jin-Tae Han, a research fellow of the Korea Institute of Civil Engineering and Building Technology, is greatly appreciated.
This research was supported by a grant (code 20SCIP-C151438-02) from the Construction Technologies Program funded by the Ministry of Land, Infrastructure, and Transport of the Korean government. This research was also supported by the Regional Demand-Specific R&D Support Program from the Ministry of Science and ICT (Republic of Korea) (CN20120GB001).
This paper was edited by Mario Parise and reviewed by two anonymous referees.
Adrian, R. J.: Particle-Imaging Techniques for Experimental Fluid Mechanics, Annu. Rev. Fluid Mech., 23, 261–304, https://doi.org/10.1146/annurev.fl.23.010191.001401, 1991.
Alpert, P., Ben-Gai, T., Baharad, A., Benjamini, Y., Yekutieli, D., Colacino, M., Diodato, L., Ramis, C., Homar, V., Romero, R., Michaelides, S. and Manes, A.: The paradoxical increase of Mediterranean extreme daily rainfall in spite of decrease in total values, Geophys. Res. Lett., 29, 29–32, https://doi.org/10.1029/2001GL013554, 2002.
Alshibli, K. A. and Akbas, I. S.: Strain Localization in Clay: Plane Strain versus Triaxial Loading Conditions, Geotech. Geol. Eng., 25, 45–55, https://doi.org/10.1007/s10706-006-0005-4, 2007.
Alshibli, K. A. and Sture, S.: Sand Shear Band Thickness Measurements by Digital Imaging Techniques, J. Comput. Civ. Eng., 13, 103–109, https://doi.org/10.1061/(ASCE)0887-3801(1999)13:2(103), 1999.
Bae, Y., Shin, S., Won, J., and Lee, D.: The Road Subsidence Conditions and Safety Improvment Plans in Seoul, Seoul, 60 pp., 2016.
Beck, B.: Soil Piping and Sinkhole Failures, in: Encyclopedia of Caves (Second Edition), edited by: White, W. B. and Culver, D. C., Academic Press, Amsterdam, 966 pp., 2012.
Brinkmann, R., Parise, M., and Dye, D.: Sinkhole distribution in a rapidly developing urban environment: Hillsborough County, Tampa Bay area, Florida, Eng. Geol., 99, 169–184, https://doi.org/10.1016/j.enggeo.2007.11.020, 2008.
Caramanna, G., Ciotoli, G., and Nisio, S.: A Review of Natural Sinkhole Phenomena in Italian Plain Areas, Nat. Hazards, 45, 145–172, https://doi.org/10.1007/s11069-007-9165-7, 2008.
Choi, C., Kim, J., Kang, J., and Park, Y.: Ground Subsidence Risk Analysis with Intensity and Duration of Rainfall, Mod. Environ. Sci. Eng., 3, 162–167, https://doi.org/10.15341/mese(2333-2581)/03.03.2017/003, 2017.
Galloway, D., Jones, D. R., and Ingebritsen, S. E.: Land Subsidence in the United States, United States Geol. Surv. Circ., 1182, 177, https://doi.org/10.3133/cir1182 1999.
Gao, Y., Luo, W., Jiang, X., Lei, M., and Dai, J.: Investigations of Large Scale Sinkhole Collapses, Laibin, Guangxi, China, in National Cave and Karst Research Institute Symposium 2, Carlsbad, New Mexico, 327–331, 2013.
Guarino, P. M. and Nisio, S.: Anthropogenic Sinkholes in the Territory of the City of Naples (Southern Italy), Phys. Chem. Earth, 49, 92–102, https://doi.org/10.1016/j.pce.2011.10.023, 2012.
Guo, S., Shao, Y., Zhang, T., Zhu, D. Z., Asce, M., and Zhang, Y.: Physical Modeling on Sand Erosion around Defective Sewer Pipes under the Influence of Groundwater, Journal of Hydrualic Engineering, 139, 1247–1257, https://doi.org/10.1061/(ASCE)HY.1943-7900.0000785., 2013.
Gutiérrez, F., Guerrero, J., and Lucha, P.: A genetic classification of sinkholes illustrated from evaporite paleokarst exposures in Spain, Environ. Geol., 53, 993–1006, https://doi.org/10.1007/s00254-007-0727-5, 2008.
Gutierrez, F., Parise, M., De Waele, J., and Jourde, H.: A review on natural and human-induced geohazards and impacts in karst, Earth Sci. Rev., 138, 61–88, https://doi.org/10.1016/j.earscirev.2014.08.002, 2014.
Indiketiya, S., Jegatheesan, P., and Pathmanathan, R.: Evaluation of Defective Sewer Pipe Induced Internal Erosion and Associated Ground Deformation Using Laboratory Model Test, Can. Geotech. J., 54, 1184–1195, https://doi.org/10.1139/cgj-2016-0558, 2017.
Intrieri, E., Gigli, G., Nocentini, M., Lombardi, L., Mugnai, F., Fidolini, F., and Casagli, N.: Sinkhole monitoring and early warning: An experimental and successful GB-InSAR application, Geomorphology, 241, 304–314, https://doi.org/10.1016/j.geomorph.2015.04.018, 2015.
Japan Road Association: Earth works manual, 1990.
Kim, J., Jang, E.-R., and Chung, C.-K.: Evaluation of Accuracy and Optimization of Digital Image Analysis Technique for Measuring Deformation of Soils, J. Korean Geotech. Soc., 27, 5–16, 2011.
Kim, J., Woo, S. I., and Chung, C.: Assessment of Non-uniform Deformation during Consolidation with Lateral Drainage using Particle Image Velocimetry (PIV), KSCE J. Civ. Eng., 22, 520–531, https://doi.org/10.1007/s12205-017-0707-6, 2018.
Kim, K., Kim, J., Kwak, T. Y., and Chung, C. K.: Logistic Regression Model for Sinkhole Susceptibility due to Damaged Sewer Pipes, Nat. Hazards, 93, 765–785, https://doi.org/10.1007/s11069-018-3323-y, 2018.
Kristo, C., Rahardjo, H., and Satyanaga, A.: Effect of Variations in Rainfall Intensity on Slope Stability in Singapore, Int. Soil Water Conserv. Res., 5, 258–264, https://doi.org/10.1016/j.iswcr.2017.07.001, 2017.
Kuwano, R., Horii, T., Yamauchi, K., and Kohashi, H.: Formation of Subsurface Cavity and Loosening due to Defected Sewer Pipes, Japanese Geotech. J., 5, 349–361, 2010a.
Kuwano, R., Sato, M., and Sera, R.: Study on the Detection of Underground Cavity and Ground Loosening for the Prevention of Ground Cave-in Accident, Japanese Geotech. J., 5, 349–361, 2010b.
Kwak, T., Kim, J., Lee, M., and Chung, C.-K.: Evaluation of the Factors Contributing to the Occurrence of Ground Cave-ins and Subsidence Induced by a Damaged Sewer Pipeline, in: Civil Engineering Conference in the Asian Region (CECAR 7), Hawaii, USA, 11 pp., 2016.
Kwak, T. Y., Woo, S. I., Kim, J., and Chung, C. K.: Model Test Assessment of the Generation of Underground Cavities and Ground Cave-ins by Damaged Sewer Pipes, Soils Found., 59, 586–600, https://doi.org/10.1016/j.sandf.2018.12.011, 2019.
Martinotti, M. E., Pisano, L., Marchesini, I., Rossi, M., Peruccacci, S., Brunetti, M. T., Melillo, M., Amoruso, G., Loiacono, P., Vennari, C., Vessia, G., Trabace, M., Parise, M., and Guzzetti, F.: Landslides, floods and sinkholes in a karst environment: the 1–6 September 2014 Gargano event, southern Italy, Nat. Hazards Earth Syst. Sci., 17, 467–480, https://doi.org/10.5194/nhess-17-467-2017, 2017.
Ministry of Environment of Korea: Technical Standard for Construction of Sewer Pipes, 591 pp., 2010.
Mukunoki, T., Kumano, N., and Otani, J.: Image Analysis of Soil Failure on Defective Underground Pipe due to Cyclic Water Supply and Drainage using X-ray CT, Front. Struct. Civ. Eng., 6, 85–100, https://doi.org/10.1007/s11709-012-0159-5, 2012.
Nadarajah, S. and Choi, D.: Maximum Daily Rainfall in South Korea, J. Earth Syst. Sci., 116, 311–320, https://doi.org/10.1007/s12040-007-0028-0, 2007.
National Disaster Management Institute of Korea: Possibility of Manhole Cap Removal by Heavy Rainfall, Minist. Secur. Public Adm. Korea Press Releases, 1–6, 2014.
Oosthuizen, A. C. and Richardson, S.: Sinkholes and subsidence in South Africa, available at: https://www.geoscience.org.za/images/geohazard/Sinkholes.pdf (last access: 20 November 2020), 2011.
Parise, M.: A procedure for evaluating the susceptibility to natural and anthropogenic sinkholes, Georisk, 9, 272–285, https://doi.org/10.1080/17499518.2015.1045002, 2015.
Parise, M., Pisano, L., and Vennari, C.: Sinkhole clusters after heavy rainstorms, Journal of Cave and Karst Studies, 80, 28–38, https://doi.org/10.4311/2017ES0105, 2018.
Parise, M.: Sinkholes, in: Encyclopedia of Caves, edited by: White, W. B., Culver, D. C., and Pipan, T., Academic Press, Elsevier, 3rd edition, ISBN 978-0-12-814124-3, 934–942, 2019.
Peruccacci, S., Brunetti, M. T., Luciani, S., Vennari, C., and Guzzetti, F.: Lithological and seasonal control on rainfall thresholds for the possible initiation of landslides in central Italy, Geomorphology, 139, 79–90, 2012.
Rahardjo, H., Kim, Y., and Satyanaga, A.: Role of Unsaturated Soil Mechanics in Geotechnical Engineering, Int. J. Geo-Engineering, 10, 1–23, https://doi.org/10.1186/s40703-019-0104-8, 2019.
Rogers, C. J.: Sewer Deterioration Studies: The Background to the Structural Assessment Procedure in the Sewerage Rehabilitation Manual, 49 pp., 1986.
Rossi, M., Peruccacci, S., Brunetti, M. T., Marchesini, I., Luciani, S., Ardizzone, F., Balducci, V., Bianchi, C., Cardinali, M., Fiorucci, F., Mondini, A. C., Reichenbach, P., Salvati, P., Santangelo, M., Bartolini, D., Gariano, S. L., Palladino, M., Vessia, G., Viero, A., Antronico, L., Borselli, L., Deganutti, A. M., Iovine, G., Luino, F., Parise, M., Polemio, M., and Guzzetti, F.: SANF: a national warning system for rainfall-induced landslides in Italy, in: Proceedings of the 11th International Conference and 2nd North American symposium on landslides, Banff, Alberta, Canada, 3–8 June, 2012.
Sato, M. and Kuwano, R.: Influence of Location of Subsurface Structures on Development of Underground Cavities induced by Internal Erosion, Soils Found., 55, 829–840, https://doi.org/10.1016/j.sandf.2015.06.014, 2015.
Tang, Y., Zhu, D. Z., and Chan, D. H.: Experimental Study on Submerged Sand Erosion through a Slot on a Defective Pipe, J. Hydraul. Eng., 143, 1–14, https://doi.org/10.1061/(ASCE)HY.1943-7900.0001326, 2017.
Van Den Eeckhaut, M., Poesen, J., Dusar, M., Martens, V., and Duchateau, P.: Sinkhole formation above underground limestone quarries: A case study in South Limburg (Belgium), Geomorphology, 91, 19–37, https://doi.org/10.1016/j.geomorph.2007.01.016, 2007.
Vessia, G., Parise, M., Brunetti, M. T., Peruccacci, S., Rossi, M., Vennari, C., and Guzzetti, F.: Automated reconstruction of rainfall events responsible for shallow landslides, Nat. Hazards Earth Syst. Sci., 14, 2399–2408, https://doi.org/10.5194/nhess-14-2399-2014, 2014.
Waltham, T., Bell, F., and Culshaw, M.: Sinkholes and Subsidence, Springer, Chichester, 350 pp., 2005.
White, D. J. and Take, W. A.: GeoPIV: Particle Image Velocimetry (PIV) Software for Use in Geotechnical Testing, Cambridge Univ. Eng. Dep. Tech. Rep., 322, 15, CUED/D-SOILS/TR322, 2002.
White, D. J., Take, W. A., and Bolton, M. D.: Soil Deformation Measurement using Particle Image Velocimetry (PIV) and Photogrammetry, Geothechnique, 53, 619–631, https://doi.org/10.1680/geot.2003.53.7.619, 2003.
Wi, S., Valdés, J. B., Steinschneider, S., and Kim, T. W.: Non-stationary Frequency Analysis of Extreme Precipitation in South Korea using Peaks-over-threshold and Annual Maxima, Stoch. Environ. Res. Risk Assess., 30, 583–606, https://doi.org/10.1007/s00477-015-1180-8, 2016.
Yokota, T., Fukatani, W., and Miyamoto, T.: The present situation of the road cave in sinkholes caused by sewer systems, 95 pp., 2012.