the Creative Commons Attribution 4.0 License.
the Creative Commons Attribution 4.0 License.
 | 21 Oct 2020
Assessing atmospheric moisture effects on heavy precipitation during HyMeX IOP16 using GPS nudging and dynamical downscaling
Alberto Caldas-Alvarez
Samiro Khodayar
Gaining insight into the interaction between atmospheric moisture and convection is determinant for improving the model representation of heavy precipitation, a weather phenomenon that causes casualties and monetary losses in the western Mediterranean region every year. Given the large variability of atmospheric moisture, an accurate representation of its distribution is expected to reduce the errors related to the representation of moist convective processes. In this study, we use a diagnostic approach to assess the sensitivity of convective precipitation and underlying mechanisms during a heavy precipitation event (Hydrological cycle in the Mediterranean eXperiment Intensive Observation Period; HyMeX IOP16) to variations of the atmospheric moisture spatio-temporal distribution. Sensitivity experiments are carried out by nudging a homogenized data set of the Global Positioning System-derived zenith total delay (GPS-ZTD) with sub-hourly temporal resolution (10 min) in 7 and 2.8 km simulations with the COnsortium for Small-scale MOdeling in CLimate Mode (COSMO-CLM) model over the western Mediterranean region. The analysis shows that (a) large atmospheric moisture amounts (integrated water vapour; IWV ∼ 40 mm) precede heavy precipitation in the affected areas. This occurs 12 h prior to initiation over southern France and 4 h over Sardinia, north-eastern Italy and Corsica, which is our main study area. (b) We found that the moisture is swept from the Atlantic by a westerly large-scale front associated with an upper level low on the one hand and evaporated from the Mediterranean Sea and north Africa on the other. The latter moisture transport occurs in the 1 to 4 km layer. (c) COSMO-CLM overestimated the atmospheric humidity over the study region (Corsica), and this was, to a good extent, corrected by the GPS-ZTD nudging. This reduced maximum precipitation (−49 % for 7 km and −16 % for 2.8 km) drastically, considerably improving the precipitation representation in the 7 km simulation. The convection-permitting simulation (2.8 km) without the GPS-ZTD nudging already did a good job in representing the precipitation amount. (d) The two processes that exerted the largest control on precipitation reduction were the decrease of atmospheric instability over Corsica (convective available potential energy; CAPE −35 %) and the drying of the lower free troposphere bringing additional dry air entrainment. In addition, the 7 km simulation showed a weakening of the represented low-pressure system and the associated cyclonic wind circulation. This ultimately reduced the intensity and number of convective updrafts represented over the island. These results highlight the large impact exerted by moisture corrections on precipitating convection and the chain of processes leading to it across scales.
- Article
(11625 KB) - Full-text XML
-
Supplement
(6419 KB) - BibTeX
- EndNote


Heavy precipitating convection causes serious damages and casualties in countries of the western Mediterranean (WMed) basin yearly, especially in autumn (Llasat et al., 2010; Gilabert and Llasat, 2017). During these events, daily accumulated precipitation over 150 mm is not rare, and precipitation rates can be well over 20 mm h−1 (Ducrocq et al., 2014; Röhner et al., 2016). These are caused mainly by convective events ranging several temporal and spatial scales, from the mesoscale down to the micro-alpha (Ducrocq et al., 2016; Funatsu et al., 2018). Accurate representation of the convective processes is crucial to support forecasters and decision makers to prevent impacts on properties and communities. The WMed is especially prone to heavy precipitating convection in autumn because of the combination of the relatively high sea surface temperature of the Mediterranean and the Atlantic, the arrival of low-pressure systems such as extratropical cyclones or upper level troughs and the interaction with the Mediterranean complex orography (Ducrocq et al., 2014). Atmospheric moisture plays a decisive role at all phases of convective development, and therefore it is relevant to gain knowledge on moist convective processes to improve the modelling of extreme phenomena (Sherwood et al., 2010; Ahrens and Samson, 2010). Given the high spatio-temporal variability of atmospheric moisture (Steinke et al., 2015; Girolamo et al., 2016), a deficient representation of its distribution has been pointed out as being a source of uncertainty in current predictions (Chazette et al., 2015a; Khodayar et al., 2016a). That is why there is growing interest in developing forecast systems that assimilate humidity observations with sub-hourly frequency (Guerova et al., 2016). Given the novelty of such assimilation frequencies and the multiple methodologies applied, new insights into their impact on simulated atmospheric conditions leading to heavy precipitation are needed.
Determinant for the heaviest precipitation events in the WMed are the vast moisture amounts which may originate from remote or local sources (Ricard et al., 2012; Krichak et al., 2014; Khodayar et al., 2016a). Depending on the synoptic conditions, the Mediterranean Sea can account for over 50 % of the transported moisture (Duffourg and Ducrocq, 2011). This is the case when an anticyclonic flow dominates the 3 to 4 d preceding heavy precipitation. Remote sources such as the Atlantic and the tropics also supply the necessary moisture, especially for the heaviest precipitation events (Pinto et al., 2013; Winschall et al., 2014), whose transport is brought via tropical plumes (Chazette et al., 2015b) or extratropical cyclones (Xoplaki et al., 2012). Finally, north Africa has also been identified as a source of moisture by Duffourg and Ducrocq (2011). Regions prone to convective development are correlated with areas of moisture convergence where a building up of conditional instability takes place (Ricard et al., 2012; Khodayar et al., 2016b). Given the correlation between the location of moisture convergence and precipitating convection, the complex Mediterranean orography plays a decisive role in forming areas prone to heavy precipitation. The high mountain ridges constrain the moisture transport in the basin, favouring moisture gathering at the mountain foothills, the coasts and the valleys. Moreover, the elevated terrain provides dynamic lifting to the convergent moist air masses, triggering convection.
In addition to the moisture transport, the variability and stratification determine when, where and how intense convection can be. Several studies (Duffourg and Ducrocq, 2011; Ricard et al., 2012; Khodayar et al., 2016a; Maranan et al., 2019) have highlighted the moistening of the lower troposphere as a necessary factor for precipitating convection to develop with specific humidity values up to 10 g kg−1 below 850 hPa. A moist low level increases the convective available potential energy (CAPE) of the lifted parcel. A second factor crucial for convection intensity is the moisture in the lower free troposphere (LFT). This is the moisture transport that occurs above the planetary boundary layer (PBL). Recent observational studies (Virman et al., 2018; Schiro and Neelin, 2019) concluded that the probability of intense convection increases rapidly with increasing LFT humidity, especially over land. Whether this sensitivity of heavy precipitation to LFT moisture variation is well represented by current atmospheric models has been investigated by past sensitivity modelling studies using fine model resolution, from Δx ∼ 500 m to Δx ∼ 7 km (Keil et al., 2008; Honda and Kawano, 2015; Lee et al., 2018). They demonstrated that convection enhancing (weakening) happened with increasing (diminishing) moisture in the LFT in the simulations. These studies performed moisture sensitivity experiments, modifying the water vapour distribution by adding or subtracting a prescribed water vapour amount at chosen heights. It is thus of particular interest to investigate the aforementioned issues by performing corrections towards observations instead of using idealized experiments.

Figure 1Simulation domains for the CTRL-7 and NDG-7 runs (green line) and for the CTRL-2.8 and NDG-2.8 runs (red line). The investigation area CO is depicted by the thick lined black box. The box over north Africa (NA) denotes the region of intense evapotranspiration between 20 and 27 October (see Sect. 4.1). The orange scatter points show the location of the GPS receivers used for nudging and the blue squares the location of the radiosondes used for validation and process understanding. The upper left corner shows detail of the orography over CO, the purple transect representing the humidity vertical distribution in Fig. 5.
A powerful technique to correct the atmospheric moisture distribution is data assimilation (DA). Recent advances in remote sensing techniques for atmospheric moisture and the growing computational power have enabled the achievement of relevant improvements for heavy precipitation representation (Wulfmeyer et al., 2015). A well-established method of assimilating data is the nudging scheme. Nudging consists of relaxing the model's prognostic variables towards measurements (Schraff and Hess, 2012), whereby the main advantages are its simplicity (Guerova et al., 2016) and that it has shown good results, especially in analysing humidity fields as compared to other schemes (Schraff et al., 2016). Nudging can be used to assimilate Global Positioning System (GPS) measurements that provide information on the total column atmospheric moisture. The demonstrated benefits of using GPS measurements are that it is an all-weather product (as opposed to other remote sensing integrated products), and it has a large accuracy and a high temporal resolution (Cress et al., 2012; Guerova et al., 2016). The GPS data set used for nudging in this work is provided in the framework of the Hydrological cycle in the Mediterranean eXperiment (HyMeX; Ducrocq et al. 2014), which is particularly unique given the common processing of data from more than 25 European networks, its dense coverage and its temporal resolution of 5 min (Bock et al., 2016).
Our study focuses on the Intensive Observation Period (IOP) 16 of the HyMeX field campaign in autumn 2012 (Ducrocq et al., 2014), taking Corsica as our study region. The event was selected due to the combination of propitious instability and moisture conditions interacting with the Corsican complex orography. It has also been selected given the large impact shown on GPS nudging in seasonal simulations of the complete autumn 2012 period performed in our working group. This ongoing work revealed that the GPS nudging was able to reduce the existing wet bias in the model with a non-systematic response for heavy precipitation. HyMeX IOP16 was highlighted as one of the events for which the GPS nudging was beneficial in reducing the precipitation overestimation (Samiro Khodayar, personal communication, 2019).
Within this framework, this work is devoted to assess the sensitivity of convective precipitation and underlying mechanisms to variations of the atmospheric moisture spatio-temporal distribution. Our objectives are (1) to gain knowledge on the role of local and remote atmospheric moisture contributions in the convection-related processes leading to the occurrence of the event, (2) to assess the model sensitivity to continuous GPS nudging and (3) to quantify the impact of the GPS nudging depending on the model resolution.
The organization of the paper is as follows. Section 2 describes the model experiments and presents the observational data sets used for model validation and nudging. Section 3 provides a description of the event, including the synoptic situation, the convective evolution and the transport of moisture. Section 4 discusses the impact of the GPS nudging in precipitation, humidity and convective-related processes, and Sect. 5 presents the conclusions.
2.1 Observations
2.1.1 GPS zenith total delay
The zenith total delay (ZTD) is the “excess path length of GPS satellite emissions (in the L1 and L2 band) caused by the refractivity of the neutral atmosphere” (Businger et al., 1996). The refractivity definition for the neutral atmosphere depends on the partial pressures of water vapour and dry air and on the temperature as introduced in foundational papers of GPS meteorology (Bevis et al., 1994). The ZTD is proportional to the integrated water vapour (IWV) in the zenith direction. The ZTD is given in length units and is obtained from the slanted path delays by means of mapping functions Zm(θ) dependent on the curvature of the Earth and the elevation angle (Duan et al., 1996). The data set used for the sensitivity experiments is provided by the LAboratoire de Recherche en Géodésie (LAREG) and the HyMeX community, and its specifications can be found in Bock et al. (2016). It merges data from more than 900 stations with 20 stations over Corsica, our study region, it is made available in temporal resolution up to 5 min and it has a dense coverage of the western European countries (see Fig. 1). All networks have been commonly processed by the GIPSY-OASIS II software to guarantee homogeneity. Data screening includes outliers, range and ambiguity checks to increase accuracy. The comparison against radiosonde IWV measurements has shown no significant biases during night-time and biases in the range of 0.5–1.4 mm during daytime (Bock et al., 2016).
2.1.2 Radiosondes (Rads.)
In the framework of HyMeX Special Observation Period 1 (SOP1), Météo France provides the operational soundings containing more than 30 atmospheric parameters, including temperature, dew point temperature, geopotential height, air pressure, wind direction and horizontal wind speed. On average, they contain ca. 30 levels between the surface and the 300 hPa level, with about one measurement every 250 m. In addition to the operational soundings, supplementary soundings were launched during the HyMeX IOPs. Hence, the temporal resolution of the soundings lies between 12 and 6 h. In total, 10 stations are used, among which three (Gibraltar, Mallorca and Dar El Beïda) are used for process understanding; seven over the Italian Peninsula, Croatia, Corsica and Sardinia are used for validation of the specific humidity and IWV simulations. We perform the validation of the model data, obtaining the nearest grid points to the location of the radiosondes. No height correction is applied for this purpose since the difference in height between the neighbouring grid points and the height of the radiosonde stations does not exceed 30 m in any case. The data are accessible at http://mistrals.sedoo.fr/?editDatsId=595&datsId=595&project_name=HyMeX (last access: 14 October 2020).
2.1.3 Rain gauges
Météo France and the HyMeX programme provide the HyMeX domain precipitation amount (Nuret, 2013; SEDOO OMP; https://doi.org/10.6096/mistrals-hymex.904) data set, with hourly accumulated precipitation measured by rain gauges. Over 5000 stations are deployed over the WMed land parts, with about 30 stations placed over the island of Corsica. The version used (V4) enjoys the newest quality control and checks for double stations. The data set spans the September 2012 to March 2013 period.
2.1.4 NOAA CPC MORPHing precipitation (CMORPH)
CMORPH makes precipitation measurements available in a rectangular grid, merging satellite microwave observations. These are combined using the morphing technique (Joyce et al., 2004; https://doi.org/10.5065/D60R9MF6) that uses motion vectors derived from infrared data to transport the microwave information to spots where no microwave data were available. It has a broad coverage (60∘ S–60∘ N), and its spatial and temporal resolution at the Equator is 8 km and 30 min. The Climate Prediction Center (CPC) of the National Weather Service (NWS) in the United States provides the data, and the data span the period 1998 to 2015. CMORPH has shown a good detection skill in validation studies (Bitew and Gebremichael, 2011; Habib et al., 2012) and high correlation rates with sub-daily rain gauge data (Sapiano and Arkin, 2009).
2.1.5 Global Land Evaporation Amsterdam Model (GLEAM)
GLEAM provides daily accumulated terrestrial evaporation (evapotranspiration) in a 0.25∘ × 0.25∘ grid, spanning the period 2003–2017. GLEAM computes the total evaporation over land from the sum of bare-soil evaporation (Eb), transpiration (Et), open-water evaporation (Ew), snow sublimation (Es) and interception loss (Ei), as described in Martens et al. (2017) and Miralles et al., (2011). Four interconnected modules dealing with the rainfall interception, soil stress, soil state and the evaporation calculation compute the aforementioned contributions. The four modules are forced by gridded global data, which, in the version used in this work (v3b), are obtained mostly from remote sensing products, such as the Clouds and the Earth's Radiant Energy System (CERES) for radiation, the Tropical Rainfall Measurement Mission (TRMM) for precipitation, the Atmospheric Infrared Sounder (AIRS) for air temperature or European Space Agency Climate Change Initiative Soil Moisture (ESA CCI SM) for soil moisture. GLEAM version v3b has shown an average correlation with in situ measurements of 0.78. In the validation, only 2 out of 63 stations showed differences, with a level of significance of 10 % (Martens et al., 2017).
2.1.6 The Hybrid Single-Particle Lagrangian Integrated Trajectory (HYSPLIT) model
The HYbrid Single-Particle Lagrangian Integrated Trajectory (HYSPLIT) model computes air parcels, dispersion and chemical transformations (Stein et al., 2015; Rolph et al., 2017). In this paper, we use HYSPLIT to compute backward trajectories of moisture sources. The HYSPLIT model uses a hybrid approach, combining Lagrangian trajectories with the Eulerian methodology, using a fixed three-dimensional grid as a frame of reference (Stein et al., 2015). The free access internet-based platform READY (https://www.ready.noaa.gov/index.php, last access: 14 October 2020) offers HYSPLIT trajectories' calculation using eight different atmospheric model analyses of meteorological data. In this work, we use the half-degree archive of the National Centers for Environmental Prediction (NCEP) Global Data Assimilation System (GDAS) that spans the period 2007 to present and has a global coverage. The data set is accessible at https://www.ready.noaa.gov/HYSPLIT_traj.php (last access: 18 July 2019).
2.2 The COSMO-CLM model and the GPS-ZTD nudging sensitivity experiments
2.2.1 COnsortium for Small-scale MOdeling in CLimate Mode (COSMO-CLM)
The COSMO model is based on the fully compressible, non-hydrostatic, hydro-thermodynamical equations of the atmosphere. COSMO-CLM simulates the atmosphere as a multicomponent continuum constituted of liquid water, dry air, water vapour and solid water in the form of cloud droplets' ice crystals, raindrops, rimed aggregates, hail and graupel (Schättler et al., 2016). We use COSMO version 5.00 in climate configuration. This implies that the slow-changing variables (ozone concentration, aerosol concentration and canopy variables) evolve in time. This brings a more realistic representation of seasonal simulations, such as the ones presented in this work. The dynamic solver is a third-order Runge–Kutta split explicit scheme following Wicker and Skamarock (2002). It uses an Arakawa-C/Lorenz grid, with scalars defined at the centre of the grid box and the normal velocity components defined on the corresponding box faces. The grid is rotated, and the height coordinate shows a Gal-Chen terrain-following grid stretching. The model uses a sponge layer with Rayleigh damping at the top boundary and three grid point lines for adaptation at the lateral boundaries. The boundary and initial states of the atmospheric prognostic variables are obtained by coarser resolution forcing models in a one-way nesting approach. The soil state and the surface–atmosphere interactions are simulated through the TERRA-Multi-Layer model (TERRA-ML; Doms et al., 2011). TERRA-ML has eight soil layers and is responsible for issuing the temperature and humidity conditions at the ground. It considers the processes of evaporation, runoff, snow storage and interception storage. In the resolutions used in this work (7 and 2.8 km), COSMO-CLM parameterizes the turbulent diffusion using a 1-D diagnostic closure for the turbulent kinetic energy (Doms et al., 2011). The grid-scale clouds and precipitation are parameterized using a bulk scheme, including several hydrometeor types (Doms et al., 2011). The radiation is parameterized following the formulation according to Ritter and Geleyn (1992). In the case of grid spaces larger than 3 km, sub-grid deep moist convection is parameterized using a mass-flux, low-level scheme, with the equilibrium closure based on moisture convergence (Tiedtke, 1989). Shallow convection is parameterized using an adaptation of the Tiedtke scheme in the simulations using a 7 and a 2.8 km grid.
2.2.2 The nudging scheme
Following Schraff and Hess (2012), “nudging or Newtonian relaxation consists of relaxing the model's prognostic variables towards prescribed values within a predetermined time window”. The extent of the relaxation depends on the difference between the observed and the modelled variable , a weighting factor considering the measurement location and its representativeness (wk(x,t)) and a coefficient that modulates the impact of the analysis increments (Gφ). This term is added to the result provided by the dynamics and numerics (. These terms define the state of the prognostic variable (φ(x,t)) in the nudging equation (Eq. 1).
For any observation type (k), the weighting factor takes into account the representativeness of the observation (εk) and the spatial and temporal distance to the location of the observation by means of the horizontal (wxy), vertical (wz) and temporal weights (wt), using the relation . The weight for spreading in the horizontal direction is a second-order autoregressive function dependent on the distance between the observation and the target point (Δr) and the correlation scale (s); see Eq. (2). This implies that the impact of the assimilated observation decreases with the distance to the station location. For example, the horizontal weight is halved (wxy=0.5) at a distance of 135 km at the 500 hPa level.
Since a profile of specific humidity is constructed from the derived GPS-IWV value at the model levels, no vertical spreading (wz) is needed for GPS observations.
Regarding temporal weighting, for hourly or even more frequent data measured from a stationary platform, the data are linearly interpolated to the model time. The observations are assigned to a grid point in the spatio-temporal space, and the body of the report is evaluated. This is the step where gross error and consistency checks, quality control and redundancy checks dismiss suspicious observations.
In the case of Global Positioning System-derived ZTD (GPS-ZTD) observations, they are converted to IWV following Bevis et al. (1994), making use of run-time COSMO-CLM pressure and temperature values linearly interpolated to the station location (Schraff and Hess, 2012). The observations are assigned to a grid point in the model space, provided the altitude difference of the GPS station and model surface lies within the range −150 to 600 m to allow for extrapolation and interpolation, respectively. Then they are converted to a specific humidity profile () given IWV is not a model prognostic variable as opposed to specific humidity. This constructed profile shall be treated by the nudging scheme as an upper air measurement in the remainder of the process. The profile is constructed by means of an iterative process that scales the observed IWV (IWVobs) with the modelled one (IWVmod) until a sufficiently low error is reached or alternatively after 20 iterations. An iterative process is needed since, occasionally, some levels show supersaturated values after scaling to the observed IWV. When this happens, the specific humidity values are truncated to saturation, leaving the IWV of the constructed profile too far away from the observed one. Equation (3) describes the iterative formula. The first profile () used as the first guess for the iterative process is the modelled specific humidity profile. Hence, the profile used for nudging depends on the vertical humidity distribution simulated by the model at the beginning of the nudging time window.
2.2.3 The GPS-ZTD nudging sensitivity experiments
The nudging scheme is used to assimilate GPS-ZTD data to assess the sensitivity of heavy precipitating convection to corrections of the spatio-temporal distribution of atmospheric moisture. We employ seasonal simulations of autumn 2012 to profit from the full length of the GPS-ZTD data set.
The methodology is described as follows: we perform reference runs, hereafter referred to as CTRL, of the period 1 September at 00:00 UTC to 20 November at 00:00 UTC using two different horizontal resolutions (7 and 2.8 km). Subsequently, we simulate the same period, keeping the same settings but nudging GPS-ZTD data continuously every 10 min. These runs are called NDG-7 and NDG-2.8. The 7 km runs (CTRL-7 and NDG-7) have been forced by European Centre for Medium-Range Weather Forecasts (ECMWF) analyses with a 6-hourly frequency. The 2.8 km runs (CTRL-2.8 and NDG-2.8) are forced by the CTRL-7 simulation in a one-way nesting strategy. CTRL-7 forces NDG-2.8 to ensure a fair comparison between CTRL-2.8 and NDG-2.8 with the same boundary and initial conditions. The simulation domains are contained in Fig. 1. We assimilate GPS data continuously to assess the differences in model representation from the free runs and the runs with an improved representation of the atmospheric column content. In this sense we use a diagnostic approach, and our experiments do not assess the impact of the assimilation on the subsequent first guess forecast.
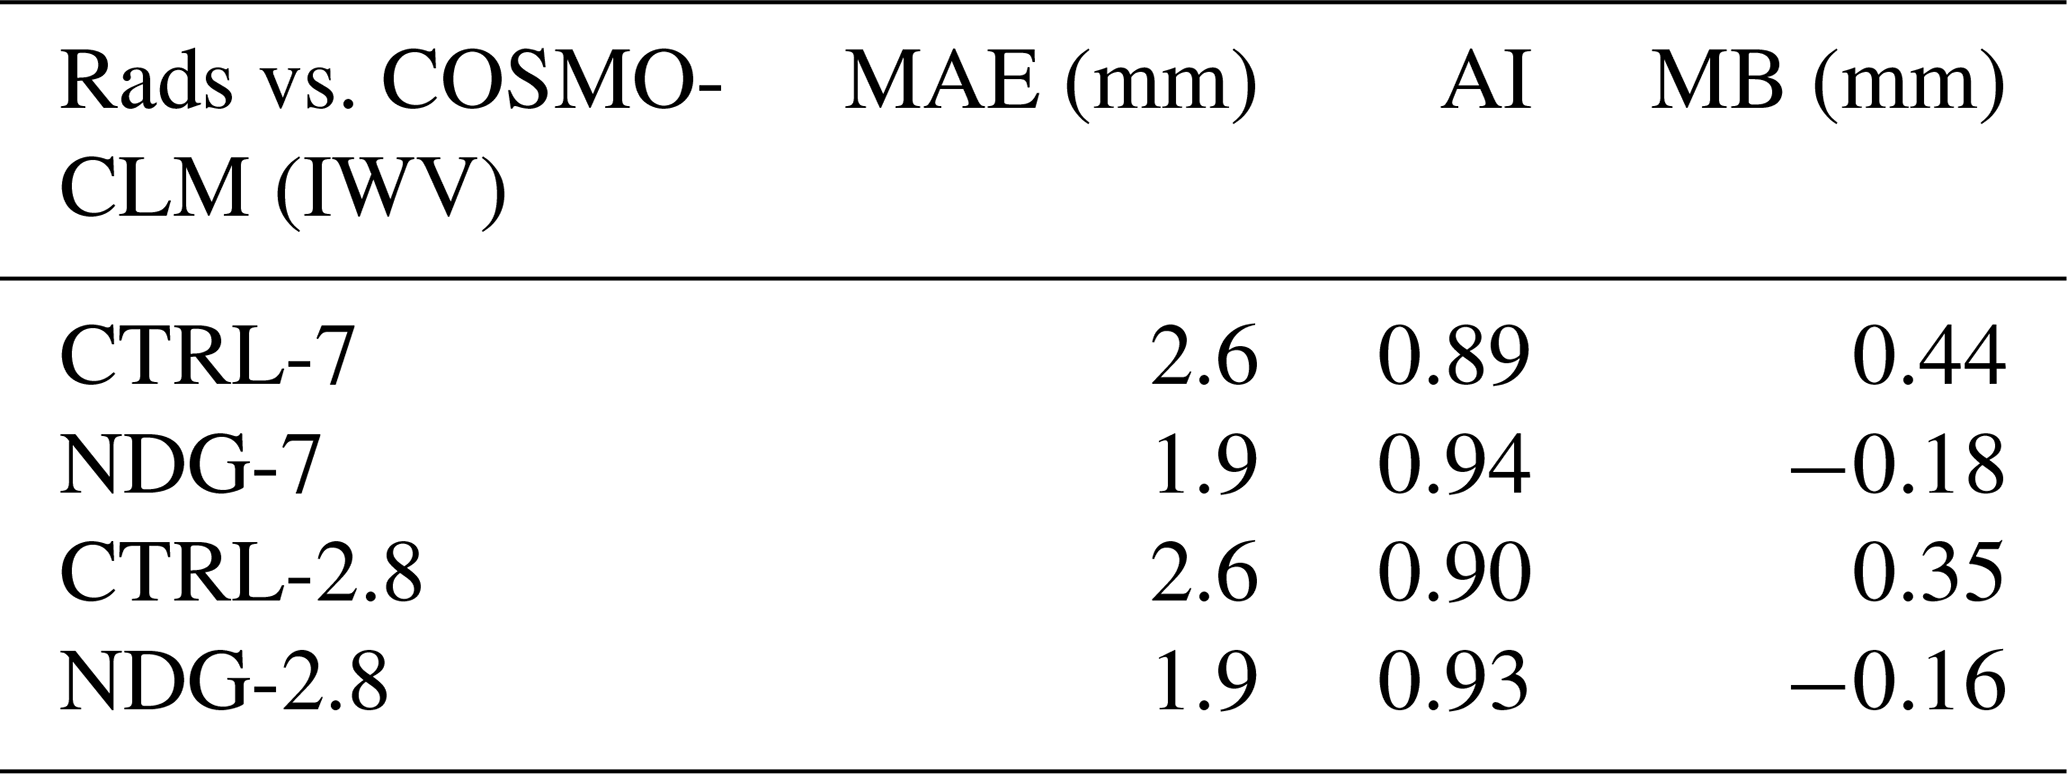
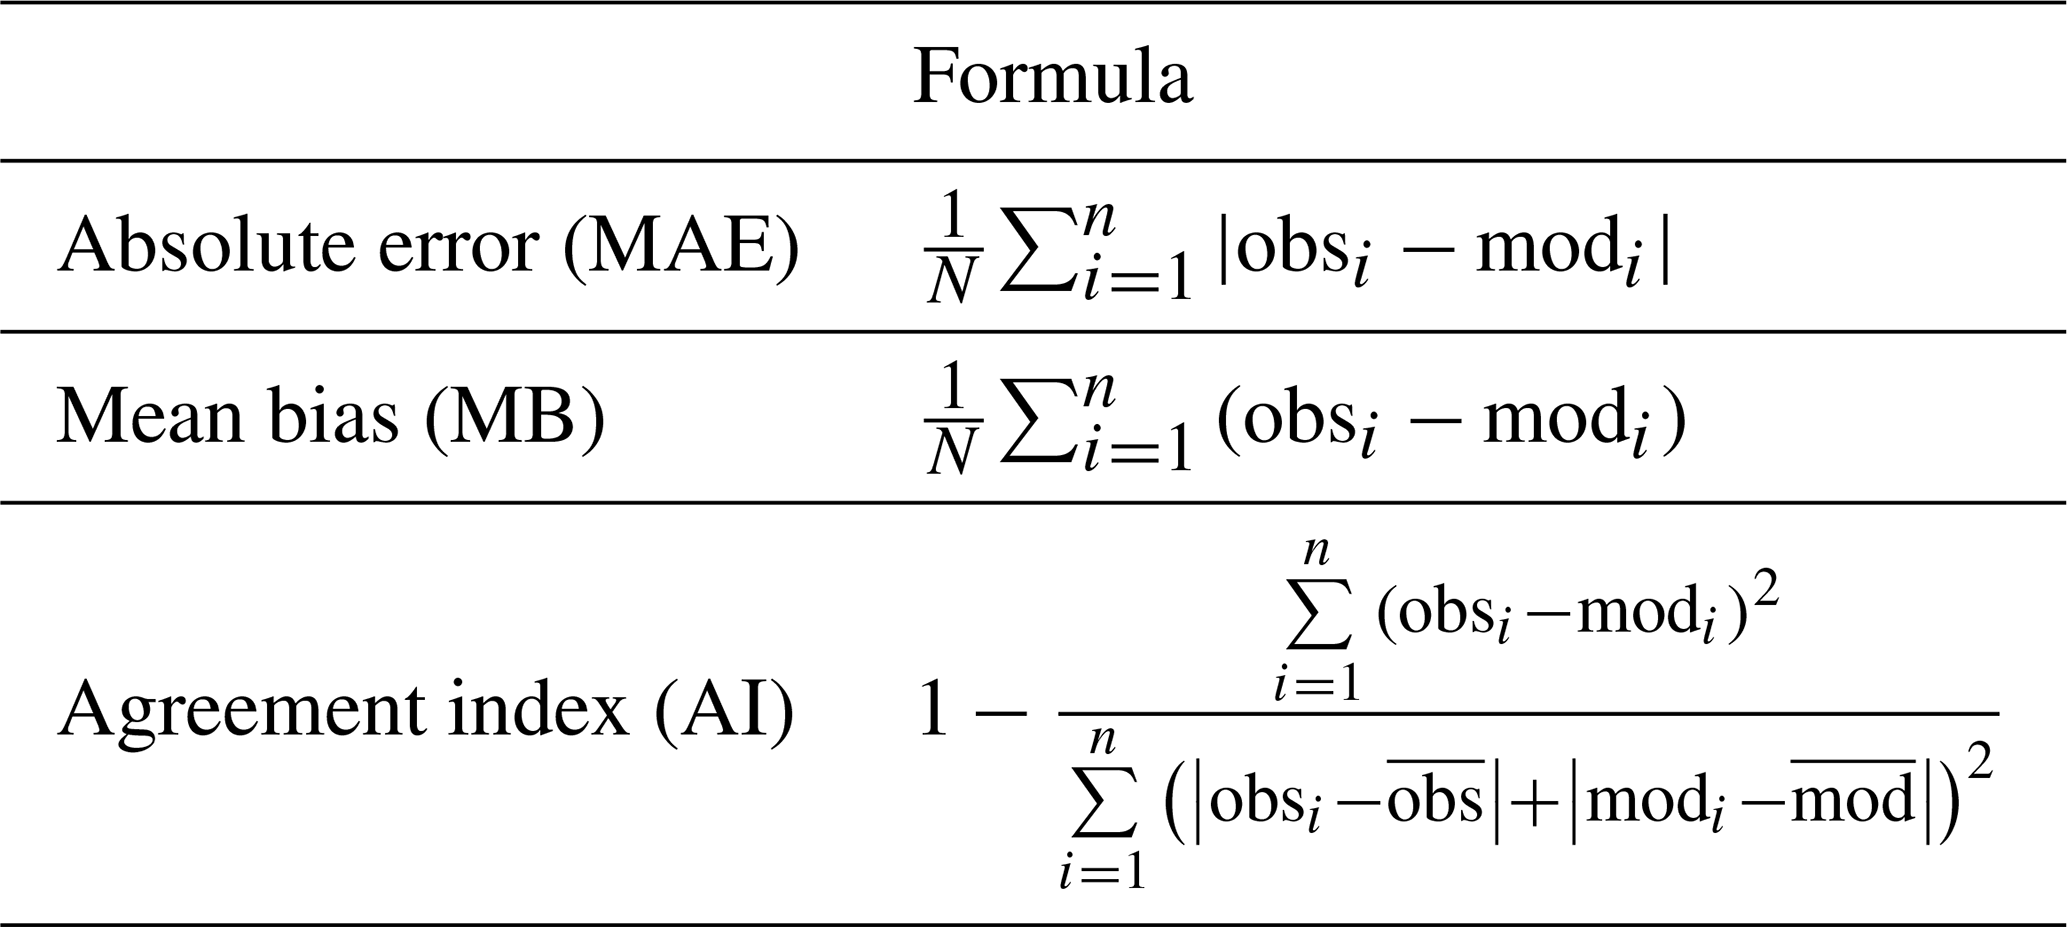
Within the 80 d period of simulation, there were several events, largely affected by the GPS-ZTD nudging. IOP16, the case study of this paper, is especially interesting given the large reduction of maximum precipitation (−49 %) induced by the GPS-ZTD nudging over the investigation area of Corsica in the course of 26 h. The remaining cases of the autumn 2012 period and analyses on the complete season are part of a series of modelling studies from our working group, including a PhD thesis by Caldas-Alvarez (2019). IOP16 is also given the important role of the local orographic and instability factors in triggering and maintaining convection rather than the large-scale upper level forcing. We observed in the seasonal simulations that cases occurring under a weak synoptic forcing are more impacted by the GPS-ZTD nudging given the strong correction of the lower to middle tropospheric humidity. We validate the model output against in situ humidity measurements, quantifying the mean absolute error (MAE), the mean bias (MB) and the agreement index (AI; see Table 1) adapted from González-Zamora et al. (2015). More details on these validation metrics can be found in the Appendix. The precipitation fields are validated against rain gauges and the evapotranspiration over land using spatial averages of the GLEAM product.
To investigate the impact of moisture variations on convection-related processes, such as atmospheric latent and potential instability conditions, several convective-related indices are examined. The CAPE, providing information about the latent instability, is obtained through the mean layer parcel method, as described in Leuenberger et al. (2010). The KO index is obtained as the difference in equivalent potential temperature (θe) between several levels of the atmosphere up to 500 hPa (Andersson et al., 1989); hence it bears information on potential instability and how the upper levels introduce atmospheric instability. Finally, the moisture flux is obtained by multiplying specific humidity and the horizontal wind following Ricard et al. (2012) but computed at each pressure level.
During IOP16 several convective systems affected regions in the north WMed, and rain gauge stations measured totals of up to 200 mm d−1 over southern France, 150 mm d−1 south of the western Alps and 250 mm d−1 over the Gulf of Genoa (250 mm d−1). Over Corsica, most precipitation occurred over the western side of the island for 12 h, with maximum precipitation intensities reaching 25 mm h−1.
In this section, we use observations from radiosondes, the evapotranspiration product GLEAM (see Sect. 2.1), CMORPH precipitation estimates, backward trajectories and the CTRL-7 simulation to understand the transport and distribution of moisture towards the WMed region. To validate the atmospheric moisture field of CTRL-7, in Table 1 we present the MAE, the AI and the MB of IWV between CTRL-7 and operational sounding measurements. In total, we selected 55 soundings from seven stations (blue squares within the 2.8 km simulation domain in Fig. 1), during the period 26 October at 00:00 UTC to 28 October at 00:00 UTC with a temporal resolution between 6 and 12 h. CTRL-7 has a MAE of 2.6 mm, a MB of 0.44 mm and AI of 0.89. These values are within the acceptable range and are of the same order as the root mean square error (RMSE) values found in other publications of IWV comparison between model data and GPS observations (Bock et al., 2016).

Figure 2CTRL-7 simulation of 500 hPa geopotential height in black isolines (gpdam), mean sea-level pressure in blue isolines (hPa) and equivalent potential temperature at 850 hPa on a colour-coded scale (K) on 26 October 2012 at 06:00 UTC (a), 12:00 UTC (b) and 18:00 UTC (c).
Table 1Mean absolute error (MAE), agreement index (AI) and mean bias (MB) of IWV between the model and the observations. The selected observations are all radiosondes available in the period 26 October at 00:00 UTC to 28 October at 00:00 UTC at the seven stations within the 2.8 km simulation domain (see red box in Fig. 1). All model values have been interpolated to the location of the radiosonde station from the nearest neighbours. The difference between the model and the station height never exceeded 30 m.
3.1 Synoptic conditions
The synoptic situation during the IOP16 was characterized by a cut-off low displacing westerly from the Iberian peninsula toward southern France between 25 October at 12:00 UTC and 27 October at 00:00 UTC (Thévenot et al., 2015). The upper levels showed an associated diffluent flow with a south-westerly to southerly circulation at the low levels over the western part of the basin. Such a synoptic situation is prototypical of heavy precipitation events (HPEs) in the WMed (Jansa et al., 2001; Duffourg and Ducrocq, 2011). Over the Tyrrhenian Sea on the morning of 26 October, the low-level flow induced convergence to the south of France. Figure 2 shows the geopotential height of the 500 hPa level (FI500), the pressure at mean sea level (PMSL) and the spatial distribution of θe at 850 hPa at 3 h of the event as represented by CTRL-7. Figure 2a shows the situation on 26 October at 06:00 UTC, when values of θe larger than 320 K are recorded. This moist and energetic southerly flow agrees with past publications referring to values of wet bulb temperature (θw) of over 16 ∘C (Duffourg et al., 2016; Martinet et al., 2017). A total of 6 h later (Fig. 2b), the cut-off low progressed toward the border of France and Spain, further deepening. On 26 October at 18:00 UTC, the high values of θe (>320 K) finally reached Corsica as well as extensive parts of the Tyrrhenian Sea (see Fig. 2c). Northerly cold winds terminated the event in the early morning of 27 October.
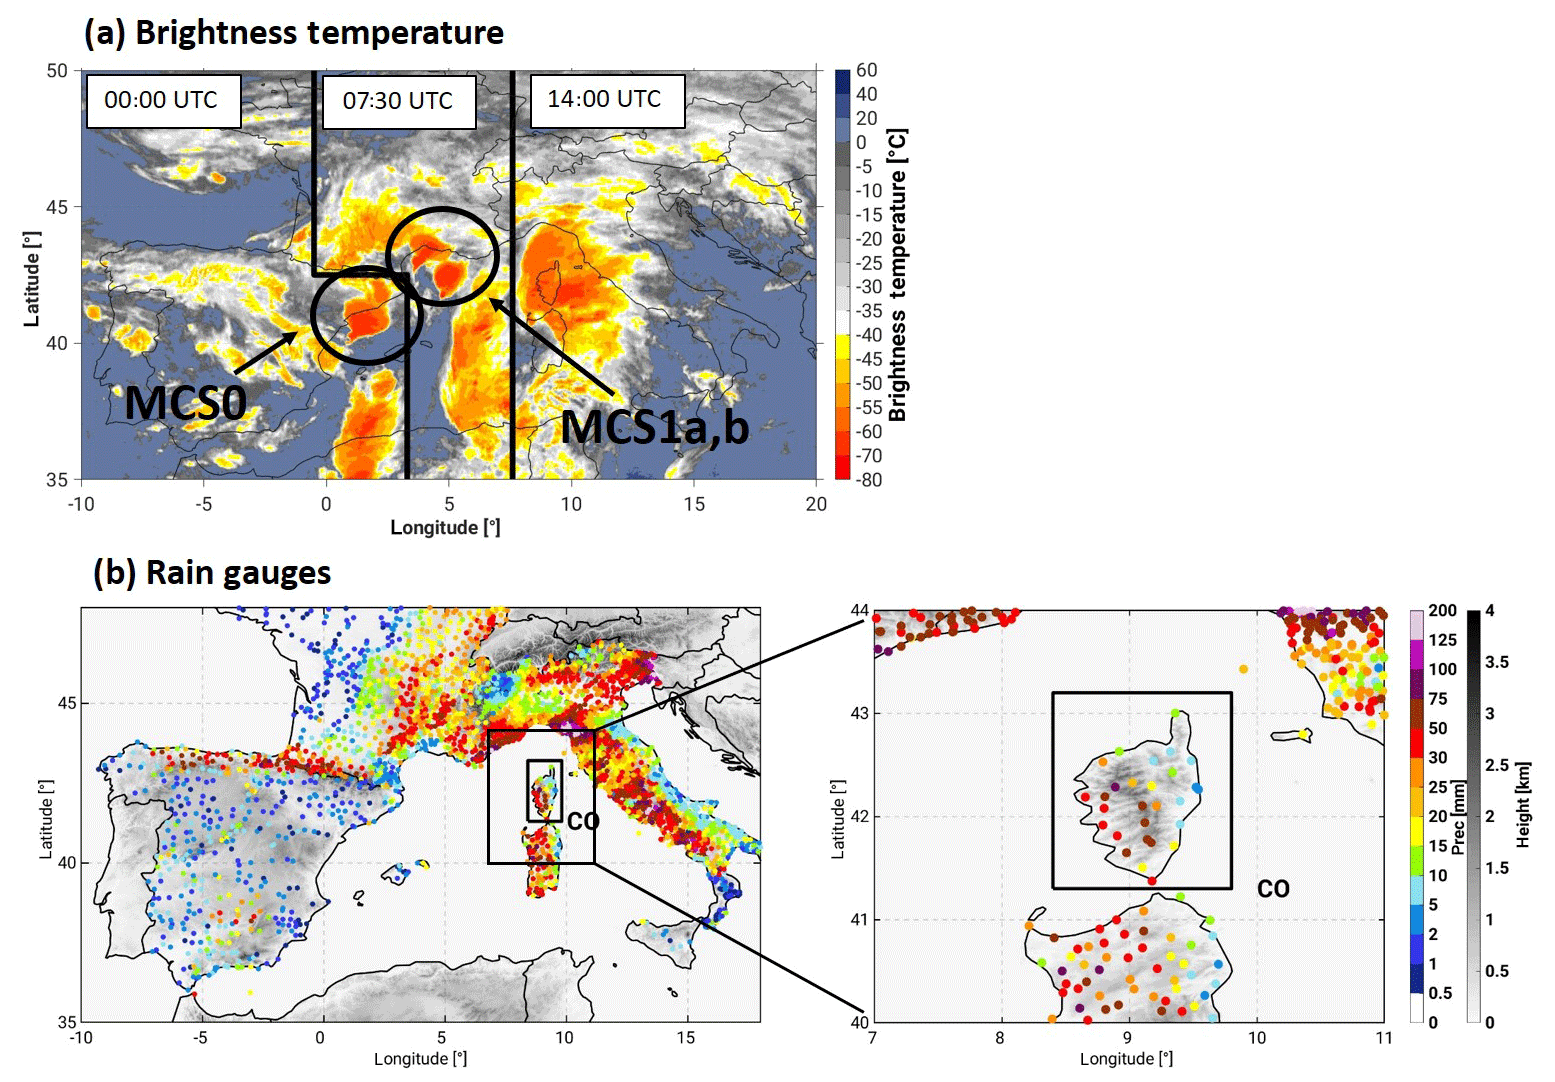
Figure 3Composite image of brightness temperature as measured by the SEVIRI instrument on 26 October 2012 at 00:00 UTC, at 07:30 UTC and at 14:00 UTC (a). Rain-gauge-accumulated precipitation over the complete WMed region between 26 October at 13:00 UTC and 27 October at 15:00 UTC and a close-up of the study region of Corsica (b). The accumulation period shown is the period of heavy precipitation over our main study region, the island of Corsica (black box), during this event.
3.2 Convective evolution over Corsica
In the early morning of 26 October convection triggered a mesoscale convective system (MCS), organized into a V-shape close to the north-eastern coast of Spain. This MCS was named MCS0 by Thévenot et al. (2015), and hereafter we adopt the same nomenclature. This is shown by Fig. 3a, depicting the convective cloud tops through brightness temperature images obtained with the Spinning Enhanced Visible Infrared Imager (SEVIRI) in a composite image at 00:00, 07:30 and 14:00 UTC. Northward, in the proximity of the Gulf of Lion, new convective cells triggered the formation of an MCS (MCS1) at 05:00 UTC that would split into two defined MCSs (MCS1a and MCS1b). The two split MCSs moved toward southern France and eastwards, respectively, in the course of 6 h (Duffourg et al., 2016). At the southern French region, the first MCS induced precipitation accumulation of over 70 mm. South of the Alps, the second split MCS brought values of over 90 mm (see Fig. 3b, showing the accumulated precipitation between 26 October at 13:00 UTC and 27 October at 15:00 UTC for the whole WMed). Another MCS developed in the Liguria–Tuscany region in north-western Italy around 07:30 UTC, named MCS2 as in Thévenot et al. (2015), not shown here. This area shows the highest precipitation rates of the event, with over 245 mm in 24 h (Duffourg et al., 2016). High convective cloud tops are also observed over the mid-Mediterranean west of Corsica at 07:30 UTC, as shown by the brightness temperature (Fig. 3a). This shows that convection is already happening offshore before the cells arrive at the island. At 14:00 UTC over the island, the offshore convection is reinforced by orographic lifting of the moist low-level air masses.
Over Corsica, which is our study region, precipitation total values reach maximum accumulation between 75 and 100 mm over the windward side of the mountains and between 50 and 75 mm over the mountain crests (see Fig. 3b). At the lee side of the mountain, the accumulated precipitation reaches 30 mm. The first convective cells occur over the island between 13:00 and 15:00 UTC on 26 October, forced by orographic lifting precipitating with intensities up to 11.5 mm h−1 over the windward side of the mountains (not shown). Between 26 October at 19:00 UTC and 27 October at 01:00 UTC, offshore convective systems arrive at the island (see Fig. 3a). This stage has the largest precipitation intensities of the event (up to 16 mm h−1, not shown), with precipitation falling mostly over the western part of the island, transitioning from the north at 21:00 UTC to the south at 23:00 UTC.
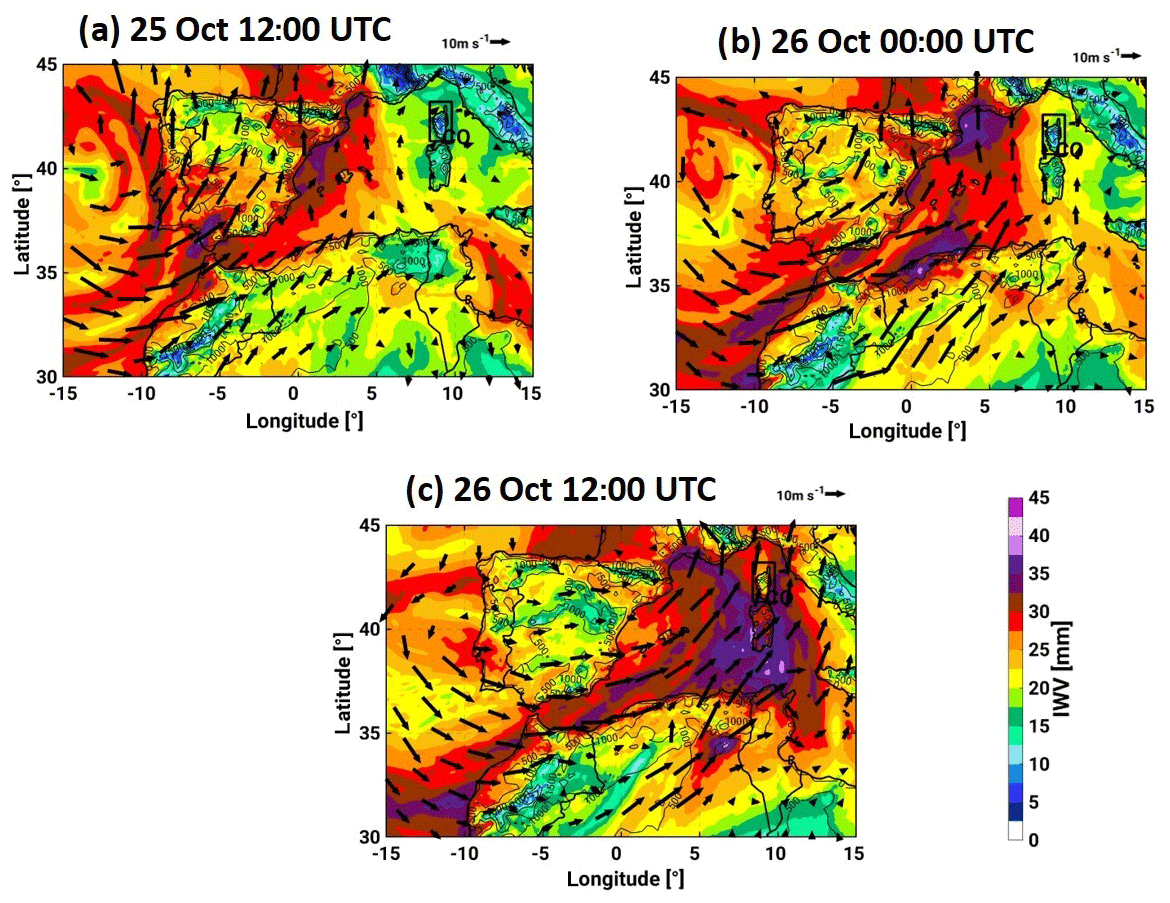
Figure 4Spatial distribution of IWV and winds at 850 hPa as represented by CTRL-7 on 25 October 2012 at 12:00 UTC (a), on 26 October at 00:00 UTC (b) and on 26 October 2012 at 12:00 UTC (c).
3.3 Atmospheric moisture transport
The transport of moisture feeding the convective systems over Corsica, southern France and north-eastern Italy arises from the action of the upper level pressure low through two mechanisms. First, the associated front swept atmospheric moisture from the Atlantic to the Mediterranean in the course of 36 h. Second, intense evaporation over the Mediterranean and north Africa between 25 October at 18:00 UTC and 26 October at 12:00 UTC was transported by the south-westerly flow. Figure 4 shows the CTRL-7 representation of IWV between 25 October at 12:00 UTC and 26 October at 12:00 UTC in the WMed at 3 h, with the simulated wind fields at 850 hPa. Given the overall good performance of CTRL-7 in representing IWV (Table 1), we use this simulation to study the moisture origins. On 25 October at 12:00 UTC (Fig. 4a), the front associated with the pressure low west of the Iberian peninsula carried large IWV amounts of up to 40 mm over the Strait of Gibraltar and along the southern Portuguese coast. Local areas in the Gulf of Lion (southern France) also showed values as large as 40 mm about 12 h before precipitation initiation. On 26 October at 00:00 UTC, the Atlantic moisture is already located over the Algerian coast and the Gulf of Lion (see Fig. 4b). Along the Algerian coast, these high moisture amounts on 26 October at 00:00 UTC were a combination of moisture pushed by the low-pressure system from the Atlantic and moisture evaporated from north African land. The large moisture amount present over the Gulf of Lion originates partly from the Mediterranean Sea due to evaporation along the Spanish eastern coast, as introduced in Thévenot et al. (2015) and Martinet et al. (2017). At the time of precipitation initiation over Corsica (26 October at 12:00 UTC), vast IWV amounts surrounded the western and southern coasts of the island (see Fig. 4c). These large IWV values (∼ 40 mm) surrounded the island 4 h prior to precipitation initiation. We have additionally validated this moisture transport against the Moderate Resolution Imaging Spectroradiometer (MODIS) daily product, but we do not show it here given the presence of extensive cloud cover during the period hampering the quantitative validation. A visual comparison is included in the Supplement (Fig. S1).
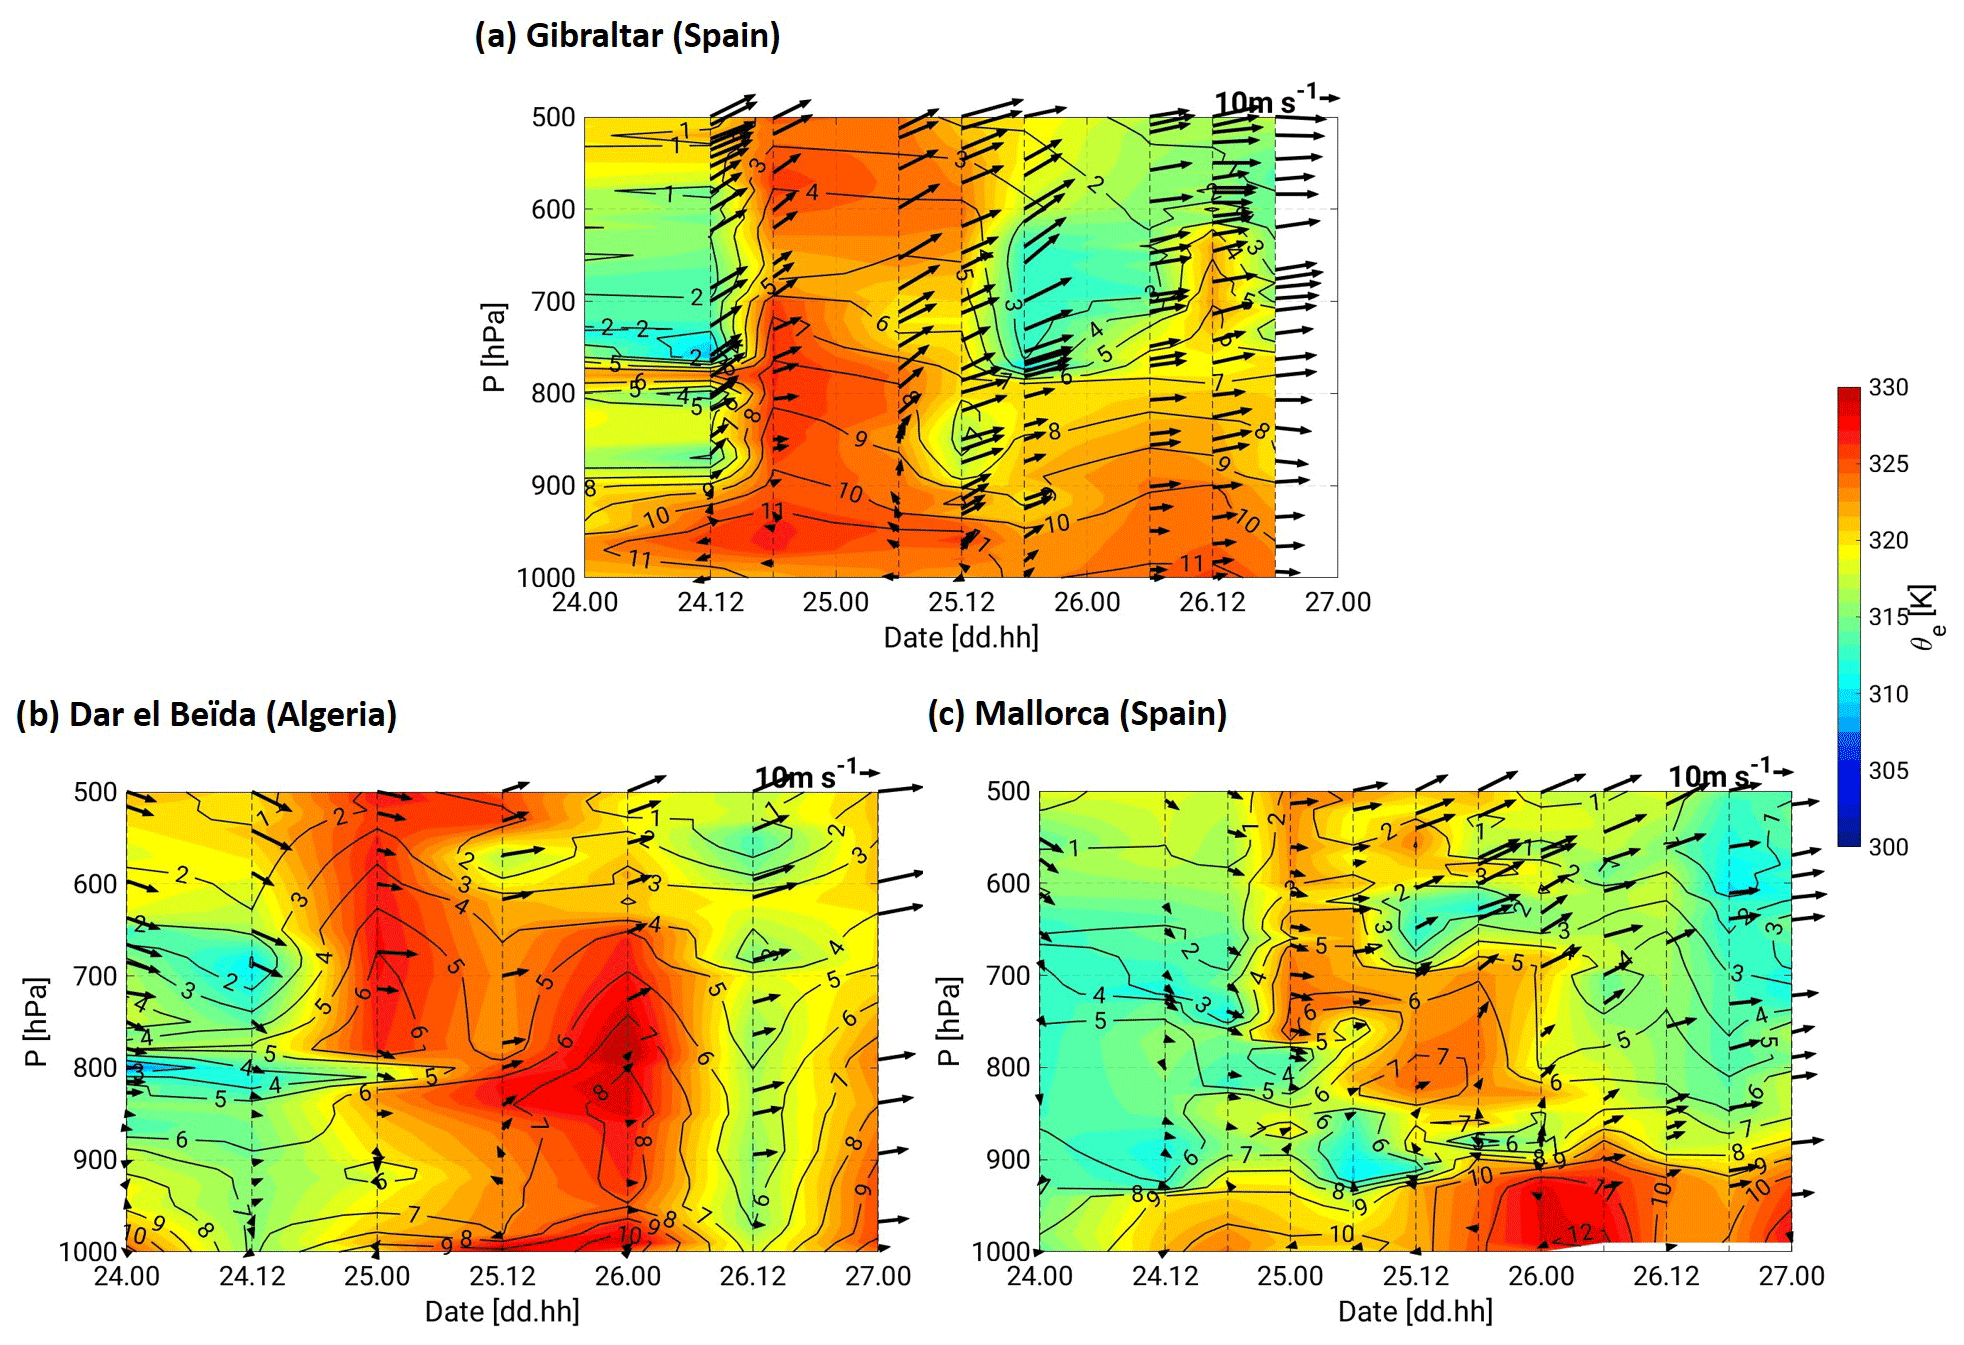
Figure 5Time–height cross-sections at Gibraltar (a), Dar el Beïda (b) and Mallorca (c) between 24 October at 00:00 UTC and 27 October at 00:00 UTC. The colour shading stands for equivalent potential temperature (θe), the contours denote specific humidity and the arrows show the direction and speed of horizontal wind at the stations. The location of the radiosondes can be seen in Fig. 1.
To better assess the timing and vertical stratification of the moisture transport the time–height cross-sections of equivalent potential temperature (θe), specific humidity and horizontal winds measured by radiosondes between 24 October and 27 October at 00:00 UTC at Gibraltar (Spain), Dar el Beïda (Algeria) and Mallorca (Spain) are shown in Fig. 5. The cross-section of Gibraltar (Fig. 5a) shows high specific humidity values throughout the complete atmospheric column (3 g kg−1 at 500 hPa and 11 g kg−1 at 950 hPa) between 24 October at 18:00 UTC and 25 October at 06:00 UTC, in agreement with the simulated IWV in Fig. 4a. Further east, over Dar el Beïda (Algeria; see Fig. 5b), high specific humidity and θe values are present between 500 and 800 hPa on 25 October at 00:00 UTC. The high humidity (6 g kg−1) and θe (325 K) at this time come from the arrival of the moisture swept from the Atlantic. At lower levels (800 to 1000 hPa), high humidity and θe only happen at the station 24 h later, on 26 October at 00:00 UTC. This is because below 800 hPa, the mesoscale circulation has a strong south–south-easterly component (Duffourg et al., 2016; Martinet et al., 2017), which delays the arrival of the moist air masses. This can also be seen in the wind direction over Dar el Beïda on 25 October at 12:00 UTC below 850 hPa, where a south-easterly circulation takes place. Over Mallorca, a similar vertical distribution can be observed (see Fig. 5c.). On 25 October at 00:00 UTC, specific humidity values as high as 6 g kg−1 exist between 500 and 800 hPa. A period of 12 h later, the high θe and specific humidity can be found in the layer 700 to 800 hPa due to the delayed arrival of moisture at low levels. Finally, on 26 October at 00:00 UTC high θe and specific humidity are located in the marine boundary layer over Mallorca.
To further understand the extent of the moisture contribution feeding convection from north Africa (NA; see Fig. 1), Fig. 6 shows the mechanisms of moisture evaporation and transport. Figure 6a shows the spatial distribution of hourly evapotranspiration simulated by CTRL-7 on 25 October at 12:00 UTC and the vertical updrafts of wind speed larger than 0.25 m s−1. Hourly evaporation rates of 0.3 mm h−1 took place at the southern part of the NA box (north Africa) and of 0.2 mm h−1 over the Algerian Atlas (northern part of the NA black box). The moisture gathers in the PBL for several days until the first convective updrafts take place over the area on 25 October at 18:00 UTC. The radiosondes over Dar el Beïda (Fig. 5b) show the accumulation of moisture in the lower atmosphere (about 10 g kg−1 close to 1000 hPa on 25 October at 12:00 UTC). Vertical transport of humidity is promoted by convection during the evening of 25 October. On 26 October at 06:00 UTC, intense convective activity takes place over the Mediterranean Sea between the coast of Algeria and the islands (Corsica and Sardinia). This further promotes the moisture uptake from the sea, aided by the intensified drag of low-level winds associated with convection to ensure mass continuity (Schneider et al., 2010; Peixoto and Oort, 1992).

Figure 6Spatial distribution of evapotranspiration (colour shading) and vertical updrafts with vertical wind speeds larger than 0.25 m s−1 (blue contours) simulated with CTRL-7 on 25 October at 12:00 UTC (a). The black boxes denote the regions of intense evaporation. (b) Spatially averaged daily evapotranspiration (GLEAM and CTRL-7) and daily precipitation (CMORPH and CTRL-7) over north Africa (black box) between 1 September 2012 and 2 November 2012. The CTRL-7 precipitation has been upscaled to the coarser grid of CMORPH (0.0727∘). Likewise, CTRL-7 evapotranspiration has been upscaled to the coarser grid of GLEAM of 0.25∘. (c) Lagrangian backward trajectories obtained with the HYSPLIT model, starting on 26 October 2012 at 18:00 UTC (initiation of the event over Corsica) going back 24 h.
Figure 6b represents the evapotranspiration anomaly over north Africa, showing the temporal evolution of spatially averaged precipitation measured by CMORPH and simulated by CTRL-7 and of evapotranspiration as shown by GLEAM and CTRL-7. CMORPH shows spatially averaged daily precipitation over 15 mm d−1 over north Africa on the 19 and 20 October. Precipitation during these days coincided with the IOP15 of HyMeX during which a large band of south to north precipitation impacted regions of Africa, eastern Spain and southern France (Pantillon et al., 2015). CTRL-7 represents this precipitation but overestimates the amount. As a consequence of the precipitation event, daily evapotranspiration over the area reached daily spatial averages of 1.4 mm as shown by GLEAM, lasting for 7 d, well above the mean evapotranspiration values during this season (0.5 mm). Despite differences in the magnitude of evaporation, COSMO-CLM captures this period of anomalous evapotranspiration well.
Figure 6c shows the 24 h backward trajectories obtained with the HYSPLIT model, using reanalysis data from the GDAS model (see Sect. 2.1) with a resolution of 0.5∘. The IWV distribution simulated by GDAS for this event has been visually compared to that of COSMO-CLM with a good agreement, ensuring an analogue description of the large-scale moisture flow for this event. We initialize the trajectories in a 3∘ × 2.5∘ box, at a height of 4000 , over the study region CO on 26 October at 18:00 UTC. The trajectories confirm the moisture transport from northern Africa, as they are located over the intense evapotranspiration area, shown by the black NA box, on 25 October at 18:00 UTC. Two sets of trajectories are distinguishable. The first set (ellipse A in Fig. 6c) shows the trajectories over the Moroccan shore on 25 October at 18:00 UTC. These trajectories travel at heights between 2000 and 3000 , as shown by the vertical section on the bottom of Fig. 6c. The second set (ellipse B in Fig. 6c) shows trajectories located over northern Algeria on 25 October at 18:00 UTC. They travel at a lower height (< 1000 m) in the well mixed diurnal layer. Further trajectory analysis can be found in the Supplement of this paper.
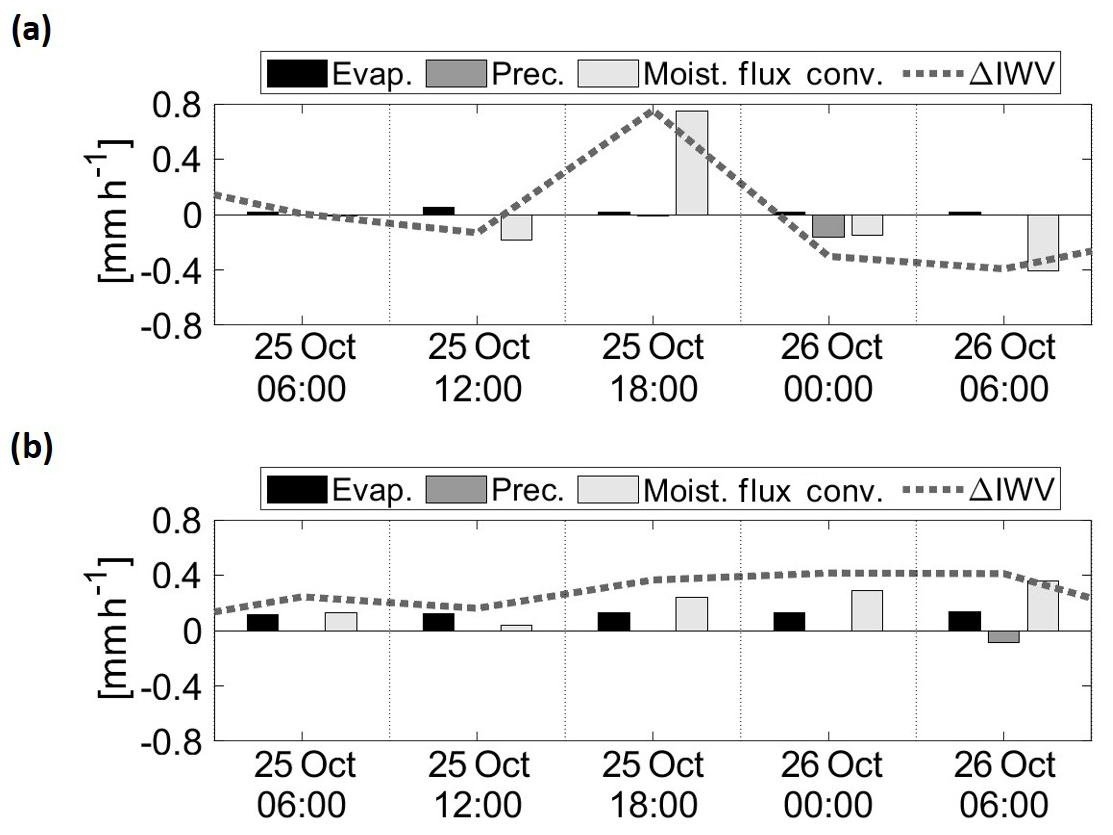
Figure 7Temporal evolution of the moisture budget terms, variation of IWV (ΔIWV), moisture flux convergence, evapotranspiration and precipitation. Hourly values are given. The spatial averages are performed over the investigation areas NA (a) and MED (b). The values are obtained from CTRL-7.
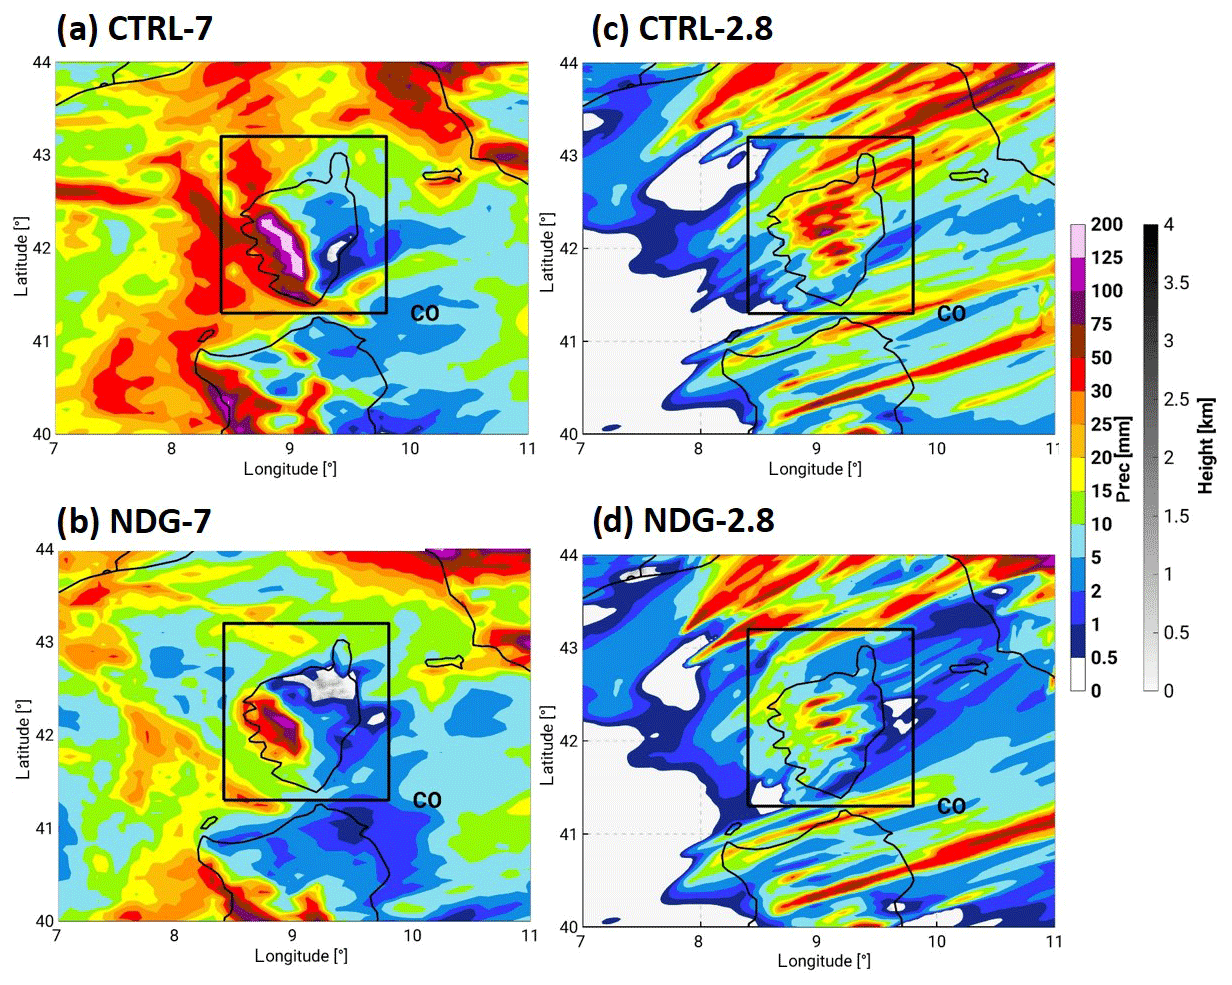
Figure 8COSMO-CLM-accumulated precipitation over Corsica between 26 October at 13:00 UTC and 27 October at 15:00 UTC, i.e. during the period of precipitation over the island.
Figure 7 shows the temporal evolution of the spatially averaged moisture budget terms over the investigation areas NA and the Mediterranean (MED; see Fig. 6). The moisture budget terms have been obtained as in Lamb et al. (2012). Precipitation is considered a moisture sink, whereas evapotranspiration is a source. Moisture flux convergence (MFC) can be a sink or a source depending on its sign. The temporal evolution over NA (Fig. 7a) shows that on 25 October at 12:00 UTC the contribution of the evaporation to IWV reaches 0.1 mm h−1, due to the soil in NA that is wetter than usual and the intense solar radiation. This moisture contribution is almost as large as the evaporation from the Mediterranean Sea over the MED area (0.15 mm h−1). On 25 October at 18:00 UTC an increase in IWV takes place, reaching 0.8 mm h−1 over NA (Fig. 7a) due to strong MFC associated with the Atlantic moisture brought by the south-westerly flow. Over MED (Fig. 7b) we can see a stable evaporation during the period as well as an enhanced MFC, especially after 25 October at 18:00 UTC. These two contributions build up overseas until 26 October at 06:00 UTC when convection triggers.
4.1 Precipitation
The COSMO-CLM simulations were able to represent the event over the island in both the 7 and the 2.8 km configurations at the right time. CTRL-7 performed well in representing the location of maximum precipitation over the windward slope of the Corsican mountains (see Figs. 8a and 3b). CTRL-2.8 showed a worse representation of the location of the maximum as it mainly shifted it towards the crests of the mountain and also to the lee side (see Fig. 8c), though it represented the amount better than CTRL-7. CTRL-2.8 represented more isolated precipitation structures, located over the mountain crests. Representing more localized structures is a well identified effect of reaching convection-permitting resolutions (Chan et al., 2012; Fosser et al., 2016).
The GPS-ZTD nudging induced a decrease in the accumulated totals for both model resolutions. In the case of NDG-7 this occurred over the windward side of the mountain, improving the agreement with the observations (Fig. 3b). NDG-2.8 showed the same location of the maxima as CTRL-2.8, with too large a reduction, obtaining values below 20 mm.
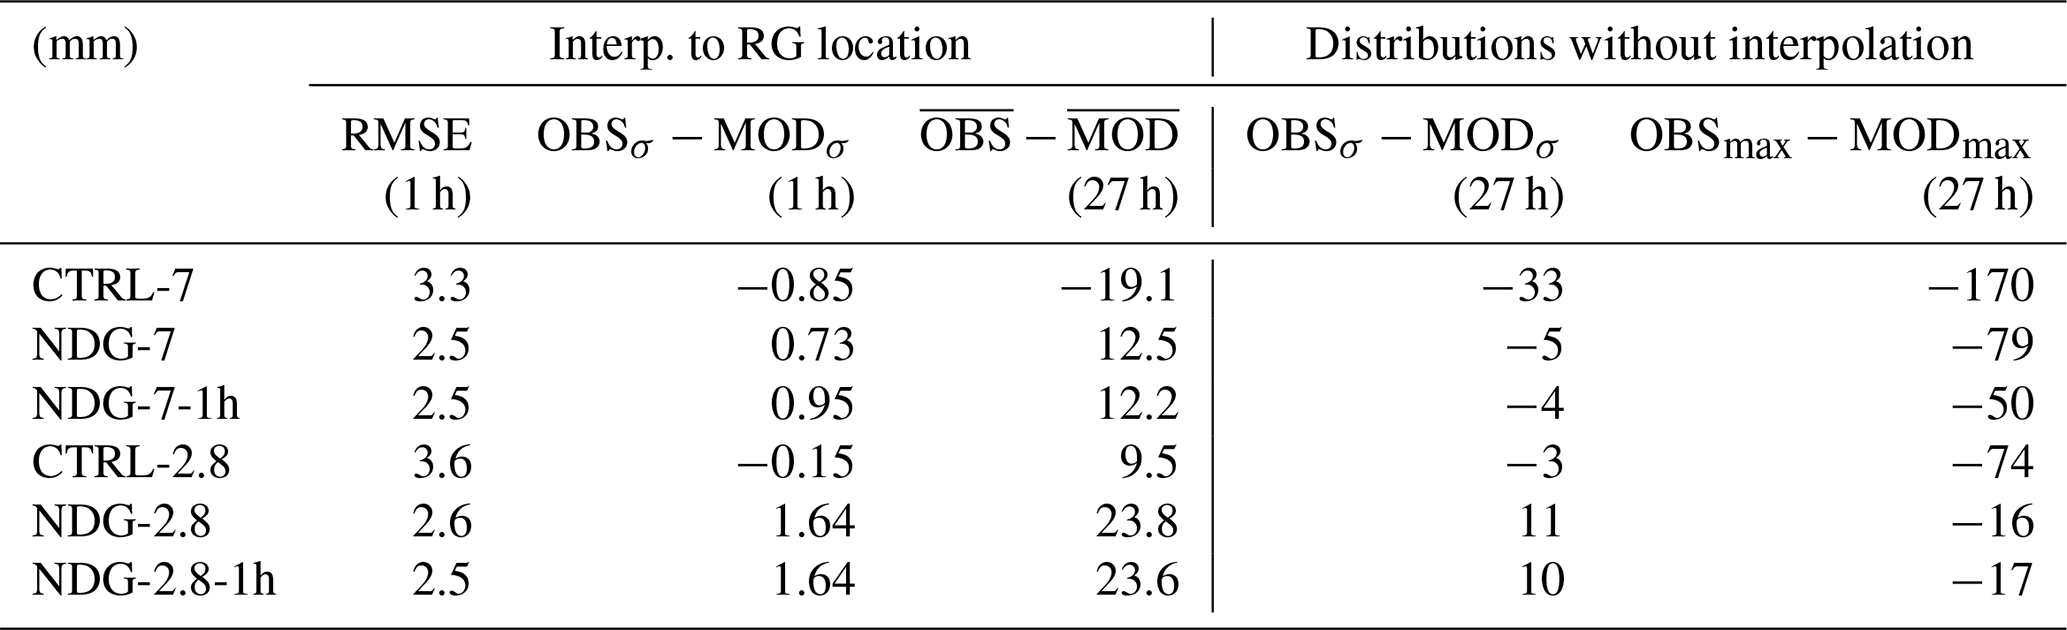
Table 2Model precipitation validation against rain gauges (RGs). COSMO-CLM has been interpolated to the location of the RG for the first three metrics: root mean square error (RMSE), hourly standard deviation (SD) difference (OBSσ−MODσ) and spatially averaged differences (). In contrast, all precipitation values simulated by COSMO-CLM over the island of Corsica are used in the last two metrics, SD difference (OBSσ−MODσ) and difference of maximum precipitation (OBSmax−MODmax). The temporal resolution of each metric is given in brackets. The description of the validation metrics can be found in the Appendix.

To validate our simulations against rain gauges quantitatively, Table 2 shows the root mean square error (RMSE), the hourly standard deviation (SD) difference (OBSσ−MODσ), the spatially averaged differences (), the accumulated precipitation SD difference (OBSσ−MODσ) and the difference of maximum precipitation (OBSmax−MODmax). A description of the metrics can be found in the Appendix. The results show an overestimation of maximum and spatially averaged precipitation by CTRL-7 in excess of 185 and 10.4 mm, respectively, as well as of the SDs (−32 mm). The RMSE for hourly precipitation was 3.1 mm. The reduction caused by the GPS-ZTD nudging was beneficial for the representation of maximum accumulated precipitation in NDG-7, now in excess of 58 mm compared to the observations, of the accumulated precipitation SD (−0.7 mm) and of the RMSE (2.6 mm). CTRL-2.8 showed a good performance, with better values than CTRL-7 for maximum (excess of 3 mm) and spatially averaged accumulated precipitation (14.6 mm), as well as the SD differences, with, however, the same RMSE (3.1 mm). The GPS-ZTD dried the NDG-2.8 simulations excessively, obtaining worse scores. Only the RMSE was improved (2.7 mm), similarly to NDG-7.
4.2 Atmospheric moisture
As introduced in Sect. 3, we assess the accuracy of model moisture outputs and the impact of nudging GPS-ZTD, comparing independent humidity measurements from radiosondes. The reference run, CTRL-2.8, has MAE values of 2.6 mm, with MB of 0.35 mm and AI of 0.90. These values are similar to those of CTRL-7, albeit a slight improvement of the MB and the AI.
Nudging GPS-ZTD data improves the scores further, bringing the MAE of IWV to 1.9 mm for NDG-7 and NDG-2.8 and the MB to −0.18 and −0.16 mm, respectively. In this sense, both the 7 and the 2.8 km simulations show an improvement.
Figure 9a shows the spatially averaged temporal evolution of IWV over the study region CO. The hours prior to precipitation initiation (26 October at 13:00 UTC) were characterized by an IWV increase starting on 26 October at 00:00 UTC. All simulations showed this, though the IWV amount over CO for NDG-7 and NDG-2.8 was 5 mm higher than for CTRL-7 and CTRL-2.8. This was due to simulated precipitation over the island until the night of 24 October in the NDG runs, hence inducing a much wetter boundary layer (not shown). By 26 October at 10:00 UTC, an intense moisture increase takes place over the island. As described in Sect. 3.3, this is the time when the Atlantic, Mediterranean and African moisture reached CO. At this time, all simulations show the same mean IWV (27 mm), which lasts for 4 h. Given that no GPS stations are located over Africa or the Mediterranean Sea, the south-westerly moisture is only weakly impacted by the GPS-ZTD nudging during these first 4 h of the event over CO. On 26 October at 14:00 UTC, the CTRL and NDG runs start to diverge and between 26 October at 16:00 UTC and 27 October at 06:00 UTC, NDG-7 and NDG-2.8 show ca. 4 mm less than their CTRL counterparts do. This is due to the impact of the GPS measurements over the island.
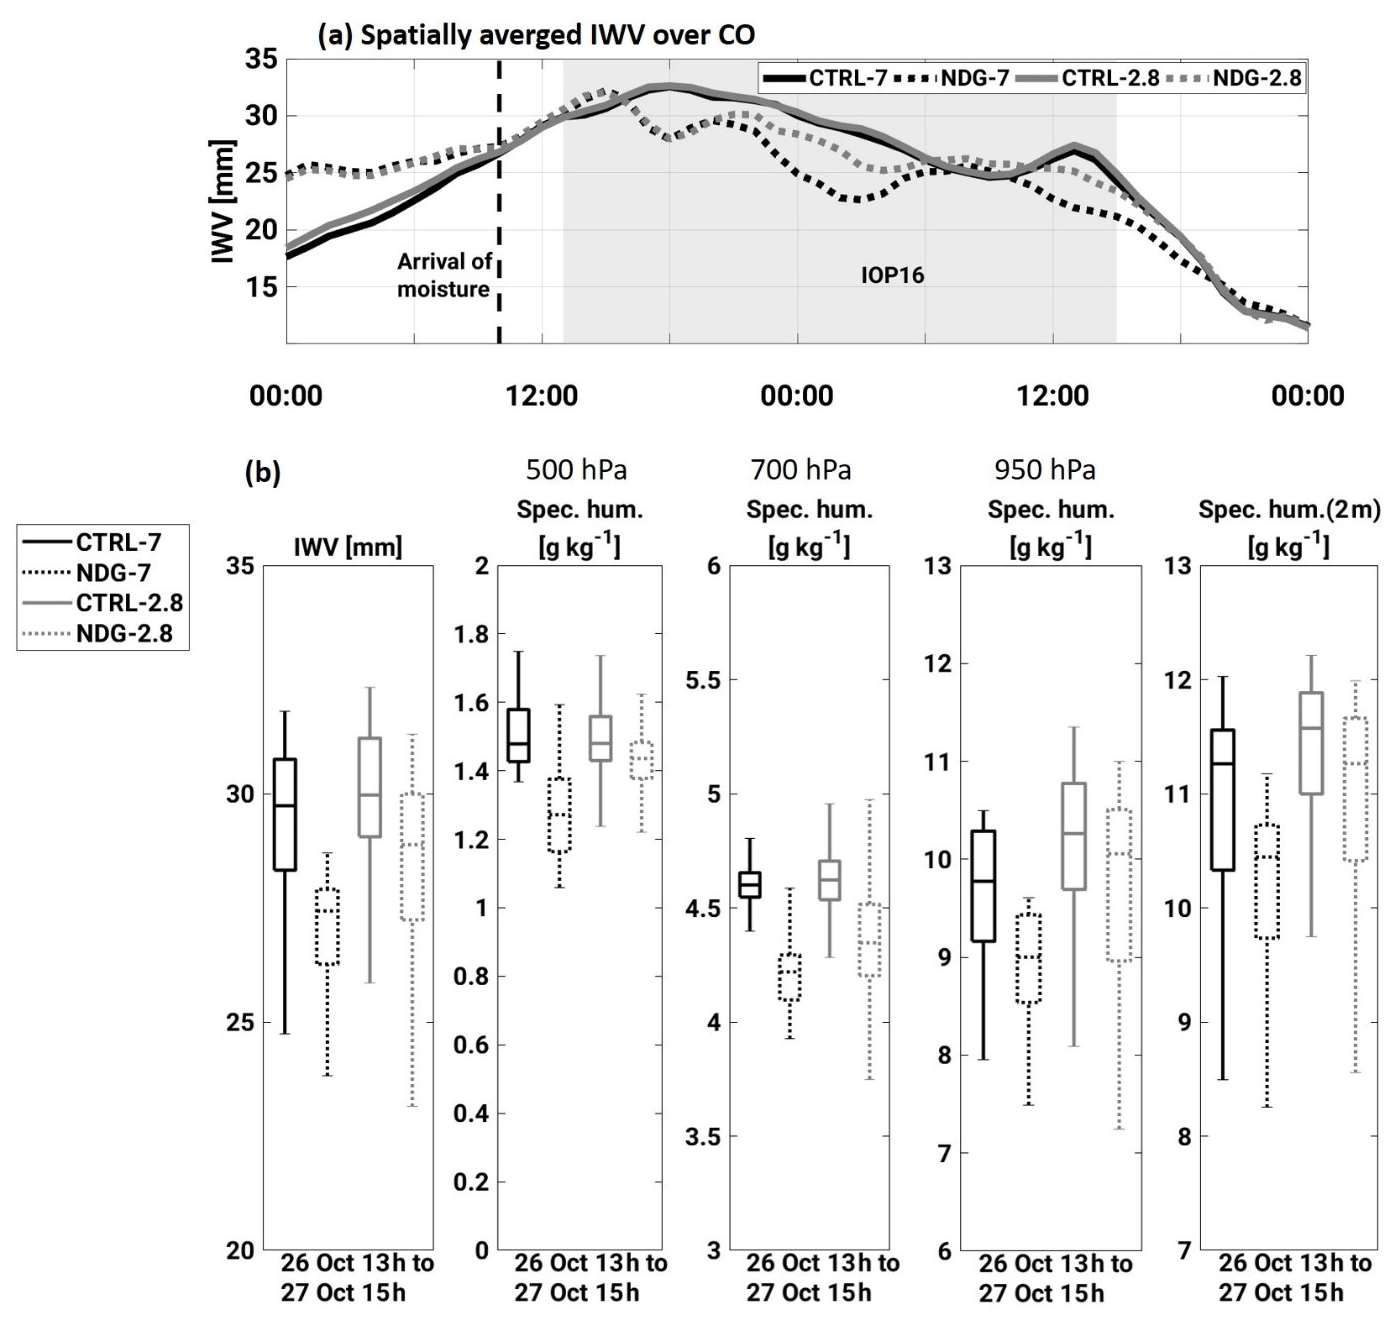
Figure 9Spatially averaged IWV for all simulations during the event. The area for averaging is shown in Fig. 1 (CO), and the model output has been upscaled to a common coarser grid. The period shown is 26 October at 00:00 UTC to 28 October at 00:00 UTC. (b) Box-and-whisker plots showing the median, the 25th and 75th percentiles and the extreme values of IWV and specific humidity at 500, 700 and 950 hPa and at 2 m height. The box and whiskers are obtained from the distribution of values for the quantities shown between 26 October at 13:00 UTC and 27 October at 15:00 UTC over the study region CO.
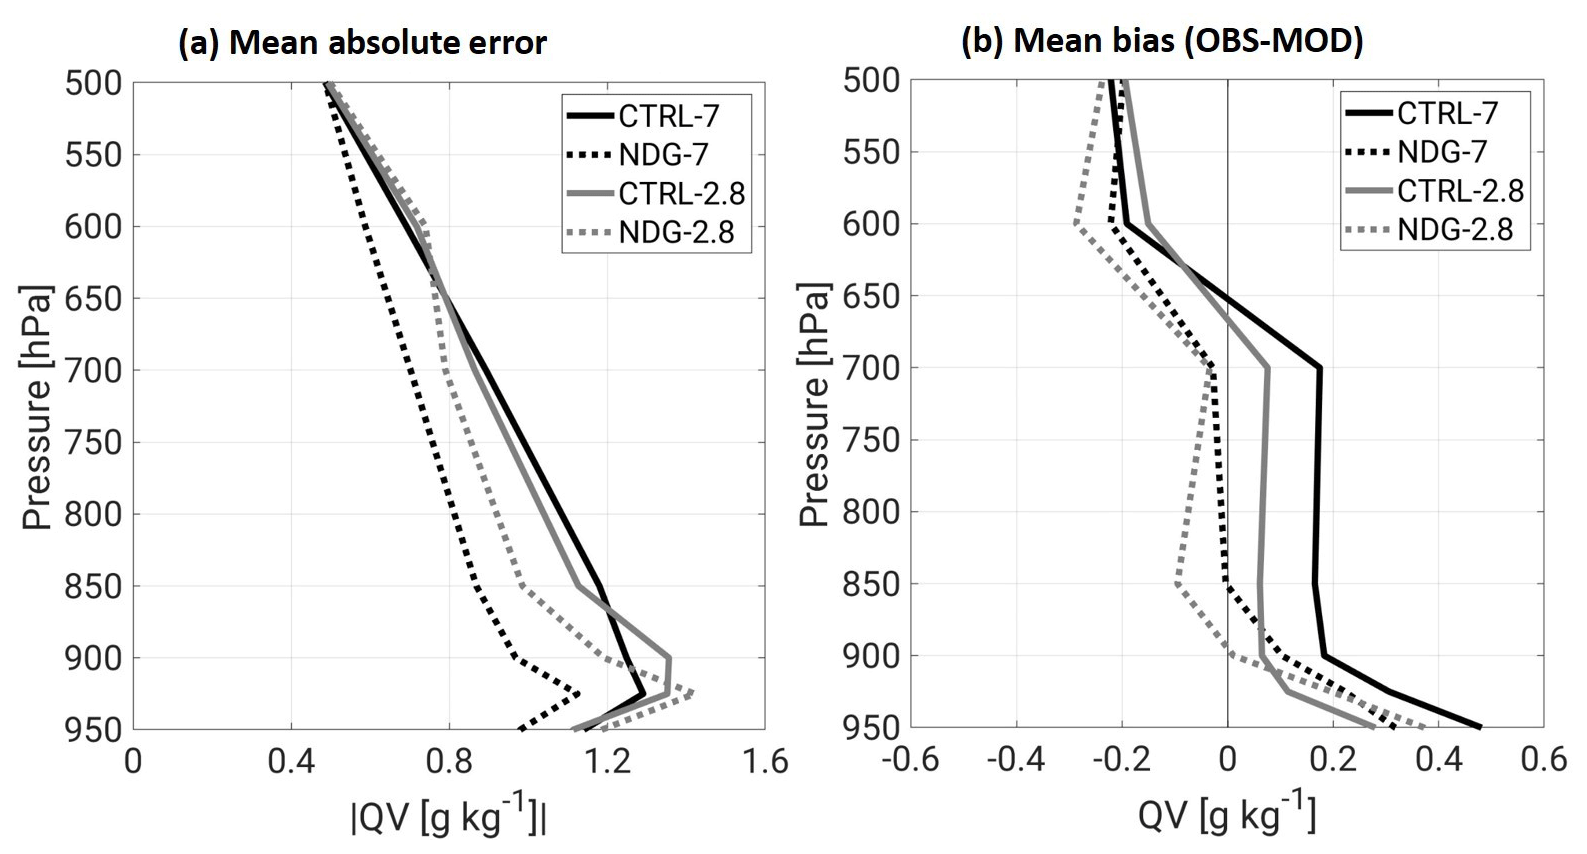
Figure 10Validation of the model representation of the vertical distribution of specific humidity quantified by the mean absolute error (a) and the mean bias as the OBS-MOD (b). All model values are validated against the radiosondes available in the period 26 October at 00:00 UTC to 28 October at 00:00 UTC at the seven stations within the 2.8 km simulation domain (see red box in Fig. 1). All model values have been interpolated to the location of the radiosonde station from the nearest neighbours, and the vertical specific humidity values have been interpolated to 11 pressure levels between 950 and 500 hPa. No values are shown below 950 hPa given the lack of available data for several stations below this level.
To understand at which levels the humidity reduction was most effective, Fig. 9b shows box-and-whisker plots between 500 hPa and the surface. At 500 hPa, a specific humidity reduction of 0.2 g kg−1 took place for median values in the 7 km simulation (−13 %). The decrease was weaker in the 2.8 km grid, with a reduction of 0.05 g kg−1 (−3 %). At 700 hPa the specific humidity decrease was about 0.4 g kg−1 for median values (−8 %) for both resolutions. At 950 hPa, the humidity reduction was larger in the 7 km (−8 %) than in the 2.8 km run (−2 %). Finally, at 2 m height the reduction was −7 % for 7 km and −3 % for 2.8 km.
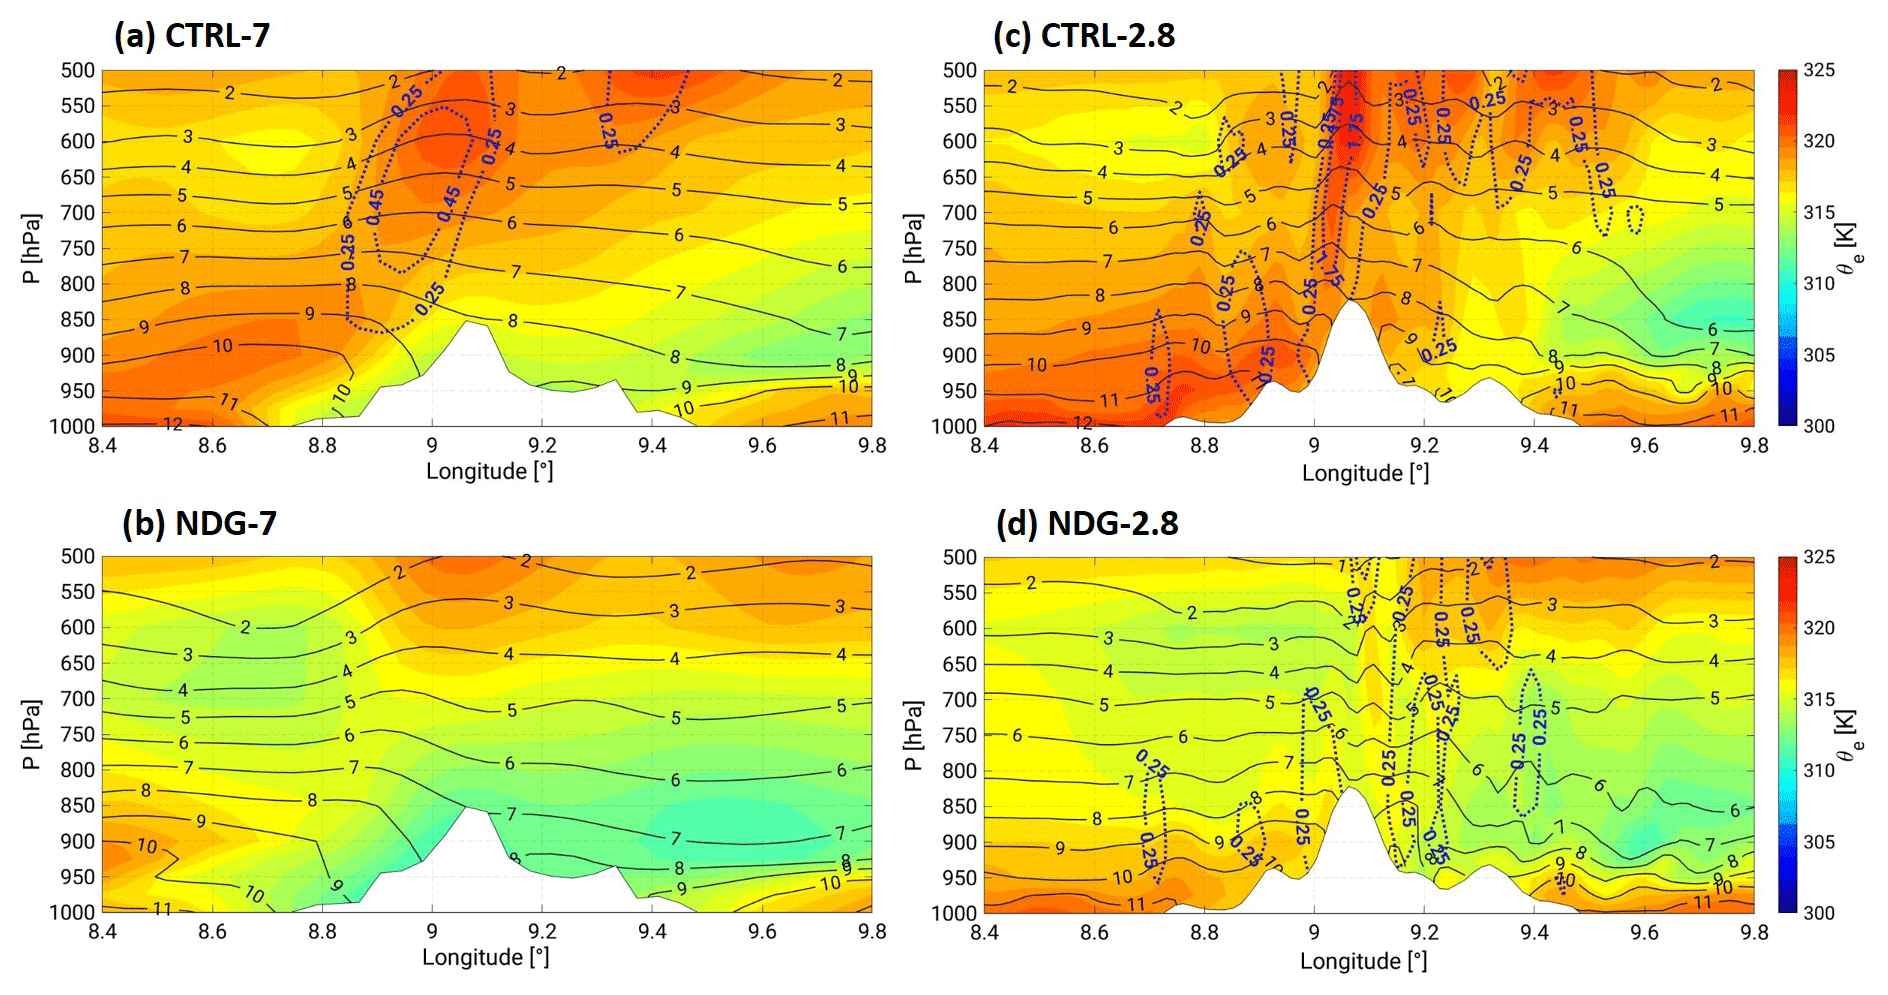
Figure 11Vertical cross-sections along the mean wind direction between 700 and 1000 hPa (see transect in Fig. 1) on 26 October at 17:00 UTC. The selected hour corresponds to the first precipitation maximum represented over Corsica by the COSMO-CLM simulations. The position of the transect is represented in Fig. 1. The specific humidity values are represented by black contour lines; the colour shading represents equivalent potential temperature (θe). Vertical wind speed is represented by dashed blue contours, where isolines start at 0.25 m s−1.
Figure 10 represents the MAE and the MB of specific humidity profiles between 500 and 950 hPa for the same set of radiosondes. The period of validation is 26 October at 00:00 UTC to 28 October at 00:00 UTC, and the area is larger than that of Corsica. This is done to assess the overall performance of the model with as many radiosondes as possible (Fig. 1). Between 600 and 950 hPa, the MAE of specific humidity of CTRL-7 and CTRL-2.8 is between 0.7 g kg−1 (600 hPa) and 1.3 g kg−1 (925 hPa). The MB of the profile shows that this error comes from an underestimation of specific humidity by COSMO-CLM below 650 hPa, which is largest below 900 hPa. Over 650 hPa, the simulations overestimated the specific humidity. The GPS-ZTD nudging improves the MAE of the humidity profile between 650 and 925 hPa for both resolutions. The MAE of NDG-7 is now within the range 0.6 g kg−1 (600 hPa) and 1.1 g kg−1 (925 hPa), and the improvement reaches the 950 hPa level. For NDG-2.8, the MAE is between 0.8 g kg−1 (650 hPa) and 1.2 g kg−1 (900 hPa), but an improvement is only achieved down to 925 hPa. The MB is closer to zero in the same atmospheric layers (650 to 900 hPa) for both resolutions, albeit showing better results for the 7 km simulation. The correction for LFT moisture is larger in the 7 km run than in the 2.8 km run, probably due to the larger number of observations included in the nudging in this simulation because of larger simulation domains (see Fig. 1). These values of the MAE and mean bias are of the same order as the validation of the RMSE of specific humidity profiles between reanalyses data and lidar measurements from Duffourg et al. (2016).
Below 900 hPa, the GPS-ZTD nudging was not able to correct the dry bias of the model sufficiently. Both CTRL runs show difficulties in representing the steeper gradient shown by the radiosondes, and the correction induced by the GPS-ZTD nudging is not enough to moisten the PBL sufficiently during this event. Overall, COSMO-CLM shows a good performance in representing the integrated atmospheric moisture fields and humidity over 900 hPa at both model resolutions. The 2.8 km simulation was initially more accurate, but the nudging brings both to similar accuracy values.
4.3 Instability reduction and increase of free tropospheric mixing
The two affected processes that exerted the largest control on precipitation reduction were atmospheric latent instability reduction and dry air entrainment, both investigated in this section. The changes in these two processes start to play a role immediately after the first hour of large IWV differences, i.e. after 26 October at 16:00 UTC. This is the case for both the 7 and the 2.8 km simulations.
Figure 11 shows the vertical cross-sections of equivalent potential temperature (θe), specific humidity and the wind along the direction of the mean horizontal wind (purple transect in Fig. 1) over the island on 26 October at 17:00 UTC. CTRL-7 and CTRL-2.8 show θe values over 322 K from the surface up to 500 hPa, showing the upward transport of moist low-level air masses. After applying the GPS-ZTD nudging, NDG-7 shows reduced values of θe (310 K) close to the ground (see 2 m specific humidity in Fig. 9b) over the island and at 700 hPa (312 K), showing a less favourable environment for convection development. The 2.8 km simulation, for its part, showed a weak reduction of θe at the windward side of the mountain (316 K) as a result of the GPS-ZTD nudging compared to the NDG-7. However, at the lee side between 600 and 900 hPa, θe is reduced in NDG-2.8 by −8 K (compared to CTRL-2.8, 318 K); this is shown in Fig. 11c and d. The consequence for the updrafts was a change in their timing location and intensity with less penetrating updraughts (see Fig. 11d).
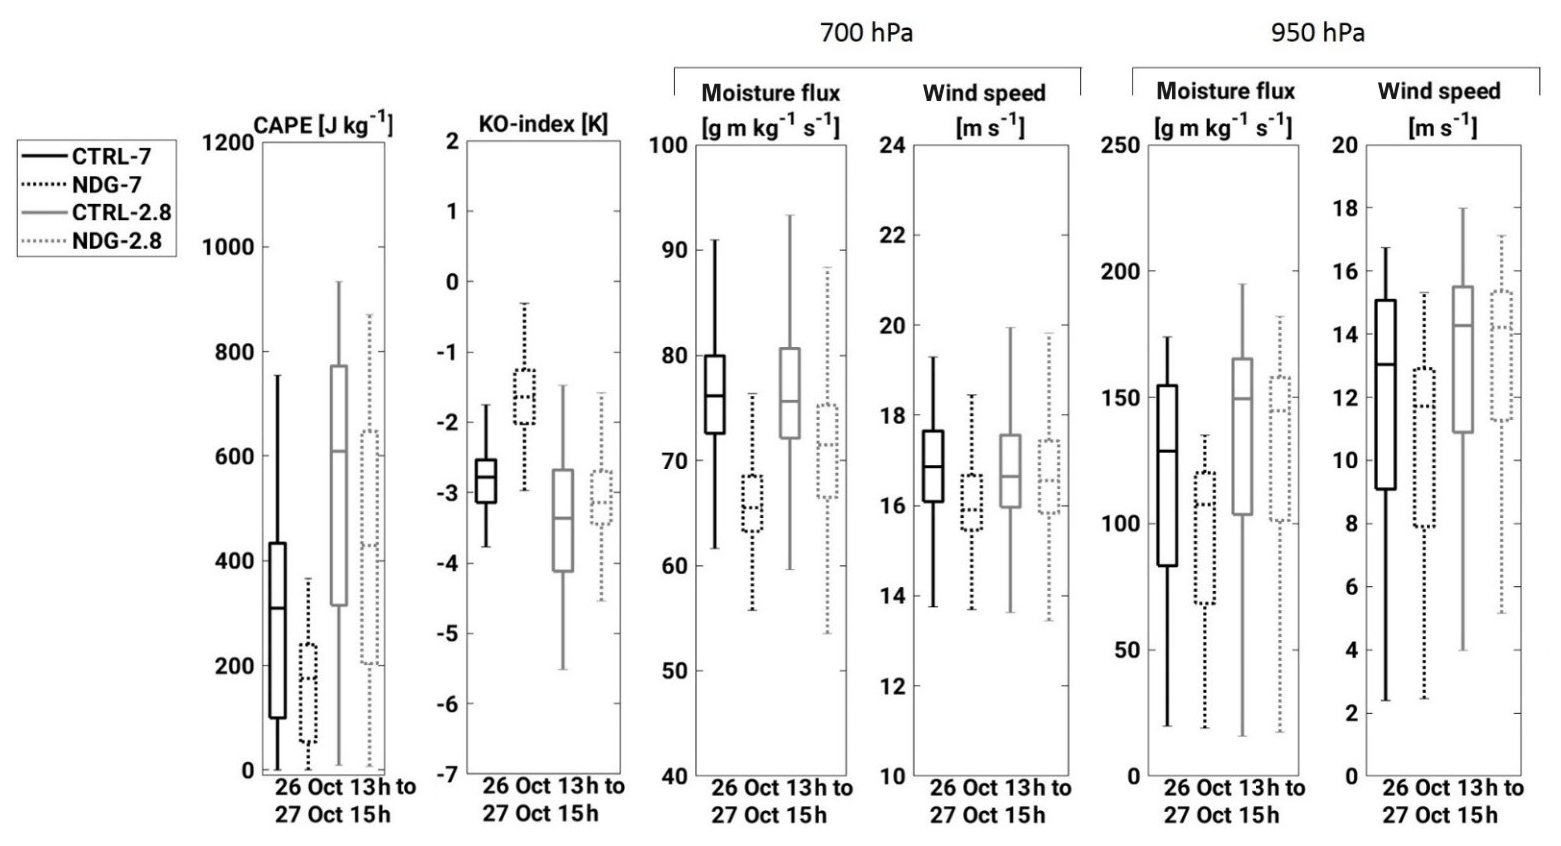
Figure 12Box-and-whisker plots showing the median, the 25th and 75th percentiles and the extreme values of CAPE, the KO index, moisture flux and horizontal wind speeds. The box and whiskers are obtained from the distribution of values for the quantities shown between 26 October at 13:00 UTC and 27 October at 15:00 UTC over the study region CO.
Figure 12 shows that median CAPE is reduced as a result of the GPS-ZTD nudging for both resolutions, from 310 J kg−1 in CTRL-7 to 190 J kg−1 in NDG-7 (−39 %) and from 600 J kg−1 in CTRL-2.8 to 410 J kg−1 in NDG-2.8 (−32 %). Since COSMO-CLM selects the lowest 50 hPa as the mean layer to compute CAPE (mixed layer), a decrease of humidity close to the ground implies a relevant impact on atmospheric instability conditions. COSMO-CLM in the 2.8 km resolution represented larger latent instability than 7 km for this event. The median KO index increased from −2.7 K in CTRL-7 to −1.5 K in NDG-7 (+44 %), where a lower KO index indicates more potential for storm development under favourable large-scale conditions. The narrower simulation domains of the 2.8 km simulations (see Sect. 2.2.2) render the impact of the GPS-ZTD nudging on the KO index weaker given the inability to represent changes on the large-scale pressure distribution. The overall decrease in the median moisture flux implies a drier ground level and a drier LFT. This means that the air entrained in the convective updrafts is drier than that of the reference runs (CTRL). The median moisture flux is reduced by about 13 % in NDG-7 and about 5 % in CTRL-2.8 at 700 hPa. In the PBL, the moisture flux is also reduced. The changes in moisture flux between CTRL-7 and NDG-7 are larger than their 2.8 km counterparts. This is due to two factors: first, the changes in specific humidity are slightly weaker in the 2.8 km runs as compared to the 7 km runs; and second, the horizontal wind speed and direction in the 7 km runs are modified as a result of the GPS-ZTD nudging. For instance, at 950 hPa, extreme horizontal wind speeds are reduced by −8 % from CTRL-7 to NDG-7. This impact is not observed in the 2.8 km runs.
Overall, the humidity reduction caused by the GPS-ZTD nudging, locally over Corsica, reduced the amount of instability (as shown by CAPE and the KO index) as well as humidity in the LFT (demonstrated by the changes in specific humidity and moisture flux).
4.4 Impact on the low-pressure system and mesoscale winds
Besides impacting the representation of the local conditions of humidity, instability and buoyancy, the GPS-ZTD nudging affected the representation of the low-pressure system.
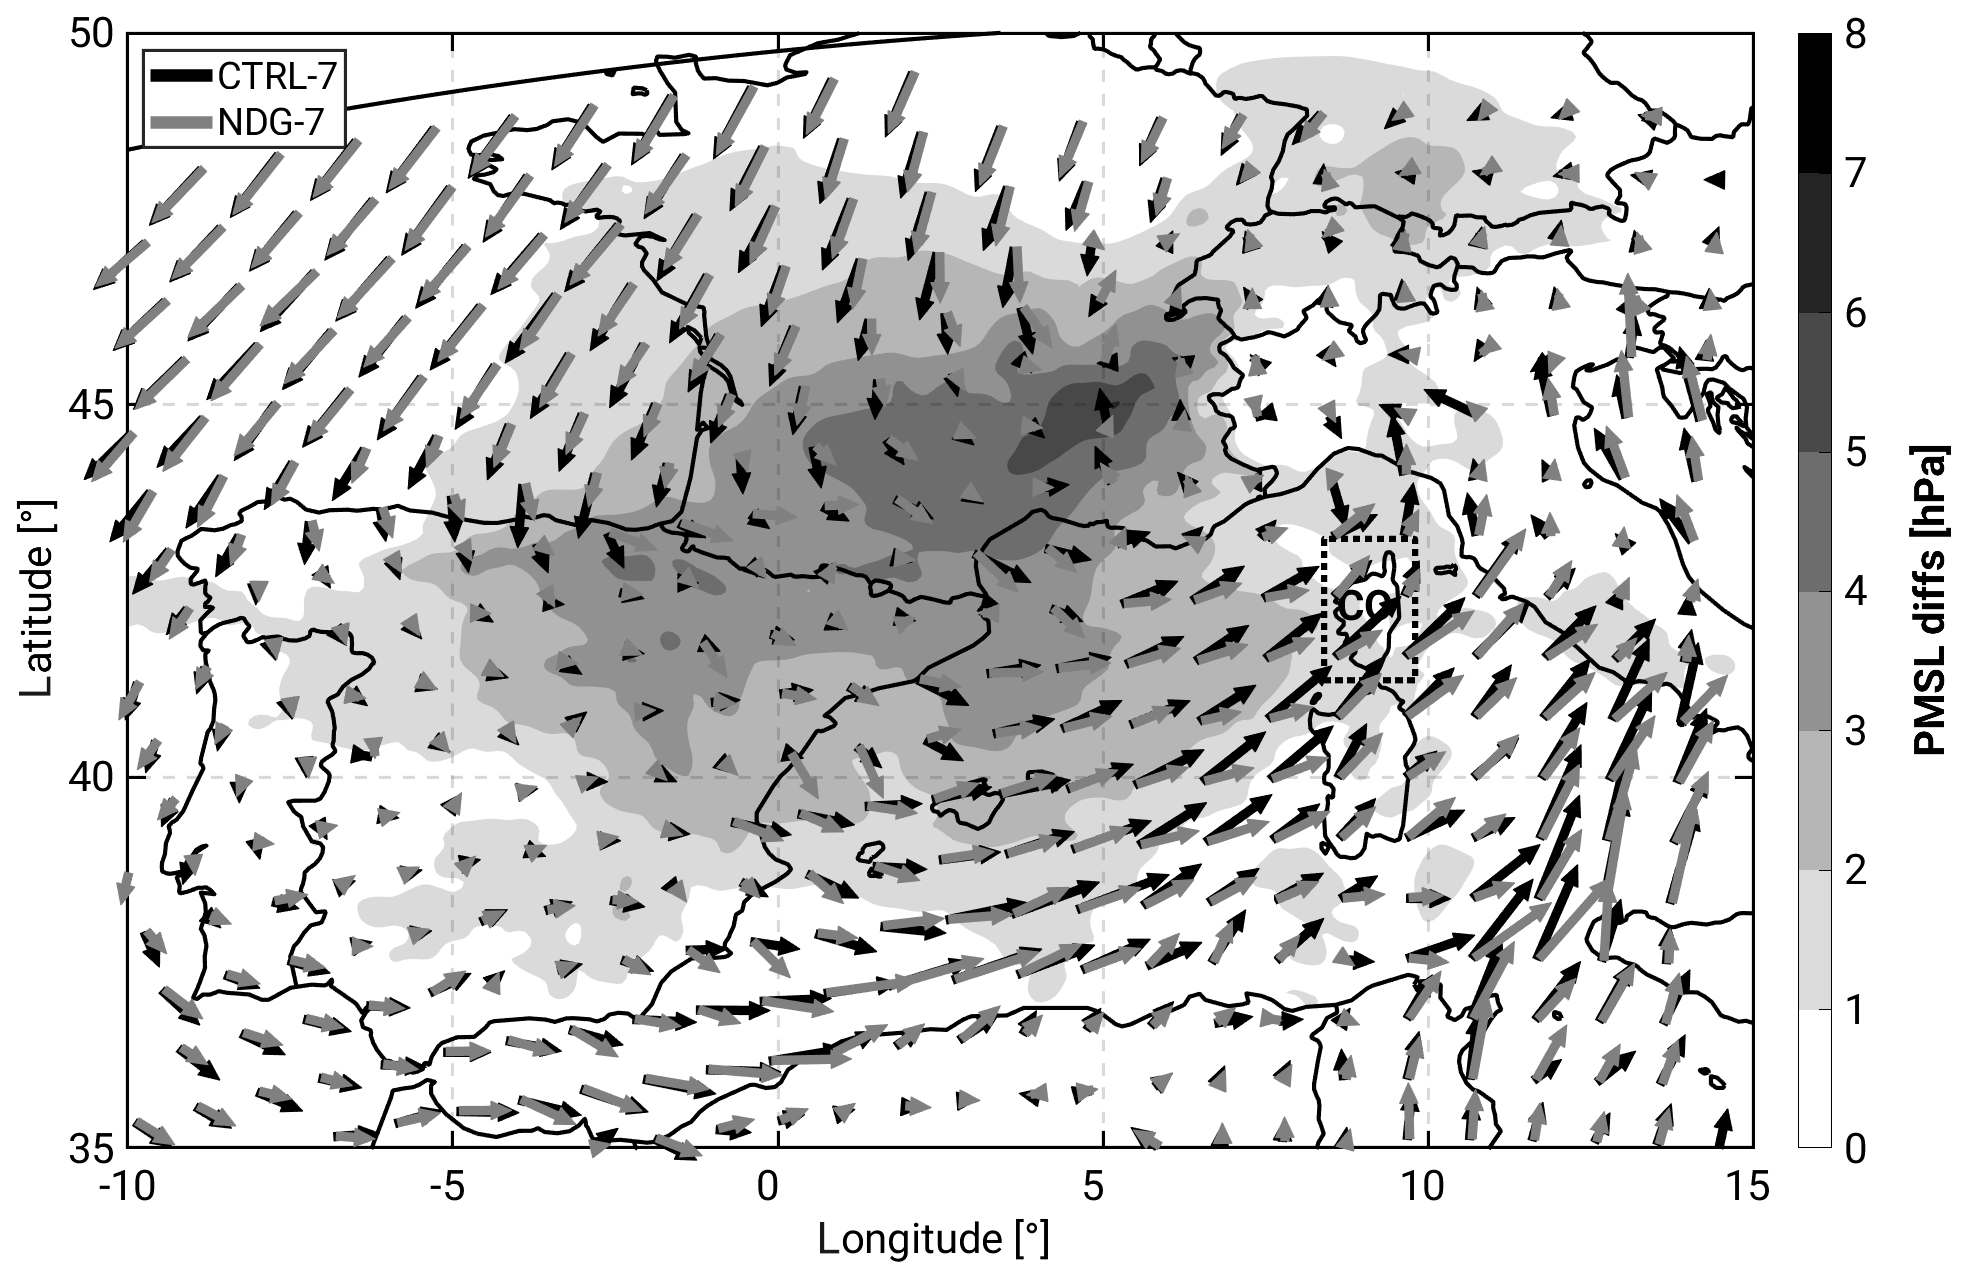
Figure 13Spatial distribution of the differences in pressure at mean sea level (PMSL) between NDG-7 and CTRL-7 on 26 October at 23:00 UTC in a grey scale. Darker grey colours indicate larger PMSL in NDG-7. Horizontal winds at 950 hPa are represented by black (CTRL-7) and grey (NDG-7) arrows.
Table 3Metrics for precipitation validation for the additional simulations initialized on 20 October 2012. A description of the metrics used can be found in the Appendix.
In the early morning of 26 October 2016, the centre of the upper level low was located over the north-western part of the Iberian Plateau. The GPS-ZTD nudging induced moisture reductions of 7 mm in IWV at that location in the NDG-7 simulations, with very large reductions in the range 1–2 g kg−1 from the ground up to 700 hPa (not shown). The progression of the pressure low toward southern France was effective in 12 h and at 15:00 UTC; the PMSL was of 995 hPa in the Rhône Valley (CTRL-7). The centre of the low extended toward the Alps at 23:00 UTC. Drying of the atmospheric column, due to the GPS-ZTD nudging, also took place in this region between 25 and 28 October (not shown). At 23:00 UTC on 20 October, over the Cévennes–Vivarais area, differences in IWV were 3 mm between CTRL-7 and NDG-7. Figure 13 shows the differences in PMSL on 26 October at 23:00 UTC between NDG-7 and CTRL-7, as well as the wind fields at 950 hPa. The GPS-ZTD nudging increased the PMSL by 10 hPa at the centre of the system and up to 2 hPa between Brittany (France) and the Balearic Islands (Spain). The drying over France and the Iberian peninsula induced a weaker low-pressure system in NDG-7; this changed the cyclonic wind circulation from a south-westerly to west–south-westerly flow and a reduction of the horizontal wind speeds. The largest impact was observed at the 950 hPa level despite relevant differences affecting Corsica existing between 850 and 1000 hPa. The reduction of the horizontal wind speeds is demonstrated through box-and-whisker plots in Fig. 12. This difference in horizontal wind speed does not exist in the 2.8 km runs (see Fig. S3). This hampered orographic lifting at the mountain foothills and ahead of the island, reducing triggering of new cells and weakening the convective updrafts.
4.5 10 min vs. 1 h nudging
To discern the added value of nudging GPS-ZTD with a temporal resolution of 10 min with respect to lower nudging temporal resolutions, we carried out additional simulations with COSMO-CLM with a 1 h frequency initialized on 20 October 2012 at 00:00 UTC. These simulations have the same model settings as the original simulations (Sect. 2.2.2) except for the changes in nudging frequency (labelled with the suffix “1 h”). The initialization time is also different to avoid the computational cost of running the whole autumn season but is early enough to take the Atlantic and African moisture transport described in Sect. 3.3 into account. They show analogue features to those presented in Sect. 2.2.2 and hence are used for the validation of the 1 h frequency nudging impacts.
Table 3 shows a validation of the additional runs against rain gauges, as in Table 2. Nudging GPS-ZTD data with a 1 h frequency brings a slightly larger reduction of the precipitation maximum and the hourly SD for NDG-7-1h as compared to the 10 min frequency (NDG-7). The RMSE, the SD and the mean of accumulated precipitation showed no relevant differences between NDG-7 and NDG-7-1h. This aspect is even clearer in the case of 2.8 km. No perceptible differences exist for the validation metrics between NDG-2.8-1h and NDG-2.8. Similarly to the validation metrics, the spatial distribution shows no relevant differences between the 1 h and the 10 min frequency nudging. The spatial distributions are shown in Fig. S4.
The pathways of moisture and its interaction with convection are not fully understood (Stevens, 2005; Sherwood et al., 2010; Ahrens and Samson, 2010). A deeper understanding of moist processes is relevant to improve the representation of heavy precipitation by numerical atmospheric models in order to support the mitigation and prevention of its hydrological impacts. This study aimed at assessing the sensitivity of convective precipitation and underlying mechanisms to variations of the atmospheric moisture distribution. With this purpose, we presented an in-depth analysis of HyMeX IOP16, with special focus on the complex orographic region of Corsica. We showed novel insights into the role of remote moisture transports in this event and the sensitivity of precipitation representation to high-frequency GPS-ZTD nudging. The main findings of this diagnostic study are summarized in the following.
-
Large atmospheric moisture amounts (IWV ∼ 40 mm) precondition the areas of convective activity, namely, southern France, the Gulf of Lion, Corsica, Sardinia, the mid-Mediterranean and north-eastern Italy, in agreement with previous investigations in the region (Khodayar et al., 2016a). These very wet air masses reach southern France and the Gulf of Lion about 12 h prior to precipitation initiation and the central Mediterranean about 4 h prior to initiation. A low-level convergence line located between France and the Balearic Islands (Duffourg et al., 2016; Martinet et al., 2017) delays the arrival of low-level moisture at Corsica and the Italian Peninsula.
-
The transport of moisture feeding the convective cells arises from the action of the upper level pressure low through two mechanisms. Firstly, the associated front sweeps atmospheric moisture from the Atlantic to the Mediterranean in the course of 36 h. Secondly, evaporated moisture over the Mediterranean and north Africa between 25 October at 18:00 UTC and 26 October at 12:00 UTC is transported by the south-westerly flow towards Corsica, feeding the convective systems.
-
Northern Africa has been identified as a source of moisture for this event, caused by intense evapotranspiration between 21 and 28 October due to intense solar radiation and precipitation impacting the region 2 d earlier. After 25 October, the intense south-westerly flow and the convective activity brought the moisture up north in the course of 24 to 30 h, as shown by backward trajectories and model output.
COSMO-CLM was able to represent this event over Corsica with a good agreement on the timing for both resolutions but an overestimation of precipitation in CTRL-7, well corrected by the GPS-ZTD nudging. Overall, the representation of humidity during the event was good, and the GPS-ZTD nudging helped to further reduce the model humidity biases. In this regard, the following points are made.
-
The precipitation overestimation in the 7 km run was well corrected by the GPS-ZTD nudging. Regarding the 2.8 km simulations, CTRL-2.8 performed well in representing the maximum and the spatial averages, but the GPS-ZTD nudging reduced excessively the total precipitation. The impact of nudging GPS-ZTD with a 1 h frequency or the 10 min frequency showed no relevant differences.
-
The reference runs (CTRL-7 and CTRL-2.8) performed well overall in reproducing the moisture distribution during the event. The GPS-ZTD nudging improved the representation of IWV, reducing the MAE of IWV. Regarding the vertical distribution of humidity, the GPS-ZTD nudging improved the MAE below 650 hPa in the 7 km simulation by 25 % and between 650 and 925 hPa in the 2.8 km resolution by 8 %. The weaker improvement in the PBL is because the model is unable to represent the abrupt humidity gradient of the lowest layers. Even if the GPS-ZTD correction is beneficial, it is not sufficient to overcome the humidity biases at this level.
The impact of the GPS-ZTD nudging during the case study has been assessed with the following conclusions.
-
Heavy precipitation showed a large sensitivity to the moisture variations, implying a strong reduction of the maximum totals (−49 % for 7 km and −16 % for 2.8 km) arising from less intense convection and a lower number of triggered cells.
-
The two affected processes which exerted the largest control for precipitation reduction were the reduction of atmospheric instability over the island (−35 % CAPE) and the drying of the lower free troposphere bringing more dry air entrainment into the convective updrafts (−13 % moisture flux at 700 hPa for 7 km and −5 % for 2.8 km).
-
Additionally, the 7 km simulations showed an impact on the large-scale surface pressure and the associated circulation given the larger simulation domains. The GPS-ZTD nudging dried the atmospheric levels over the Iberian peninsula and France, weakening the low-pressure system. This induced in turn a decrease in horizontal wind speed and a veering of the direction toward west–south-west.
The unique opportunity provided by the synergy of high-resolution atmospheric modelling, very frequent data nudging and high-resolution humidity data sets enables the study of moisture and convection interactions in a selected case study of heavy precipitation. We showed the benefit of nudging GPS-ZTD for the simulation of the vertical profile and integrated amount of atmospheric humidity and for precipitation in a convection parameterized set-up (7 km). This is relevant since coarse-resolution simulations will still be needed as providers of forcing data, and therefore GPS-ZTD nudging can reduce moisture uncertainties at these grid lengths. The performance of CTRL-2.8 was acceptable without the GPS-ZTD nudging. This highlights the added value of convection-permitting resolutions for this case being able to provide a fair precipitation forecast, even in the presence of the addressed humidity biases. Also noteworthy is the large sensitivity to variations of the LFT moisture shown by the model. Recent observational studies have highlighted the linkage between intense convective precipitation and a humid LFT (Schiro and Neelin, 2019; Virman et al., 2018), hence the relevance of the ability to represent such sensitivity. This study also points out one of the drawbacks of GPS-ZTD nudging. Being an integrated quantity, GPS-ZTD nudging struggles to correct the vertical distribution of humidity, in this case particularly in the lower troposphere. Lastly, this study focuses on a single case study; therefore, the results presented here should be extended to other events of the region to allow for generalization. In a further publication, the authors evaluate the impact of GPS-ZTD nudging on the SOP1 period of the HyMeX campaign, considering the sensitivity of all IOPs in the autumn season.
Table A1Precipitation validation metrics used in Tables 2 and 3. N denotes the total number of measurements at the rain gauge stations, hourly (1 h) or accumulated (27 h). M denotes all model grid points over land. For the first two metrics, all hourly values between 26 October at 13:00 UTC and 27 October at 15:00 UTC are considered, and COSMO-CLM is interpolated to the station's location. The third metric is an average of accumulated precipitation, with COSMO-CLM values interpolated to the station's location. The last two metrics considered all observed and simulated precipitation values over land.
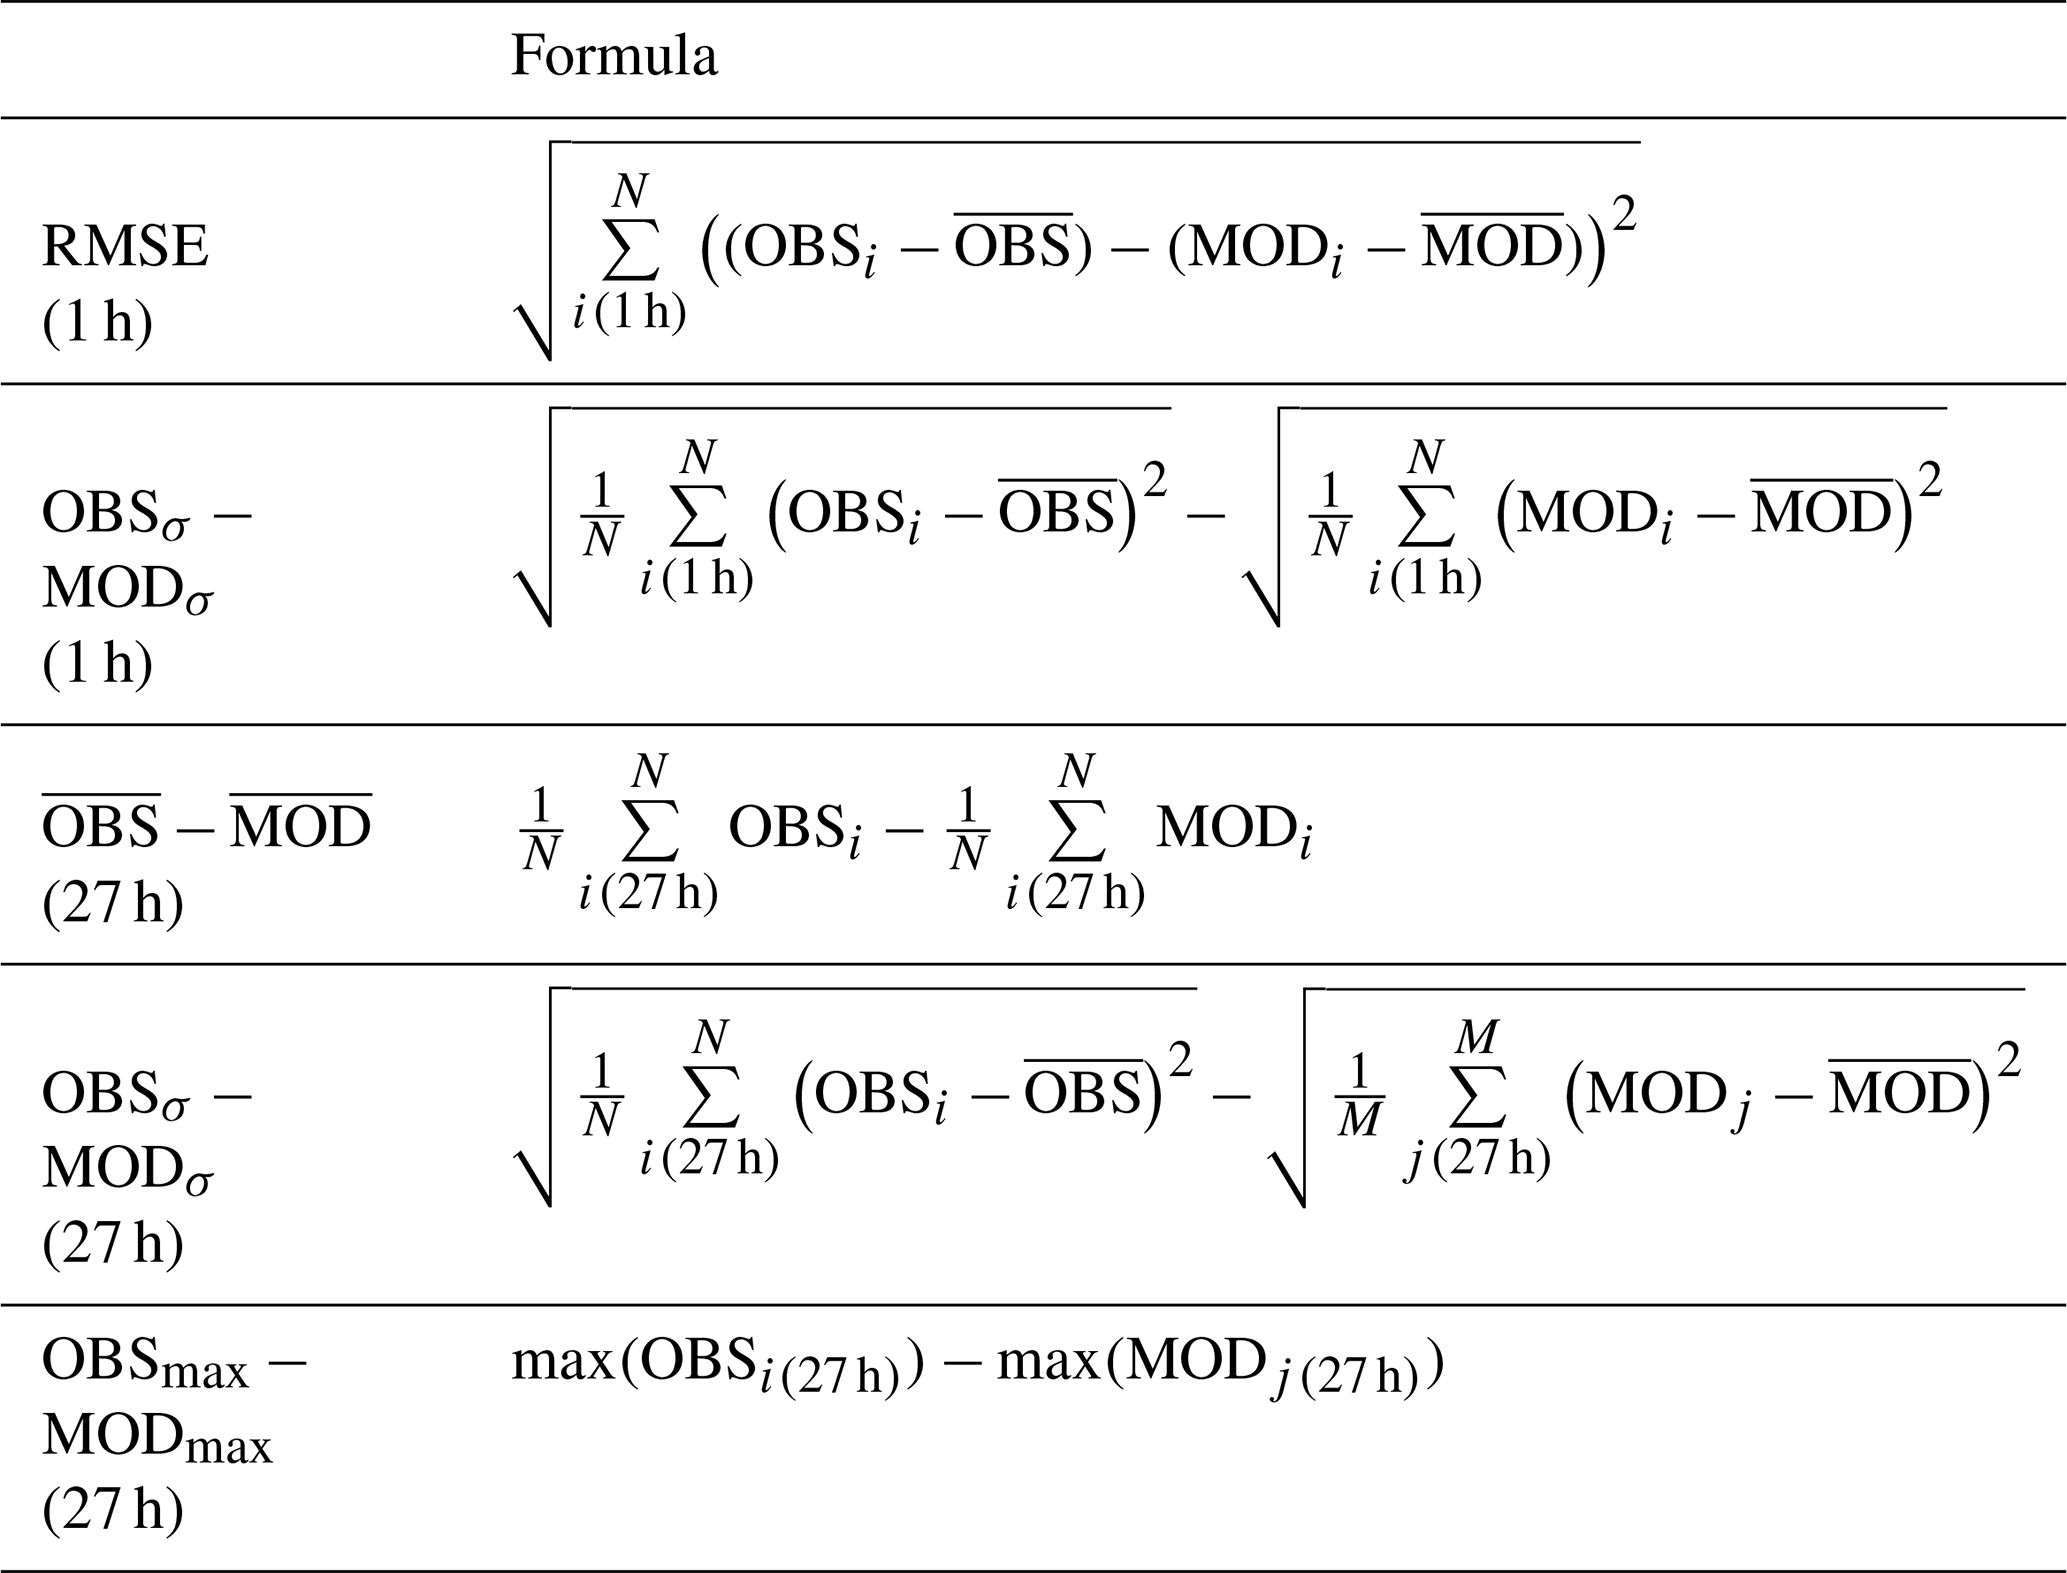
Table A2IWV validation metrics used in Table 1 and Fig. 10 in Sect. 4.2.
The COSMO-CLM model is only accessible to members of the Climate Limited-area Modeling Community, and access is granted upon request. Parts of the model documentation are freely available at https://doi.org/10.1127/0941-2948/2008/0309 (Rockel et al., 2008).
Two further publications using these nudging simulations are ongoing. Therefore, these are not yet available to the general public. However, the data used to produce the figures showing results on the nudging simulations (Figs. 2, 4, 6a, 6b, 7, 8, 9, 10, 11, 12, 13; and Tables 1–3) are accessible at https://doi.org/10.5445/IR/1000123256 (Caldas-Alvarez and Khodayar, 2020). The model data used to produce the graphs in the paper are available from Caldas-Alvarez and Khodayar (2020). The observational data used in the figures within this paper are obtained from the referenced data sets, and their access depends on the restrictions of each institution.
The supplement related to this article is available online at: https://doi.org/10.5194/nhess-20-2753-2020-supplement.
SK designed and planned the experiments. As part of his PhD, ACA carried out the nudging experiments under the supervision of SK. ACA and SK analysed the results and wrote the manuscript.
The authors declare that they have no conflict of interest.
This article is part of the special issue “Hydrological cycle in the Mediterranean (ACP/AMT/GMD/HESS/NHESS/OS inter-journal SI)”. It is not associated with a conference.
We acknowledge Oliver Bock and the LAboratoire de Recherche En Géodésie (LAREG) of the French Institute of the Geographic and Forest Information (IGN) for their providing of the GPS-ZTD data set. We also acknowledge Météo France and the HyMeX program for supplying the rain gauge and radiosonde data supported by grants MISTRALS/HyMeX and ANR-11-BS56-0005 IODA-MED. We would like to thank the German Weather Service (DWD) and the CLM-Community for their providing of the COSMO-CLM model and especially Ulrich Schättler and Christoph Schraff for their support in carrying out the nudging experiments. We are also thankful to the European Centre for Medium-Range Weather Forecasts (ECMWF) for their Integrated Forecasting System (IFS) analyses. We thank as well the teams of HYSPLIT at the NOAA Air Resources Laboratory, CMORPH at the Climate Prediction Center (CPC) and GLEAM for their data sets. We thank the reviewers for their fruitful comments. Finally, we would like to thank the hosting institution, the Karlsruhe Institute of Technology (KIT).
This research has been supported by the Bundesministerium für Bildung und Forschung (BMBF; German Federal Ministry of Education
and Research) (PREMIUM grant no. 01LN1319A).
The article processing charges for this open-access
publication were covered by a Research
Centre of the Helmholtz Association.
This paper was edited by Véronique Ducrocq and reviewed by Stefano Federico and one anonymous referee.
Ahrens, C. D. and Samson, P. J.: Extreme Weather and Climate, Cengage Learning, United States of America, ISBN 0495118575, 2010.
Andersson, T., Andersson, M., Jacobsson, C., and Nilsson, S.: Thermodynamic indices for forecasting thunderstorms in southern Sweden, Meteorol. Mag., 116, 141–146, 1989.
Bevis, M., Businger, S., Chiswell, S., Herring, T. A., Anthes, R. A., Rocken, C., and Ware, R. H.: GPS Meteorology: Mapping Zenith Wet Delays onto Precipitable Water, J. Appl. Meteorol., 33, 379–386, https://doi.org/10.1175/1520-0450(1994)033<0379:gmmzwd>2.0.co;2, 1994.
Bitew, M. M. and Gebremichael, M.: Evaluation of satellite rainfall products through hydrologic simulation in a fully distributed hydrologic model, Water Resour. Res., 47, W06526, https://doi.org/10.1029/2010WR009917, 2011.
Bock, O., Bosser, P., Pacione, R., Nuret, M., Fourrié, N., and Parracho, A.: A high-quality reprocessed ground-based GPS dataset for atmospheric process studies, radiosonde and model evaluation, and reanalysis of HyMeX Special Observing Period, Q. J. Roy. Meteor. Soc., 142, 56–71, https://doi.org/10.1002/qj.2701, 2016.
Businger, S., Chiswell, S. R., Bevis, M., Duan, J., Anthes, R. A., Rocken, C., Ware, R. H., Exner, M., VanHove, T., and Solheim, F. S.: The Promise of GPS in Atmospheric Monitoring, B. Am. Meteorol. Soc., 77, 5–18, https://doi.org/10.1175/1520-0477(1996)077<0005:tpogia>2.0.co;2, 1996.
Caldas-Alvarez, A.: Atmospheric Moisture Effects on Deep Convection in the Western Mediterranean, KIT Scientific Publishing, Karlsruhe, Germany, VI, 237, https://doi.org/10.5445/KSP/1000097100, 2019.
Caldas-Alvarez, A. and Khodayar, S.: Analysis data to Caldas-Alvarez and Khodayar (2020), KITOpen, https://doi.org/10.5445/IR/1000123256, 2020.
Chan, S. C., Kendon, E. J., Fowler, H. J., Blenkinsop, S., Ferro, C. A. T., and Stephenson, D. B.: Does increasing the spatial resolution of a regional climate model improve the simulated daily precipitation?, Clim. Dynam., 41, 1475–1495, https://doi.org/10.1007/s00382-012-1568-9, 2012.
Chazette, P., Flamant, C., Shang, X., Totems, J., Raut, J.-C., Doerenbecher, A., Ducrocq, V., Fourrié, N., Bock, O., and Cloché, S.: A multi-instrument and multi-model assessment of atmospheric moisture variability over the western Mediterranean during HyMeX, Q. J. Roy. Meteor. Soc., 142, 7–22, https://doi.org/10.1002/qj.2671, 2015a.
Chazette, P., Flamant, C., Raut, J.-C., Totems, J., and Shang, X.: Tropical moisture enriched storm tracks over the Mediterranean and their link with intense rainfall in the Cevennes-Vivarais area during HyMeX, Q. J. Roy. Meteor. Soc., 142, 320–334, https://doi.org/10.1002/qj.2674, 2015b.
Cress, A., Anlauf, H., Bitzer, H. W., Rhodin, A., Schraff, C., Helmert, K., and Stephan, K. (Eds.): Global and regional impact studies at the German Weather Service (DWD), World Meteorological Organization (WMO), Sedona, USA, 2012.
Di Girolamo, P., Flamant, C., Cacciani, M., Richard, E., Ducrocq, V., Summa, D., Stelitano, D., Fourrié, N., and Saïd, F.: Observation of low-level wind reversals in the Gulf of Lion area and their impact on the water vapour variability, Q. J. Roy. Meteor. Soc., 142, 153–172, https://doi.org/10.1002/qj.2767, 2016.
Doms, G., Förstner, J., Heise, E., Herzog, H.-J., Mironov, D., Raschendorfer, M., Reinhardt, T., Ritter, B., Schrodin, R., Schulz, J.-P., and Vogel, G.: A Description of the Nonhydrostatic Regional COSMO Model Part II: Physical Parameterization, German Weather Service, P.O. Box 100465, 63004 Offenbach, Germany, 2011.
Duan, J., Bevis, M., Fang, P., Bock, Y., Chiswell, S., Businger, S., Rocken, C., Solheim, F., van Hove, T., Ware, R., McClusky, S., Herring, T. A., and King, R. W.: GPS Meteorology: Direct Estimation of the Absolute Value of Precipitable Water, J. Appl. Meteorol., 35, 830–838, https://doi.org/10.1175/1520-0450(1996)035<0830:gmdeot>2.0.co;2, 1996.
Ducrocq, V., Braud, I., Davolio, S., Ferretti, R., Flamant, C., Jansa, A., Kalthoff, N., Richard, E., Taupier-Letage, I., Ayral, P.-A., Belamari, S., Berne, A., Borga, M., Boudevillain, B., Bock, O., Boichard, J.-L., Bouin, M.-N., Bousquet, O., Bouvier, C., Chiggiato, J., Cimini, D., Corsmeier, U., Coppola, L., Cocquerez, P., Defer, E., Delanoë, J., Di Girolamo, P., Doerenbecher, A., Drobinski, P., Dufournet, Y., Fourrié, N., Gourley, J. J., Labatut, L., Lambert, D., Le Coz, J., Marzano, F. S., Molinié, G., Montani, A., Nord, G., Nuret, M., Ramage, K., Rison, W., Roussot, O., Said, F., Schwarzenboeck, A., Testor, P., van Baelen, J., Vincendon, B., Aran, M., and Tamayo, J.: HyMeX-SOP1: The Field Campaign Dedicated to Heavy Precipitation and Flash Flooding in the Northwestern Mediterranean, B. Am. Meteorol. Soc., 95, 1083–1100, https://doi.org/10.1175/bams-d-12-00244.1, 2014.
Ducrocq, V., Davolio, S., Ferretti, R., Flamant, C., Santaner, V. H., Kalthoff, N., Richard, E., and Wernli, H.: Introduction to the HyMeX Special Issue on “Advances in understanding and forecasting of heavy precipitation in the Mediterranean through the HyMeX SOP1 field campaign”, Q. J. Roy. Meteor. Soc., 142, 1–6, https://doi.org/10.1002/qj.2856, 2016.
Duffourg, F. and Ducrocq, V.: Origin of the moisture feeding the Heavy Precipitating Systems over Southeastern France, Nat. Hazards Earth Syst. Sci., 11, 1163–1178, https://doi.org/10.5194/nhess-11-1163-2011, 2011.
Duffourg, F., Nuissier, O., Ducrocq, V., Flamant, C., Chazette, P., Delanoë, J., Doerenbecher, A., Fourrié, N., Di Girolamo, P., Lac, C., Legain, D., Martinet, M., Saïd, F., and Bock, O.: Offshore deep convection initiation and maintenance during the HyMeX IOP 16a heavy precipitation event, Q. J. Roy. Meteor. Soc., 142, 259–274, https://doi.org/10.1002/qj.2725, 2016.
Fosser, G., Khodayar, S., and Berg, P.: Climate change in the next 30 years: What can a convection-permitting model tell us that we did not already know?, Clim. Dynam., 48, 1987–2003, https://doi.org/10.1007/s00382-016-3186-4, 2016.
Funatsu, B. M., Rysman, J.-F., Claud, C., and Chaboureau, J.-P.: Deep convective clouds distribution over the Mediterranean region from AMSU-B/MHS observations, Atmos. Res., 207, 122–135, https://doi.org/10.1016/j.atmosres.2018.03.003, 2018.
Gilabert, J. and Llasat, M. C.: Circulation weather types associated with extreme flood events in Northwestern Mediterranean, Int. J. Climatol., 38, 1864–1876, https://doi.org/10.1002/joc.5301, 2017.
González-Zamora, Á., Sánchez, N., Martínez-Fernández, J., Gumuzzio, Á., Piles, M., and Olmedo, E.: Long-term SMOS soil moisture products: A comprehensive evaluation across scales and methods in the Duero Basin (Spain), Phys. Chem. Earth, Pt A/B/C, 83–84, 123–136, https://doi.org/10.1016/j.pce.2015.05.009, 2015.
Guerova, G., Jones, J., Douša, J., Dick, G., de Haan, S., Pottiaux, E., Bock, O., Pacione, R., Elgered, G., Vedel, H., and Bender, M.: Review of the state of the art and future prospects of the ground-based GNSS meteorology in Europe, Atmos. Meas. Tech., 9, 5385–5406, https://doi.org/10.5194/amt-9-5385-2016, 2016.
Habib, E., Haile, A. T., Tian, Y., and Joyce, R. J.: Evaluation of the High-Resolution CMORPH Satellite Rainfall Product Using Dense Rain Gauge Observations and Radar-Based Estimates, J. Hydrometeorol., 13, 1784–1798, https://doi.org/10.1175/JHM-D-12-017.1, 2012.
Honda, T. and Kawano, T.: How does mid-tropospheric dry air affect the evolution of supercellular convection?, Atmos. Res., 157, 1–16, https://doi.org/10.1016/j.atmosres.2015.01.015, 2015.
Jansa, A., Genoves, A., Picornell, M. A., Campins, J., Riosalido, R., and Carretero, O.: Western Mediterranean cyclones and heavy rain. Part 2: Statistical approach, Meteorol. Appl., 8, 43–56, https://doi.org/10.1017/s1350482701001049, 2001.
Joyce, R. J., Janowiak, J. E., Arkin, P. A., and Xie, P.: CMORPH: A Method that Produces Global Precipitation Estimates from Passive Microwave and Infrared Data at High Spatial and Temporal Resolution, J. Hydrometeorol., 5, 487–503, https://doi.org/10.1175/1525-7541(2004)005<0487:camtpg>2.0.co;2, 2004.
Keil, C., Röpnack, A., Craig, G. C., and Schumann, U.: Sensitivity of quantitative precipitation forecast to height dependent changes in humidity, Geophys. Res. Lett., 35, L09812, https://doi.org/10.1029/2008gl033657, 2008.
Khodayar, S., Fosser, G., Berthou, S., Davolio, S., Drobinski, P., Ducrocq, V., Ferretti, R., Nuret, M., Pichelli, E., Richard, E., and Bock, O.: A seamless weather-climate multi-model intercomparison on the representation of a high impact weather event in the western Mediterranean: HyMeX IOP12, Q. J. Roy. Meteor. Soc., 142, 433–452, https://doi.org/10.1002/qj.2700, 2016a.
Khodayar, S., Kalthoff, N., and Kottmeier, C.: Atmospheric conditions associated with heavy precipitation events in comparison to seasonal means in the western mediterranean region, Clim. Dynam., 51, 951–967, https://doi.org/10.1007/s00382-016-3058-y, 2016b.
Krichak, S. O., Barkan, J., Breitgand, J. S., Gualdi, S., and Feldstein, S. B.: The role of the export of tropical moisture into midlatitudes for extreme precipitation events in the Mediterranean region, Theor. Appl. Climatol., 121, 499–515, https://doi.org/10.1007/s00704-014-1244-6, 2014.
Lamb, P. J. and Ports, D. H.: Investigation of Large-Scale Atmospheric Moisture Budget and Land Surface Interactions over U. S. Southern Great Plains including for CLASIC (June 2007), J. Hydrometeorol., 13, 1719–1738, https://doi.org/10.1175/JHM-D-12-01.1, 2012.
Lee, K.-O., Flamant, C., Duffourg, F., Ducrocq, V., and Chaboureau, J.-P.: Impact of upstream moisture structure on a back-building convective precipitation system in south-eastern France during HyMeX IOP13, Atmos. Chem. Phys., 18, 16845–16862, https://doi.org/10.5194/acp-18-16845-2018, 2018.
Leuenberger, D., Stoll, M., and Roches, A.: Description of some convective indices implemented in the COSMO model, Deutscher Wetterdienst (DWD), available at: http://www.cosmo-model.org/content/model/documentation/techReports/docs/techReport17.pdf (last access: 22 July 2019), 2010.
Llasat, M. C., Llasat-Botija, M., Prat, M. A., Porcú, F., Price, C., Mugnai, A., Lagouvardos, K., Kotroni, V., Katsanos, D., Michaelides, S., Yair, Y., Savvidou, K., and Nicolaides, K.: High-impact floods and flash floods in Mediterranean countries: the FLASH preliminary database, Adv. Geosci., 23, 47–55, https://doi.org/10.5194/adgeo-23-47-2010, 2010.
Maranan, M., Fink, A. H., Knippertz, P., Francis, S. D., Akpo, A. B., Jegede, G., and Yorke, C.: Interactions between Convection and a Moist Vortex Associated with an Extreme Rainfall Event over Southern West Africa, Mon. Weather Rev., 147, 2309–2328, https://doi.org/10.1175/MWR-D-18-0396.1, 2019.
Martens, B., Miralles, D. G., Lievens, H., van der Schalie, R., de Jeu, R. A. M., Fernández-Prieto, D., Beck, H. E., Dorigo, W. A., and Verhoest, N. E. C.: GLEAM v3: satellite-based land evaporation and root-zone soil moisture, Geosci. Model Dev., 10, 1903–1925, https://doi.org/10.5194/gmd-10-1903-2017, 2017.
Martinet, M., Nuissier, O., Duffourg, F., Ducrocq, V., and Ricard, D.: Fine-scale numerical analysis of the sensitivity of the HyMeX IOP16a heavy precipitating event to the turbulent mixing-length parametrization, Q. J. Roy. Meteor. Soc., 143, 3122–3135, https://doi.org/10.1002/qj.3167, 2017.
Miralles, D. G., Holmes, T. R. H., De Jeu, R. A. M., Gash, J. H., Meesters, A. G. C. A., and Dolman, A. J.: Global land-surface evaporation estimated from satellite-based observations, Hydrol. Earth Syst. Sci., 15, 453–469, https://doi.org/10.5194/hess-15-453-2011, 2011.
Nuret, M.: HyMeX domain precipitation amount, SEDOO OMP, MISTRALS, Toulouse, France https://doi.org/10.6096/mistrals-hymex.904, 2013.
Pantillon, F., Chaboureau, J. P., and Richard, E.: Remote impact of North Atlantic hurricanes on the Mediterranean during episodes of intense rainfall in autumn 2012, Q. J. Roy. Meteor. Soc., 141, 967–978, https://doi.org/10.1002/qj.2419, 2015.
Peixoto, J. P. and Oort, A. H.: Physics of Climate, American Inst. of Physics, New York, USA, 1992.
Pinto, J. G., Ulbrich, S., Parodi, A., Rudari, R., Boni, G., and Ulbrich, U.: Identification and ranking of extraordinary rainfall events over Northwest Italy: The role of Atlantic moisture, J. Geophys. Res.-Atmos., 118, 2085–2097, https://doi.org/10.1002/jgrd.50179, 2013.
Ricard, D., Ducrocq, V., and Auger, L.: A Climatology of the Mesoscale Environment Associated with Heavily Precipitating Events over a Northwestern Mediterranean Area, J. Appl. Meteorol. Clim., 51, 468–488, https://doi.org/10.1175/jamc-d-11-017.1, 2012.
Ritter, B. and Geleyn, J.-F.: A Comprehensive Radiation Scheme for Numerical Weather Prediction Models with Potential Applications in Climate Simulations, Mon. Weather Rev., 120, 303–325, https://doi.org/10.1175/1520-0493(1992)120<0303:acrsfn>2.0.co;2, 1992.
Rockel, B., Will, A., and Hense, A.: The Regional Climate Model COSMO-CLM (CCLM), Meteorol. Z., 17, 347–348, https://doi.org/10.1127/0941-2948/2008/0309, 2008.
Röhner, L, Nerding, K. U., and Corsmeier, U.: Diagnostic Study of a Heavy Precipitation Event over Spain by investigation of moisture trajectories, Q. J. Roy. Meteor. Soc., 142, 287–297, https://doi.org/10.1002/qj.2825, 2016.
Rolph, G., Stein, A., and Stunder, B.: Real-time Environmental Applications and Display sYstem: READY, Environ. Modell. Softw., 95, 210–228, https://doi.org/10.1016/j.envsoft.2017.06.025, 2017.
Sapiano, M. R. P. and Arkin, P. A.: An Intercomparison and Validation of High-Resolution Satellite Precipitation Estimates with 3-Hourly Gauge Data, J. Hydrometeorol., 10, 149–166, https://doi.org/10.1175/2008JHM1052.1, 2009.
Schättler, U., Doms, G., and Schraff, C.: A Description of the Nonhydrostatic Regional COSMO-Model Part VII: User's Guide, DeutscherWetterdienst, P.O. Box 100465, 63004 Offenbach, Germany, 2016.
Schiro, K. A. and Neelin, J. D.: Deep Convective Organization, Moisture Vertical Structure, and Convective Transition Using Deep-Inflow Mixing, J. Atmos. Sci., 76, 965–987, https://doi.org/10.1175/jas-d-18-0122.1, 2019.
Schneider, M., Romero, P. M., Hase, F., Blumenstock, T., Cuevas, E., and Ramos, R.: Continuous quality assessment of atmospheric water vapour measurement techniques: FTIR, Cimel, MFRSR, GPS, and Vaisala RS92, Atmos. Meas. Tech., 3, 323–338, https://doi.org/10.5194/amt-3-323-2010, 2010.
Schraff, C. and Hess, R.: A Description of the Nonhydrostatic Regional COSMO-Model Part III: Data Assimilation, DeutscherWetterdienst, P.O. Box 100465, 63004 Offenbach, Germany, 2012.
Schraff, C., Reich, H., Rhodin, A., Schomburg, A., Stephan, K., Periáñez, A., and Potthast, R.: Kilometre-scale ensemble data assimilation for the COSMO model (KENDA), Q. J. Roy. Meteor. Soc., 142, 1453–1472, https://doi.org/10.1002/qj.2748, 2016.
Sherwood, S. C., Roca, R., Weckwerth, T. M., and Andronova, N. G.: Tropospheric water vapor, convection, and climate, Rev. Geophys., 48, RG2001 , https://doi.org/10.1029/2009rg000301, 2010.
Stein, A. F., Draxler, R. R., Rolph, G. D., Stunder, B. J. B., Cohen, M. D., and Ngan, F.: NOAA's HYSPLIT Atmospheric Transport and Dispersion Modeling System, B. Am. Meteorol. Soc., 96, 2059–2077, https://doi.org/10.1175/BAMS-D-14-00110.1, 2015.
Steinke, S., Eikenberg, S., Löhnert, U., Dick, G., Klocke, D., Di Girolamo, P., and Crewell, S.: Assessment of small-scale integrated water vapour variability during HOPE, Atmos. Chem. Phys., 15, 2675–2692, https://doi.org/10.5194/acp-15-2675-2015, 2015.
Stevens, B.: Atmospheric Moist Convection, Annu. Rev. Earth Pl. Sc., 33, 605–643, https://doi.org/10.1146/annurev.earth.33.092203.122658, 2005.
Thévenot, O., Bouin, M. -N., Ducrocq, V., Brossier, C. L., Nuissier, O., Pianezze, J., and Duffourg, F.: Influence of the sea state on Mediterranean heavy precipitation: A case-study from HyMeX SOP1, Q. J. Roy. Meteor. Soc., 142, 377–389, https://doi.org/10.1002/qj.2660, 2015.
Tiedtke, M.: A Comprehensive Mass Flux Scheme for Cumulus Parameterization in Large-Scale Models, Mon. Weather Rev., 117, 1779–1800, https://doi.org/10.1175/1520-0493(1989)117<1779:acmfsf>2.0.co;2, 1989.
Virman, M., Bister, M., Sinclair, V. A., Järvinen, H., and Räisänen, J.: A New Mechanism for the Dependence of Tropical Convection on Free-Tropospheric Humidity, Geophys. Res. Lett., 45, 2516–2523, https://doi.org/10.1002/2018gl077032, 2018.
Wicker, L. J. and Skamarock, W. C.: Time-Splitting Methods for Elastic Models Using Forward Time Schemes, Mon. Weather Rev., 130, 2088–2097, https://doi.org/10.1175/1520-0493(2002)130<2088:tsmfem>2.0.co;2, 2002.
Winschall, A., Sodemann, H., Pfahl, S., and Wernli, H.: How important is intensified evaporation for Mediterranean precipitation extremes?, J. Geophys. Res.-Atmos., 119, 5240–5256, https://doi.org/10.1002/2013jd021175, 2014.
Wulfmeyer, V., Hardesty, R. M., Turner, D. D., Behrendt, A., Cadeddu, M. P., Di Girolamo, P., Schlüssel, P., van Baelen, J., and Zus, F.: A review of the remote sensing of lower tropospheric thermodynamic profiles and its indispensable role for the understanding and the simulation of water and energy cycles, Rev. Geophys., 53, 819–895, https://doi.org/10.1002/2014rg000476, 2015.
Xoplaki, E., Trigo, R. M., Garcández, R., Kuglitsch, F. G., Mariotti, A., Nieto, R., Pinto, J. G., Pozo-Vázquez, D., Saaroni, H., Toreti, A., Trigo, I. F., Vicente-Serrano, S. M., Yiou, P., and Ziv, B.: Large-Scale Atmospheric Circulation Driving Extreme Climate Events in the Mediterranean and its Related Impacts, in: The Climate of the Mediterranean Region, Elsevier, the Netherlands, 347–417, https://doi.org/10.1016/b978-0-12-416042-2.00006-9, 2012.
- Abstract
- Introduction
- Observations and model set-up
- Atmospheric moisture transport and precipitating convection during IOP16
- Nudging effects on convection
- Conclusions
- Appendix A
- Code availability
- Data availability
- Author contributions
- Competing interests
- Special issue statement
- Acknowledgements
- Financial support
- Review statement
- References
- Supplement