the Creative Commons Attribution 4.0 License.
the Creative Commons Attribution 4.0 License.
 | 17 Oct 2020
Annual flood damage influenced by El Niño in the Kan River basin, Iran
Farhad Hooshyaripor
Sanaz Faraji-Ashkavar
Farshad Koohyian
Roohollah Noori
Although many studies have explored the effect of teleconnection patterns on floods, few investigations have focused on the assessment of expected flood damage under such large-scale atmospheric signals. This study aims to determine the effect of the most emblematic teleconnection, El Niño, on the expected damage due to floods with short return periods in the Kan River basin, Iran. To determine the flood damage costs, the median of annual precipitation changes (ΔP) during El Niño conditions was used, although ΔP cannot necessarily be transferred to extreme values. Then the flooded area was determined under the increased rainfall due to El Niño for 5-, 10-, and 50-year return periods. The results showed that El Niño has increased the annual precipitation by 12.2 %. Flood damage assessment using damage–depth curves showed that the relative increase in expected damage during El Niño conditions is much higher for short return period floods than that for long return period floods. In general, a 12.2 % increase in the annual precipitation would increase the damage by 1671 % and 176 %, respectively, for the return periods of 5 and 10 years. However, in the case of a 50-year flood, this increased percentile decreased to 52 %. These results indicate the importance of small flood events in flood management planning during El Niño.
- Article
(4290 KB) - Full-text XML
- BibTeX
- EndNote


In recent decades, the frequency of flood events and the resultant damage have been increasing dramatically in Iran. According to the available reports, the number of flood events in Tehran over 4 decades has grown from 12 cases in 1951 to 54 cases in 1991 (Fars News, 2015; Saghafian et al., 2017). Climate change, encroaching on floodplains, land use changes, diversion of the waterways, destructive effects of human activities, degradation of forests and pastures, and the construction of dysfunctional and vulnerable hydraulic structures can be mentioned as the reasons for increasing flood risks (Wang et al., 2019; Tang, 2020). The magnitude and frequency of flood events in each region depends on several factors: (i) physiographical features of the catchment such as shape, slope, and river network density, (ii) hydrological features such as precipitation, storage and initial losses, evapotranspiration, and permeability, (iii) human activities, (iv) large-scale atmospheric signals, and (v) climate change (Noori et al., 2011; Ward et al., 2014a, b; Alizadeh-Choobari and Najafi, 2017; Hooshyaripor and Yazdi, 2017; Hooshyaripor et al., 2017; Saghafian et al., 2017; Hao et al., 2018). These factors affect the frequency and intensity of floods and consequently the amount of damage costs. Identifying these factors will help to manage floods and reduce the risks. In recent years, the effects of teleconnection phenomena on regional climate have been increasingly discussed. With the help of the predictions of teleconnection indicators, flood damage can be reduced by implementing the necessary practical measures (Schöngart and Junk, 2007). Sun et al. (2015) showed that parts of North and South America, South and East Asia, South Africa, Australia, and Europe are affected by El Niño–Southern Oscillation (ENSO). Schöngart and Junk (2007) showed that there is a strong correlation between ENSO and Amazon River floods such that the river water level decreases in the warm episode of the ENSO (El Niño) and increases in its cold episode (La Niña). Grieco and DeGaetano (2018) concluded that the occurrence of El Niño in the winter reduces the frequency of high waves in the east of Lake Ontario, Canada, while there was no meaningful relationship in the conditions of La Niña. Azmoodehfar and Azarmsa (2013) showed that the southeast of Iran during the years with La Niña events experienced a higher-than-normal maximum and minimum temperature. In a global study, Ward et al. (2014a) investigated the impact of ENSO on the daily peak discharge of some important rivers and showed that ENSO exerts strong and widespread influences on both flood hazards and risk. Saghafian et al. (2017) showed that in the Dez and Karoun basins (located in the west and southwest of Iran) during March and April, El Niño increases the maximum annual flood level and vice versa in the case of La Niña. Their results showed that the maximum annual flood during El Niño events is much greater than that during La Niña events. Gholizadeh (2015) investigated the effect of El Niño on rainfall events between 1973 and 2012 and concluded that the El Niño phenomenon increases the annual rainfall of Iran. Hooshyaripor et al. (2019) investigated the impact of different teleconnection indices on Iranian rainfall and concluded that El Niño can enhance the annual precipitation by nearly 40 %. They stated that due to the increase in rainfall, the river discharge would be affected directly. So far, many studies have focused on the impact of El Niño on river flow. Alizadeh-Choobari and Najafi (2017) indicated that the ENSO cycle contributes to the interannual climate variability over Iran. According to their results, about 26 % of the variance in annual precipitation over Iran is related to El Niño. Based on their achievements, in spite of the seasonality of the ENSO signal and its interannual variability, Iran is anomalously wet during El Niño and dry during La Niña, and the impacts of La Niña and El Niño are generally stronger over the warm and arid regions.
Although the effect of ENSO on precipitation has been frequently studied, there are few studies about ENSO's influence on the socioeconomic damage and losses due to floods (Ward et al., 2014b). The main reason for the limited research on the economic impacts of climate and hydrologic variability is the lack of economic data on flood damage (Changnon, 2003). Analyzing the National Flood Insurance Program's daily claims and losses and the Multivariate ENSO Index (MEI), Corringham and Cayan (2019) quantified insured flood losses across the western United States from 1978 to 2017. They showed that in coastal southern California and across the southwest of the United States, El Niño has had a strong effect in producing more frequent and higher magnitudes of insured losses, while in the Pacific northwest, the opposite pattern with less insured losses has been reported. Changnon (2003) revealed that the strong El Niño events of 1982/1983 and 1997/1998 have caused significant flood damage costing over USD 2.8 billion in southern California. Null (2014) demonstrated that from 1949 until 1997, out of the six seasons that flood damage costs exceeded USD 1 billion in California, the year of three cases had been El Niño years with very strong (1982), moderate (1994), and weak (1968) El Niño conditions. Ward et al. (2014b) assessed ENSO's influence in terms of affected population, gross domestic product, and economic damage caused by flood risk at the global scale and showed that climate variability, especially from ENSO, should be incorporated into disaster-risk analyses and policies. They revealed that, if the frequency and/or magnitude of ENSO events were to change in the future due to climate change, changes in flood risk variations across almost half of the world's terrestrial regions would occur. Ward et al. (2016) provided a global modeling exercise to examine the relationships between flood duration and frequency and ENSO. They indicated that the duration of flooding compared to flood frequency is more sensitive to ENSO.
The above studies indicate the importance of teleconnection on the flood characteristics in many parts of the world, although few investigations have focused on the assessment of the expected damage under El Niño or La Niña conditions. Obviously, damage assessment is an important part of flood risk analysis which determines the need for flood management programs and their priorities. The question addressed in this research is that, given the increasing impact of rainfall due to El Niño, how much damage is expected to be added in a given study area. To answer this question, the catchment of the Kan River north of the Tehran metropolis was selected, and a simplistic approach was employed to estimate the flooding area and damage. Due to the importance of the basin, numerous flood risk studies have been conducted in this area (WRI, 2011a–c; Yazdi and Salehi Neyshabouri, 2012; Yazdi et al., 2013). Hence, this paper focuses on the impact of El Niño not only on the precipitation amount but also on the flood damage that is expected to increase during El Niño conditions.
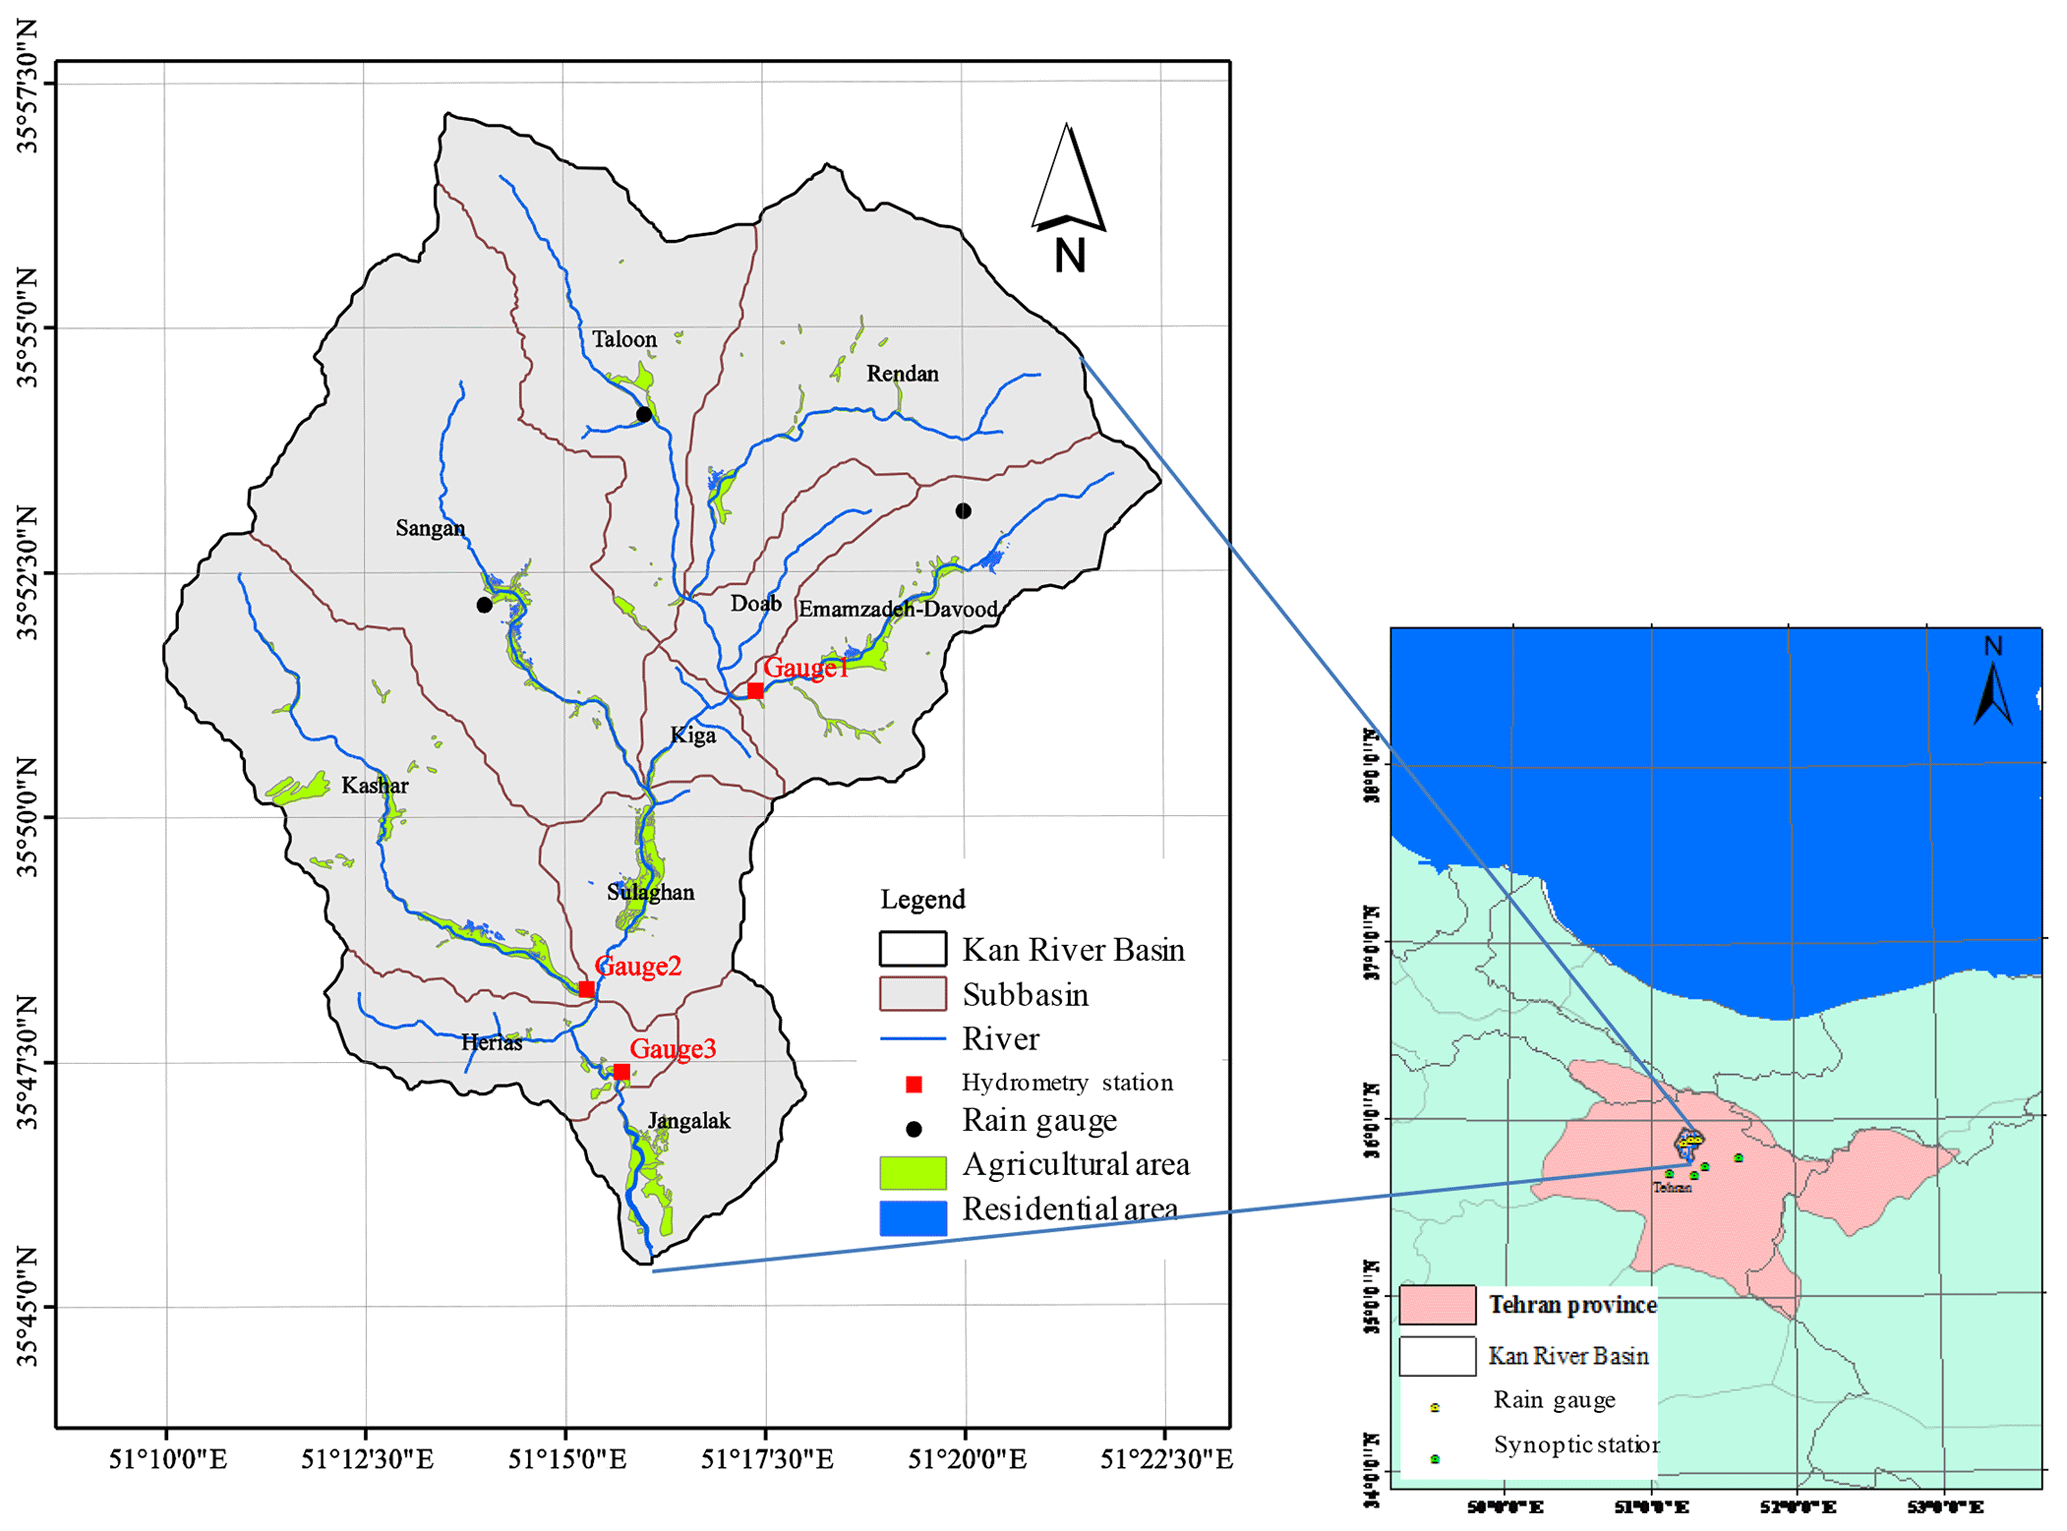
Figure 1Location of the Kan River basin in the north of the Tehran plain, Iran.
The Kan River basin is one of the most important basins located in the north of Tehran city and an area vulnerable to flooding (Yazdi and Salehi Neyshabouri, 2012). It is reported that in the flood of 15 July 2015, a 20 min storm caused eight losses of life, several bridge and diversion dam failures, and more than USD 10 million in damage to residential, commercial, and agricultural areas (ISNA, 2015). In June 1968, a heavy rain 6 times the mean annual precipitation happened in 2 d and caused 31 losses of life and huge damage to properties. In general, during a period of 60 years (from 1954 to 2015), at least eight flood events that resulted in loss of life (in total 2200 people) were reported in the Kan River basin and central Tehran areas. Existence of many restaurants, demographics, and recreational, tourist, and pilgrimage centers adjacent to the sloping Kan River have exacerbated the potential for damage (WRI, 2011a).
The Kan River basin is located between lat 35∘45′ and 35∘58′, long 51∘10′ and 51∘23′. The basin can be divided into 10 subbasins (Fig. 1). The highest point of the basin is 3823 m, and the lowest point is 1328 m with an average of 2377 m a.s.l. (above sea level). The area of the basin is 216 km2. The average annual precipitation is 640 mm, and the average annual discharge is 78.23 M m3 at Sulaghan station. The hydrometric stations include Kiga (Gauge 1), Keshar (Gauge 2), and Sulaghan (Gauge 3) (Fig. 1). As shown in Fig. 1, there are three rain gauge stations in the basin and four synoptic stations around the basin.
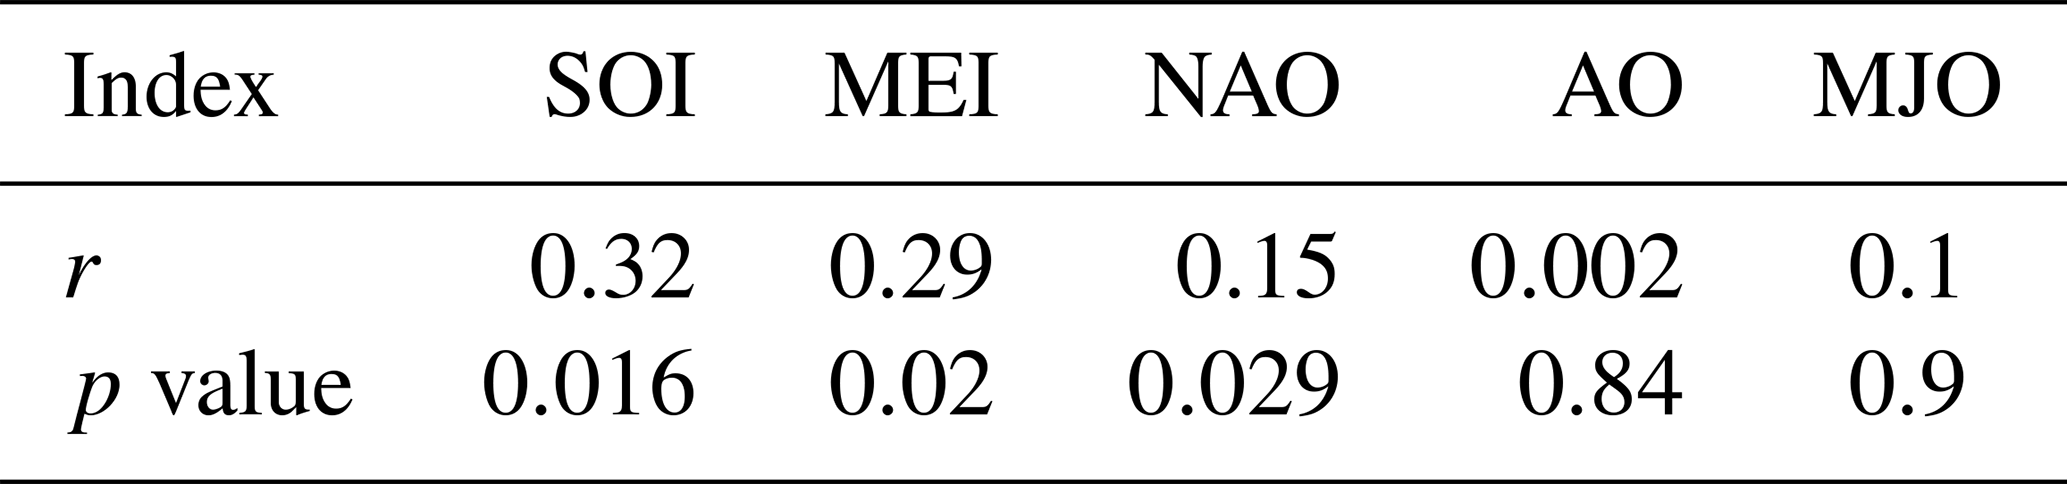
In this study, teleconnection indices, namely southern oscillation index (SOI), Multivariate ENSO Index (MEI), Arctic Oscillation (AO), North Atlantic Oscillation (NAO), and Madden–Julian Oscillation (MJO), were evaluated. An index that has the highest correlation with the precipitation in the study area was selected for further analysis. The Fisher's exact test of independence was used to test the significance of correlation between the teleconnection indices and precipitation. In the Fisher's exact test, the null hypothesis is that two variables are independent. In other words, the relative proportions of each teleconnection index are independent of the precipitation:
Considering the Fisher's exact test, if the p value is less than 0.05, the null hypothesis is rejected; i.e., the p value must be less than 0.05. According to the results (Table 1), there would be a statistically significant association between SOI (MEI and NAO as well) and precipitation. However, SOI has the highest correlation with the precipitation in the Kan River basin. Therefore, ENSO is the most important large-scale atmospheric signal that affects precipitation in the Kan River basin. It has been shown that rainfall intensity increases in the conditions of El Niño and decreases in the conditions of La Niña. Accordingly, the present study will assess the increase in flood damage due to El Niño occurrences. For this purpose, the following steps have been taken.
Table 1Correlation coefficient (r) and p value between precipitation at Mehrabad station and different teleconnection indices.
-
Step I: estimating the lag time (Tl) between the El Niño event and the precipitation in the study area. As the effect of ENSO takes time to be experienced in far geographic locations, the lag time between the ENSO occurrence and the related influences in the Kan River basin was firstly calculated. This lag time can be estimated by comparing the variations of SOI with local precipitation time series. The monthly rainfall at the nearby synoptic stations, including Mehrabad (1951–2017), Shemiran (1988–2017), Tehran Geophysics (1992–2017), and Chitgar (1997–2017) (see Fig. 1), and monthly SOI values are used. A statistical method, average mutual information (AMI), is used to determine the time delay. This method is based on the Shannon entropy theory and is a measure of the amount of information obtained about one random variable through the other random variable. Guiasu (1977) defined the mutual information of two random variables as a measure of the mutual dependence between two variables. Not limited to real-valued random variables and linear dependence like the correlation coefficient, mutual information is more general and determines how different the joint distribution of the pair (X, Y) is to the product of the marginal distributions of X and Y (Guiasu, 1977). Suppose A is monthly precipitation in the representative station of the basin and B is SOI. The AMI is defined between two measurements ai and bi belonging, respectively, to the sets A and B as follows (Cover and Thomas, 1991):
where PAB(ai, bj) is the conjugate probability density for measurements A and B with values of a and b, respectively, and PA(ai) and PB(bj) are the probability density function for measurements A and B. If ai (the measurements of A) is independent of bi (the measurements of B), then the value of IAB will be zero. In this paper, probabilities PA and PB were calculated using empirical frequency analysis in which the relative frequency histograms for both time series, SOI, and precipitation were determined. The values of AMI of different arbitrary lag times (1 to 12 months) between SOI and precipitation were calculated. The higher the AMI value is, the more dependency there will be between two time series. Therefore, that lag time corresponding to the highest AMI value was selected as the lag time between the time series. This method determines the lag time between two time series by using the nature of the data itself without any predetermined format based on probabilistic concepts (Cover and Thomas, 1991). In Eq. (2), K is the optimal number of statistical categories for fitting the statistical distribution on the measurements A and B. When dealing with large sets of numbers, Sturges' rule (Sturges, 1926) can be used to choose the number of categories. Sturges' rule is widely used in statistical packages like excel for making histograms. According to the rule, the data range should be split into K equally spaced classes:
where n is the amount of data in the corresponding interval (here n=480); therefore, in the present study, K equals 10. Note that there is uncertainty in the optimal number of categories that may influence the lag time between the precipitation in the basin and SOI.
-
Step II: estimating the amount of rainfall variation under the influence of El Niño. Secondly, the influence of El Niño on the precipitation amount in the Kan River basin is quantified. The influence is estimated using a statistical method by calculating the expected value of the changes of precipitation amount in the El Niño episodes compared to those in the neutral periods. In this study, the SOI values were obtained from the National Oceanic and Atmospheric Administration (NOAA) website (https://www.cpc.ncep.noaa.gov/data/indices/soi, last access: March 2018). Prolonged periods of negative SOI values accompany the abnormally warm ocean waters across the eastern tropical Pacific. La Niña and El Niño are characterized, respectively, by SOI > +1 and SOI < −1 (WRCC, 2010). Then annual precipitation change (PC) in El Niño conditions is calculated as follows:
where (mm) is annual rainfall in every El Niño episode, PN (mm) is average annual rainfall in normal episodes, and T is the number of El Niño events in the time period (here T=6). Then the median of PC values (ΔP; mm) will be used to construct synthesized rainfall storms. It should be noted that one limitation of this research is that the annual change factor is applied in the extreme rainfalls of short timescales. Certainly it is better to consider the monthly or seasonal change factor or to use extreme rainfalls on the basis of recorded storms. However, this paper uses annual precipitation and a change factor to estimate extreme rainfall due to data limitations.
-
Step III: estimation of design rainfalls with different return periods. Thirdly, several design storms are generated. The rainfall storms are synthesized based upon the average precipitation change during El Niño events. The designed storms are used for assessing the flood damage in a certain return period. To do so, the intensity–duration–frequency (IDF) rainfall curve of Kan basin was obtained from the Water Research Institute (WRI; WRI, 2011b). The time of concentration (Tc) of the basin is 135.19 min (using the Kirpich equation). Therefore, the intensity of design rainfall (id) can be deduced for different return periods (here, three return periods of 5, 10, and 50 years are considered). These return periods are selected in accordance with the paper's objective to show the importance of small floods in flood management plans compared to long return period floods. Then the rainfall intensity in El Niño conditions (iE) can be calculated by multiplying id and ΔP.
-
Step IV: hydrological modeling. Fourthly, the Hydrologic Engineering Center and Hydrologic Modeling System (HEC-HMS) hydrologic model is used to simulate the rainfall-runoff process using the design storms generated in Step III. The hydrologic model is run for each return period. The simulated peak discharge is used in the next step to estimate the flooding depth. In the hydrologic model, the Soil Conservation Society (SCS) method is used to calculate the effective rainfall (Pe; mm):
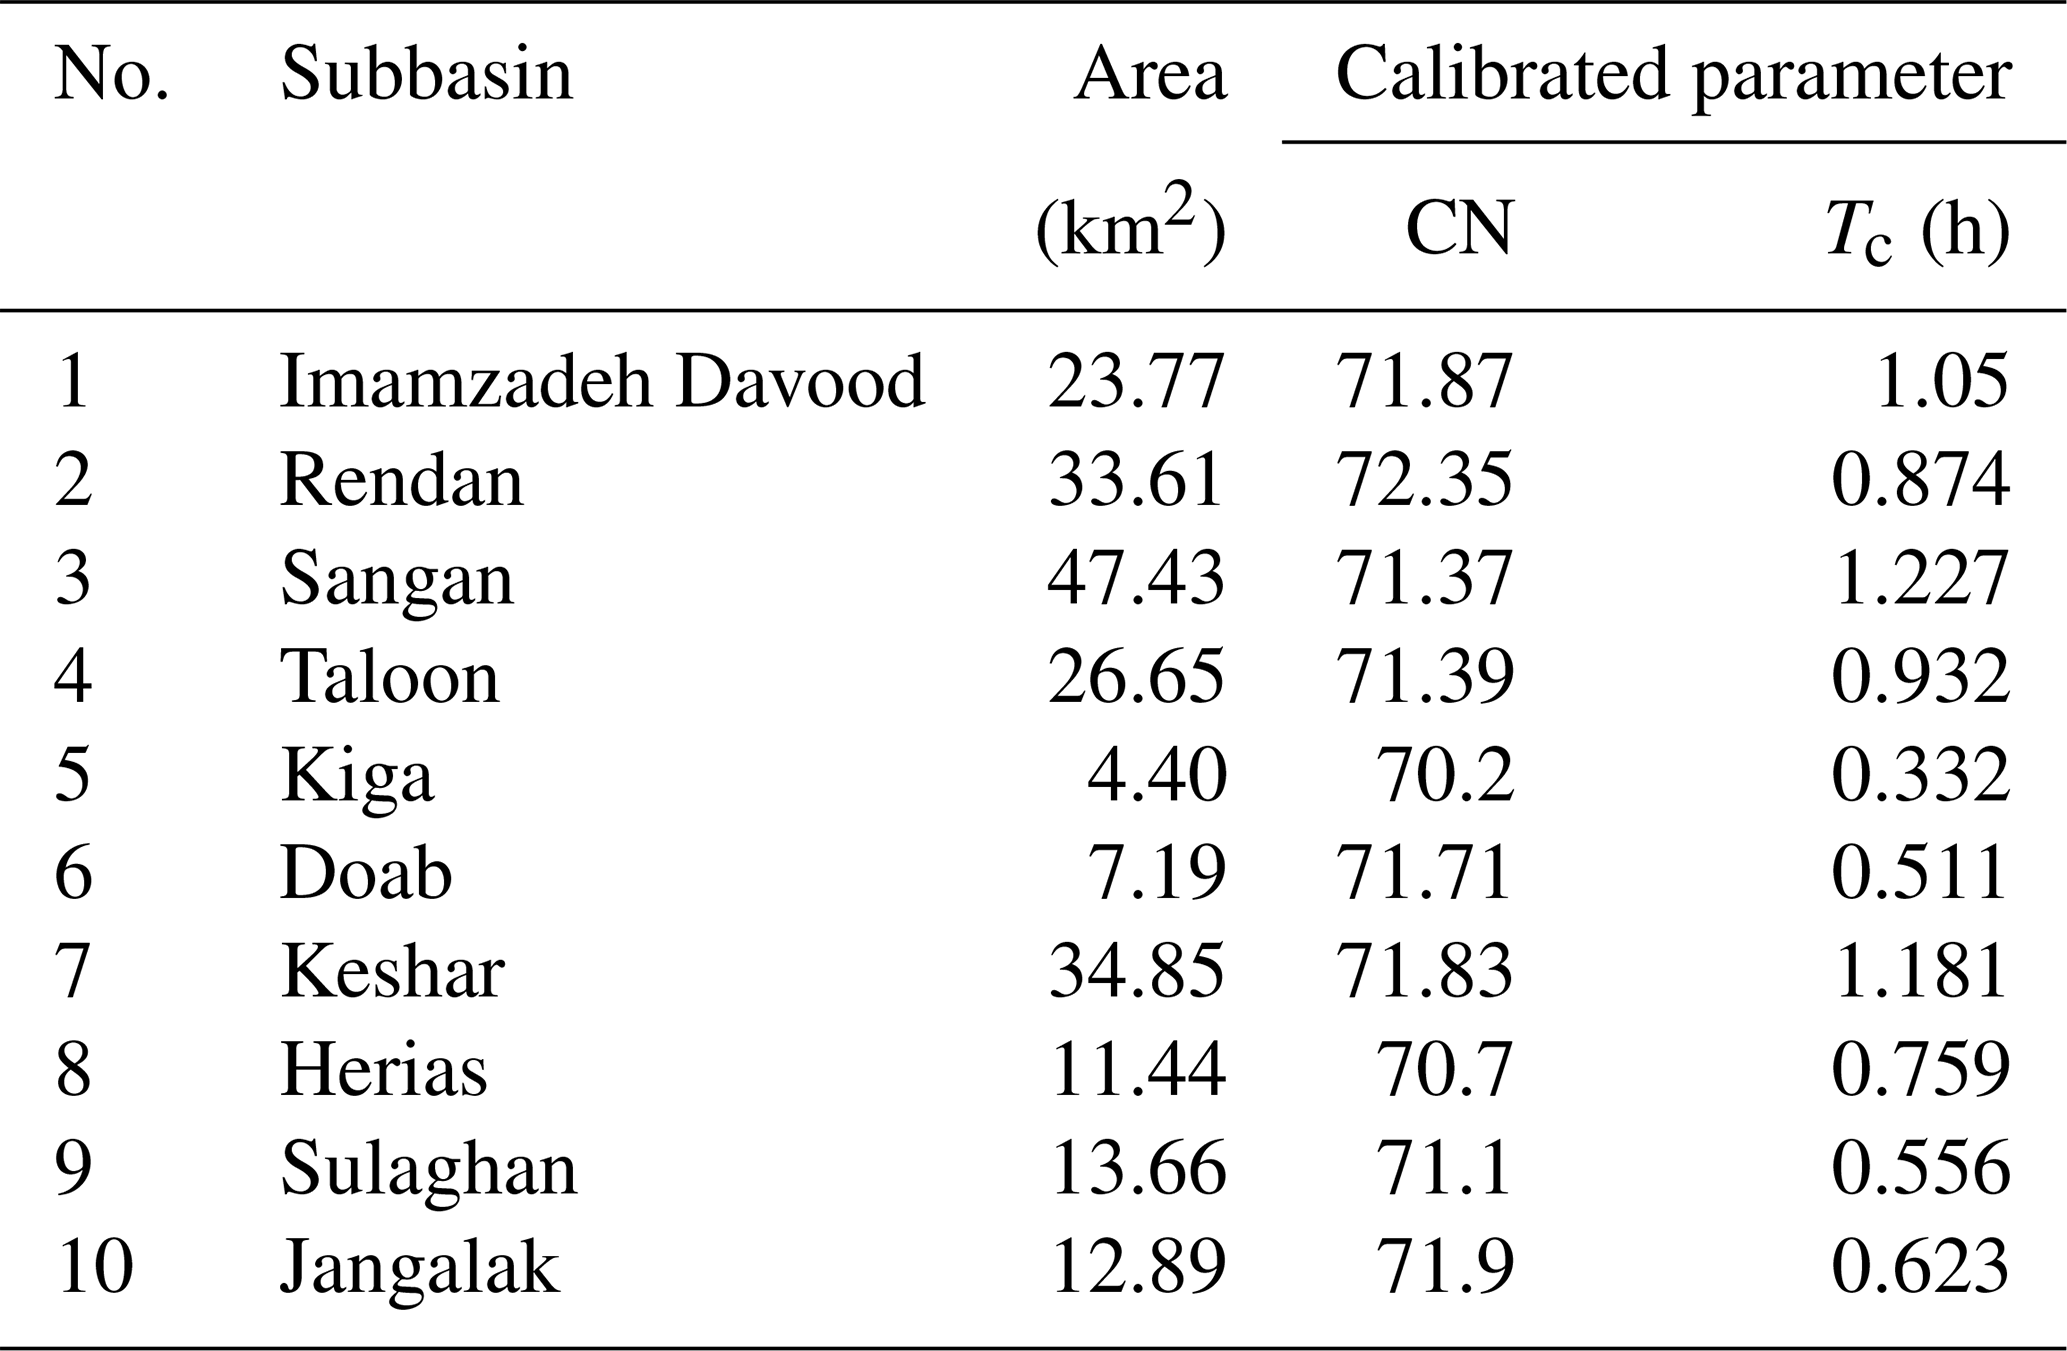
where P (mm) is rainfall and S (mm) is potential maximum retention. The constant value 0.2 is selected based on the SCS recommendation to estimate initial losses as Ia=0.2S (Ponce and Hawkins, 1996). Moreover, the Clark instantaneous unit hydrograph method is applied to transform the effective rainfall into runoff (Q), and the two-parameter Muskingum method is used for flood routing. The Muskingum method calculates the discharge within the river given the inflow hydrograph at the upstream end. For the calibration of the HEC-HMS model, hourly historical storms which had been recorded at three rain gauge stations in the basin and the related runoffs at the hydrometric stations (Fig. 1) are used. Note that for calculations of rainfall specific to every subbasin, the gauge weight method is used when the weights were determined from the Thiessen method. The curve numbers (CNs) and time of concentration (Tc) are calibrated within 10 subbasins. For the calibration and verification of the hydrologic model, four storm events were extracted from 15 years of available data (2000–2014): (1) the storm of 15–18 April 2003 in which a flood of maximum 38.22 m3 s−1 was recorded at Gauge 3, (2) the storm of 16–19 April 2002 where the peak discharge rate of 32.3 m3 s−1 was recorded at Gauge 3, (3) the storm of 15–17 April 2009 in which a flood of maximum 34 m3 s−1 was recorded at Gauge 3, and (4) the storm of 11–13 March 2011 where the peak discharge rate of 55.1 m3 s−1 was recorded at Gauge 3. Then the calibrated model can be used for modeling the rainfall of given return periods to calculate the flood hydrographs at the outlet of the subbasins.
-
Step V: hydraulic modeling. Fifthly, the Hydrological Engineering Center and River Analysis System (HEC-RAS) model is used for hydraulic modeling and the determination of flood depth at the target points (residential areas shown in Fig. 1). Based on the obtained flood depth, the flooding area is determined for designed storms in El Niño and neutral episodes. HEC-RAS is a one-dimensional model based on the numerical solution of the Saint-Venant equations. The model is calibrated by adjusting the Manning roughness coefficients at different river sections. The calibrated HEC-RAS model under steady state conditions is then driven by the simulated peak discharges from HEC-HMS hydrologic model to simulate flood depths at the target points.
-
Step VI: estimating expected damage cost. Finally, flood damage is assessed for all six runs of the model. These sources of damage can be compared to each other in order to determine the role of El Niño. Damage caused by flooding can be divided into two groups: tangible and intangible sources of damage. Intangible damage is that caused by illnesses and mental problems due to loss of life or property. Tangible damage can be categorized into direct and indirect sources of damage. Direct damage is that caused by the flooding of buildings and properties to such things as home equipment, crops, livestock, and poultry. Indirect damage is due to the disruption of trade and business, threats to life, the need for emergency services, and so on. Note that this paper focuses on direct, tangible damage only.
Damage caused by flood is a function of its characteristics, including flow depth and inundation amount, duration of inundation, and flow velocity. One of the commonly used methods for estimating flood damage is the damage–depth curve method which gives the relationship between damage percentile and flood depth (Corry et al., 1980; KGS_Group, 2000; Messner et al., 2007; Olesen et al., 2017; Wobus et al., 2017; Jamali et al., 2018). The damage–depth curves have been prepared for different land uses of the Kan River basin (Fig. 2) by the Federal Emergency Management Administration (Berkman and Brown, 2015). The main land uses of the Kan River floodplain are residential buildings, restaurants, and fruit gardens (WRI, 2011c). The damage cost is then calculated to include the total monetary value of the inundated land-use-specific property. A comprehensive analysis of physical damage due to flooding requires information including accurate land use maps, area and age of buildings, type of structures, number of floors, exact area of different agricultural crops in the flood-prone area, crop number per unit area, value of crops, value of buildings and their contents, number of residential, administrative, and commercial buildings in the flood prone areas, area and elevation of buildings, their locations, and the spatial distribution of flood depth in the inundated areas for different return periods. In this paper, a simplistic approach is used for this regard. For the building damage analysis, separating buildings into residential and commercial ones, the total area of inundated buildings, average inundation depth, and the average economic value of the buildings and their contents for every building type are considered. For agricultural damage analysis, considering the dominant crops of cherries and apples and including the area of inundation, average inundation depth, crop density, and average price of one single crop, the flood damage is assessed.
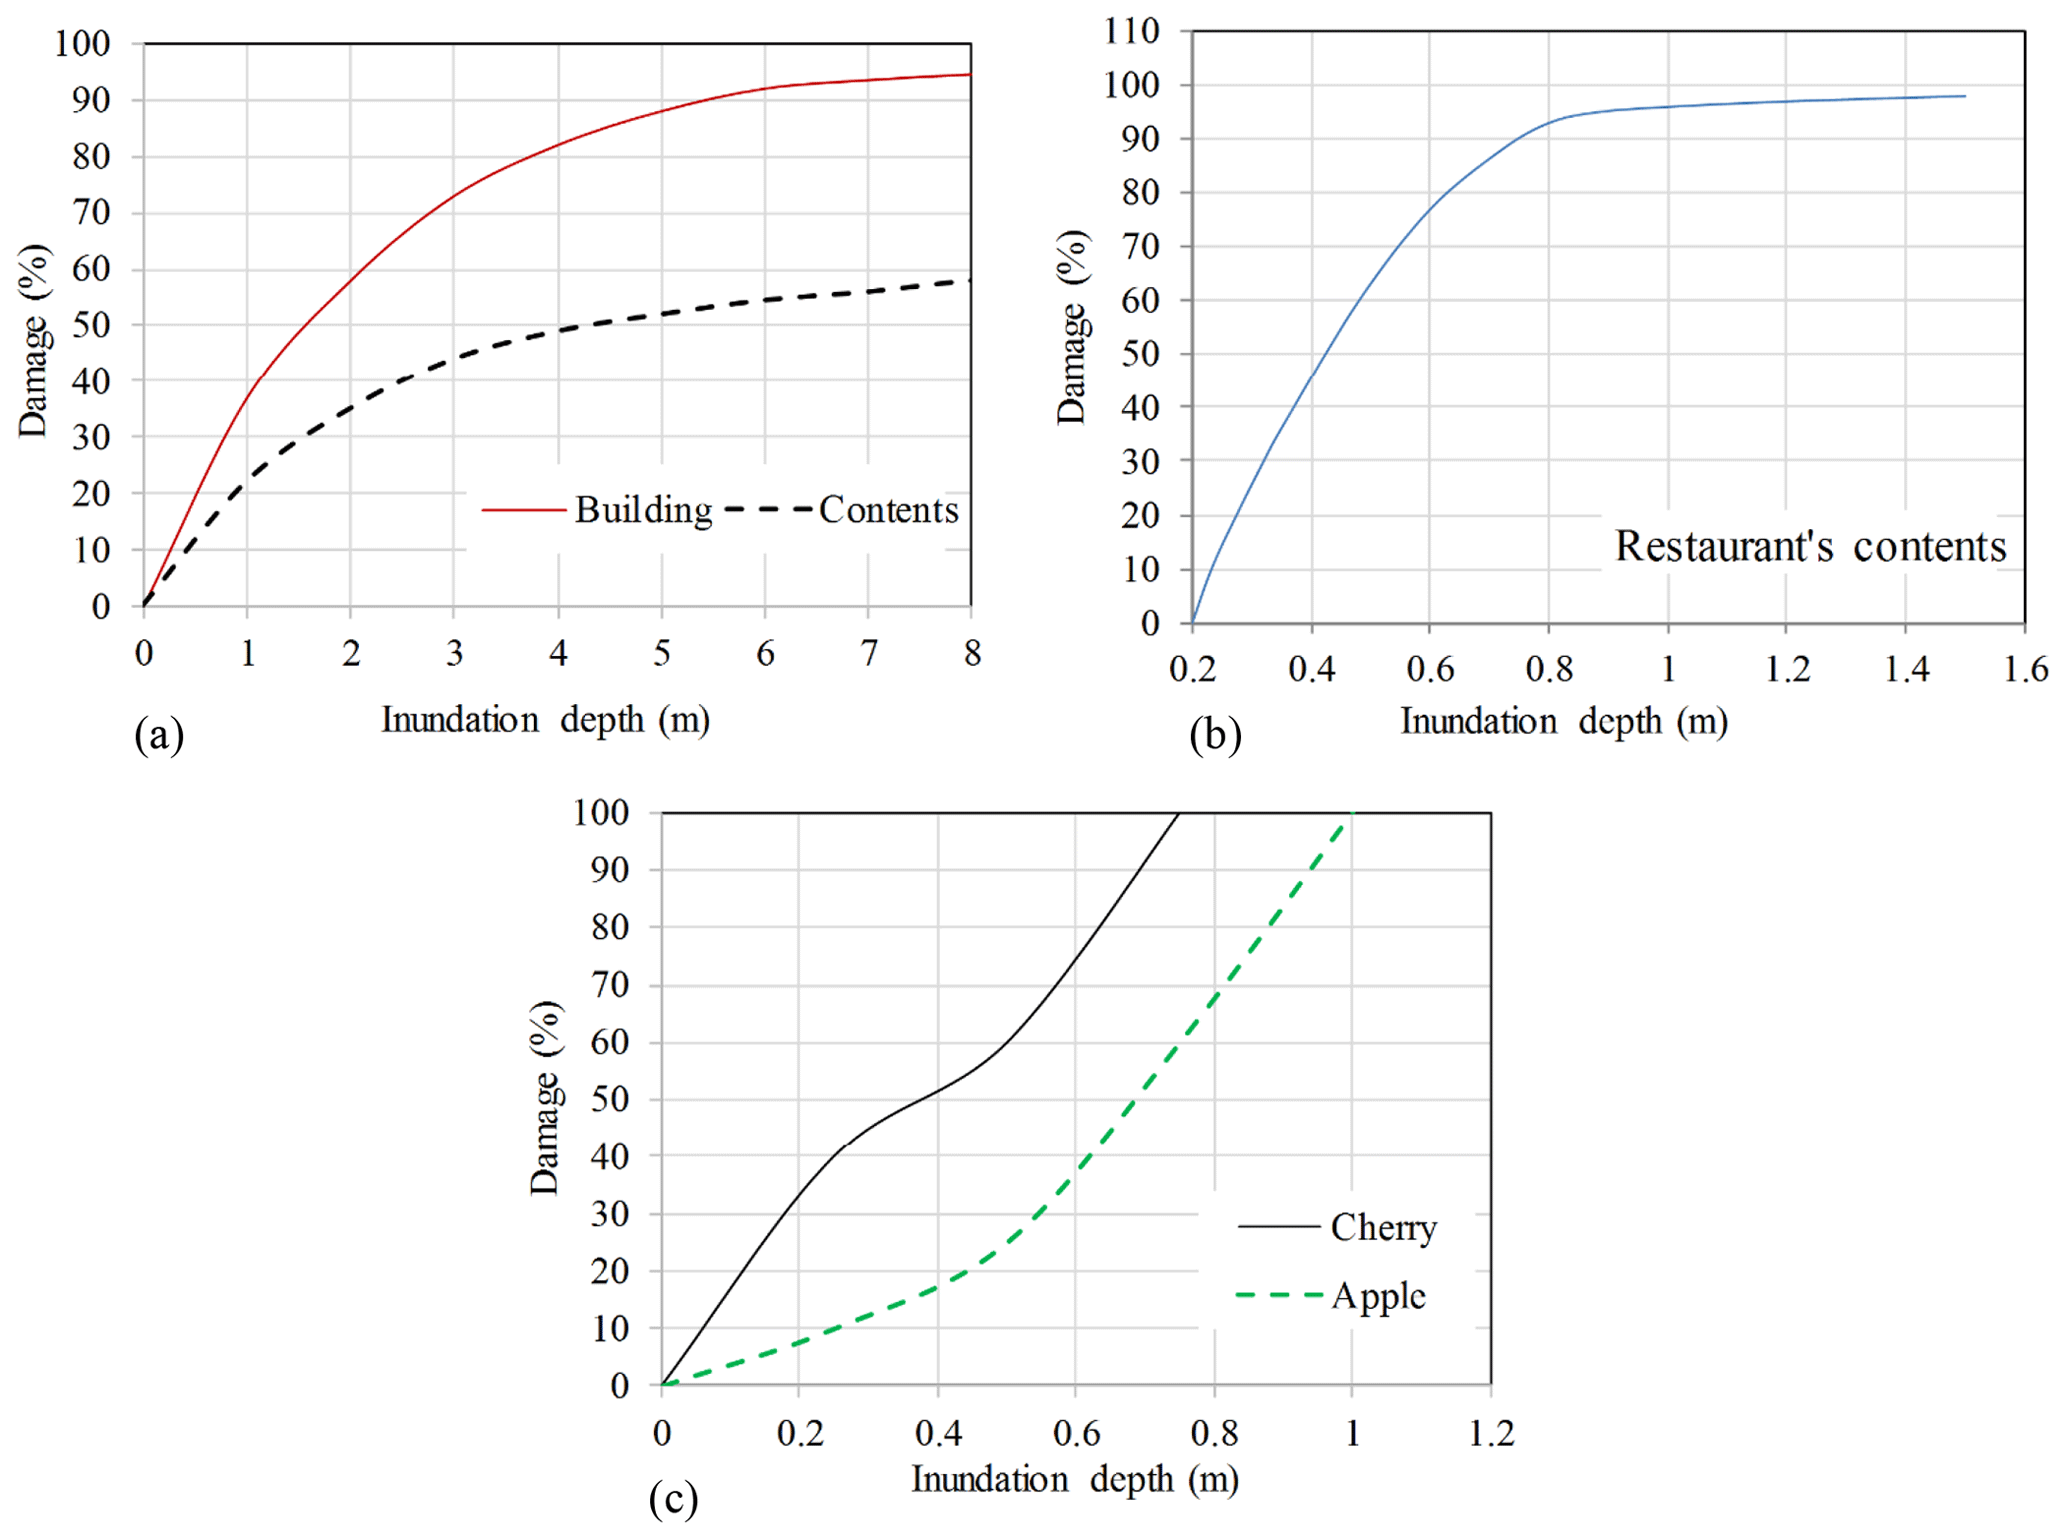
Figure 2Damage–depth curves for different land uses of (a) a building and its contents, (b) a restaurant's contents, and (c) agriculture in the Kan River basin.
Monthly analyses of the precipitation in the synoptic stations and SOI using the AMI method showed that there is no lag time between rainfall and SOI time series (the lag time is less than 1 month). There are 161 months with El Niño and 128 months with La Niña events over the period of 1951–2017. The average monthly rainfall at Mehrabad station in El Niño episodes is 21.4 mm and in La Niña episodes 16.2 mm, while in normal conditions it is 19 mm. In Fig. 3, the annual rainfall of stations is plotted against the SOI index. It is obvious that with the decreasing SOI index, annual rainfall increases in the study area and vice versa. In the period of 1951–2017, a total of six El Niño (SOI < −1) and five La Niña (SOI > +1) events occurred. Out of the six El Niño years, five periods have experienced an increase in precipitation (2 %–45 %) and one period a decrease in precipitation (−34 %). The largest events for El Niño date back to 1983 and 1987, respectively, with 334 and 252 mm recorded rainfall at Mehrabad station. Furthermore, based on the trend lines, a one unit decrease in SOI would lead to a 22.5 mm increase in annual rainfall at Mehrabad station (Fig. 3a). For further analyses, Mehrabad station was chosen because it has more data than the other stations. There are 6 years with El Niño events and 55 normal years among the total of 66 years (1951–2017). Using Eq. (4), for the 6 years with El Niño conditions, the PC values range from −34 % to 45 %, while the latter is related to the year 1983 in which the high value of 334 mm of rainfall was recorded. The median of the PC values can be calculated (ΔP=12.2 %). It should be noted that the threshold of SOI = −1 is an assumption that affects the results significantly.
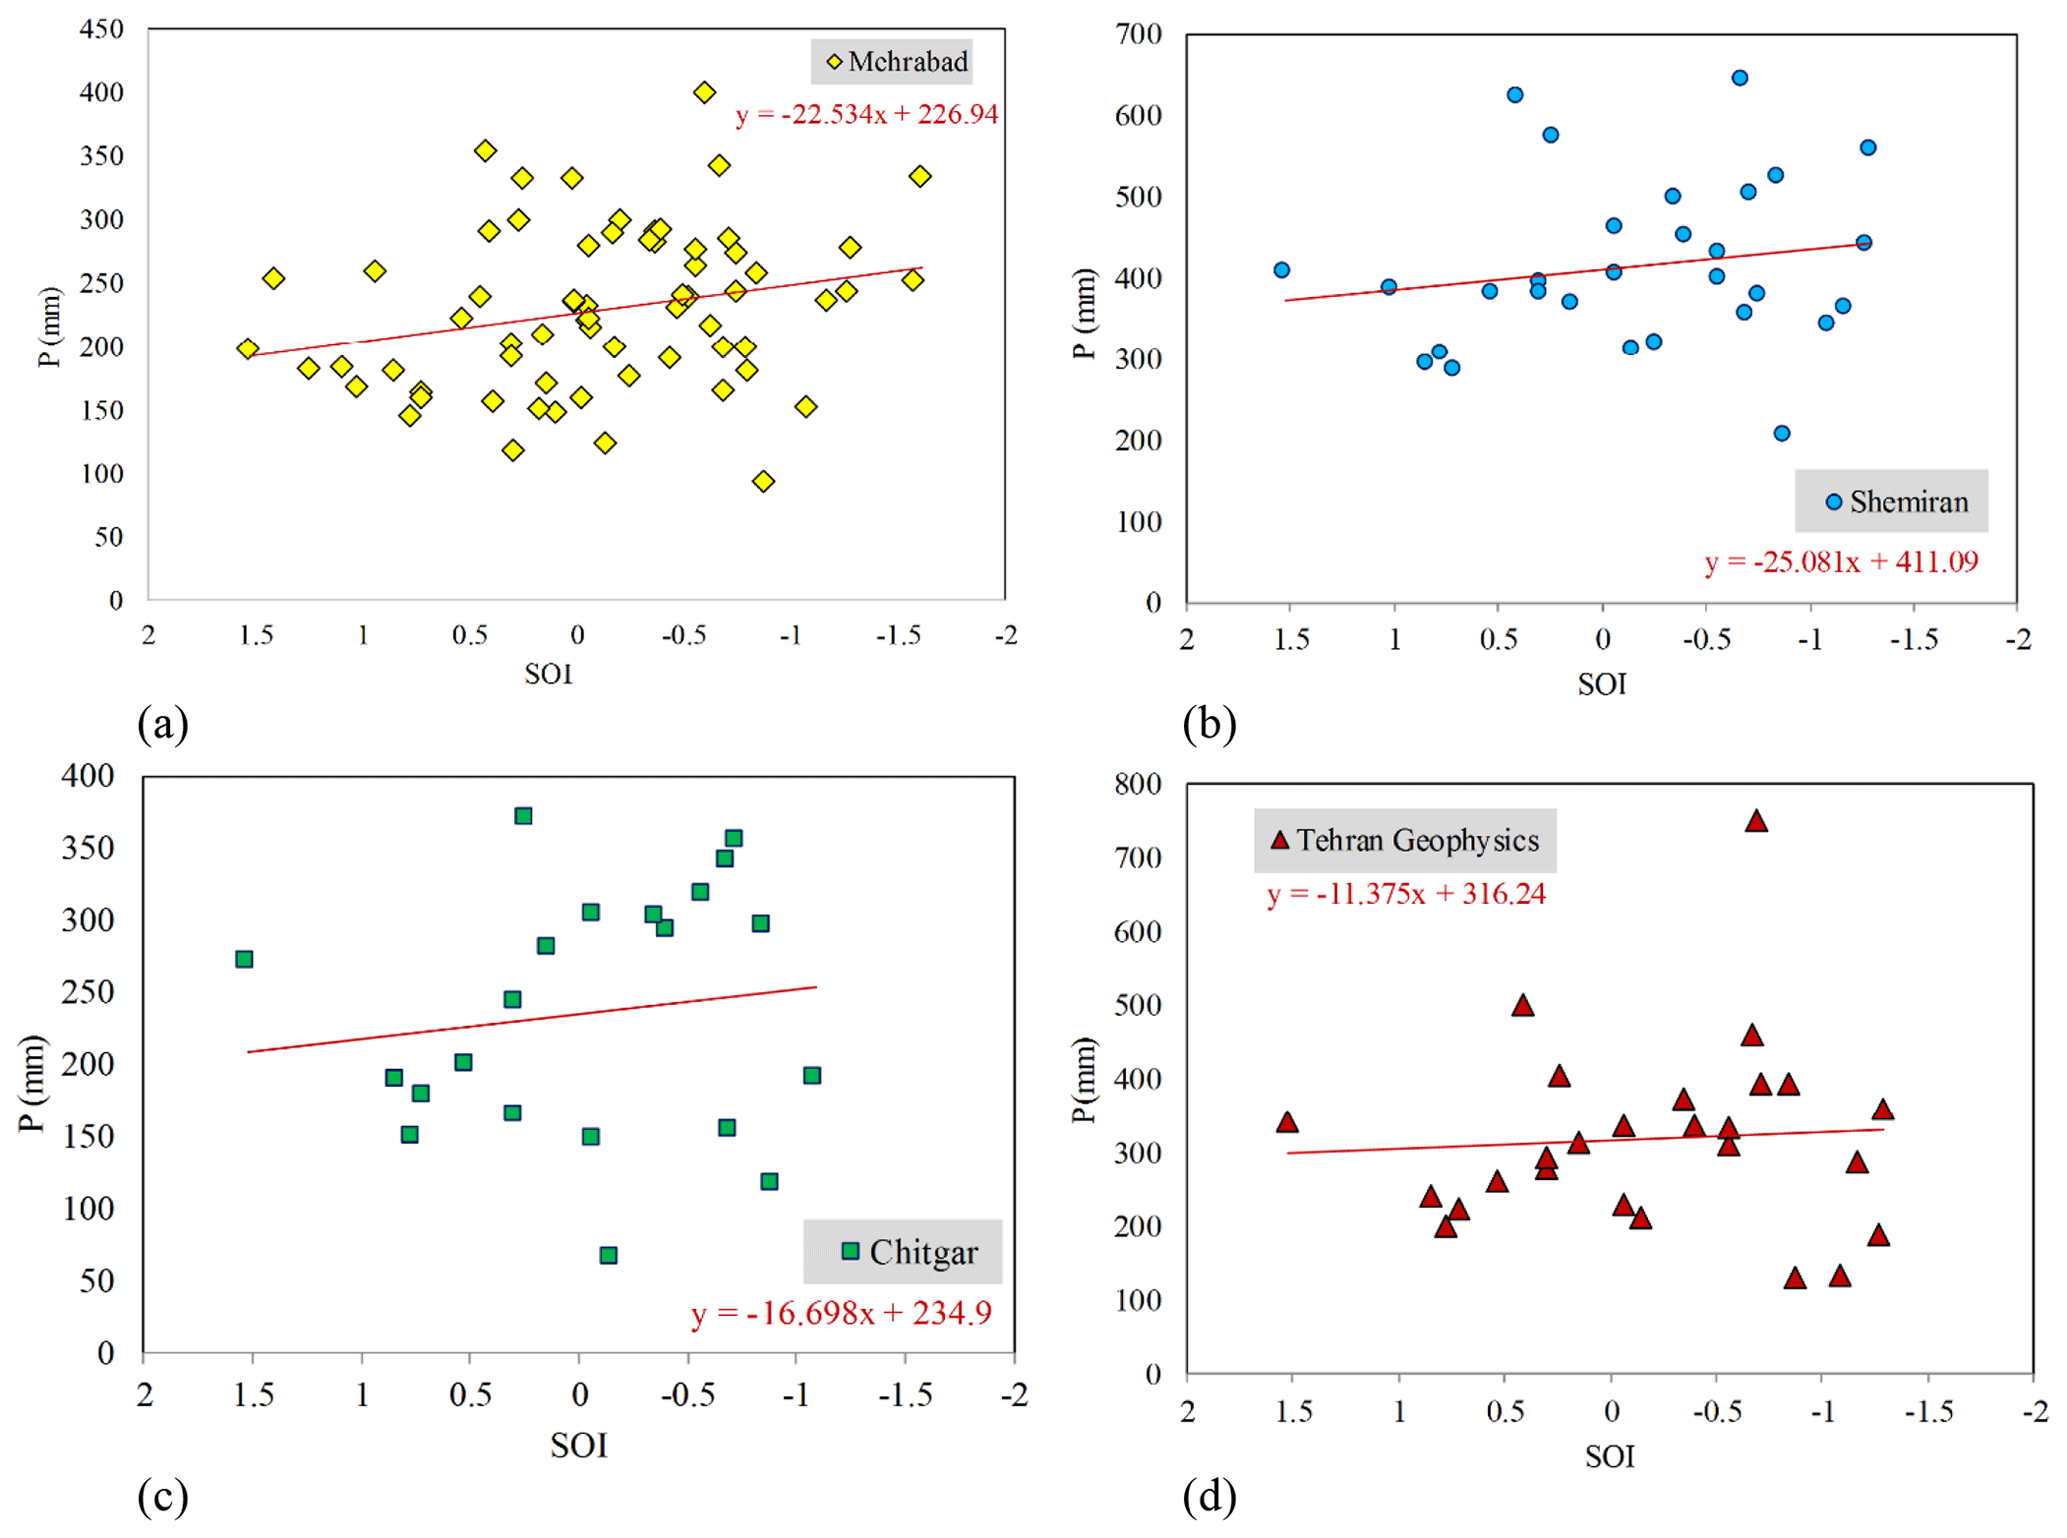
Figure 3Annual rainfall against SOI index at the stations of (a) Mehrabad, (b) Shemiran, (c) Chitgar, and (d) Tehran Geophysics.
The Kan River basin has a 135.19 min time of concentration. Therefore, considering the duration of the design rainfall as D=150 min, id can be estimated from IDF curves. For return periods of 5, 10, and 50 years, id values are 7.8, 9.5, and 13 mm h−1, respectively. Thus, iE values can be calculated as 8.76, 10.66, and 14.59 mm h−1, respectively, for return periods of 5, 10, and 50 years.
4.1 Hydrologic and hydraulic modeling
The HEC-HMS model was calibrated using a flood event recorded in April 2003. The calibration parameters include the curve number (CN) and concentration time (Tc) of the subbasins. In the process of automatic calibration, the parameters are determined in such a way that the model could simulate the hydrologic behavior of the basin accurately. The main objective is to predict the exact peak discharge and the time to the peak of the hydrograph in the hydrometric stations by minimizing the mean squared error (MSE) between predictions and observations. Figure 4a shows the comparison between the observed and simulated hydrographs at Gauge 3. Figure 4b shows the results for the upstream gauges (Gauge 1 and Gauge 2). Table 2 shows the calibrated parameter values for the hydrologic modeling. The hydrologic model is verified with the flood events in April 2002, April 2009, and March 2011 which have, respectively, peak discharges of 31.5, 34.4, and 54.1 m3 s−1. A comparison between the simulated and observed flood hydrographs is shown in Fig. 4c. It is noted that, for the flood in March 2011, the peak value of 54.1 m3 s−1 was provided by the estimation of the Regional Water Company of Tehran. The discharges in the upstream stations are not available and thus are not compared. The verification suggests that the model using the estimated parameters can be used to predict flood hydrographs under the design storms at the subbasins.
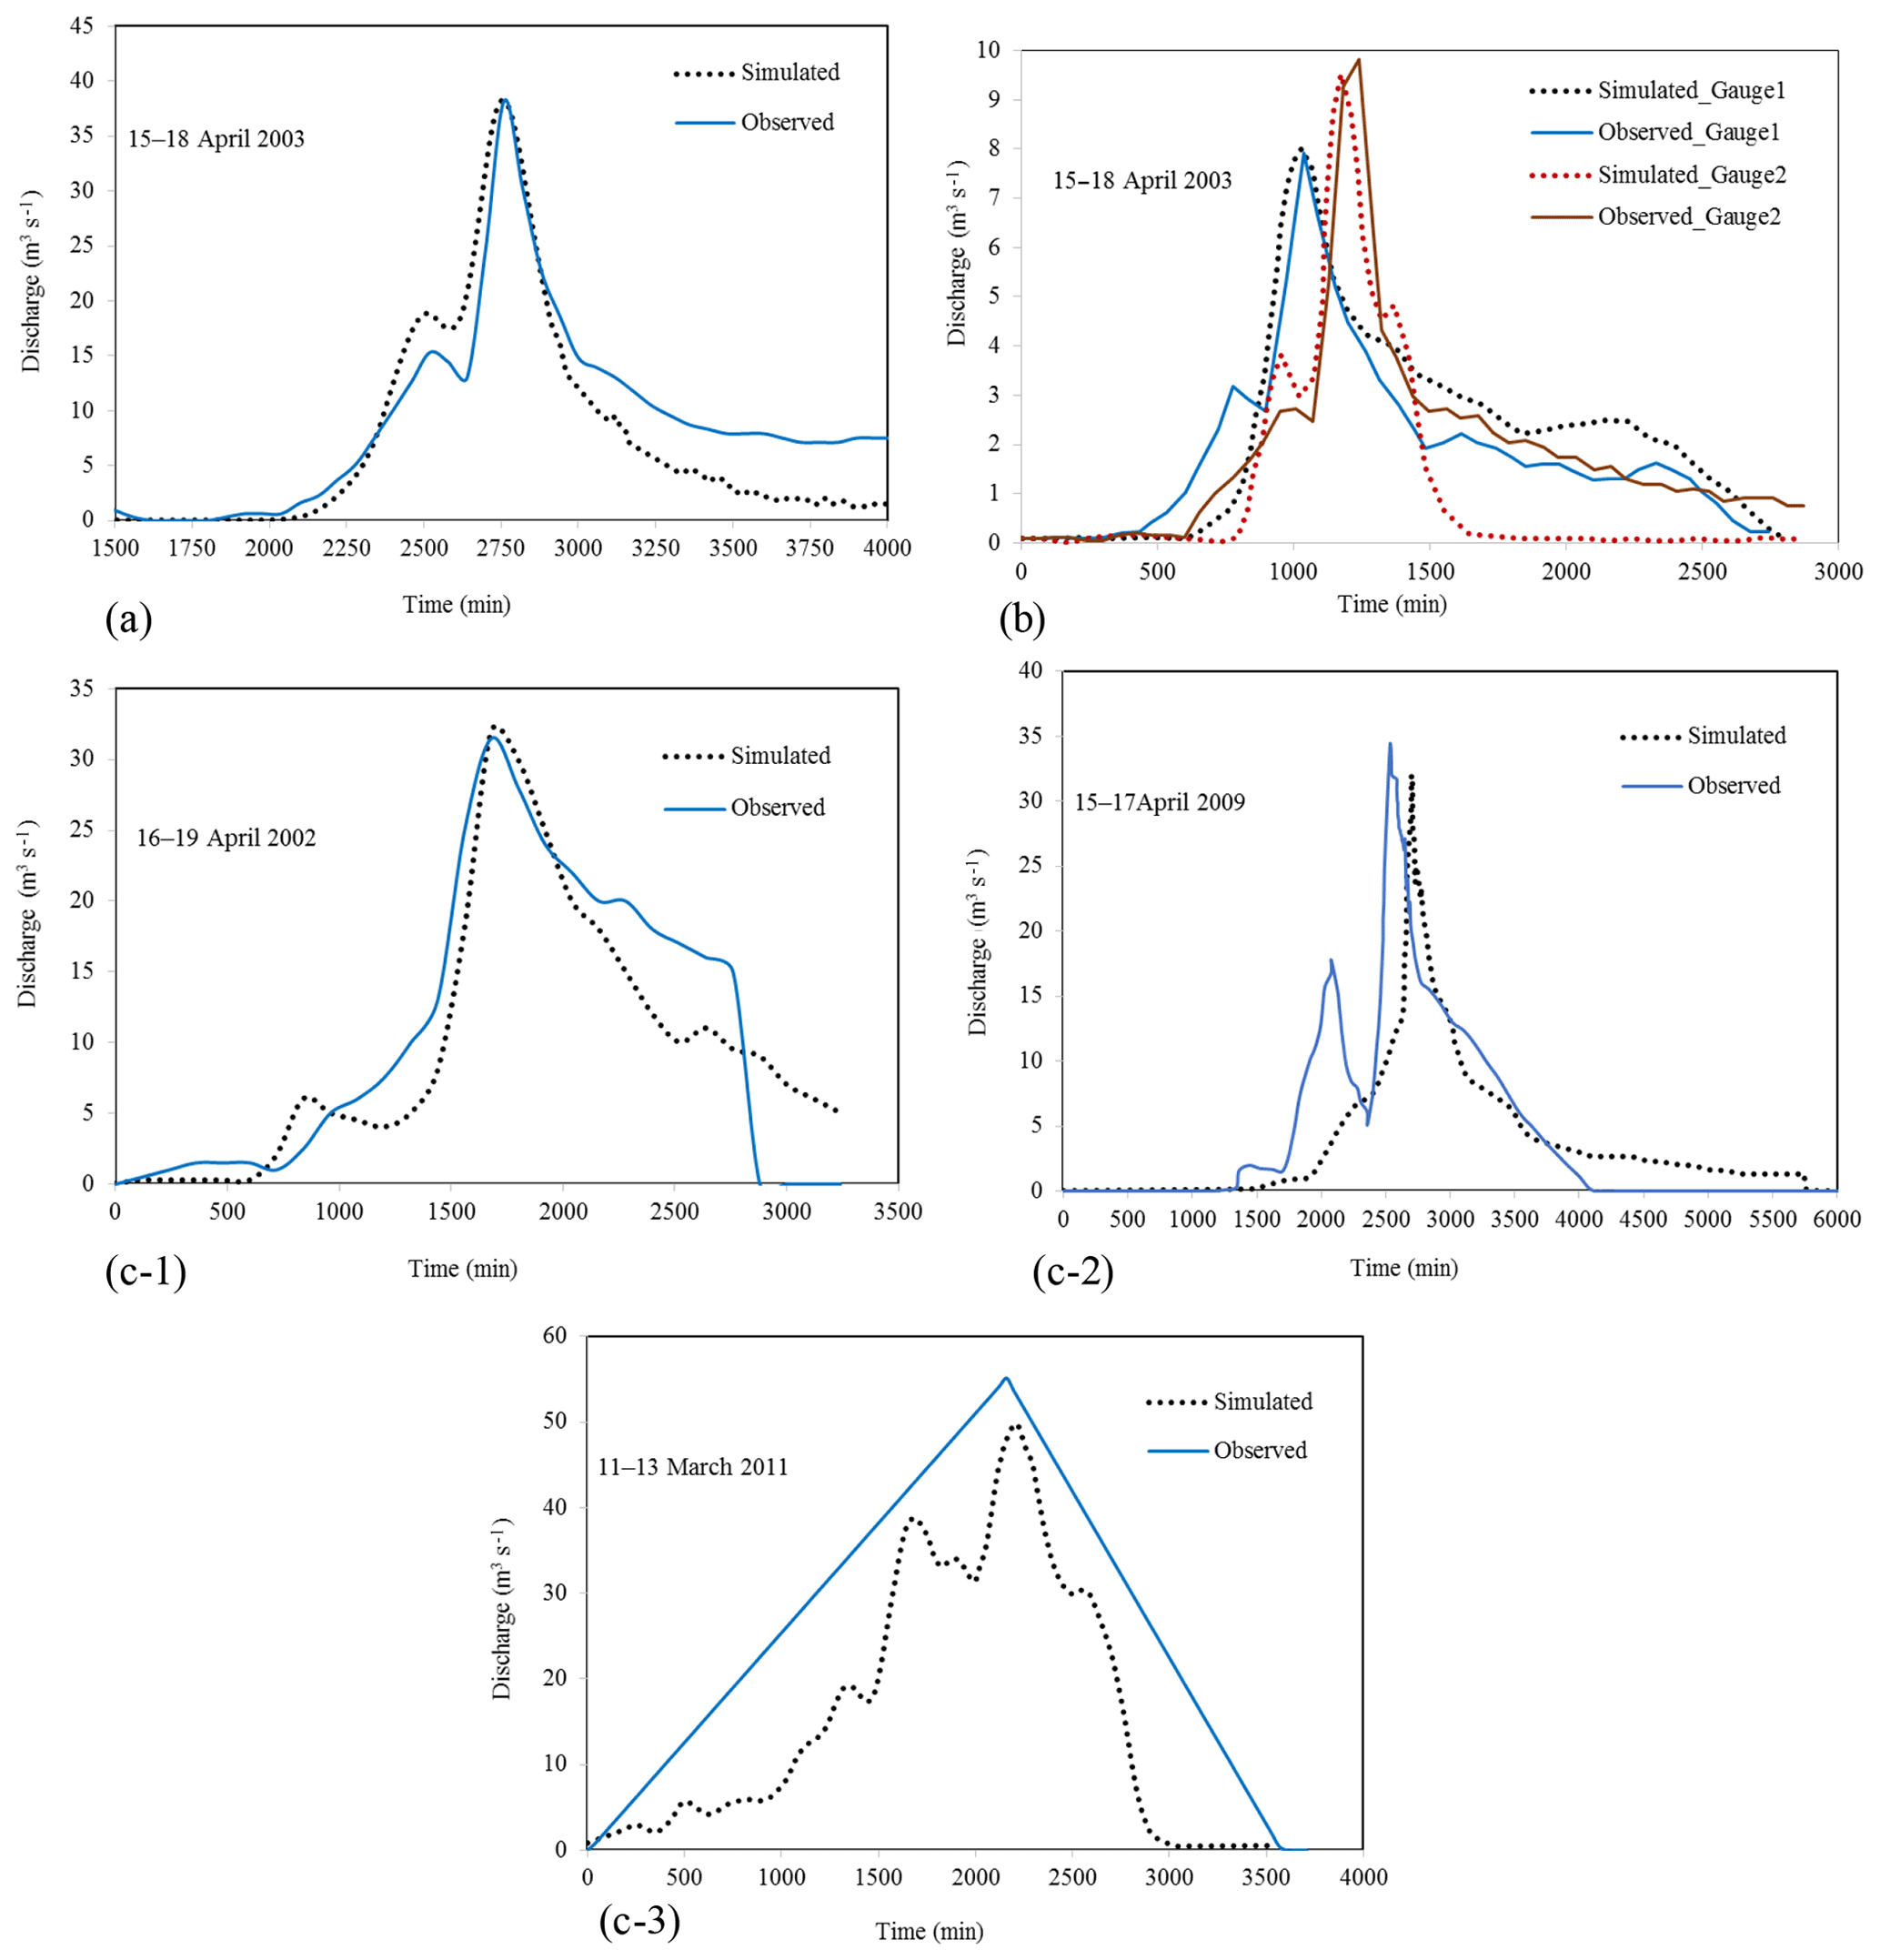
Figure 4The observed and simulated flood hydrographs in (a) the calibration step at Sulaghan station (15–18 April 2003), (b) the calibration step at upstream gauges (15–18 April 2003), and (c) the verification step at Sulaghan station (16–19 April 2002, 15–17 April 2009, and 11–13 March 2011).
Table 2The calibrated parameters for the HEC-HMS hydrologic model.
Then the HEC-RAS model is used to simulate the path of the flood and to determine the flood depths of different return periods at the target points. For starting the hydraulic modeling, HEC-RAS requires cross sections of the river at different points. In this study, the cross sections were extracted from a digital elevation model. Flood hydrographs of the subbasins with different return periods were simulated by the calibrated rainfall-runoff model (HEC-HMS), and the peak values were used as the boundary conditions for the HEC-RAS model. For the model's calibration, the peak discharges produced in the hydrologic model's calibration step (the flood event during 15–18 April 2003) are inputted into the hydraulic model as the boundary conditions at the upstream reaches, and the flood depth and discharge at Sulaghan station are compared with the observations. The parameters of the HEC-RAS model such as Manning roughness coefficients are calibrated manually. For the model verification, the flood event of 16–19 April 2002 and the upstream peak discharges generated by the hydrologic model are used.
The hydrologic and hydraulic models are applied for modeling floods under the design storms of 5-, 10-, and 50-year return periods. For floods under design storm conditions of each return period, one model run under El Niño and one under normal conditions are required. There are a total of six different runs of the combined hydrologic and hydraulic model. Using the obtained inundated depths, the flood mapping can be shown. Figure 5 illustrates the inundation areas at two target points (Sulaghan and Sangan villages) for the 50-year flood in normal conditions.
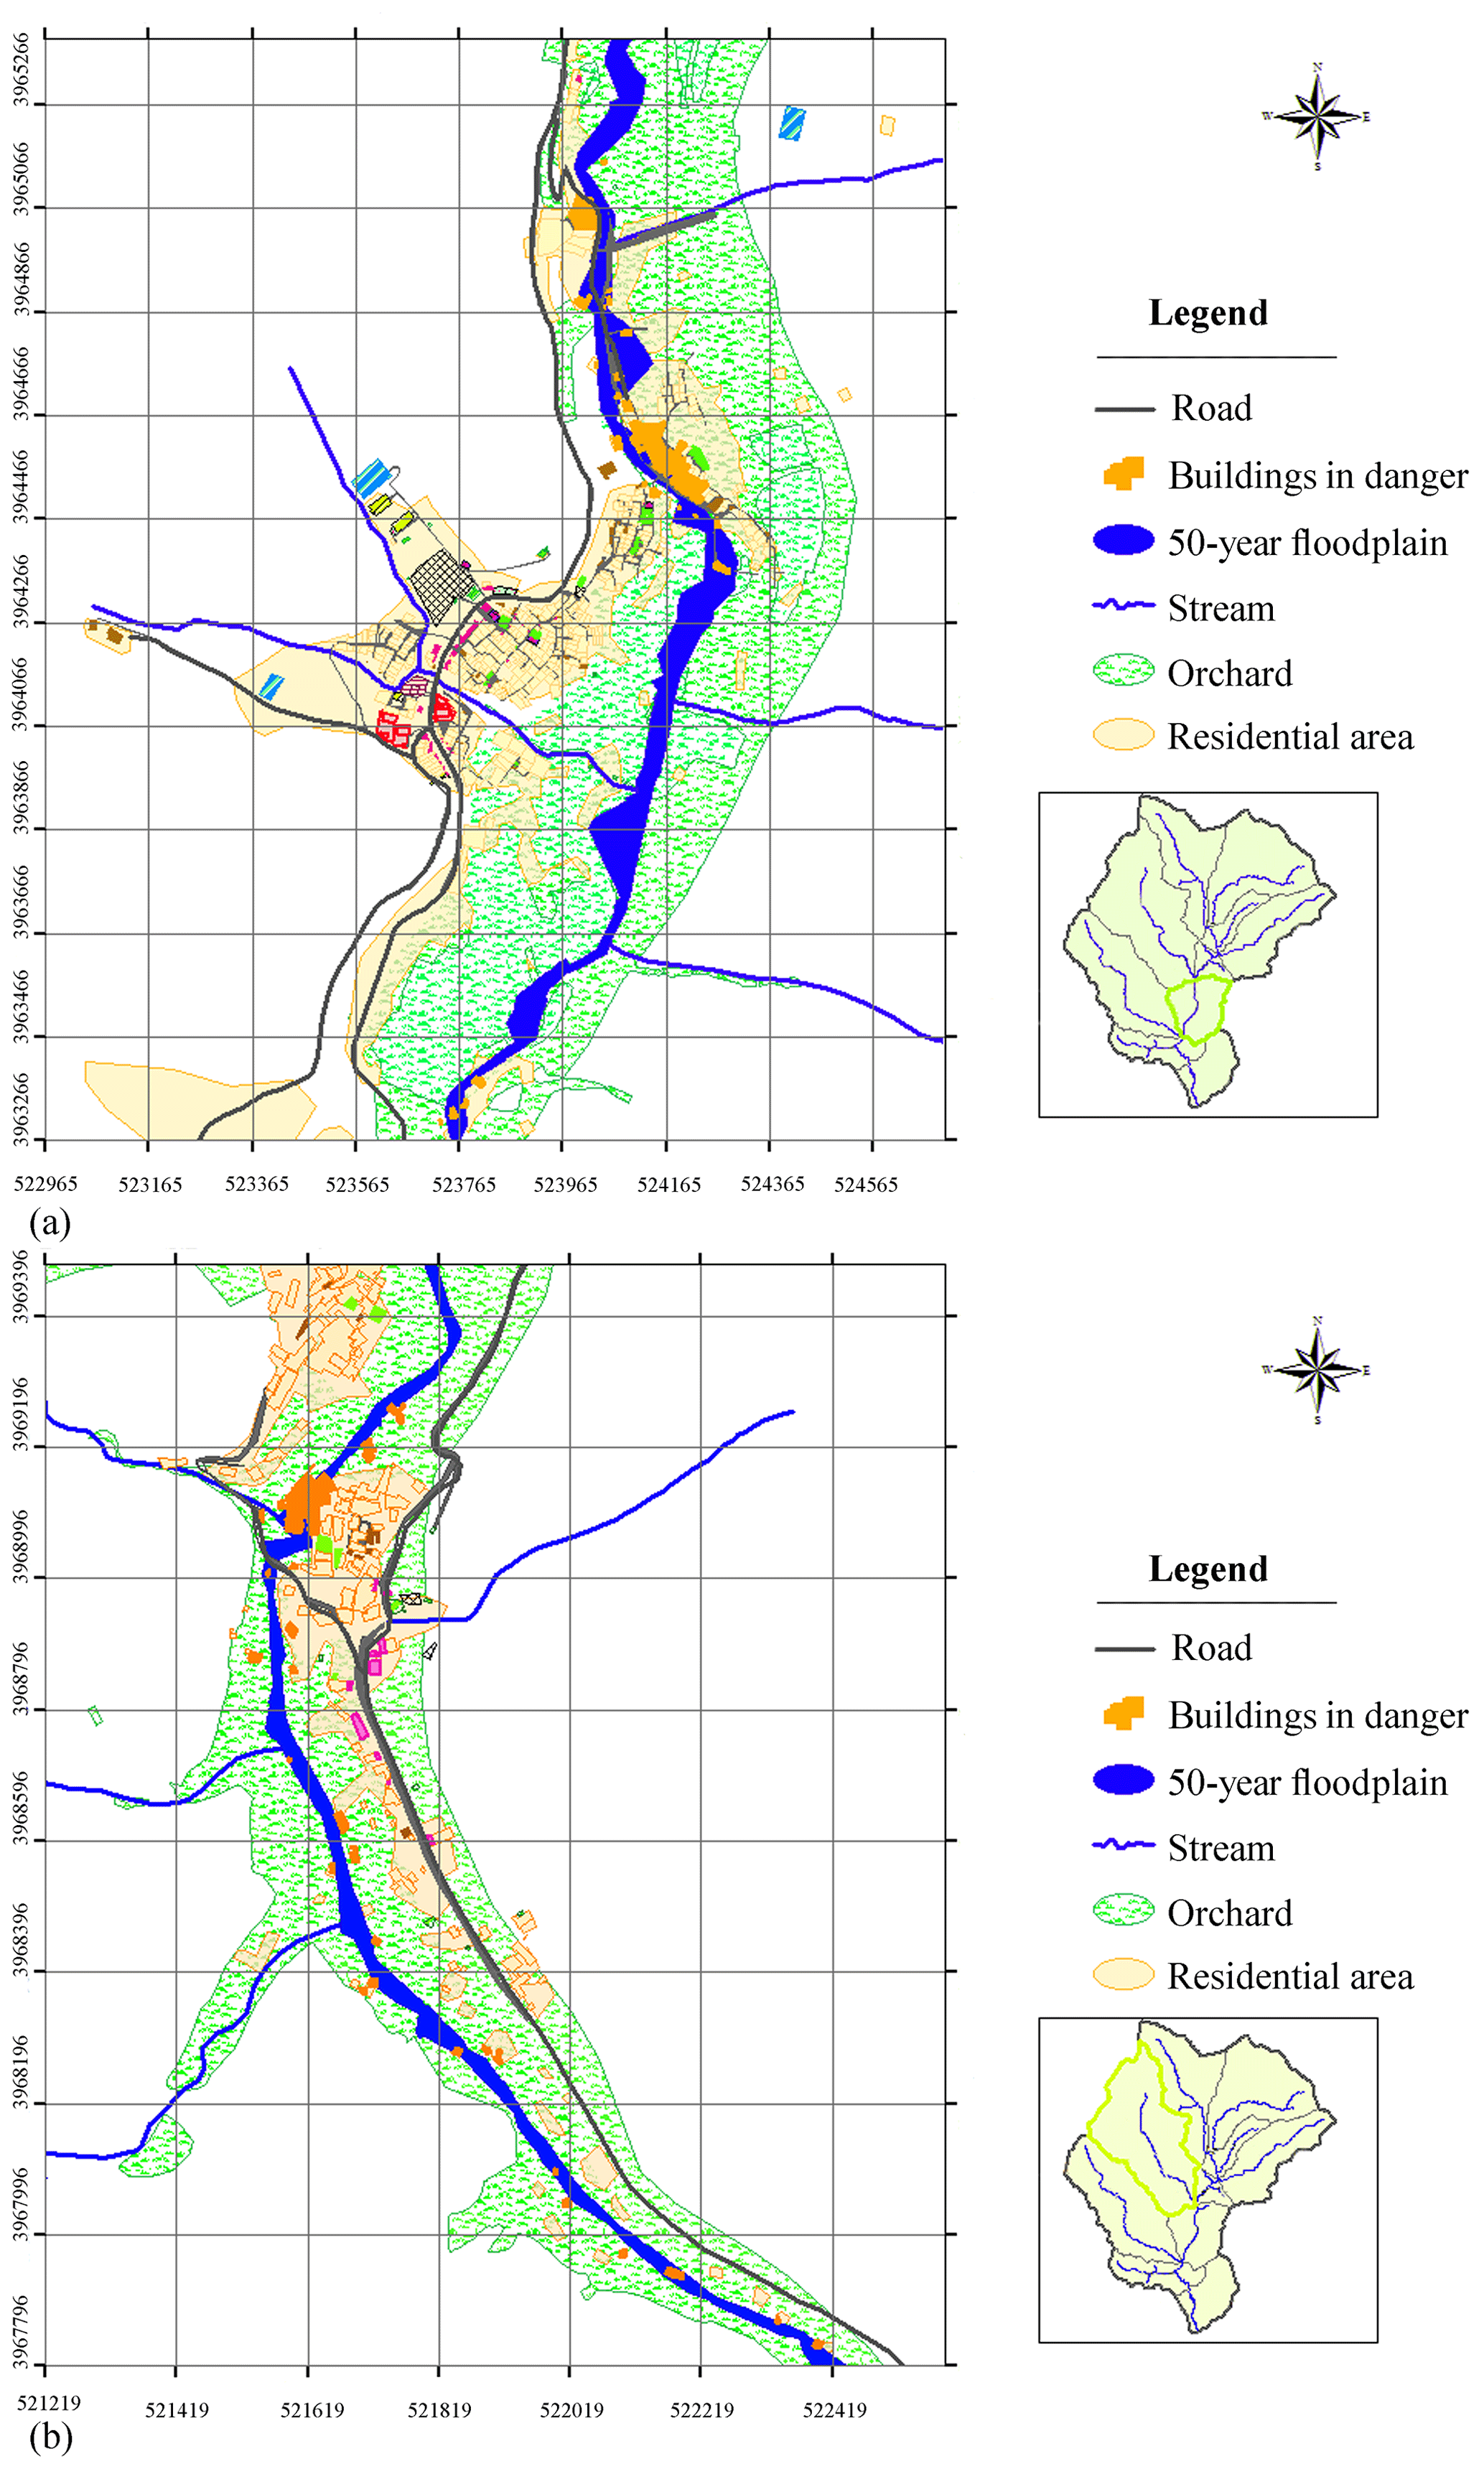
Figure 5The 50-year floodplain in the subbasins of (a) Sulaghan and (b) Sangan (the original layers are obtained from WRI, 2011a).
Table 3Physical damage to the subbasin properties for floods at different return periods.
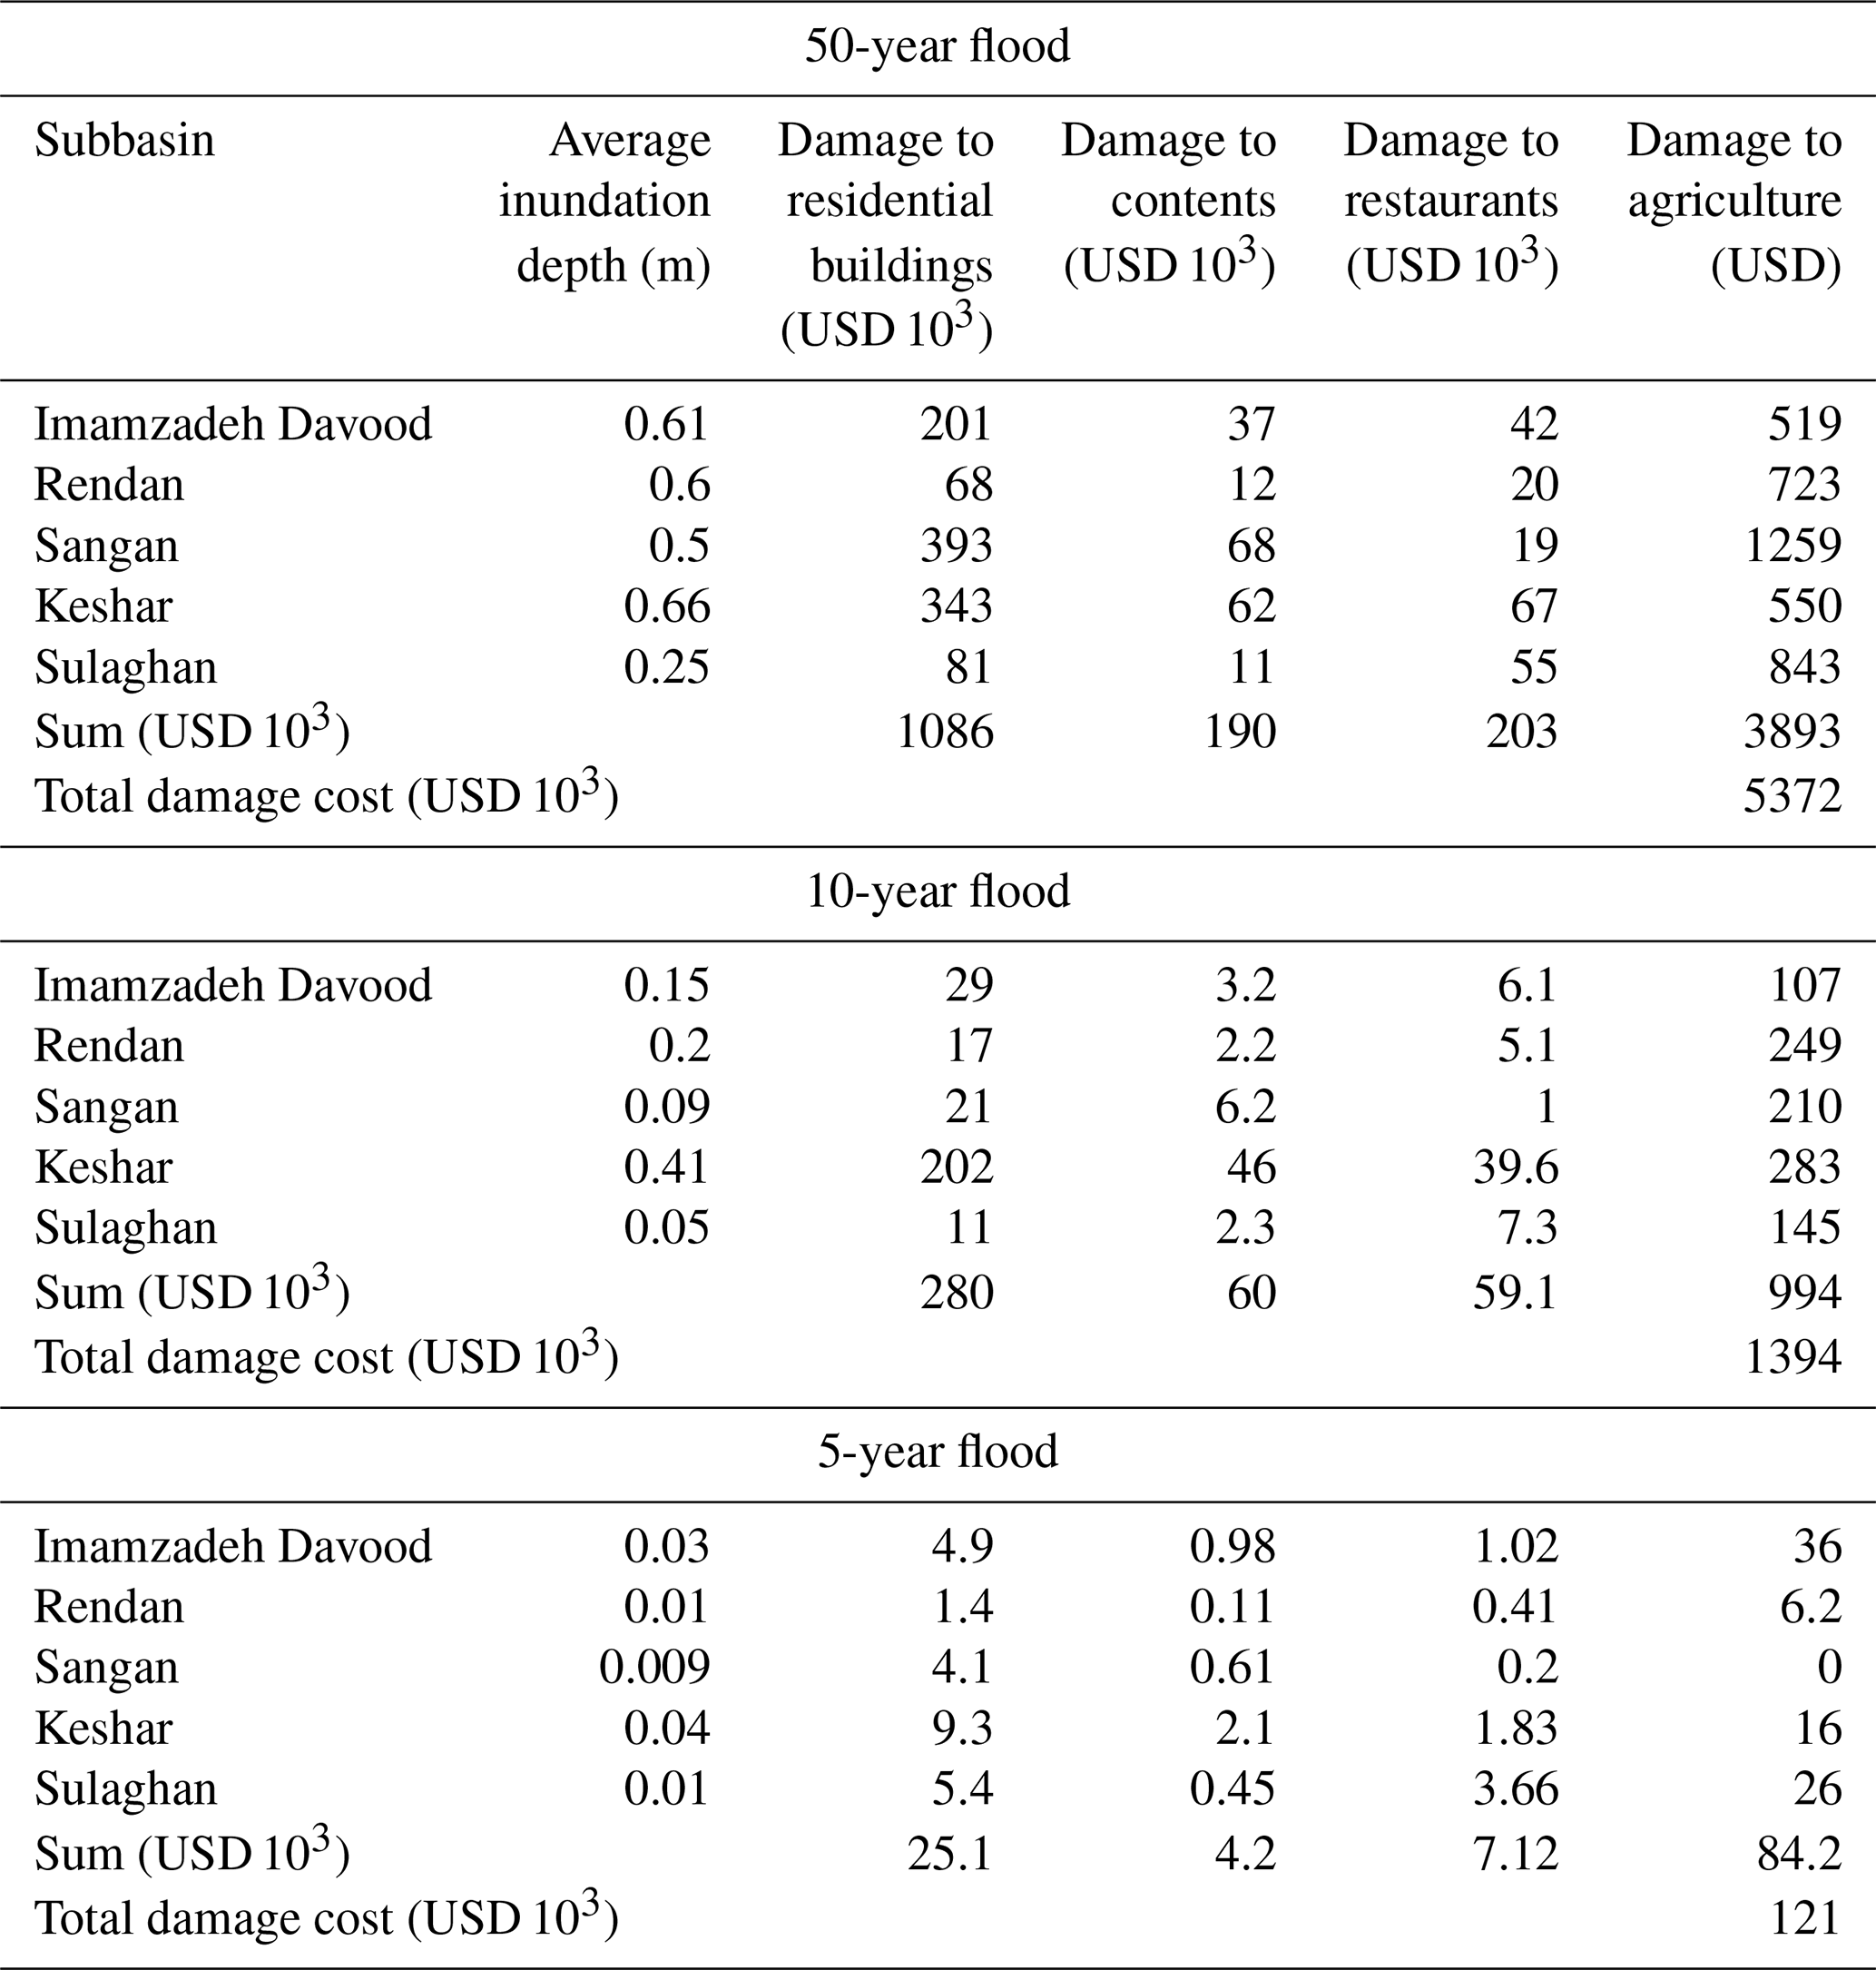
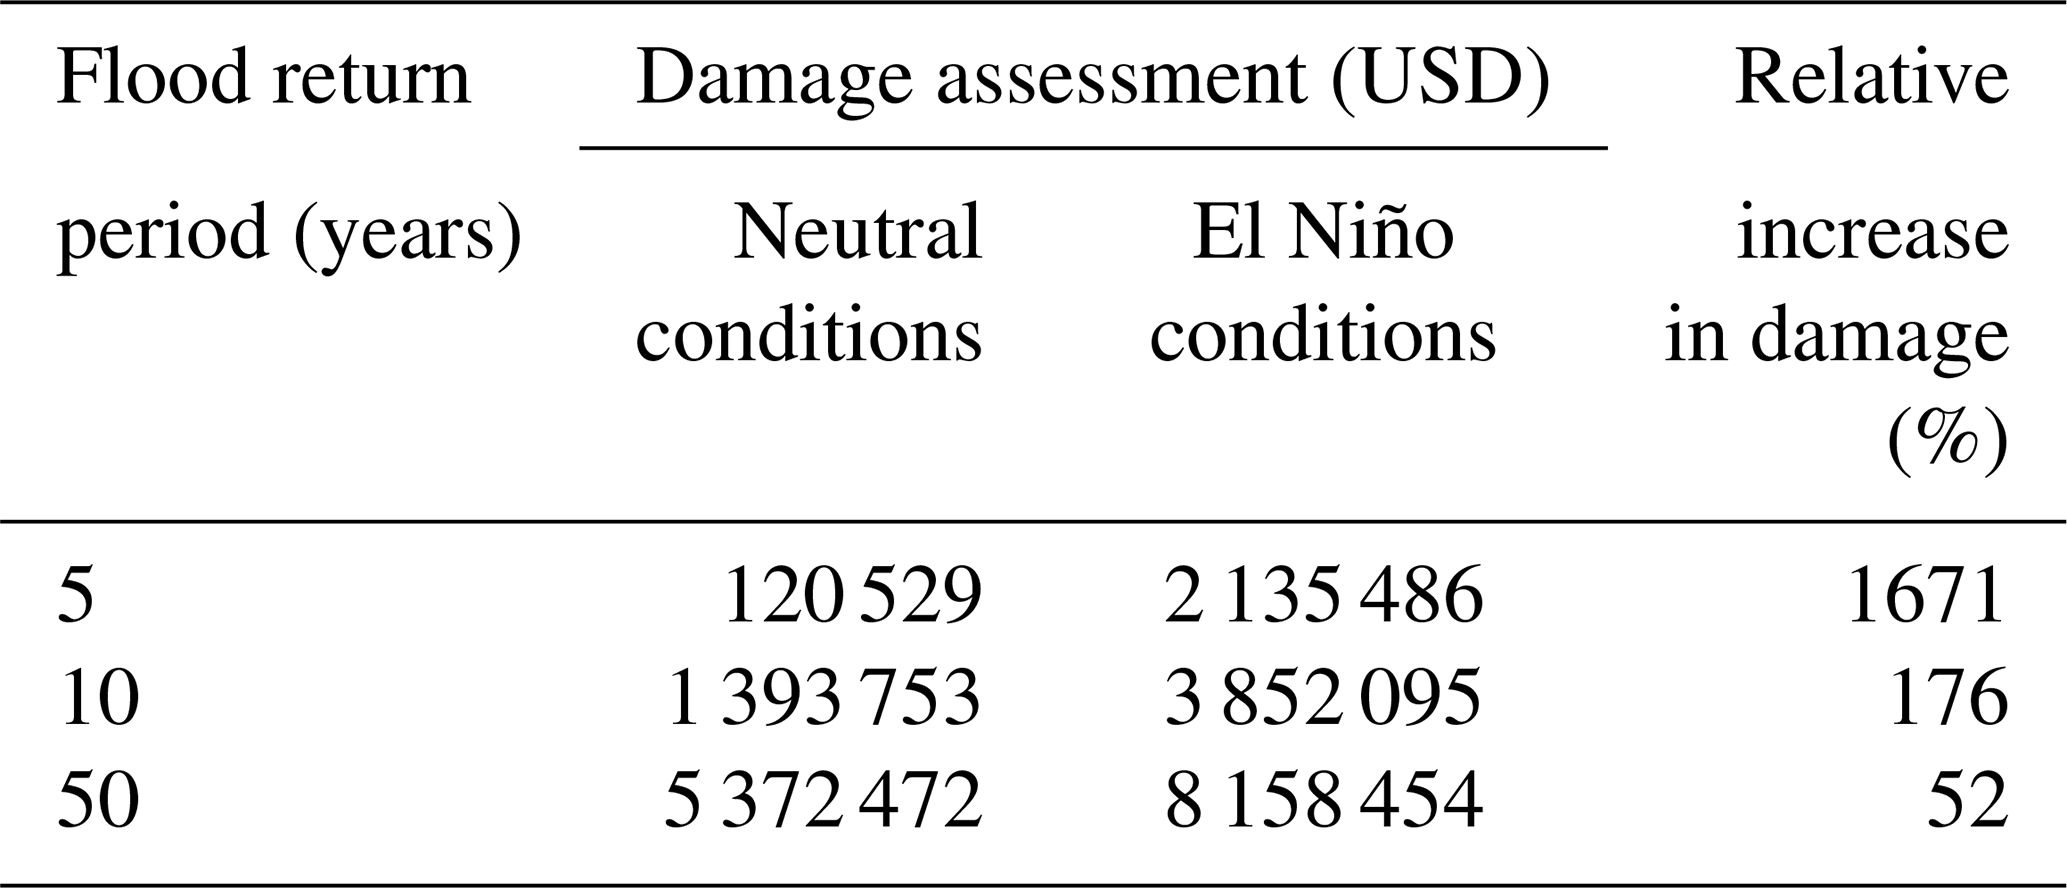
Table 4Flood damage and expected increases during El Niño conditions.
4.2 Damage analysis
In this section, with the help of the geographic information system (GIS) tool and the land use maps (generated from maps at 1∕25 000 scale) which were obtained from the local municipality, the results of a simple analysis of flood damage are provided. Only five subbasins, namely Imamzadeh Davood, Rendan, Sangan, Sulaghan, and Keshar, are considered because of a lack of data in the other subbasins. As noted previously, here a simplistic approach with several limitations is used. The main reason is lack of precise land use information and accurate monetary value of property in the basin.
The flood damage to each land use type is assessed using the average economic value of one unit of that land use. It should be noted that for agricultural physical damage analysis in each subbasin, the two dominant products of cherry and apple were identified, and the average crop number per unit area and value of each crop were used to calculate total flood damage based on the areal percentage of each crop type. The percentages of crops, number of them per unit area, and their economic value, as well as the value of different assets in the flooding area, are obtained from a field survey and interviews with the local authorities and local inhabitants and engineering judgments. Table 3 provides details of the physical damage to the land uses for different return periods. Similarly, the increased rainfall due to El Niño is simulated, and the damage is estimated in the same procedure (Table 4). The results show that the relative increase in the expected flood damage during El Niño events is much higher than that of rainfall increase. Moreover, for shorter return period floods, the relative increase in flood damage is much higher than that for longer return period floods. Specifically, for 5-year floods, expected flood damage during El Niño could increase by 1671 %. The main reason for this high relative increase is that the average depth of a 5-year flood is very shallow (<0.04 m). With an increase of 12.2 % in the rainfall intensity during El Niño events, the flood depth increases considerably (about 0.5 m). For the 10- and 50-year floods, expected flood damage due to El Niño would increase by 176 % and 52 %, respectively.
The high percentage increase in damage for 5-year floods may be related to the fact that the initial losses and infiltration amounts are considerably larger compared to the 5-year rainfall. When rainfall is relatively small, the effective rainfall is reduced due to retention (rainfall not converted into runoff). For large storms with longer return periods, infiltration and initial losses are small compared to the rainfall. Therefore, the effect of infiltration and initial losses is insignificant, and increase in rainfall intensity will be reflected in the increase in effective precipitation and direct runoff for floods with long return periods.
In this paper, the effect of El Niño on flood damage was investigated. The methodology was based on the calculation of increasing rainfall amount during El Niño event compared to normal conditions. Considering SOI = −1.0 as the threshold of El Niño, the annual percentage of increased rainfall is 12.2 %. It should be noted that the annual change factor may not necessarily be transferred to extreme values. Nonetheless, the annual change factor was applied for generating design storms of different return periods of 5, 10, and 50 years. Using the HEC-HMS hydrologic model and HEC-RAS hydraulic model, the flood inundation area was simulated for both episodes of neutral and El Niño conditions. A total of six model runs were implemented, and flood damage was assessed based on the simulated flood inundation and depth maps. The damage–depth curve method was used to estimate the flood damage. The results showed that the relative increase in expected damage under El Niño conditions is much higher for short return period floods than that for long return period floods. More specifically, in a flood with a return period of 5 years, El Niño would lead to an increase of 1671 % in damage. The relative change in the expected damage is 176 % for a 10-year return period flood, while it is 52 % for a 50-year return period flood. It suggests that flood managers should pay more attentions to small floods during El Niño years. The flood management for small but frequent floods requires much less of a financial budget and may result in much more effective approaches. The results provide decision makers with essential information on flood risks and highlight the importance of taking into account the probable effect of El Niño in flood risk management.
The SOI values were available at the National Oceanic and Atmospheric Administration (NOAA) website (https://www.cpc.ncep.noaa.gov/data/indices/soi, last access: March 2018). Other datasets used during the current study were collected by authors from the Iran's Water Research Institute. These datasets are available from the corresponding authors upon reasonable request.
FH wrote the paper with major contributions from RN and QT. FH, SF, and FK developed the models and performed the simulations. All authors contributed to writing the paper.
The authors declare that they have no conflict of interest.
This research is partially supported by the National Natural Science Foundation of China (41730645, 41790424, 41425002), the Strategic Priority Research Program of the Chinese Academy of Sciences (XDA20060402), and the International Partnership Program of Chinese Academy of Sciences (131A11KYSB20170113). Qiuhong Tang is supported by a Newton Advanced Fellowship.
This paper was edited by Bruno Merz and reviewed by Xun Sun and two anonymous referees.
Alizadeh-Choobari, O. and Najafi, M. S.: Climate variability in Iran in response to the diversity of the El Niño–Southern Oscillation, Int. J. Climatol., 38, 4239–4250, https://doi.org/10.1002/joc.5564, 2017.
Azmoodehfar, M. H. and Azarmsa, S. A.: Assessment the effect of ENSO on weather temperature changes using fuzzy analysis (case study: Chabahar), APCBEE Proc., 5, 508–513, https://doi.org/10.1016/j.apcbee.2013.05.086, 2013.
Berkman, M. P. and Brown, T.: Estimating flood impacts: a status report, in: Australasian Coasts & Ports Conference 2015: 22nd Australasian Coastal and Ocean Engineering Conference and the 15th Australasian Port and Harbour Conference, Engineers Australia and IPENZ, 114–120, available at: https://search.informit.com.au/documentSummary;dn=703231098671457;res=IELIAC (last accuses: March 2018), 2015.
Changnon, S.: Measures of economic impacts of weather extremes, B. Am. Meteorol. Soc., 84, 1231–1235, https://doi.org/10.1175/BAMS-84-9-1231, 2003.
Corringham, T. W. and Cayan, D. R.: The effect of El Niño on flood damages in the western United States, Weather Clim. Soc., 11, 489–504, https://doi.org/10.1175/WCAS-D-18-0071.1, 2019.
Corry, M., Jones, J., and Thompson, D.: The design of encroachments of floodplains using risk analysis, Hydraulic Engineering Circular, no. 17, Department of Transportation, Federal Highway Administration, Washington, D.C., USA, 1980.
Cover, T. M. and Thomas, J. A.: Elements of Information Theory, Wiley, Hoboken, New Jersey, ISBN 978-0-471-24195-9, 1991.
FARS News: Accurate announcement of floods and killings in the capital/2779 people were killed, available at: https://www.farsnews.com/news/13940704000378 (last access: September 2018), 2015.
Gholizadeh, M. H.: Evaluation of relation between rainfall and El Niño phenomena in Iran, Int. Res. J., 5, 1–11, 2015.
Grieco, M. B. and DeGaetano, A. T.: A climatology of extreme wave height events impacting eastern Lake Ontario shorelines, Theor. Appl. Climatol., 136, 543–552, https://doi.org/10.1007/s00704-018-2502-9, 2018.
Guiasu, S.: Information Theory with Applications, McGraw-Hill, New York, ISBN 978-0-07-025109-0, 1977.
Hao, Z., Hao, F., Singh, V. P., and Zhang, X.: Quantifying the relationship between compound dry and hot events and El Niño–Southern Oscillation (ENSO) at the global scale, J. Hydrol., 567, 332–338, https://doi.org/10.1016/j.jhydrol.2018.10.022, 2018.
Hooshyaripor, F. and Yazdi, J.: A new methodology for surcharge risk management in urban areas (case study: Gonbad-e-Kavus city), Water Sci. Technol., 75, 823–832, https://doi.org/10.2166/wst.2016.567, 2017.
Hooshyaripor, F., Tahershamsi, A., and Razi, S.: Dam break flood wave under different reservoir's capacities and lengths, Sādhanā, 42, 1557–1569, https://doi.org/10.1007/s12046-017-0693-x, 2017.
Hooshyaripor, F., Faraji-Ashkavar, S., Koohyian, F., and Dehghani, M.: Estimation of the effect of large-scale signals on regional rainfall of Iran by statistical analysis, ASAS J., 20, 65–76, 2019.
ISNA: Latest news of floods and storms/death of 14 people, available at: https://www.isna.ir/news/94042914923 (last access: September 2018), 2015.
Jamali, B., Löwe, R., Bach, P. M., Urich, C., Arnbjerg-Nielsen, K., and Deletic, A.: A rapid urban flood inundation and damage assessment model, J. Hydrol., 564, 1085–1098, https://doi.org/10.1016/j.jhydrol.2018.07.064, 2018.
KGS_Group: Red River Basin-stage-damage curves update and preparation of flood damage maps, report prepared for the International Joint Commission, Winnipeg, Manitoba, Canada, https://doi.org/10.1061/40517(2000)118, 2000.
Messner, F., Penning-Rowsell, E., Green, C., Meyer, V., Tunstall, S., and Veen, D.: Evaluating flood damages: guidance and recommendations on principles and models, Sixth Framework Programme for European Research and Technological Development, integrated project FLOODsite, document reference T09-06-01, available at: http://www.floodsite.net/html/partner_area/project_docs/T09_06_01_Flood_damage_guidelines_d9_1_v2_2_p44.pdf (last access: December 2017), 2007.
NOAA: Southern Oscillation Index (SOI), available at: http://www.cpc.ncep.noaa.gov/data/indices/soi (last access: March 2018).
Noori, R., Karbassi, A. R., Moghaddamnia, A., Han, D., Zokaei-Ashtiani, M. H., Farokhnia, A., and Gousheh, M. G.: Assessment of input variables determination on the SVM model performance using PCA, Gamma test, and forward selection techniques for monthly stream flow prediction, J. Hydrol., 401, 177–189, https://doi.org/10.1016/j.jhydrol.2011.02.021, 2011.
Null, J.: El Niño and La Niña: their relationship to California flood damage, Golden Gate Weather Services, available at: https://ggweather.com/enso/calif_flood.htm (last access: April 2018), August 2014.
Olesen, L., Löwe, R., and Arnbjerg-Nielsen, K.: Flood damage assessment literature review and recommended procedure, Cooperative Research Centre for Water Sensitive Cities, Melbourne, Australia, available at: https://backend.orbit.dtu.dk/ws/portalfiles/portal/130797720/IN_PC956_B4_1_Flood_Damage_web.pdf (last access: March 2018), 2017.
Ponce, V. and Hawkins, R.: Runoff curve number: has it reached maturity, J. Hydrol. Eng., 1, 11–19, https://doi.org/10.1061/(ASCE)1084-0699(1996)1:1(11), 1996.
Saghafian, B., Haghnegahdar, A., and Dehghani, M.: Effect of ENSO on annual maximum floods and volume over threshold in the southwestern region of Iran, Hydrolog. Sci. J., 62, 1039–1049, https://doi.org/10.1080/02626667.2017.1296229, 2017.
Schöngart, J. and Junk, W. J.: Forecasting the flood-pulse in Central Amazonia by ENSO-indices, J. Hydrol., 335, 124–132, https://doi.org/10.1016/j.jhydrol.2006.11.005, 2007.
Sturges, H.: The choice of a class-interval, J. Am. Stat. Assoc., 21, 65–66, 1926.
Sun, X., Renard, B., Thyer, M., Westra, S., and Lang, M.: A global analysis of the asymmetric effect of ENSO on extreme precipitation, J. Hydrol., 530, 51–65, https://doi.org/10.1016/j.jhydrol.2015.09.016, 2015.
Tang, Q.: Global change hydrology: terrestrial water cycle and global change, Sci. China Earth Sci., 63, 459–462, https://doi.org/10.1007/s11430-019-9559-9, 2020.
Wang, Y., Zhang, X., Tang, Q., Mu, M., Zhang, C., Lv, A., and Jia, S.: Assessing flood risk in Baiyangdian Lake area in a changing climate using an integrated hydrological-hydrodynamic modelling, Hydrolog. Sci. J., 64, 2006–2014, https://doi.org/10.1080/02626667.2019.1657577, 2019.
Ward, P. J., Eisner, S., Flörke, M., Dettinger, M. D., and Kummu, M.: Annual flood sensitivities to El Niño–Southern Oscillation at the global scale, Hydrol. Earth Syst. Sci., 18, 47–66, https://doi.org/10.5194/hess-18-47-2014, 2014a.
Ward, P. J., Jongman, B., Kummu, M., Dettinger, M. D., Sperna Weiland, F. C., and Winsemius, H. C.: Strong influence of El Niño Southern Oscillation on flood risk around the world, P. Natl. Acad. Sci. USA, 111, 15659–15664, https://doi.org/10.1073/pnas.1409822111, 2014b.
Ward, P. J., Kummu, M., and Lall, U.: Flood frequencies and durations and their response to El Niño Southern Oscillation: global analysis, J. Hydrol., 539, 358–378, https://doi.org/10.1016/j.jhydrol.2016.05.045, 2016.
Wobus, C., Gutmann, E., Jones, R., Rissing, M., Mizukami, N., Lorie, M., Mahoney, H., Wood, A. W., Mills, D., and Martinich, J.: Climate change impacts on flood risk and asset damages within mapped 100-year floodplains of the contiguous United States, Nat. Hazards Earth Syst. Sci., 17, 2199–2211, https://doi.org/10.5194/nhess-17-2199-2017, 2017.
WRCC – Western Regional Climate Center: Understanding El Niño for your fire management unit, available at: https://wrcc.dri.edu/ (last access: March 2018), January 2010.
WRI – Water Research Institute: Integrated flood management, case study: Kan basin, Report of Hydraulic Modeling and Flood Zoning, Water Research Institute, Ministry of Energy, Iran, 2011a.
WRI – Water Research Institute: Integrated flood management, case study: Kan basin, Report of Hydrologic Study and Flood, Water Research Institute, Ministry of Energy, Iran, 2011b.
WRI – Water Research Institute: Integrated flood management, case study: Kan basin. Report of Flood Vulnerability Assessment, Water Research Institute, Ministry of Energy, Iran, 2011c.
Yazdi, J. and Salehi Neyshabouri, S. A. A.: Optimal design of flood-control multi-reservoir system on a watershed scale, Nat. Hazards, 63, 629–646, https://doi.org/10.1007/s11069-012-0169-6, 2012.
Yazdi, J., Salehi Neyshabouri, S. A. A., Niksokhan, M. H., Sheshangosht, S., and Elmi, M.: Optimal prioritisation of watershed management measures for flood risk mitigation on a watershed scale, J. Flood Risk Manage., 6, 372–384, https://doi.org/10.1111/jfr3.12016, 2013.