the Creative Commons Attribution 4.0 License.
the Creative Commons Attribution 4.0 License.
 | 06 Oct 2020
Building hazard maps with differentiated risk perception for flood impact assessment
Jorge Leandro
Markus Disse
In operational flood risk management, a single best model is used to assess the impact of flooding, which might misrepresent uncertainties in the modelling process. We have used quantified uncertainties in flood forecasting to generate flood hazard maps that were combined based on different exceedance probability scenarios. The purpose is to differentiate the impacts of flooding depending on the building use, enabling, therefore, more flexibility for stakeholders' variable risk perception profiles. The aim of the study is thus to develop a novel methodology that uses a multi-model combination of flood forecasting models to generate flood hazard maps with differentiated exceedance probability. These maps take into account uncertainties stemming from the rainfall–runoff generation process and could be used by decision makers for a variety of purposes in which the building use plays a significant role, e.g. flood impact assessment, spatial planning, early warning and emergency planning.
- Article
(20626 KB) - Full-text XML
-
Supplement
(331 KB) - BibTeX
- EndNote


Floods are one of the most destructive natural hazards and lead to severe social and economic impacts (European Union, 2007; Alfieri et al., 2016). The number of people exposed to recent flooding which occurred in many central European countries highlights the importance of assessing flood hazards. During the extensive June 2013 floods in Germany, for example, more than 80 000 people in eight federal states had to be evacuated (Thieken et al., 2016). The vulnerability of settlements calls for improved flood forecasting, which includes underlying uncertainties and impacts.
In this study, we present a novel methodology that uses a multi-model combination of two-dimensional (2D) hydrodynamic (HD) models to assess the impact of flooding based on water depths, which are termed in this study flood hazards. These hazards can be evaluated for key urban features, such as buildings, roads, bridges and green spaces (Leandro et al., 2016). This study focusses in particular on buildings. Furthermore, the hazard maps serve a variety of purposes, e.g. flood impact assessment, spatial planning, early warning and emergency planning (Hammond et al., 2013), for target users. For this paper, the users consist of a group of decision makers, such as the Bavarian Environment Agency and disaster relief organizations in Germany, the Federal Agency for Technical Relief or the German Red Cross.
In deterministic flood forecasting, the predictions of forecasting models, precipitation forecasts, hydrological models and HD models are used to generate flood hazard maps. These maps form the basis of flood risk management and are utilized to assess the impact of floods (Schanze, 2006; Hagemeier-Klose and Wagner, 2009). Although advances are continually being made in real-time forecasting, they are still inherently uncertain (Meyer et al., 2009; Bates et al., 2014; Beven et al., 2018). The decision-making process based on uncertain predictions can have a huge economic impact and possibly lead to life and death situations (Leedal et al., 2010). Thus, a thorough assessment is required of the extent to which uncertainties affect the flood hazards. In addition, forecasts that inform policy or risk management decisions should include major sources of uncertainty and communicate them coherently (Todini, 2017).
Researchers have addressed various sources of uncertainties in flood modelling, such as precipitation measurements, spatial interpolation of the precipitation, model parameters, model structure (Nester et al., 2012; Leandro et al., 2013), discharge data, measured discharge and uncertainty estimation techniques (Dotto et al., 2012). Although uncertainties arising from precipitation and HD models are significant, the generation of discharges using a hydrological model is considered as one of the most uncertain steps in flood forecasting (Di Baldassarre and Montanari, 2009). Substantial research has been dedicated to the field of discharge forecasting and reducing uncertainties by using methods such as generalized likelihood uncertainty estimation (Beven and Binley, 2014), global sensitivity analyses (Pappenberger et al., 2008) and the Shuffled Complex Evolution Metropolis algorithm (Dotto et al., 2012). To find the appropriate method, Pappenberger et al. (2006) have provided a decision tree that helps users select a suitable method for a given solution. Furthermore, in a recent study Boelee et al. (2018) reviewed uncertainty quantification methods to provide practitioners with an overview of ensemble-modelling techniques. An overview of existing ensemble forecasts in operational use can be found in Cloke and Pappenberger (2009) and Todini (2017). Most notably, in the federal states of Rhineland-Palatinate (Bartels et al., 2017) and Bavaria (Laurent et al., 2010) discharge ensembles are generated using the COSMO-DE-EPS precipitation ensemble as input to a distributed hydrological model LARSIM (Large Area Runoff Simulation Model). These and similar developments offer a potential framework for quantifying uncertainties. A challenging issue in natural hazards, however, remains the effective communication of the quantified uncertainties to decision makers (Doyle et al., 2019). Researchers have questioned how uncertainties should be communicated to reduce the risk of wrong or inappropriate decisions (Bruen et al., 2010; Todini, 2017).
In operational flood forecasting, hazard maps are provided in the form of exceedance probability scenarios, and generally, only one scenario is considered for emergency planning. Normally, a 50 % exceedance probability scenario (or median) is expected to be close to the deterministic best-model approach (Di Baldassarre et al., 2010). In other examples (Beven et al., 2014, 2015; Disse et al., 2018), model results of various exceedance probabilities are provided on separate or combined maps. Kolen et al. (2010) stated that there is a need for new methodologies that employ a multi-model combination approach by including several scenarios for improving decision-making. A multi-model combination is based on the results of several models and creates a more robust forecasting system with a better representation of uncertainties (Kauffeldt et al., 2016). Although the multi-model combination approach has been used widely in the field of discharge forecasting (Shamseldin et al., 1997; See and Openshaw, 2000; Oudin et al., 2006; Weigel et al., 2008), the approach is not commonly used in the field of real-time flood hazard forecasting. The long computational time required by the HD models restricts the use of such an approach in real-time forecasting. However, the use of a simple model structure and/or high-performance computing makes it possible to simulate HD models in real time, thus making it feasible to use multi-model combination approaches. Zarzar et al. (2018) have used a multi-model combination framework consisting of hydrometeorological and HD models to visualize flood inundation uncertainties in which they have used an average of HD model raster outputs to obtain the percentage of ensemble agreement.
We develop a methodology for obtaining a multi-model combination as an effective alternative to the traditional best-model approach for producing detailed hazard maps, which are termed building hazard maps. This term can be defined as a map that highlights buildings that are affected by or are vulnerable to flooding with differentiated exceedance probabilities of flood inundation extents projected on building use. In this paper, we have designed three scenarios with differentiated exceedance probabilities, each referring to the subjective classification of buildings with varying flood impact. To the best of our knowledge, this combination approach has not yet been used to assess the impact of flooding. The maps help prevent serious damage to buildings and aid in evacuation planning in the case of flooding. The methodology is applied for the flood event of January 2011 in the city of Kulmbach, Germany.
The framework to generate building hazard maps (as shown in Fig. 1) consists of three components: (1) hydrological modelling – discharge ensemble forecasts were produced using forecasted precipitation; (2) HD modelling – the water depths were simulated using a pre-calibrated 2D HD model; and (3) post-processing of the model results – a multi-model combination was used to produce flood hazard maps based on a classification of buildings. The framework was tested for the flood event of January 2011 in the city of Kulmbach, Germany. The first two components of the framework were developed in previous studies (Beg et al., 2018; Bhola et al., 2018a, b). The particular focus of this study is on the development of the framework of a multi-model combination in the post-processing component. For the sake of clarity, each component is described in detail in chronological order.
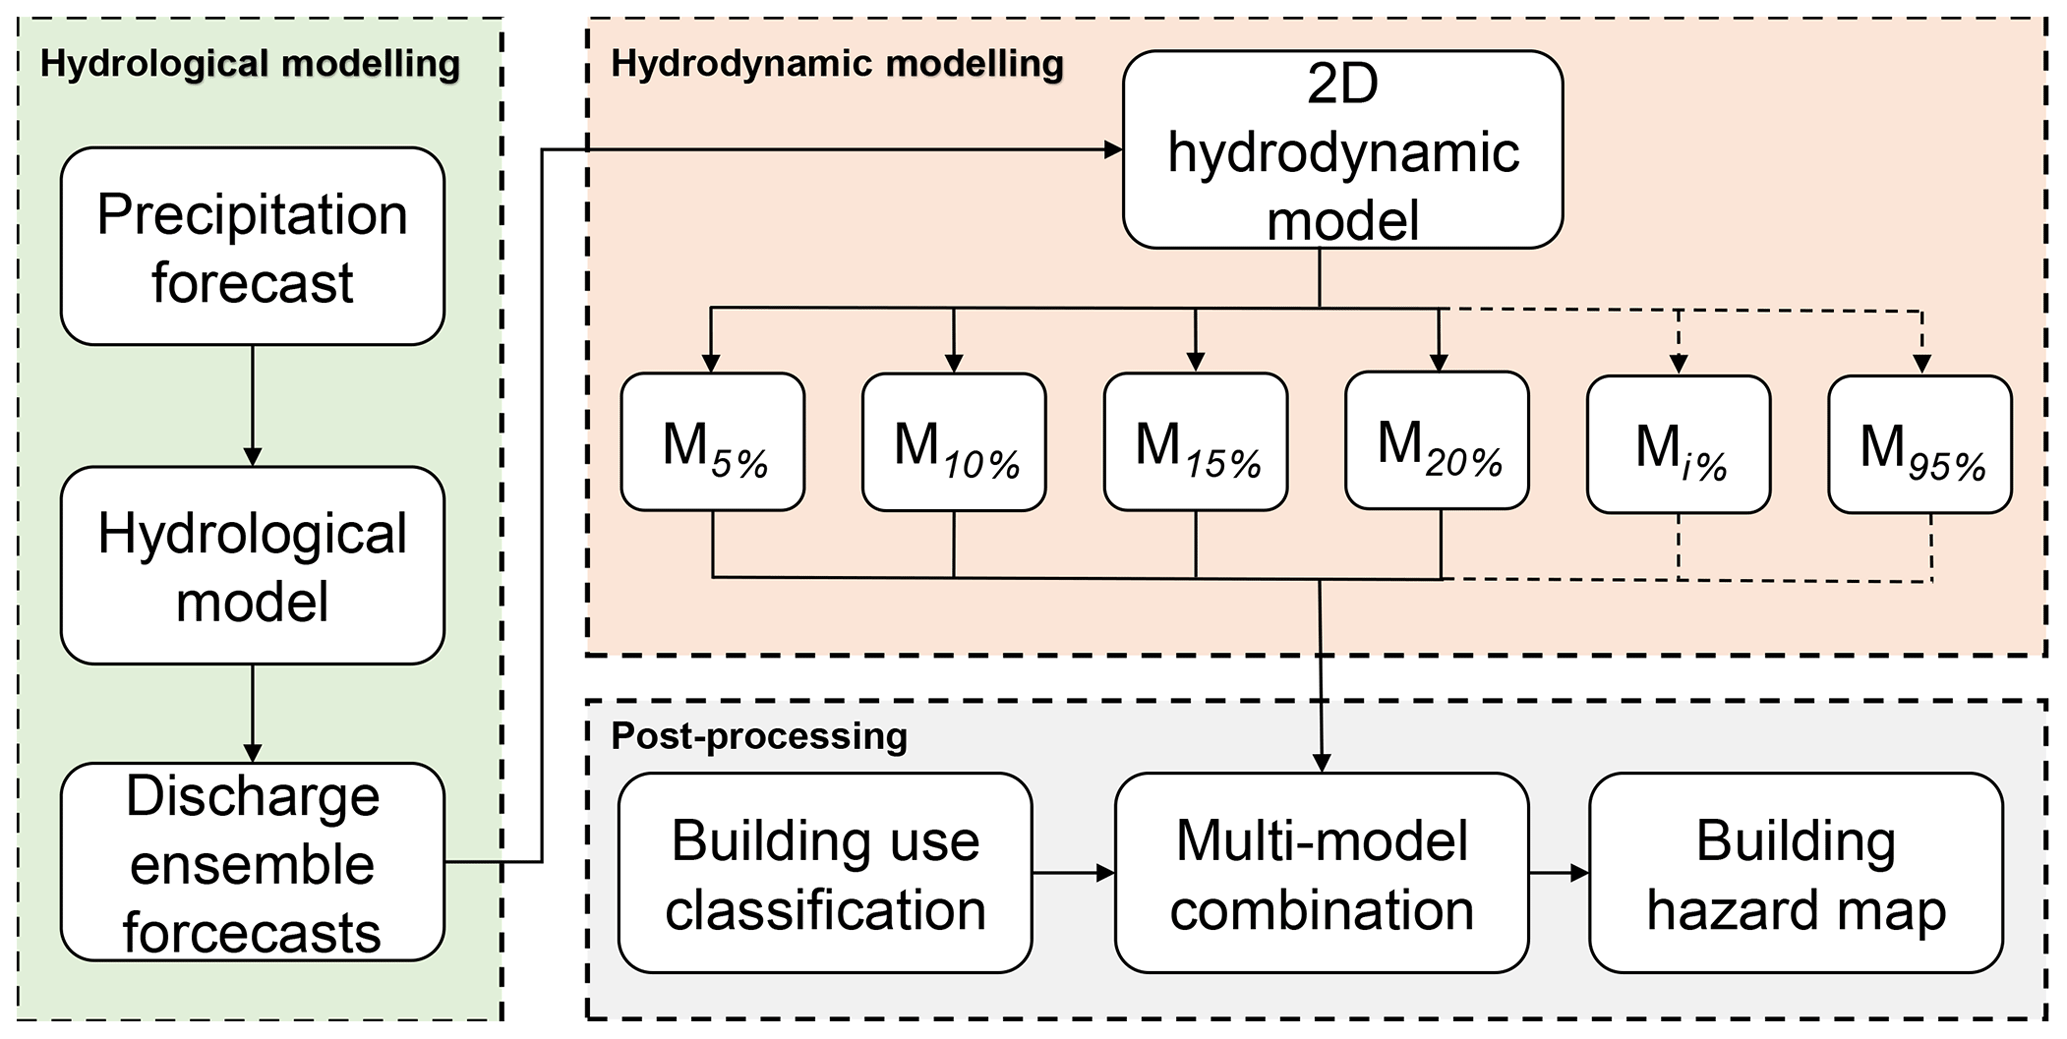
Figure 1Schematic view of the methodology used to generate building hazard maps. The major components consist of the operational hydrological ensemble forecasts (Beg et al., 2018), the hydrodynamic model and post-processing that includes the multi-model combination. Mx % denotes the HD model results generated using x % percentile discharge.
2.1 Hydrological modelling
2.1.1 Hydrological model – LARSIM
The conceptual hydrological model LARSIM (Large Area Runoff Simulation Model) was used to study the hydrology of the model area and to generate discharge forecasts. In the model, the hydrological processes are simulated in a series of subarea elements connected by flood-routing elements in a predetermined sequence. LARSIM simulates the hydrologic processes for one element for a defined period and passes the resulting output hydrograph information to the next element (Fig. 2). The model structure can be grid-based or based on hydrologic sub-catchments. The model uses a soil module with storage capacities in considering infiltration, evapotranspiration and runoff generation. The discharge generation consists of three components: runoff generation, runoff concentration and a river component. In addition to simulating hydrological processes, LARSIM is most suitable in operational flood forecasting (Demuth and Rademacher, 2016). It deals with the gaps in hydrometeorological input data and allows for the correction or manipulation of numeric weather forecasts (e.g. external-forcing parameters). Furthermore, the model automatizes processes for the assimilation of hydrological data, which is crucial in flood forecasting (Luce et al., 2006; Haag and Bremicker, 2013).

For this study, a pre-setup model for the study area was provided by the Bavarian Environment Agency, and this model is operationally used in the flood forecasting centre for the river Main (Laurent et al., 2010). The model uses a grid-based structure with a resolution of 1 km2 and a temporal resolution of 1 h. This LARSIM model considers a soil module with storage capacities in considering the water balance, which consists of three parts: upper, middle and lower soil storages that contribute to the discharge components, modelled as a linear storage system. The model includes 34 parameters that allow for the modelling of different processes, such as direct discharge, interflow and groundwater flow. A complete description of calibration parameters is not within the scope of this study and has been elaborated on by Ludwig and Bremicker (2006) or Haag et al. (2016). Nevertheless, Table S1 in the Supplement presents a comprehensive description of important parameters along with the eight most sensitive parameters identified in Beg et al. (2018), which were considered in generating the discharge ensemble forecasts.
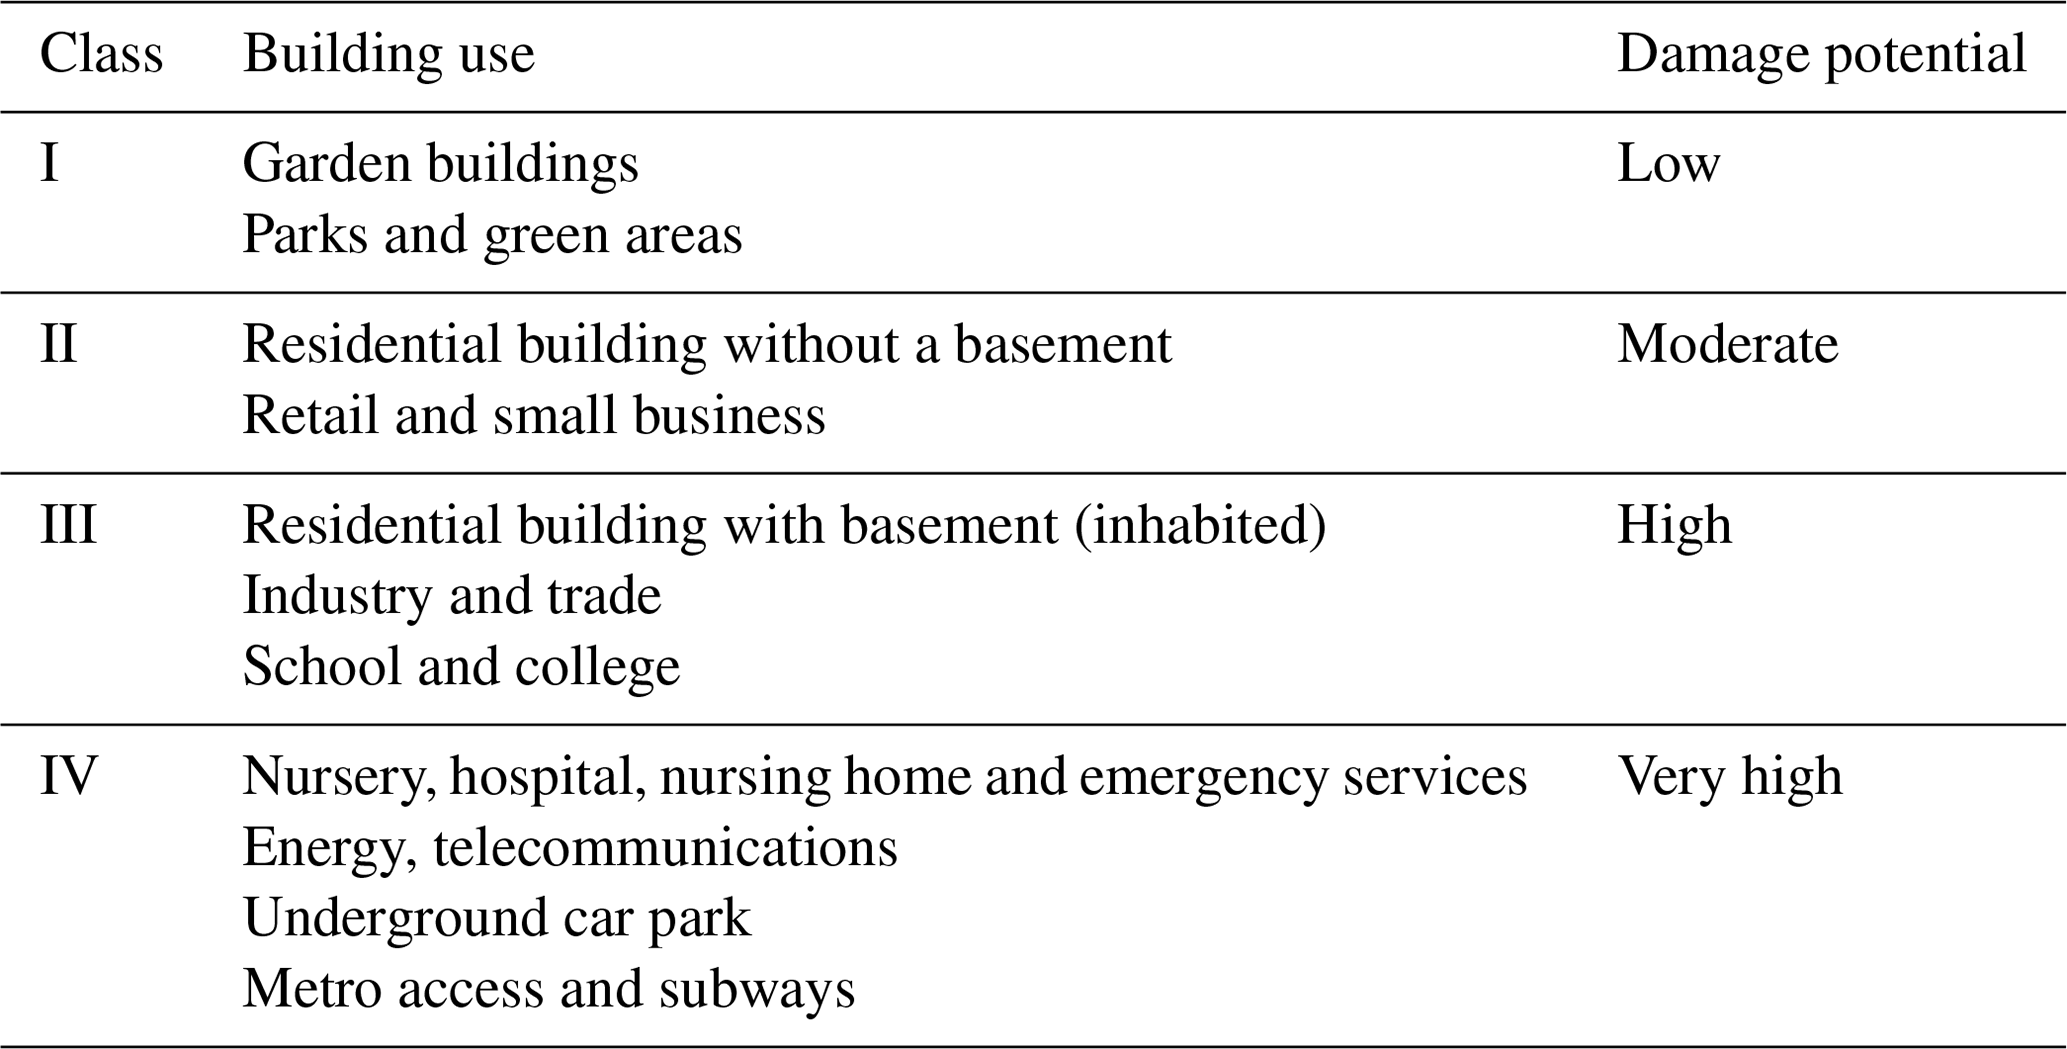
Table 1Building use classification based on the guidelines of Krieger et al. (2017).
2.1.2 Discharge ensemble forecasts
The winter flood event of January 2011 was hindcasted to test the framework. The event was one of the largest in terms of its magnitude and corresponds to a discharge of a 100-year return period at gauge Kauerndorf (river Schorgast) and 10-year return period at gauge Ködnitz (river White Main). Intense rainfall and snowmelt in the Fichtel Mountains caused floods in several rivers of Upper Franconia. Within 5 d, two peak discharges were recorded. The first peak occurred on 9 January 2011, and the second peak measured 5 d later (on 14 January 2011) caused even higher discharges and water levels. The maximum discharge of 92.5 m3 s−1 was recorded at gauge Kauerndorf and 75.3 m3 s−1 at gauge Ködnitz (Fig. 3).
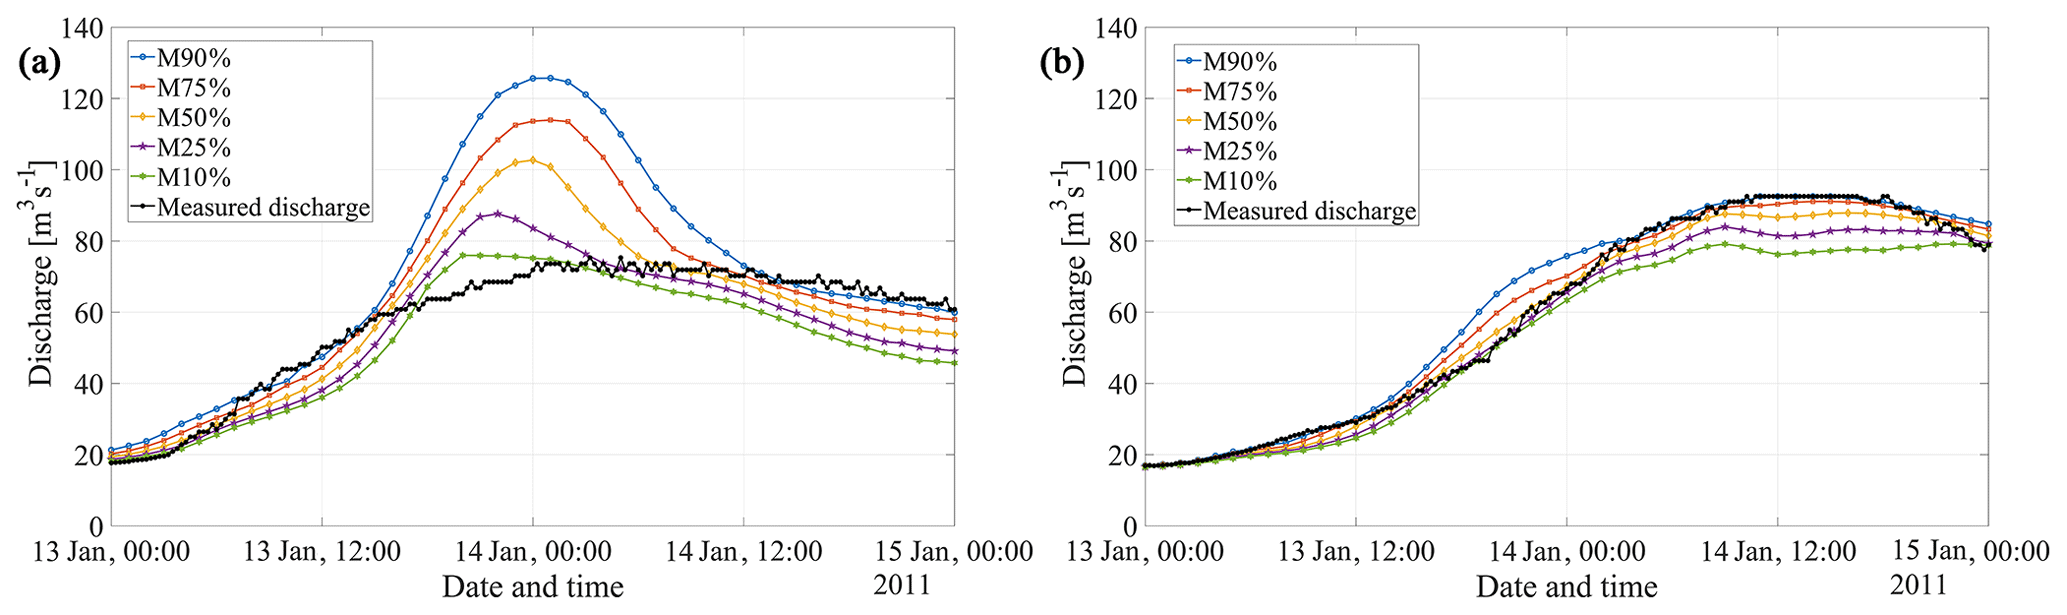
Figure 3Hindcasted flood event of January 2011: measured discharge hydrograph along with 10 %, 25 %, 50 %, 75 % and 90 % percentile discharges for gauges (a) Ködnitz and (b) Kauerndorf (discharge data based on Beg et al., 2018; measured discharge from Bavarian Hydrological Services, http://www.gkd.bayern.de, last access: 5 March 2018).
To automatize the generation of forecasts, a tool FloodEvac was developed in MATLAB® R2018a (Disse et al., 2018). The tool considers model input and model parameter uncertainty in simulating flood scenario combinations. The tool generates rainfall spatial distributions using sequential conditional geospatial simulations and model parameter uncertainty using Monte-Carlo sampling. The uncertainties in the discharge hydrographs were quantified in Beg et al. (2018) using this FloodEvac tool. In their study, the forecast was performed using 50 ensemble members. A parameter uncertainty module was used to generate 50 different parameter sets (for eight sensitive parameters). In addition, geostatistical simulation for rainfall was implemented using two different R packages, namely gstat and RandomFields. The rainfall data were available at an hourly interval at 50 gauges in the catchment. Each forecast was simulated for 61 h: 49 h of observed hourly rainfall and 12 h of forecast rainfall data. To hindcast the event of January 2011, 10 different raster datasets of rainfall uncertainty were generated for the catchment. The 50 parameter sets were combined with the 10 rainfall uncertainty cases, linking one rainfall scenario with every five-parameter set in sequential order, thus making 50 sets of hydrological models for the upper Main catchment. These 50 models were then simulated, and the results of discharge ensembles were stored.
Figure 3 shows the percentiles of 10 %, 25 %, 50 %, 75 % and 90 % for the January 2011 flood event at two gauging stations upstream of the city, Ködnitz and Kauerndorf. Uncertainty bands are much wider at gauge Ködnitz (Fig. 3a) than at gauge Kauerndorf, which suggests that the model parameters are more sensitive in the catchment of White Main than in that of Schorgast. In addition, the peak of the measured discharge at gauge Ködnitz was well overpredicted, which suggests that the uncertainty in the discharges is higher in the catchment of White Main than in that of Schorgast. While the peak of the measured discharge at Kauerndorf is very well predicted, the one at gauge Ködnitz is overpredicted. Nevertheless, it can be seen from Fig. 3 that the ensemble of these 50 members could effectively bracket the observed discharge data.
2.2 Hydrodynamic modelling
HEC-RAS was used as the 2D HD model to quantify uncertainties in flood inundation. It is a non-commercial hydrodynamic model developed by the U.S. Army Corps of Engineers and has been used widely for various flood inundation applications (Moya Quiroga et al., 2016; Patel et al., 2017). The implicit method allows for larger computational time steps compared to an explicit method. HEC-RAS solves either 2D Saint Venant or 2D diffusion-wave equations. The latter allows faster calculation and has greater stability due to its complex numerical schemes (Martins et al., 2017). Due to these advantages and suitability for use in real-time inundation forecast (Henonin et al., 2013), we have used the diffusive-wave model that was previously set up, calibrated and validated in Bhola et al. (2018a) and Bhola et al. (2018b). For the diffusive-wave approximation, it is assumed that the inertial terms are less than the gravity, friction and pressure terms. Flow movement is driven by a barotropic pressure gradient balanced by bottom friction (Brunner, 2016). The equations of mass and momentum conservation are as follows:
where H is the surface elevation (m), h is the water depth (m), u and v are the velocity components in the x- and y-direction respectively (m s−1), q is a source or sink term, g is the gravitational acceleration (m s−2), cf is the bottom friction coefficient (s−1), R is the hydraulic radius (m), |V| is the magnitude of the velocity vector (m s−1), and M is the inverse of the Manning's n (m(1∕3) s−1).
Table S2 in the Supplement summarizes the model properties, such as the model size and mesh size, and model roughness in the domain. The model parameter consists of the roughness coefficient Manning's M for five land use classes. The buildings are explicitly included using their shape in the mesh and are excluded from the flow calculation by assigning a high roughness value. To assign hazard to a building, the maximum water depth of all the neighbouring cells was used. Sensitivity analysis of the model was performed using 1000 uniformly distributed model parameter sets for the flood event of 2011.
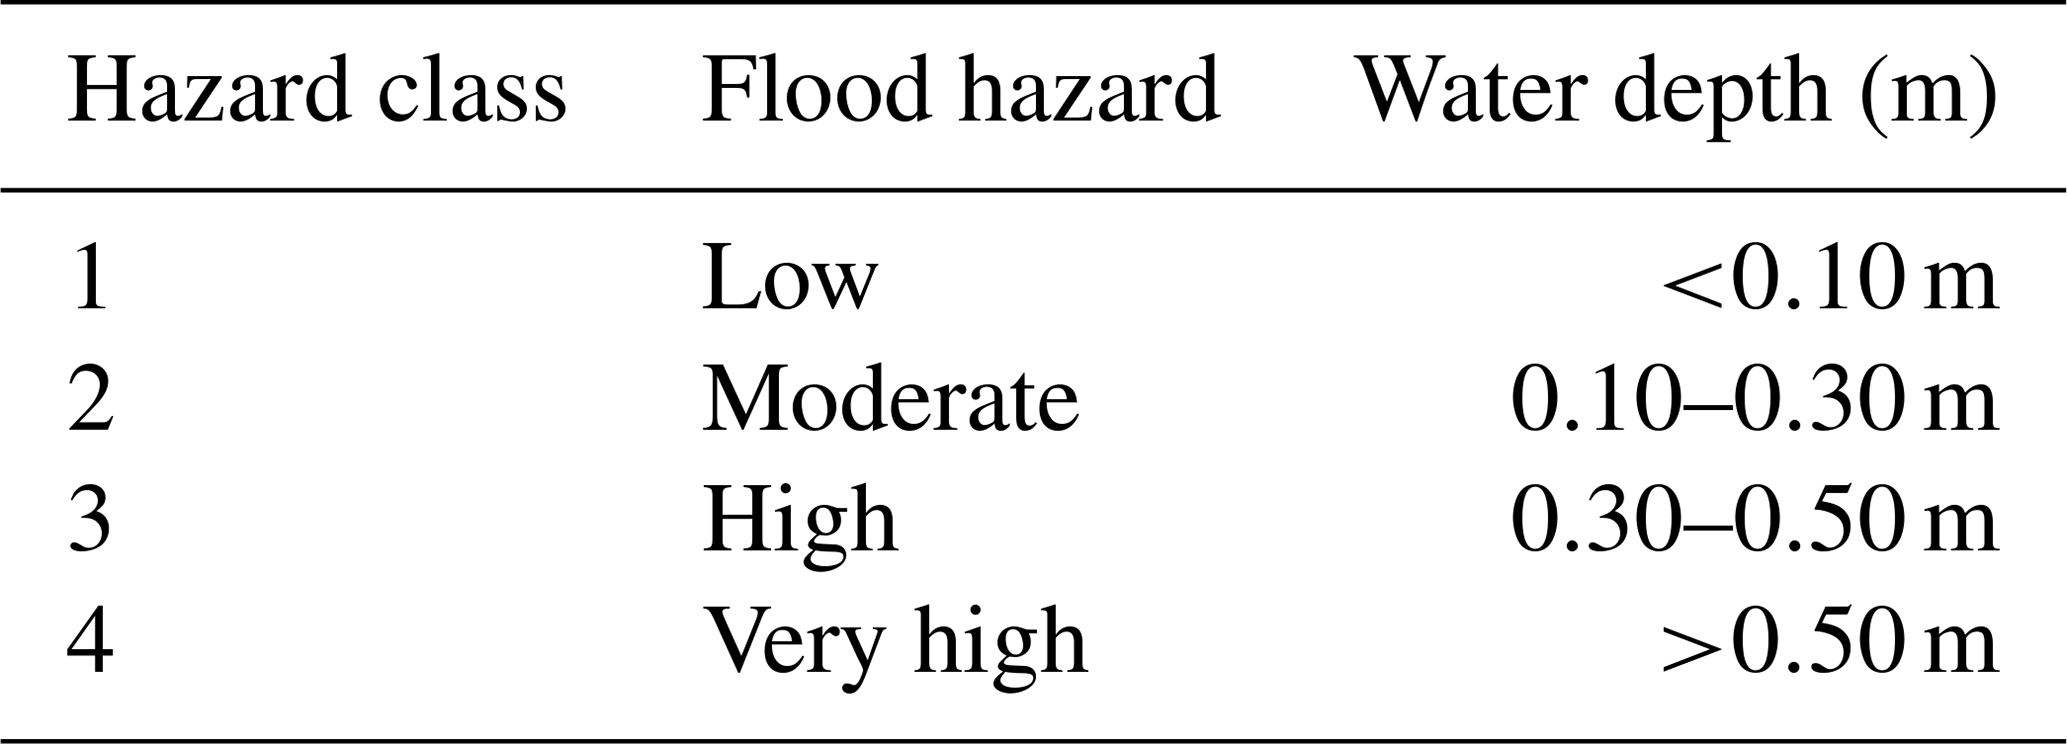
Table 2Hazard classification used in this study based on water depths. Classification source is Krieger et al. (2017).
Although uncertainties arise in the HD modelling, we have considered discharges in hydrological modelling as the sole source of uncertainties in this paper as we have assumed them to be more significant. Various HD simulations were conducted based on percentiles of the discharges (Fig. 3) as upstream boundary conditions at river gauges Ködnitz and Kauerndorf.
2.3 Post-processing
2.3.1 Building use classification
In this study, we have considered only buildings as urban features to assess the flood impact and in preparation of flood hazard maps. The shape and use of the buildings were provided by the Bavarian Ministry of the Interior, for Building and Transport (Fig. 4).
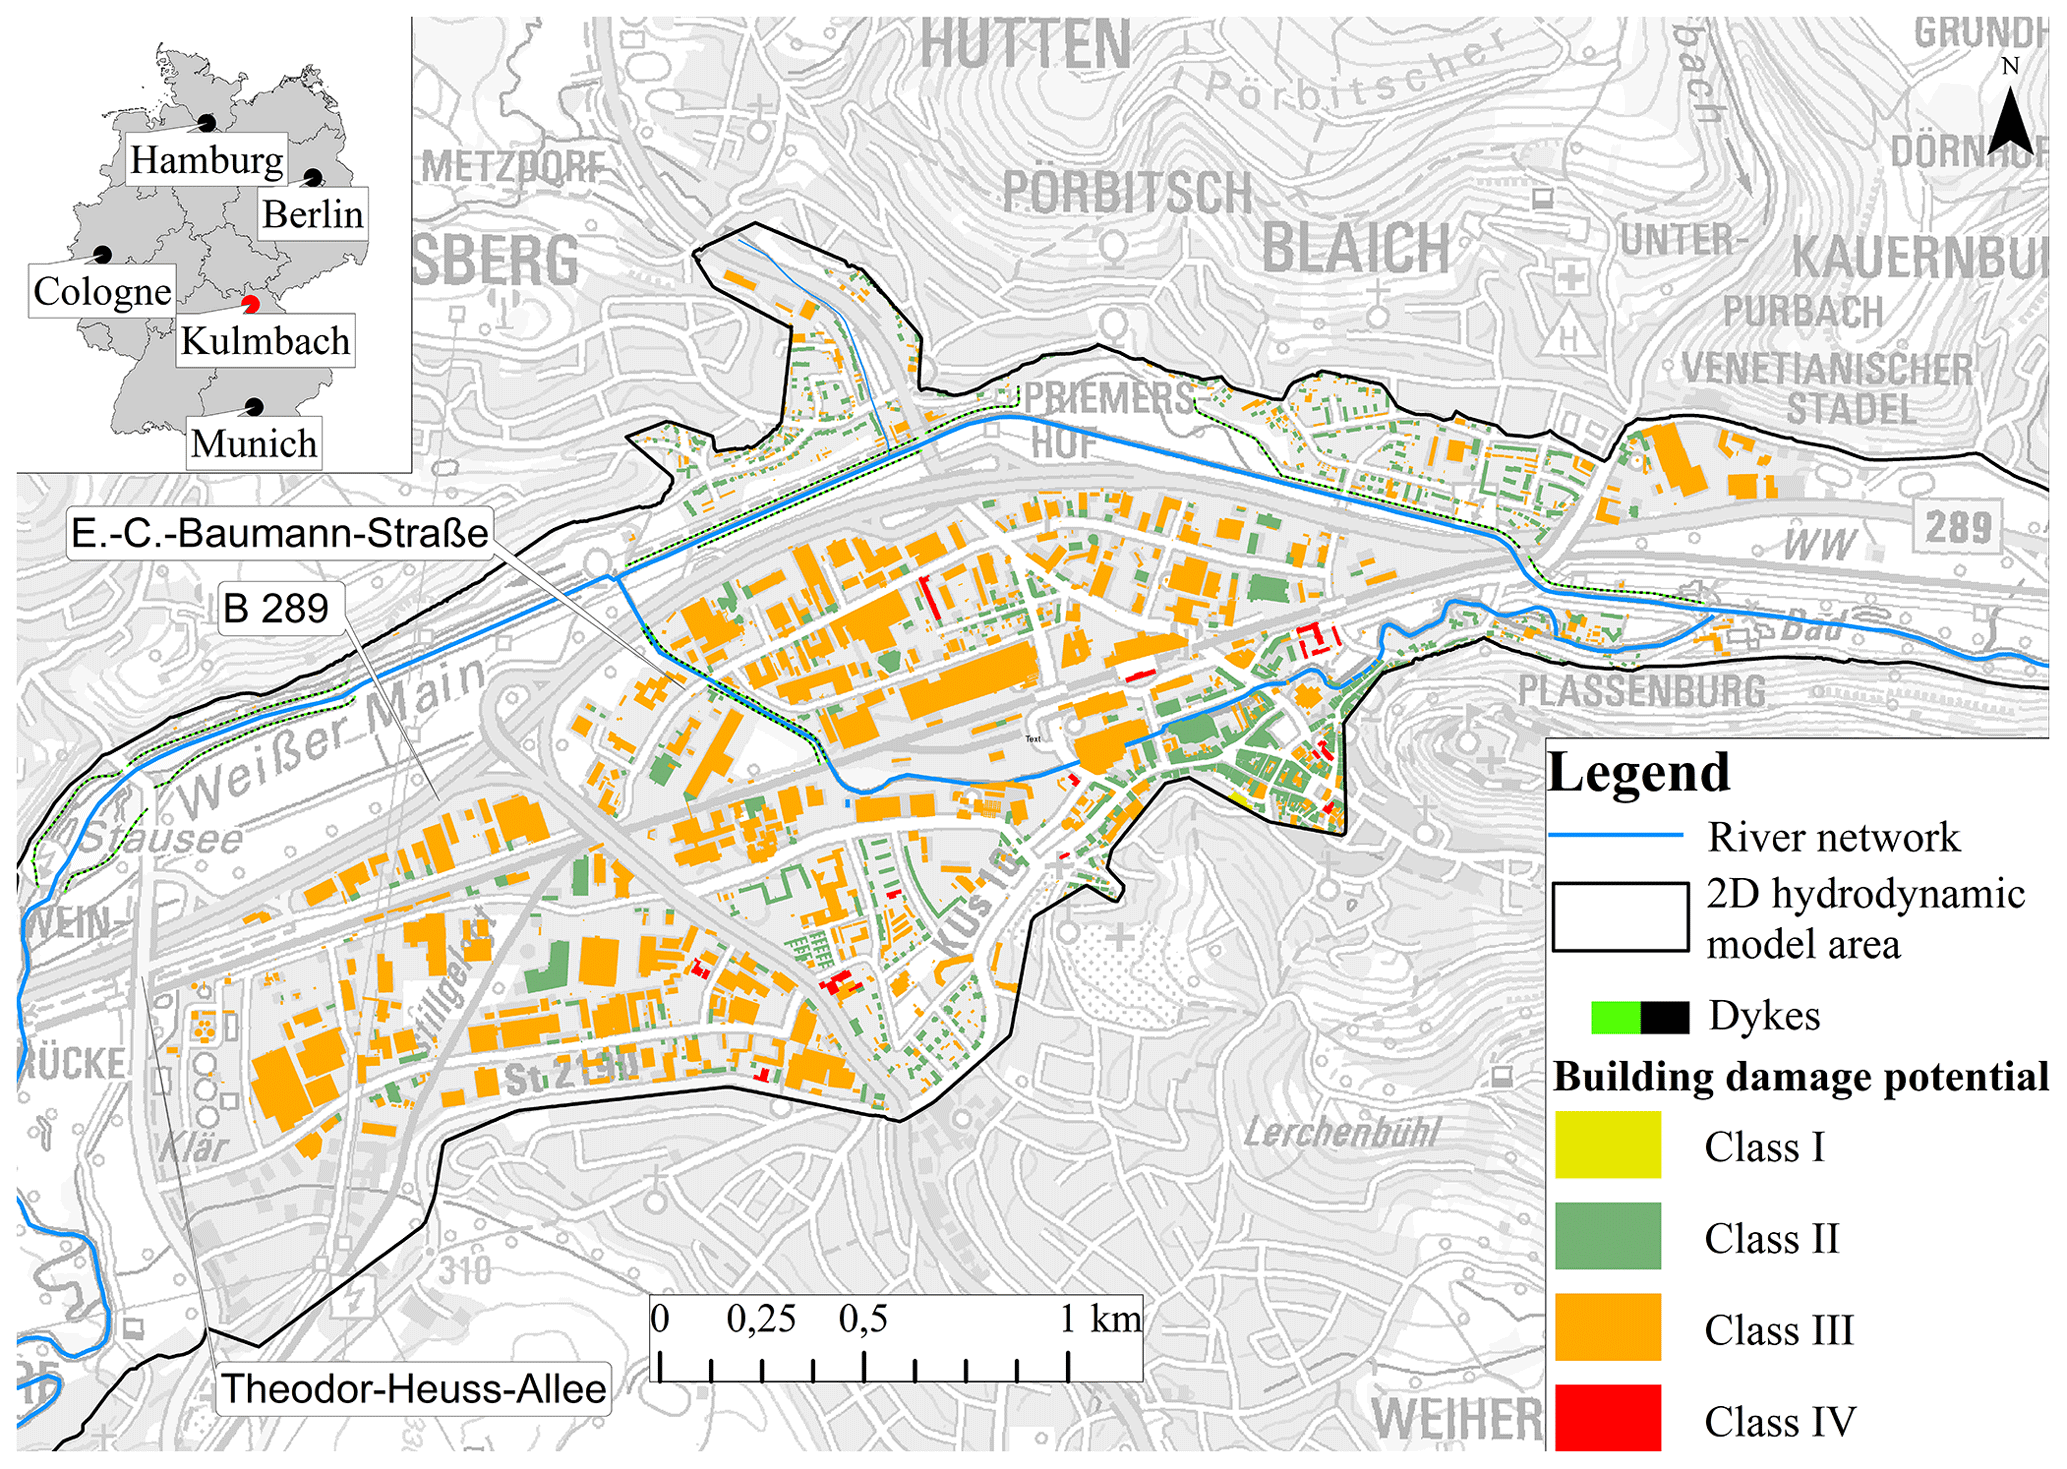
Figure 4The city of Kulmbach and building damage potential classification. (Data source: Bavarian Ministry of the Interior, for Building and Transport and Water Management Authority Hof; Geobasisdaten © Bayerische Vermessungsverwaltung, http://www.geodaten.bayern.de, last access: 5 March 2018.)
There are various classifications of land use features available in the literature. Dutta et al. (2003) have used direct and indirect damage as the basis of their classification and classified their study area into residential and non-residential categories. Jonkman et al. (2008) have classified urban features in residential, businesses, commercial and public property and agricultural to estimate flood loss. Furthermore, the vulnerability was the basis of classification in residential (Thieken et al., 2008) and industrial and commercial (Kreibich et al., 2010) sectors in order to estimate flood losses. We have used the damage potential of a building as a basis for classification in order to focus on the flood impact assessment. Building damage potential is required for a variety of flood mitigation planning activities including flood damage assessment, multi-hazard analyses and emergency measures (Shultz, 2017). The buildings were classified into four classes based on their function following the recommendation of the German standard for risk management in urban areas in the case of flash floods (Krieger et al., 2017). According to this standard, building use is one of the important criteria for assessing the damage potential of a building. In this study, four damage potential classes for each building use were taken into consideration as presented in Table 1. In the authors' opinion keeping our classification simple will likely fit a vast majority of cities regardless of their size. In any case, we acknowledge that the number of classes or criteria can be changed or adapted depending on the aim of the forecast. The damage potential varies from low to very high based on the building use; for example, residential buildings with a basement, industries and schools need special protection and thus were rated with a correspondingly high damage potential (class III). In addition, nurseries and hospitals as well as low-lying facilities, such as traffic underpasses, driveways to underground garages and other entrances, require greater protection and were thus categorized as having the highest damage potential (class IV). Residential buildings and retail businesses were classified as having moderate damage potential (class II), and gardens and parks as having relatively low damage potential (class I). Figure 4 shows the city centre, where buildings were classified according to Table 1. It can be seen that most of the buildings belong to class III as the area is industrial. There are a total of 2695 buildings in Fig. 4 of which 1, 958, 1716 and 20 were classified in classes I, II, III and IV respectively. The nature of the data in this case study leads to an uneven representation of the classes. It should be noted that the classification aims to create classes based on damage potential and not on generating clusters with similar sizes.
2.3.2 Hazard classification
In this study, hazard classification was based on the recommendations given in the German standard for risk management in urban flood prevention (Krieger et al., 2017). The classification was based on the estimated water depths of the 2D HD model. Table 2 shows the four categories of flood hazards, which consider water depth in urban areas and vary from low to very high. It should be noted that in individual cases, the damage may also arise at lower water depths (<0.10 m) for buildings, such as underground parking and metro stations, which are classified as the building class IV in the previous section.
2.3.3 Multi-model combination
The multi-model combination of the 2D HD model results was based on considerations of evacuation planning and gives priority to buildings with higher damage potential. In order to prioritize, it is important to differentiate the impacts of water depths on building classes. A certain water depth might have a different impact on a building with higher damage potential. For example, there is a greater threat from a low water depth to underground metro access than from the same water depth to a residential building. Therefore, buildings classified into a higher damage potential class relate to model results of a higher percentile. Each building class corresponds to a certain discharge percentile, and the resulting damage potential assessment can be visualized and presented as a building hazard map.
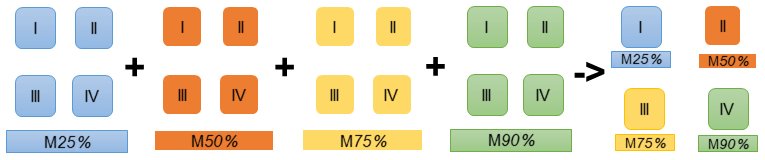
Figure 5An example of a multi-model combination in which the four building classes I, II, III and IV are assigned to the 2D HD model results of 25 %, 50 %, 75 % and 90 % respectively.
Figure 5 shows an example of a multi-model combination in which the four building classes were assigned four different percentiles. The simulation results (water depth in this case) obtained from the HD model with 25 %, 50 %, 75 % and 90 % percentile discharges were assigned to the building classes I, II, III and IV respectively. The novelty of the multi-model combination approach is that the flood inundation uncertainty is coupled with the building use. Therefore evacuation planning or investment planning can take the information of uncertainties in the water depths into consideration.
In this section, we present the results of five percentiles and the performance of the multi-model combination. To assess the methodology, the flood event of January 2011 was used to quantify uncertainties in discharge hydrographs. The forecasts corresponding to 10 %, 25 %, 50 %, 75 % and 90 % percentiles were further used as input boundary conditions to the 2D HD model, and water depths were stored. Furthermore, the flood inundation maps and building hazards were then classified.
3.1 Flood inundation maps and building hazards
The numbers of affected buildings in each hazard class for all five HD models are presented in Fig. 6. As the discharge percentile increases, the number of affected buildings in each hazard class increases. The maximum flood inundation of the five models is presented in Fig. 7. The figures present both the inundation extent and building hazards based on the classification discussed in Sect. 2.3.2.
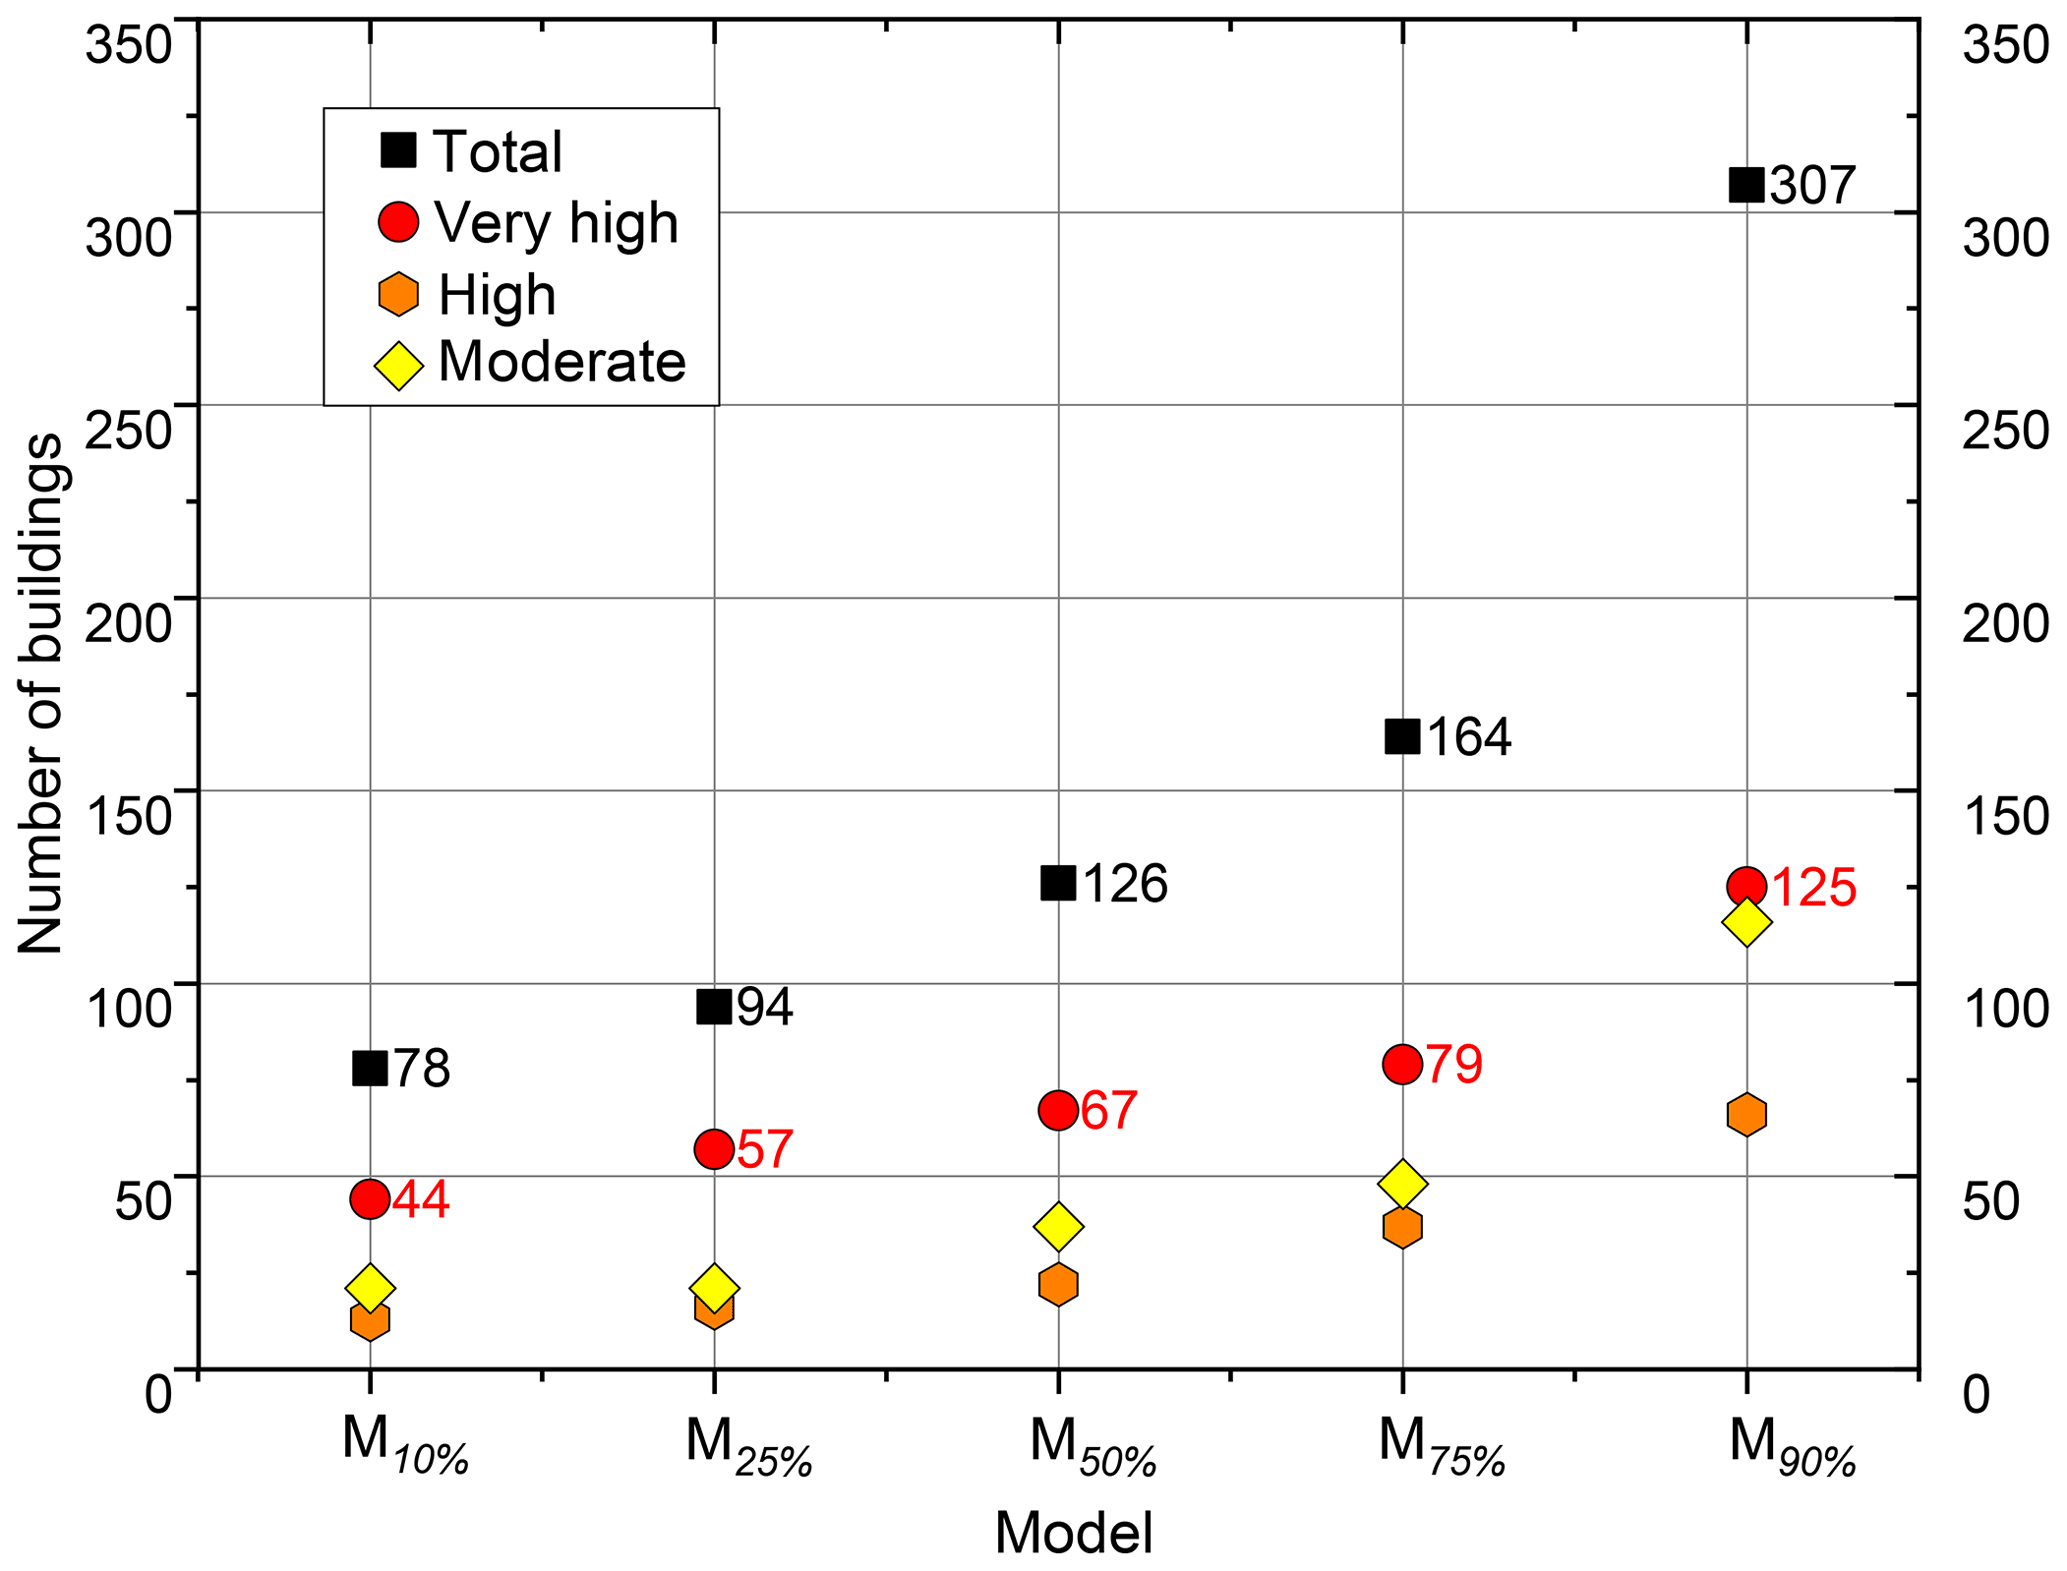
Figure 6The number of affected buildings in each hazard class for 2D HD model results using five discharge percentiles.
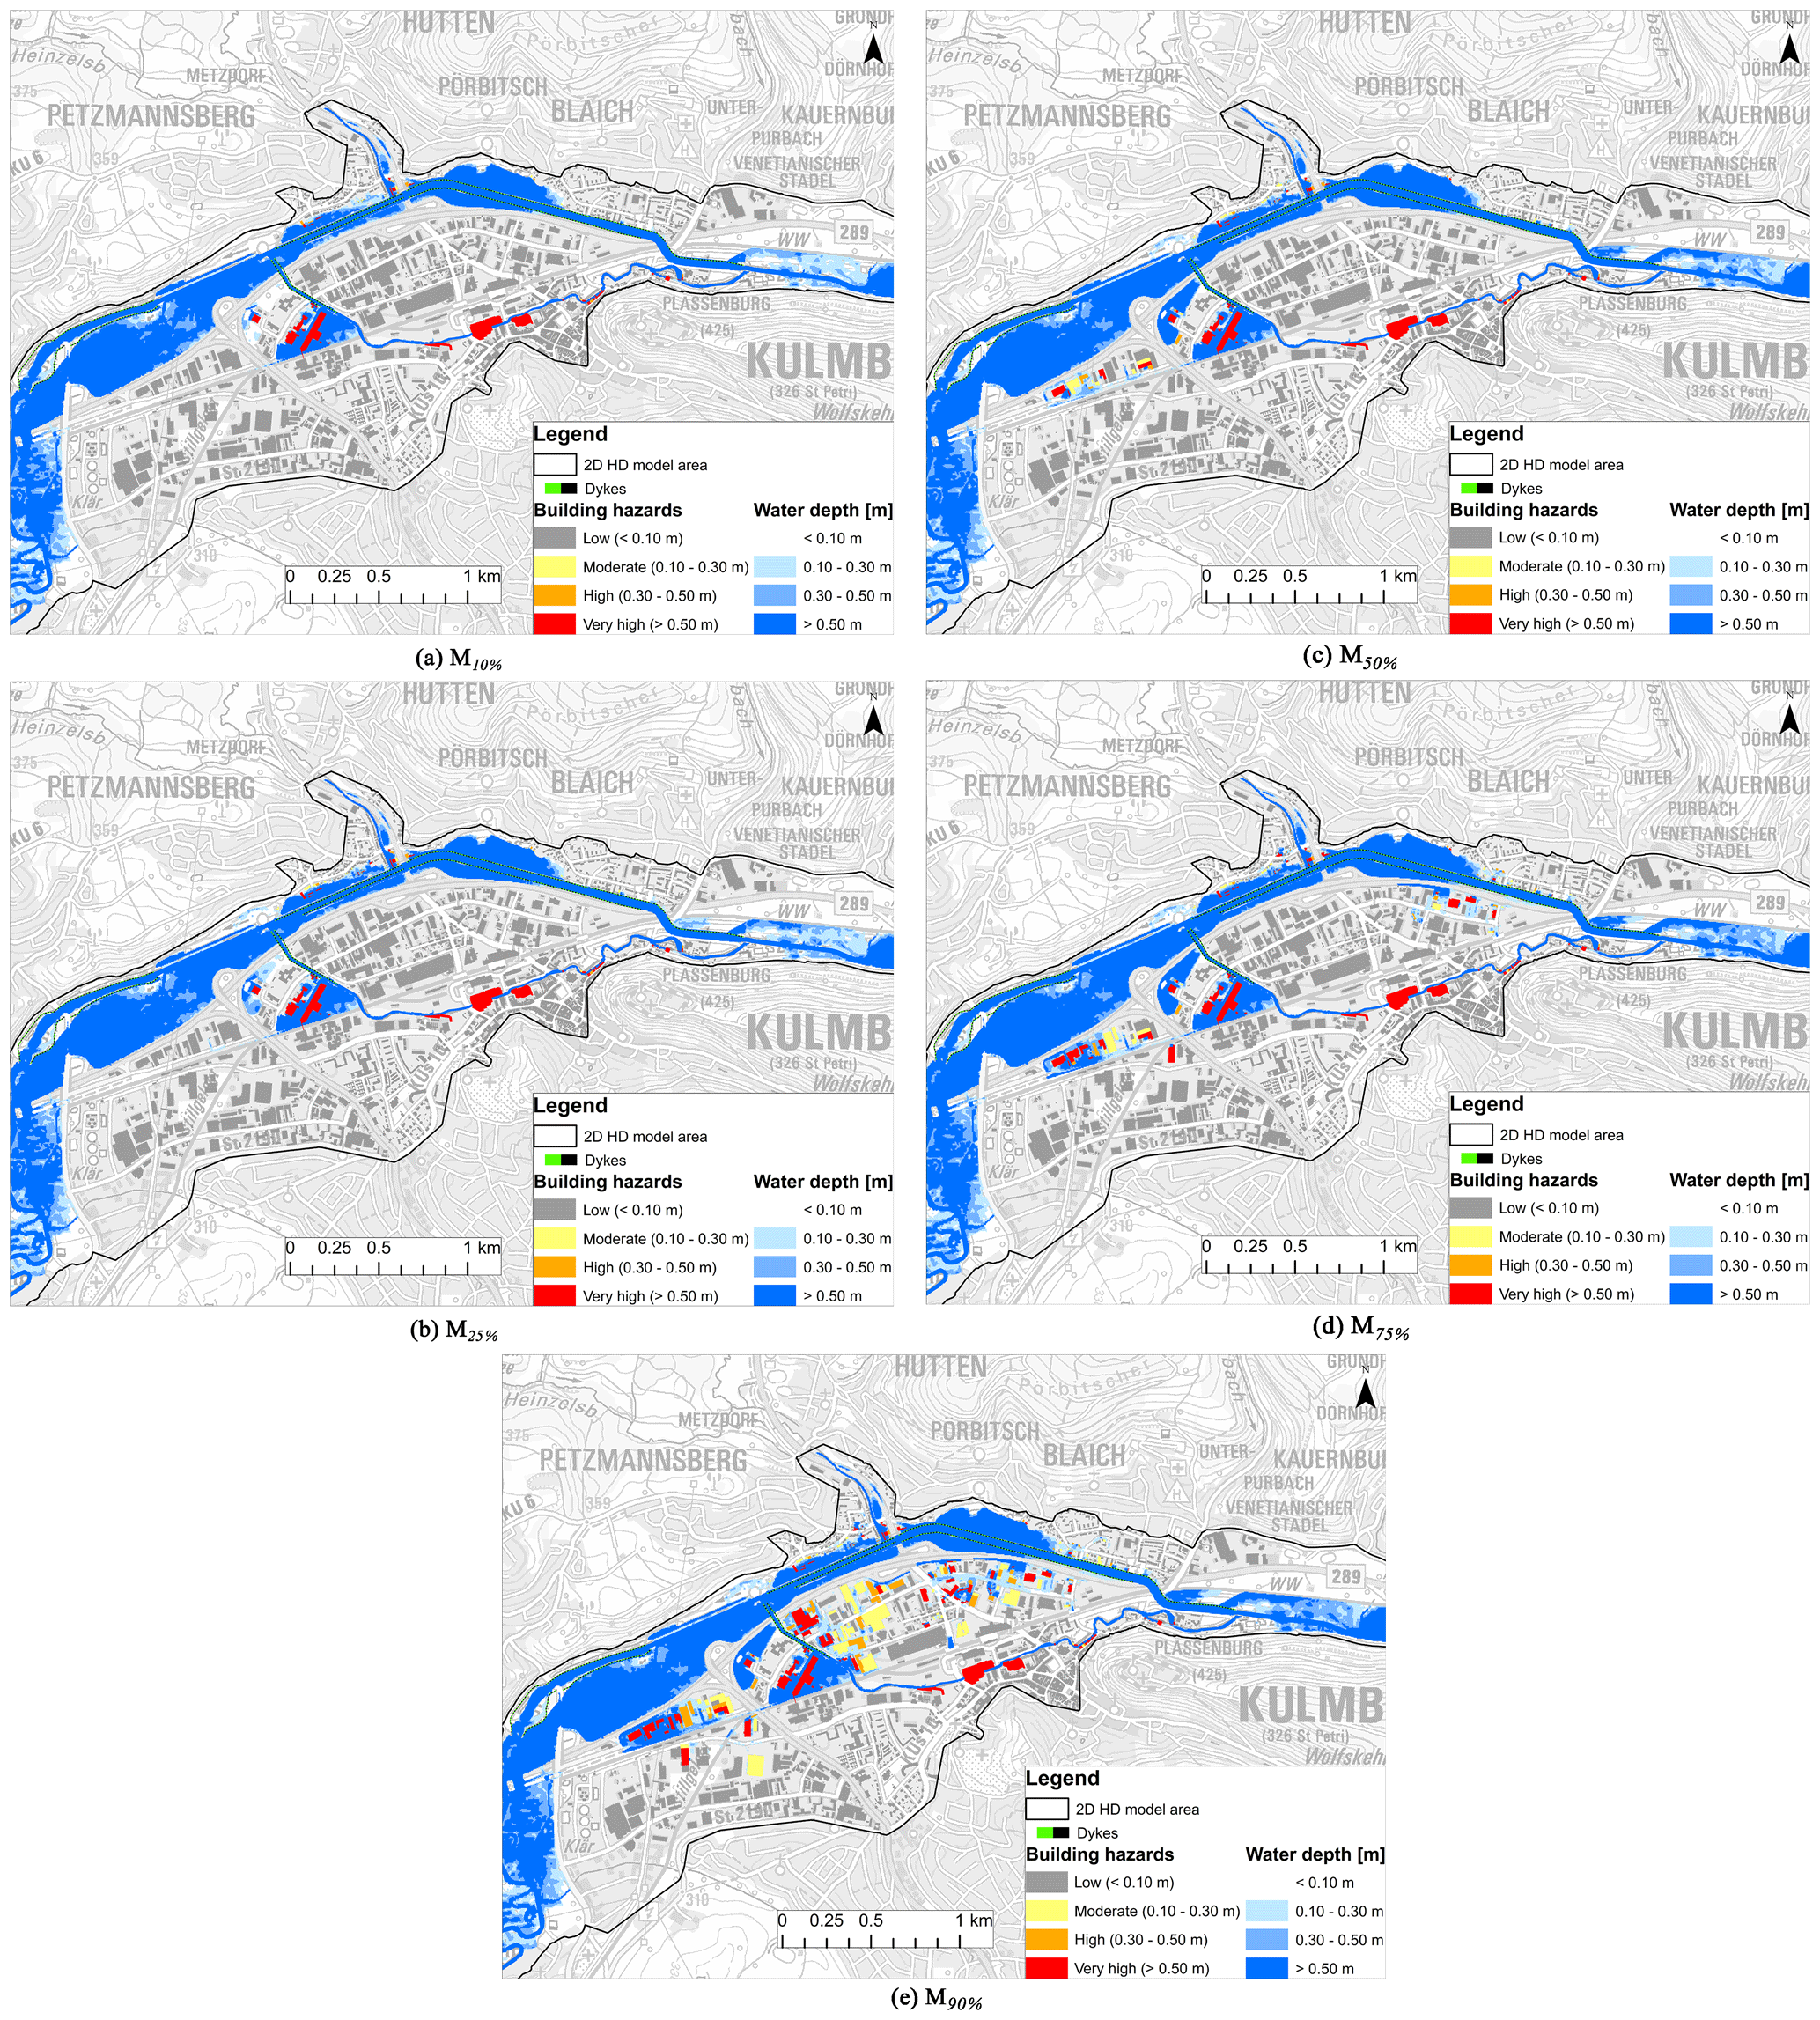
Figure 7Flood inundation and building hazard maps for five-percentile discharge hydrographs. (Data source: Geobasisdaten © Bayerische Vermessungsverwaltung, http://www.geodaten.bayern.de, last access: 5 March 2018.)
Post-event binary information on the flood extent was collected from newspaper articles and press releases published by the Bavarian Environment Agency. The information shows that the dykes were at their full capacity and most of the floodplains and traffic routes were flooded, but no serious damage was reported (Wasserwirtschaftsamt Hof, 2011). The streets Theodor-Heuss-Allee and E.-C.-Baumann-Straße were flooded, and some flooding was observed on motorway B289 (see Fig. 4 for locations).
3.2 Multi-model combination
Three combination scenarios based on a high, average and low exceedance probability were designed to illustrate the methodology developed in this study and are presented in Table 3.
Table 3Scenarios of multi-model combinations based on exceedance probability.
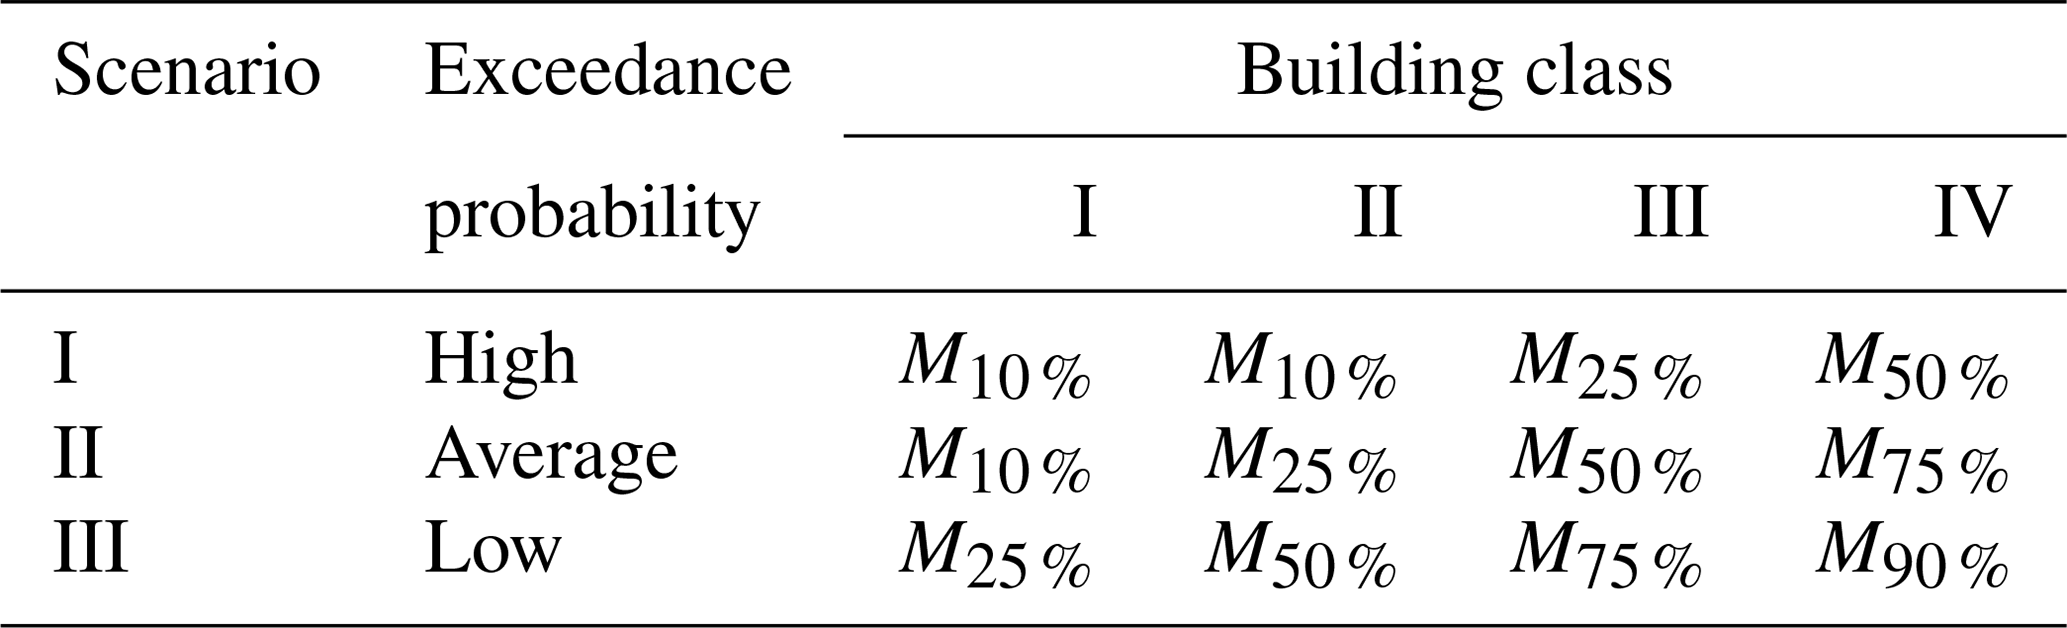
The main objective of the combination is to differentiate the impacts of water depths on building classes. Therefore, to design the combinations, a high percentile was assigned to the buildings with a high damage potential class. Each scenario presents a given risk perception that can be defined as the subjective judgement of a decision maker about the severity of the risk, which can influence the choice of mitigation measures (Botzen et al., 2009). Different risk perceptions will lead to different exceedance probability scenarios, which can be easily adjusted depending on the perception of different stakeholders. The hazard maps for the three scenarios are shown in Fig. 8.
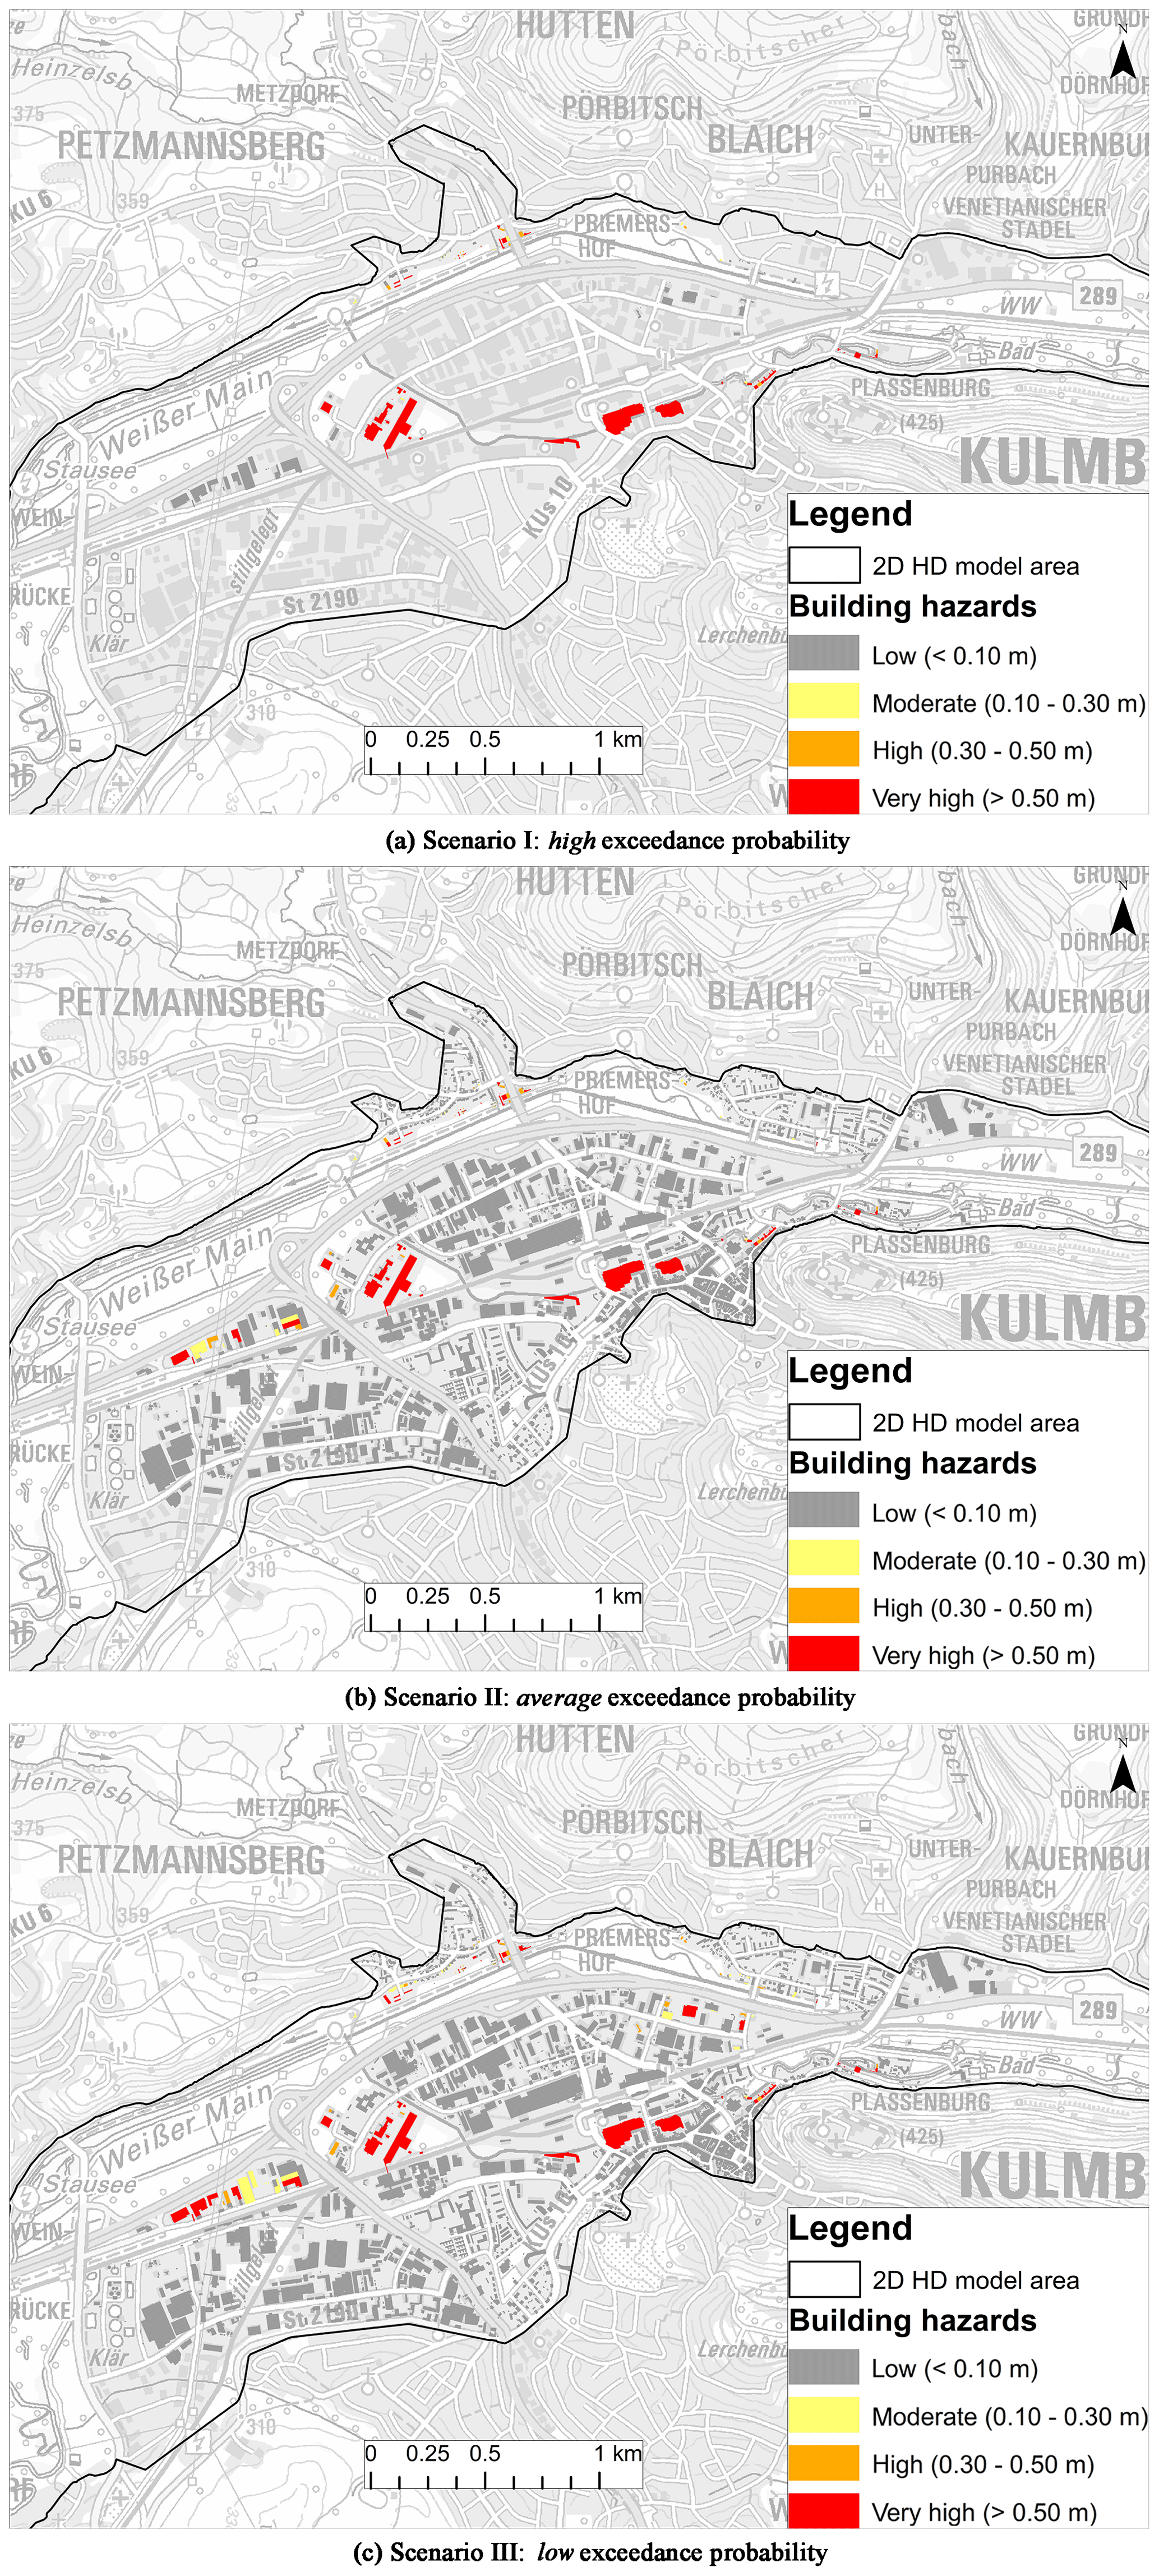
Figure 8Building hazard maps for the three scenarios; the numbers of affected buildings are 84, 107 and 142 respectively. Hazard classification is based on Krieger et al. (2017). (Data source: Geobasisdaten © Bayerische Vermessungsverwaltung, http://www.geodaten.bayern.de, last access: 5 March 2018.)
Prior work in hydrology has demonstrated the effectiveness of multi-model combinations in improving flood forecasts as compared to the best-model approach (Weigel et al., 2008). However, these methodologies were previously limited to discharge ensemble forecasts and were not researched for hazard maps. In this study, we extend the use of multi-model combinations to produce flood hazard maps for buildings depending on their use and related damage potential.
First, the five simulation results are presented in Fig. 7 as inundation and building hazard maps. It should be noted that few buildings show very high hazards due to their proximity to the Mühl canal (Fig. 7a). Even though there was no overtopping of water from the canal, because of buildings' geolocation being near to the canal, these were assigned automatically with the highest hazard, starting with a discharge of M10 %. Ideally, this should be prevented by removing the river channel elements from the dataset before assigning the water depths to the buildings as in Bermúdez and Zischg (2018). However, and without retracting our conclusions, it was decided not to include it in this work in order to keep the automation process simple. Up to a discharge of M50 %, no inundation in the city centre was observed as the dykes were not breached. It can be observed in Fig. 6 that the increment in the number of affected buildings is gradual, especially with respect to the buildings belonging to the very high hazard class. As the peak discharge increases in M75 %, the dykes at the B289 road were breached and water entered the city centre and more buildings were affected. Most damage was observed in M90 % with 307 affected buildings, out of which 125 buildings show very high hazard, an increment of 46 from M75 %. The affected buildings were located in the city centre (Fig. 7e), mainly in industrial and commercial areas. Similarly, the streets Theodor-Heuss-Allee and E.-C.-Baumann-Straße were inundated starting from a discharge of M50 %.
In operational use, the mean of the discharge ensemble or M50 % would normally have been used as the best model, which, according to Fig. 7c, is in agreement with the post-event information. However, this match might not always be representative, especially in the case of an event of a different or higher magnitude, as discussed in Di Baldassarre et al. (2010). They argued that visualizing flood hazards as a probability is a more accurate representation as compared to a single best model, which might misrepresent the uncertainty in the modelling process.
With the objective of visualizing uncertainties, three scenarios based on exceedance probability were used to combine HD model results and are presented in Fig. 8. In scenarios I and II, 84 and 107 buildings were affected, which shows that the impact of high- and average-exceedance-probability scenarios was less than that of M50 % in which a total of 126 buildings were affected, out of which 67 buildings were classified in the very high hazard class.
Furthermore, as a majority of the buildings were classified in class II and III, the resulting map of a low-exceedance-probability scenario corresponds closely with M50 % and M75 %, with 142 affected buildings. In scenario II, 63 buildings were classified in the very high hazard class, which increased to 71 in scenario III. Similarly, 22 buildings belonged to both moderate and high hazard classes, and shifting to scenario III, the number increased to 33 and 38 in the moderate and high classes respectively.
In Fig. 9, a comparison is presented between the best model (M50 %) and the multi-model combinations, and the areas with prominent changes are highlighted in red circles. The figure presents building hazards resulting from the combination of exceedance probability scenarios and locates 16 more buildings than are affected when compared to M50 %. The buildings that belong to class III (Fig. 9b) were assigned the results of M75 % and show a very high hazard. Figure 9a shows that an adjacent building belonging to class II (ID 1393) was not flooded. This demonstrates that the methodology was implemented accurately and prioritized measures such as flood impact assessment, spatial planning, early warning and emergency planning, according to the damage potential of a building. The prioritization is important in order to focus on a combination of various evacuation strategies to prevent damage and save lives (Kolen et al., 2010). Hence, decision makers must be made aware of the impact associated with a low exceedance probability to improve their planning strategies (Pappenberger and Beven, 2006; Uusitalo et al., 2015).
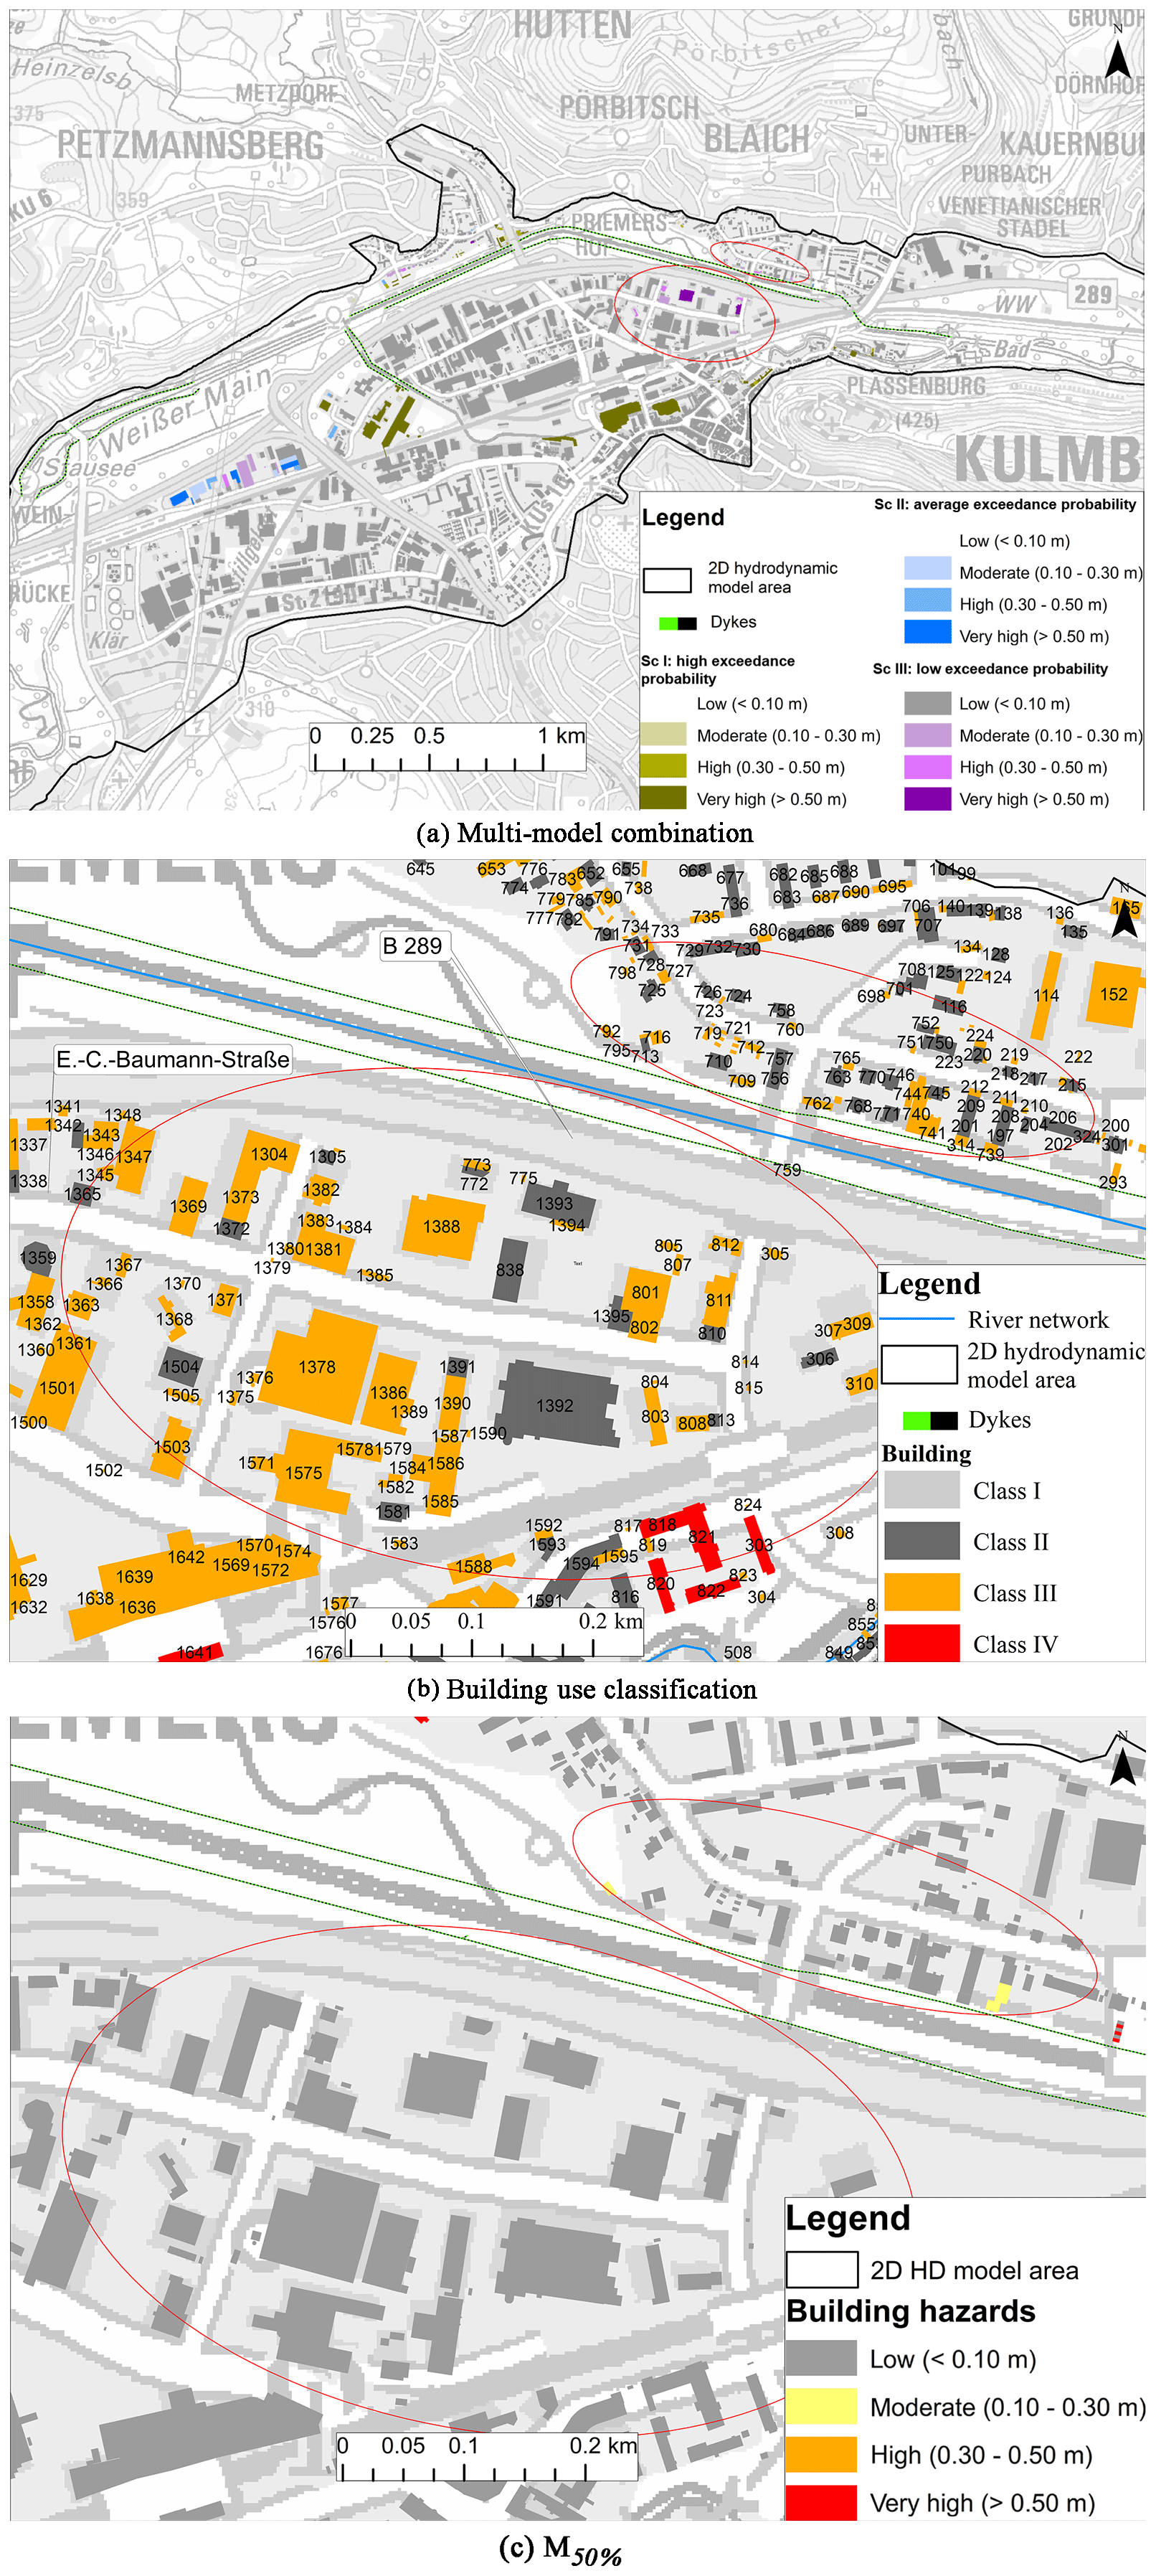
Figure 9Comparison of building hazard maps between best model (M50 %) vs. multi-model combinations. The areas with prominent change are highlighted in red circles. (Data source: Geobasisdaten © Bayerische Vermessungsverwaltung, http://www.geodaten.bayern.de, last access: 5 March 2018.)
A potential drawback of the combination is that the hazard classification may shift from low to very high in two adjacent buildings belonging to different classes. This might confuse evacuation planners by presenting inconsistent information. To tackle this issue, more information and specific guidelines should be provided to them on how to use the maps. In addition, continuous flood inundation maps are hard to obtain, especially at the boundaries of two combinations. There might be a step rise in the water depths while shifting from the results of one model to another. To address this issue, future research should be conducted to provide consistency in interpolation and in combining models (see Zazar et al., 2018). In addition, in order to avoid the confusion, these maps could be forecasted for a regular interval of 3–4 h.
Overall, the methodology is independent of the choice of models, i.e. hydrological and HD, and is transferable to other study areas. In order to use the methodology in real time, the runtime of the flood forecasting modelling should be below the flow travel time. In this study, a 50-member ensemble forecast was used from Beg et al. (2018), where the entire process took 25 min with a three-core desktop in parallel mode to generate a forecast of 12 h. Various percentile discharges were then run simultaneously in the HD model, which required 30 min to simulate a 12-hour event on an eight-core, 2.4 GHz (Intel E5-2665), including the initial start (Bhola et al. 2018a). Post-processing of the model results would consume an additional 15 min. Therefore, real-time hazard maps are delivered to decision makers in 70 min. A faster runtime can be ensured by using a simple model structure (Leandro et al., 2014) and/or high-performance computing (Kuchar et al., 2015). In the absence of such infrastructures or with a very large catchment size, HD models can be replaced with alternatives, such as terrain-based models (Zheng et al., 2018) and satellite images (Voigt et al., 2007). In addition, a database of prerecorded inundation scenarios as shown in Bhola et al. (2018a) can expand the application of this methodology.
Molinari et al. (2014) have stated that a comprehensive uncertainty assessment improves emergency responses by assessing the potential consequences of flood events. Therefore, our methodology would allow the target users to benefit from hazard maps enabling them to better prioritize and coordinate evacuation planning based on the stakeholder perception to risk. The maps could further serve as a tool for flood risk assessment. The methodology can be used for flood mitigation and flood forecast planning in the form of emergency management training, where forecasted hazard scenarios can be presented to the training groups. By visualizing inundation scenarios, potential damage at the building level which has been prioritized based on the desired classification can be estimated with this methodology and made available together with each forecasted scenario.
In summary, we have presented a new methodology for flood impact assessment using a multi-model combination in the form of building hazard maps with differentiated exceedance probability. These maps offer an alternative way to communicate the underlying uncertainties in forecasting models and are ready to use for decision makers in the field of flood risk management. The entire forecasting framework consists of three stages: (i) generation of discharge ensemble forecasts, (ii) 2D HD simulations using the generated forecasts and (iii) hazard maps using multi-model combinations. The framework was applied to the city of Kulmbach, and three multi-model combinations were designed based on exceedance probability. The model results of M50 % show a good match with binary information collected after the flood event. The low-exceedance-probability scenario corresponds closely with M50 % and M75 %. We expect this multi-model combination to improve the current visualization techniques in operational flood risk management and evacuation planning. In this study, we have considered only buildings as a feature; additional urban features, such as bridges (Gebbeken et al., 2016) and roads (Goerigk et al., 2018), should be included in the future to extend the methodology. Furthermore, other sources of uncertainty, such as HD model parameters, model structures and measured data, should also be incorporated for a comprehensive assessment. In addition, the economic, social and hazardous effects of carrying out an evacuation in the case of a false alarm must be considered. Hence, a validation of the combination is crucial to building trust in its prediction in real time. Further research investigating multi-model combinations and validation in other study areas may be beneficial. In order to design a multi-model combination, a group consisting of researchers, operational bodies and experts in the field of flood risk management should be consulted. A more extensive study on the validation of the multi-model combination may be required, possibly by using measuring gauges, post-event surveys (as conducted in Thieken et al., 2005), satellite images (as in Triglav-Čekada and Radovan, 2013), and/or crowdsourced data (Bhola et al., 2018b).
In the future, damage potential classification can be further improved by including additional criteria, such as population density or water quality, and with this the applicability of this method can be extended. For example, the assessment of the damage potential of commercial enterprises, substances or machinery containing elements that could be a source of water pollution could be included (Krieger et al., 2017). In addition, other classification methods for buildings and hazard types should be evaluated, especially to further dissect the impact of class III in commercial and industrial sectors. Finally, the output of the framework can be extended to hazard maps uploaded to a web-based GIS to improve visualization and to provide layers of additional information, such as inundation pathways and weak spots in the river and floodplains, to provide sufficient details to intervene (aid in planning). This additional information would enhance the usefulness to different target users, such as planners, decision makers and flood forecasting agencies.
Data from this research are not publicly available. Interested researchers can contact the corresponding author of this article.
The supplement related to this article is available online at: https://doi.org/10.5194/nhess-20-2647-2020-supplement.
PKB conceptualized and completed the formal uncertainty analysis. PKB wrote the original draft, which was subsequently reviewed and edited by all co-authors. All authors contributed to writing the paper.
The authors declare that they have no conflict of interest.
This research was funded by the German Federal Ministry of Education and Research (BMBF) with the grant number FKZ 13N13196. In addition, this work was supported by the German Research Foundation (DFG) and the Technical University of Munich (TUM) in the framework of the Open Access Publishing Fund. The authors would like to thank all contributing project partners, funding agencies, politicians and stakeholders in different functions in Germany. A very special thanks goes to the Bavarian Environment Agency in Hof for providing us with the quality data to conduct the research. We would also like to thank the language centre of the Technical University of Munich for their consulting in improving the language of the manuscript.
This research has been supported by the Bundesministerium für Bildung und Forschung (grant no. FKZ 13N13196). This work was supported by the German Research Foundation (DFG) and the Technical University of Munich (TUM) in the framework of the Open Access Publishing Fund.
This paper was edited by Kai Schröter and reviewed by two anonymous referees.
Alfieri, L., Feyen, L., Salamon, P., Thielen, J., Bianchi, A., Dottori, F., and Burek, P.: Modelling the socio-economic impact of river floods in Europe, Nat. Hazards Earth Syst. Sci., 16, 1401–1411, https://doi.org/10.5194/nhess-16-1401-2016, 2016.
Bartels, J., Seidel, J., Bardossy, A., Bliefernicht, J., Kunstmann, H., Kunstmann, H., Johst, M., and Demuth, N.: Bewertung von Ensemble-Abflussvorhersagen für die operationelle Hochwasserwarnung, Hydrol. Wasserbewirts., 61, 297–310, https://doi.org/10.5675/HyWa_2017,5_1, 2017.
Bates, P. D., Pappenberger, F., and Romanowicz, R. J.: Uncertainty in Flood Inundation Modelling, in: Applied Uncertainty Analysis for Flood Risk Management, edited by: Beven, K., and Hall, J., Imperial College Press, London, UK, 232–269, ISBN 978-1-78326-312-7, 2014.
Beg, M. N. A., Leandro, J., Bhola, P., Konnerth, I., Amin, K., Koeck, F., Carvalho, R. F., and Disse, M.: Flood Forecasting with Uncertainty Using a Fully Automated Flood Model Chain: A Case Study for the City of Kulmbach, HIC 2018, in: 13th International Conference on Hydroinformatics, 1–5 July 2018, Palermo, Italy, 2018.
Bermúdez, M. and Zischg, A. P.: Sensitivity of flood loss estimates to building representation and flow depth attribution methods in micro-scale flood modelling, Nat. Hazards, 92, 1633–1648. https://doi.org/10.1007/s11069-018-3270-7, 2018.
Beven, K. and Binley, A.: GLUE: 20 years on, Hydrol. Process., 28, 5897–5918, https://doi.org/10.1002/hyp.10082, 2014.
Beven, K., Leedal, D., and McCarthy, S.: Framework for assessing uncertainty in fluvial flood risk mapping, CIRIA, London, UK, 58 pp., 2014.
Beven, K., Lamb, R., Leedal, D., and Hunter, N.: Communicating uncertainty in flood inundation mapping: a case study, Intl. J. River Basin Management, 13, 285–295, https://doi.org/10.1080/15715124.2014.917318, 2015.
Beven, K. J., Almeida, S., Aspinall, W. P., Bates, P. D., Blazkova, S., Borgomeo, E., Freer, J., Goda, K., Hall, J. W., Phillips, J. C., Simpson, M., Smith, P. J., Stephenson, D. B., Wagener, T., Watson, M., and Wilkins, K. L.: Epistemic uncertainties and natural hazard risk assessment – Part 1: A review of different natural hazard areas, Nat. Hazards Earth Syst. Sci., 18, 2741–2768, https://doi.org/10.5194/nhess-18-2741-2018, 2018.
Bhola, P., Leandro, J., and Disse, M.: Framework for Offline Flood Inundation Forecasts for Two-Dimensional Hydrodynamic Models, Geosciences, 8, 346, https://doi.org/10.3390/geosciences8090346, 2018a.
Bhola, P. K., Nair, B. B., Leandro, J., Rao, S. N., and Disse, M.: Flood inundation forecasts using validation data generated with the assistance of computer vision, J. Hydroinform., 21, 240–256, https://doi.org/10.2166/hydro.2018.044, 2018b.
Boelee, L., Lumbroso, D. M., Samuels, P. G., and Cloke, H. L.: Estimation of uncertainty in flood forecasts – A comparison of methods, J. Flood Risk. Manag., e12516, https://doi.org/10.1111/jfr3.12516, 2018.
Botzen, W. J. W., Aerts, J. C. J. H., and van den Bergh, J. C. J. M.: Dependence of flood risk perceptions on socioeconomic and objective risk factors, Water Res., 45, W10440, https://doi.org/10.1029/2009WR007743, 2009.
Bruen, M., Krahe, P., Zappa, M., Olsson, J., Vehvilainen, B., Kok, K., and Daamen, K.: Visualizing flood forecasting uncertainty: some current European EPS platforms – COST731 working group 3, Atmos. Sci. Lett., 11, 92–99, https://doi.org/10.1002/asl.258, 2010.
Brunner, G. W., United, S., Army, Corps of, E., Institute for Water, R., and Hydrologic Engineering, C.: HEC-RAS river analysis system: hydraulic reference manual Version 5.0, US Army Corps of Engineers, Institute for Water Resources, Hydrologic Engineering Center, Davis, CA, 2016.
Cloke, H. L. and Pappenberger, F.: Ensemble flood forecasting: A review, J. Hydrol., 375, 613–626, https://doi.org/10.1016/j.jhydrol.2009.06.005, 2009.
Demuth, N. and Rademacher, S.: Chapter 5 – Flood Forecasting in Germany – Challenges of a Federal Structure and Transboundary Cooperation, in: Flood Forecasting, edited by: Adams, T. E. and Pagano, T. C., Academic Press, Boston, 125–151, 2016.
Di Baldassarre, G. and Montanari, A.: Uncertainty in river discharge observations: a quantitative analysis, Hydrol. Earth Syst. Sci., 13, 913–921, https://doi.org/10.5194/hess-13-913-2009, 2009.
Di Baldassarre, G., Schumann, G., Bates, P. D., Freer, J. E., and Beven, K. J.: Flood-plain mapping: a critical discussion of deterministic and probabilistic approaches, Hydrolog. Sci. J., 55, 364–376, https://doi.org/10.1080/02626661003683389, 2010.
Disse, M., Konnerth, I., Bhola, P. K., and Leandro, J.: Unsicherheitsabschätzung für die Berechnung von dynamischen Überschwemmungskarten – Fallstudie Kulmbach, in: Vorsorgender und nachsorgender Hochwasserschutz: Ausgewählte Beiträge aus der Fachzeitschrift WasserWirtschaft Band 2, edited by: Heimerl, S., Springer Fachmedien Wiesbaden, Wiesbaden, 350–357, 2018.
Dotto, C. B. S., Mannina, G., Kleidorfer, M., Vezzaro, L., Henrichs, M., McCarthy, D. T., Freni, G., Rauch, W., and Deletic, A.: Comparison of different uncertainty techniques in urban stormwater quantity and quality modelling, Water Res., 46, 2545–2558, https://doi.org/10.1016/j.watres.2012.02.009, 2012.
Doyle, E. E. H., Johnston, D. M., Smith, R., and Paton, D.: Communicating model uncertainty for natural hazards: A qualitative systematic thematic review, Int. J. Disast. Risk Re., 33, 449–476, https://doi.org/10.1016/j.ijdrr.2018.10.023, 2019.
Dutta, D., Herath, S., and Musiake, K.: A mathematical model for flood loss estimation, J. Hydrol., 277, 24–49, https://doi.org/10.1016/S0022-1694(03)00084-2, 2003.
European Union: Directive 2007/60/EC of the European Parliament and of the Council of 23 October 2007 on the assessment and management of flood risks, 2007.
Gebbeken, N., Videkhina, I., Pfeiffer, E., Garsch, M., and Rüdiger, L.: Risikobewertung und Schutz von baulichen Infrastrukturen bei Hochwassergefahr, Bautechnik, 93, 199–213, https://doi.org/10.1002/bate.201600003, 2016.
Goerigk, M., Hamacher, H. W., and Kinscherff, A.: Ranking robustness and its application to evacuation planning, Eur. J. Oper. Res., 264, 837–846, https://doi.org/10.1016/j.ejor.2016.05.037, 2018.
Haag, I. and Bremicker, M.: Möglichkeiten und Grenzen der Schneesimulation mit dem Hochwasservorhersagemodell LARSIM, Forum für Hydrol. Wasserbewirts., 33, 47–58, 2013.
Haag, I., Johst, M., Sieber, A., and Bremicher, M.: Guideline for the Calibration of LARSIM Water Balance Models for operational Application in Flood Forecasting, LARSIM Entwicklergemeinschaft – Hochwasserzentralen LUBW, BLfU, LfU RP, HLNUG, BAFU, 2016.
Hagemeier-Klose, M. and Wagner, K.: Evaluation of flood hazard maps in print and web mapping services as information tools in flood risk communication, Nat. Hazards Earth Syst. Sci., 9, 563–574, https://doi.org/10.5194/nhess-9-563-2009, 2009.
Hammond, M. J., Chen, A. S., Djordjevi, S., Butler, D., and Mark, O.: Urban flood impact assessment: A state-of-the-art review, Urban Water J., 12, 14–29, https://doi.org/10.1080/1573062X.2013.857421, 2013.
Henonin, J., Russo, B., Mark, O., and Gourbesville, P.: Real-time Urban Flood Forecasting and Modelling – a State of the Art, J. Hydroinform., 15, 717–736, https://doi.org/10.2166/hydro.2013.132, 2013.
Jonkman, S. N., Bockarjova, M., Kok, M., and Bernardini, P.: Integrated hydrodynamic and economic modelling of flood damage in the Netherlands, Ecol. Econ. 66, 77–90, https://doi.org/10.1016/j.ecolecon.2007.12.022, 2008.
Kauffeldt, A., Wetterhall, F., Pappenberger, F., Salamon, P., and Thielen, J.: Technical review of large-scale hydrological models for implementation in operational flood forecasting schemes on continental level, Environ. Modell. Softw., 75, 68–76, https://doi.org/10.1016/j.envsoft.2015.09.009, 2016.
Kolen, B., Kutschera, G., and Helsloot, I.: A comparison between the Netherlands and Germany of evacuation in case of extreme flooding, Urban flood Conference, 26–27 September, Paris, 2010.
Kreibich, H., Seifert, I., Merz, B., and Thieken, A. H.: Development of FLEMOcs – a new model for the estimation of flood losses in the commercial sector, Hydrolog. Sci. J., 55, 1302–1314, https://doi.org/10.1080/02626667.2010.529815, 2010.
Krieger, K., Schmitt, T. G., and Illgen, M.: Risikomanagement in der kommunalen Überflutungsvorsorge nach DWA-Merkblatt M 119, GWF Wasser Abwasser, 158, 34–39, 2017.
Kuchar, S., Golasowski, M., Vavrik, R., Podhoranyi, M., Sir, B., and Martinovic, J.: Using High Performance Computing for Online Flood Monitoring and Prediction, Int. J. Env. Chem. Ecolog. Geolog. Geophy. Eng., 101, 432–437, 2015.
Laurent, S., Hangen-Brodersen, C., Ehret, U., Meyer, I., Moritz, K., Vogelbacher, A., and Holle, F.-K.: Forecast uncertainties in the operational flood forecasting of the Bavarian Danube catchment, in: Hydrological Processes of the Danube River Basin, edited by: Brilly, M., Springer, Dordrecht, Netherlands, 367–387, 2010.
Leandro, J., Leitão, J. P., and de Lima, J. L. M. P.: Quantifying the uncertainty in the Soil Conservation Service flood hydrographs: a case study in the Azores Islands, J. Flood Risk. Manag., 6, 279–288, https://doi.org/10.1111/jfr3.12010, 2013.
Leandro, J., Chen, A. S., and Schumann, A.: A 2D parallel diffusive wave model for floodplain inundation with variable time step (P-DWave), J. Hydrol., 517, 250–259, https://doi.org/10.1016/j.jhydrol.2014.05.020, 2014.
Leandro, J., Schumann, A., and Pfister, A.: A step towards considering the spatial heterogeneity of urban key features in urban hydrology flood modelling, J. Hydrol., 535, 356–365, https://doi.org/10.1016/j.jhydrol.2016.01.060, 2016.
Leedal, D., Neal, J., Beven, K., Young, P., and Bates, P.: Visualization approaches for communicating real-time flood forecasting level and inundation information, J. Flood Risk. Manag., 3, 140–150, https://doi.org/10.1111/j.1753-318X.2010.01063.x, 2010.
Luce, A., Haag, I., and Bremicker, M.: Daily discharge forecasting with operational water-balance models in Baden-Württemberg, Hydrol. Wasserbewirts., 50, 58–66, 2006.
Ludwig, K. and Bremicker, M.: The water balance model LARSIM: design, content and applications, Inst. für Hydrologie der Univ., Freiburg i. Br., User Manual of Software, 2006.
Martins, R., Leandro, J., Chen, A. S., and Djordjević, S.: A comparison of three dual drainage models: shallow water vs local inertial vs diffusive wave, J. Hydroinform., 19, 331–348, https://doi.org/10.2166/hydro.2017.075, 2017.
Meyer, V., Scheuer, S., and Haase, D.: A multicriteria approach for flood risk mapping exemplified at the Mulde river, Germany, Nat. Hazards, 48, 17–39, https://doi.org/10.1007/s11069-008-9244-4, 2009.
Molinari, D., Ballio, F., Handmer, J., and Menoni, S.: On the modeling of significance for flood damage assessment, Int. J. Disast. Risk Re., 10, 381–391, https://doi.org/10.1016/j.ijdrr.2014.10.009, 2014.
Moya Quiroga, V., Kure, S., Udo, K., and Mano, A.: Application of 2D numerical simulation for the analysis of the February 2014 Bolivian Amazonia flood: Application of the new HEC-RAS version 5, RIBAGUA – Rev. Iberoam. Agua, 3, 25–33, https://doi.org/10.1016/j.riba.2015.12.001, 2016.
Nester, T., Komma, J., Viglione, A., and Blöschl, G.: Flood forecast errors and ensemble spread – A case study, Water Resour. Res., 48, W10502, https://doi.org/10.1029/2011wr011649, 2012.
Oudin, L., Andréassian, V., Mathevet, T., Perrin, C., and Michel, C.: Dynamic averaging of rainfall-runoff model simulations from complementary model parameterizations, Water Resour. Res., 42, W07410, https://doi.org/10.1029/2005wr004636, 2006.
Pappenberger, F. and Beven, K. J.: Ignorance is bliss: Or seven reasons not to use uncertainty analysis, Water Resour. Res., 42, W05302, https://doi.org/10.1029/2005WR004820, 2006.
Pappenberger, F., Harvey, H., Beven, K., Hall, J., and Meadowcroft, I.: Decision tree for choosing an uncertainty analysis methodology: a wiki experiment, Hydrol. Process., 20, 3793–3798, https://doi.org/10.1002/hyp.6541, 2006.
Pappenberger, F., Beven, K. J., Ratto, M., and Matgen, P.: Multi-method global sensitivity analysis of flood inundation models, Adv. Water Resour., 31, 1–14, https://doi.org/10.1016/j.advwatres.2007.04.009, 2008.
Patel, D. P., Ramirez, J. A., Srivastava, P. K., Bray, M., and Han, D.: Assessment of flood inundation mapping of Surat city by coupled 1D/2D hydrodynamic modeling: a case application of the new HEC-RAS 5, Nat. Hazards, 89, 93–130, https://doi.org/10.1007/s11069-017-2956-6, 2017.
Schanze, J.: A hybrid multi-model approach to river level forecasting, in: Flood Risk Management: Hazards, Vulnerability and Mitigation Measures, edited by: Schanze, J., Zeman, E., and Marsalek, J., Flood Risk Management: Hazards, Vulnerability and Mitigation Measures, Springer Netherlands, Dordrecht, 1–20, 2006.
See, L. and Openshaw, S.: A hybrid multi-model approach to river level forecasting, Hydrolog. Sci. J., 45, 523–536, https://doi.org/10.1080/02626660009492354, 2000.
Shamseldin, A. Y., O'Connor, K. M., and Liang, G. C.: Methods for combining the outputs of different rainfall – runoff models, J. Hydrol., 197, 203–229, https://doi.org/10.1016/S0022-1694(96)03259-3, 1997.
Shultz, S.: The Extent and Nature of Potential Flood Damage to Commercial Property Structures in the Midwestern United States, J. Contemp. Water Res. Educ., 161, 81–91, https://doi.org/10.1111/j.1936-704X.2017.3253.x, 2017.
Thieken, A. H., Müller, M., Kreibich, H., and Merz, B.: Flood damage and influencing factors: New insights from the August 2002 flood in Germany, Water Resour. Res., 41, W12430, https://doi.org/10.1029/2005wr004177, 2005.
Thieken, A. H., Olschewski, A., Kreibich, H., Kobsch, S., and Merz, B.: Development and evaluation of FLEMOps – a new Flood Loss Estimation Model for the private sector, in: Flood Recovery, Innovation and Response I. Flood Recovery, Innovation And Response 2008, London, England, 2–3 July 2008, edited by: Proverbs, D., Brebbia, C. A., and Penning-Rowsell, E., WIT Press, Southampton, UK, 315–324, 2008.
Thieken, A. H., Bessel, T., Kienzler, S., Kreibich, H., Müller, M., Pisi, S., and Schröter, K.: The flood of June 2013 in Germany: how much do we know about its impacts?, Nat. Hazards Earth Syst. Sci., 16, 1519–1540, https://doi.org/10.5194/nhess-16-1519-2016, 2016.
Todini, E.: Flood Forecasting and Decision Making in the new Millennium, Where are We?, Water Res. Manag., 31, 3111–3129, https://doi.org/10.1007/s11269-017-1693-7, 2017.
Triglav-Čekada, M. and Radovan, D.: Using volunteered geographical information to map the November 2012 floods in Slovenia, Nat. Hazards Earth Syst. Sci., 13, 2753–2762, https://doi.org/10.5194/nhess-13-2753-2013, 2013.
Uusitalo, L., Lehikoinen, A., Helle, I., and Myrberg, K.: An overview of methods to evaluate uncertainty of deterministic models in decision support, Environ. Modell. Softw., 63, 24–31, https://doi.org/10.1016/j.envsoft.2014.09.017, 2015.
Voigt, S., Kemper, T., Riedlinger, T., Kiefl, R., Scholte, K., and Mehl, H.: Satellite Image Analysis for Disaster and Crisis-Management Support, IEEE T. Geosci. Remote., 45, 1520–1528, https://doi.org/10.1109/TGRS.2007.895830, 2007.
Wasserwirtschaftsamt Hof: Gebiet des Mains: available at: https://www.wwa-ho.bayern.de/hochwasser/hochwasserereignisse/januar2011/main/index.htm (last access: 27 March 2019), 2011.
Weigel, A. P., Liniger, M. A., and Appenzeller, C.: Can multi-model combination really enhance the prediction skill of probabilistic ensemble forecasts?, Q. J. Roy. Meteor. Soc., 134, 241–260, https://doi.org/10.1002/qj.210, 2008.
Zarzar, C. M., Hosseiny, H., Siddique, R., Gomez, M., Smith, V., Mejia, A., and Dyer, J.: A Hydraulic MultiModel Ensemble Framework for Visualizing Flood Inundation Uncertainty, J. Am. Water Resour. As., 54, 807–819, https://doi.org/10.1111/1752-1688.12656, 2018.
Zheng, X., Tarboton, D. G., Maidment, D. R., Liu, Y. Y., and Passalacqua, P.: River Channel Geometry and Rating Curve Estimation Using Height above the Nearest Drainage, J. Am. Water Resour. As., 54, 785–806, https://doi.org/10.1111/1752-1688.12661, 2018.