the Creative Commons Attribution 4.0 License.
the Creative Commons Attribution 4.0 License.
 | 06 Oct 2020
Rapid flood risk screening model for compound flood events in Beira, Mozambique
Erik C. van Berchum
Mathijs van Ledden
Jos S. Timmermans
Jan H. Kwakkel
Sebastiaan N. Jonkman
Coastal cities combine intensive socioeconomic activities and investments with high exposure to flood hazards. Developing effective strategies to manage flood risk in coastal cities is often a costly and complicated process. In designing strategies, engineers rely on computationally demanding flood simulation models, but they can only compare a limited number of strategies due to computational constraints. This limits the efficacy of standard flood simulation models in the crucial conceptual phase of flood risk management. This paper presents the Flood Risk Reduction Evaluation and Screening (FLORES) model, which provides useful risk information in this early conceptual phase. FLORES rapidly performs numerous simulations and compares the impact of many storms, strategies, and future scenarios. This article presents FLORES and demonstrates its merits in a case study for Beira, Mozambique. Our results demonstrate that expansion of the drainage capacity and strengthening of its coastal protection in the southwest are crucial components of any effective flood risk management strategy for Beira.
- Article
(5879 KB) - Full-text XML
- BibTeX
- EndNote


1.1 Background
Coastal cities are under increasing pressure of flood events. Currently, floods are the most recurring and damaging type of natural hazard, posing major threats to socioeconomic development and safety of inhabitants (Fraser et al., 2016). Both socioeconomic activity and extreme weather events are increasing rapidly, and even though cities in many cases are becoming less vulnerable due to effective flood risk management, flood risk is growing in many flood-prone regions around the world (Doocy et al., 2013; Mechler and Bouwer, 2015; Salman and Li, 2018). The main processes leading to urban flooding are extreme rainfall (pluvial flooding), high river discharge (fluvial flooding), and storm surges (coastal flooding). For coastal cities, these flood hazards interact and can be correlated. Individual meteorological events, like hurricanes, can simultaneously cause extreme rainfall and high storm surges. These compound events further increase both the vulnerability and the complexity of flood risk management in coastal cities. Research on compound flooding is growing as it plays an important role in flood risk management of cities along coasts and rivers, and the occurrence of compound floods is growing significantly (Wahl et al., 2015; Zscheischler et al., 2018; Paprotny et al., 2020).
The impact of flooding can be reduced through measures that improve the city's hydraulic ability to deal with the flood hazard – the probability of a flood event – or reduce the damage caused by a flood event. Managing flood risk is often the role of local governments. The planning process can be supported through flood risk analysis, which informs decision makers about the most significant risks and how to best manage them (Sayers et al., 2013). The type and detail of risk information required varies throughout the phases of the planning process. This is, however, not always recognized in the tools that are used to generate the required information.
Quantitative flood risk analysis is often supported by computer models. The first models, limited by computational power and available input data, focused on analytical optimization in order to explain and compare concepts (Van Dantzig, 1956; USACE, 1996; Vrijling et al., 1998). These models mostly focused on the economic impact of floods only: first because this was needed most and second because multiobjective optimization quickly complicates calculations. More recent developments allow the optimization to account for intangible damages (Kind, 2014), nature-based flood protection (Vuik et al., 2016), and multiple lines and types of defense within the same flood protection system (Custer, 2015; Dupuits et al., 2017). These developments were made possible through highly schematized regional layouts that limit computational load. This does, however, limit the ability to model a city's layout in a sufficiently accurate way.
On the other side of the spectrum, numerical flood modeling has developed into standard practice for the design of flood risk management systems. The use of high-resolution flood simulation software (e.g., Delft3D, SWMM, MIKE) is standard practice in large flood risk management design projects. These simulations incorporate in-depth knowledge of fundamental hydraulic processes and the use of geographic information system (GIS)-based tools (Kovar and Nachtnebel, 1993), made possible by the growth in computational power. In recent years, several models have also been developed, specifically aiming to simulate compound flooding (Pasquier et al., 2019; Gori et al., 2020). These models provide accurate simulation for specific coastal cities. These simulations, however, are complex, labor-intensive to develop, time-consuming to run, and expensive. In addition, their high accuracy demands lots of input data and computational power. This type of model is therefore not well suited for analyses where many simulations are required, such as uncertainty analysis, investment strategy analysis, or the comparison of many flood risk reduction measures (Haasnoot et al., 2014).
The gap between conceptual, analytical models and high-resolution spatial flood simulation models leaves room for models that take local spatial circumstances into account but still can evaluate many scenarios and many flood risk management options. In recent years, several of these models have been developed, mostly for particular case studies (Jamali et al., 2018; de Ruig et al., 2019; Shen et al., 2016). These models run relatively quickly because of their simplified schematization of the project area and flood hazard. But this restricts their ability to be applied to other areas. This paper describes a fast, widely applicable flood risk screening model. This model can be adapted to local circumstances. It can be used to investigate multiple flood hazards, many different scenarios, and many possible flood risk management options.
1.2 Objective and scope
This paper introduces the Flood Risk Reduction Evaluation and Screening (FLORES) model as a generally applicable decision-support model for the early planning stages of flood risk management. It has been developed for exploring and evaluating the impact of many different flood risk reduction strategies within a flood-prone area. The FLORES model generalizes a model originally developed to study coastal flooding in the Houston–Galveston Bay area (van Berchum et al., 2018b). In this paper, we describe how the model has been developed into a generally applicable flood risk screening model by including pluvial flooding of urban areas. The schematization has been generalized such that more types of urban layouts can systematically be modeled. In addition, FLORES can simulate multiple interacting flood hazards, in this case coastal and pluvial flooding. The main characteristics of FLORES are to (1) make risk-based assessments of flood risk reduction strategies, (2) minimize computational load, (3) enable considering structural and nonstructural measures, (4) compare flood risk reduction strategies based on multiple performance metrics, and (5) be applicable to a wide range of urban layouts. FLORES is demonstrated using a case study of Beira, Mozambique, which represents a case with compound flooding in a data-poor environment.
2.1 Model structure
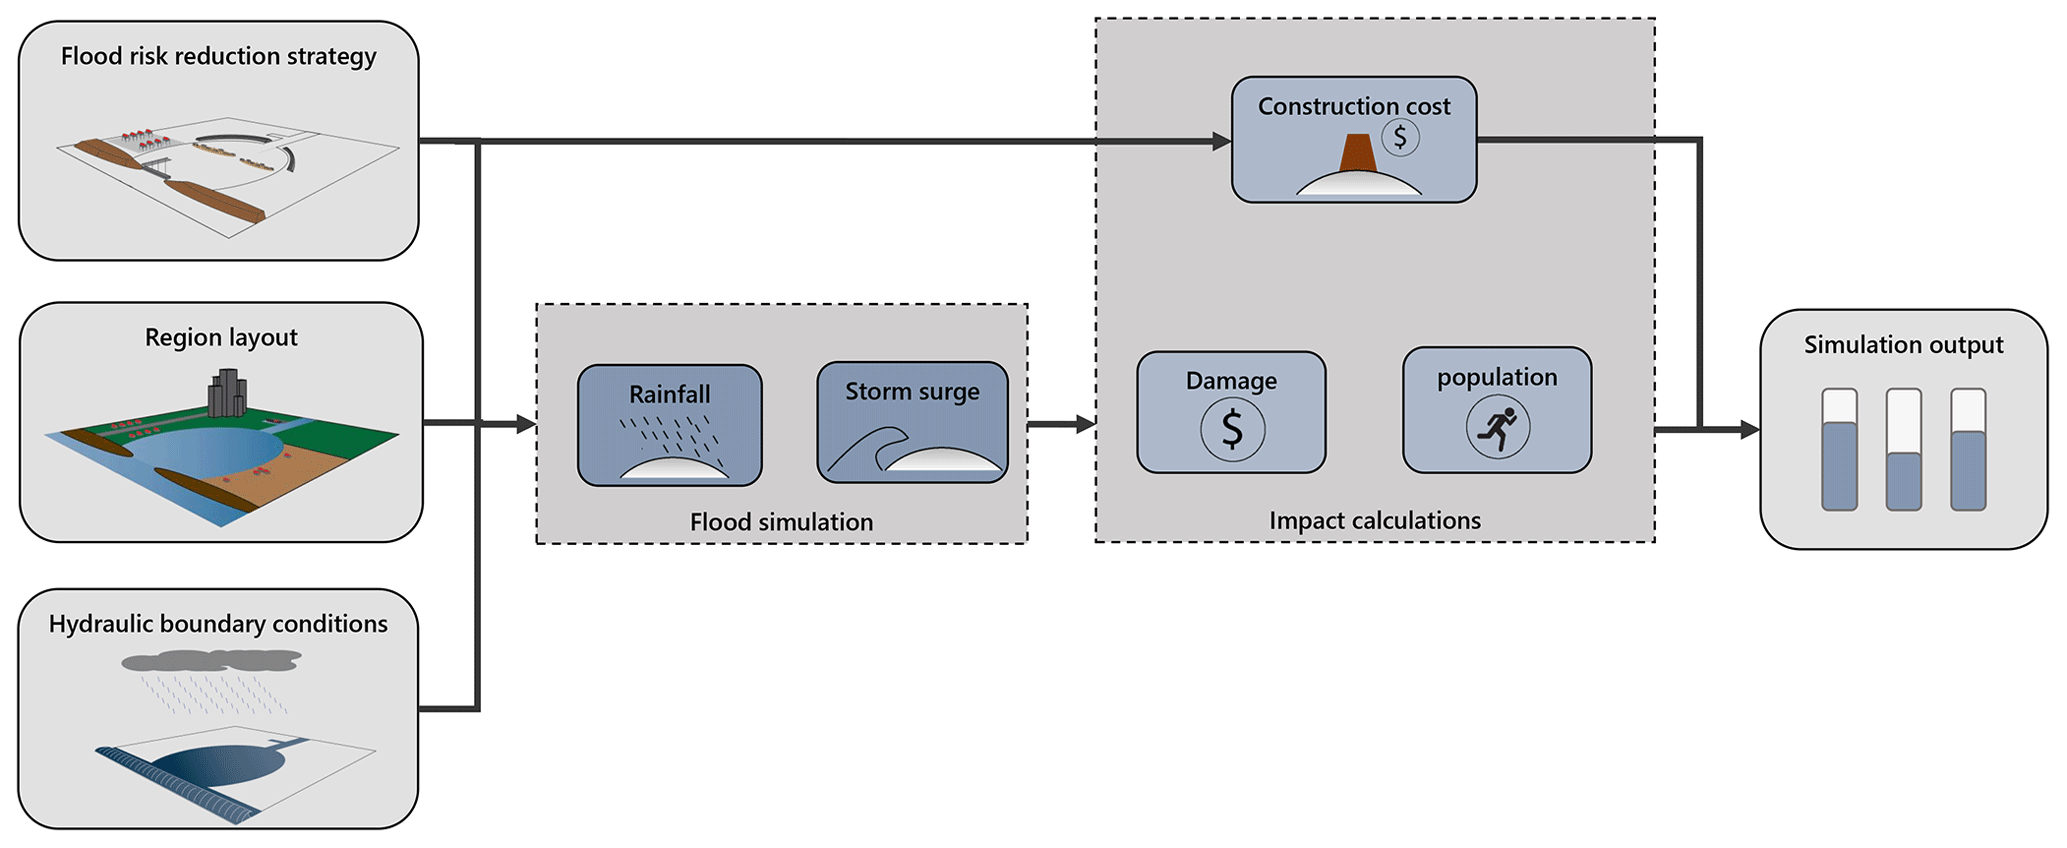
The Flood Risk Reduction Evaluation and Screening model, FLORES, can assess and compare many different strategies for reducing flood risk in coastal cities. At the heart of the model is a flood simulation model, which calculates the extent and resulting impact (i.e., economic damage, number of people affected) of a flood event, represented by a storm surge and rainfall event, each with a specific return period (Fig. 1). The use of FLORES in the design of a flood risk management system for a coastal city requires many simulations that evaluate a range of hazards and risk reduction strategies under many scenarios on multiple impacts. Simulating the resulting number of possible scenarios is computationally heavy and only feasible when individual simulations are fast (on the order of seconds). Therefore, the flood simulation uses basic hydraulic formulas and hydrological balances instead of detailed simulation software. To assess a single flood risk reduction strategy consisting of multiple soft and hard measures, the simulation is repeated for a range of different hazard combinations to build a complete risk profile (Kaplan and Garrick, 1981). This can be compared with the original situation, showing the risk reduction as a result of implementing the measures. Multiple strategies as well as different possible future scenarios (i.e., climate scenarios) can be assessed to get a clear picture of the options and their consequences.
2.1.1 Flood event simulation model
A flood simulation consists of two parts: the hydraulic flood simulation and the impact calculation. The first part simulates how water flows into and through the urban area during the storm event, resulting in maximum water levels throughout a city. The impact calculation uses these maximum water levels to estimate impact in terms of economic damage and number of people affected.
The hydraulic flood simulation takes both rainfall and storm surge into account. Urban flooding is schematized through a combination of an urban inundation model and a drainage system model. For the schematization, the city is divided into drainage basins, which are areas where all water drains towards the same place, see Fig. 2. Similar schematizations have been used before, for example by Gouldby et al. (2008) and Shen et al. (2016). Throughout the simulated storm, the hydraulic response is calculated by viewing the hydrological balance for each basin for each time step:

Figure 2Schematization of the city from GIS data into input data for the FLORES model. Based on the DEM, the region is divided into basins and contours, leading to a volume–depth curve of every basin. This schematization does not include coastal boundaries yet.
The volume of water in a drainage basin after time step i (Vi) depends on the volume at the previous time step (Vi−1), the length of the time step (t), and the number of hydrological processes that cause an inflow or outflow of water. Inflows are rainfall (Qr), storm surge overtopping nearby barriers (Qs), surface flow from neighboring basins (Qfi), and drainage of upstream basins (Qdi). Outflows are infiltration (Qin), drainage flow (Qdo), and surface flow towards neighboring basins (Qfo). The difference between inflow and outflow is stored in the basin itself (Qrt), starting with retention. When the retention capacity is fully utilized, water floods the streets, starting at the lowest part (often the drainage point) of the basin.
The schematization of the storm surge routing is based on van Berchum et al. (2018b): the borders between land and water are schematized as line elements (lines of defense) that separate the outside water from the drainage basins inside. Here, barriers can be placed in the form of dunes, levees, storm surge barriers, etc. For each time step, basic formulas calculate the amount of overtopping or overflow passing a barrier. This counts as inflow for the drainage basins behind the barrier. By dividing the area into layers (e.g., coastal zone, bay side, inner city), the model can simulate flood protection based on multiple lines of defense. For structural flood defenses, the probability of failure is also taken into account through fragility curves as levee failure has a huge effect on the flood impact. The fragility curves are currently schematized as cumulative normal distributions. The simulation considers all possible scenarios (which structures fail) by running the entire hydraulic flow model for all scenarios, which leads to different combinations of outcomes (flood structural scenarios) and their resulting inundation depths.
As part of the impact calculation, the damages due to inundation are estimated using three metrics: the expected damage in US dollars, the estimated number of people affected, and the cost of new constructions and repair. The first two metrics are calculated in a similar manner, based on the inundation depth of each of the drainage basins. To increase accuracy, the drainage basins are divided into elevation contours. Focusing on the expected number of people affected, the inhabitants of one area (defined by the basin and elevation contour) are considered to be affected when inundation is more than 10 cm. This is summed for each elevation contour [1, 2, ..., n] and drainage basin [1, 2, ..., m] and weighted by the probability of each flood structure scenario [1, 2, ..., s]. This results in the expected number of people affected for one flood simulation (see Eq. 2):
where Np is the expected number of people affected, Nc(hf) is the expected number of people affected in one elevation contour (-), hf is the flood inundation in one contour in meters (m), and Ps is the probability of the scenario (–). Following the same principle, the economic damage is calculated. Here we include not only elevation contour but also land use type. The damage per contour is calculated by summing the expected damage per land use type, which follows from the inundation depth through a damage curve. This type of curve shows the expected portion of value damaged by a certain inundation (van Berchum et al., 2018b).
The third performance metric is the expected cost of new constructions and repair. This depends on the choice of measure and the scenario (which measures fail and require repair). Construction cost depends on the length and height of a structural measure. The length of a measure cannot be changed as a measure is placed on a predefined border between land and water. Besides these constant costs, some costs depend on the chosen structure height, such as material and manpower. When a structure fails, it is assumed that it will be repaired up to its original value. Maintenance cost is currently not taken into account.
2.1.2 Risk profile assembly
The performance of a flood risk reduction strategy cannot be based on a single flood event scenario. Therefore, multiple scenarios are combined to build a more representative risk profile. Here, risk is defined as a combination of scenarios that can affect you, each of which has a probability of occurrence and a potential consequence (Kaplan and Garrick, 1981). When modeling, it is impossible to look at all possible scenarios. Therefore, a number of simulations is numerically integrated to represent the entire risk profile. For each individual scenario, the impact is weighted by its probability, which depends on the return period of the incoming flood hazard (and the correlation between hazards if there are multiple). By varying the intensity and return period of the incoming hazards, the risk profile shows how the city and the implemented measures perform under different circumstances.
The development of a risk profile is complicated by compound flooding, where both extreme rainfall and coastal storm surge are threatening the city. This influences the performance of some measures. For example, the efficiency of a drainage system, which drains to outside water, can decrease when outside water levels are raised due to storm surge. Several different combinations are simulated, resulting in a risk profile that depends on two variables – the probability of occurrence of the rainfall and storm surge. For each flood hazard, five different storm intensities are used, which means that 25 simulations are needed for one risk calculation. An example, based on the case study, can be seen in Fig. 7.
A common problem of risk analysis of compound flood events is correlation between the flood hazards (Wahl et al., 2015). Several types of large storms, such as cyclones, generally lead to both storm surge and rainfall. Considering the hazards separately and independently would be underestimating the potential risk. Although complicated, correlation can be estimated based on historical data and expert judgment. In many countries, these data are not or only sparsely available. In FLORES, the same flood hazard combinations (e.g., a 10-year storm surge and a 100-year rainfall event) are simulated, regardless of correlation. However, each combination will have a different probability, also depending on the correlation. This correlation value can be adjusted in the model.
2.1.3 Screening flood risk reduction strategies
FLORES can quickly assess how a flood risk reduction strategy affects the risk profile. Subsequently, it is also possible to look at many different strategies, covering the entire design space of different combinations of measures (and elevation of measures, if applicable) under different scenarios. This leads to a huge number of data available for analysis, which will be processed using the Exploratory Modelling and Analysis (EMA) workbench (Kwakkel, 2017). This Python-based toolset runs common analysis and optimization algorithms to visualize and support decision making and planning (e.g., feature scoring, scenario discovery). It has been used in several research fields in the past (Rostampour et al., 2019; Ciullo et al., 2019a). FLORES uses these tools to visualize screening results, prioritize measures, and search for trade-off and trends.
2.2 Model data usage
FLORES is intended to be applicable to flood-prone cities worldwide. Therefore, it should work based on easily accessible data sources. Examples are global elevation maps (often GIS-based digital elevation models, DEMs) or reports containing global estimates of damage curves. As many of the most vulnerable cities are located in developing countries which often lack detailed datasets, FLORES should run with only minimal need for detailed local data. Therefore, open-source datasets can be used for most of the required data, such as elevation, population density, damage curves, hazard data, and future scenarios. However, for some types of data, local information is necessary, for example information on the local hydrology (e.g., drainage system, sewerage), considered measures, and the structural exposure. If for these inputs no data are available, they can also be based on qualitative assessment in cooperation with local authorities or organizations. However, this does affect the results and their accuracy, which should be taken into account. A list of required input and their minimum requirements can be found in Table 1.
Table 1Minimum requirements for FLORES data sources.
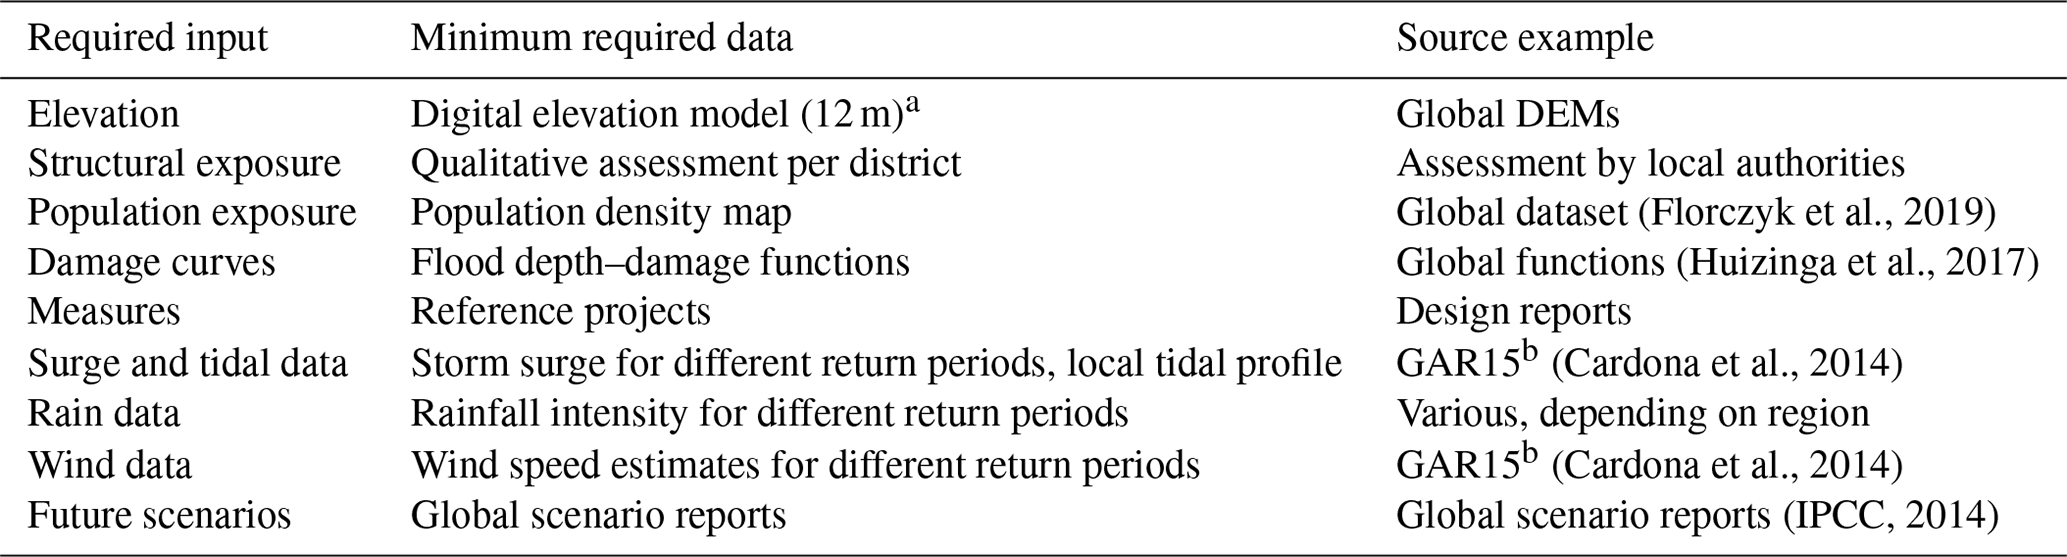
a This is based on earlier model runs. In future research, we hope to show that global open-source DEMs (∼30 m resolution) can also be used. b GAR15 is the Global Assessment Report on Disaster Risk Reduction 2015.
3.1 Background
To demonstrate the capabilities of FLORES, we use it to analyze flood risk in the coastal city of Beira, Mozambique. Beira is one of the largest cities of Mozambique, with more than 600 000 inhabitants. It is also home to an important port, connecting an extensive hinterland – which includes Zimbabwe – with the Indian Ocean. In the past, Beira has been subjected to large-scale flood events, resulting from both coastal storm surges and extreme rainfall events. Most notably, the city was at the center of global attention when Tropical Cyclone Idai made landfall only a few kilometers from the center of Beira in March 2019. The cyclone continued through Mozambique, affecting about 1.85 million people and causing roughly USD 700 million dollars in damage (IOM, 2019). Extreme rainfall inundated the lower parts of the city, mostly occupied by informal settlements.
Beira's flood vulnerability was recognized long before Idai. Rainfall events have been causing large-scale floods of lower-lying areas on a nearly yearly basis. At the coast, beaches are eroding quickly due to degrading of the groynes and poor coastal management. Several studies have analyzed the problems and suggested a number of possible measures and strategies to reduce flood risk (Arcadis, 1999; Deltares et al., 2013; CES and Lackner, 2013). Some of the suggested strategies have been implemented, most notably a large-scale rehabilitation of a part of the drainage system, financed by the Mozambique government through the IDA.
Flood risk in the city is still considerable and growing due to urban expansion and climate change. The process of developing a flood risk reduction strategy is complicated by a number of factors. Many different hydrological processes and interventions are interacting. For example, the city is threatened by both storm surge and rainfall, and many of the possible actions will interact with each other and the hazards. Moreover, future development of the city is highly uncertain. Beyond the complexity of the system itself, the analysis is further complicated by lack of data and the need for multiobjective evaluation.
3.2 Model setup
3.2.1 Input data
For each type of information, the most detailed yet easily obtainable data source is used. The data sources used in this case study are listed in Table 2. Regarding the elevation data, this lidar DEM dataset has been developed as a part of an earlier project financed by the World Bank aiming to enhance local research. The DEM was calibrated with locally used elevation units (meter above chart datum, m + CD, which is equal to the lowest astronomical tide).
For damage estimates, the structural exposure is combined with damage curves. Huizinga et al. (2017) provide maximum damage estimates for all countries and flood depth–damage curves per continent for different land use types. As the number of land use types with a damage curve in Africa is limited to three (residential, industrial, agricultural), the structural exposure will be divided into these three groups as well.
Table 2Data sources for the FLORES model in Beira.
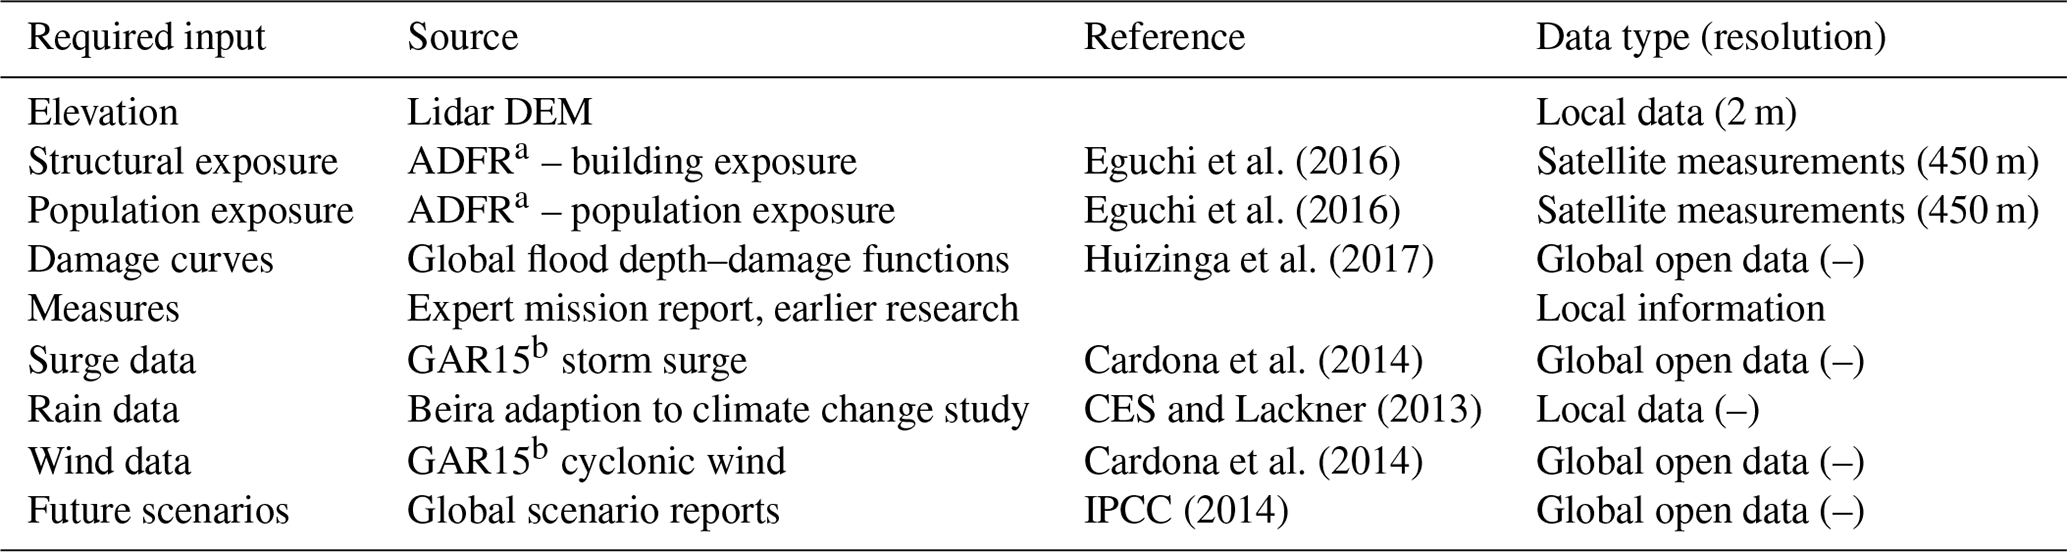
a ADFR is the Africa Disaster Risk Financing initiative. b GAR15 is the Global Assessment Report on Disaster Risk Reduction 2015.
3.2.2 Compound flood hazard setup
The hydraulic boundary conditions are based on extreme-value analyses of coastal storm surge and extreme rainfall events. Input for the model is the return period of both types of flood hazards. A coastal storm surge is simulated as a time series of water levels at the coast, also taking tide into account (see Fig. 3). Rainfall is simulated as a constant inflow for duration of the storm. For events where both hazards are occurring, the joint probability is important. For this particular case, an initial analysis using ERA-Interim (Dee et al., 2011) suggests independence between coastal storm surge and extreme rainfall, which was therefore also used for this screening. Future analysis should examine whether this assumption is valid for extreme cases. The hydraulic boundary conditions for several return periods are shown in Table 3. Two climate change scenarios are taken into account, which will affect the boundary conditions by increasing the surge level and rain intensity.

Figure 3Example time series of coastal storm surge event. Orange: run up due to storm surge; blue: elevation of tide; green: total elevation of tide plus surge.
Table 3Hydraulic boundary conditions for FLORES application in Beira. Note that the maximum surge level is calculated above the still-water level. Other factors like the tide (3.4 m amplitude) and the mean sea level (3.6 m + CD) should also be taken into account. The FLORES model will assume a storm duration of 24 h.

3.2.3 Flood risk reduction measures
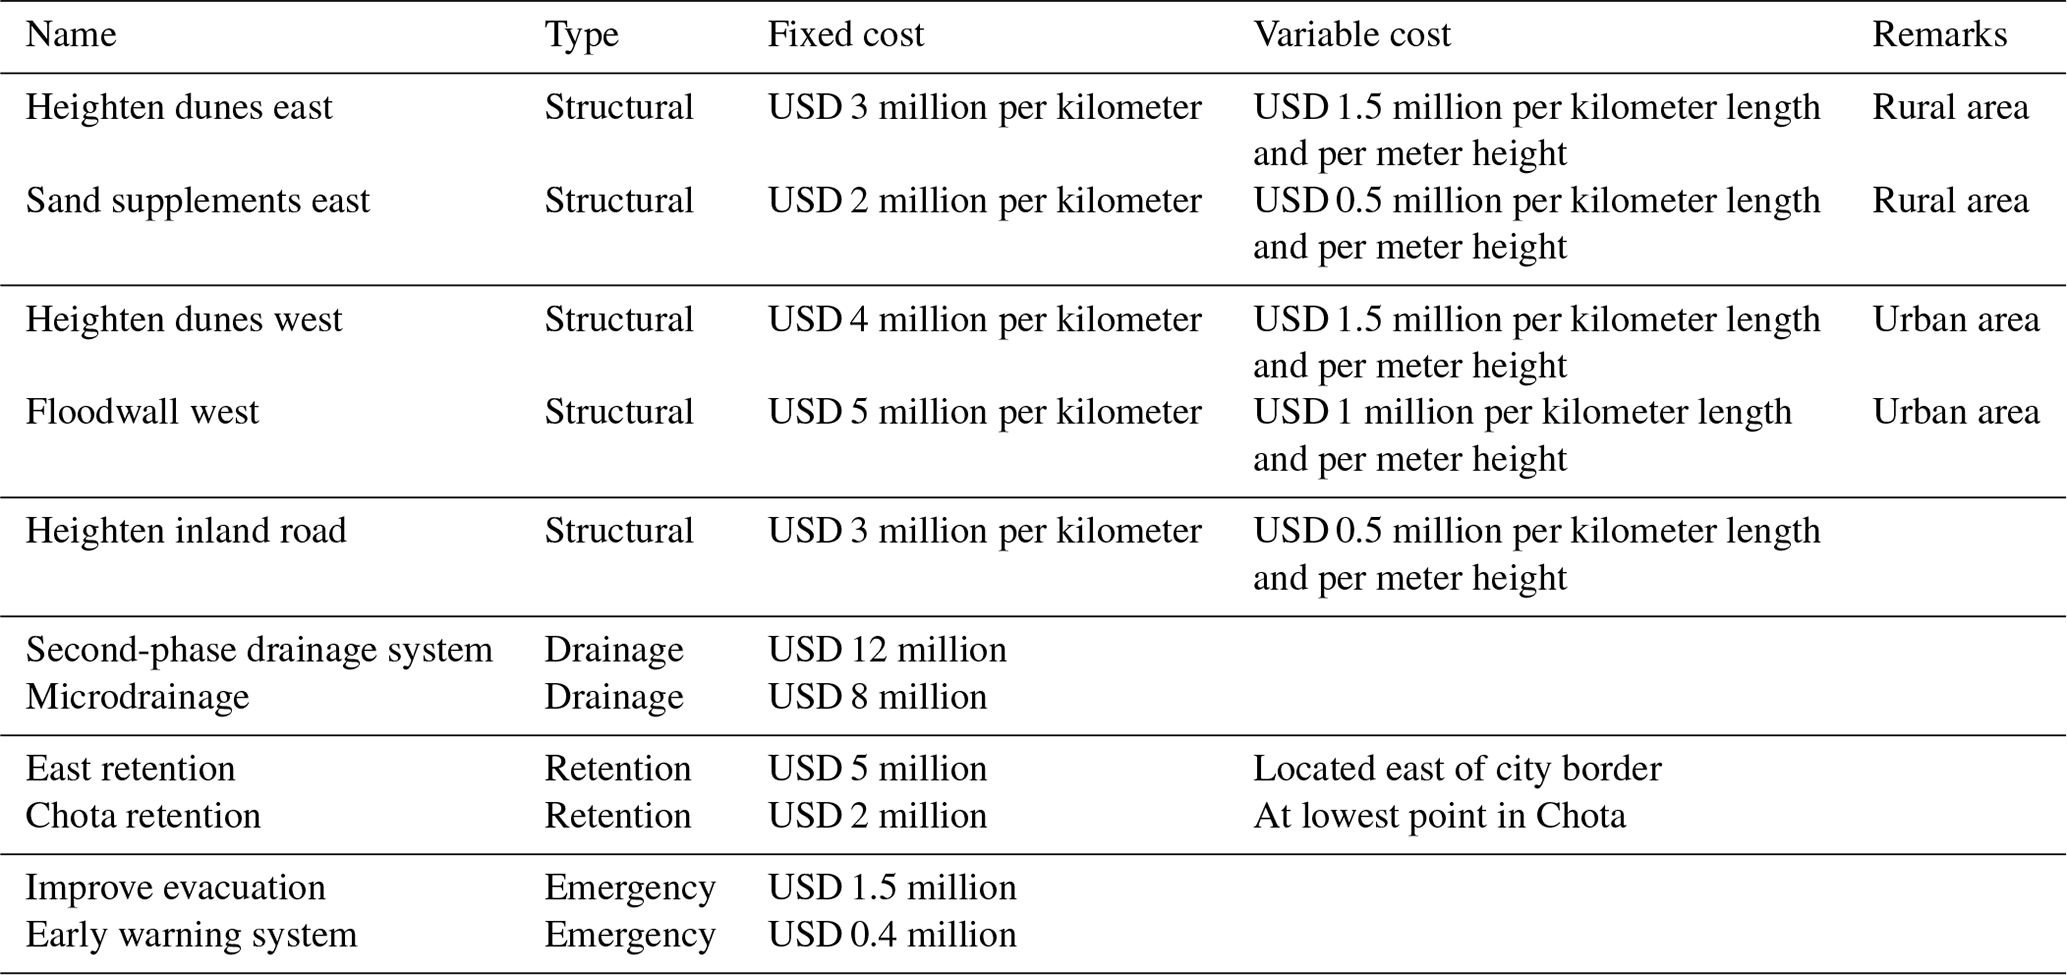
We consider various measures for improving flood risk management in Beira, including measures considered by the local government, measures suggested by local stakeholders, and measures explored in scoping studies (Deltares et al., 2013; Letitre et al., 2018). The set of measures showcases the different types of measures that can be considered with FLORES, including structural flood defenses, drainage systems, retention basins, and nonstructural emergency measures. Note that a part of the overgrown drainage system has already been rehabilitated through widening of the canals and addition of a retention basin and a coastal inlet structure. A map of Beira with some of the measures is shown in Fig. 4. A complete list of all measures used in this case study can be found in the appendix.
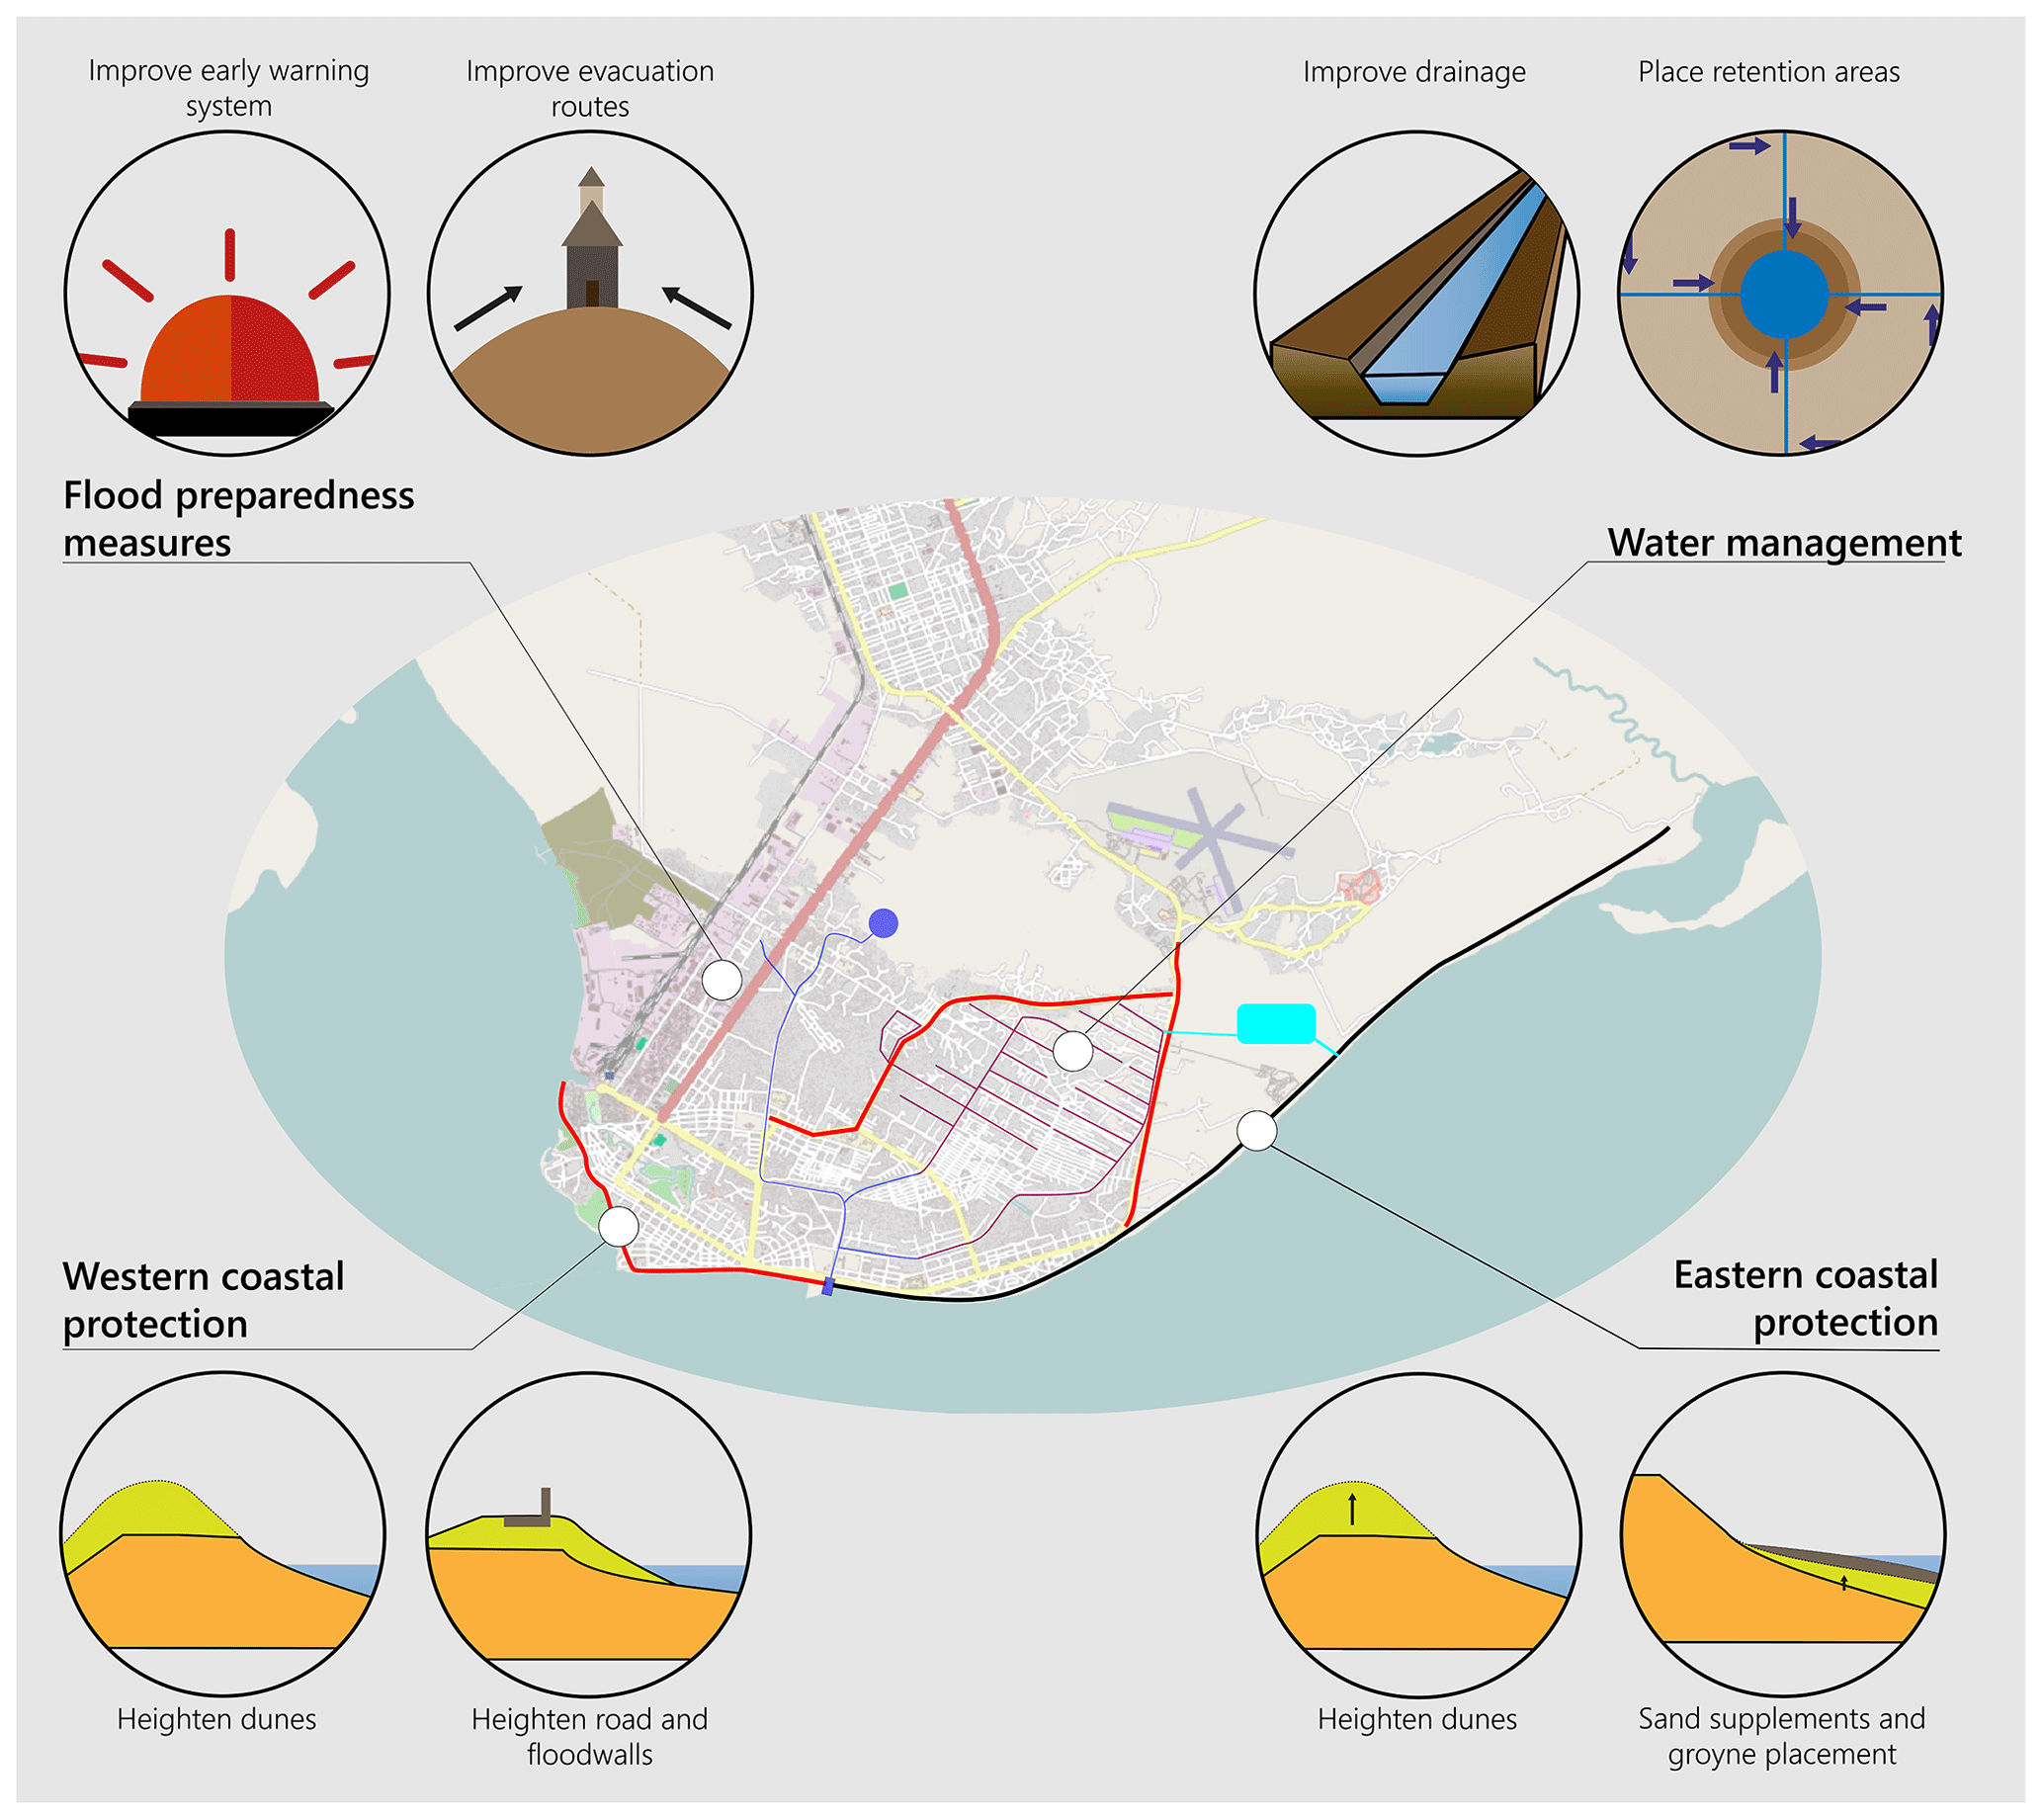
Figure 4Map of Beira, Mozambique. Denoted are a few examples of flood risk reduction measures. Background image: © OpenStreetMap contributors 2018. Distributed under a Creative Commons BY SA license.
3.3 Model evaluation
Limited data for evaluating the accuracy of the flood simulations are available. Cyclone Idai provided some insight into one situation, with verifiable data and known hydraulic conditions. During other extreme events, however, no detailed measurements were taken. Only few detailed flood simulations have been conducted (CES and Lackner, 2013). As a part of the design of the drainage system, which was completed in 2018, a 10-year rainfall event was simulated. This simulation is compared with a FLORES flood simulation (Fig. 5). FLORES predicts lower flood levels in lower areas of the city, especially in areas with steep slopes. Other than this comparison, some benchmark tests were available to test the accuracy of the flood simulation. For example, storm surge events up to the 5-year storm surge hardly affect the city, and larger storm surges affect areas known for their relatively weak flood defenses and storage capacity (southeastern part of Beira).
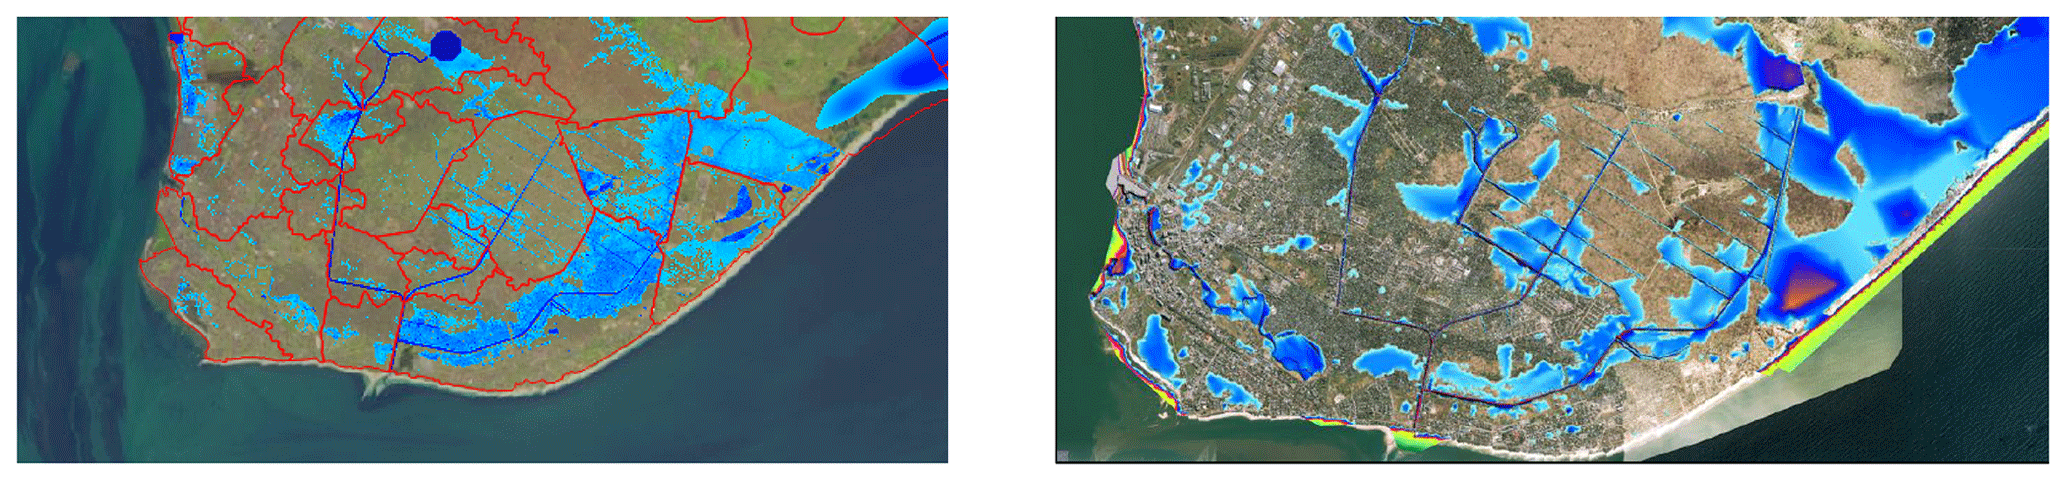
Figure 5Flood extent resulting from a 10-year rainfall event for FLORES (left) and an ANUGA simulation, which was part of the Rio Chiveve feasibility study. Background image: Sentinel-2 (© ESA).
3.4 Results
FLORES is used to analyze the current situation as well as potential future situations and strategies for the city of Beira. First, we examine the current risk profile of Beira without any new measures in place as a benchmark. Next, we quantify the effects of different possible flood risk reduction strategies under different potential future scenarios in Sect. 3.4.2. Their effectiveness is evaluated based on their ability to decrease flood risk compared to the current situation. With FLORES, we analyzed 500 strategies, consisting of random combinations of flood risk reduction measures. For structural measures, a random crest elevation is also chosen. These 500 strategies were evaluated for two future climate change scenarios. The run time was roughly 10 h for the entire screening on a single computer with an 8-core (3.2 GHz) processor using parallelization.
3.4.1 Current risk profile
Looking closer at the hydrological situation in Beira, a number of phenomena stand out. First, the city has a large lower-lying area, which does not have a natural connection to open water. Not surprisingly, the most common cause of flooding is extreme rainfall, as also shown in historical reports and flood simulations. The lower parts of the city experience flooding on an almost yearly basis, although this has decreased due to the new drainage system (see Fig. 6, left). For more severe rainfall events, the entire city is affected (see Fig. 6, middle). Between these two simulations, the percentage of people affected has grown from 6 % to 21 %. Only the city center, located on higher ground in the southwest, is able to drain effectively towards the Rio Chiveve and the drainage system. When coastal storm surge occurs in combination with a 10-year rainfall event, the impact is amplified strongly (see Fig. 6, right). Here, even areas that are not directly affected by the storm surge are flooded due to the reduced effectiveness of the drainage system. As a result, damages due to compound flooding are more than the sum of damages of the individual flood hazards. Please note that this does not have to hold true for all cases. More extreme storm surge or rainfall events (100-year return period) can damage most of the city, and an added hazard leads to little added damage.
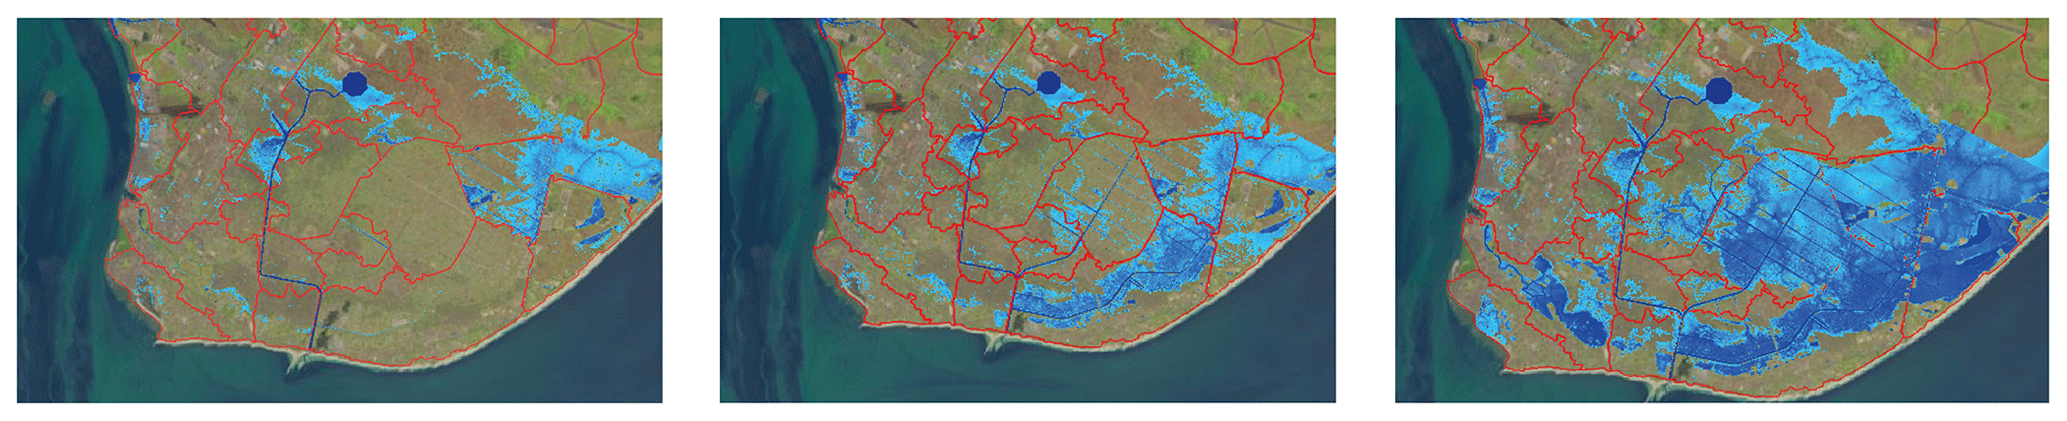
Figure 6Flood map for a 2-year rainfall event (left), 10-year rainfall event (middle), and a 10-year rainfall event plus a 10-year coastal surge event (right). Background image: Sentinel-2 (© ESA).
Historically, coastal storm surge is most problematic when resulting from a tropical cyclone. These situations do not occur regularly, which is why the effects of coastal storm surge only become significant for more extreme events. The model results also show little damage for up to a 5-year storm surge (see Fig. 7). Smaller storms create coastal surges up to 0.5 m, which are insignificant compared to the tidal range, which can grow up to 6–7 m. This also shows the importance of timing. For example, the 3.5 m storm surge from Cyclone Idai hit during neap tide, and damage due to coastal flooding was relatively small. In some scenarios compound flooding can occur, where the effects of coastal storm surge and extreme rainfall strengthen each other. In Beira, the capacity of the drainage system depends on outside water levels. Due to high water, there is a time window where no drainage is possible. This time window grows during a storm surge and is also growing due to sea level rise.
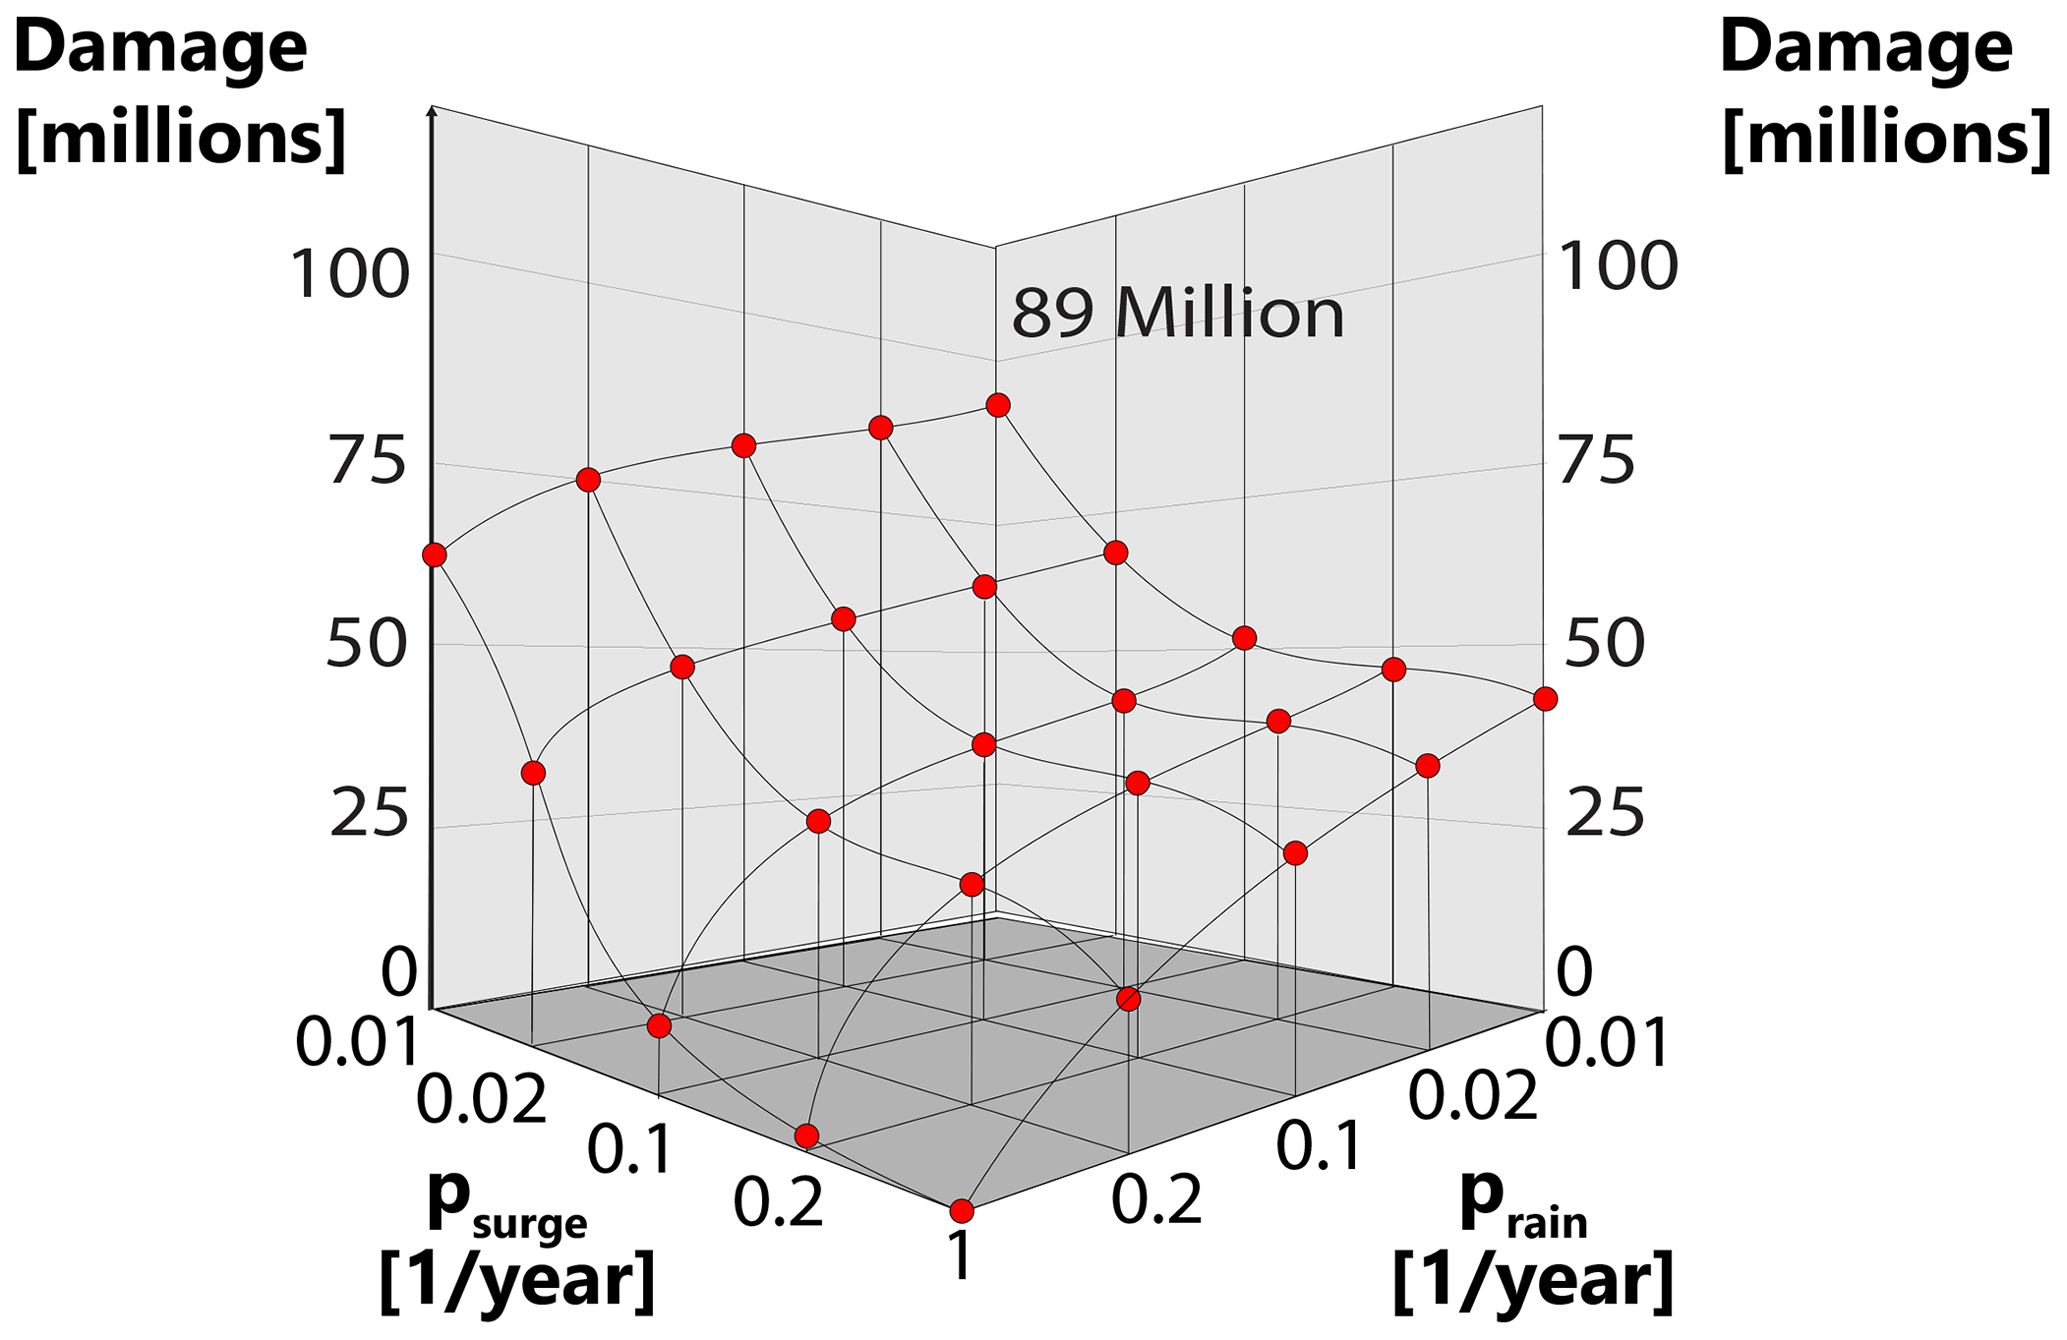
Figure 7Risk profile of the current situation in Beira, Mozambique. Shown is the expected damage of a compound flood event with a probability of occurrence of the storm surge (ps) and the rainfall (pr).
The risk profile of the current situation can be estimated based on simulations of multiple different storms. Both flood hazards – coastal storm surge and extreme rainfall – are represented by five intensities, based on their return period (0-, 5-, 10-, 50-, 100-year event). A 0-year event is used in the model to signify no storm surge or no rainfall. The resulting risk profile can be seen in Fig. 7. Integration of probabilities and consequences of events result in the expected annual damage (dollar yr−1), which in this case is roughly USD 16.5 million yr−1. Please note that the model can also use different future scenarios which will have a large effect on the expected annual damage.
3.4.2 Screening of flood risk reduction strategies
In order to assess the effectiveness of flood risk reduction strategies, their performance is compared with the current situation and with each other based on their risk profile. The screening of flood risk reduction measures is based on 500 randomly sampled strategies for two different future climate scenarios. Here, we show the results of several analyses of these data. Figure 8 shows how each strategy performs on their output parameters (risk reduction, reduction in number of people affected, and construction cost). Each dot represents one flood risk reduction strategy, and the two colors denote the climate scenarios.
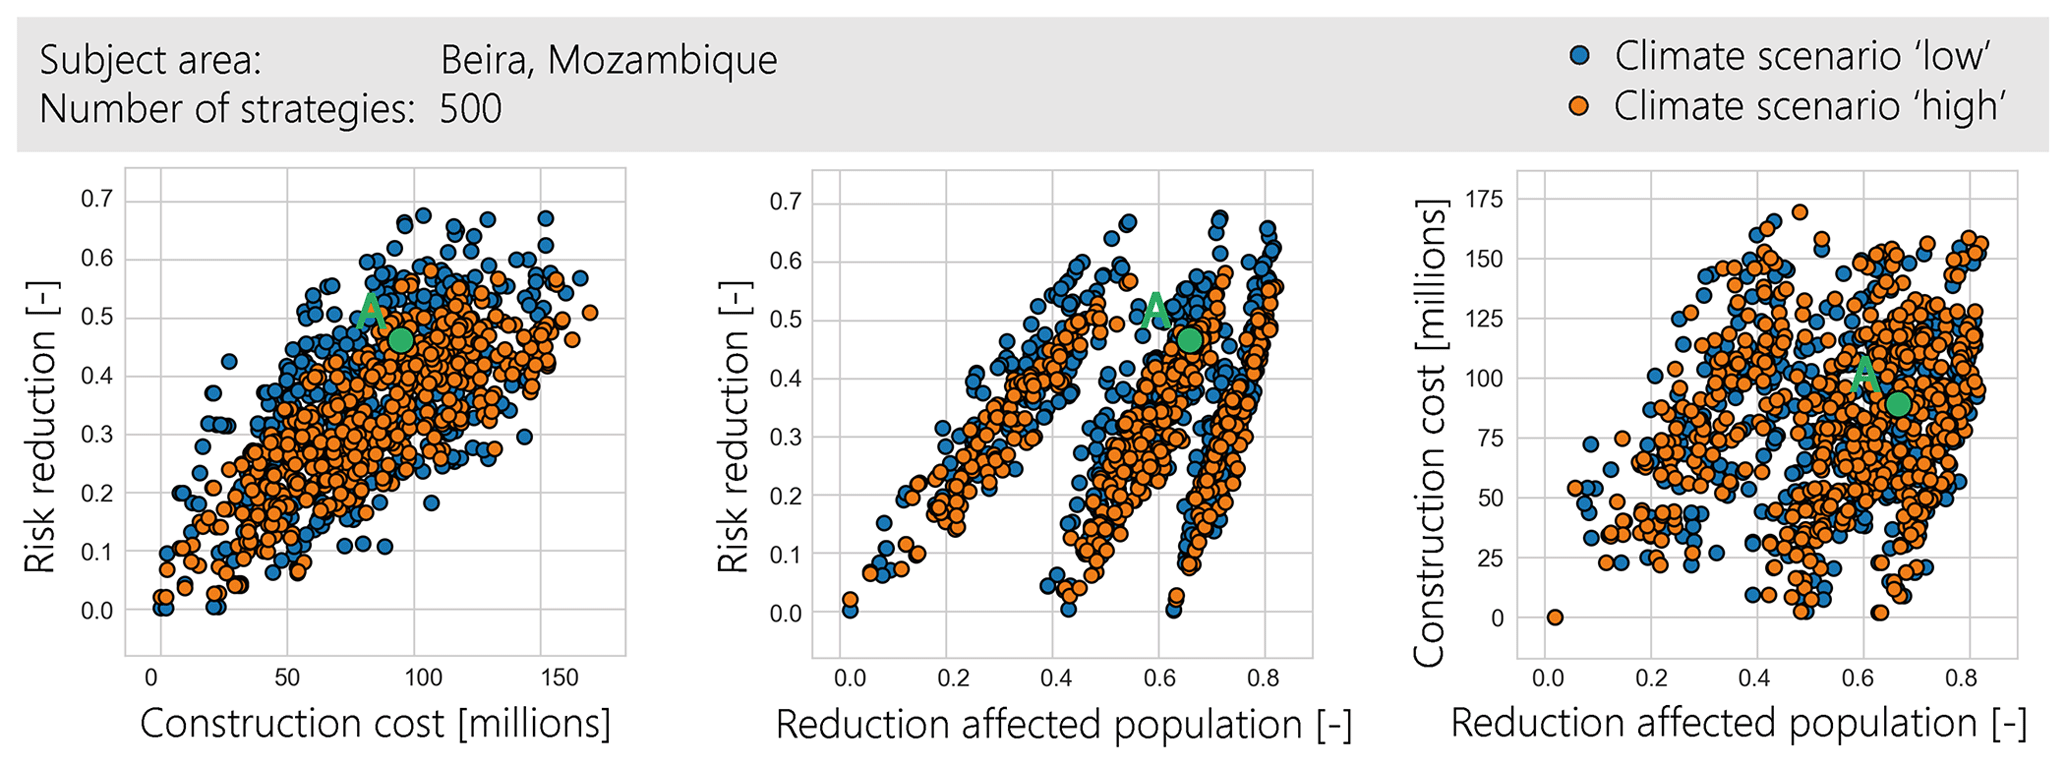
Figure 8Pair-wise plotting graphs for the Beira case study. Each dot represents one flood risk reduction strategy. Each strategy can be assessed by its risk reduction, reduction of affected population, and cost of construction. Here, those outcomes are plotted against each other. Different colors indicate two different future climate scenarios. A represents a strategy consisting of four measures: (1) dunes on the eastern coast (10.5 m + CD), (2) a flood wall on the southwestern coast (9 m + CD), (3) enhancement of the drainage system, and (4) enhanced evacuation of vulnerable neighborhoods.
Figure 8 shows a clear positive correlation between construction cost and risk reduction. However, individual strategies can deviate greatly from the trend, which indicates that some low-cost combinations can make a large difference. Moreover, these outliers are more prominent in a less extreme future climate scenario (blue dots in the figure), especially in the low-cost range. This indicates that some cheaper measures are relatively effective in moderate storm conditions but are quickly overpowered in more extreme situations. For Beira, this most likely points to the inland measures (improving the drainage system, adding retention areas), which are less costly than coastal measures and are most effective for small to moderate rainfall conditions.
Figure 9 quantifies the dependency of output variables on the input choices and uncertainties through a feature scoring analysis (Breiman, 2001; Jaxa-Rozen and Kwakkel, 2018). On the left, all potential measures are listed as well as the future climate change scenario. The numbers indicate how much the outcome variables (below the table) depend on the choice on the left. A higher number indicates a higher importance, where 0 means that the measure has no influence, and 1 indicates that the output is fully dependent on the choice for that input. The results underscore the importance of both coastal measures and inland measures, in particular further improvement of the drainage system. Increasing retention areas are relatively less effective. Simulations show that retention areas are effective only for smaller pluvial events but have insufficient capacity when a storm surge overpowers the coastal defenses and reduces the effectiveness of the drainage system (see Fig. 6). This effect is increased because the high outside water level during storm surge events prevents the drainage system from functioning. This is an example of how compound flood events lead to high damages by affecting hydrological processes in ways that are of less importance when considering individual hazards.
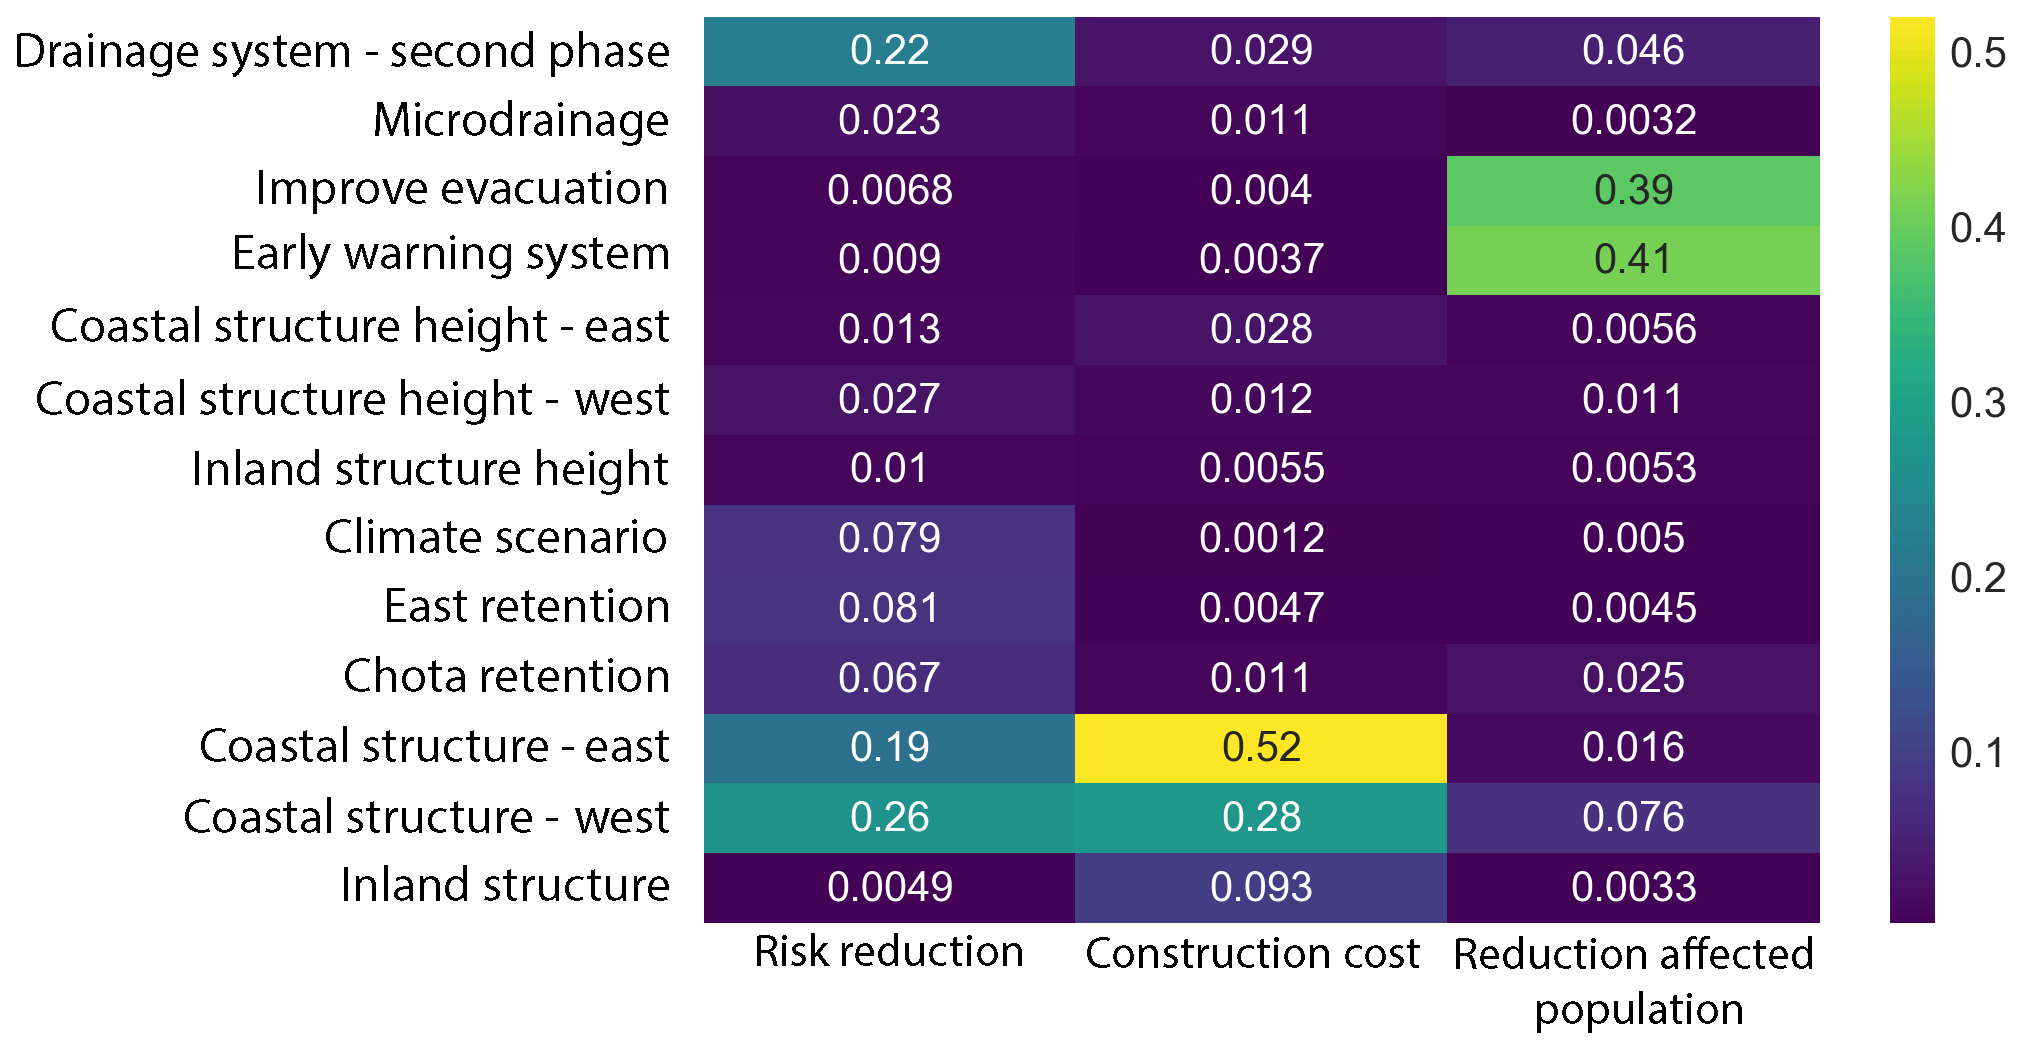
Figure 9Feature scoring analysis for the Beira case study. It shows the relative importance of the choice of measures and uncertainties (listed on the left) for the outcomes (below). Higher numbers indicate higher importance.
Finally, we identify promising combinations of options using scenario discovery (Bryant and Lempert, 2010; Kwakkel and Jaxa-Rozen, 2016) with the Patient Rule Induction Algorithm (PRIM; Friedman and Fisher, 1999). Specifically, we use scenario discovery to identify which combinations of design choices are most effective when pursuing a predetermined set of goals. A design choice can be the choice to use (or not to use) a particular measure, or a minimum or maximum build elevation. The aim is to find a combination of design choices that will maximize the chance of reaching a predetermined set of goals. PRIM calculates which are most effective and removes strategies out of the comparison that do not include this option. Finally, a number of strategies is left, of which many comply with the goals set in advance (see Table 4).
Table 4Results of PRIM analysis for the Beira case study. “Goals” shows what output we are looking for (i.e., minimum risk reduction, maximum budget). “Start” shows how many strategies out of the initial 500 comply with the goals, called strategies of interest. “Results” shows design choices that are made, focusing on these strategies of interest. “Final” indicates how many strategies are left after filtering for the design choices listed under “Results” and how many of those are still strategies of interest.
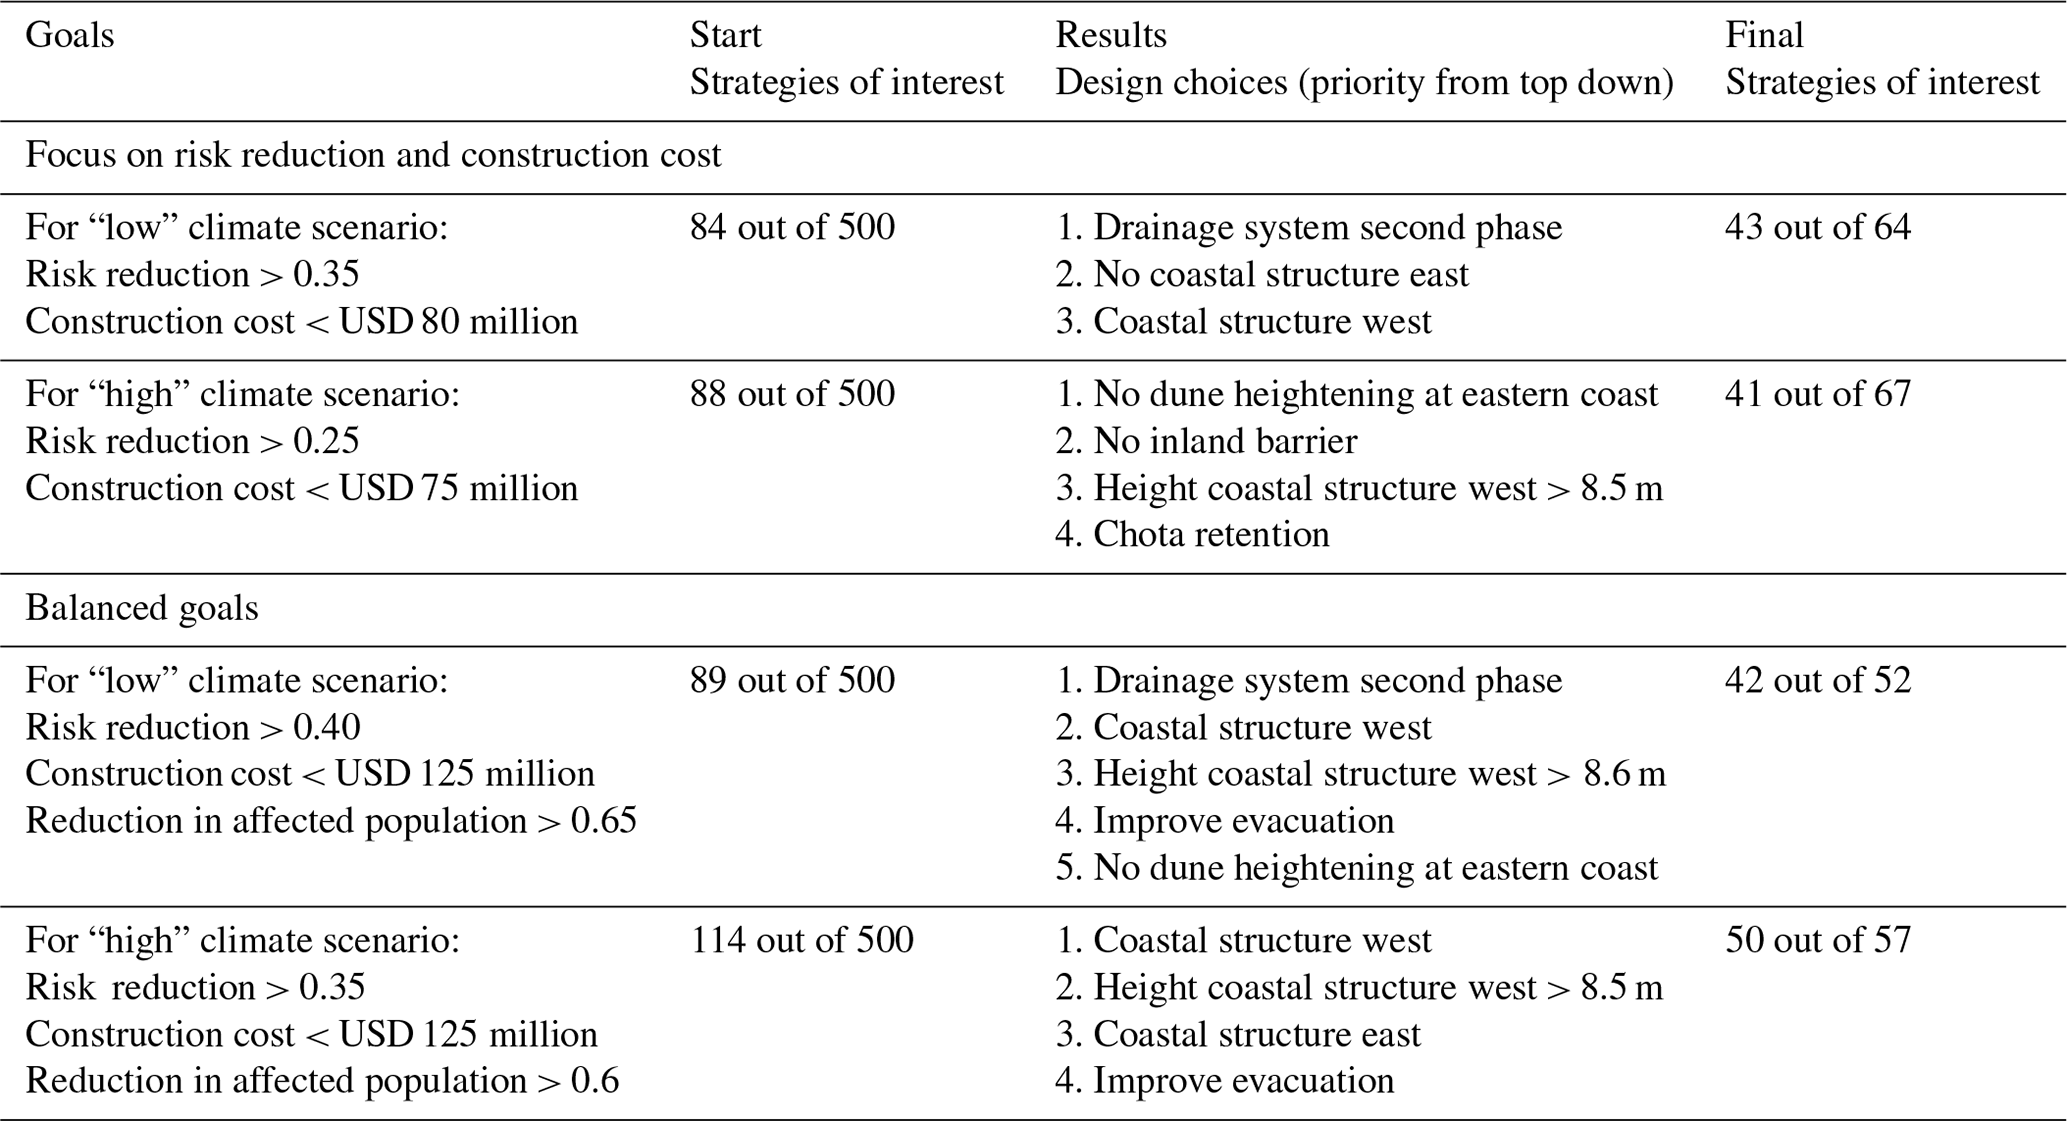
Table 4 highlights the importance of both coastal and inland design choices. Most of the strategies that reach the goals on both risk reduction and construction cost included an improved drainage system as well as coastal protection in the urban area at the southwestern side of Beira. When a less affected population was added as a goal, emergency measures such as evacuation were added because of their relatively low investment costs.
The aim of FLORES is to provide useful information in the early planning stages of flood risk management, when limited time and input data are available. Therefore, several limitations should be taken into account. Many physical processes are simplified. First, the simulation mainly revolves around solving the hydrological water balance for a defined number of drainage basins for every time step. Measures acting on a smaller scale are therefore hard to represent correctly. Second, storm surge is modeled as a time series of water levels during a storm, leading to inflow into coastal basins through overtopping or overflow. A coastal barrier can prevent this but could also fail. The moment of failure, as well as the portion of the barrier that fails when it does, is set beforehand. Sensitivity to these choices has not been investigated as part of this study but could be included by integrating fragility curves and breach models (Ciullo et al., 2019b). Third, the drainage system is simplified compared to common urban-drainage models (Butler and Davies, 2003). For example, water drainage between basins is limited by the downstream basin. Therefore, water cannot flow in the upstream direction, which would occur if the outside water level is especially high.
FLORES is under active further development. In earlier case studies, the coastal storm surge simulation and the resulting damage have been extensively evaluated (van Berchum et al., 2018a). However, lack of data prevents similar testing for Beira. Also, several model variables require further sensitivity analysis. For example, storms are simulated using a 6 min time step, which provided reasonable accuracy and computational speed in earlier case studies. However, this is not tested for compound flood simulations. Similar assessments are needed for other variables, such as the step-in elevation for the contours – which was 0.25 m – and the number of simulations required to construct a realistic risk curve. The optimal choice for these variables will mostly depend on the complexity and size of the project areas as well as the available input data. For this case study, a combination of publicly available and local data was used. In general, most required data are available publicly, with the exception of information about the measures, local hydrology, and structural exposure. Most crucial is the choice of DEM, which is available almost globally.
This paper presents the Flood Risk Reduction Evaluation and Screening (FLORES) model as a generic model for investigating compound flood risk and shows its application through a case study of Beira, Mozambique. The project area is schematized such that a single flood simulation only takes a few seconds, and calculating a complete risk profile can be done in a few minutes. This allows for the comparison of many different storms, flood risk reduction strategies, and future scenarios. Using basic hydraulic formulas, FLORES simulates the flood impact for cities with sufficient accuracy for comparing large-scale concepts of flood risk reduction strategies.
For the Beira case study, FLORES provided insight into the prioritization of measures and long-term effects. Both the drainage system and coastal protection were identified as crucial elements in an effective flood risk reduction strategy, which is in line with earlier reports (CES and Lackner, 2013; Deltares et al., 2013; Letitre et al., 2018). Effects of both coastal storm surge and extreme rainfall were taken into account, including storms where both hazards occurred simultaneously. This led to flood damages that exceeded the impact of simulating individual hazards. For example, coastal storm surge led to a long interval where drainage was not possible, greatly restricting the city's ability to withstand extreme rainfall. On the short term, the expansion of the current drainage system would provide the highest benefits in terms of reducing economic damage and number of people affected. On the longer term, especially in the case of higher-end climate change, the coastal system is expected to become the dominant factor in the flood risk management of Beira. These results have contributed to current efforts for planning for future events in Beira.
Further research should explore the impact of using global open DEMs compared to commercial or locally obtained DEMs, as used in Beira. For further development of FLORES, it is crucial to gather more information on the accuracy of the model compared to historic events as well as the correlation between different flood hazards. This is possible by formulating a new case study where more detailed information is available. This is also useful to demonstrate and expand the range of possible situations (e.g., cities threatened by river flooding, cities with large lakes). Other possible extensions focusing on social or environmental impact can be added in a later stage as well through additional performance metrics.
FLORES is developed to be easily transferred to other flood-prone cities. For the Beira case study, we used input data of varying resolution, including global open data sources. For other cities, these data are either available or easily obtainable, making the application of this model to a new case study relatively simple and a process that can easily be standardized. The goal of the model is to provide useful risk information early on in the flood risk management process, when information is often scarce, but important decisions need to be made. By screening the many potential flood risk reduction strategies and quantifying their impact with multiple parameters, decision makers can fall back on a range of useful risk information in their aim to develop an effective flood risk management plan.
Table A1Flood risk reduction measures used in the FLORES model for Beira, Mozambique. Cost estimates are based on local reference projects.
The FLORES model code, as well as the case study information for Beira, is open-source and available on GitHub (https://github.com/ErikBerch/FLORES-Beira, last access: 31 October 2019; ErikBerch, 2020).
Sentinel-2 data are freely available from the ESA/EC Copernicus Sentinels Scientific Data Hub at https://scihub.copernicus.eu/ (last access: 29 September 2019, Copernicus Open Access Hub, 2020).
ECvB developed the model and prepared the paper. All coauthors contributed to the development of the model's methodology and review of the paper. MvL contributed to the application of the model to the case study. JHK contributed to the model code.
The authors declare that they have no conflict of interest.
We would like to thank the World Bank in Washington, DC, for hosting us. This research was financed by the EU-funded Africa Disaster Risk Financing (ADRF) Initiative, managed by the Global Facility for Disaster Reduction and Recovery (GFDRR). The sole responsibility of this publication lies with the author. The European Union is not responsible for any use that may be made of the information contained therein.
This research has been supported by the European Union (grant no. P153188).
This paper was edited by Sven Fuchs and reviewed by Jay R. Lund and Philip Ward.
Arcadis: Integrated coastal zone management programme for Beira, Mozambique, Arnhem, the Netherlands, 1999.
Breiman, L.: Random forests, Mach. Learn., 45, 5–32, 2001.
Bryant, B. P. and Lempert, R. J.: Thinking inside the box: a participatory, computer-assisted approach to scenario discovery, Technol. Forecast. Soc., 77, 34–49, 2010.
Butler, D. and Davies, J.: Urban drainage, Crc Press, 2003.
Cardona, O., Bernal, G., Ordaz, M., Salgado, M., Singh, S., Mora, M., and Villegas, C.: Update on the Probabilistic Modelling of Natural Risks at Global Level: Global Risk Model, GAR15, (CIMNE & INGENIAR) UNISDR, Geneva, 2014.
CES and Lackner, I.: Adaptation to climate change in beira. rehabilitation, extension and operation of the urban storm water drainage system, Beira. (Technical report), Ministry of Public Works and Urban Settlement, Beira, Mozambique, 2013.
Ciullo, A., de Bruijn, K. M., Kwakkel, J. H., and Klijn, F.: Accounting for the uncertain effects of hydraulic interactions in optimising embankments heights: Proof of principle for the IJssel River, J. Flood Risk Manage., e12532, https://doi.org/10.1111/jfr3.12532, 2019.
Copernicus Open Access Hub: Welcome to the Copernicus Open Access Hub, available at: https://scihub.copernicus.eu/ (last access: 29 September 2019), 2020.
Custer, R.: Hierarchical Modelling of Flood Risk for Engineering Decision Analysis, Technical University of Denmark, Department of Civil Engineering, DTU Civil Engineering Report, No. R-319, PhD thesis, ISBN: 9788778774071, 2015.
Dee, D. P., Uppala, S., Simmons, A., Berrisford, P., Poli, P., Kobayashi, S., Andrae, U., Balmaseda, M., Balsamo, G., and Bauer, d. P.: The ERA-Interim reanalysis: Configuration and performance of the data assimilation system, Q. J. Roy. Meteorol. Soc., 137, 553–597, 2011.
Deltares, Witteveen+Bos, Wissing, Van den Broek Consulting, and Niras: Masterplan Beira Mozambique, Deltares, Delft, the Netherlands, 2013.
de Ruig, L. T., Barnard, P. L., Botzen, W. W., Grifman, P., Hart, J. F., de Moel, H., Sadrpour, N., and Aerts, J. C.: An economic evaluation of adaptation pathways in coastal mega cities: An illustration for Los Angeles, Sci. Total Environ., 678, 647–659, 2019.
Doocy, S., Daniels, A., Murray, S., and Kirsch, T. D.: The human impact of floods: a historical review of events 1980–2009 and systematic literature review, PLOS Currents Disasters, Edition 1, https://doi.org/10.1371/currents.dis.f4deb457904936b07c09daa98ee8171a, 2013.
Dupuits, E., Schweckendiek, T., and Kok, M.: Economic optimization of coastal flood defense systems, Reliab. Eng. Syst. Safe., 159, 143–152, 2017.
Eguchi, R. T., Huyck, C. K., Bevington, J. S., Eguchi, M. T., Esquivias, G., Huyck, M., Ghosh, S., Hu, Z., Chen, R. S., Levy, M., Pistolesi, L., Yetman, G., and Porter, K.: GFDRR Africal Disaster Risk Financing – Result Area 5. Exposure Development (Phase II). Final Report, GFDRR, World Bank Group (technical report), Washington, D.C., USA, 2016.
ErikBerch: FLORES-Beira, GitHub, available at: https://github.com/ErikBerch/FLORES-Beira (last access: 31 October 2019), 2020.
Florczyk, A., Corbane, C., Ehrlich, D., Freire, S., Kemper, T., Maffenini, L., Melchiorri, M., Pesaresi, M., Politis, P., and Schiavina, M.: GHSL Data Package 2019, Luxembourg, EUR, 29788, 2019.
Fraser, S., Jongman, B., Balog, S., Simpson, A., Saito, K., and Himmelfarb, A.: The making of a riskier future: How our decisions are shaping future disaster risk, Global Facility for Disaster Reduction and Recovery, 166 pp., 2016.
Friedman, J. H. and Fisher, N. I.: Bump hunting in high-dimensional data, Stat. Comput., 9, 123–143, 1999.
Gori, A., Lin, N., and Smith, J.: Assessing Compound Flooding From Landfalling Tropical Cyclones on the North Carolina Coast, Water Resour. Res., 56, e2019WR026788, https://doi.org/10.1029/2019WR026788, 2020.
Gouldby, B., Sayers, P., Mulet-Marti, J., Hassan, M., and Benwell, D.: A methodology for regional-scale flood risk assessment, Proceedings of the Institution of Civil Engineers-Water Management, 169–182, 2008.
Haasnoot, M., Van Deursen, W., Guillaume, J. H., Kwakkel, J. H., van Beek, E., and Middelkoop, H.: Fit for purpose? Building and evaluating a fast, integrated model for exploring water policy pathways, Environ. Modell. Softw., 60, 99–120, 2014.
Huizinga, J., de Moel, H., and Szewczyk, W.: Global flood depth-damage functions: Methodology and the database with guidelines, Joint Research Centre (Seville site), 2017.
IOM: Mozambique Cyclone Idai Response: Situation Report No.3 04-08 April 2019, International Organization for Migration, reliefweb.int, 2019.
IPCC: Climate change 2014: synthesis report. Contribution of Working Groups I, II and III to the fifth assessment report of the Intergovernmental Panel on Climate Change, IPCC, 2014.
Jamali, B., Löwe, R., Bach, P. M., Urich, C., Arnbjerg-Nielsen, K., and Deletic, A.: A rapid urban flood inundation and damage assessment model, J. Hydrol., 564, 1085–1098, 2018.
Jaxa-Rozen, M. and Kwakkel, J.: Tree-based ensemble methods for sensitivity analysis of environmental models: A performance comparison with Sobol and Morris techniques, Environ. Modell. Softw., 107, 245–266, 2018.
Kaplan, S. and Garrick, B. J.: On the quantitative definition of risk, Risk Anal., 1, 11–27, 1981.
Kind, J. M.: Economically efficient flood protection standards for the Netherlands, J. Flood Risk Manage., 7, 103–117, 2014.
Kovar, K. and Nachtnebel, H. P.: Application of geographic information systems in hydrology and water resources management, Int. Assoc. Hydrol. Sci., Publication 211, in: Proceedings of an International Conference, Vienna, Austria, 19–22 April 1993, IAHS Press, Wallingford, 693 pp., ISBN 0 947571 48 5, 1993.
Kwakkel, J. H. and Jaxa-Rozen, M.: Improving scenario discovery for handling heterogeneous uncertainties and multinomial classified outcomes, Environ. Modell. Softw., 79, 311–321, 2016.
Kwakkel, J. H.: The Exploratory Modeling Workbench: An open source toolkit for exploratory modeling, scenario discovery, and (multi-objective) robust decision making, Environ. Modell. Softw., 96, 239–250, 2017.
Letitre, P., Huthoff, F., Vroeg, H. D., and Berchum, E. V.: Scoping study at pre-feasibility level for Beira's long term coastal protection and flood preparedness, Netherlands Enterprise Agency (RVO), 2018.
Mechler, R. and Bouwer, L. M.: Understanding trends and projections of disaster losses and climate change: is vulnerability the missing link?, Clim. Change, 133, 23–35, 2015.
Paprotny, D., Vousdoukas, M.I., Morales-Nápoles, O., Jonkman, S. N., and Feyen, L.: Pan-European hydrodynamic models and their ability to identify compound floods, Nat Hazards, 101, 933–957, https://doi.org/10.1007/s11069-020-03902-3, 2020.
Pasquier, U., He, Y., Hooton, S., Goulden, M., and Hiscock, K. M.: An integrated 1D–2D hydraulic modelling approach to assess the sensitivity of a coastal region to compound flooding hazard under climate change, Nat. Hazards, 98, 915–937, 2019.
Rostampour, V., Jaxa-Rozen, M., Bloemendal, M., Kwakkel, J., and Keviczky, T.: Aquifer Thermal Energy Storage (ATES) smart grids: Large-scale seasonal energy storage as a distributed energy management solution, Appl. Energy, 242, 624–639, 2019.
Salman, A. M. and Li, Y.: Flood risk assessment, future trend modeling, and risk communication: a review of ongoing research, Nat. Hazards Rev., 19, 04018011, https://doi.org/10.1061/(ASCE)NH.1527-6996.0000294, 2018.
Sayers, P., Li, Y., Galloway, G., Penning-Rowsell, E., Shen, F., Wen, K., Chen, Y., and Le Quesne, T.: Flood Risk Management: A Strategic Approach, Paris, UNESCO, 2013.
Shen, J., Tong, Z., Zhu, J., Liu, X., and Yan, F.: A new rapid simplified model for urban rainstorm inundation with low data requirements, Water, 8, 512, https://doi.org/10.3390/w8110512, 2016.
USACE: Risk-based analysis for flood damage reduction studies, US Army Corps of Engineers, Engineer Manual 1110-2-1619, 1996.
van Berchum, E., Mobley, W., Jonkman, S., Timmermans, J., Kwakkel, J., and Brody, S.: Evaluation of flood risk reduction strategies through combinations of interventions, J. Flood Risk Manage., 12, e12506, https://doi.org/10.1111/jfr3.12506, 2018.
Van Dantzig, D.: Economic decision problems for flood prevention, Econometrica, J. Econom. Soc., 24, 276–287, 1956.
Vrijling, J., Van Hengel, W., and Houben, R.: Acceptable risk as a basis for design, Reliab. Eng. Syst. Safe., 59, 141-150, 1998.
Vuik, V., Jonkman, S. N., Borsje, B. W., and Suzuki, T.: Nature-based flood protection: the efficiency of vegetated foreshores for reducing wave loads on coastal dikes, Coast. Eng., 116, 42–56, 2016.
Wahl, T., Jain, S., Bender, J., Meyers, S. D., and Luther, M. E.: Increasing risk of compound flooding from storm surge and rainfall for major US cities, Nat. Clim. Change, 5, 1093–1097, 2015.
Zscheischler, J., Westra, S., Van Den Hurk, B. J., Seneviratne, S. I., Ward, P. J., Pitman, A., AghaKouchak, A., Bresch, D. N., Leonard, M., and Wahl, T.: Future climate risk from compound events, Nat. Clim. Change, 8, 469–477, 2018.