the Creative Commons Attribution 4.0 License.
the Creative Commons Attribution 4.0 License.
 | 29 Sep 2020
Assessment of the physical vulnerability of buildings affected by slow-moving landslides
Qin Chen
Lei Gui
Kunlong Yin
Dhruba Pikha Shrestha
Juan Du
Xuelian Cao
Physical vulnerability is a challenging and fundamental issue in landslide risk assessment. Previous studies mostly focus on generalized vulnerability assessment from landslides or other types of slope failures, such as debris flow and rockfall, while the long-term damage induced by slow-moving landslides is usually ignored. In this study, a method was proposed to construct physical vulnerability curves for masonry buildings by taking the Manjiapo landslide as an example. The landslide's force acting on the buildings' foundation is calculated by applying the landslide residual-thrust calculation method. Considering four rainfall scenarios, the buildings' physical responses to the thrust are simulated in terms of potential inclination by using Timoshenko's deep-beam theory. By assuming the landslide safety factor to be landslide intensity and inclination ratio to be vulnerability, a physical vulnerability curve is fitted and the relative function is constructed by applying a Weibull distribution function. To investigate the effects of buildings' parameters that influence vulnerabilities, the length, width, height, and foundation depth and Young's modulus of the foundation are analysed. The validation results on the case building show that the physical vulnerability function can give a good result in accordance with the investigation in the field. The results demonstrate that the building length, width, and foundation depth are the three most critical factors that affect the physical vulnerability value. Also, the result shows that the higher the ratio of length to width of the building, the more serious the damage to the building. Similarly, the shallower the foundation depth is, the more serious the damage will be. We hope that the established physical vulnerability curves can serve as tools for the quantitative risk assessment of slow-moving landslides.
- Article
(7656 KB) - Full-text XML
- BibTeX
- EndNote


Physical vulnerability is a fundamental and indispensable item in the risk definition presented by Varnes (1984). It can be defined as the degree of loss to a given element or set of elements within an area affected by a hazard (UNDRO, 1984). Physical vulnerability is measured on a continuous scale ranging from 0 (no loss) to 1 (total loss). For quantifying physical loss, such as the structural damage, the physical vulnerability of the elements at risk can be achieved by assessing the damage degree, resulting from the occurrence of a landslide of a given type and intensity (van Westen et al., 2006).
Recently, physical vulnerability has still been a challenge, and there has been a growing interest in quantifying risk due to natural hazards (van Westen et al., 2006). To quickly and easily analyse physical vulnerability, researchers have developed various types of tools or software such as HAZUS-MH (FEMA, 2003), RiskScape (King and Bell, 2005), ARMAGEDOM (Sedan et al., 2013), and CAPRA (https://ecapra.org/, last access: 10 August 2019). HAZUS-MH (FEMA, 2003) is considered to be the initially introduced and the most popularly applied software. RiskScape is a national-scale multi-hazard impact model in New Zealand, and ARMAGEDOM is a tool for seismic risk assessment that has three different precision levels (regional territorial scale, district scale, and the district scale with more detailed hazard description and physical vulnerability estimation). The majority of the software is employed to analyse the physical vulnerability of earthquakes or multi-hazards, and very little can be utilized for landslide hazard assessment. To solve this problem, Papathoma-Köhle et al. (2015) developed an integrated toolbox designed for buildings subjected to landslides.
In the past decades, researchers have worked on landslide physical vulnerability assessment techniques, which can be grouped into four main approaches as follows: expert judgement (Sterlacchini et al., 2007; Winter et al., 2014; Godfrey et al., 2015; Guillard-Gonçalves et al., 2016), statistical (Ciurean et al., 2013, 2017), mechanics-based (Luna et al., 2014; Liang and Xiong, 2019; Nicodemo et al., 2020), and integrated (Li et al., 2010; Uzielli et al., 2015b). The results of these approaches include matrices, indicators, and fragility or physical vulnerability curves or functions. For example, by utilizing the procedures motivated by the seismic risk analysis, Negulescu and Foerster (2010) introduced a simplified methodology to evaluate the mechanical performances of buildings subjected to landslide hazards. Also, Totschnig et al. (2011) presented physical vulnerability curves for debris flow and torrent hazards. Wu et al. (2011) constructed physical vulnerability curves for landslides by considering the landslides' impact energy and impact impulse as the intensity indicators. By utilizing FLO-2D (hydrologic and hydraulic modelling software of debris flow propagation), Luna et al. (2014) discussed the physical vulnerability functions of buildings at debris flow risk. Based on the physical vulnerability assessments proposed by Li et al. (2010), Uzielli et al. (2015b) modified the method by integrating the assessment of landslide intensity and building resilience. Papathoma-Köhle et al. (2015) related hazard intensity (debris flow depth) with the loss caused by building damage to buildings' physical vulnerability curves. Del Soldato et al. (2017) studied the empirical physical vulnerability curves for buildings by considering the debris flow depth, the flow velocity, and the impact pressure. Mavrouli et al. (2017) quantified the masonry buildings' damage induced by rockfalls by calculating the impact force of falling rocks on masonry buildings.
The slow-moving landslides are particular types of landslides with a slow velocity based on the classification provided by Cruden and Varnes (1996). Slow-moving landslides on the pre-existing sliding surfaces can cause differential settlement or tilt on structures. People are not usually endangered, but damage to buildings and infrastructures may be high (Douglas, 2007). Slow-moving landslides are observed worldwide in many countries, e.g. Italy (Cascini et al., 2008; Antronico et al., 2015; Uzielli et al., 2015a; Nicodemo et al., 2017; Borrelli et al., 2018; Ferlisi et al., 2019), Canada (Clifton et al., 1986; Brooker and Peck, 1993; Moore et al., 2006; Barlow, 2000), China (Chen et al., 2016; Zhang et al., 2018; Dong et al., 2018; Wang et al., 2018), the USA (Esser, 2000), and Australia (Jworchan et al., 2008).
Fell et al. (2008) suggested the estimation of the physical vulnerability of elements at risk for various landslide types. The slow-moving landslides may cause partial damage to buildings due to local displacement. The assessment methods for the physical vulnerability of slow-moving landslides are still limited. The aforementioned approaches are not very suitable since slow-moving landslides have different intensity indicators and different types of damage as compared to those from debris flows, rockfalls, or fast-moving landslides.
Performance analysis of buildings during the landslide and taking an inventory of the observed damage comprise a feasible methodology (Faella and Nigro, 2003). To investigate the physical vulnerability of the buildings impacted by landslides, numerous studies have been conducted regarding the acquisition of landslide deformation displacement or finding the statistical relation between the damage degree of buildings and landslide intensity (Mansour et al., 2011; Abdulwahid and Pradhan, 2017; Nicodemo et al., 2017; Peduto et al., 2017, 2018; Chen et al., 2016). For example, Mansour et al. (2011) investigated the relationship between the movement and the expected extent of damage to urban settlements. Based on the persistent scatterer interferometry, Lu et al. (2014) obtained the slow-moving landslide velocity for estimating buildings' economic risk with a total affected area of more than 800 km2. Ferlisi et al. (2015) reported that combining the differential interferometry (DInSAR) data and the results of supplementary damage surveys on the slow-moving landslides allowed for the preliminary generation of a (maximum velocity) cause–effect (damage) relation. Peduto et al. (2017) applied landslide deformation (cumulative surface displacement and differential settlement) as the input variables to construct the empirical fragility and physical vulnerability curves for buildings. By applying the horizontal strains and angular distortions to the numerical model, Infante et al. (2016) generated physical vulnerability for buildings. Nicodemo et al. (2020) employed the equivalent frame method to analyse the damage of a representative building in the case of a slow-moving landslide by numerical modelling. However, a detailed study on the physical vulnerability of buildings using mechanical analysis is not yet available.
This study proposes a method for assessing physical vulnerability from the perspective of mechanics and obtains its changes during the process of slow-moving landslides. We first calculate the thrust force of a landslide acting on the buildings' foundation and then analyse the buildings' physical response. Multi-scenarios were applied to help in constructing the physical vulnerability curves. After the validation by utilizing an application on a typical building impacted by slow-moving landslides, a sensitivity analysis was conducted on the parameters of the building and its foundation.
2.1 Force acting on the building foundation during the landslide process
To quantitatively evaluate the building's physical vulnerability during the landslide process, it is essential to calculate the force acting on the building's foundation. In this study, landslide residual-thrust force is calculated by employing the residual-thrust method, which is extensively applied in China for slope stability analysis (Nie et al., 2004). A slide mass is divided into different slices in this method, and a force analysis is performed on each slice. In this way, it is possible to easily obtain the thrust of a landslide by utilizing the arbitrary shape of the sliding surface including under complex loads. The landslide residual force can be calculated by applying Eqs. (1)–(6). In this method the groundwater seepage should be considered under rainy conditions, which can be performed using the SEEP/W code (GeoStudio). The physical vulnerability curve is estimated using a landslide safety factor to express the strength of the landslide. Landslides with smaller safety factors are more unstable, resulting in greater residual thrust on the building's foundation.
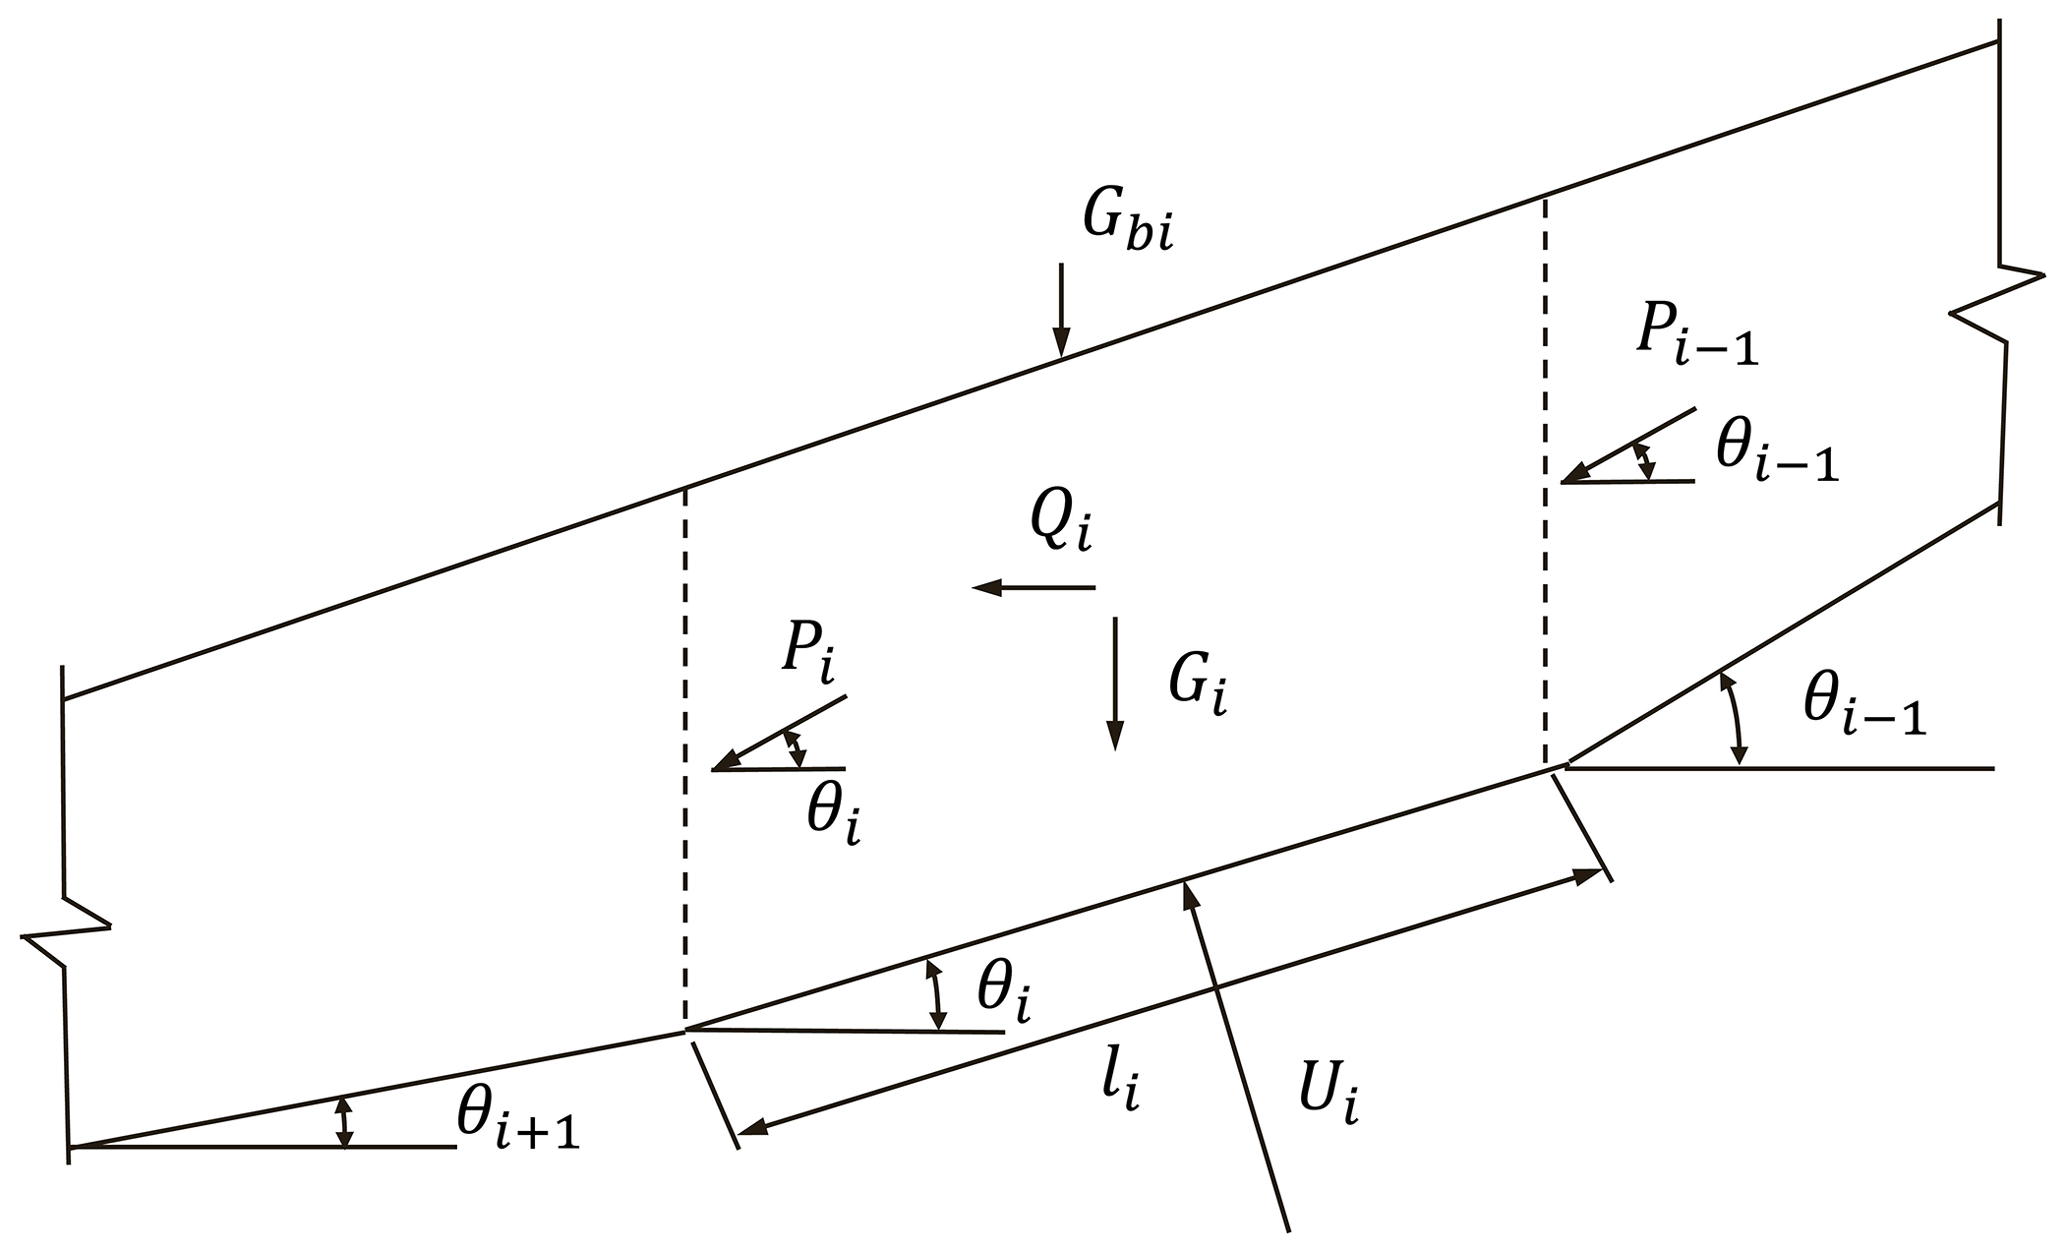
Figure 1Computing model of residual-thrust method with a broken-line slip surface (Ministry of Housing and Urban–Rural Development of PRC, 2013).
The safety factor of the landslide, Fs, is defined based on the Chinese code of Technical Code for Building Slope Engineering (GB 50330-2013) as follows:
For a single slice, the residual-thrust force of the ith slice is given as follows:
where Ri denotes the resistance force of the ith slice (kN m−1), Ti denotes the driving force of the ith slice (kN m−1), Pi denotes the residual thrust of the ith slice (kN m−1),ψi denotes the transmitting coefficient of the ith slice, Gi denotes the weight of the ith slice (kN m−1), Gbi denotes the accessional vertical load of the ith slice (kN m−1), θi denotes the angle between the sliding surface and horizontal plane of the ith slice, li denotes the length of the ith slice (m), ci denotes the cohesion of the ith slice (kPa), φi denotes the internal friction angle of the ith slice, Ui denotes the pore water pressure of the ith slice (kN m−1), Qi denotes the horizontal seismic force of the ith slice, and Fi denotes the horizontal component of landslide thrust (shown in Fig. 2).
The transformation of landslide residual-thrust force on buildings' foundations depends on the distribution of force. According to Chinese standards (China Railway Second Survey and Design Institute, 1983) and Dai (2002), landslide thrust distribution is approximately assumed to be a triangular, rectangular, or parabola shape, based on the type of sliding mass material. Each type of thrust distribution corresponds to a distribution function (Table 1).
Table 1Distribution functions of landslide thrust for various sliding mass materials of the landslide.

Note that F denotes the horizontal component of landslide residual thrust (Pi) in Eq. (3) and h denotes the vertical distance from the sliding surface to the ground surface (Fig. 2).
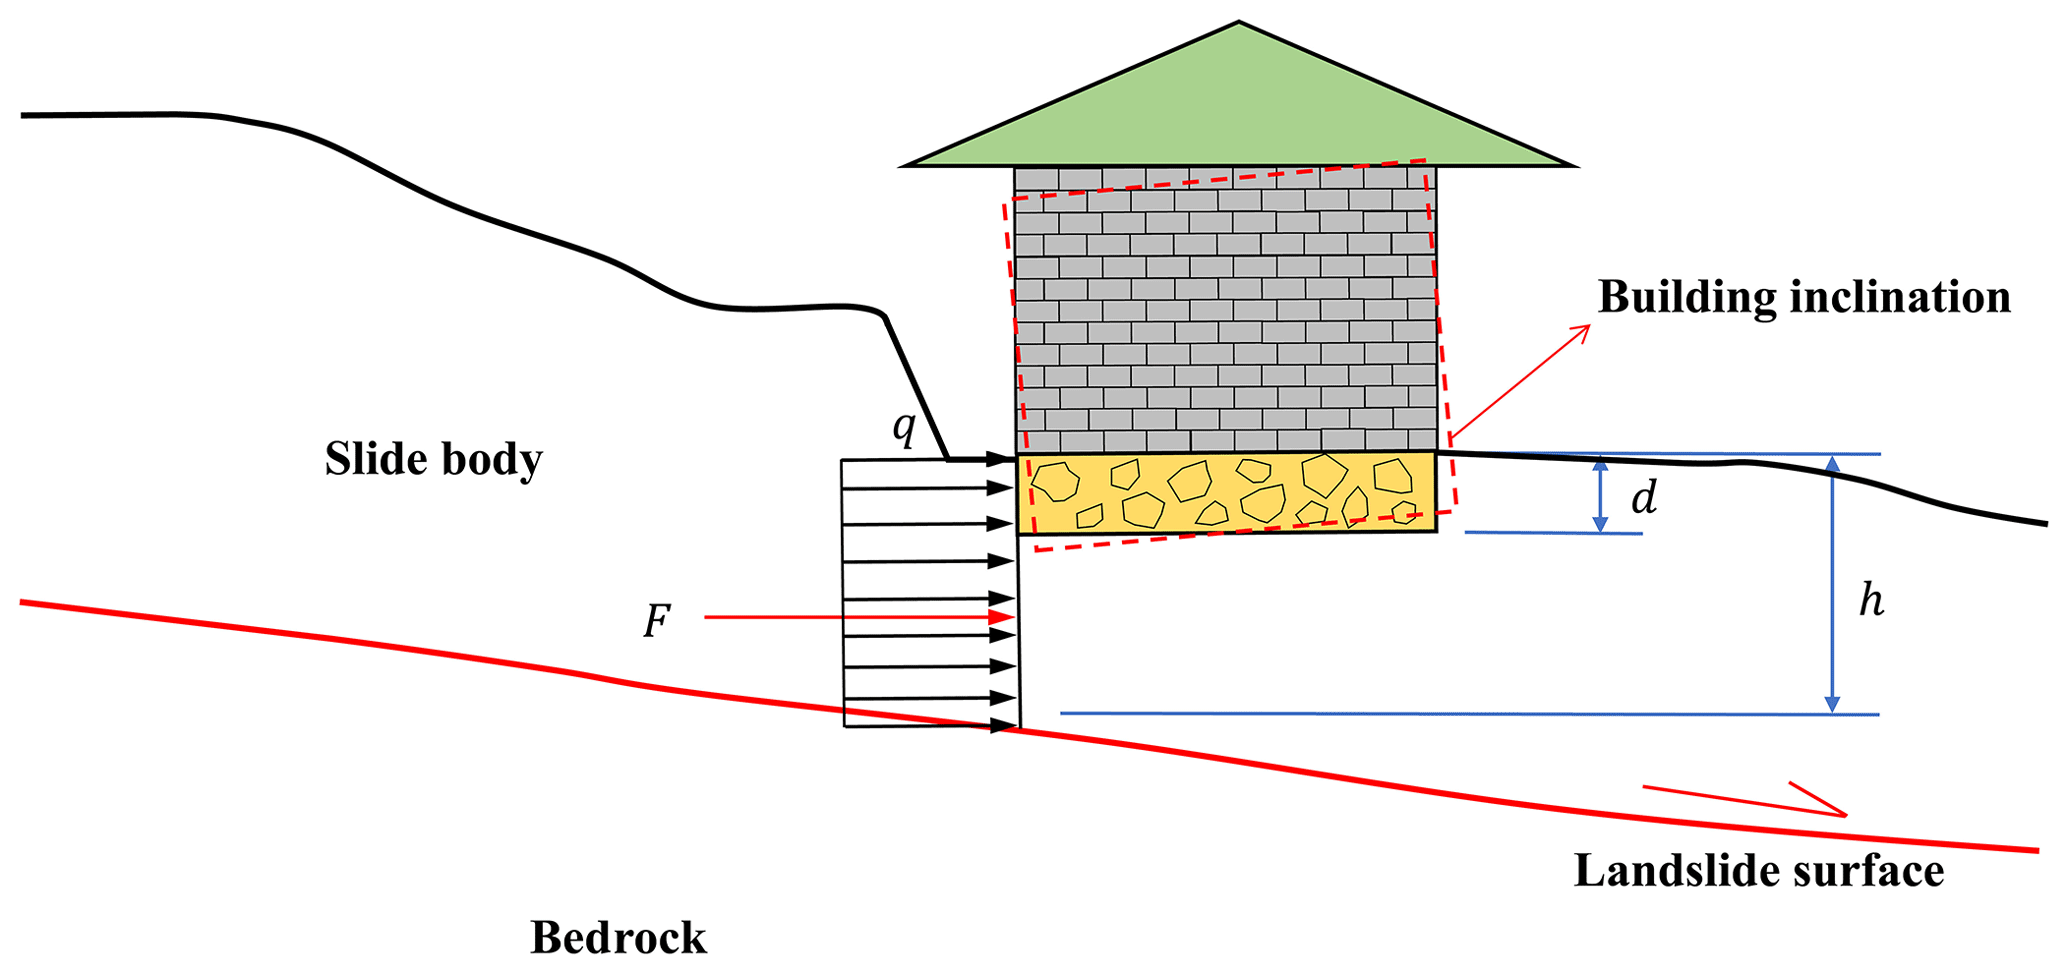
Figure 2A schematic diagram of landslide thrust action on a building. Note that h denotes the vertical distance from the sliding surface to the ground surface.
2.2 Physical response of buildings
2.2.1 Inclination of buildings
The foundation of the masonry building affected by the landslide thrust can be simplified as a beam (Fig. 3). It has been observed that real structures are normally very complicated, but the simplification of the beam helps in illustrating several important features (Burland and Wroth, 1974).
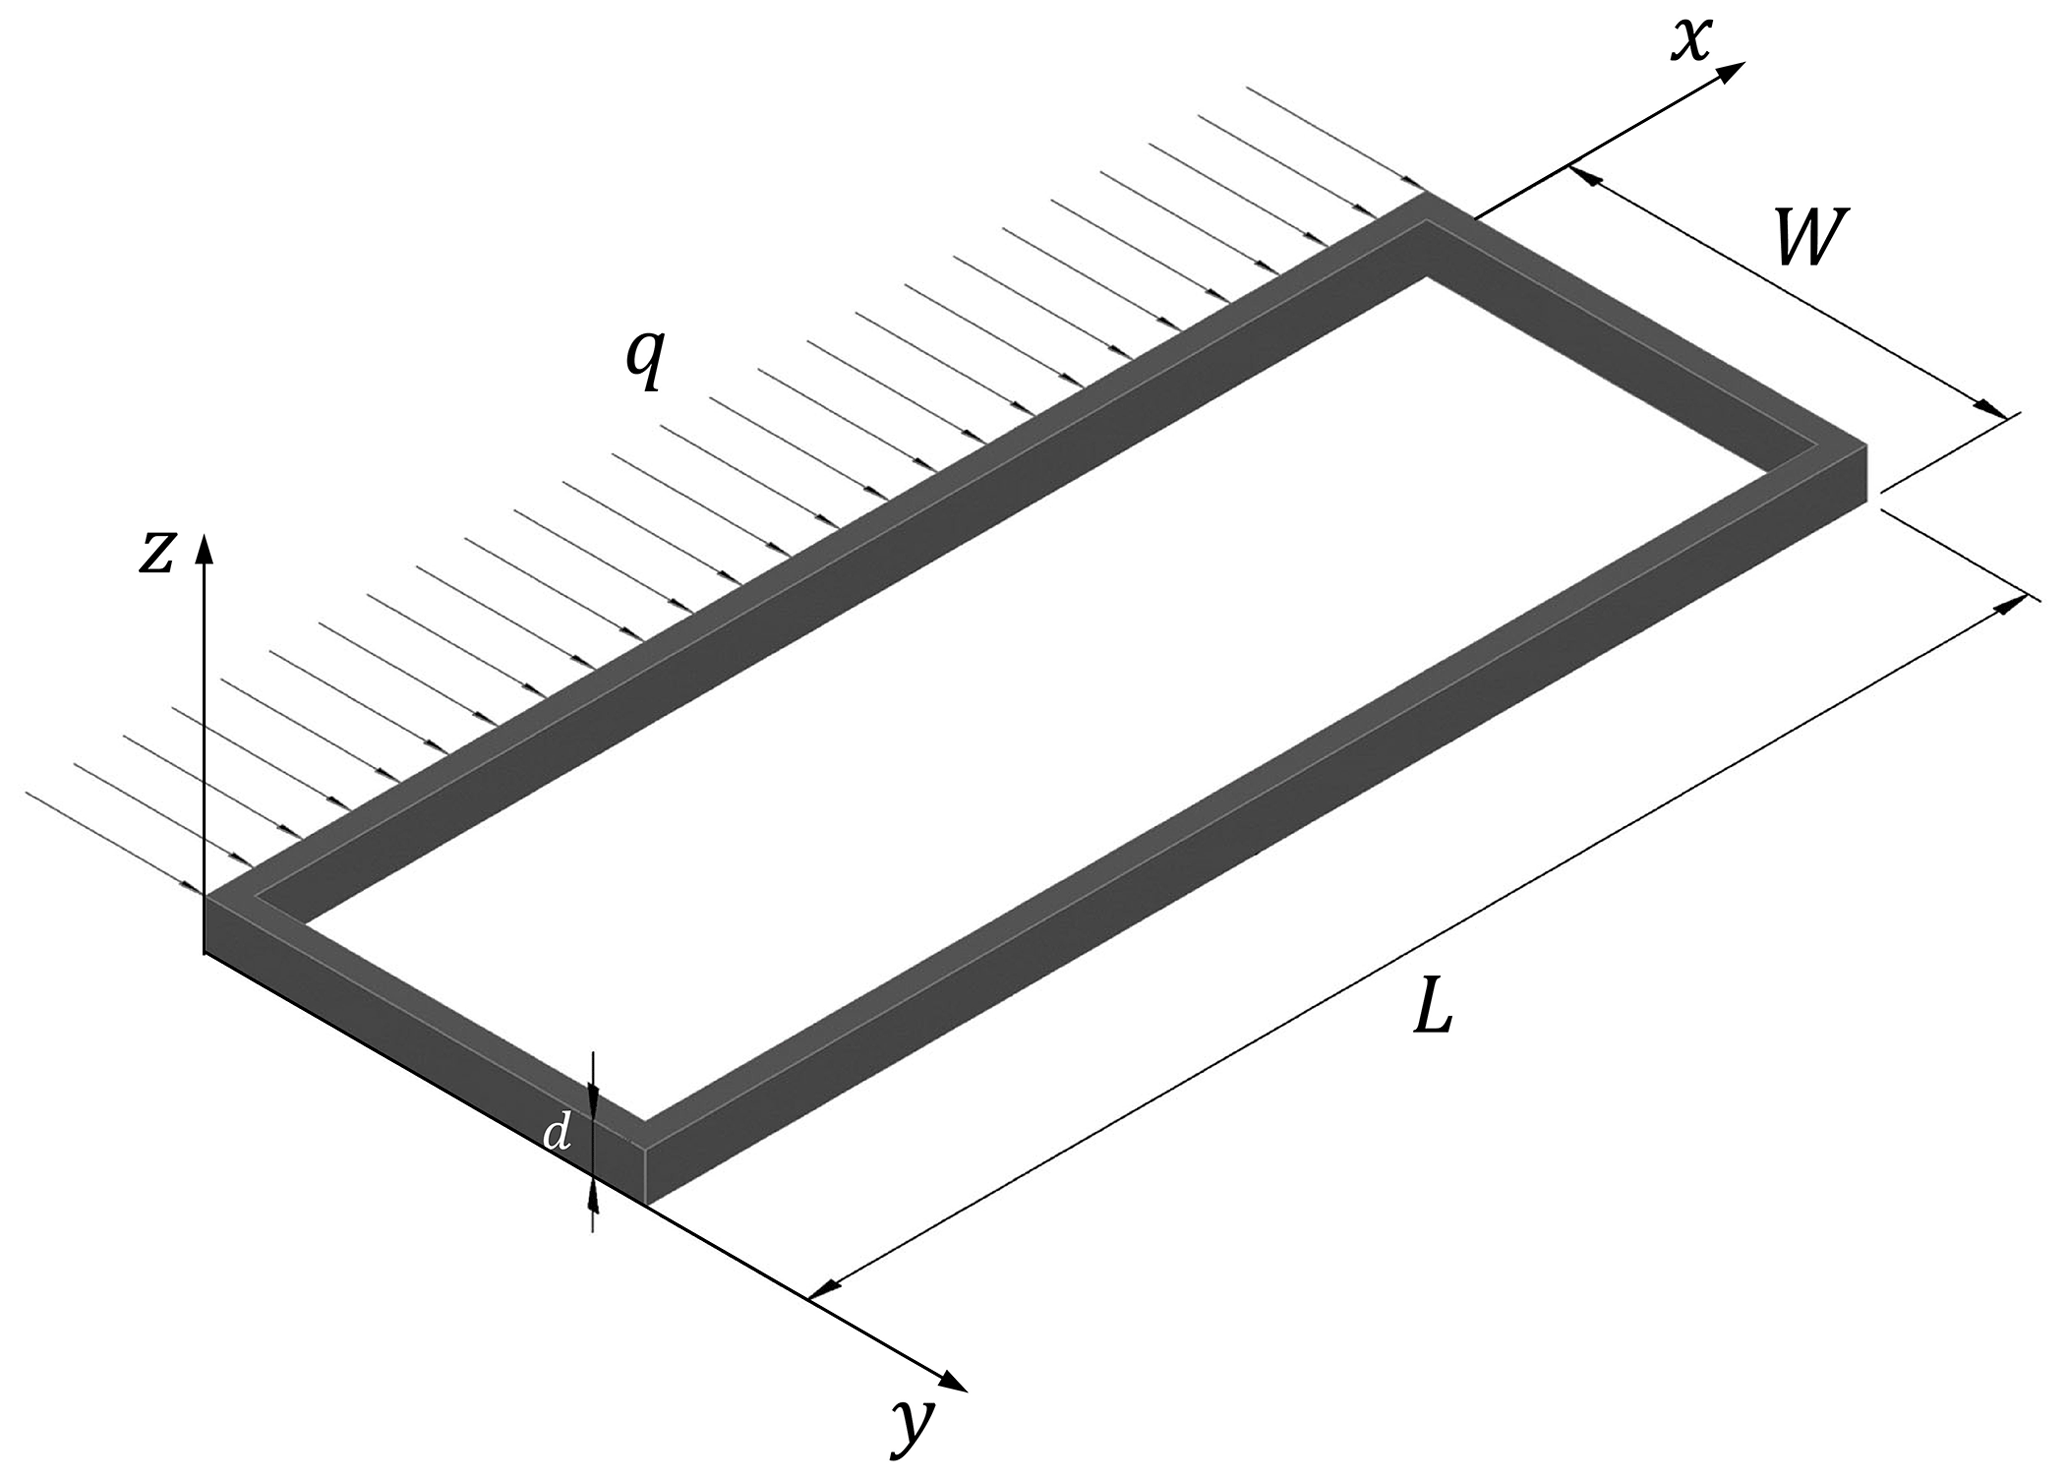
For illustrative purposes, we only consider the case of a beam with a uniform load. Gere and Timoshenko (1984) gave the function of deflection for the uniform loaded beam of unit thickness flexing in both shear and bending as follows:
where q denotes the distribution force on the foundation (kN m−1); L denotes the length of the building; I denotes the moment of inertia defined by , in which d denotes the depth of the foundation; and W denotes the width of the building. Also, E and G denote Young's modulus and shear modulus of the foundation materials, respectively.
When , the equation for the total central deflection is the following:
where the maximum deformation of the foundation is denoted by ym.
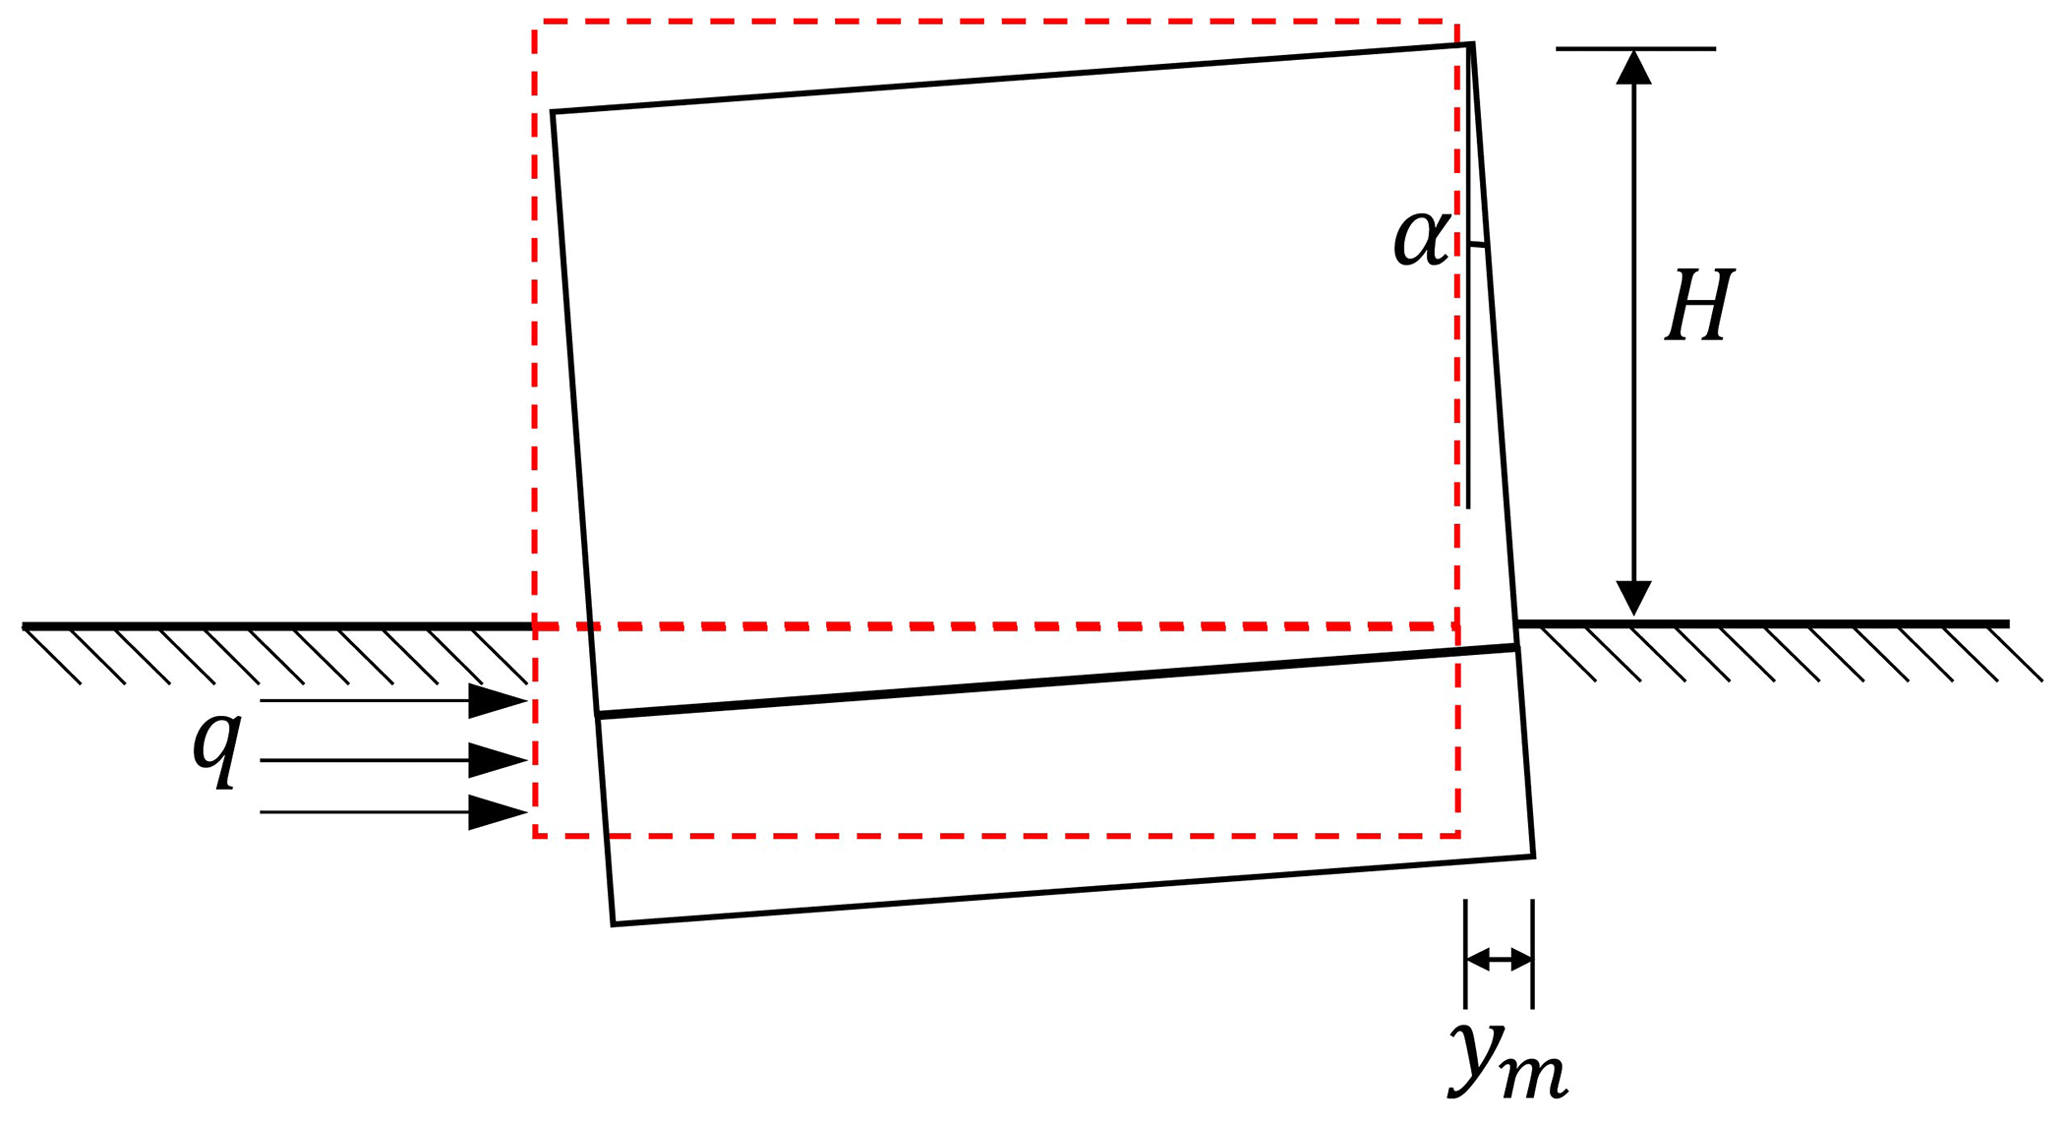
From Technical Specification for Incline-rectifying of Buildings (JGJ 270-2012; Ministry of Housing and Urban–Rural Development of PRC, 2012), it is proposed that the incline angle α of the building is the angle between the inclined structure and the vertical plane (Fig. 4). Furthermore, the inclination of the building is the tangent value of the incline angle.
Meanwhile, according to Code of Deformation Measurement of Building and Structure (JGJ 8-2007; Ministry of Construction of the PRC, 2007), we can calculate the inclination of the building which is the ratio of the horizontal difference between the observation point on the top of the building and observation point on the bottom of the building to the vertical height of the building after tilting. The formula is as follows:
where
-
i is the inclination of the building,
-
α is the incline angle of the building,
-
ym is the horizontal difference between the top and bottom of the building, and
-
H is the vertical height of the tilted building calculated from the outdoor ground.
It is worth pointing out that the building in our study case is regarded as a rigid building and the edges of the foundation are fixed. Therefore, the maximum horizontal displacement of the foundation by using the simple beam mechanical model will be approximately the horizontal difference in the observation point at the top of the building relative to the observation point at the bottom.
The following is the equation for the inclination of the building:
where i denotes the inclination of the building, which is the ratio of the maximum deformation ym and the vertical height of the tilted building calculated from the outdoor ground H.
2.2.2 Damage degree definition
In this study, the ratio of the building's inclination to the threshold value is represented as the damage degree. The damage degree is regarded as the output of physical vulnerability (Tarbotton et al., 2015; Kang and Kim, 2016). The degree of the building damage can be evaluated by utilizing some parameters, such as cracks in walls, inclination, the ratio of maintenance cost, and the original value of the building (Alexander, 1986; Chiocchio et al., 1997; Cooper, 2008). Finno et al. (2005) reported that when highly stiff buildings are very inclined due to ground deformation, the wall-cracking phenomenon is not obvious. On the contrary, if the stiffness of the building is lower, the cracking on the wall becomes serious. This research shows that using only cracks as an indicator is not suitable for vulnerability assessment. Other indicators, such as inclination, should also be taken into consideration. Therefore, the width of the cracks is not the only indicator for building damage assessment but we should also take into account if the building is inclined. Therefore, the inclination has been chosen to represent the deformation of buildings (Huang et al., 2015).
Moreover, the inclination of the building is easy to measure. The standard for dangerous building appraisal (JGJ 125-2016; Ministry of Housing and Urban–Rural Development of PRC, 2016) provides the threshold value of the inclination of single- or multi-storey buildings (Table 2). Buildings with inclination exceeding the threshold value are considered to be dangerous and uninhabitable.
Table 2The threshold value of building inclination (Ministry of Housing and Urban–Rural Development of PRC, 2016).
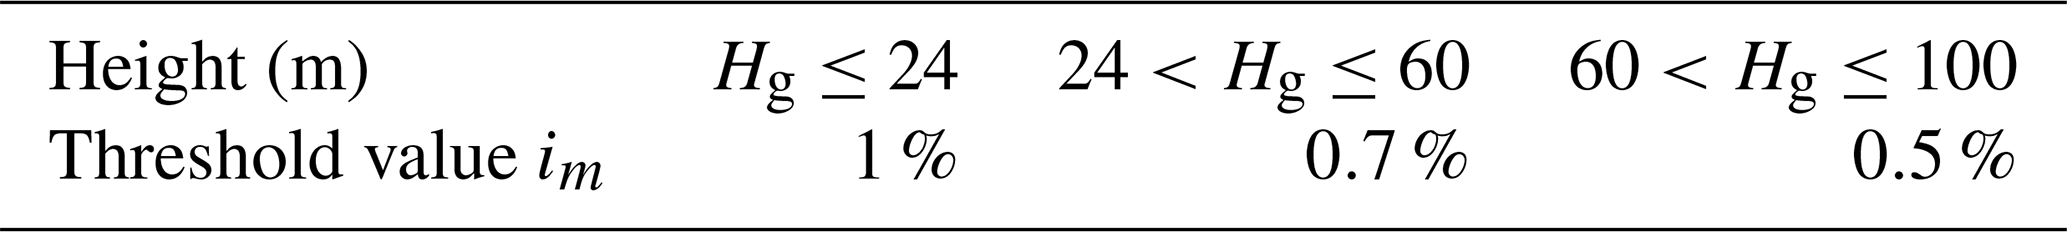
Here, Hg denotes the building height which is calculated from the outdoor ground.
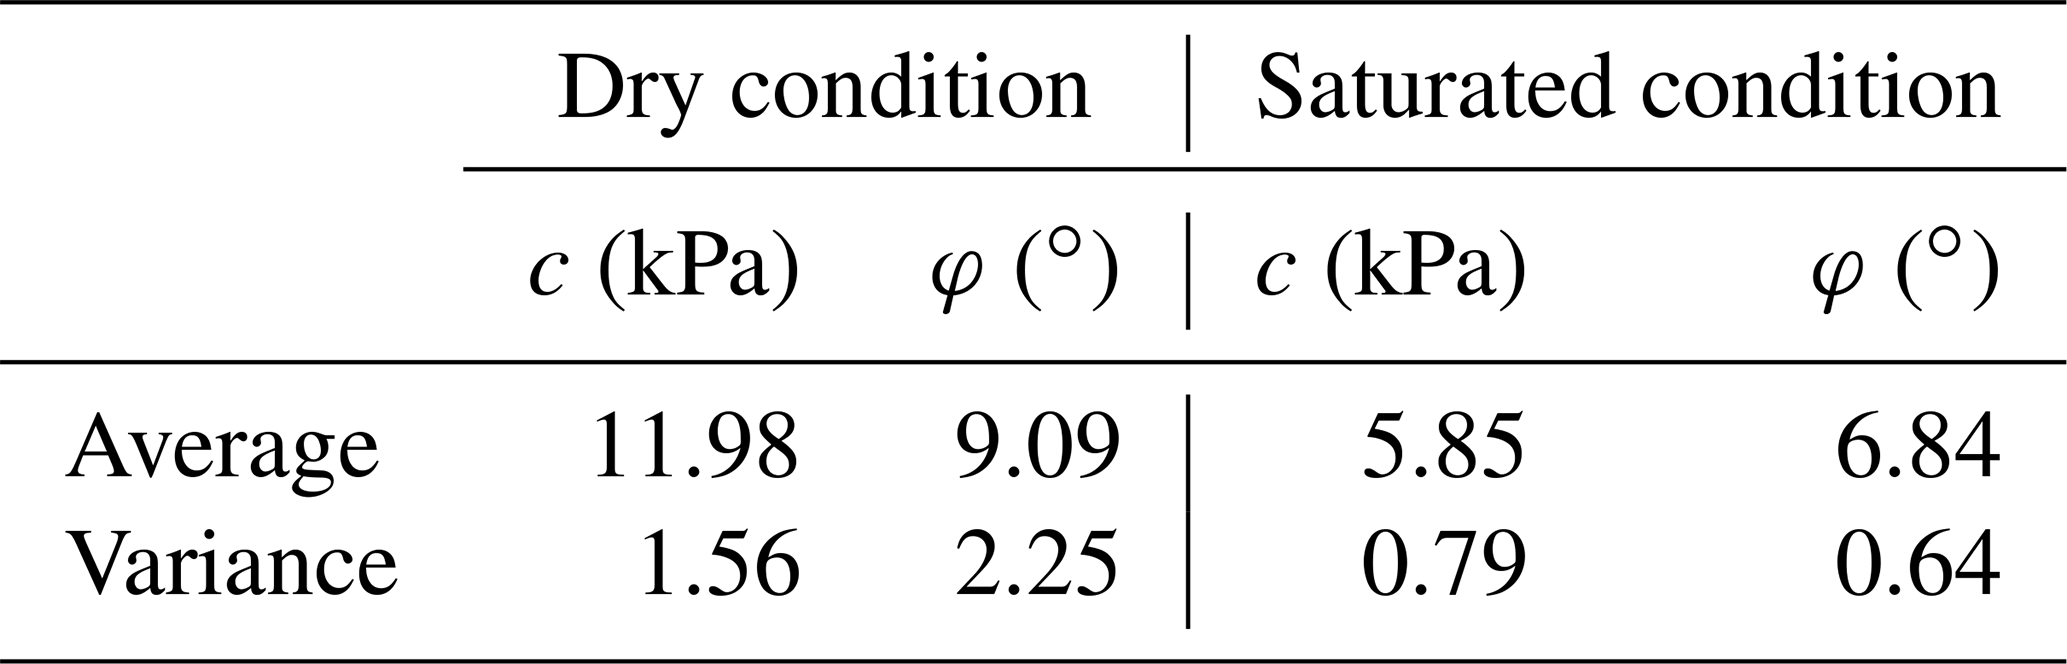
Table 3Shear-strength parameters of Manjiapo landslide slip soils (data source is the Hunan Institute of Xiangxi Geological Engineering Survey, China; Chen et al., 2017).
By comparing the inclination of the building with the threshold value, the vulnerability (V) can be calculated as follows:
The vulnerability (V) ranges from 0 to 1.0; a value close to 1.0 indicates serious damage. Equation (11) demonstrates that the building's inclination depends on the following three parameters: size, material, and foundation depth. To ascertain the parameter with the highest significant impact on the degree of building damage, we can conduct a sensitivity analysis on these parameters by employing the principle of controlling variables.
Table 4Parameters of the building on the Manjiapo landslide.
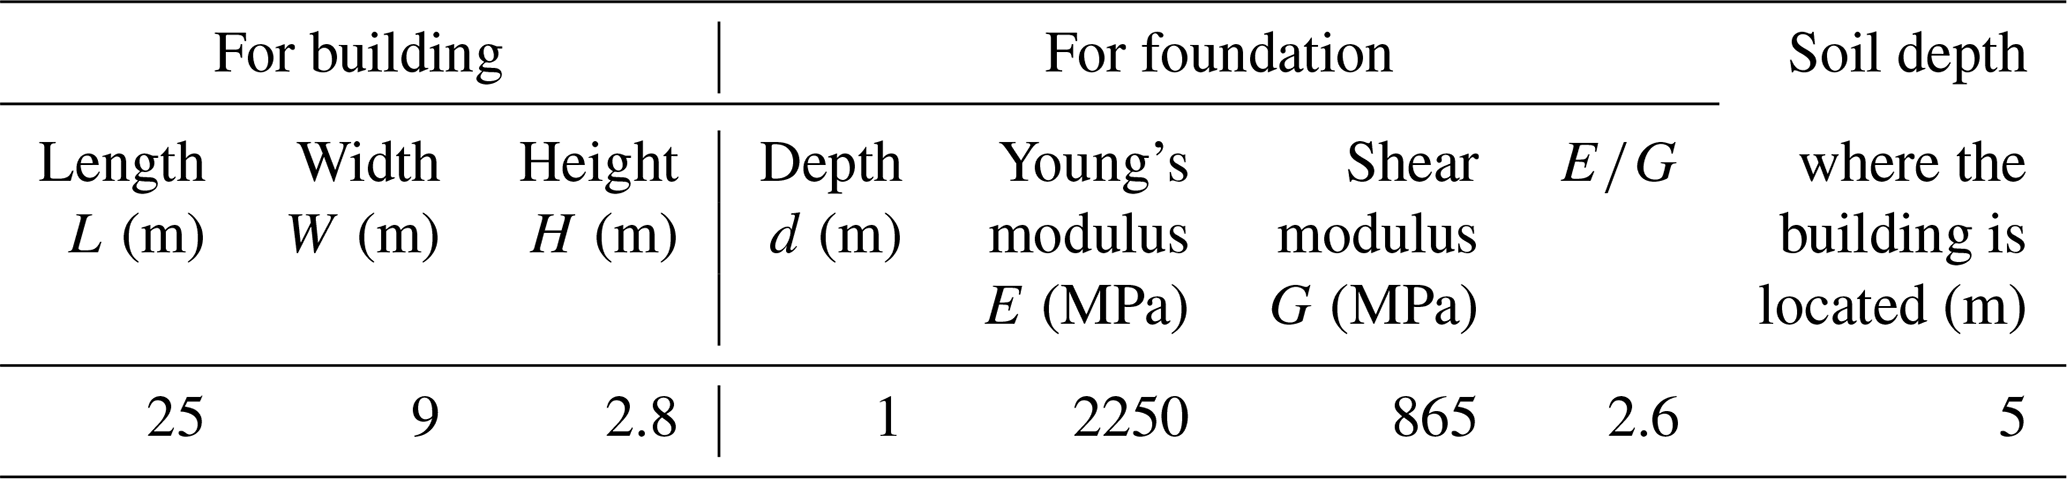
Note that the elastic modulus value is from the code for the design of masonry building (GB50003-2011; Ministry of Housing and Urban–Rural Development of PRC, 2011). Thus, an isotropic elastic material is defined as follows: , where ν denotes the Poisson's ratio for ν=0.3, and (Burland et al., 1977). H denotes the vertical height of the tilted building calculated from the outdoor ground.
2.3 Physical vulnerability function for masonry buildings
2.3.1 General functions
In this study, we obtained the physical vulnerability curve by relating building vulnerability with the landslide safety factor. It is important to note that the safety factor for the whole landslide (Fs) should be calculated, and also, the local value of the safety factor for the area where the building is located (Fsb) should be considered. For slow-moving landslides, they can have an Fs greater than 1.0 but with cracks within the landslide area, which can cause damage to buildings located across the cracks (Chen et al., 2016; Infante et al., 2016). To solve the problem of the building's vulnerability, the local safety factor Fsb of this kind of landslide needs to be focused. Meanwhile, a landslide's intensity is directly proportional to its stability situation. A higher intensity corresponds to a higher thrust force on the building foundation and lower landslide safety factor. Thus, we utilize the reciprocal value of Fsb to be the landslide intensity in this study.
The relationship between building vulnerability and the landslide intensity was fitted by employing a Weibull (1951) function that produces an S-shaped curve. This type of distribution curve has been proved to be the best for physical vulnerability analysis by Papathoma-Köhle et al. (2015). Based on these findings, a modified Weibull function for calculating physical vulnerability is defined as follows:
where V denotes physical vulnerability which is calculated by employing Eq. (11); Fsb is calculated by employing Eq. (1); and a and b are constants, which need to be determined.
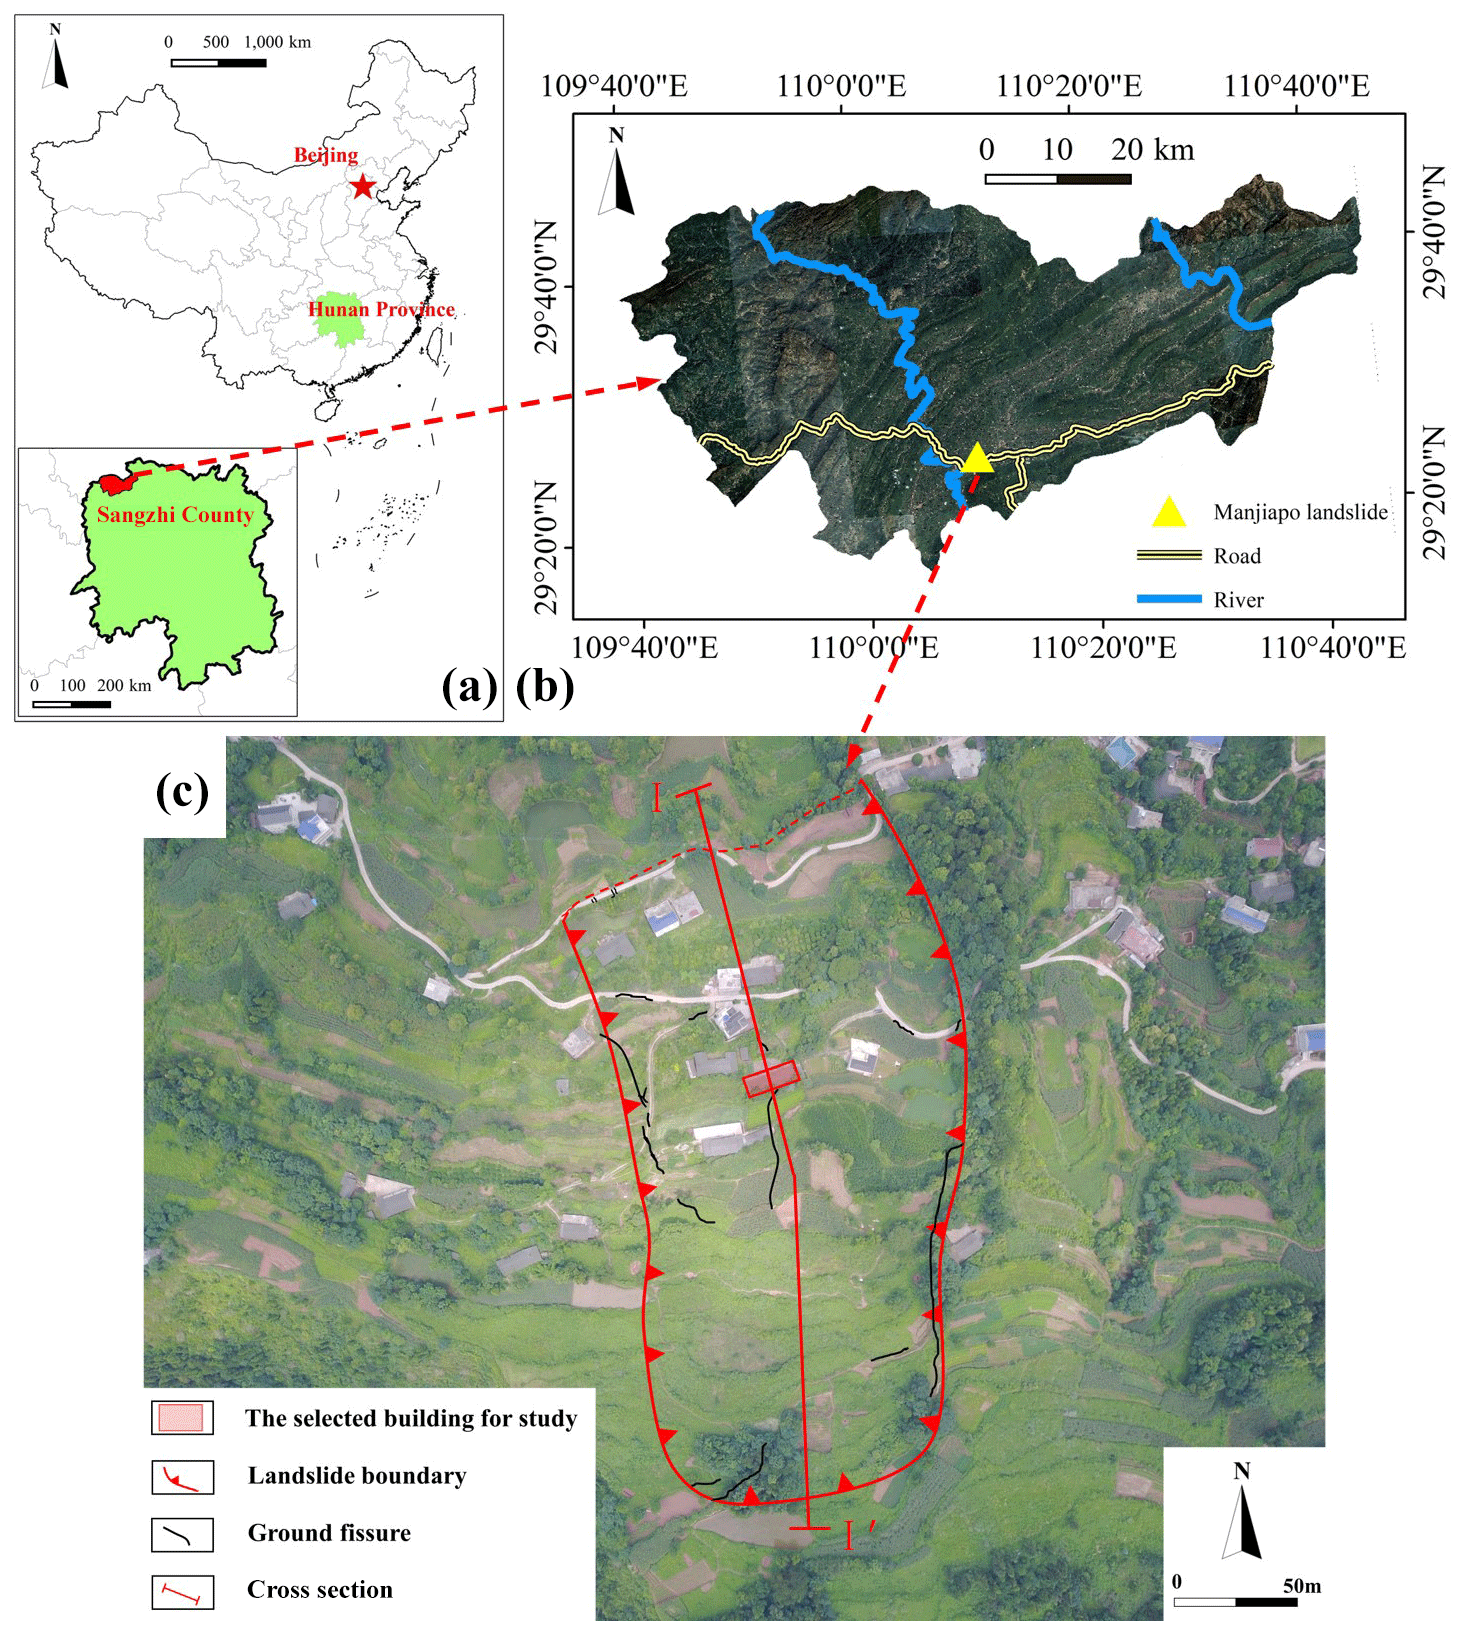
Figure 5Location of the Manjiapo landslide: (a) map of China downloaded from http://www.geodata.cn (last access: 18 July 2019), (b) a © Google Earth image fragment showing the location of the landslide, and (c) an unmanned aerial vehicle (UAV) image showing the landslide boundary and the location of a cross section I–I′ (UAV image obtained during field investigation).
2.3.2 Determination of constants by applying multiple scenarios
To determine the constants a and b in Eq. (12), we first obtain two or more scenarios, which can reflect the landslide safety factor and the building vulnerability. Using several triggering scenarios, such as rainfall, earthquake, and reservoir water level fluctuation, we can obtain several safety factors, the corresponding landslide force on building foundation, and the building vulnerability. Then, we apply the least-squares method to obtain the constants based on the presupposed function in Eq. (12).
In this study, rainfall is the key triggering factor for the landslide. Thus, we obtain rainfall scenarios by analysing the precipitation using different return periods. The Pearson type III (PT III) distribution model (Lei et al., 2018; Radwan et al., 2019) is applied because it is useful in rainfall-induced landslides; its probability density function is defined as follows:
where parameters α, β, and a0 can be given by the three statistical parameters after conversion, , Cv, and Cs. Thus, we have
where denotes the average value, Cv denotes the coefficient of variation, and Cs denotes the coefficient of skewness.
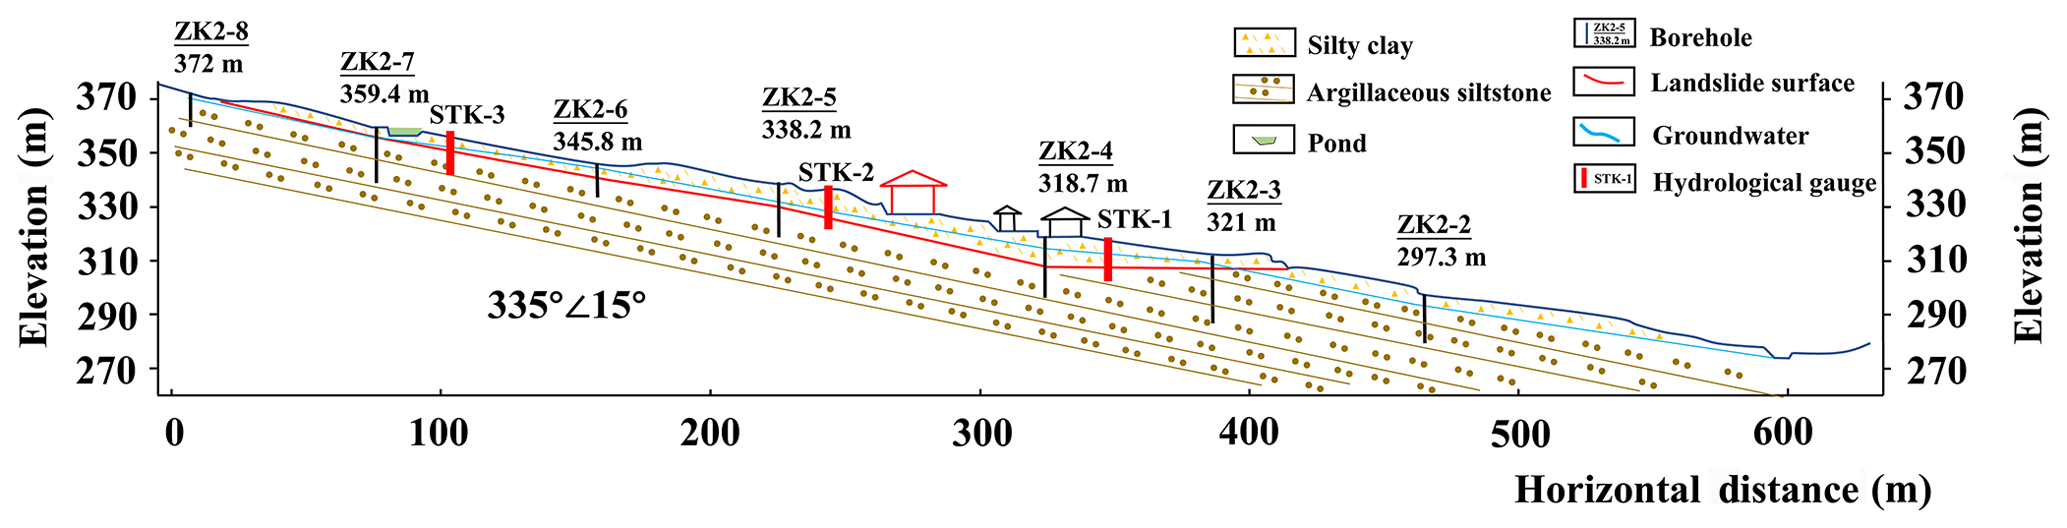
Figure 6Geological profile (1:1000) of section I–I′ of the Manjiapo landslide. The location of the cross section is shown in Fig. 5c.
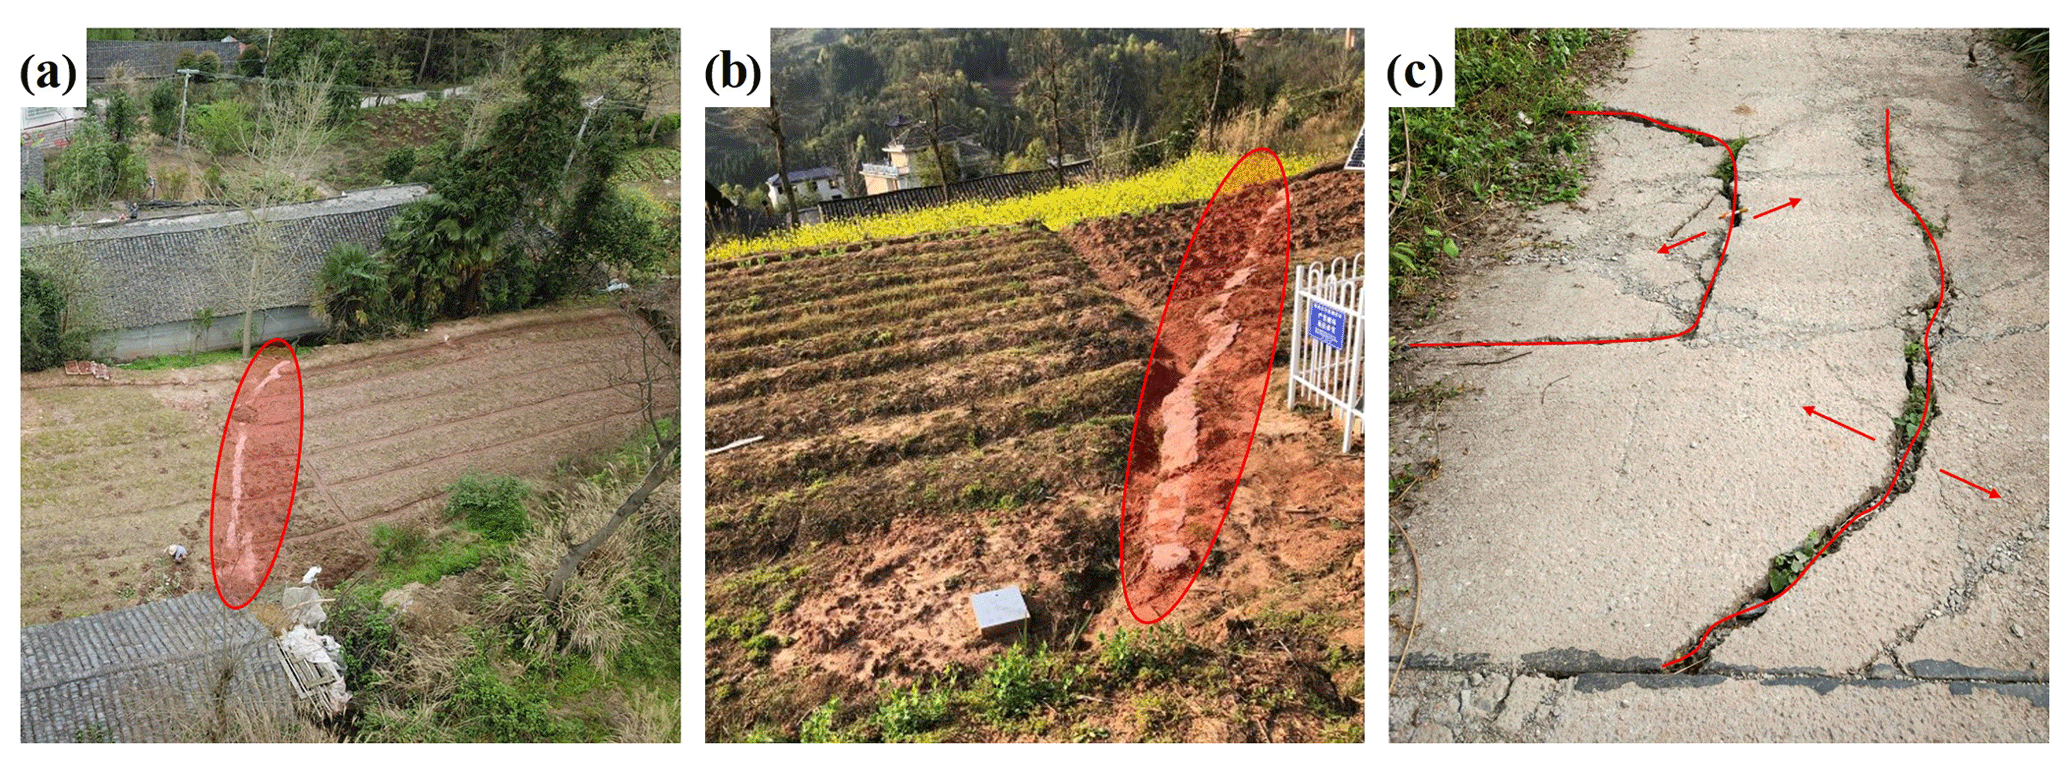
Figure 7Cracks on the Manjiapo landslide: (a) the middle part, (b) the upper part, and (c) the lower part.
From Eq. (14), the PT III distribution model has three undetermined parameters: , Cv, and Cs. The principle of maximum entropy, the method of moments, and maximum likelihood estimation are employed to estimate the parameters for the PT III distribution (Singh and Singh, 1988). We plot the physical vulnerability curve after obtaining the values of these three parameters determined by different rainfall scenarios with varying return periods.
3.1 Geological settings and deformation of landslide
The Manjiapo landslide (29∘25′3.69" N, 110∘10′0.32" E), located in Sangzhi County, Zhangjiajie, China, was selected as the case study (Fig. 5). The area is mountainous and hilly with elevation ranging from 154 to 1890 m.a.s.l. The climate is humid subtropical, and the estimated average annual rainfall is about 1400 mm.
The landslide covers an area of about 6.6×10⁴ m2 with an average thickness of 6.9 m and an estimated volume of 45.5×10⁴ m3. It demonstrates a strip shape in a plan with a longitudinal dimension of about 560 m and the average width of approximately 176 m along the northwest–southeast (NW–SE) direction. The elevation of the main crack is about 370 m.a.s.l. The toe of the landslide is located at a 272 m elevation along the stream.
The topography demonstrates a multi-step shape, the height of which ranges from 1 to 3 m. The middle and upper parts of the landslide are relatively gentle with a slope gradient of about 8∘, while the lower part is steeper (12∘ slope). The sliding direction of the landslide includes two parts: the upper part orients at 335∘, and the lower part at 313∘.
The main materials of the landslide comprise loose debris from silty clay and siltstone, in which the latter is only distributed in the middle and upper sections of the landslide (Fig. 6). The bedrock is argillaceous siltstone with a slope angle of approximately 10∘. The shear-strength parameters of the slip soil of the landslide, shown in Table 3, are obtained from the detailed landslide report in 2017 of the Hunan Institute of Xiangxi Geological Engineering Survey (Chen et al., 2017). The shear-strength parameters are based on six groups of undisturbed soil samples and their laboratory tests.
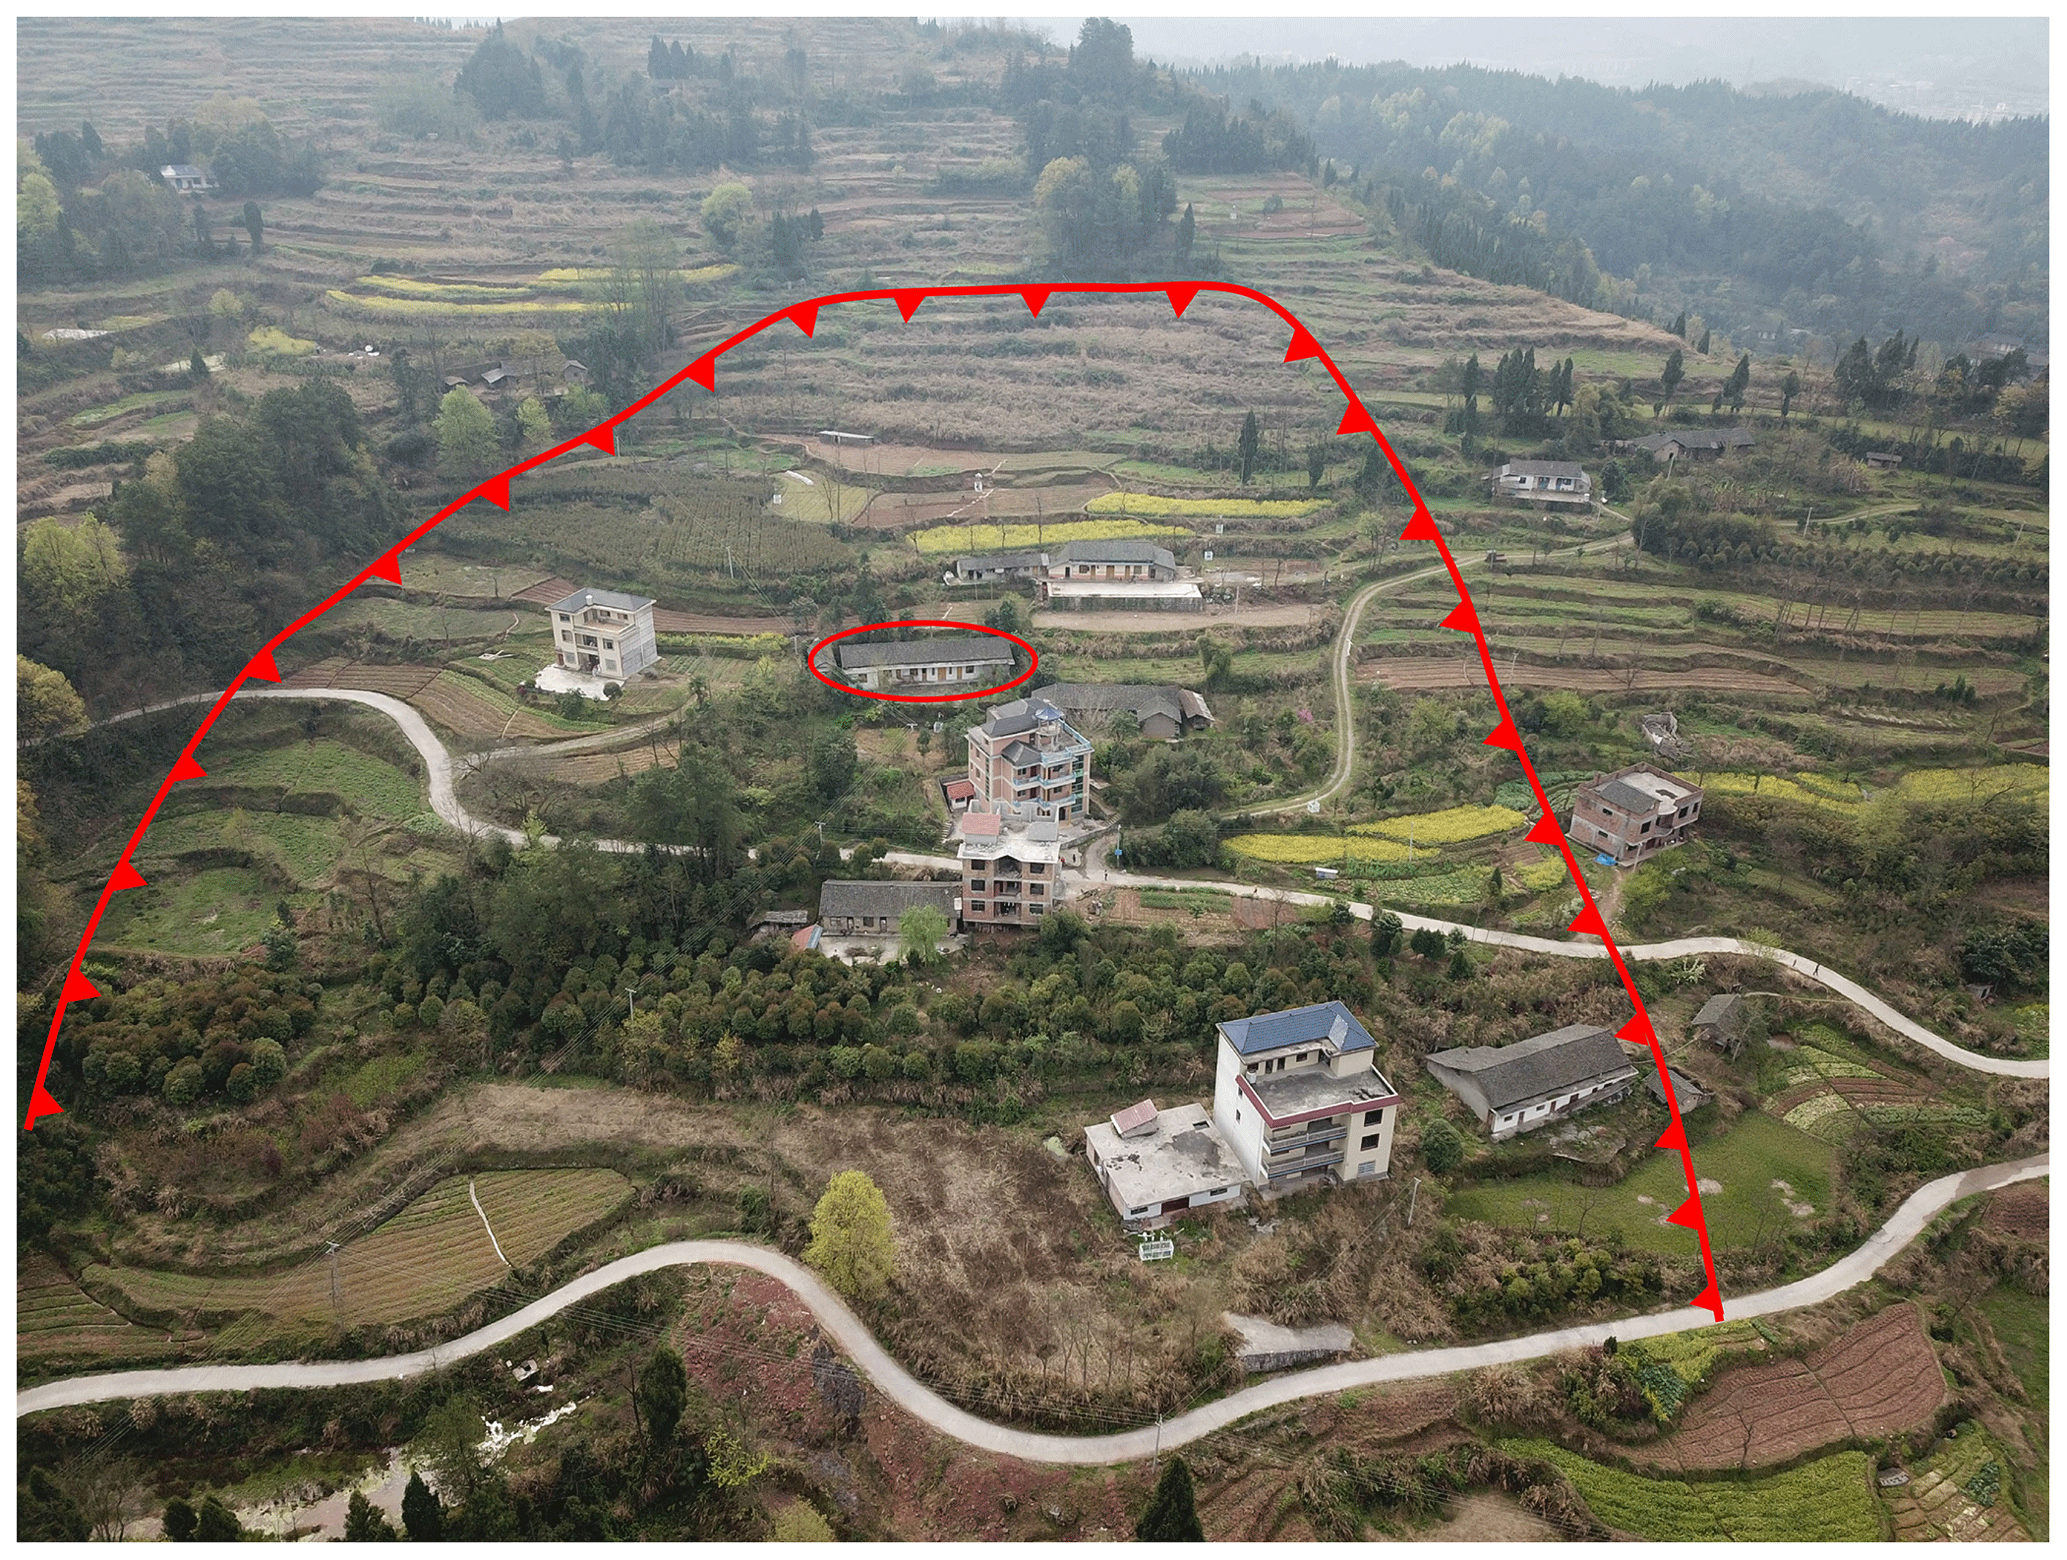
Figure 8A typical example of a damaged building in the landslide area (unmanned aerial vehicle image obtained during field investigation).
Manjiapo landslide has a history of 10-year displacement. According to the residents, the landslide occurred in August 2008, which resulted in a few ground fissures. Due to heavy rain during 28 to 30 June 2016, severe displacement of the landslide was induced. Field investigation carried out in July 2017 revealed that the displacement mainly occurred in the middle and upper parts of the landslide (Figs. 5c and 7a, b). Numerous tension cracks in the upper part had a visible depth of 2–5 cm, with a length of 1600 to 6600 cm and a width of about 15 cm. In the middle part of the landslide, staggered extrusion deformation can be observed locally as well as numerous tension cracks.
Moreover, the surface deformation caused the rise in groundwater in the silty clay layer. As a result, the shear strength of the soil mass decreased and the sliding zone was formed. It was revealed by boreholes dug during fieldwork in 2017. On the lower part of the landslide, cracks and some uplift deformation were observed on the roads (Fig. 7c).
Rainfall appeared to be the most important triggering factor of the slow-moving Manjiapo landslide. The cracks and the macroscopic deformation on the landslide have been monitored since 2016. Analysis of the monitoring data shows that only heavy rainfall could reactivate the landslide. Analysis of the borehole data shows that the groundwater table is stable in the dry season. The landslide did not show any displacement in the absence of extreme rainfall. For example, the cracks on the landslide did not expand, and there were only a few new cracks.
3.2 Damaged buildings on the landslide
Field investigation, carried out in July 2017, shows that 15 houses were affected by the landslide, of which 5 were constructed using brick–wood and 10 brick–concrete (Fig. 8). The buildings located in the middle part of the landslide were the most severely damaged. Due to landslide deformation, the walls of these buildings were cracked and inclined. We selected a damaged building for a detailed study. Severe cracks appeared on the walls, and finally, the building was abandoned.
The selected building for study is a one-storey masonry building with a length of 25 m and a width of 9 m. The building has six rooms, and each room was damaged as a result of continuous rain from 28 to 30 June 2016. Large-scale ground collapse occurred in rooms C, D, and E (Fig. 9). Meanwhile, the walls of these rooms developed numerous diagonal cracks with widths varying from 2 to 8 cm. The walls were heavily tilted, with inclination varying from 0.7 % to 1.0 % (Fig. 10a, b, c).

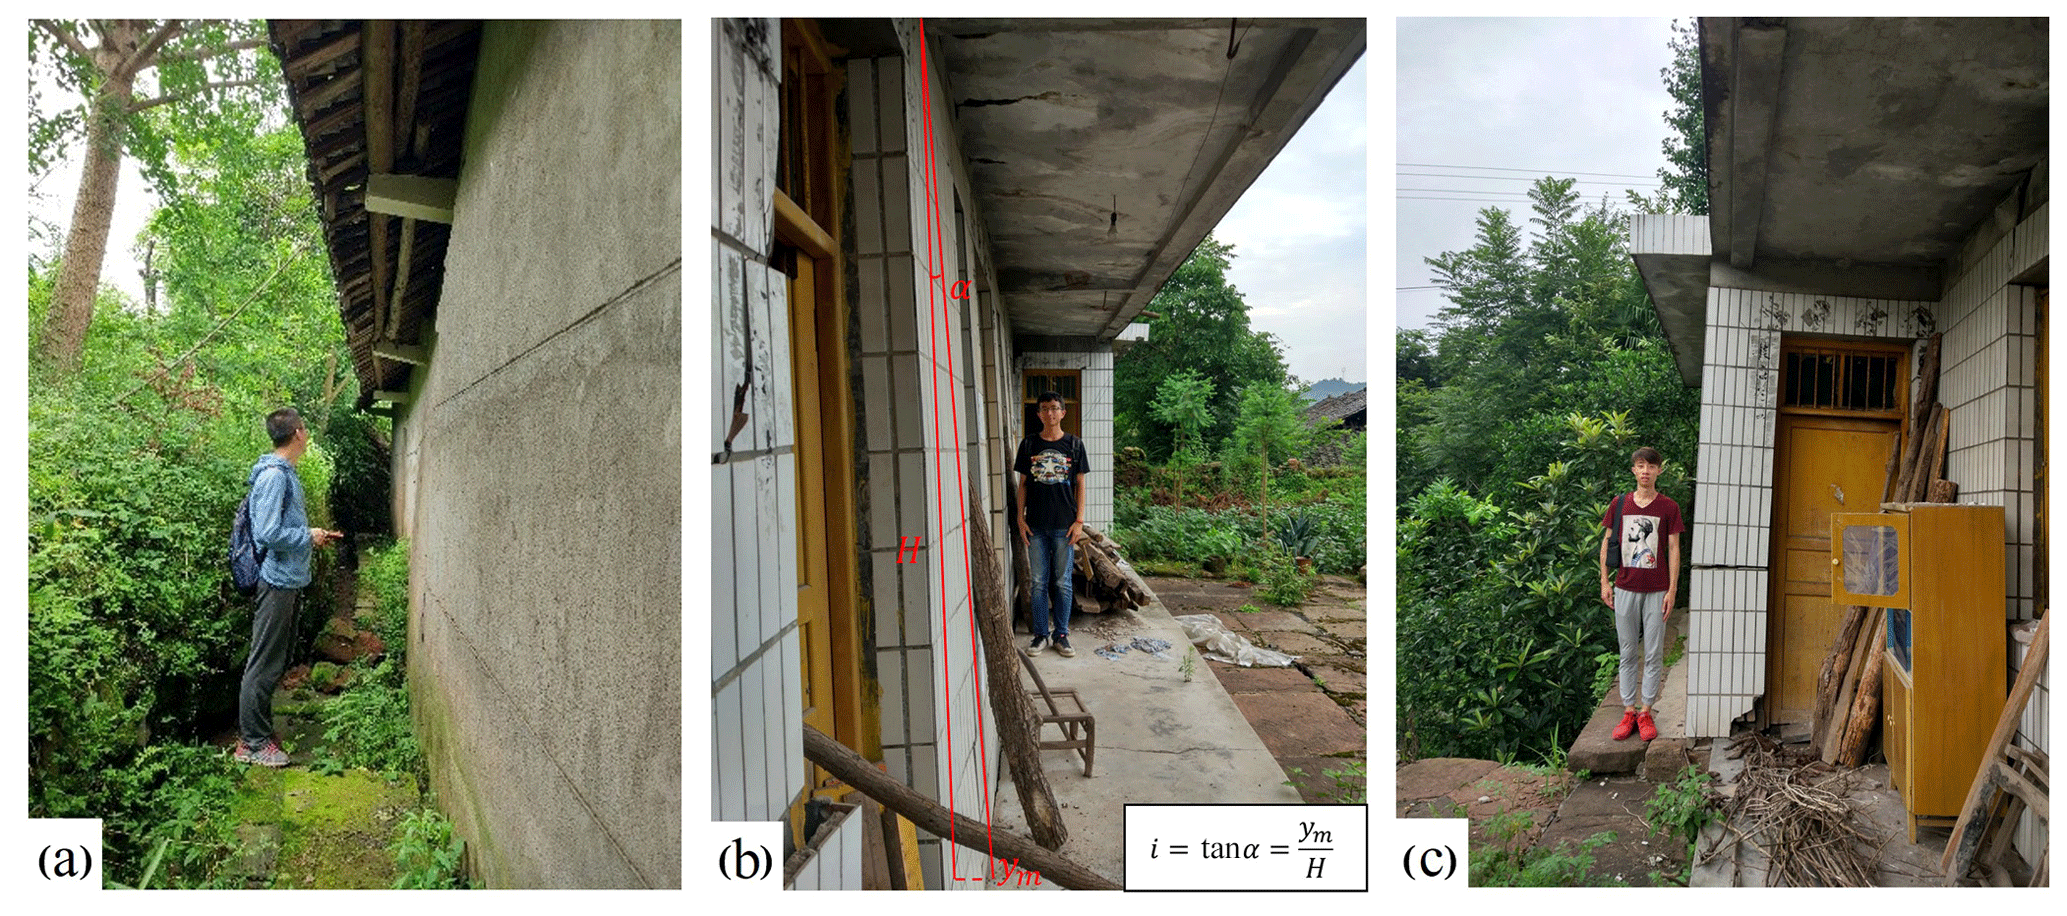
Figure 10The integral decline state of the case study building: (a) the back wall of the building with an inclination of 1.0 %, (b) the front wall of the building with an inclination of 0.8 %, (c) the front wall of room A (shown in Fig. 9) with an inclination of 0.7 %.
3.3 Rainfall data analysis
Landslides are induced by extreme or short-term sustained intense precipitation (Chen et al., 2014; Fang et al., 2018; Huang et al., 2014). Furthermore, 3 d rainfall proved to be the most relevant parameter of landslide occurrences in the study area (Lin et al., 2020). Precipitation data of Sangzhi County for the period 1995 to 2016 were collected from the site http://www.cma.gov.cn/ (last access: 26 May 2019). The data were analysed for extreme rainfall and scenario determination (Fig. 11).
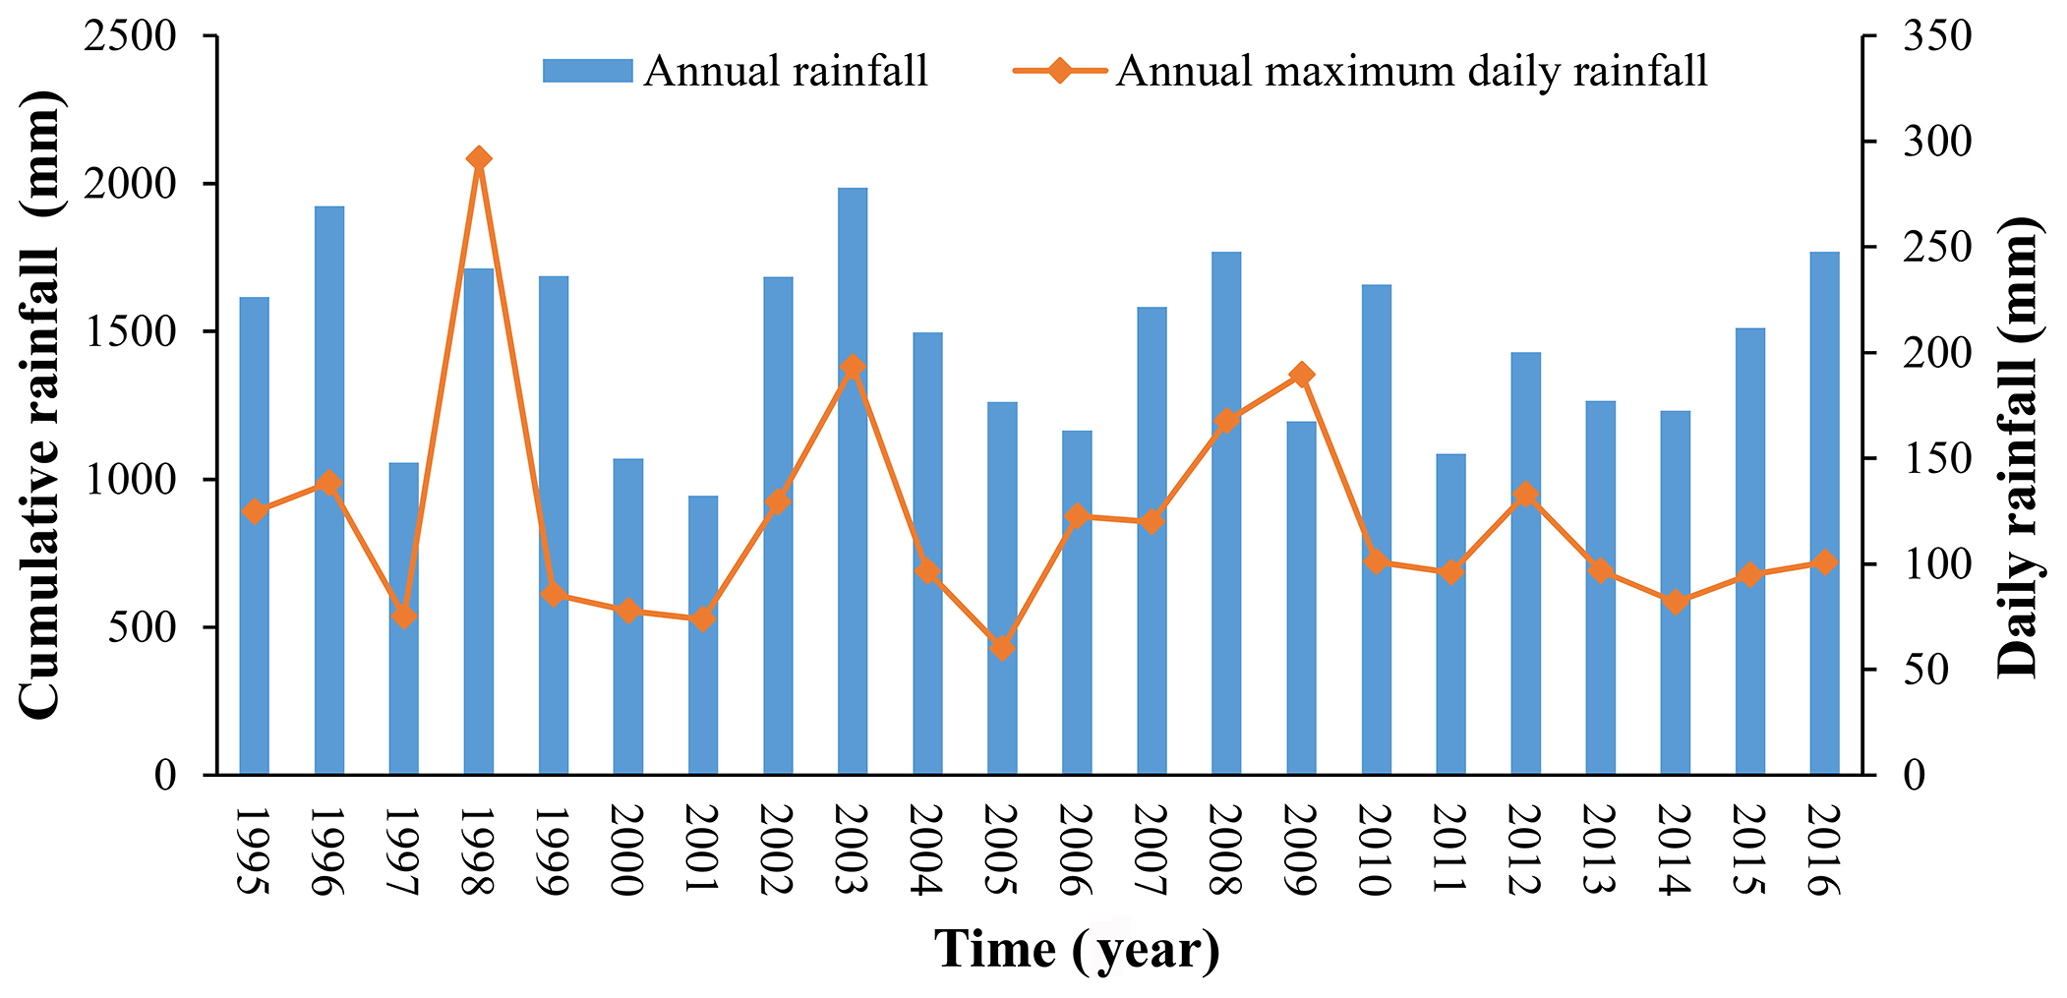
Figure 11Annual and maximum daily rainfall in the study area during the period of 1995–2016.
4.1 Extreme rainfall scenarios and landslide residual-thrust calculation
The extreme rainfall distribution curve is depicted in Fig. 12 and is constructed by employing the PT III distribution model and the rainfall data collected for the period 1995–2016. Using this curve, we can obtain the amount of 3 d cumulative precipitation corresponding to each return period.
Groundwater levels based on four scenarios with different magnitudes of rainfall were selected: (a) dry condition, no rain; (b) rainfall with a return period of 5 years (3 d precipitation is 235 mm from Fig. 11); (c) rainfall with a return period of 10 years (3 d precipitation is 279 mm from Fig. 11); and (d) rainfall with a return period of 50 years (3 d precipitation is 352 mm from Fig. 11). For scenarios b, c, and d, rainfall data were utilized as the boundary condition to simulate the groundwater level of the landslide. Note that all the scenarios are assumed to be without the influence of an earthquake.
The SEEP/W code (GeoStudio) was applied to analyse the groundwater seepage of Manjiapo landslide to obtain the amount of 3 d cumulative precipitation corresponding to each return period by using the PT III (Pearson type III) distribution model (Fig. 12). The average amount of 3 d cumulative precipitation is input into the software in turn, and the groundwater under the rainfall scenarios is simulated.
The saturated volumetric water content is 0.4 by the cutting-the-ring method. The saturated permeability coefficient is obtained by back analysis. We choose the saturated volumetric water content and the permeability coefficient by the variable-controlling approach. Three groups of input values are 0.4 and 0.1, 0.4 and 0.2, and 0.4 and 0.3. Then, the groundwater is simulated and validated for the rainfall event in March 2018. The root mean square error (RMSE) is utilized to check the accuracy. Lower RMSE means smaller error and better prediction. The results of the RMSE are shown in Table 5. The saturated volumetric water content is 0.4, and the most suitable permeability coefficient is 0.3 m d−1.
Table 5Permeability coefficient back analysis of the rainfall event in March 2018, by comparing the root mean square errors (RMSEs) in three hydrological gauges (installed by the authors in December 2017; see Fig. 5) on the Manjiapo landslide.
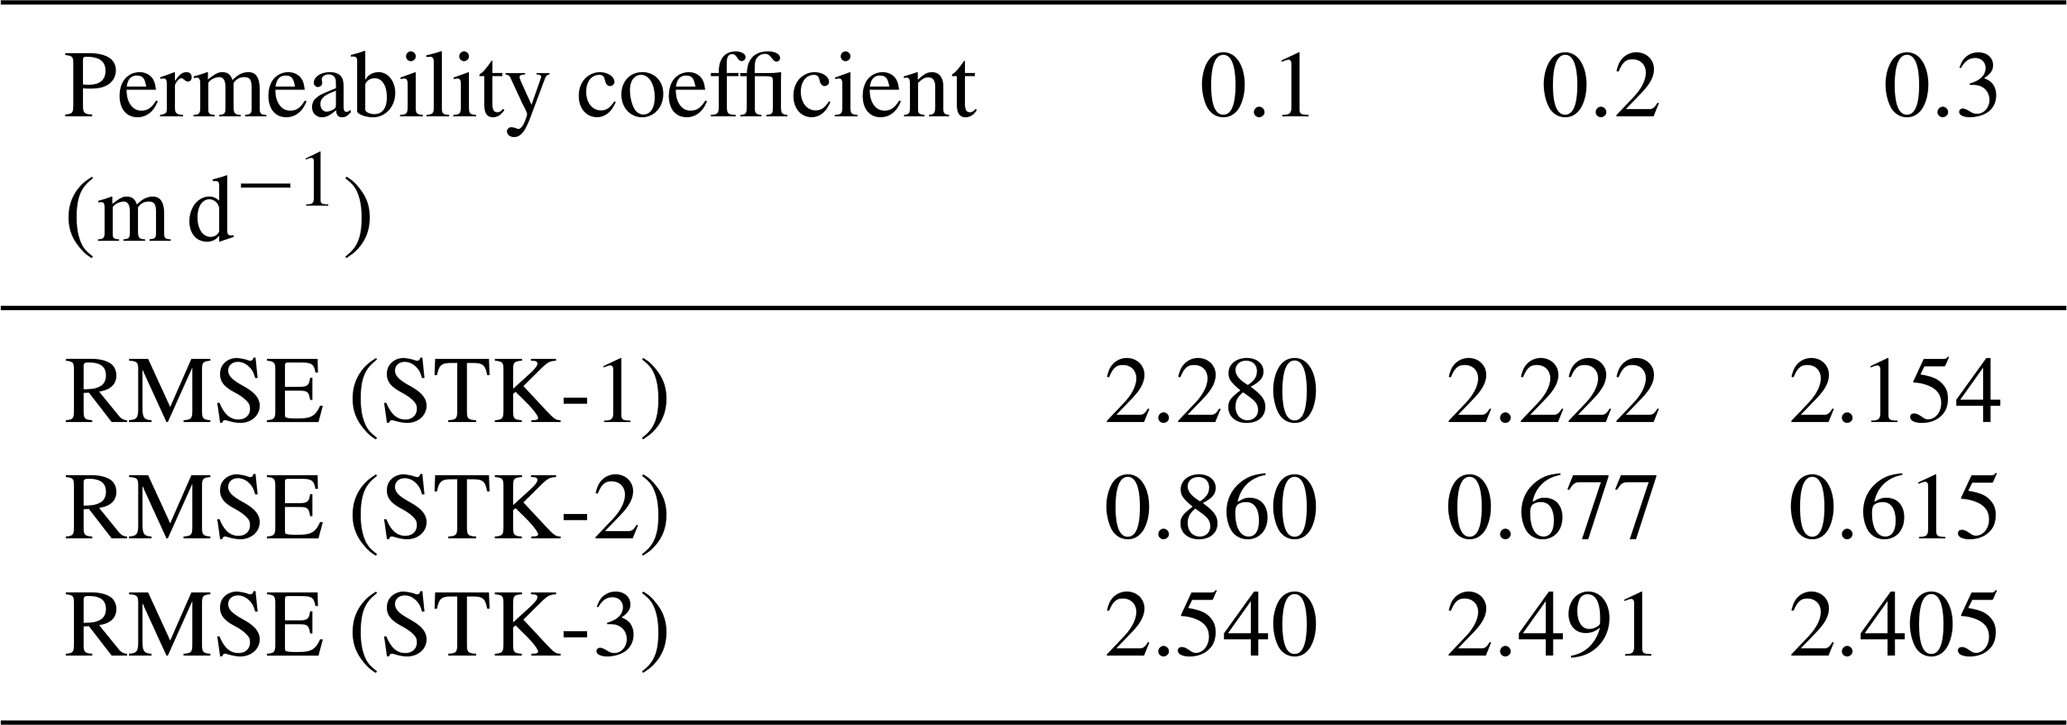
Note that the saturated volumetric water content by laboratory testing is 0.4.
The results of the residual thrust and the corresponding safety factor are presented in Table 6. These values were obtained by the landslide residual-force calculation method (Sect. 2.1) for the geological profile (Fig. 6). In the dry season (scenario a), the landslide performs a residual thrust of 142 kN m−1 and safety factor for the area where the case study building is located of 0.853, while these values can change significantly in the rainy season (scenario b, c, and d). For example, the residual thrust can be increased by at least 15 times and the safety factor can be reduced by nearly half in the rainy season with a 50-year rainfall. This indicates an important influence of rainfall on landslide stability and the building's safety.
Table 6Landslide residual thrust, pushing force on the building's foundation, and vulnerability of the building based on four scenarios (a: dry condition; b: rainfall with a return period of 5 years, 3 d precipitation is 235 mm d−1; c: rainfall with a return period of 10 years, 3 d precipitation is 279 mm d−1; d: rainfall with a return period of 50 years, 3 d precipitation is 352 mm d−1).
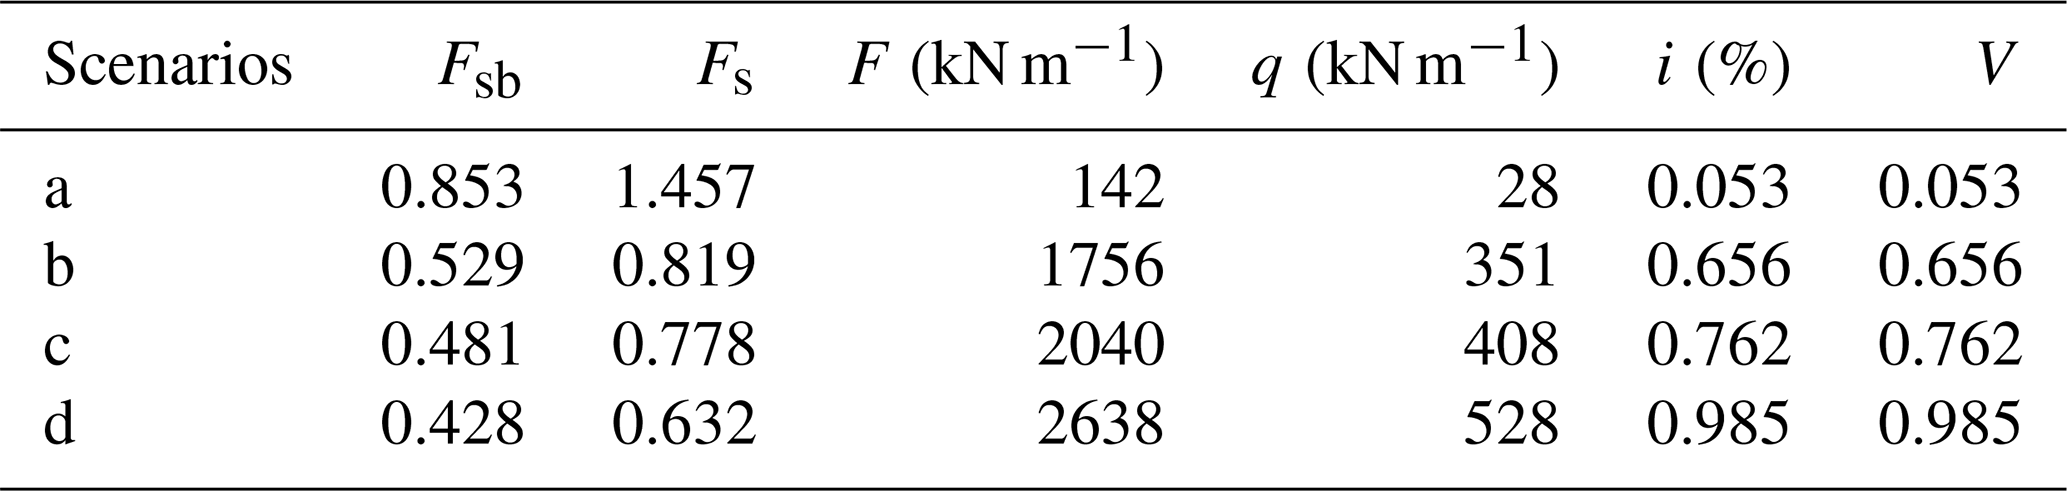
Here, Fsb denotes the factor of safety for the area where the building is located.
4.2 Results of scenario-based vulnerability curve of the building
As described earlier in Sect. 3.1 and demonstrated in the geological profile (Fig. 6), the sliding mass material is silty clay and bedrock. Therefore, the thrust distribution form can be considered as rectangular based on Table 1. By applying the results of the horizontal component of landslide residual thrust (using the method in Sect. 2.1) and the soil depth where the building is located (Table 3), the pushing force on the foundation was calculated by the corresponding thrust distribution function.
Table 6 illustrates the results of the pushing force on the foundation, inclination, and the building vulnerability based on different scenarios. The result indicates that the building's vulnerability is very low (V=0.053) in the dry season, with a pushing force of 28 kN m−1 on the building's foundation. However, in rainy seasons, the building can experience severe damage with a vulnerability of 0.798 (10-year rainfall) or even 0.985 (50-year rainfall).
Using the four sets of scenario data (Table 6), we constructed the physical vulnerability function, and the constants in Eq. (12) were determined by employing the Weibull function.
Based on the Chinese standard from Specification of Risk Assessment for Geological Hazard (DZ/T 0286-2015; Ministry of Land and Resources of the PRC, 2015), there are three stability states of landslide according to the range of the safety factor of the landslide. Please see more details in Table 7.

Table 7The range of safety factors of the landslide and its state (referring to Ministry of Land and Resources of the PRC, 2015).
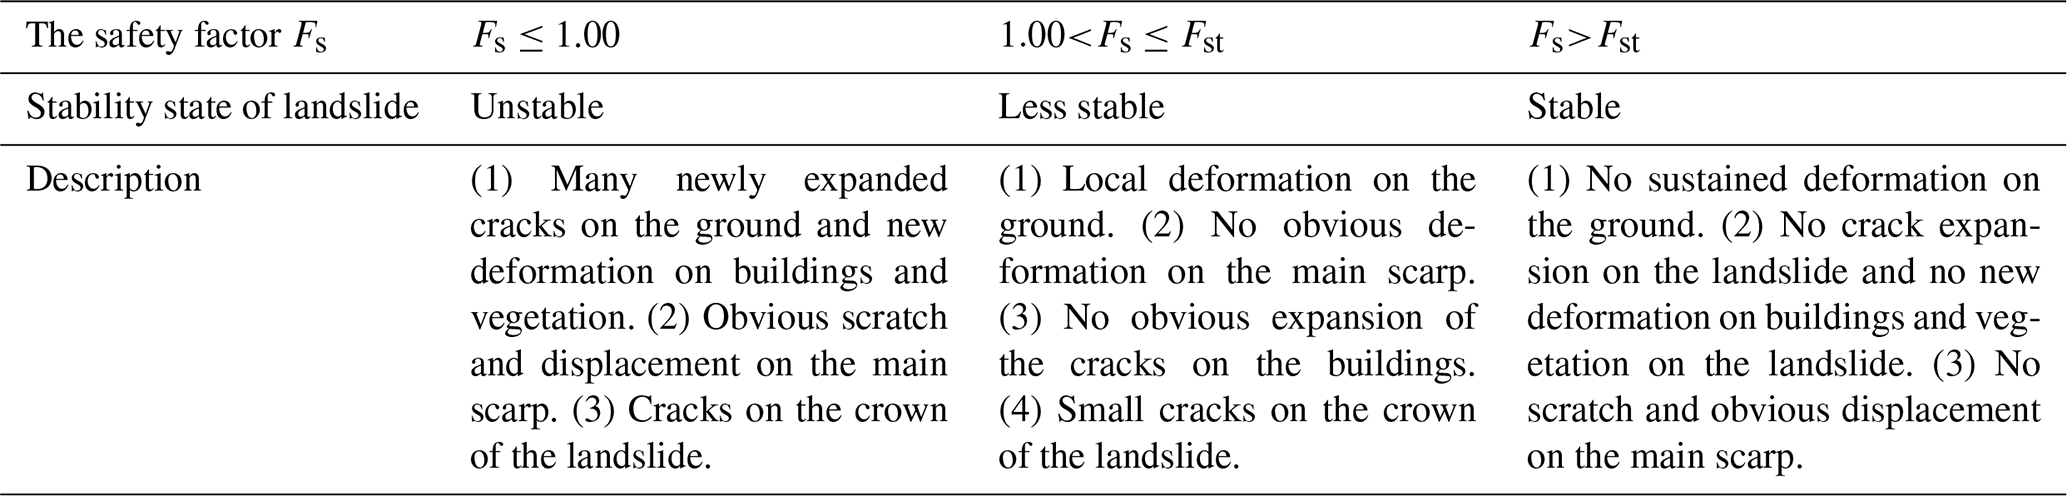
Note that Fst denotes the design safety factor.
The value of Fst is defined based on the slope safety level and slope type. Meanwhile the slope safety level is defined based on the potential economic loss and element at risk. According to the field investigation, there are 116 residents in the affected area of the Manjiapo landslide, and the road passes through the middle part of the landslide. In the case of geologic hazard, it will threaten the lives and property of 116 residents and damage more than 67 000 m2 of the land. At the same time, the road will be damaged, threatening the safety of the pedestrians and passing vehicles. The potential economic loss will be more than CNY 5 million. Based on Table 9, the safety level of the Manjiapo landslide is judged to be second level.
Table 8The value of the design safety factor (referring to Ministry of Housing and Urban–Rural Development of PRC, 2013).
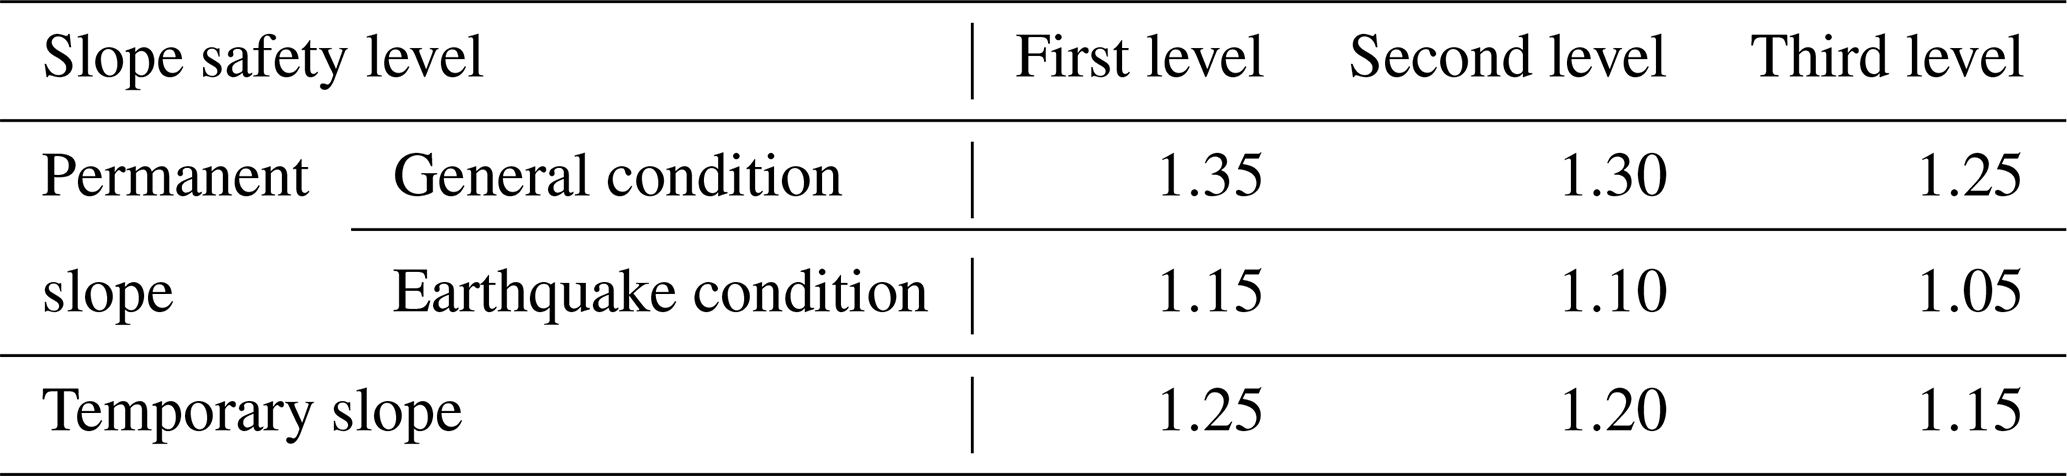
Table 9The slope safety level (referring to General Administration of Quality Supervision, Inspection and Quarantine of the PRC, 2016).
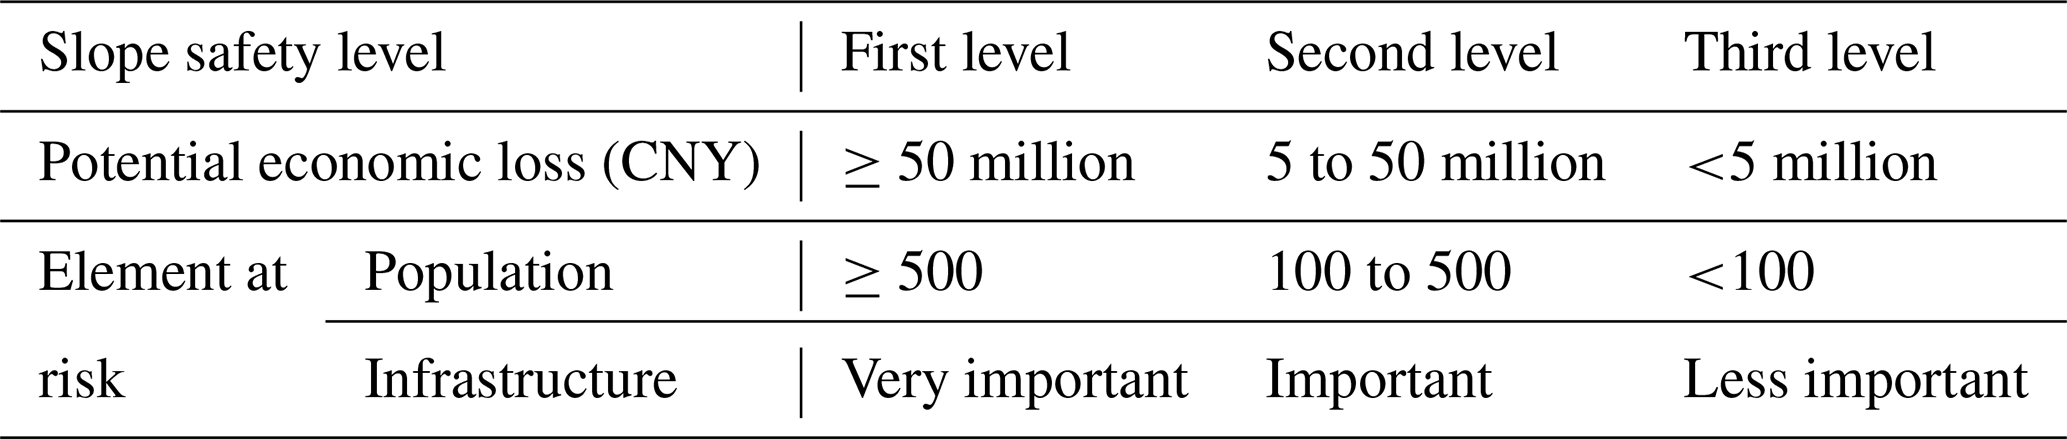
Note that if one of the conditions is met, it will be judged to be the corresponding slope safety level.
Therefore, when the safety factor of the Manjiapo landslide is greater than 1.30, the landslide is stable and the landslide intensity is very low. In addition, the resistance ability of the building can prevent the building from being destroyed by the low intensity of the landslide (Du et al., 2013). In summary, the physical vulnerability of the building on the Manjiapo landslide is very low when the safety factor is greater than 1.30. The physical vulnerability of the building on Manjiapo landslide is 0 when the reciprocal value of the safety factor (1∕Fsb) is 0.5. The physical vulnerability of the case study building on the Manjiapo landslide is demonstrated in Fig. 13.
We can observe that the physical vulnerability is very low when the landslide is stable with a safety factor greater than 1.0. When the safety factor is lower than 1.0, the physical vulnerability rapidly increases. Vulnerability approximates to 1.0 when the reciprocal value of the safety factor is 2.5. By utilizing this curve, we can obtain the possible physical vulnerability of the building if the safety factor for the local area where the case study building is located is known.

Figure 13The physical vulnerability curve for masonry buildings impacted by the slow-moving landslides.
4.3 Influence of building characteristics on vulnerability and the sensitivity analysis
To obtain the influence of building characteristics on vulnerability, we conducted sensitivity analysis. We know that numerous parameters of the building were included in the building inclination and vulnerability calculation, e.g. length, width, depth of foundation, and E∕G ratio. We conducted sensitivity analysis by changing the values of each parameter in step while keeping others constant and estimated the possible physical vulnerabilities of the building. The results are shown in Fig. 14.
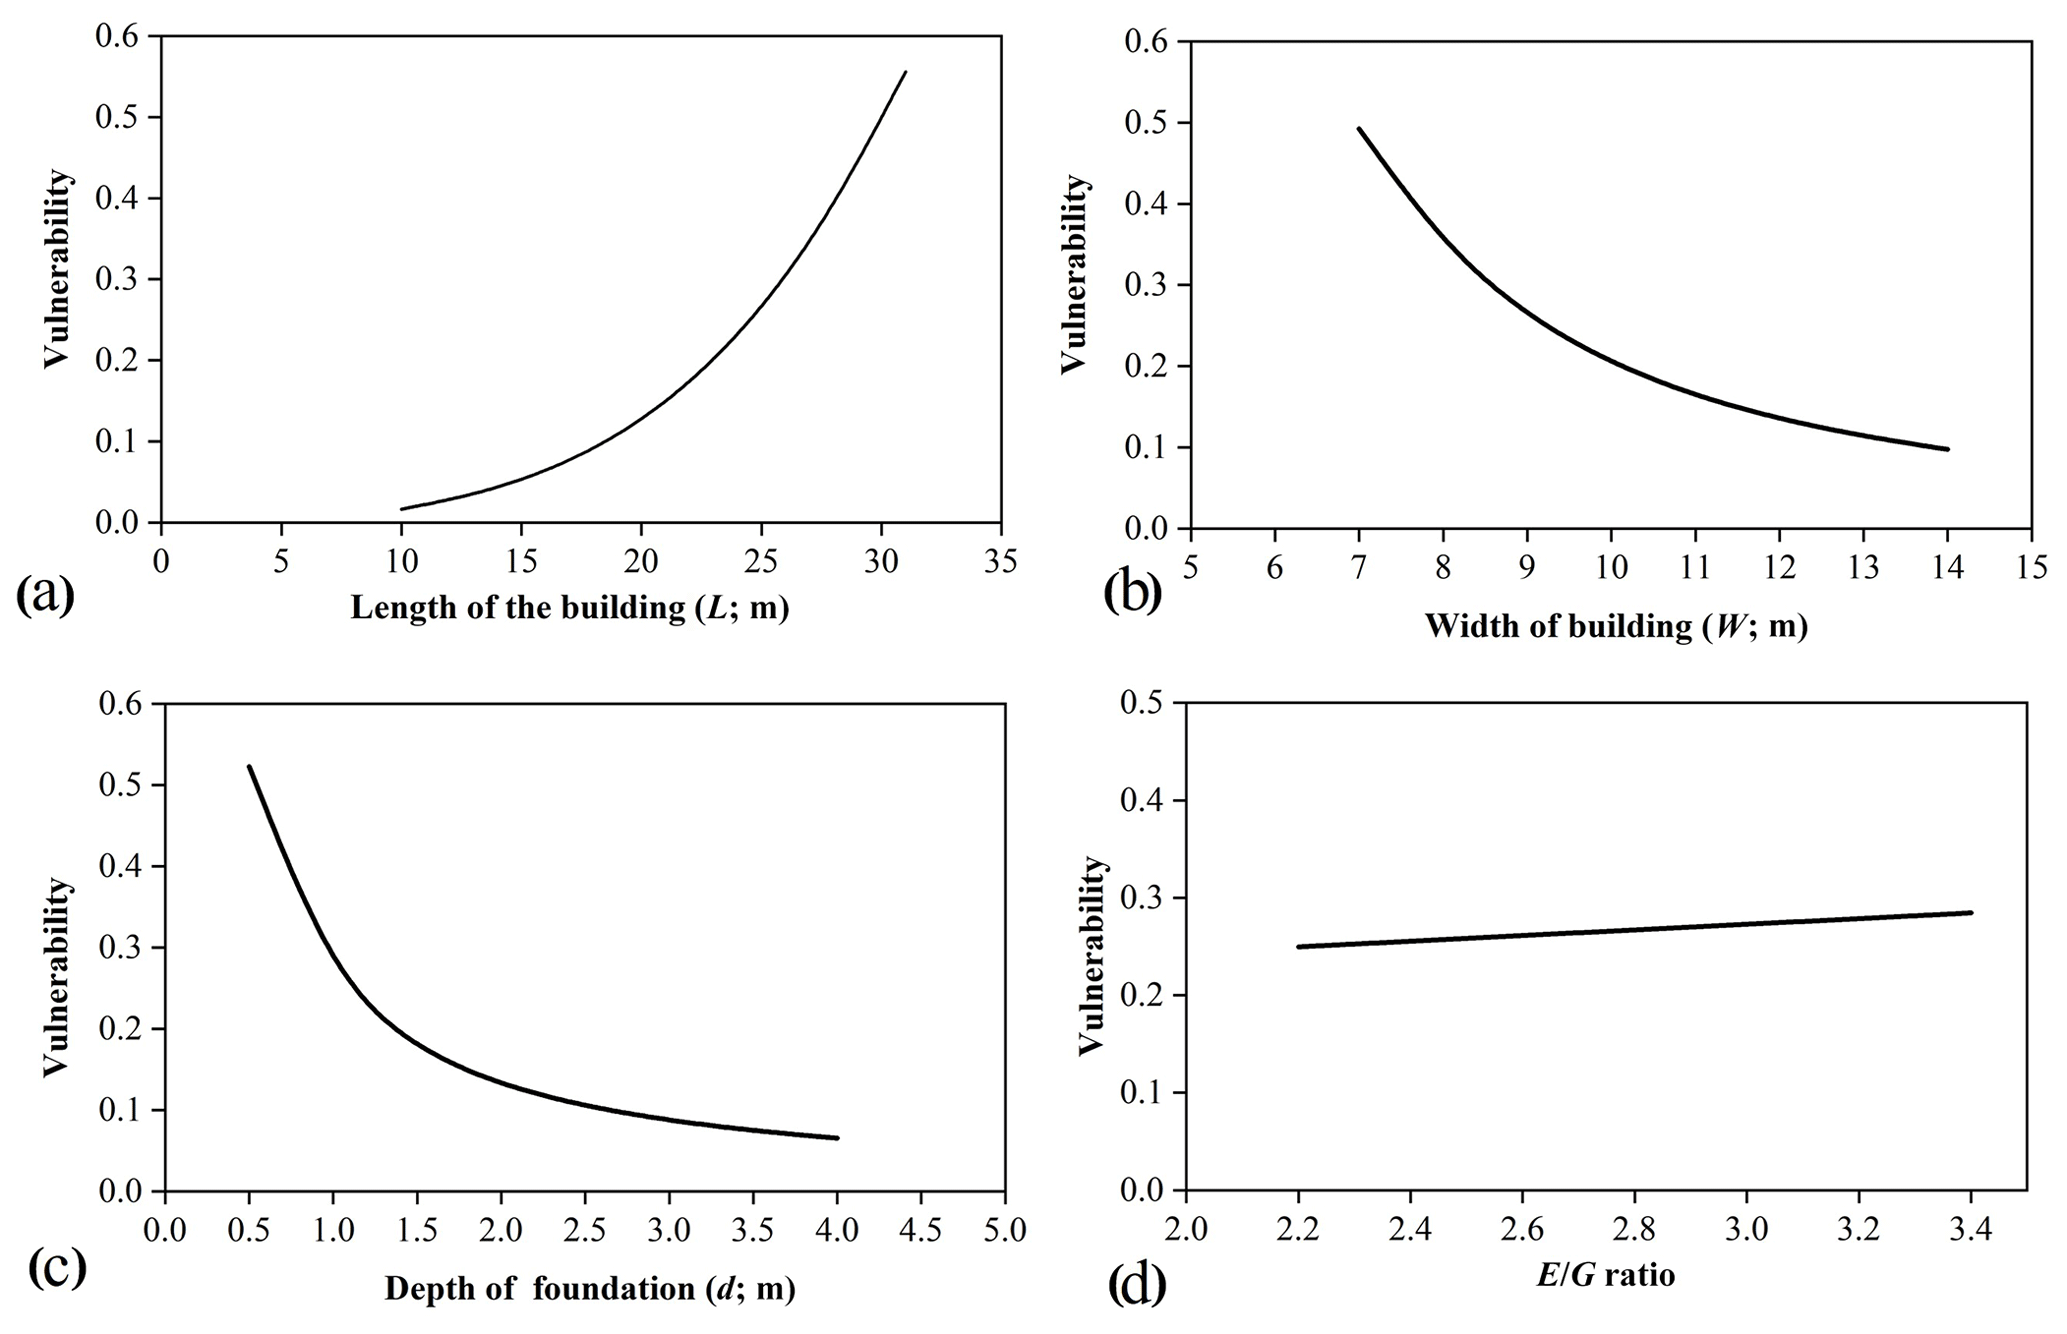
Figure 14Vulnerability curves for different building parameters: (a) length, (b) width, (c) depth of foundation, and (d) E∕G ratio.
As demonstrated in Fig. 14, we observe that the physical vulnerability is directly proportional to the building length and E∕G ratio and is inversely proportional to the other parameters: building width and foundation depth. It also shows that the higher the ratio of building length and width, the more vulnerable to damage the building is. Besides, buildings with deeper foundations and lower E∕G ratios have higher resistance.
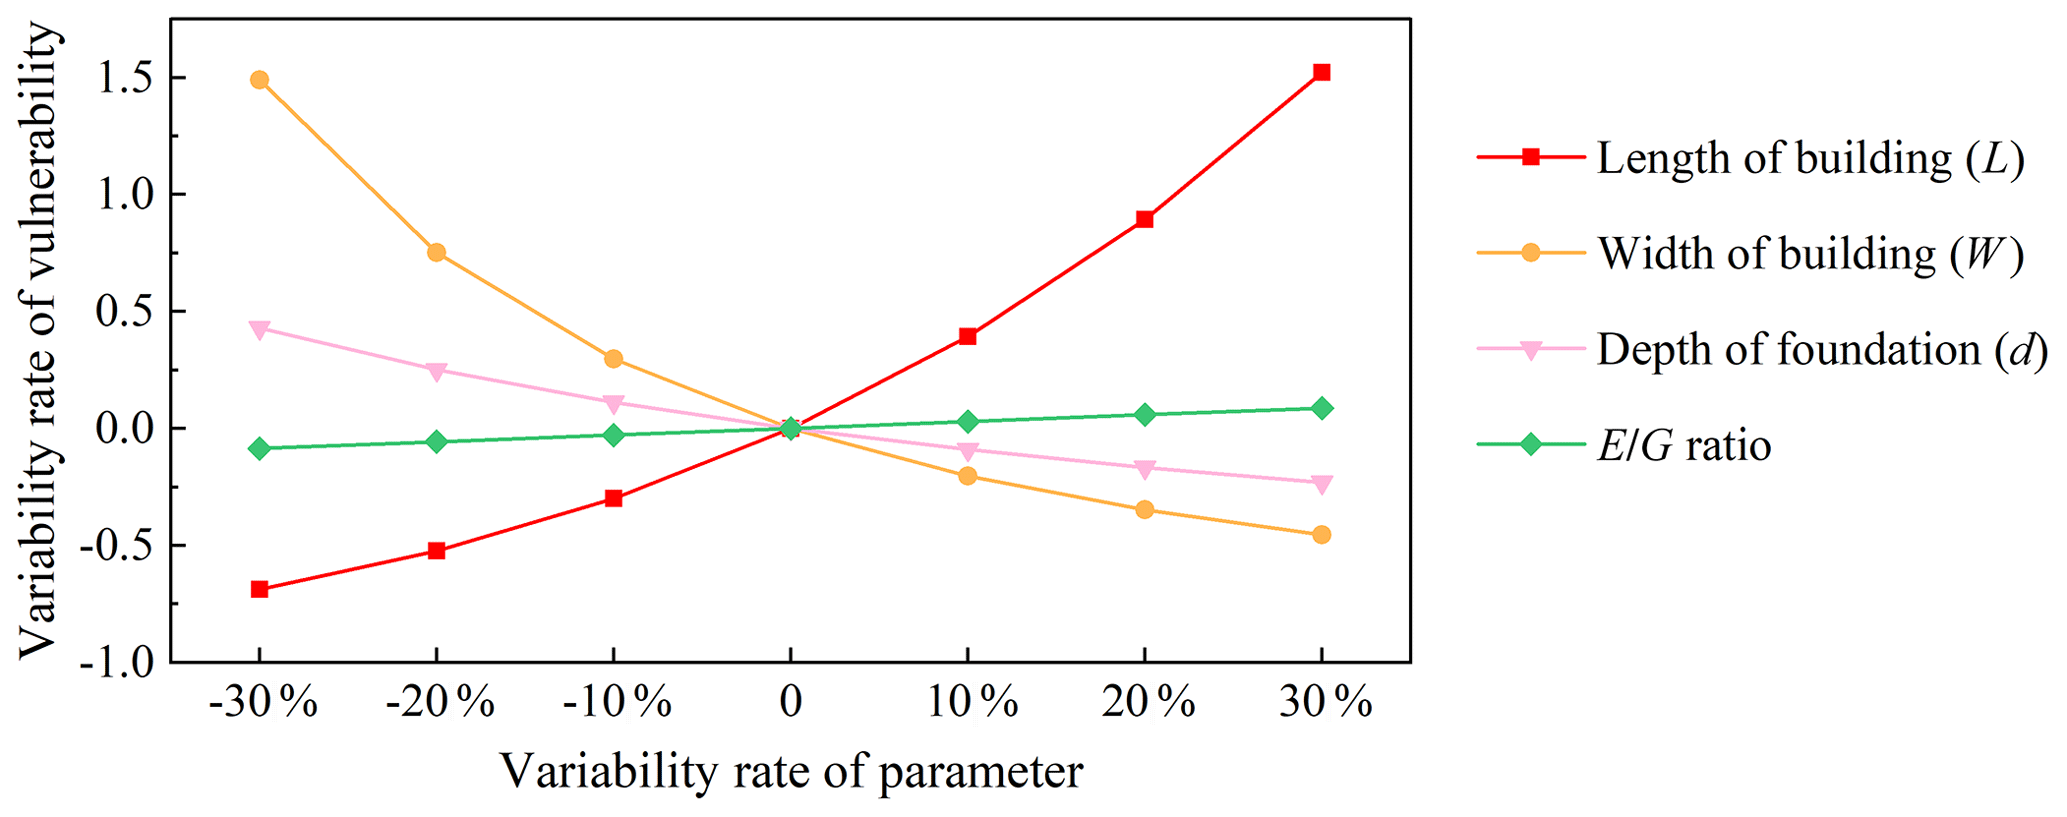
The results of the sensitivity analysis of the building parameters are demonstrated in Fig. 15. The red line that represents length has the steepest slope among all the lines, indicating that the length of the building has the most significant influence on the physical vulnerability of the building. We can simultaneously obtain the second major factor, that is, the width of the building, while the third one is the foundation depth.
We tested four types of buildings with different lengths: 15, 20, 25, and 30 m (Fig. 16a). When Fsb is greater than 1.0, the building physical vulnerability with any length is very low; that is, there is almost no damage. In addition, the building demonstrated a different performance when Fsb was less than 1.0. The building physical vulnerability with a length of 15 m was slightly increased when the landslide stability was becoming worse. However, the building physical vulnerability with a length of 30 m rapidly increased when Fsb was less than 1.0. This indicates that the buildings on the location where the target building stands have a length limit of 30 m. When the length of the building was greater than 30 m, the building faced severe damage if Fsb was less than 1.0.
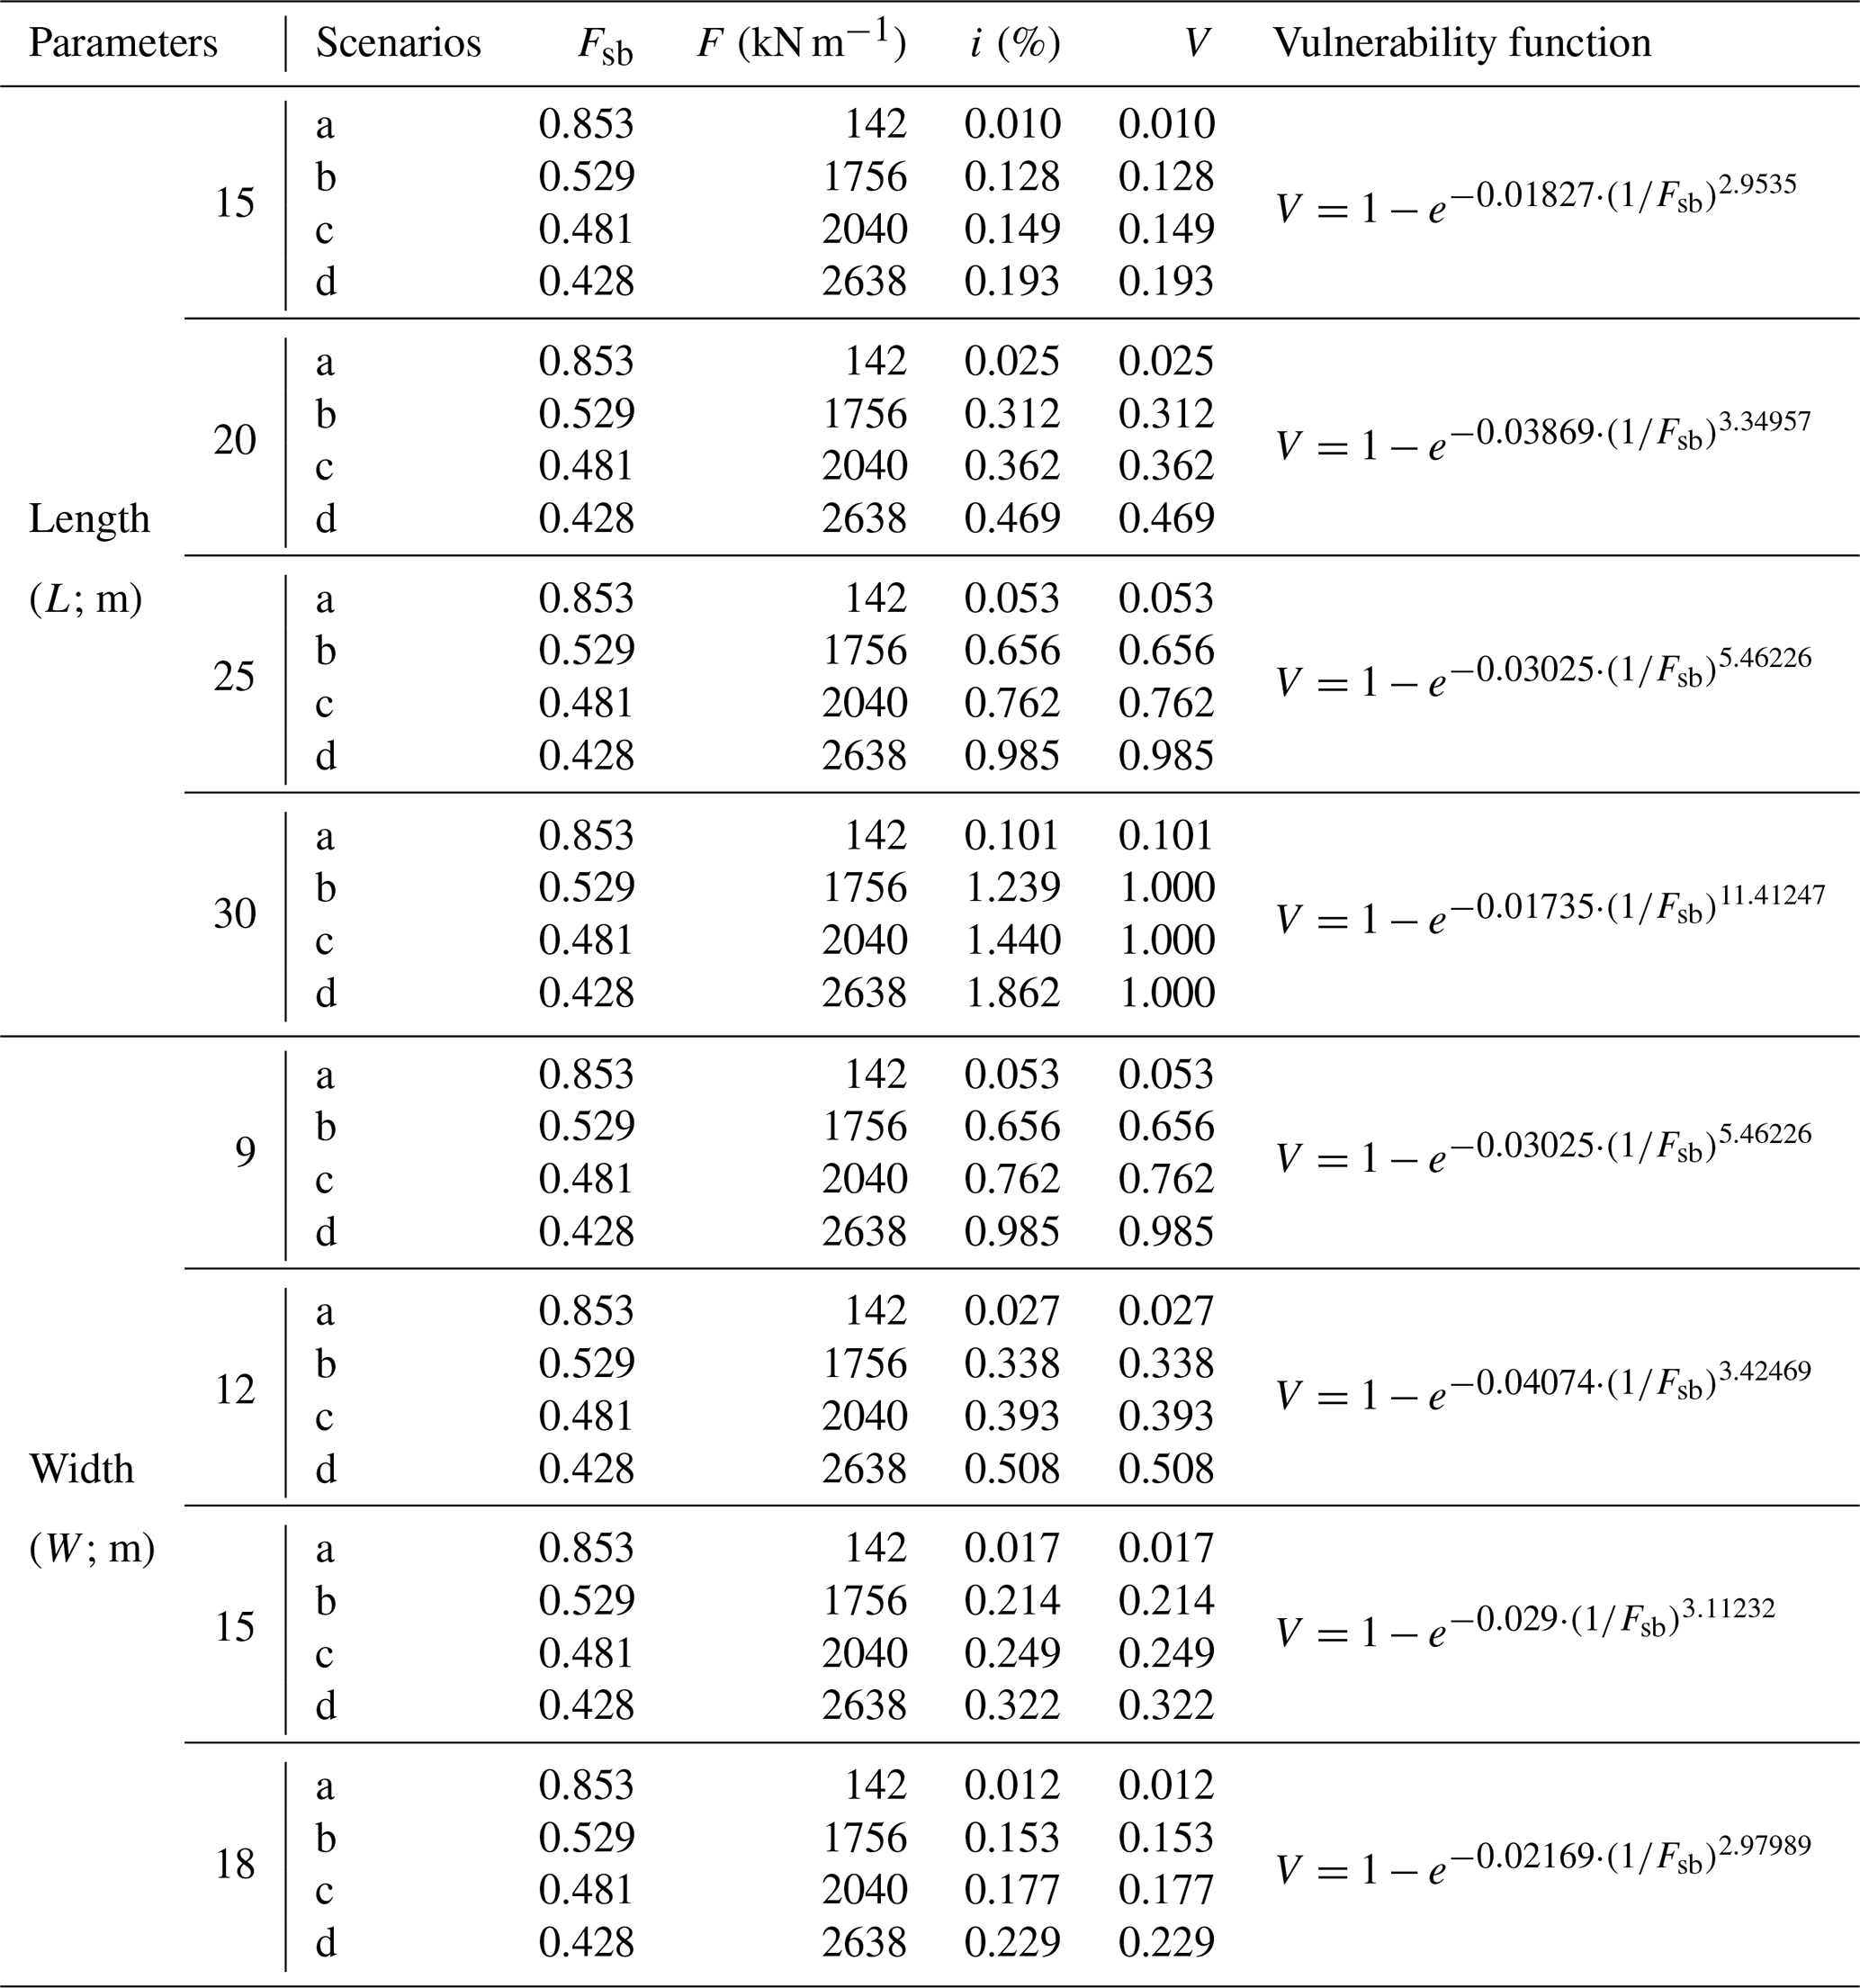
To further test the detailed influences of the building parameters, we select the top two parameters based on the above results of the sensitivity analysis: building length and width. Two sets of physical vulnerability curves are depicted in Fig. 16, and the corresponding functions of building physical vulnerability at the three scenarios are presented in Table 10.
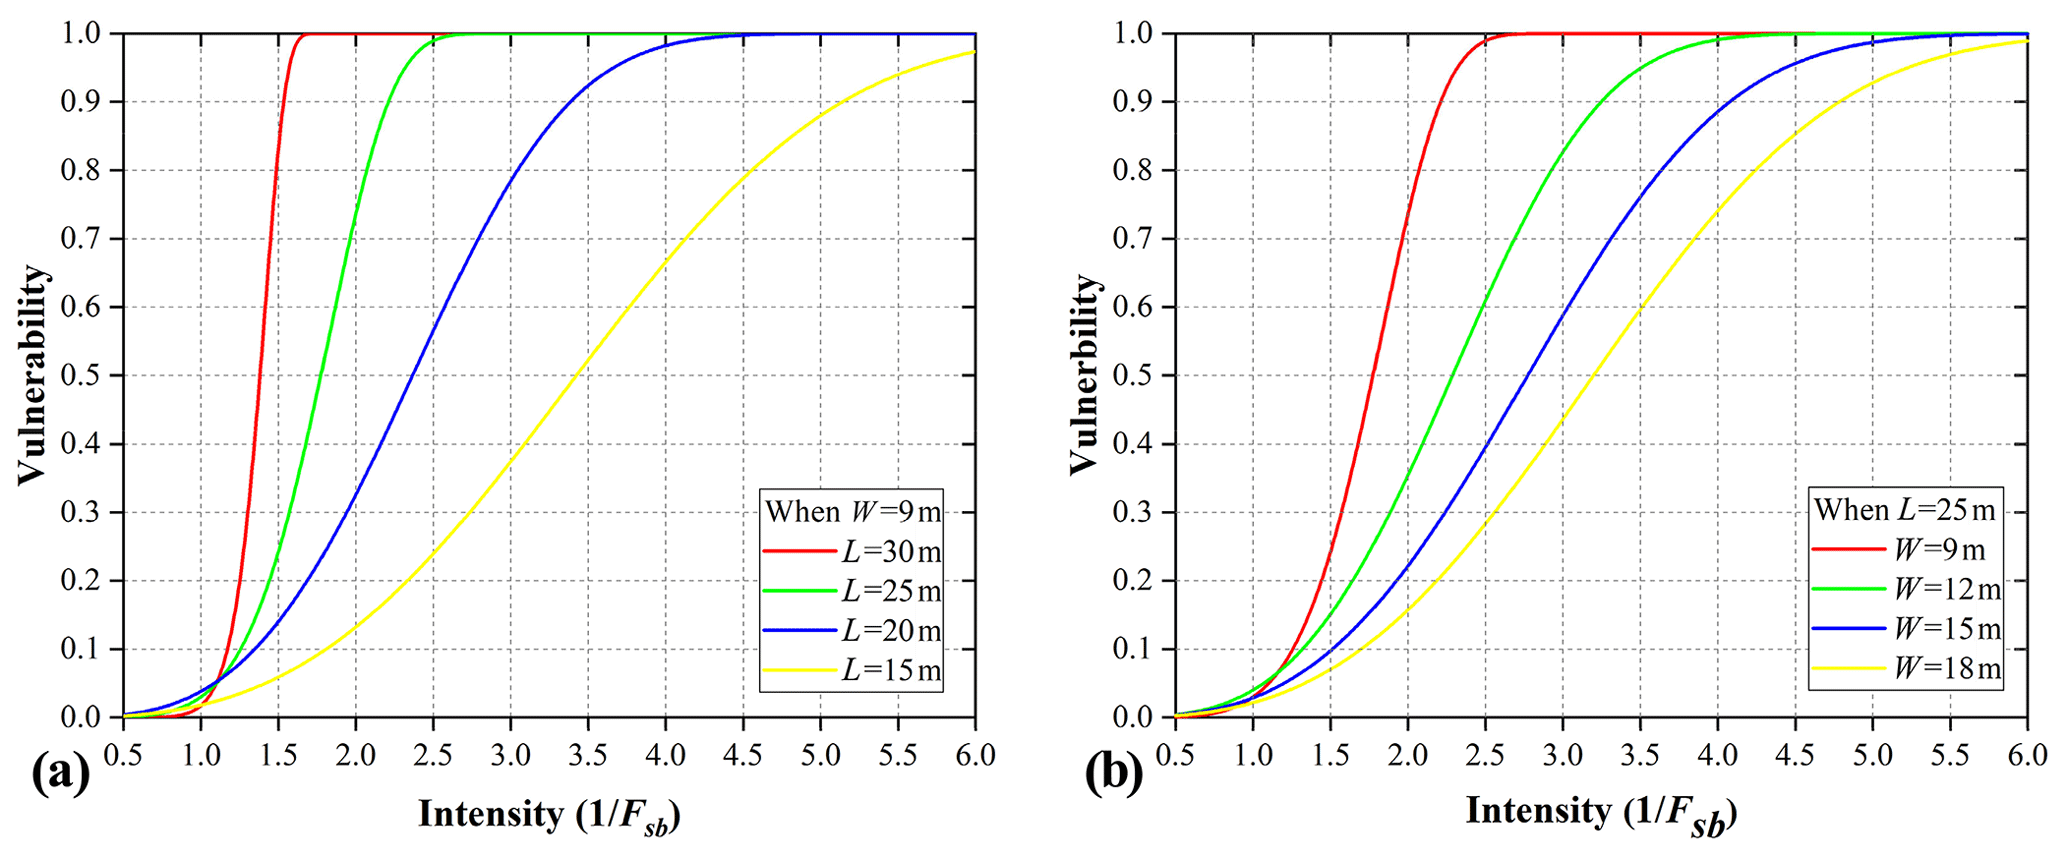
Figure 16Physical vulnerability curves of buildings with different parameters: (a) length and (b) width.
Table 10Physical vulnerability functions of buildings with different lengths and widths based on various scenarios.
Physical vulnerability curves of buildings with various building widths are depicted in Fig. 16b, while the physical vulnerability curves of buildings with various lengths are depicted in Fig. 16a. The difference in the physical vulnerability of the buildings with different building widths is not significant when the Fsb is greater than 1.0. Meanwhile, the building with a width of 9.0 m is susceptible to the changes in Fsb. A rapid increase in building damage with such a building width occurs when the Fsb is less than 1.0. When the building width is close to the building length, the vulnerability of the building is lower than other cases under the same value of Fsb.
We developed a scenario-based mechanical method for analysing the physical vulnerability of buildings on slow-moving landslides. The method enabled us to analyse the physical vulnerability from a mechanical perspective on soil–structure interaction, which can help us to better understand the building damage on the slow-moving landslides and is useful for the physical vulnerability assessment of masonry buildings located on slow-moving landslides. By inputting the geometry parameters (length and width of the building) and the safety factor of the area where buildings are located, the potential vulnerability can be obtained by using the vulnerability functions we provided in this study.
The results of the application correspond to the facts from the field investigation. As described in Sect. 3.2, the building damage occurred due to rainfall from 28 to 30 June 2016. The calculated physical vulnerability is observed to be 0.762 (Table 5), which is close to the real damage measured in the field which varied from 0.7 to 1.0 (Fig. 10a, b, and c). Herein, the influence of building parameters (length, width, height, foundation depth, etc.) on physical vulnerability corresponds to other previously conducted studies (Li et al., 2010; Du et al., 2013; Corominas et al., 2014). This is consistent with the study conducted by Corominas et al. (2014) in that the typology of buildings is a key factor in the quantification of physical vulnerability.
The vulnerability functions from this study are suitable for the masonry buildings which are located on slow-moving landslides and are perpendicular to the slope direction. The case study building is oriented along the contour lines of or nearly perpendicular to the direction of the slope or the landslide. If the building was oriented parallel to the slope direction, the damage would not have been so severe. This is revealed by the results obtained from the sensitivity analysis of building parameters in the assessment of vulnerability. In the case of buildings perpendicular to the slope direction, the larger the building length, the more serious the building's damage with the same force of landslide. The case study building (25 m long) showed much damage; it almost collapsed when the landslide occurred. Our study shows that the building length perpendicular to the sliding direction of the landslide should not be too large. We note that 30 m is the threshold value for the length of masonry buildings. Physical vulnerability will be decreased if the building width is increased and the length is decreased considerably (Fig. 14a and b). In this case the orientation of the building will be changed in such a way that the longest axis of the building is in the same direction as that of the slope. Therefore, we suggest that it is important to consider the building length-to-width ratio as well as the orientation of the buildings in land use planning for the development of settlements on sloping areas.
Since the output of physical vulnerability is related to the safety factor for the area where the building is located, it is possible to evaluate the physical vulnerability of buildings prone to slow-moving landslides at a regional scale. For instance, the distribution of safety factors can now be obtained from several studies (Muntohar and Liao, 2009; Apip et al., 2010; Salciarini et al., 2006; Sorbino et al., 2010). If we employ the physical vulnerability curves or the curves from this study, the risk can be quantified for the potential losses of buildings based on the Fsb analysis for landslides at a regional scale. But the application of physical vulnerability assessment at the regional scale should be tested first before implementing regional land use planning activities.
The research is based on detailed field investigation, monitoring, and analysis of a specific landslide and case building. Concerning the limitations of this study, it is important to mention that the results are applicable for areas with a similar geological background prone to slow-moving landslides or similar landslide displacement processes. The quantitative relationship between the physical vulnerability of buildings and the landslide displacement process has only been rarely studied around the world. It needs a greater concentration of studies. Moreover, the physical vulnerability assessment was carried out for the building which is located inside the landslide area for which soil pressure on the foundation is suitable. Our study does not include the estimation of vulnerability for the buildings which are located across the boundary of the landslide, the result of which may be a bit different. Also, we did not consider the friction between the foundation and soil and uncertainty analysis was not performed. In future studies, more relative mechanical models are required. Similarly, the random distribution of soil parameters for landslide Fs calculation, such as shear strength, can be considered for generating fragility curves based on this study. Currently, intensive research on slow-moving landslide vulnerability in the Three Gorges Reservoir (Zizheng et al., 2020) is being carried out, where the authors are applying our approach to more case studies. This approach will be verified and modified through continuing studies.
We propose a method for constructing physical vulnerability curves and functions by utilizing the analysis of the horizontal force of the landslide acting on the foundation and the physical response of the building. The proposed method was applied to slow-moving landslides in China, for which a severely damaged building was considered as the case study structure.
The proposed method mainly comprises calculating the landslide safety factor and horizontal load on foundations based on different scenarios (extreme rainfall with different return periods); the physical response of the foundation and the inclination of the building were also analysed. Finally, the physical vulnerability curves were generated by applying the Weibull function.
Good consistency between the estimated physical vulnerability and in-field damage evidence was observed in the case study building. The sensitivity analysis of the building characteristics revealed that building length and foundation depth are the main determining factors in the physical vulnerability to slow-moving landslides. The larger the building length, the higher the vulnerability. Apart from the length, the orientation of the building seems to be equally important. Thus the building length, especially if it is oriented perpendicularly to the sliding direction of the landslide, should not be too large. We hope that this study can be a useful supplement to the physical vulnerability estimation of buildings in areas prone to slow-moving landslides.
The study relied on two sets of data: (i) the data collected by the fieldwork and (ii) the detailed landslide investigation report (Chen et al., 2017) provided by the China Geological Survey (Hunan Institute of Xiangxi Geological Engineering Survey). However, the investigation report is not available online. If readers want to have the report, they can request it by e-mail from the authors.
QC and LC discussed the research plan, carried out the fieldwork, carried out the modelling part, and wrote the paper. QC prepared the figures for the paper. LC and KY supervised the research. LG and XC helped in modelling. LG and JD helped in data collection. DPS helped in research paper development and English writing.
The authors declare that they have no conflict of interest.
We want to thank the editor and the two anonymous reviewers for their constructive comments, which helped us to improve the quality of the article.
This research is supported by two projects: (i) the project titled “Studies on spatial–temporal differences in large accumulation landslide deformation and its vulnerability model for buildings in the Three Gorges reservoir” (grant no. 41877525) and (ii) the project titled “Study on the dynamic response of the quantitative vulnerability of buildings in different evolution stages of landslides” (grant no. 41601563), both of which are financed by the National Natural Science Foundation of China.
This paper was edited by Mario Parise and reviewed by two anonymous referees.
Abdulwahid, W. M. and Pradhan, B.: Landslide vulnerability and risk assessment for multi-hazard scenarios using airborne laser scanning data (LiDAR), Landslides, 14, 1057–1076, https://doi.org/10.1007/s10346-016-0744-0, 2017.
Alexander, D.: Landslide damage to buildings, Environ. Geol. Water S., 8, 147–151, 1986.
Antronico, L., Borrelli, L., Coscarelli, R., and Gullà, G.: Time evolution of landslide damages to buildings: the case study of Lungro (Calabria, southern Italy), Bull. Eng. Geol. Environ., 74, 47–59, https://doi.org/10.1007/s10064-014-0591-y, 2015.
Apip, Takara, K., Yamashiki, Y., Sassa, K., Ibrahim, A. B., and Fukuoka, H.: A distributed hydrological-geotechnical model using satellite-derived rainfall estimates for shallow landslide prediction system at a catchment scale, Landslides, 7, 237–258, https://doi.org/10.1007/s10346-010-0214-z, 2010.
Barlow, J. P.: Slope movement patterns in young valley slopes in Northern Alberta, Canada, in: Landslides in Research, Theory and Practice: Proceedings of the 8th International Symposium on Landslides, Cardiff, 26–30 June 2000.
Borrelli, L., Nicodemo, G., Ferlisi, S., Peduto, D., Di Nocera, S., and Gullà, G.: Geology, slow-moving landslides, and damages to buildings in the Verbicaro area (North-western Calabria region, southern Italy), J. Maps, 14, 32–44, https://doi.org/10.1080/17445647.2018.1425164, 2018.
Brooker, E. W. and Peck, R. B.: Rational design treatment of slides in overconsolidated clays and clay shales, Canadian Geotech. J., 30, 526–544, https://doi.org/10.1139/t93-045, 1993.
Burland, J. B. and Wroth, C. P.: Settlement of buildings and associated damage, Proc., Conf. on Settlement of Structures, Pentech Press, London, 611–654, 1974.
Burland, J. B., Broms, B. B., and Mello, V.: Behaviour of foundation and structures, Comportent des Foundations et des Structures, Proc., 9th Int. Conf. on Soil Mechanics and Foundation Engineering, II, State of the Art Report, Tokyo, 495–546, 1977.
Cascini, L., Calvello, M., and Grimaldi, G.: Modelling the transient groundwater regime for the displacements analysis of slowmoving active landslides, edited by: Chen et al., Proceedings, 10th International Symposium on Landslides and Engineered Slopes, Xi'an, China, 1, 607–613, 2008.
Chen, J., Rong, Y., Qiang, W., Jie, T., He, Z., Cao, H., Observatory, H. M., Service, C. M., Service, D. M., and Service, H. M.: Hazard rainfall threshold analysis of rainfall-induced geological disasters in Hunan Province, J. Catastroph., 29, 42–47, 2014.
Chen, L., Cao, X., Yin, K., Wu, Y., and Li, Y.: Physical vulnerability assessment for buildings impacted by a slow moving landslide based on field work and statistical modelling, Proceeding of 12th International Symposium on landslides, Volume 2, 12–19 June, Napoli, Italy, 2016.
Chen, W., Lei, L. Huang, C., Deng, Q., Peng, Y., Cui, S., and Zeng, J.: Detailed geological investigation report of Manjiapo landslide in Sangzhi County, Hunan Province, Hunan Institute of Xiangxi Geological Engineering Survey, Hunan, 2017.
China Railway Second Survey and Design Institute: Design and calculation of anti-slide pile, China Railway Publishing House, Bejing, 1983.
Chiocchio, C., Iovine, G., and Parise, M.: A proposal for surveying and classifying landslide damage to buildings in urban areas, Engineering geology and the environment, Proceedings of the international symposium on engineering geology and the environment, Athens, 23–27 June 1997, vol. 1, 553–558, 1997.
Ciurean, R. L., Schroter, D., and Glade, T.: Conceptual frameworks of vulnerability assessments for natural disasters reduction, edited by: Tiefenbacher, J. P., in: Approaches to Disaster Management – Examining the Implications of Hazards, Emergencies and Disasters, https://doi.org/10.5772/55538, 2013
Ciurean, R. L., Hussin, H., van Westen, C. J., Jaboyedoff, M., Nicolet, P., Chen, L., Frigerio, S., and Glade, T.: Multi-scale debris flow vulnerability assessment and direct loss estimation of buildings in the Eastern Italian Alps, Nat. Hazards, 85, 929–957, https://doi.org/10.1007/s11069-016-2612-6, 2017.
Clifton, A. W., Yoshida, R. T., and Chursinoff, R. W.: Regina Beach – a town on a landslide, Canadian Geotech. J., 23, 60–68, https://doi.org/10.1139/t86-007, 1986.
Cooper, A. H.: The classification, recording, databasing and use of information about building damage caused by subsidence and landslides, Quart. J. Eng. Geol. Hydrogeol., 41, 409–424, https://doi.org/10.1144/1470-9236/07-223, 2008.
Corominas, J., van Westen, C., Frattini, P., Cascini, L., Malet, J. P., Fotopoulou, S., Catani, F., Van Den Eeckhaut, M., Mavrouli, O., Agliardi, F., Pitilakis, K., Winter, M. G., Pastor, M., Ferlisi, S., Tofani, V., Hervás, J., and Smith, J. T.: Recommendations for the quantitative analysis of landslide risk, Bull. Eng. Geol. Environ., 73, 209–263, https://doi.org/10.1007/s10064-013-0538-8, 2014.
Cruden, D. M. and Varnes, D. J.: Landslide Types and Processes, Transportation Research Board, U.S. National Academy of Sciences, Special Report, 247, 36–75, 1996.
Dai, Z.: Study on distribution laws of landslide-Thrust and resistance of sliding mass acting on antislide piles, Chinese J. Rock Mech. Eng., 21, 517–521, https://doi.org/10.3321/j.issn:1000-6915.2002.04.013, 2002.
Del Soldato, M., Bianchini, S., Calcaterra, D., De Vita, P., Martire, D. Di, Tomás, R., and Casagli, N.: A new approach for landslide-induced damage assessment, Geomatics Nat. Hazards Risk, 8, 1524–1537, https://doi.org/10.1080/19475705.2017.1347896, 2017.
Dong, J., Liao, M., Xu, Q., Zhang, L., Tang, M., and Gong, J.: Detection and displacement characterization of landslides using multi-temporal satellite SAR interferometry: A case study of Danba County in the Dadu River Basin, Eng. Geol., 240, 95–109, https://doi.org/10.1016/j.enggeo.2018.04.015, 2018.
Douglas, J.: Physical vulnerability modelling in natural hazard risk assessment, Nat. Hazards Earth Syst. Sci., 7, 283–288, https://doi.org/10.5194/nhess-7-283-2007, 2007.
Du, J., Yin, K., Nadim, F., and Lacasse, S.: Quantitative vulnerability estimation for individual landslides, Proceedings of the 18th international conference on soil mechanics and geotechnical engineering, Paris, 2181–2184, ICSMGE, 2013.
Esser, A. J.: Case of a slope failure in lacustrine deposits, in: Landslides in Research, Theory and Practice: Proceedings of the 8th International Symposium on Landslides, Cardiff, 26–30 June, 2000.
Faella, C. and Nigro, E.: Dynamic impact of the debris flows on the constructions during the hydrogeological disaster in Campania-1998: failure mechanical models and evaluation of the impact velocity, in: Proceedings of the International Conference on “Fast Slope Movements-Prediction and Prevention for Risk Mitigation”, May, 2003, Patron Editore, Napoli, 179–186, 2003.
Fang, Q., Chen, Q., and Wu, L.: Analysis of rainstorm-induced geological disasters in Hunan Province and its enlightenment for disaster prevention, J. Inst. Disast. Prevent., 20, 52–59, 2018.
Fell, R., Corominas, J., Bonnard, C., Cascini, L., Leroi, E., and Savage, W. Z.: Guidelines for landslide susceptibility, hazard and risk zoning for land-use planning, Eng. Geol., 102, 85–111, https://doi.org/10.1016/j.enggeo.2008.03.014, 2008.
FEMA: HAZUS-MH, Technical manual, Federal Emergency Management agency, Washington DC, 2003.
Ferlisi, S., Peduto, D., Gullà, G., Nicodemo, G., Borrelli, L., and Fornaro, G.: The use of DInSAR data for the analysis of building damage induced by slow-moving landslides, edited by: Lollino G. et al., in: Engineering Geology for Society and Territory, Volume 2, Springer, Cham, https://doi.org/10.1007/978-3-319-09057-3_325, 2015.
Ferlisi, S., Gullà, G., Nicodemo, G., and Peduto, D.: A multi-scale methodological approach for slow-moving landslide risk mitigation in urban areas, southern Italy, Euro-Mediterranean, J. Environ. Integr., 4, 20, https://doi.org/10.1007/s41207-019-0110-4, 2019.
Finno, R. J., Voss, F. T., Rossow, E., and Blackburn, J. T.: Evaluating damage potential in buildings affected by excavations, J. Geotech. Geoenviron. Eng., 131, https://doi.org/10.1061/(asce)1090-0241(2005)131:10(1199), 2005.
General Administration of Quality Supervision, Inspection and Quarantine of the PRC: Code for geological investigation of landslide prevention, Standards Press of China, Beijing, 2016.
Gere, J. and Timoshenko, S.: Mechanics of Materials, Second edition, Wadsworth, Inc., California, 1984.
Godfrey, A., Ciurean, R. L., van Westen, C. J., Kingma, N. C., and Glade, T.: Assessing vulnerability of buildings to hydro-meteorological hazards using an expert based approach – An application in Nehoiu Valley, Romania, Int. J. Disaster Risk Reduct., 13, 229–241, https://doi.org/10.1016/j.ijdrr.2015.06.001, 2015.
Guillard-Gonçalves, C., Zêzere, J. L., Pereira, S., and Garcia, R. A. C.: Assessment of physical vulnerability of buildings and analysis of landslide risk at the municipal scale: application to the Loures municipality, Portugal, Nat. Hazards Earth Syst. Sci., 16, 311–331, https://doi.org/10.5194/nhess-16-311-2016, 2016.
Guo, Z., Chen, L., Yin, K., Shrestha, D. P., and Zhang, L: Quantitative risk assessment of slow-moving landslides from the viewpoint of decision-making: A case study of the Three Gorges Reservoir, Eng. Geol., 273, https://doi.org/10.1016/j.enggeo.2020, 2020.
Huang, L., Xiao, Z., Nie, W., Shi, Y., and Yang, J.: Assessment of building impacted by tunnel construction based on the statistical analysis, Chinese J. Underground Space Eng., 11, 1310–1315, 2015.
Huang, W., Fang, Q., Wang, G. W., and Ming-Bo, L. I.: Preliminary study on the critical rainfall for landslide space early warning in chaling county of Hunan province, Chinese J. Geol. Hazard Cont., 25, 38–42, 2014.
Infante, D., Confuorto, P., Di Martire, D., Ramondini, M., and Calcaterra, D.: Use of DInSAR data for multi-level vulnerability assessment of urban settings affected by slow-moving and intermittent landslides, Procedia Engineering, 158, 470–475, https://doi.org/10.1016/j.proeng.2016.08.474, 2016.
Jworchan, I., O'Brien, A., and Rizakalla, E.: Landslide stabilization for residential development, edited by: Chen et al., Proceedings, 10th International Symposium on Landslides and Engineered Slopes, Xi'an, China, 2, 1757–1763, 2008.
Kang, H. and Kim, Y.: The physical vulnerability of different types of building structure to debris flow events, Nat. Hazards, 80, 1475–1493, https://doi.org/10.1007/s11069-015-2032-z, 2016.
King, A. and Bell, R.: RiskScape New Zealand: A multihazard loss modelling tool, Proc. of the International Conference on Earthquake Engineering, Earthquake Engineering in the 21st Century IZIIS 40EE‐21C, Skopje/Ohrid, Macedonia, vol. 8, 2005.
Lei, G. J., Yin, J. X., Wang, W. C., and Wang, H.: The analysis and improvement of the fuzzy weighted optimum curve-fitting method of Pearson – Type III Distribution, Water Res. Manag., 32, 4511–4526, https://doi.org/10.1007/s11269-018-2055-9, 2018.
Li, Z., Nadim, F., Huang, H., Uzielli, M., and Lacasse, S.: Quantitative vulnerability estimation for scenario-based landslide hazards, Landslides, 7, 125–134, https://doi.org/10.1007/s10346-009-0190-3, 2010.
Liang, Y. and Xiong, F.: Quantification of debris flow vulnerability of typical bridge substructure based on impact force simulation, Geomatics Nat. Hazards Risk, 10, 1839–1862, https://doi.org/10.1080/19475705.2019.1641564, 2019.
Lin, W., Li, Y., Xu, Y., Lian, Z., Cao, Y., and Sheng, Y.: Rainfall Thresholds of Rainfall-triggered Landslides in Cili County, Hunan Province, Journal of Yangtze River Scientific Research Institute, 37, 48–54, https://doi.org/10.11988/ckyyb.20181125, 2020.
Lu, P., Catani, F., Tofani, V., and Casagli, N.: Quantitative hazard and risk assessment for slow-moving landslides from Persistent Scatterer Interferometry, Landslides, 11, 685–696, https://doi.org/10.1007/s10346-013-0432-2, 2014.
Luna, B. Q., Blahut, J., Camera, C., Westen, C. Van, Apuani, T., Jetten, V., and Sterlacchini, S.: Physically based dynamic run-out modelling for quantitative debris flow risk assessment: a case study in Tresenda, northern Italy, Environ. Earth Sci., 72, 645–661, https://doi.org/10.1007/s12665-013-2986-7, 2014.
Mansour, M. F., Morgenstern, N. R., and Martin, C. D.: Expected damage from displacement of slow-moving slides, Landslides, 8, 117–131, https://doi.org/10.1007/s10346-010-0227-7, 2011.
Mavrouli, O., Giannopoulos, P. G., Carbonell, J. M., and Syrmakezis, C.: Damage analysis of masonry structures subjected to rockfalls, Landslides, 14, 891–904, https://doi.org/10.1007/s10346-016-0765-8, 2017.
Ministry of Construction of the PRC: Code of Deformation Measurement of Building and Structure, China Architecture & Building Press, Beijing, 2007.
Ministry of Housing and Urban–Rural Development of PRC: Code for design of masonry structures, China Architecture & Building Press, Beijing, 2011.
Ministry of Housing and Urban–Rural Development of PRC: Technical Specification for Incline-rectifying of Buildings, China Architecture & Building Press, Beijing, 2012.
Ministry of Housing and Urban–Rural Development of PRC: Techinical code for building slope engineering, China Architecture & Building Press, Beijing, 2013.
Ministry of Housing and Urban–Rural Development of PRC: Standard for dangerous building appraisal, China Architecture & Building Press, Beijing, 2016.
Ministry of Land and Resources of the PRC: Specification of Risk Assessment for Geological Hazard, Geological Publishing House, Beijing, 2015.
Moore, D. P., Watson, A. D., and Martin, C. D.: September. Deformation mechanism of a large rockslide inundated by a reservoir, in: Proceedings of JTC Workshop on the Mechanics and Velocity of Large Landslides, Courmayeur, Italy, 25–28 September 2006.
Muntohar, A. S. and Liao, H. J.: Analysis of rainfall-induced infinite slope failure during typhoon using a hydrological-geotechnical model, Environ. Geol., 56, 1145–1159, https://doi.org/10.1007/s00254-008-1215-2, 2009.
Negulescu, C. and Foerster, E.: Parametric studies and quantitative assessment of the vulnerability of a RC frame building exposed to differential settlements, Nat. Hazards Earth Syst. Sci., 10, 1781–1792, https://doi.org/10.5194/nhess-10-1781-2010, 2010.
Nicodemo, G., Peduto, D., Ferlisi, S., Gullà, G., Borrelli, L., Fornaro, G., and Reale, D.: Analysis of building vulnerability to slow-moving landslides via A-DInSAR and damage survey data, in: Advancing Culture of Living with Landslides, WLF 2017, Springer, Cham, 899–907, https://doi.org/10.1007/978-3-319-53498-5_102, 2017.
Nicodemo, G., Ferlisi, S., Peduto, D., Aceto, L., and Gullà, G.: Damage to masonry buildings interacting with slow-moving landslides: A numerical analysis, Geotechnical Research for Land Protection and Development, CNRIG 2019, Lecture Notes in Civil Engineering, Springer, Cham, vol. 40, 52–61, https://doi.org/10.1007/978-3-030-21359-6_6, 2020.
Nie, W. N., Zhang, L., and Hu, J.: Study on designed thrust of anti-slide pile, Chinese J. Rock Mech. Eng., 23, 5050–5052, 2004.
Papathoma-Köhle, M., Zischg, A., Fuchs, S., Glade, T., and Keiler, M.: Loss estimation for landslides in mountain areas – An integrated toolbox for vulnerability assessment and damage documentation, Environ. Model. Software, 63, 156–169, https://doi.org/10.1016/j.envsoft.2014.10.003, 2015.
Peduto, D., Ferlisi, S., Nicodemo, G., Reale, D., Pisciotta, G., and Gullà, G.: Empirical fragility and vulnerability curves for buildings exposed to slow-moving landslides at medium and large scales, Landslides, 14, 1993–2007, https://doi.org/10.1007/s10346-017-0826-7, 2017.
Peduto, D., Nicodemo, G., Caraffa, M., and Gullà, G.: Quantitative analysis of consequences to masonry buildings interacting with slow-moving landslide mechanisms: a case study, Landslides, 15, 2017–2030, https://doi.org/10.1007/s10346-018-1014-0, 2018.
Radwan, F., Alazba, A. A., and Mossad, A.: Flood risk assessment and mapping using AHP in arid and semiarid regions, Acta Geophys., 67, 215–229, https://doi.org/10.1007/s11600-018-0233-z, 2019.
Salciarini, D., Godt, J. W., Savage, W. Z., Conversini, P., Baum, R. L. and Michael, J. A.: Modeling regional initiation of rainfall-induced shallow landslides in the eastern Umbria Region of central Italy, Landslides, 3, 181, https://doi.org/10.1007/s10346-006-0037-0, 2006.
Sedan, O., Negulescu, C., Terrier, M., Roulle, A., Winter, T., and Bertil, D.: Armagedom – A tool for seismic risk assessment illustrated with applications, J. Earthquake Eng., 17, 253–281, https://doi.org/10.1080/13632469.2012.726604, 2013.
Singh, V. P. and Singh, K.: Parameter estimation for Log-pearson type III distribution by POME, J. Hydraulic Eng., 114, 1, https://doi.org/10.1061/(asce)0733-9429(1988)114:1(112), 1988.
Sorbino, G., Sica, C., and Cascini, L.: Susceptibility analysis of shallow landslides source areas using physically based models, Nat. Hazards, 53, 313–332, https://doi.org/10.1007/s11069-009-9431-y, 2010.
Sterlacchini, S., Frigerio, S., Giacomelli, P., and Brambilla, M.: Landslide risk analysis: a multi-disciplinary methodological approach, Nat. Hazards Earth Syst. Sci., 7, 657–675, https://doi.org/10.5194/nhess-7-657-2007, 2007.
Tarbotton, C., Dall'osso, F., Dominey-Howes, D., and Goff, J.: The use of empirical vulnerability functions to assess the response of buildings to tsunami impact: comparative review and summary of best practice, Earth Sci. Rev., 142, 120–134, doi.org/10.1016/j.earscirev.2015.01.002, 2015.
Totschnig, R., Sedlacek, W., and Fuchs, S.: A quantitative vulnerability function for fluvial sediment transport, Nat. Hazards, 58, 681–703, 2011.
UNDRO: Disaster prevention and mitigation: a compendium of current knowledge/Office of the United Nations Disaster Relief Co-ordinator, United Nations, Geneva, 1984.
Uzielli, M., Catani, F., Tofani, V., and Casagli, N.: Risk analysis for the Ancona landslide – I: characterization of landslide kinematics, Landslides, 12, 69–82, https://doi.org/10.1007/s10346-014-0474-0, 2015a.
Uzielli, M., Catani, F., Tofani, V., and Casagli, N.: Risk analysis for the Ancona landslide – II: estimation of risk to buildings, Landslides, 12, 83–100, https://doi.org/10.1007/s10346-014-0477-x, 2015b.
van Westen, C. J., van Asch, T. W. J., and Soeters, R.: Landslide hazard and risk zonation – Why is it still so difficult?, Bull. Eng. Geol. Environ., 65, 167–184, https://doi.org/10.1007/s10064-005-0023-0, 2006.
Varnes, D.: Landslide hazard zonation: a review of principles and practice, Nat. Hazards, 3, 61 pp., 1984.
Wang, S., Wu, W., Wang, J., Yin, Z., Cui, D., and Xiang, W.: Residual-state creep of clastic soil in a reactivated slow-moving landslide in the Three Gorges Reservoir Region, China, Landslides, 15, 2413–2422, https://doi.org/10.1007/s10346-018-1043-8, 2018.
Weibull, W.: A statistical distribution function of wide applicability, J. Appl. Mech., 18, 293–297, 1951.
Winter, M. G., Smith, J. T., Fotopoulou, S., Pitilakis, K., Mavrouli, O., Corominas, J., and Argyroudis, S.: An expert judgement approach to determining the physical vulnerability of roads to debris flow, Bull. Eng. Geol. Environ., 73, 291–305, https://doi.org/10.1007/s10064-014-0570-3, 2014.
Wu, Y. U., Liu, D. S., Lu, X., and Song, Q. H.: Vulnerability assessment model for hazard bearing body and landslide risk index, Rock Soil Mech., 32, 2487–2493, https://doi.org/10.3969/j.issn.1000-7598.2011.08.039, 2011.
Zhang, Y., Meng, X., Jordan, C., Novellino, A., Dijkstra, T., and Chen, G.: Investigating slow-moving landslides in the Zhouqu region of China using InSAR time series, Landslides, 15, 1299–1315, https://doi.org/10.1007/s10346-018-0954-8, 2018.