the Creative Commons Attribution 4.0 License.
the Creative Commons Attribution 4.0 License.
 | 22 Sep 2020
The object-specific flood damage database HOWAS 21
Patric Kellermann
Kai Schröter
Annegret H. Thieken
Sören-Nils Haubrock
Heidi Kreibich
The Flood Damage Database HOWAS 21 contains object-specific flood damage data resulting from fluvial, pluvial and groundwater flooding. The datasets incorporate various variables of flood hazard, exposure, vulnerability and direct tangible damage at properties from several economic sectors. The main purpose of development of HOWAS 21 was to support forensic flood analysis and the derivation of flood damage models. HOWAS 21 was first developed for Germany and currently almost exclusively contains datasets from Germany. However, its scope has recently been enlarged with the aim to serve as an international flood damage database; e.g. its web application is now available in German and English. This paper presents the recent advancements of HOWAS 21 and highlights exemplary analyses to demonstrate the use of HOWAS 21 flood damage data. The data applications indicate a large potential of the database for fostering a better understanding and estimation of the consequences of flooding.
- Article
(2881 KB) - Full-text XML
-
Supplement
(297 KB) - BibTeX
- EndNote


Natural hazard damage data are an essential component for ex post event analysis, response and recovery as well as for risk assessment and management (Hübl et al., 2002). De Groeve et al. (2014) identify four main application areas for damage data, i.e. damage compensation, damage accounting, forensic analyses and risk modelling. Damage compensation refers to the use of damage databases for compensation mechanisms. For example, the European Union Solidarity Fund (EUSF) requires damage data for the substantiation of claims. Damage accounting is an application area aiming at the documentation of damage trends as well as the evaluation of risk reduction policies and is often done on national or international levels using, for example, the global Emergency Events Database (EM-DAT, https://www.emdat.be/, last access: 10 September 2020, e.g. Barredo, 2009). Forensic analyses are performed to improve the understanding of risk dynamics and quantify the relative contribution of risk drivers such as hazard, exposure, vulnerability and coping capacity to the overall damage. Finally, damage data are used to derive damage models for the assessment of risk, i.e. for estimating damage associated with various flood scenarios. In general, the data needs for these four application areas are overlapping, whereby, however, the forensic analyses and the risk modelling require a higher level of detail, particularly object-specific damage data including comprehensive information about hazard, exposure and vulnerability characteristics.
With respect to forensic flood analyses, Grigg and Helweg (1975) identified water depth and object type (e.g. residential building) as the most important damage-influencing factors, already in the 1970s. However, reported water depth and resulting object-specific damage usually show large scatter, and thus it is obvious that flood damage is influenced by more drivers besides water depth and object type (Blong, 2004; Merz et al., 2004). The following damage-influencing factors were identified, e.g. flow velocity, duration of inundation, contamination of floodwater, availability and information content of flood warning, and the quality of external response in a flood situation (Penning-Rowsell and Green, 2000; Kreibich et al., 2005, 2009; Thieken et al., 2005; Totschnig and Fuchs, 2013). Thieken et al. (2005) and Merz et al. (2013) investigated single and joint effects of impact (i.e. flood characteristics) and resistance variables (e.g. building type) on flood damage ratios in the residential sector. However, forensic knowledge on flood damage processes is still scarce and quantitative information about damage drivers is fragmented (Kreibich et al., 2019). Damage models developed on the basis of this information are highly uncertain, particularly when transferred in time and space (Cammerer et al., 2013; Wagenaar et al., 2018). Conventionally, flood damage is estimated with depth–damage functions, which relate the water depth at the affected object to the damage grade or absolute damage (Grigg and Helweg, 1975; Smith, 1994). As interesting advancements, multivariable flood damage models were proposed, which consider a variety of damage-influencing variables and their interdependency: using multivariate generalised regression (Mohor et al., 2020; Van Ootegem et al., 2015; Zhai et al., 2005), rule-based models (Elmer et al., 2010b; Kreibich et al., 2010; Thieken et al., 2008) and tree-based approaches (Carisi et al., 2018; Hasanzadeh Nafari et al., 2016; Kreibich et al., 2017a). Most recent innovations are probabilistic damage models, e.g. based on Bayesian networks (Lüdtke et al., 2019; Wagenaar et al., 2018) or Bayesian regression (Rözer et al., 2019). Their main advantage is that by returning predictive distributions instead of deterministic point estimates, they inherently provide uncertainty information together with their damage predictions.
The problem of quite fragmented forensic knowledge on flood damage processes and uncertain flood damage models is also due to the fact that reliable and detailed flood damage data are scarcely available, and individual datasets often stem from one event only (e.g. Wagenaar et al., 2016; Blong, 2004; Mazzorana et al., 2014). Funding for scientific flood damage data acquisition is limited and not readily available after flood events. Damage data surveyed by governmental agencies and insurance companies in the framework of loss compensation commonly contain only limited information on damage drivers and are hardly made available mainly for reasons of privacy protection. Thus, anonymising, homogenising and bringing datasets from various stakeholders together in one database is very helpful for all flood risk professionals, in administration, the insurance industry, consultancy and science.
The objective of this paper is the presentation of the object-specific flood damage database HOWAS 21 (https://doi.org/10.1594/GFZ.SDDB.HOWAS21) and its recent advancement towards an international database. Additionally, it highlights exemplary data analyses to demonstrate the use of the HOWAS 21 flood damage data. The main objective of the flood damage database HOWAS 21 is to harmonise and integrate existing datasets of object-specific flood damage data and to provide these data to its users under a community-based use concept. It was established at the German Research Centre for Geosciences (GFZ) in 2007 as an object-specific flood damage database for Germany and incorporates object-specific flood damage data for a variety of economic sectors resulting from fluvial, pluvial and groundwater flooding (Thieken et al., 2009). HOWAS 21 particularly aims to support (1) forensic flood damage analyses and (2) the derivation of flood damage models. This paper builds on the book chapter of Kreibich et al. (2017b) but particularly highlights the new enhancement of HOWAS 21 and presents an expanded exemplification of possible analyses in its two application fields using the HOWAS 21 data as a basis. After giving an overview of prominent flood damage databases (Sect. 2), a general description of the database concept and structure, the technical design, and the data sources of HOWAS 21 is given in Sect. 3. Subsequently, descriptive statistics of available flood damage data in HOWAS 21 are shown, and a variety of exemplary analyses in the application areas of forensic flood damage analyses and damage model derivation are performed and discussed with regard to usefulness of the object-specific flood damage data (Sect. 4). Finally, conclusions are given (Sect. 5).
Depending on the intended application areas, damage databases vary significantly with respect to their scope (spatial coverage) and their scale (granularity) of recording natural hazard damage data (de Groeve et al., 2014). Many of the existing natural hazard damage databases, which also include flood damage, are event-specific at the national scale; i.e. such databases usually contain damage costs per event aggregated to the national level. This type of damage data provides a suitable basis for ex-post analysis of disastrous events (Hübl et al., 2002) as well as for damage accounting, e.g. trend analyses investigating whether damage due to natural hazards increases over time (Bouwer, 2011).
2.1 Global scope
Prominent examples of global event-specific damage databases are the NatCatSERVICE database of Munich Re (https://www.munichre.com/en.html last access: 10 September 2020; Kron et al., 2012) and the EM-DAT. The NatCatSERVICE database contains overall and insured damage figures and fatalities of natural catastrophes around the globe. The natural events are classified in geophysical (e.g. earthquake), meteorological (e.g. windstorm), hydrological (e.g. flood, mudflow), and climatological events (e.g. extreme temperature, drought, wildfire). The EM-DAT comprises global data on the occurrence and impact of natural (floods, droughts, storms, mass movements, etc.), technological (e.g. industrial or transport accidents) and complex disasters (e.g. famine) from 1900 to the present.
2.2 Continental and national scope
An example of a continent-wide event database is the European database HANZE, which contains information on dates, locations and damage of 1564 flash, river, coastal and compound floods between 1870 and 2016 (Paprotny et al., 2018). The HANZE database is open access via https://doi.org/10.4121/collection:HANZE. A well-known example of a national event-specific database is the Swiss flood and landslide damage database established at the Swiss Federal Institute for Forest, Snow and Landscape Research (WSL; Hilker et al., 2009). This database contains systematically documented information on floods and mass movements (i.e. direct monetary damage) as well as injured people and fatalities in Switzerland since 1972 using press articles as the main source of information. Broader overviews of event-specific databases are provided by Tschoegl et al. (2006), Gall et al. (2009), De Groeve et al. (2014) or Rudari et al. (2017), for example.
2.3 Natural hazard damage data on the object scale
Forensic flood damage analyses as well as damage model derivation and validation predominantly require object-specific data which permit in-depth investigations of causal relations between hazard, exposure, vulnerability and damage magnitudes (e.g. Downton et al., 2005; Jonkman, 2005). However, object-specific databases are still rare. The Flood Hazard Research Centre (FHRC) from Middlesex University, United Kingdom (UK), maintains a (national) object-specific flood damage database comprising mainly synthetic damage data generated via expert estimations about expected damage in case of a certain flood intensity (what-if analyses). These synthetic data are complemented, whenever possible, by empirical data sourced from on-site surveys or insurance companies, for example. The corresponding absolute flood damage functions for the UK are published in the Multi-Coloured Manual (Penning-Rowsell et al., 2013), as well as in its predecessors (Penning-Rowsell and Chatterton, 1977; Parker et al., 1987).
The Austrian Federal Railways (ÖBB) holds an object-specific flood damage database for railway infrastructure and operation in Austria (Moran et al., 2010; Kellermann et al., 2016). This database incorporates information about the affected infrastructure object and resulting service disruptions, the structural damage and corresponding repair costs, the hazard characteristics, and possible mitigation measures. The ÖBB natural hazard management uses the detailed information internally as a basis for the development and implementation of both structural and non-structural risk reduction measures (Kellermann et al., 2016).
The predecessor database of HOWAS 21 was the HOWAS database, which was developed and maintained by the German “Bund/Länder-Arbeitsgemeinschaft Wasser” (LAWA) (see e.g. Buck and Merkel, 1999; Merz et al., 2004). HOWAS contained professionally surveyed damage information of approx. 4000 properties affected by nine flood events between 1978 and 1994 in Germany. Only direct tangible flood damage to buildings was considered for HOWAS, distinguishing between damage to the building fabric, the fixed inventory and the movable inventory. Similar to the concept of HOWAS 21 (see Sect. 3.1), the data were classified into six damage sectors, i.e. private housing sector; public infrastructure (e.g. fire station); service sector (e.g. restaurant); mining and building industry (e.g. carpentry); manufacturing (e.g. beverage industry); and buildings for agriculture, forestry and horticulture (Merz et al., 2004). The damage records represented repair costs (building damage) or replacement costs (inventory damage), and all costs were given in absolute values. Each dataset also contains information on the water depth in the cellar and ground floor. The object-specific flood damage data are further complemented by additional information about damage-influencing factors (e.g. floor space) whenever possible. Due to missing cost coverage, LAWA stopped the database maintenance in 1994.
An extended overview of existing flood damage databases, including general characteristics and references for further information, is provided in the Supplement of this paper (Table S1). The examples given therein do not claim to be exhaustive but serve as an illustration of the variety of global efforts to collect (and learn from) natural hazard damage data.
3.1 Concept and structure
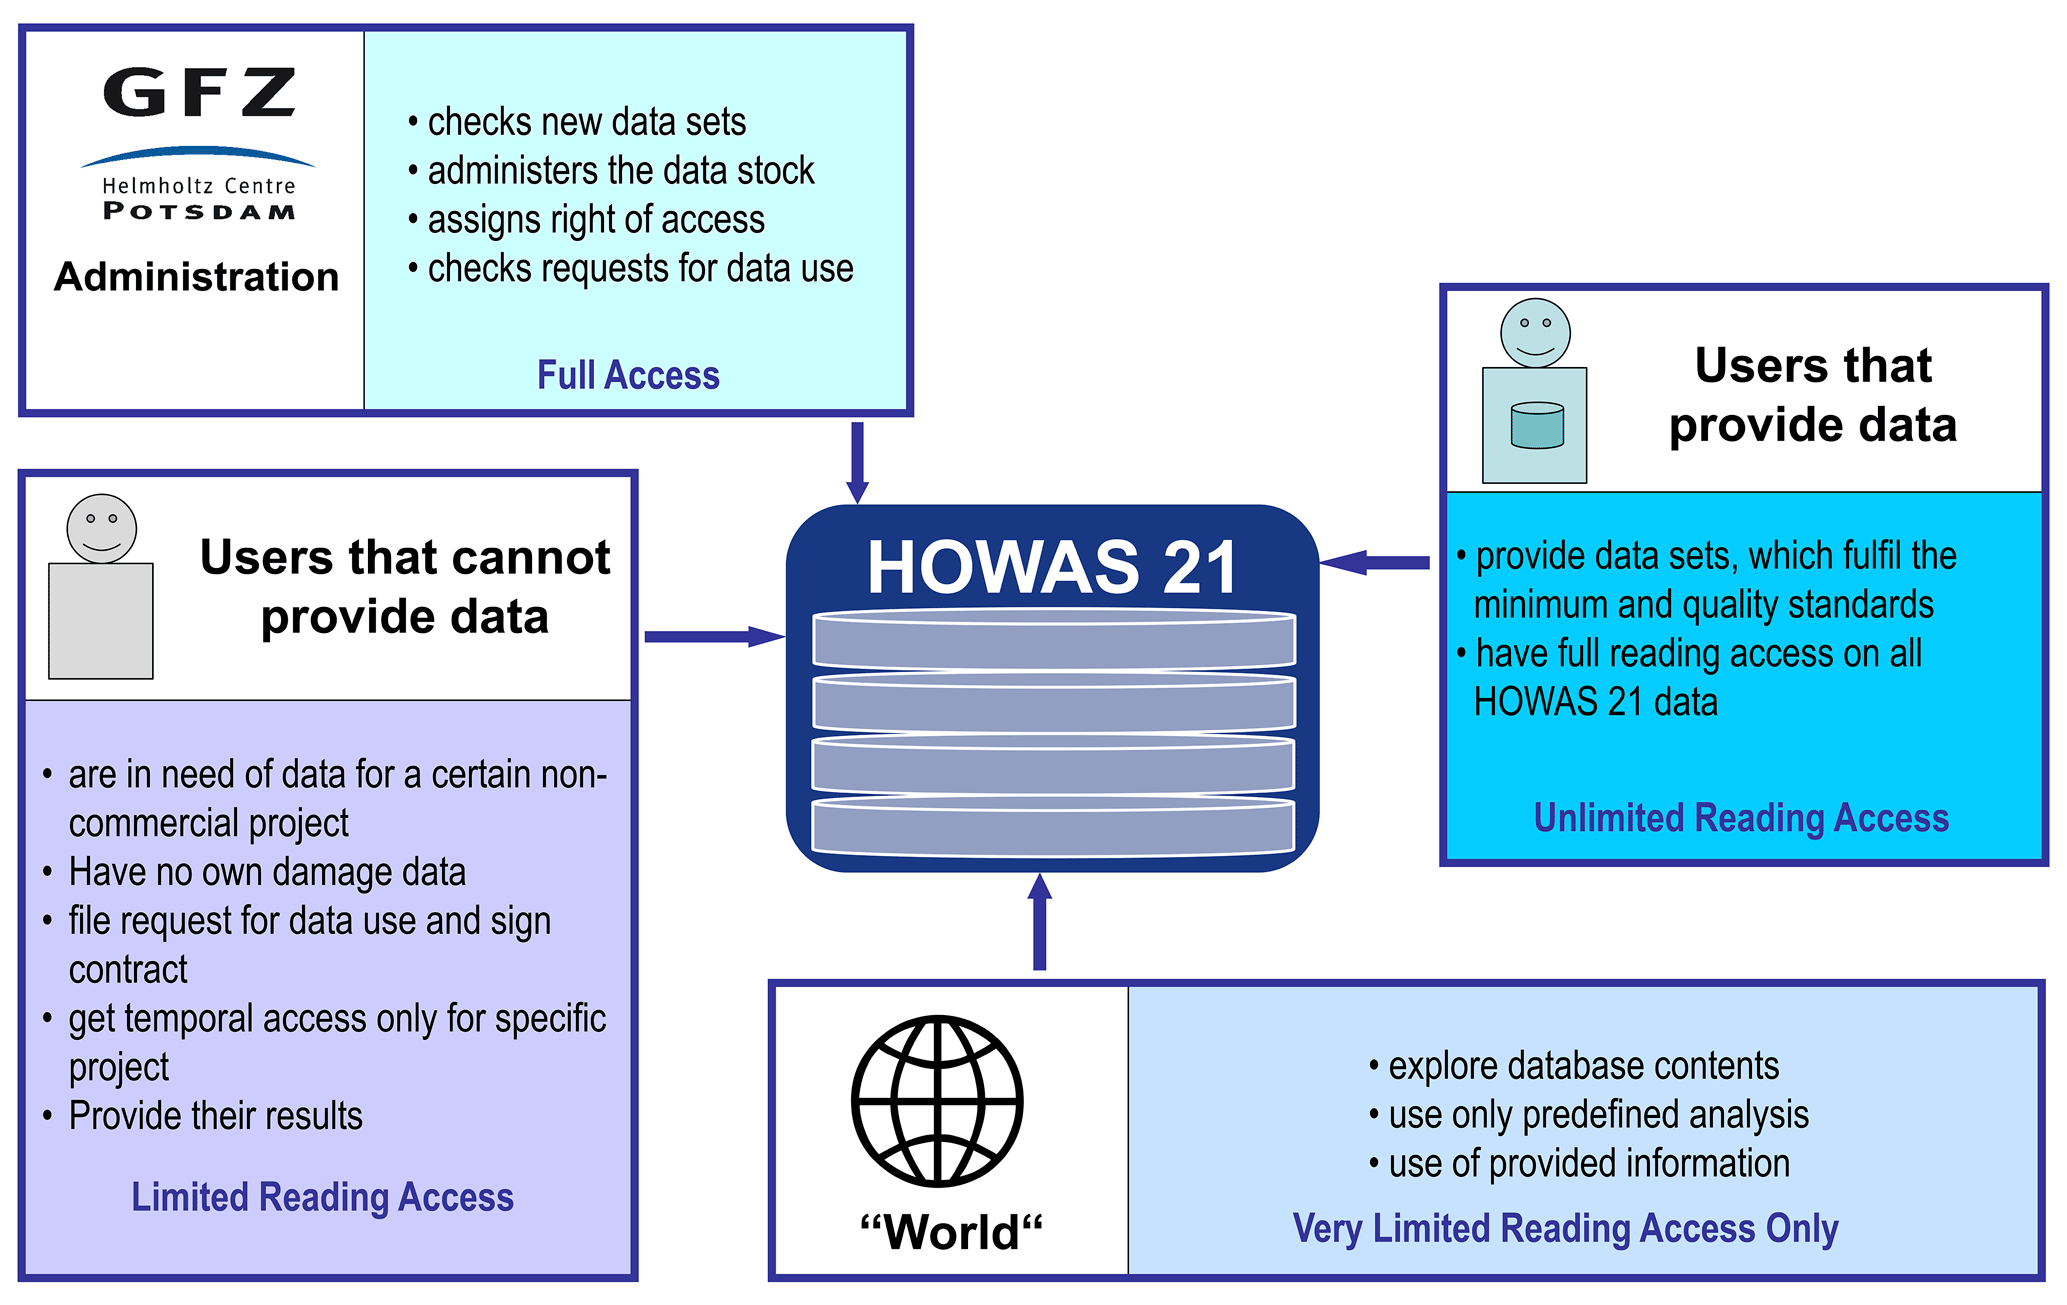
HOWAS 21 is a relational database and web application hosted and administrated by the GFZ, which is also responsible for compiling, reviewing and maintaining consistency of data; assigning access rights; and verifying user requests. HOWAS 21 does not benefit from funding for data collection or updating and, thus, largely relies on voluntary data contributions from surveys and data acquisition campaigns, for example. Thus, the use of HOWAS 21 follows a community-based concept and is organised in three user groups which have access to the database in different degrees (Thieken et al., 2009; see Fig. 1). (1) The world user group is designed for the interested public and grants access to a range of general information and information about the contained data stock via structured queries, filtered by flood type, catchment, country, region (e.g. federal state), event year, sector, data acquisition method and combinations thereof. (2) HOWAS 21 registered user group I is for institutions that provide a defined amount and quality of data to HOWAS 21. Full access to the entire database is granted to this user group. (3) Registered user group II is institutions that cannot provide flood damage data to HOWAS 21 but can get limited rights of use for scientific or non-commercial projects upon application. In return, a feedback on project results based on HOWAS 21 data is requested. Moreover, in case flood damage data are collected at a later stage, these shall be provided to HOWAS 21. The scope of use, the reporting requirements and the prohibition of data dissemination are regulated via a user contract. A total of 61 users from science, insurance, authorities and engineering consultancy had registered at HOWAS 21 by May 2020. Among these, 12 organisations provided data to HOWAS 21 (user group I). This ratio indicates that, as of yet, the majority of users are mainly interested in extracting data but hardly willing or able to contribute data to the database. Until the end of 2019, HOWAS 21 was focused on Germany. Then, it enlarged its scope and is now also open for international flood damage data, and its web application is available in German and English (https://howas21.gfz-potsdam.de/howas21/, last access: 10 September 2020).
The data structure and variable space for HOWAS 21 were derived from a multistep online expert survey based on the Delphi approach. The central idea of the Delphi approach is to reach a consensus among the respondents by having a questionnaire filled several times, after receiving feedback of earlier responses of all participants. To address the needs of different professional fields, 55 experts working in the field of flood damage analysis for government entities, the (re-)insurance industry, engineering consultancy and science were included in the survey panel (Elmer et al., 2010a). The expert survey consisted of three rounds and was conducted online as a “Tele-Delphi”. In the first round the panellists chose one or more of six sectors to answer, for which they were asked to evaluate the importance of variables for flood damage analysis. New variables could be added. In the second round the median of the answers of round one was given as feedback. Variables for which consensus about their importance had already been achieved were not reconsidered. Variables that were added by the experts during the first round were evaluated by the whole panel in the second round. In the third round, experts were asked to rank by importance those variables for each sector that got the highest importance ratings in the first two rounds.
Complementing the HOWAS 21 database, a manual outlining the theoretical framework for flood damage assessment and a suggestion for damage documentation was developed (Thieken et al. 2009).
The HOWAS 21 database classifies object-specific damage into six sectors:
- 1.
private households;
- 2.
commercial and industrial sector, including public municipal infrastructure (administration, social affairs, education, etc.) as well as agricultural buildings;
- 3.
agricultural and forested land;
- 4.
public thoroughfare, including roads and transport infrastructure;
- 5.
watercourses and hydraulic structures (particularly flood defence structures);
- 6.
urban open spaces.
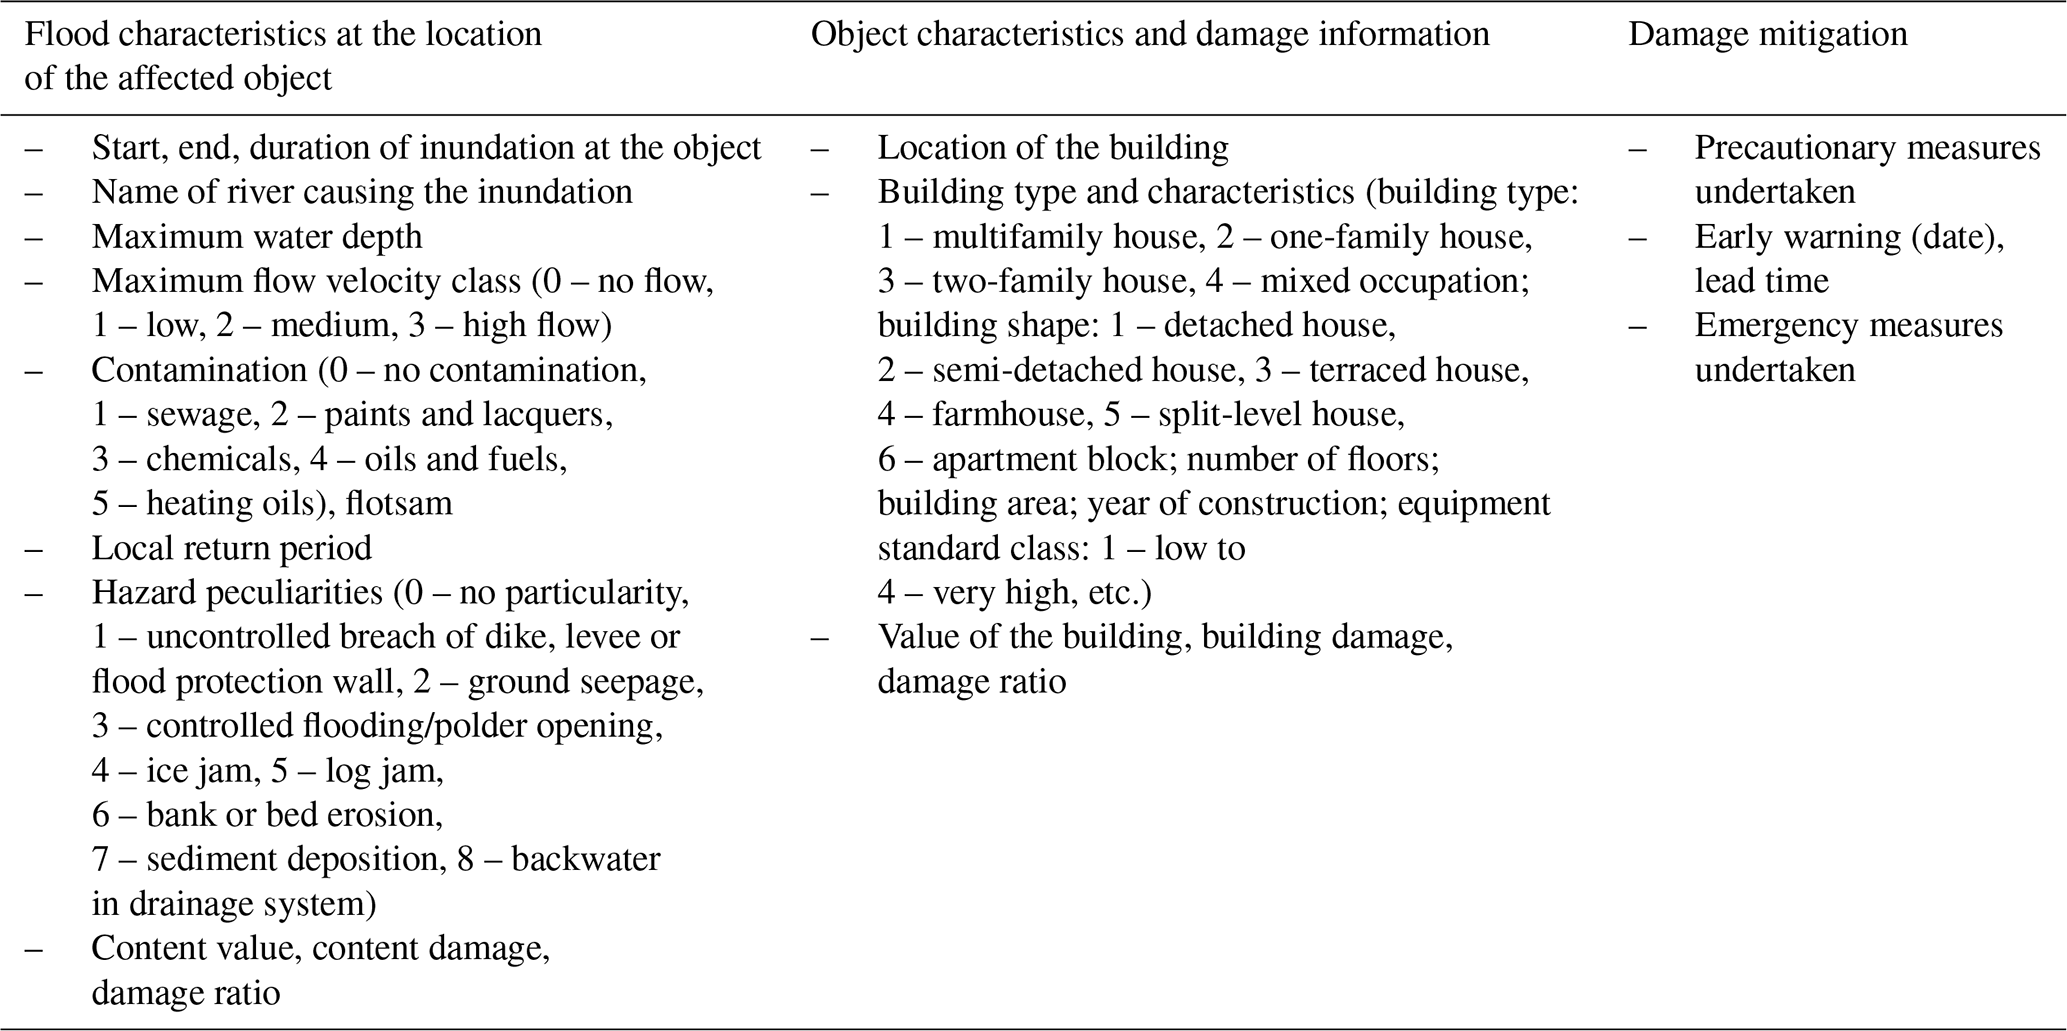
HOWAS 21 incorporates a broad range of variables including information about hazard characteristics (e.g. flow velocity, flood duration and contamination), vulnerability parameters such as building characteristics (e.g. building shape, year of construction), precautionary measures, warning lead time and flood consequences (e.g. absolute and relative damage of flood-affected objects, economic damage due to business interruption in the commercial sector). The variables of individual damage cases are grouped into three (partly sector-specific) database tables as shown exemplarily for private households in Table 1. Complete lists of all variables for all sectors are available at the HOWAS 21 web page: https://howas21.gfz-potsdam.de/howas21/attributes.html?lang=en (last access: 10 September 2020). Moreover, additional meta-information is provided for each damage case, including information about the flood (e.g. event year, catchment name, seasonality, flood type) and the data acquisition campaign (e.g. survey type, period of the survey, sample description). Variable categories which are specific for Germany were recently changed to international standards, e.g. location identifiers like the German official municipality key (Destatis, 2019), and the waterbody number was exchanged by the Getty location (Getty, 2017). The German classification system of economic activities WZ 2008 (Destatis, 2008) was replaced by the International Standard Industrial Classification of All Economic Activities (ISIC) (UN, 2008).
Table 1Exemplary overview of the main damage information tables for private households (adapted from Thieken et al., 2009, and Kreibich et al., 2017b).
Generally, the availability of detailed object-specific flood damage data is often limited due to the fact that damage data collection in the aftermath of a flood is not mandatory, sufficient funding and properly trained personnel are not readily available, and collection standards hardly exist (Menoni et al., 2016; Thieken et al., 2016). This is a challenge for HOWAS 21, which relies on the supply of flood damage data acquired via collection campaigns undertaken by the community after flood events. A compromise had to be found between the wish to incorporate comprehensive datasets into HOWAS 21 and the limited availability of damage data. Thus, minimum data provision requirements for damage cases to be incorporated into HOWAS 2l were defined as follows:
- -
economic sector of the affected object
- -
monetary damage
- -
inundation depth
- -
year (month) of the event
- -
spatial location of the affected object at least on the level of zip codes or municipalities.
These requirements are set based on the rationale of ensuring the possibility to link flood damage to hazard intensity, whereby water depth was found to be the most important explanatory variable for flood damage in a variety of studies (e.g. Merz et al., 2013; Vogel et al., 2018).
The HOWAS 21 concept further includes a procedure to determine the general quality of flood damage data. The approach is based on the hierarchical framework of Wang and Strong (1996) and assesses the quality via scores ranging from 0 (poor quality) to 4 (very good quality). More detailed information and examples of the data quality assessment concept applied in HOWAS 21 can be found in Kreibich et al. (2017b).
HOWAS 21 data are in an anonymous format respecting personal rights according to data privacy regulations.
3.2 Technical design
HOWAS 21 consists of two major components: the flood damage database and a web application. The relational database, which is implemented in PostgreSQL, contains and manages access to all available flood damage records. Its technical design aims to take account of the complexity and heterogeneity of flood damage data in multiple sectors. The database is therefore structured in multiple sector-specific tables, each carrying the mandatory and non-mandatory attributes that describe an object-specific damage record. These tables are linked to value lookup tables and follow database constraints to ensure data integrity. Corresponding metadata are comprehensive and allow for putting the damage information into context. The database itself is protected from direct public access with a firewall.
The HOWAS 21 web application complements the database by providing a user-friendly, browser-based data access interface in English and German. This interface is available at https://howas21.gfz-potsdam.de/howas21/ (last access: 10 September 2020). For long-term availability of HOWAS 21 in digital networks, a persistent interoperable digital object identifier (DOI) has been created, which links back to the current web address. The DOI for HOWAS 21 is https://doi.org/10.1594/GFZ.SDDB.HOWAS21. The HOWAS 21 web application provides the gateway with the data and provides general information about how HOWAS 21 operates. It can be used to browse, summarise, analyse and download HOWAS 21 damage records.
Users can register for a HOWAS 21 user group (see Sect. 3.1) via the web application. If access is granted and a data usage contract is signed, registered users can log in to the web application to download data.
Emphasis has been made on the security and safety of the HOWAS 21 web application in order to protect both the technical system and all data that it manages. It has been ranked as A+ in this regard by the Mozilla Observatory, which assesses a website in terms of its security and safety configuration (https://observatory.mozilla.org/analyze/howas21.gfz-potsdam.de, last access: 10 September 2020).
3.3 Data sources
The Flood Damage Database HOWAS 21 is designed for empirical flood damage data which stem from various damage data acquisition campaigns. Some of these campaigns were undertaken specifically after large flood events; others were dedicated to specific flood types and collected all flood damage data available irrespective of specific flood events. Thus, not all datasets are associated with a specific flood event, e.g. damage due to small localised events and/or pluvial or groundwater flooding. It is not in the scope of HOWAS 21 to provide a flood event definition.
As described in Sect. 2, a significant part of the data originate from the HOWAS database. HOWAS data were collected after nine floods between 1978 and 1994 in south-west Germany via on-site expert surveys by damage surveyors of insurance companies and used as a basis for financial compensation.
Further, an essential portion of HOWAS 21 damage data result from computer-aided telephone interviews (CATIs) with private households and companies who suffered flood damage in the years 2002, 2005, 2006, 2010, 2011 and/or 2013 in Germany (e.g. Kienzler et al., 2015; Thieken et al., 2016). Potential participants of CATIs were identified by compiling lists of affected streets with the help of flood masks derived from radar satellite data, for example, or publicly available information such as official reports and press releases (e.g. Kreibich et al., 2007, 2011; Thieken et al., 2007). The interviews were mainly carried out by pollsters, and, for every interview, it was consistently sought to consult the person with the best knowledge about the flood event as well as the resulting object-specific damage.
For the damage sectors “public thoroughfare” and “watercourses and hydraulic structures”, only a few damage datasets are integrated in HOWAS 21 so far. All these datasets are collected via on-site expert inspection after the 2002 flood in Dresden. Damage data for public thoroughfare comprise 246 inundated sections of road infrastructure. The dataset includes physical road characteristics (e.g. length, width, sidewalks), the road classifications and additional object features. With respect to absolute monetary damage the data were derived from reports of the city administration providing the reconstruction costs of affected road sections (Kreibich et al., 2009). A similar procedure was applied for the 525 damage cases at watercourses and hydraulic structures.
So far, damage data from outside of Germany are very limited; only 219 datasets from the 2005 riverine flood in Tyrol, Austria, are contained. These damage data were collected via computer-aided telephone interviews (CATIs) with private households.
The data used for the exemplary analyses are from 1 November 2019. The few damage datasets from Austria were not included in these analyses. Damage values distinguish between building damage, content damage, and damage to goods and stock, whereby damage to goods and stock is only defined for the commercial and industrial sector. Further, damage in the sectors public thoroughfare and watercourses and hydraulic structures is by definition classified as building damage, since, for example, roads, rail tracks, embankment and flood masonry walls are all constructions. All costs are given in euros, and the reference year of an individual cost value is the year of the related flood event occurrence. Thus, in order to achieve comparability, all costs were converted to the year 2018. Conversion factors are the price indexes for construction works on residential buildings and the consumer price indexes for replacement costs of household contents as well as commercial and industrial goods and stock, both published by the Federal Statistical Office Germany.
4.1 General descriptive statistics
HOWAS 21 comprises a total number of 8558 object-specific flood damage records from 14 years with flood events between 1978 and 2013 in Germany (see Fig. 2). The majority of available damage cases were caused by river floods, and a small additional number of cases can be attributed to groundwater flooding or pluvial flooding. The geographical distribution of the damage data is depicted in Fig. 2; most damage cases occurred in the federal state of Saxony followed by the federal state of Bavaria. Most damage cases resulted from the flood events in June 2013 in the Elbe, Danube, Rhine and Weser catchments; in August 2002 in the Elbe and Danube catchments; and the more localised event in June 1984 in the Tauber catchment.
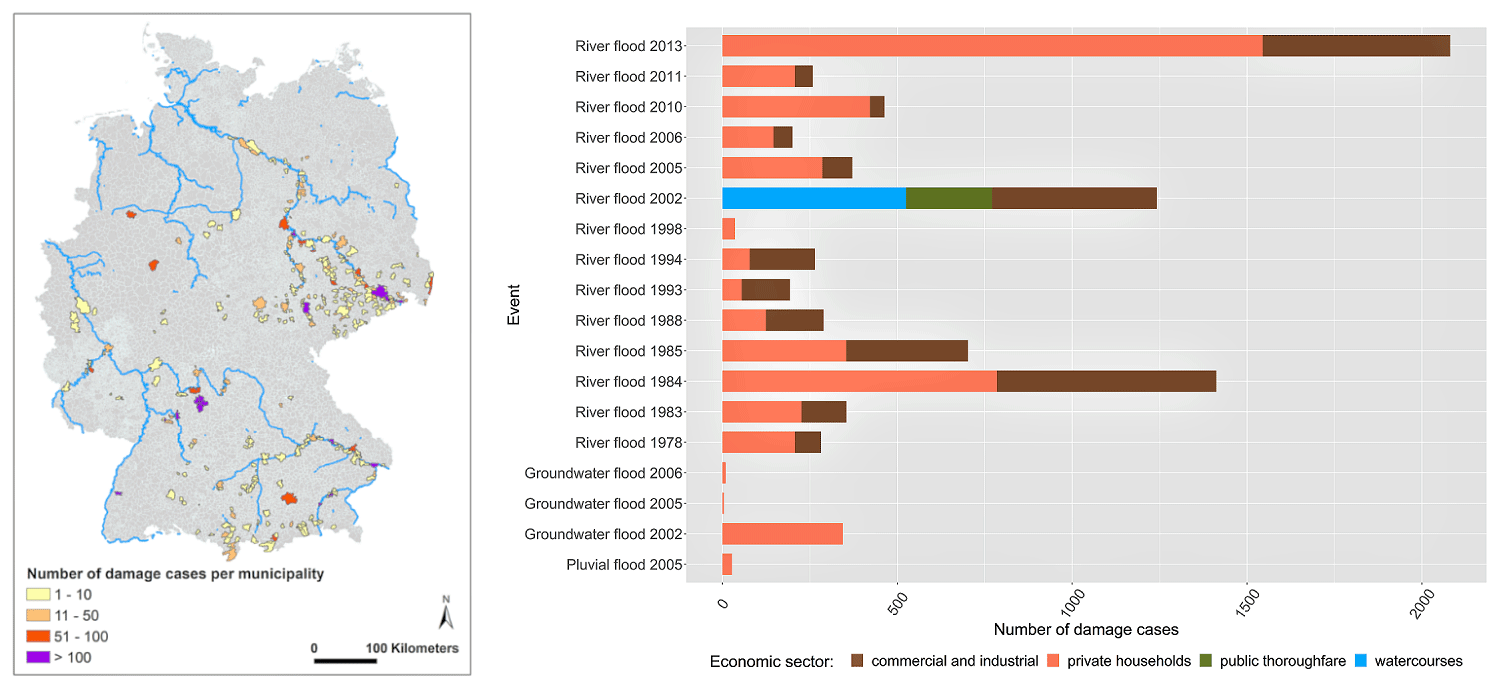
Figure 2Left plot: locations of available flood damage data in HOWAS 21 (adapted from Kreibich et al., 2017b). Right plot: number of damage cases per economic sector and event. No data are yet available for the sectors agricultural and forested land and urban open spaces.
The private household sector accounts for by far the largest data fraction (57.1 %), followed by the commercial and industrial sector (33.9 %). The sectors watercourses and hydraulic structures (6.1 %) and public thoroughfare (2.9 %) are as of yet rather underrepresented (see Table 2). No data are yet available for the sectors agricultural and forested land and urban open spaces. In fact, the commercial and industrial sector does contain a small number of flood-affected agricultural buildings.
Table 2Total number of damage records per economic sector in HOWAS 21 and average data availability rate for non-mandatory variables according to the defined minimum requirements for data incorporation into HOWAS 21.
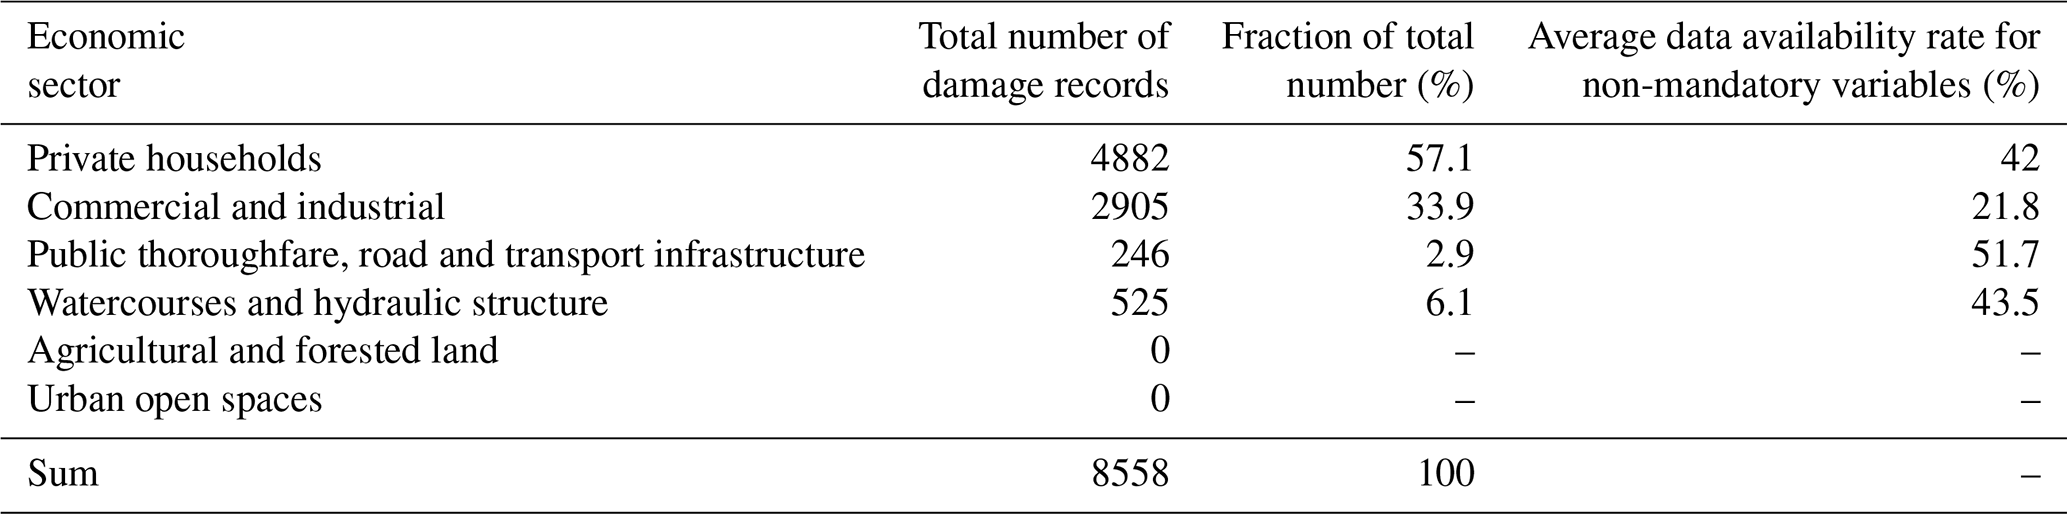
HOWAS 21 is, to the best of our knowledge, the most comprehensive flood damage database for object-specific, empirical data worldwide, with respect to both the number of damage records and the level of detail of information, i.e. the number of different hazard, exposure and vulnerability variables. Although the current set of damage records provides data for a number of variables exceeding the minimum requirements of HOWAS 21 (see Sect. 3.1), most of the records far from exhaustively fill the defined sector-specific variable space. For example, for any damage record in the private household sector, there is currently a 42 % chance of data availability for non-mandatory variables. This chance even decreases to around 22 % for the commercial and industrial sector. In turn, for certain other non-mandatory variables such as building type or building shape of objects in the private households sector, the data availability is close to 100 %.
The HOWAS 21 flood damage data feature a total mean damage of EUR 238 366 for the commercial and industrial sector, which is roughly 6 times the mean damage for the private household sector (EUR 39 994) (price level in 2018). The histograms of total damage per sector are displayed in Fig. 3. Due to their positive skewness, the data samples are plotted on the logarithmic scale. The data show large variability, which is demonstrated graphically by the histogram width and numerically by the coefficients of variation (CoVs) showing values between 187 % (public thoroughfare) and 616 % (commercial and industrial sector). The variability probably stems largely from the heterogeneity of the flood damage processes across the large time period covered and high heterogeneity of flood events from large-scale riverine flooding to local pluvial floods affecting many areas in Germany, with different socio-economic and exposure characteristics, particularly between the western and eastern parts of Germany (Thieken et al., 2007). In particular, as indicated by the exceptionally high CoV, the commercial and industrial sector is characterised by strong heterogeneity, thereby hampering the flood damage estimation in this sector (see also Sect. 4.3). This is in accordance with the common approach that separate flood damage models are developed for the manufacturing, commercial, financial and service sectors or even finer economic classifications (Sieg et al., 2017; Sultana et al., 2018).
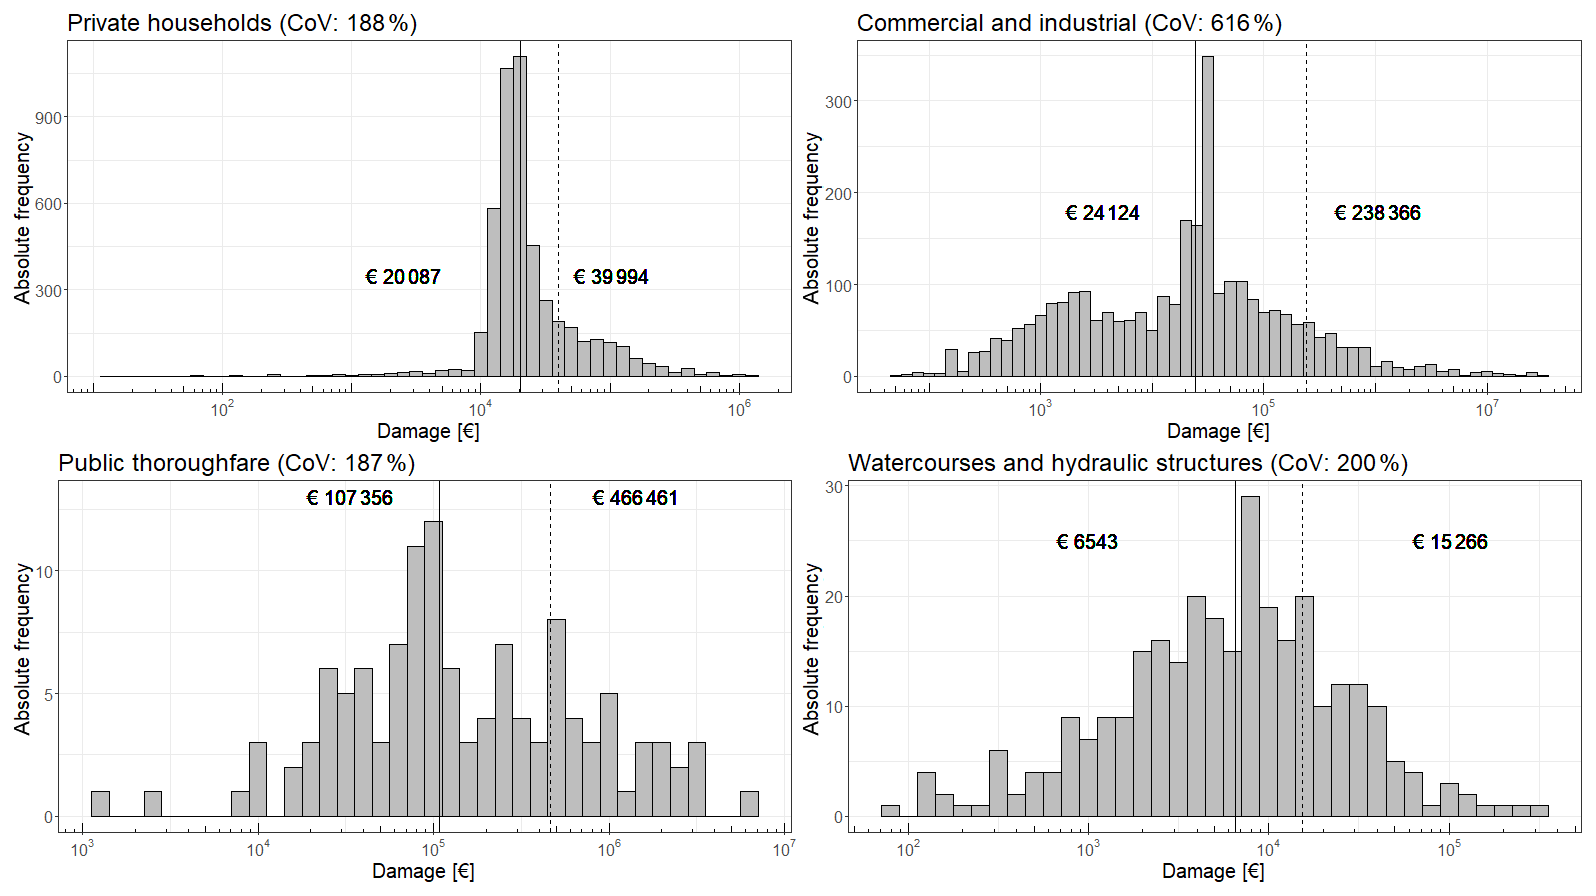
Figure 3Histograms of total damage values per sector for all records of the HOWAS 21 database. Data are plotted on the logarithmic scale. Solid and dashed lines indicate the median and the mean values, respectively.
4.2 Forensic flood analysis to gain insights into flood damage processes
Forensic analysis techniques attract growing interest in science and risk management since they help to uncover the complex underlying causes and effects of disasters (Wenzel et al., 2013; Dolan et al., 2017). More specifically, such analyses are performed to understand the individual and joint contribution of damage drivers such as hazard, exposure, vulnerability and coping capacity to the overall damage.
In this section three examples of forensic flood damage analyses on the basis of HOWAS 21 flood damage data for the private households sector are given, namely (1) the examination of information value and redundancy of flood damage-influencing variables by means of a principal component analysis (PCA) (Sect. 4.2.1), (2) the estimation of variable importance for multivariate flood damage modelling using random forest (Sect. 4.2.2) and (3) the investigation of relative changes of the relation between water depth and absolute flood damage to buildings over time (i.e. between individual flood events) based on multilevel linear regression (Sect. 4.2.3). All forensic analyses are based solely on building damage in the private household sector caused by fluvial floods; i.e. damage cases attributed to pluvial as well as groundwater flooding were removed from the data samples, to facilitate the interpretation of flood damage processes.
4.2.1 How do potential flood damage-influencing variables interact?
An important task for a better understanding of flood damage processes is the investigation of potential damage-influencing variables and their interactions. For this, the correlation structure of such variables and their contribution to the total variance in the HOWAS 21 data (related to building damage in the private household sector) are examined by means of a PCA. A principal component (PC) is a normalised (z transformation) linear combination of the original variables capturing the maximum variance in a dataset. Hence, each PC explains a certain percentage of the total variance in the dataset, whereby the first PC by definition explains the largest share of total variance, the second PC explains the second largest share and so forth. Moreover, all PCs are uncorrelated (i.e. perpendicular) to each other, and, altogether, they reflect the underlying structure in the given dataset.
All damage-influencing variables for which non-categorical data are (currently) available in HOWAS 21 were considered for the PCA, and variables quantifying flood consequences (e.g. absolute building damage in euros) were neglected. The data sample was furthermore centred and scaled to avoid bias in the variance of the data due to variable scale mismatches and, consequently, false estimations of the PC.
According to the Kaiser criterion as well as the scree plot, four significant PCs can be identified in the HOWAS 21 data sample. They explain around 59.9 % of the total variance, whereby approx. one-third of this variance can be attributed to the first PC (21.4 % of total variance). In order to facilitate the interpretation of the variable contributions to each PC and, thus, to gain insights into the interaction of variables, a varimax rotation was applied. Table 3 provides the loadings of the 11 potential flood damage-influencing variables on the four significant PCs. Loadings with absolute values equal to or above 0.5 are considered to be high and, hence, are given priority in the interpretation of the respective PCs. It appears that the first PC is dominated by the hazard variable water depth, whereby, although not exceeding the threshold of 0.5, the variables flood duration and number of floors also show a relatively high loading. The second PC is marked by a mixture of hazard and damage mitigation variables (see also Table 1), namely the variables flow velocity class and lead time. The two remaining PCs are largely characterised by the exposure characteristics year of building construction (PC3) and building type (PC4). Although also not exceeding the defined loading threshold of 0.5, the variables equipment class and building area show a relatively notable loading on PC3 orPC4.
Table 3Loadings of variables potentially influencing flood damage to buildings in the private household sectora.
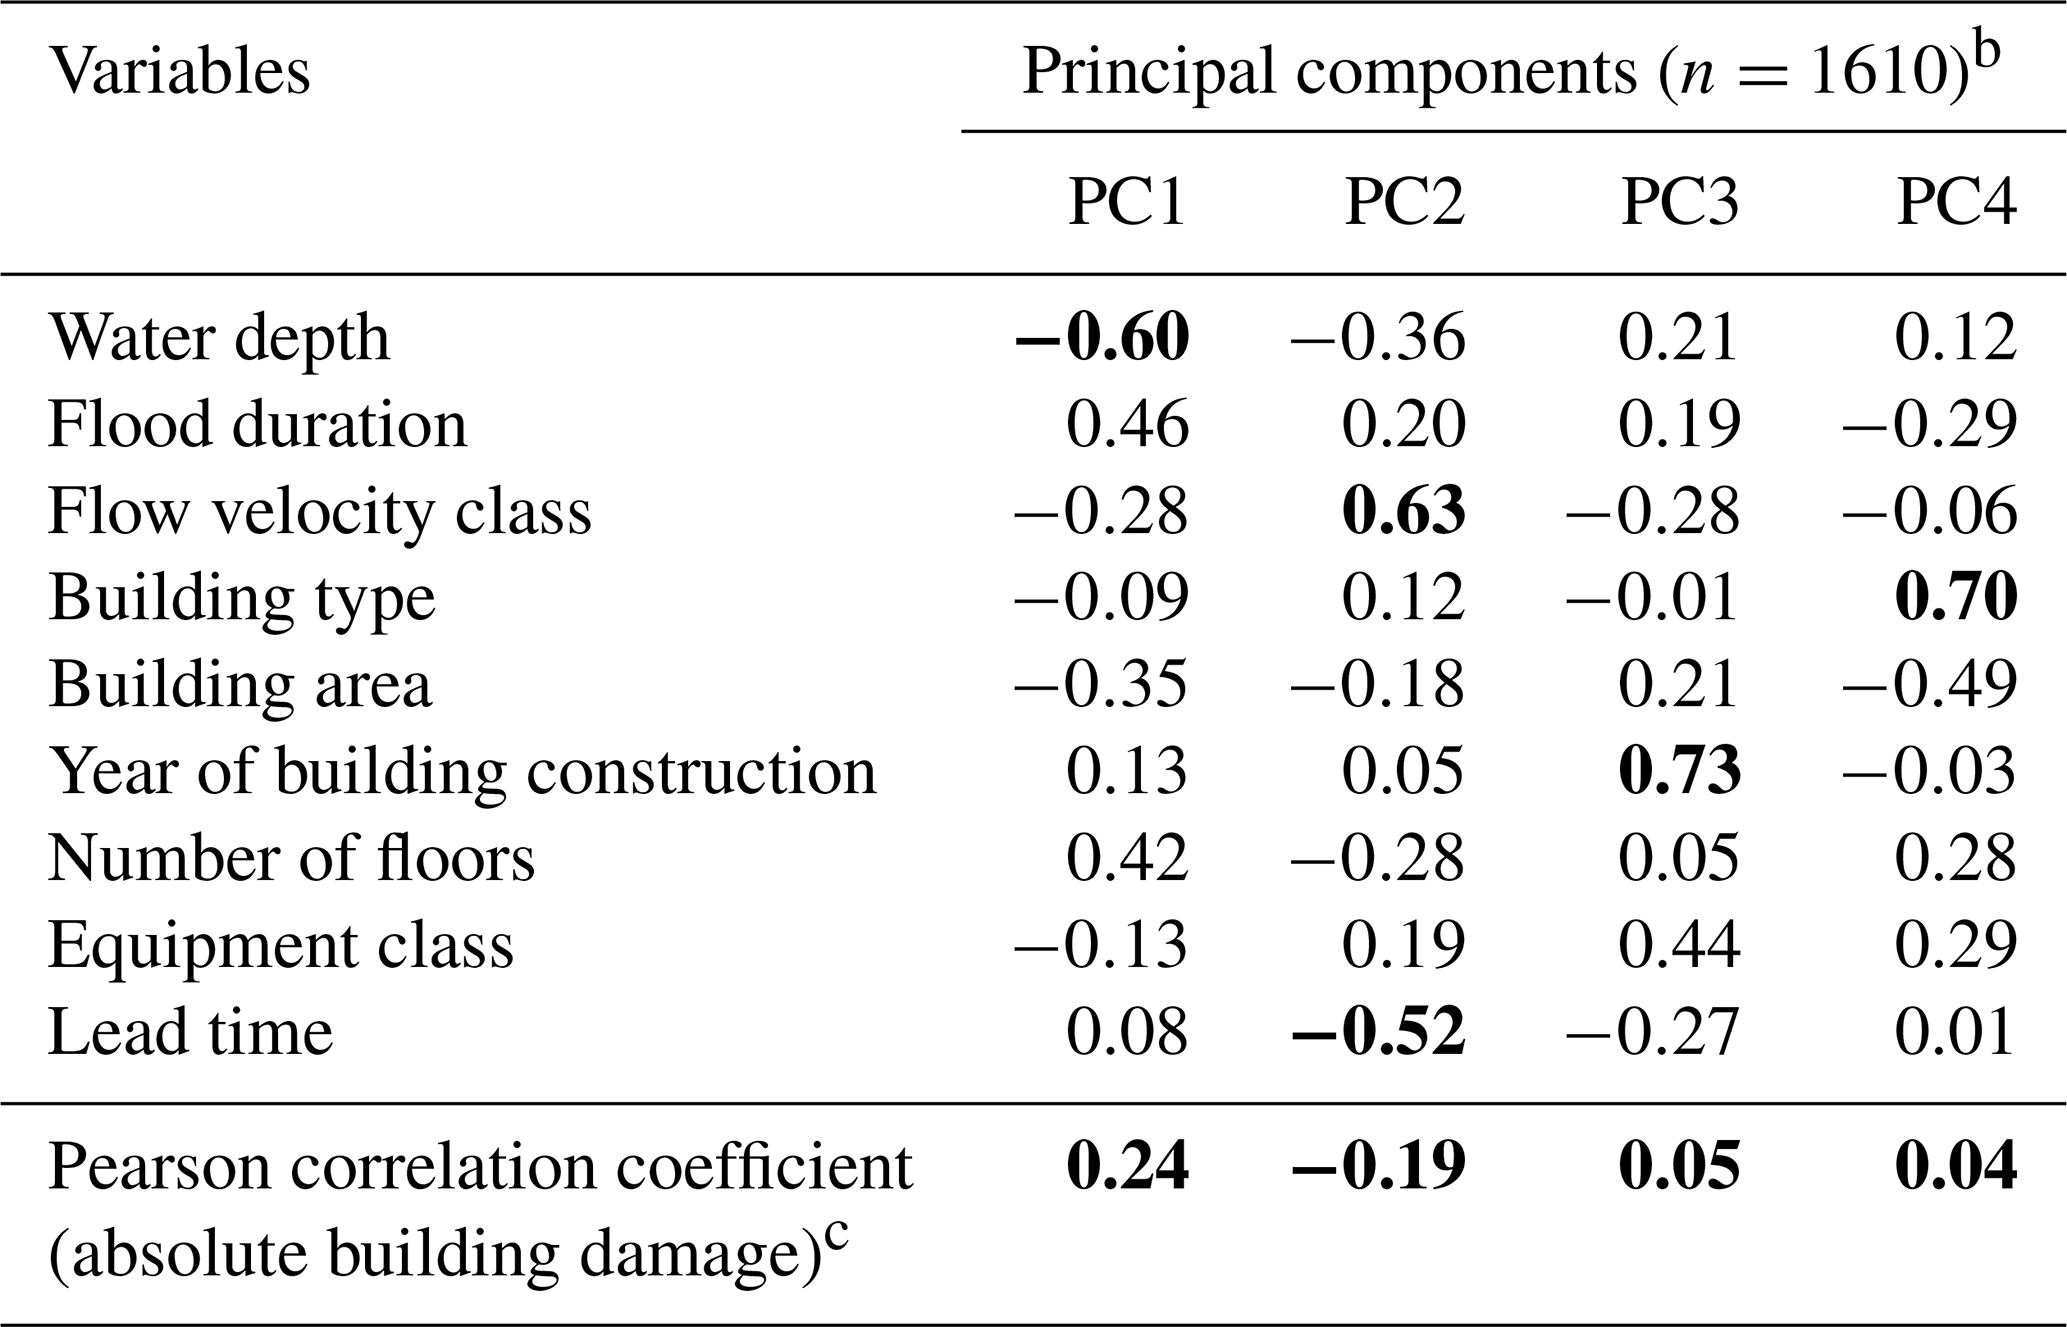
a Principal component analysis with varimax rotation; total variance explained is 59.89 %. b Significant principal components according to the Kaiser criterion. Bold numbers indicate absolute variable loadings ≥0.5. c Bold numbers indicate significant correlation coefficients based on a level of 0.01 (two sided).
In order to supplement the investigation of information value and redundancy with an estimation of the influence of the PCs on flood damage, the correlation between the factor scores of each PC and the absolute building damage was analysed (Table 3). Results show that absolute building damage correlates best with PC1, i.e. the component driven by the flood impact variable water depth. Lower (but still statistically significant) correlation is further given to PC2, PC3 and PC4.
The PCA shows that flood impact variables, particularly water depth, are the factors with the highest influence on absolute building damage. These are, however, closely followed by a variety of exposure and vulnerability characteristics, in particular lead time, year of building construction and building type. When looking at the explained variance of only around 59.9 % for the extracted PCs, the results further indicate that a large number of variables are needed to sufficiently explain the total variance in the HOWAS 21 data for fluvial flood damage to private households. This supports the results of, for example, Schröter et al. (2014) showing that flood damage processes are intrinsically complex and, thus, can be better described using a variety of explanatory variables representing different flood damage processes. Consequently, the findings basically underline the importance of a comprehensive damage data collection approach as followed by HOWAS 21.
4.2.2 How important are individual variables for multivariate flood damage estimations?
Building on the insights into information value and redundancy in the HOWAS 21 data (see Sect. 4.2.1), a logical next step towards a better understanding of flood damage processes is to investigate the individual variable importance for multivariate damage modelling. To do so, the random forest variable importance algorithm was used to identify non-monotonic and multivariate relationships of the damage-influencing variables (i.e. the predictors) to estimate absolute building damage in the private household sector. However, in contrast to the variable selection used for the PCA (see Sect. 4.2.1) and due to the applicability in a random forest framework, categorical variables (i.e. roof type and building shape) are also included in this analysis.
The variable importance of a predictor is estimated by random permutation of values of this particular variable. The idea is that this random permutation leads to an increase in the prediction error compared with the error generated by original values. Accordingly, the mean increase in prediction error caused by permutation of a certain variable serves as a measure for the importance of this particular variable.
Figure 4 shows the results of the random forest variable importance analysis. Using the mean square error (MSE) as the decisive prediction error statistic, the variable water depth is ranked as the most important variable for damage estimation, closely followed by the variables lead time and flood duration. These three predictors show an increase in the MSE between approx. 8 % and 12 %. Exposure characteristics such as building area and year of construction also play a notable role according to the MSE increase of around 4 %–5 %. On the other hand, the variables flow velocity class, number of floors and roof type show only very low importance (see Fig. 4).
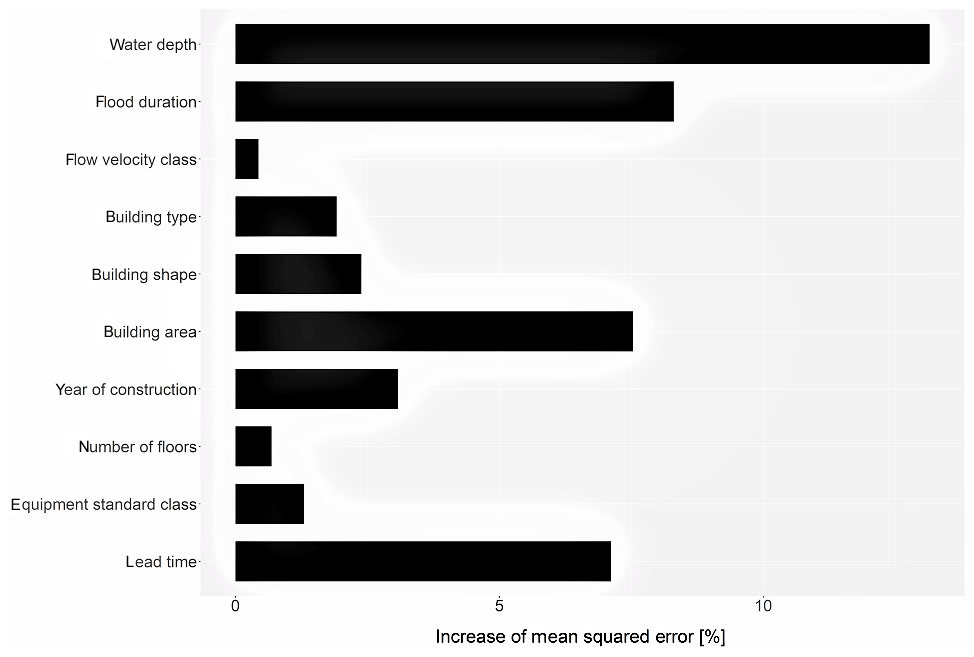
Figure 4Random forest variable importance for the estimation of building damage in the private household sector (n=1610). Importance measure is the mean square error.
Overall, similar to what could be inferred from the PCA with regard to redundancy and variance in the data (see Sect. 4.2.1), a variety of different hazard, exposure, and vulnerability characteristics are also relevant information for multivariate flood damage modelling in the private household sector. The variable lead time again also appears to play a significant role in multivariate flood damage modelling. Vogel et al. (2018) came to a similar conclusion when identifying lead time as an important predictor for flood damage estimations using a Bayesian network. Generally, the results of a variable importance analysis can also help to obtain a better understanding of the (correctness of the) model's logic as well as to improve the model by, for example, removing unimportant variables (see Sect. 4.3).
4.2.3 Has the relation of flood impact and resulting damage changed over the years?
Another important step towards a more thorough understanding of flood damage processes is seen in the examination of the process dynamics. For example, by comparing the functional relationship between flood damage drivers and the resulting damage for different years of flooding, potential patterns or trends of vulnerability over time can be identified. For decision making in flood risk management it is important to know if the vulnerability of exposed objects (e.g. residential buildings) is changing over time; e.g. a decreasing trend in vulnerability might confirm the effectiveness of an implemented risk mitigation strategy, and an increasing trend in vulnerability might indicate that risk management (and communication) needs to be improved. Against this background, the following exemplary analysis is aimed at identifying potential trends in the linear relation between water depth and absolute building damage to private households using multilevel regression.
Multilevel models, also known as mixed models, hierarchical models or group-effect models, are useful for analyses involving hierarchical, nested, clustered or longitudinal data. Hierarchical data, for example, consist of units (e.g. flood-affected objects) which can be grouped into other units (e.g. flood events), whereby the grouped units represent a distinct data level (i.e. level 1), and the grouping unit forms a superior data level in the hierarchy (i.e. level 2). Multilevel models allow the assessment of the amount of data variability due to each data level and, thus, the explicit identification and investigation of group effects. Thus, these model features are also useful for forensic flood damage analyses and, in particular, for investigating changes of relations between a predictor variable (e.g. water depth) and the response variable (e.g. absolute building damage) from one flood event to another (i.e. the group effect in our case). More detailed information about principles of multilevel models can be found in, for example, Gelman and Hill (2006).
In a first step, the relevance of group effects in the HOWAS 21 data sample is measured by means of the intra-class correlation coefficient (ICC). The ICC quantifies the ratio of variance on the hierarchical data level 1, i.e. the level of flood-affected objects, being explained by data level 2, i.e. the flood events. For example, an ICC value of 0.2 indicates that 20 % of the total data variance lies between the groups and 80 % within the groups accordingly. Common practice suggests considering ICC values of 0.05 or higher as an indicator for significant group effects (LeBreton and Senter, 2008). In such cases multilevel models should be favoured over simple linear models. Since the ICC value of the damage data of absolute building damage to private households amounts to approx. 0.08, a multilevel linear regression model is applied to further investigate the expected changes in the depth–damage relation between individual flood events.
The scatter plot of water depth and damage to building structure including multilevel linear regression lines is shown in Fig. 5. Looking at the lines reveals a more or less continuous increase in both the intercept and the slope with increasing flood event year. Increasing intercept and slope point to increasing vulnerability, since the same water depth leads to higher damage. This trend can be further investigated when plotting the group effects of the model (see Fig. 6). Three main findings emerge: first, the high group variability of both regression parameters among the 13 flood years clearly confirms significant differences in vulnerability between the flood events, as already suggested by the ICC. Second, the range of group-specific residuals indicates that, on the whole, flood damage data of years of flooding further back in time tend to scatter more compared with more recent events in the 21st century (see Fig. 6). Third, the development of the group effects of depth–damage relations over time points to an overall increasing trend in vulnerability (see also Fig. 5). In other words, the majority of regression models derived from flood events, which occurred in the 21st century, show higher intercepts as well as higher slopes relative to the values of a simple linear regression model, whereas flood events of the 20th century mostly have lower parameter values. For example, comparing the group effects of the flood year 2013 with the flood year 1988, the mean damage in 2013 is nearly EUR 26 000 higher than the mean damage as derived from the entire HOWAS 21 building damage data, whereas the mean damage in 1988 is almost EUR 9 000 lower (price level in 2018). Further, an increase of 1 cm of water depth leads to an increase in absolute building damage being around EUR 103 higher (year 2013) than the mean increase, or approx. EUR 35 lower (year 1988).
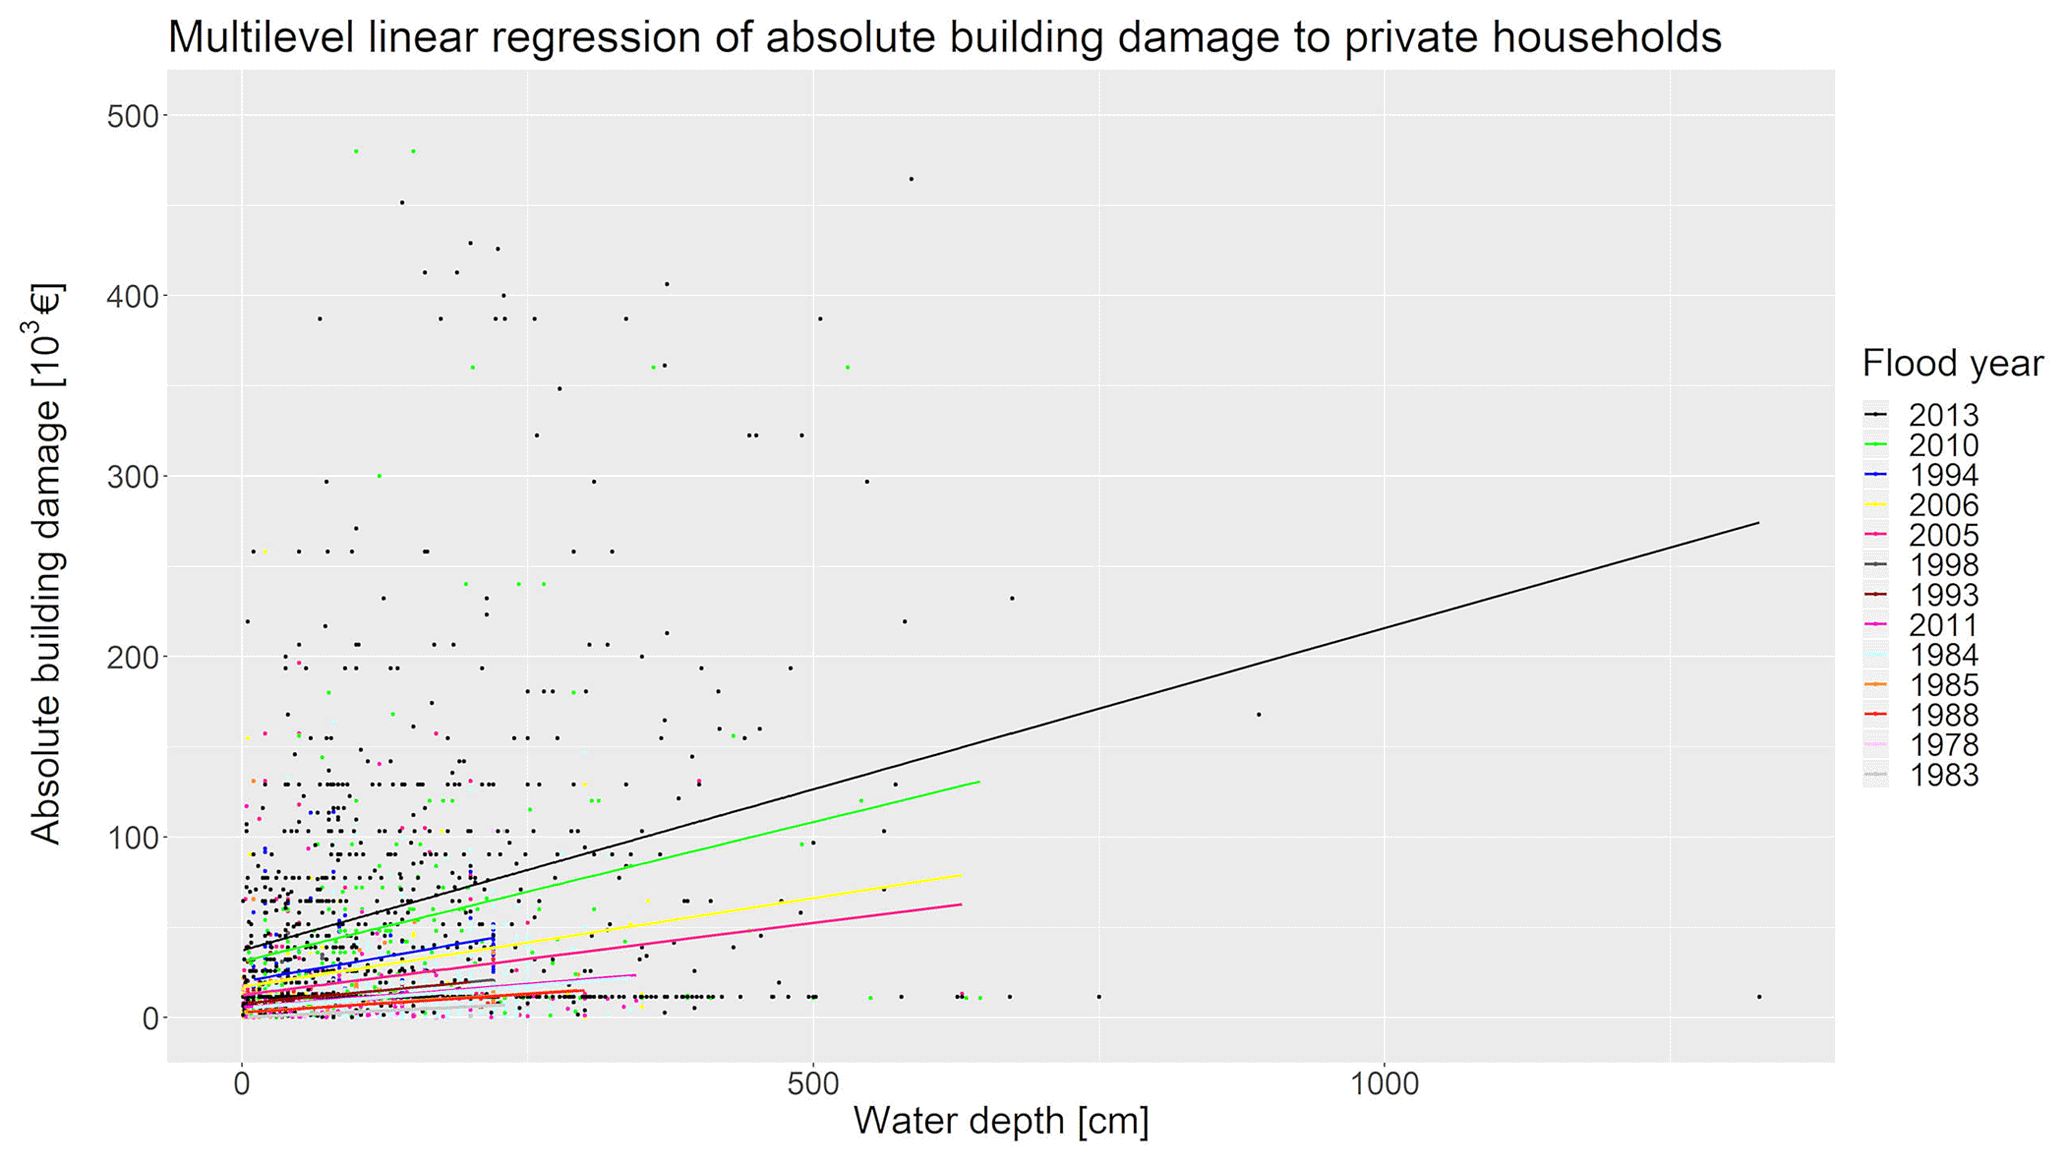
Figure 5Scatter plot of water depth and absolute damage to buildings in the private household sector including multilevel linear regression lines. Regressions are carried out on the basis of the following samples sizes: n=207 (1978), n=226 (1983), n=785 (1984), n=354 (1985), n=124 (1988), n=55 (1993), n=78 (1994), n=36 (1998), n=286 (2005), n=146 (2006), n=243 (2010), n=90 (2011), n=984 (2013).

Figure 6Dot-and-whisker plot of group effects of the multilevel linear regression model for absolute damage to buildings in the private household sector. The plot (a) corresponds to the random intercept, i.e. the variation in the intercept per group from the overall intercept of a simple linear regression. Each group represents a particular flood year. The plot (b) depicts the random slopes. The plotted values are the mean differences between the intercept for each group and the overall intercept (or slope for each group and the overall slope). The whiskers correspond to the range of group-specific residual values.
Summing up, based on water depth as the determinant and absolute building damage as the response variable, multilevel regression results reveal considerable flood damage process dynamics between individual flood years, which is manifested by changes in both the intercept and the slope of regression lines from one flood year to another (see Figs. 5 and 6). These changes or, more specifically, the overall positive trend in the occurred flood damage with time, can have manifold reasons such as (i) the increase in event severity in terms of depth and/or area, (ii) the increase in exposure in terms of number of objects and/or asset values, (iii) the increase in vulnerability of affected objects, and (iv) changes of data collection methods. More (forensic) analyses would be required to better attribute the observed trend to potential causes. For example, the current multilevel model is based on the entire HOWAS 21 dataset for the private household sector, i.e. involving a non-region-specific series of flood years. In order to reduce the effects of changes of exposure characteristics and, thus, to focus more on hazard and vulnerability-related influences, the input data for regression could be limited to a series of flood events that occurred in the same region (e.g. river catchment or federal state). More sophisticated approaches to assess spatial–temporal variability in flood damage processes are presented in Sairam et al. (2019).
4.3 Flood damage model derivation and validation
The following section presents examples of different flood damage models that can be derived on the basis of HOWAS 21 data and briefly evaluates their performance. These include (1) a variety of univariate, i.e. linear, polynomial and square-root, depth–damage curves for all four economic sectors as well as all damage types available in HOWAS 21 (i.e. damage to buildings, damage to contents, damage to goods and stock) and (2) a multivariate random forest regression model for absolute damage to building structures in the private household sector.
Univariate depth–damage curves as well as underlying data are plotted in Fig. 7. It appears that for most of the combinations of economic sector and damage type the different regression types result in similar depth–damage curve progressions. An exception is, however, the public thoroughfare sector, for which the polynomial regression curve is noticeably undulating, which is unrealistic and most likely due to a measurement artefact, since damage data are only available for very few water depth values, pointing to excessive aggregation. Generally, the visual evaluation of the curves fitted to the considerably scattered data samples already indicates that univariate depth–damage relations, i.e. the use of water depth as a sole predictor, only partly (and often insufficiently) explain the complexity of flood damage processes.
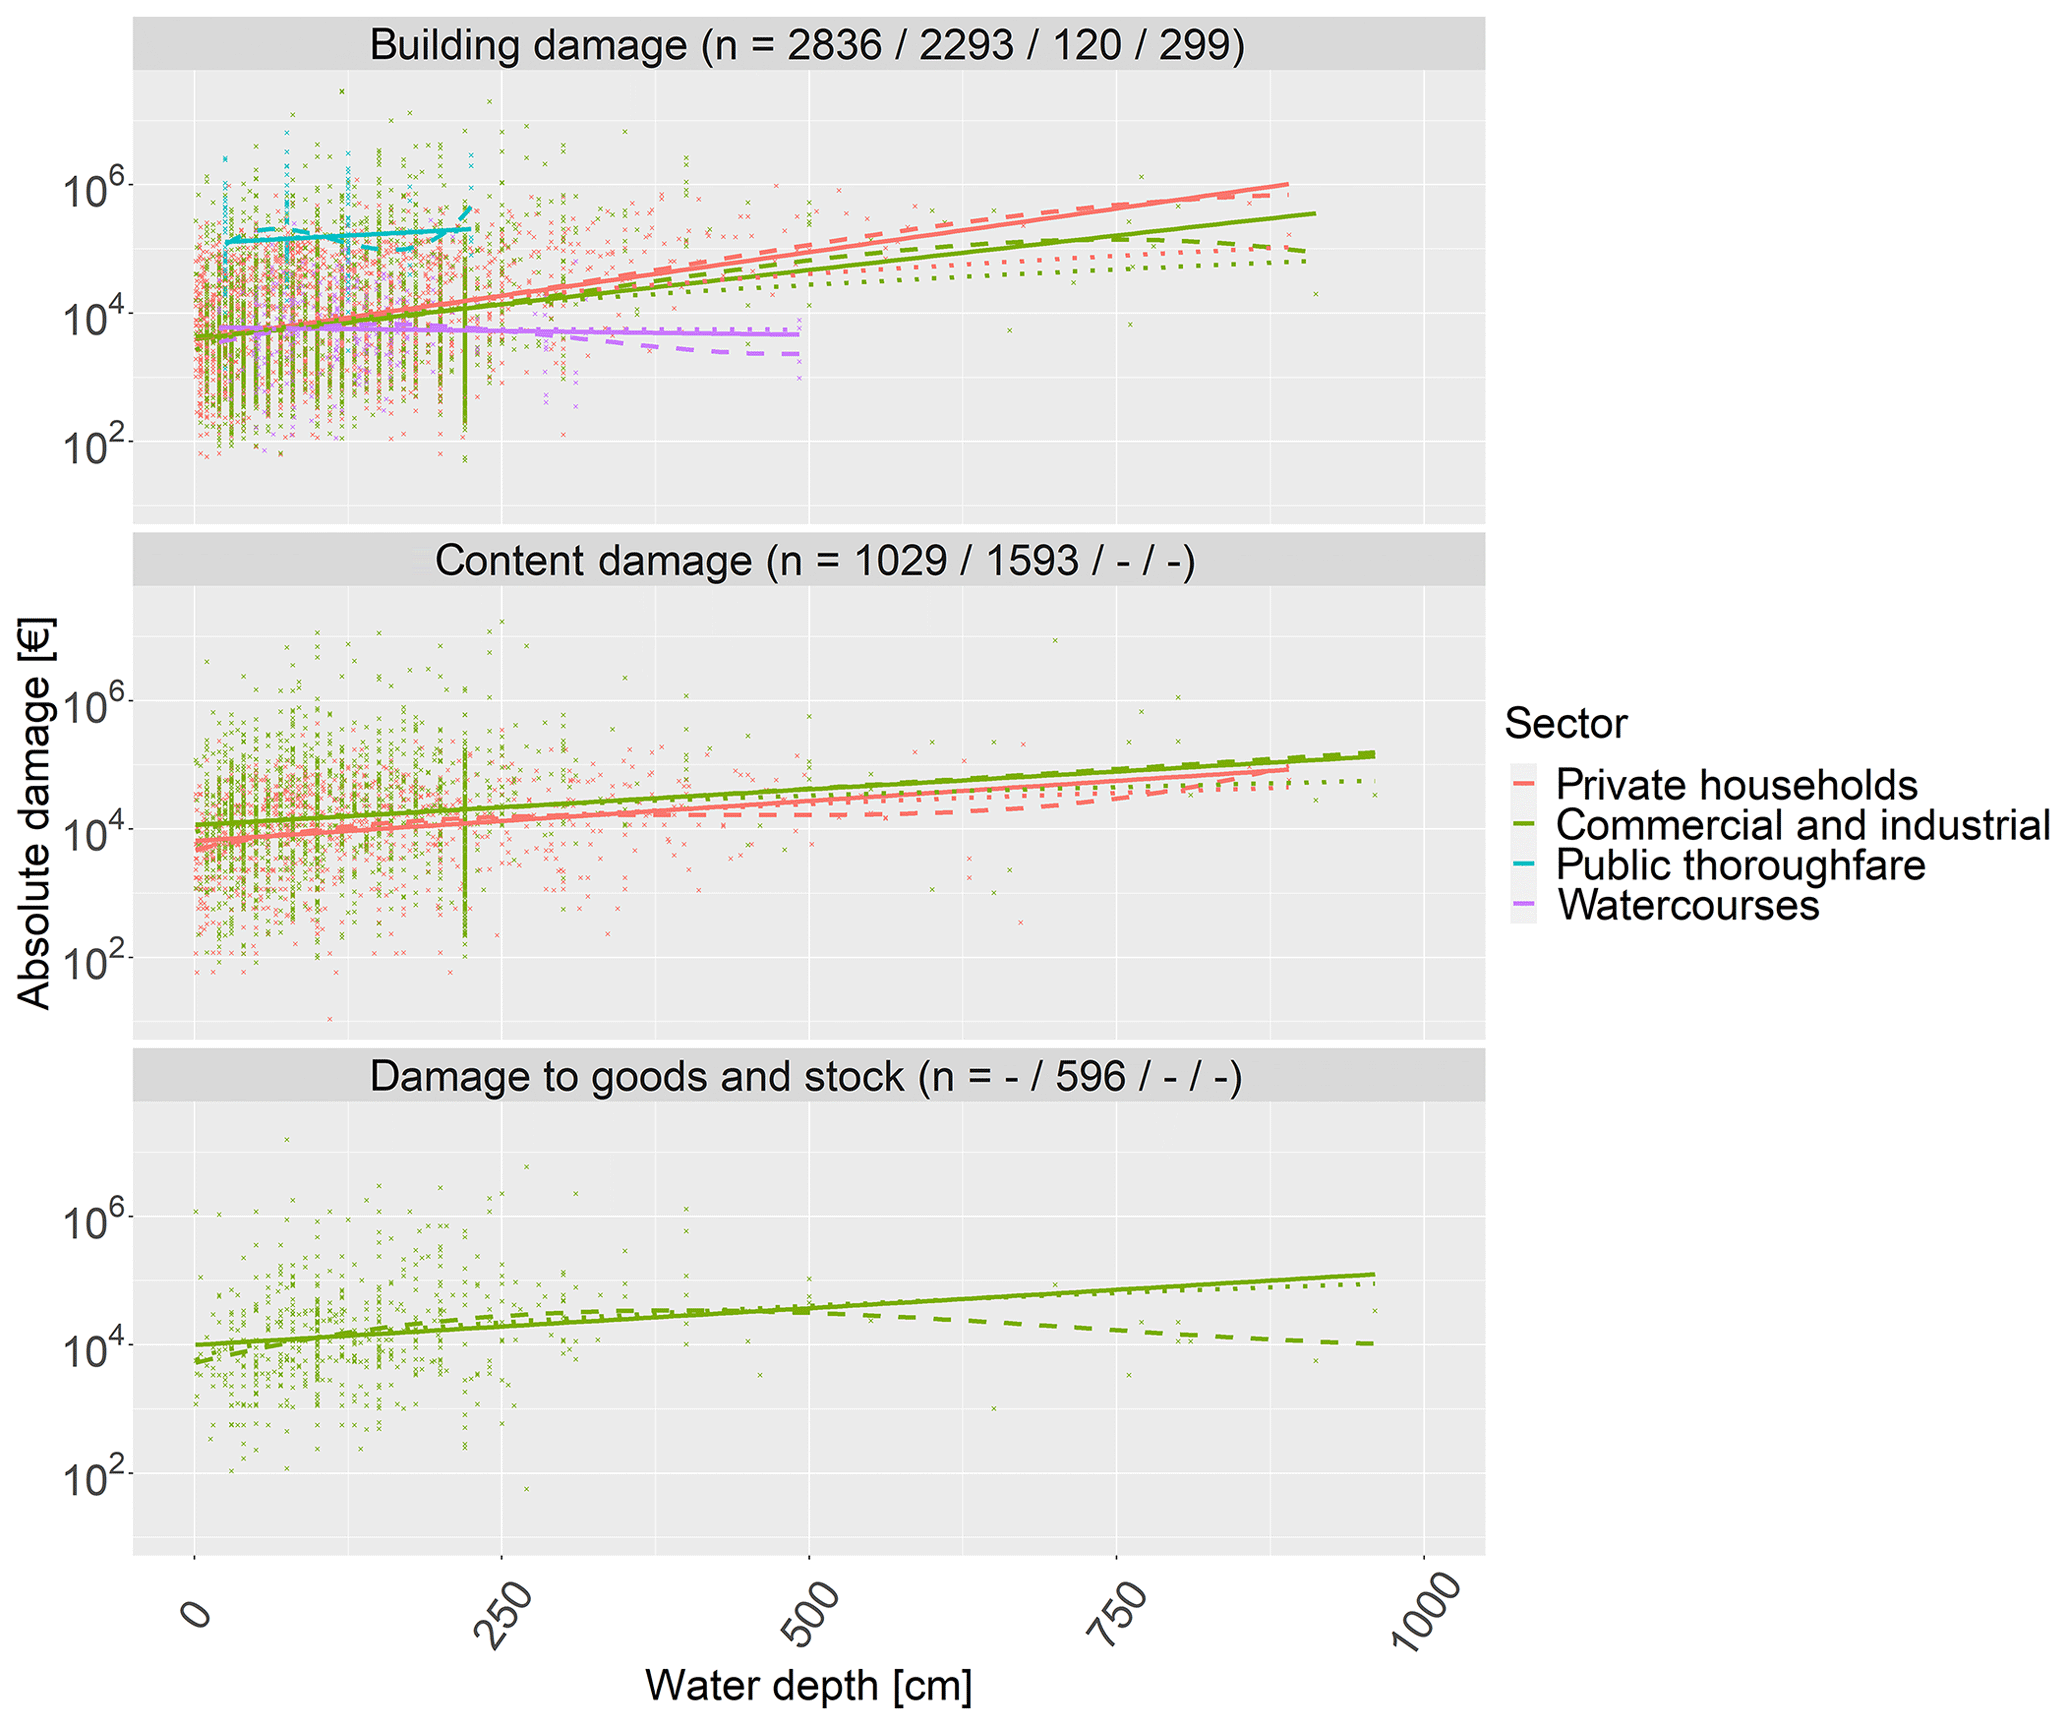
Figure 7Depth–damage curves for all four economic sectors (private households, commercial and industrial, public thoroughfare, watercourses) and damage types (building damage, contents damage, damage to goods and stock) currently available in HOWAS 21. Solid line: linear regression; dashed line: polynomial regression; dotted line: square-root regression. Absolute damage values are plotted on the logarithmic scale. The numbers in brackets in the plot titles are the sample sizes of the datasets, whereby the order of numbers corresponds to the order of elements in the plot legend.
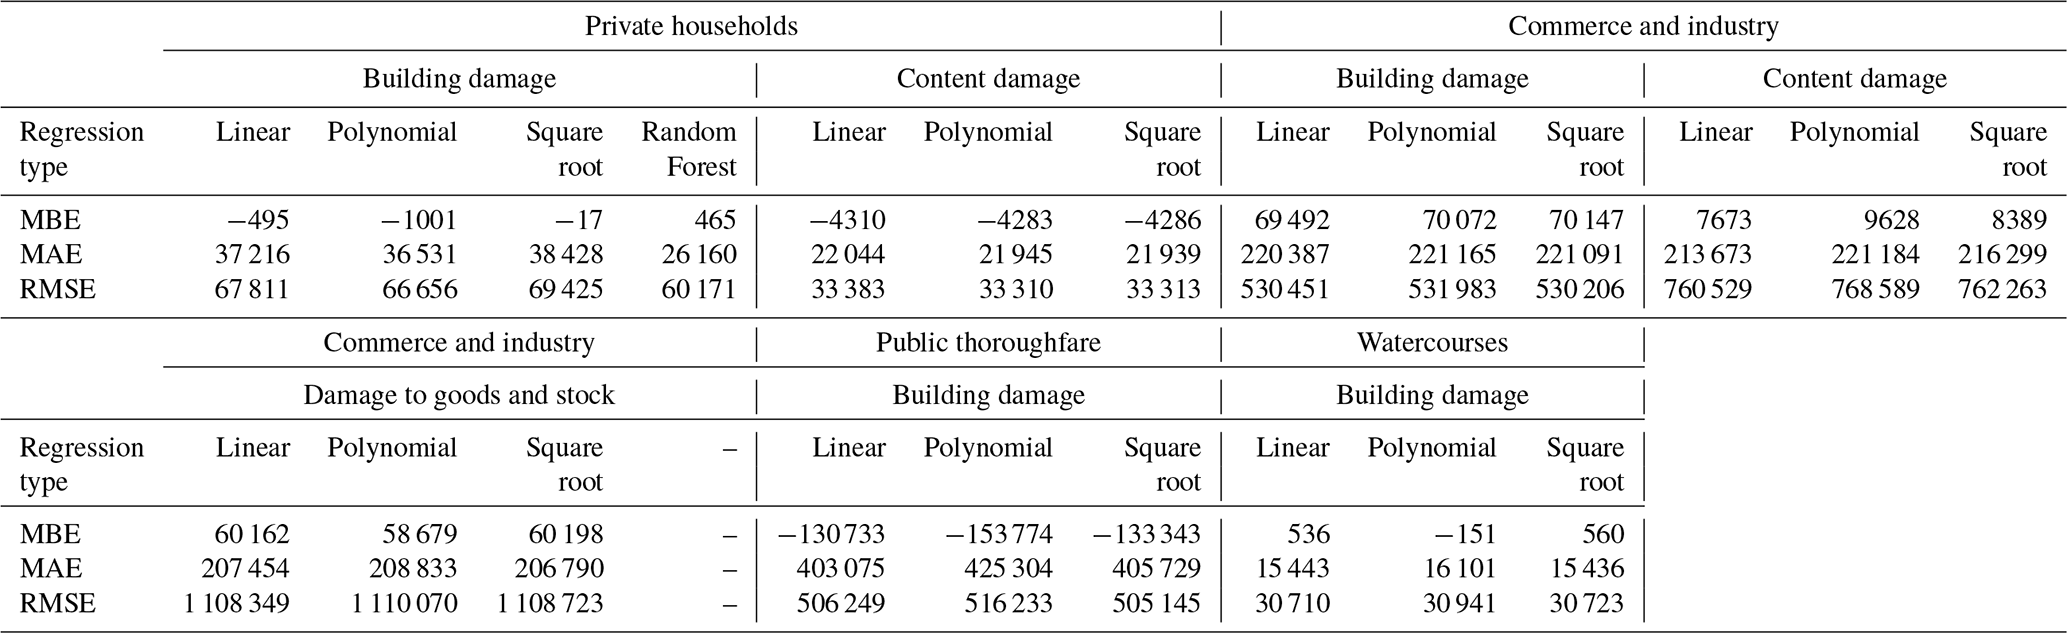
The suitability of the models to estimate absolute flood damage was evaluated by means of three different error measures: the mean bias error (MBE), the mean absolute error (MAE) and the root-mean-square error (RMSE). These are calculated based on one-third of the respective original data sample as validation, whereby the remaining two-thirds were used for the model derivation.
The error statistics for all models are summarised in Table 4. Generally, according to RMSE and MAE, the three univariate regression types perform similarly in estimating absolute flood damage for all damage types. Based on the MBE, the model performances in some cases differ significantly, whereby, however, none of the models consistently perform best (or worst) across all sectors and damage types. Also, all univariate models except the models for damage to contents in the private household sector show a MAE being of a comparable order of magnitude as the observed mean damage of the sector (see Fig. 3 and Table 4).
Table 4Performance of depth–damage curves and the random forest model as measured by error statistics (MBE: mean bias error; MAE: mean absolute error; RMSE: root-mean-square error). All values are given in euros rounded to the nearest whole number.
When used for regression, random forests are ensembles of a (large) number of regression trees. Each regression tree is constructed by recursive binary splits of a bootstrap sample from the original data called bagging, and each binary split can be related to any predictor variable at any value. The data not included in the bootstrap sample to train a regression tree, the so-called out-of-bag (OOB) observations, are used for the calculation of model performance measures as well as estimations of predictor variable importance (see Sect. 4.2.2). A more detailed description of the random forest algorithm can be found in Breiman (2001), for example. Random forests are generally seen as useful for flood damage modelling, since they are applicable to both categorical and continuous data, they allow for non-linear and non-monotonous input data and they are able to capture predictor interactions (e.g. Merz et al., 2013; Schröter et al., 2014; Kreibich et al., 2017a; Sieg et al., 2017; Sultana et al., 2018).
Due to the low importance of the predictor variables flow velocity class, number of floors and roof type (see Sect. 4.2.2, Fig. 4), they are excluded from the random forest model derivation. Consequently, the random forest model is learned on the basis of eight predictor variables, of which two variables (water depth and flood duration) are hazard characteristics, five variables (building type, building shape, building area, year of construction, equipment class) represent exposure characteristics and one variable (lead time) addresses damage mitigation.
In comparison with the univariate modelling approaches, the multivariate random forest model shows better results, although the estimation errors are still very high when viewed in relation to the observed mean damage (see Fig. 3 and Table 4). Overall, the findings of this model derivation and validation exercise suggest a limited capacity of univariate models to explain the complex flood damage processes. The error measures indicate large estimation uncertainties for all univariate models, whereby the regression type (i.e. linear, square-root and polynomial) has only marginal influence on the individual model performance irrespective of the economic sector. The largest errors are observed in the commercial and industrial sector, which can be explained by the strong heterogeneity of this sector (see Fig. 3, Sieg et al., 2017). Already in 1999, using damage data from the predecessor database HOWAS, the Department of Water Resources Management and Rural Engineering of the University of Karlsruhe (IWK) showed that the derivation of generally valid damage functions is difficult, in particular for damage categories that are poorly represented. The lack of comprehensiveness of flood damage data also led Merz et al. (2004) to the conclusions that the HOWAS database is not totally representative for flood damage in Germany and that the use of empirical flood damage data involves considerable uncertainties. They therefore claimed that (i) flood damage data should be collected at the object level whenever possible to better support the development and validation of flood damage models, and (ii) the database should be enlarged with regard to the number of variables to follow a more comprehensive and systematic data collection approach. Both of these claims were also directly addressed in the successor database HOWAS 21. Indeed, adding new predictors significantly improves the flood damage estimates as can be clearly seen from the example of the random forest performance in the private household sector (see Table 4) – whereby however the random forest estimates are still subject to considerable uncertainties. Again, this result is in line with Schröter et al. (2014) showing that complex models better capture the multidimensional nature of flood damage processes.
The flood damage database HOWAS 21 incorporates object-specific data about flood hazard, exposure, vulnerability and direct tangible damage in various economic sectors resulting from fluvial, pluvial and groundwater flooding in Germany. Its strengths include data quality features, the compliance with strict minimum requirements for data entries, the integration of sectors such as public thoroughfare or watercourses and hydraulic structures being widely underrepresented in damage data collections, and the consideration of a multitude of damage-influencing variables.
These features are also essential and integral components of the HOWAS 21 concept to support forensic flood damage analyses as well as the development of flood damage models. The exemplary analyses presented in this paper give a hint at the large potential of this database for such application fields. They generally confirm two central findings of other relevant studies, i.e. the fundamental role of the hazard variable water depth to estimate flood damage on the one hand and the need for a variety of different explanatory variables to better understand and describe the intrinsically complex flood damage processes on the other hand. In detail, the PCA shows that the flood hazard component with particularly high loadings of water depth has the highest influence on absolute building damage, followed by the component dominated by flow velocity and lead time. Similarly, the random forest variable importance analysis reveals that water depth is ranked as the most important variable for damage estimation, closely followed by the variables lead time and flood duration. With the help of multilevel linear regression, analyses show that vulnerability of residential buildings differs significantly between events, with roughly higher vulnerabilities during recent years. Depth–damage functions as well as a random-forest-based flood damage model are derived. The random forest model, which uses eight predictor variables, of which two variables (water depth and flood duration) are hazard characteristics, five variables (building type, building shape, building area, year of construction, equipment class) represent exposure characteristics and one variable (lead time) addresses damage mitigation, shows better results in comparison with the depth–damage functions, although the estimation errors are still high. Originally developed for a German context, the HOWAS 21 database has been further developed and optimised for the hosting of object-specific flood damage data with a global scope. This extension of scope of HOWAS 21 includes, inter alia, the incorporation of a globally valid spatial identifier and the international standard classification for economic activities as well as the translation of the web application and data into English.
However, HOWAS 21 depends on the cooperation and commitment of the (scientific) community. The empirical flood damage database can only continuously grow, and as such increase its value for the whole community, if collected flood damage data are provided to HOWAS 21. Therefore, if flood damage data are or become available, we expressly encourage data owners to include them in HOWAS 21 for their own benefit (i.e. getting access to all data contained in the database) but even more important for the benefit of the whole community. HOWAS 21 (https://doi.org/10.1594/GFZ.SDDB.HOWAS21) is available at https://howas21.gfz-potsdam.de/howas21/ (last access: 10 September 2020).
The data are available via the flood damage database HOWAS 21 (https://doi.org/10.1594/GFZ.SDDB.HOWAS21, GFZ German Research Centre for Geosciences, 2020), according to its data use concept.
The supplement related to this article is available online at: https://doi.org/10.5194/nhess-20-2503-2020-supplement.
PK, KS, AHT and HK developed the concept of the study. PK performed the data analyses. PK, KS, AHT, SNH and HK wrote the paper. All authors made a substantial contribution to the presentation of the HOWAS 21 database and to the interpretation of results and provided important ideas to further improve the study.
The authors declare that there is no conflict of interest.
The authors gratefully acknowledge all existing data providers for their valuable contribution to HOWAS 21, namely Deutsches GeoForschungsZentrum GFZ, Universität Potsdam, Deutsche Rückversicherung AG, LAWA Bund/Länder-Arbeitsgemeinschaft Wasser, alpS – Zentrum für Naturgefahren und Risikomanagement GmbH, Deutsches Institut für Wirtschaftsforschung e.V. (DIW Berlin), Hydrotec Ingenieurgesellschaft für Wasser und Umwelt mbH, JBA Risk Management, Landeshauptstadt Dresden, Leuphana Universität Lüneburg INFU – Institut für Umweltkommunikation, Riocom Ingenieurbüro für Kulturtechnik und Wasserwirtschaft, Risk Management Solutions Inc. and Swiss Reinsurance Company Ltd.
The article processing charges for this open-access publication were covered by a Research Centre of the Helmholtz Association.
This paper was edited by Vassiliki Kotroni and reviewed by two anonymous referees.
Barredo, J. I.: Normalised flood losses in Europe: 1970–2006, Nat. Hazards Earth Syst. Sci., 9, 97–104, https://doi.org/10.5194/nhess-9-97-2009, 2009.
Blong, R.: Residential building damage and natural perils: examples and issues, Build. Res. Inf., 32, 379–390, 2004.
Bouwer, L. M.: Have disaster losses increased due to anthropogenic climate change?, B. Am. Meteorol. Soc., 92, 39–46, 2011.
Breiman, L.: Random forests, Mach. Learn., 45, 5–32, 2001.
Buck, W. and Merkel, U.: Auswertung der HOWAS Schadendatenbank. Institut für Wasserwirtschaft und Kulturtechnik der Universität Karlsruhe, HY98/15, 1999.
Cammerer, H., Thieken, A. H., and Lammel, J.: Adaptability and transferability of flood loss functions in residential areas, Nat. Hazards Earth Syst. Sci., 13, 3063–3081, https://doi.org/10.5194/nhess-13-3063-2013, 2013.
Carisi, F., Schröter, K., Domeneghetti, A., Kreibich, H., and Castellarin, A.: Development and assessment of uni- and multivariable flood loss models for Emilia-Romagna (Italy), Nat. Hazards Earth Syst. Sci., 18, 2057–2079, https://doi.org/10.5194/nhess-18-2057-2018, 2018.
De Groeve, T., Poljansek, K., Ehrlich, D., and Corbane, C.: Current Status and Best Practices for Disaster Loss Data recording in EU Member States: A comprehensive overview of current practice in the EU Member States, Joint Research Centre of the European Commission, Report, JRC92290, https://doi.org/10.2788/18330, 2014.
Destatis (Statistisches Bundesamt): Klassifikation der Wirtschaftszweige mit Erläuterungen, Statistisches Bundesamt, Wiesbaden, available at: https://www.destatis.de/static/DE/dokumente/klassifikation-wz-2008-3100100089004.pdf (last access: 10 September 2020), 2008.
Destatis (Statistisches Bundesamt): GV-ISys – Verzeichnis der Regional- und Gebietseinheiten, Definitionen und Beschreibungen, Statistisches Bundesamt, Wiesbaden, available at: https://www.destatis.de/DE/Themen/Laender-Regionen/Regionales/Gemeindeverzeichnis/Administrativ/beschreibung-gebietseinheiten.pdf?__blob=publicationFile (last access: 10 September 2020), 2019.
Dolan, M., Walliman, N., Amouzad, S., and Ogden, R.: Forensic Disaster Analysis of Flood Damage at Commercial and Industrial Firms, in: Flood Damage Survey and Assessment, edited by: Molinari, D., Menoni, S., and Ballio, F., Geoph. Monog. Series, chap. 13, 195–209, https://doi.org/10.1002/9781119217930.ch13, 2017.
Downton, M. W., Miller, J. Z. B., and Pielke Jr., R. A.: Reanalysis of U.S. National Weather Service Flood Loss Database, Nat. Hazards Rev., 6, 13–22, 2005.
Elmer, F., Seifert, I., Kreibich, H., and Thieken, A. H.: A Delphi method expert survey to derive standards for flood damage data collection, Risk Anal., 30, 107–124, 2010a.
Elmer, F., Thieken, A. H., Pech, I., and Kreibich, H.: Influence of flood frequency on residential building losses, Nat. Hazards Earth Syst. Sci., 10, 2145–2159, https://doi.org/10.5194/nhess-10-2145-2010, 2010b.
Gall, M., Borden, K. A., and Cutter, S. L.: When do losses count? Six fallacies of natural hazards loss data, B. Am. Meteorol. Soc., 90, 799–809, 2009.
Gelman, A. and Hill, J.: Data Analysis Using Regression and Multilevel/Hierarchical Models, in: Analytical Methods for Social Research, Cambridge University Press, Cambridge, i–viii, https://doi.org/10.1017/CBO9780511790942, 2006.
Gerl, T., Kreibich, H., Franco, G., Marechal, D., and Schröter, K.: A Review of Flood Loss Models as Basis for Harmonization and Benchmarking, PLoS ONE, 11, e0159791, https://doi.org/10.1371/journal.pone.0159791, 2016.
Getty: Getty Thesaurus of Geographic Names®, available at: https://www.getty.edu/research/tools/vocabularies/tgn/ (last access: 10 September 2020), 2017.
GFZ German Research Centre for Geosciences: HOWAS 21, Helmholtz Centre Potsdam, https://doi.org/10.1594/GFZ.SDDB.HOWAS21, 2020.
Grigg, N. S. and Helweg, O. J.: State-of-the-art of estimating flood damage in urban areas, Water Resourc. Bull., 11, 379–390, 1975.
Hasanzadeh Nafari, R., Ngo, T., and Mendis, P.: An Assessment of the Effectiveness of Tree-Based Models for Multi-Variate Flood Damage Assessment in Australia, Water, 8, 282, https://doi.org/10.3390/w8070282, 2016.
Hilker, N., Badoux, A., and Hegg, C.: The Swiss flood and landslide damage database 1972–2007, Nat. Hazards Earth Syst. Sci., 9, 913–925, https://doi.org/10.5194/nhess-9-913-2009, 2009.
Hübl, J., Kienholz, H., and Loipersberger, A. (Eds.): DOMODIS – Documentation of Mountain Disasters – State of Discussion in the European Mountain Areas, Intrapraevent, Klagenfurt, 2002.
Jonkman, S. N.: Global Perspectives on Loss of Human Life Caused by Floods, Nat. Hazards, 34, 151–175, 2005.
Kellermann, P., Bubeck, P., Otto, A., Kundela, G., Schönberger, C., Kirnbauer, R., Schöbel, A., Aksentijevic, J., and Thieken, A. H.: Building railway transport resilience to alpine hazards, in: ENHANCE: Novel Multi-Sector Partnerships in Disaster Risk Management, Results of the ENHANCE project, edited by: Aerts, J. and Mysiak, J., EU FP7 project ENHANCE, Brussels, 322–343, 2016.
Kienzler, S., Pech, I., Kreibich, H., Müller, M., and Thieken, A. H.: After the extreme flood in 2002: changes in preparedness, response and recovery of flood-affected residents in Germany between 2005 and 2011, Nat. Hazards Earth Syst. Sci., 15, 505–526, https://doi.org/10.5194/nhess-15-505-2015, 2015.
Kreibich, H., Thieken, A. H., Petrow, Th., Müller, M., and Merz, B.: Flood loss reduction of private households due to building precautionary measures – lessons learned from the Elbe flood in August 2002, Nat. Hazards Earth Syst. Sci., 5, 117–126, https://doi.org/10.5194/nhess-5-117-2005, 2005.
Kreibich, H., Müller, M., Thieken, A. H., and Merz, B.: Flood precaution of companies and their ability to cope with the flood in August 2002 in Saxony, Germany, Water Resour. Res., 43, W03408, https://doi.org/10.1029/2005WR004691, 2007.
Kreibich, H., Piroth, K., Seifert, I., Maiwald, H., Kunert, U., Schwarz, J., Merz, B., and Thieken, A. H.: Is flow velocity a significant parameter in flood damage modelling?, Nat. Hazards Earth Syst. Sci., 9, 1679–1692, https://doi.org/10.5194/nhess-9-1679-2009, 2009.
Kreibich, H., Seifert, I., Merz, B., and Thieken, A. H.: Development of FLEMOcs – A new model for the estimation of flood losses in companies, Hydrolog. Sci. J., 55, 1302–1314, 2010.
Kreibich, H., Seifert, I., Merz, B., and Thieken A. H.: Recent changes in flood preparedness of private households and businesses in Germany, Reg. Environ. Change, 11, 59–71, 2011.
Kreibich, H., Botto, A., Merz, B., and Schröter, K.: Probabilistic, multivariable flood loss modeling on the mesoscale with BT-FLEMO, Risk Anal., 37, 774–787, https://doi.org/10.1111/risa.12650, 2017a.
Kreibich, H., Thieken, A. H., Haubrock, S. and Schröter, K.: HOWAS 21, the German Flood Damage Database, in: Flood Damage Survey and Assessment, edited by: Molinari, D., Menoni, S., and Ballio, F., Geoph. Monog. Series, chap. 5, 65–75, https://doi.org/10.1002/9781119217930.ch5, 2017b.
Kreibich, H., Blauhut, V., Aerts, J. C. J. H., Bouwer, L. M., Van Lanen, H. A. J., Mejia, A., Mens, M., and Van Loon, A. F.: How to improve attribution of changes in drought and flood impacts, Hydrolog. Sci. J., 64, 1–18, https://doi.org/10.1080/02626667.2018.1558367, 2019.
Kron, W., Steuer, M., Löw, P., and Wirtz, A.: How to deal properly with a natural catastrophe database – analysis of flood losses, Nat. Hazards Earth Syst. Sci., 12, 535–550, https://doi.org/10.5194/nhess-12-535-2012, 2012.
LeBreton, J. M. and Senter, J. L.: Answers to 20 questions about interrater reliability and interrater agreement, Organ. Res. Methods, 11, 815–852, 2008.
Lüdtke, S., Schröter, K., Steinhausen, M., Weise, L., Figueiredo, R., and Kreibich, H.: A Consistent Approach for Probabilistic Residential Flood Loss Modeling in Europe, Water Resour. Res., 55, 10616–10635, https://doi.org/10.1029/2019WR026213, 2019.
Mazzorana, B., Simoni, S., Scherer, C., Gems, B., Fuchs, S., and Keiler, M.: A physical approach on flood risk vulnerability of buildings, Hydrol. Earth Syst. Sci., 18, 3817–3836, https://doi.org/10.5194/hess-18-3817-2014, 2014.
Menoni, S., Molinari, D., Ballio, F., Minucci, G., Mejri, O., Atun, F., Berni, N., and Pandolfo, C.: Flood damage: a model for consistent, complete and multipurpose scenarios, Nat. Hazards Earth Syst. Sci., 16, 2783–2797, https://doi.org/10.5194/nhess-16-2783-2016, 2016.
Merz, B., Kreibich, H., Thieken, A., and Schmidtke, R.: Estimation uncertainty of direct monetary flood damage to buildings, Nat. Hazards Earth Syst. Sci., 4, 153–163, https://doi.org/10.5194/nhess-4-153-2004, 2004.
Merz, B., Kreibich, H., and Lall, U.: Multi-variate flood damage assessment: a tree-based data-mining approach, Nat. Hazards Earth Syst. Sci., 13, 53–64, https://doi.org/10.5194/nhess-13-53-2013, 2013.
Mohor, G. S., Hudson, P., and Thieken, A. H.: A comparison of factors driving flood losses in households affected by different flood types, Water Resour. Res., 54, e2019WR025943, https://doi.org/10.1029/2019WR025943, 2020.
Moran, A., Thieken, A., Schöbel, A., and Rachoy, C.: Documentation of flood damage on railway infrastructure, in: Data and mobility. Transforming information into intelligent traffic and transportation, edited by: Düh, J., Hufnagl, H., Juritsch, E., Pfliegl, R., Schimany, H., and Schönegger, H., Springer, 2010.
Paprotny, D., Morales-Nápoles, O., and Jonkman, S. N.: HANZE: a pan-European database of exposure to natural hazards and damaging historical floods since 1870, Earth Syst. Sci. Data, 10, 565–581, https://doi.org/10.5194/essd-10-565-2018, 2018.
Parker, D., Green, C., Thompson, C. S.: Urban flood protection benefits: A project appraisal guide, Gower Technical Press, Aldershot, 1987.
Penning-Rowsell, E. C. and Chatterton, J. B.: The benefits of flood alleviation: A manual of assessment techniques, Gower Technical Press, Aldershot, 1977.
Penning-Rowsell, E. C. and Green, C. S.: New insights into the appraisal of flood-alleviation benefits: (1) Flood damage and flood loss information, J. Chart. Inst. Water E., 14, 347–353, 2000.
Penning-Rowsell, E., Priest, S., Parker, D., Morris, J., Tunstall, S., Viavattene, C., Chatterton, J., and Owen, D.: Flood and Coastal Erosion Risk Management, London, Routledge, 2013.
Rözer, V., Kreibich, H., Schröter, K., Müller, M., Sairam, N., Doss-Gollin, J., Lall, U., and Merz, B.: Probabilistic Models Significantly Reduce Uncertainty in Hurricane Harvey Pluvial Flood Loss Estimates, Earth's Future, 7, 384–394, https://doi.org/10.1029/2018EF001074, 2019.
Rudari, R., Massabò, M., and Bedrina, T.: Overview of Loss Data Storage at Global Scale, in: Flood Damage Survey and Assessment, edited by: Molinari, D., Menoni, S., and Ballio, F., Geoph. Monog. Series, chap. 3, 31–51, https://doi.org/10.1002/9781119217930.ch3, 2017.
Sairam, N., Schröter, K., Rözer, V., Merz, B., and Kreibich, H.: Hierarchical Bayesian approach for modeling spatiotemporal variability in flood damage processes, Water Resour. Res., 55, 8223–8237, https://doi.org/10.1029/2019WR025068, 2019.
Schröter, K., Kreibich, H., Vogel, K., Riggelsen, C., Scherbaum, F., and Merz, B.: How useful are complex flood damage models?, Water Resour. Res., 50, 3378–3395, https://doi.org/10.1002/2013WR014396, 2014.
Sieg, T., Vogel, K., Merz, B., and Kreibich, H.: Tree-based flood damage modeling of companies: Damage processes and model performance, Water Resour. Res., 53, 6050–6068, https://doi.org/10.1002/2017WR020784, 2017.
Smith, D. I.: Flood damage estimation – A review of urban stage-damage curves and loss functions, Water SA, 20, 231–238, 1994.
Smith, D. I. and Ward, R.: Floods: Physical processes and human impacts, John Wiley and Sons, Chichester, 1998.
Sultana, Z., Sieg, T., Kellermann, P., Müller, M., and Kreibich, H.: Assessment of Business Interruption of Flood-Affected Companies Using Random Forests, Water, 10, 1049, https://doi.org/10.3390/w10081049, 2018.
Thieken, A. H., Müller, M., Kreibich, H., and Merz, B.: Flood damage and influencing factors: New insights from the August 2002 flood in Germany, Water Resour. Res., 41, W12430, https://doi.org/10.1029/2005WR004177, 2005.
Thieken, A. H., Kreibich, H., Müller, M., and Merz, B.: Coping with floods: preparedness, response and recovery of flood-affected residents in Germany in 2002, Hydrolog. Sci. J., 52, 1016–1037, 2007.
Thieken, A. H., Olschewski, A., Kreibich, H., Kobsch, S., and Merz, B.: Development and evaluation of FLEMOps – a new Flood Loss Estimation Model for the Private Sector, in: Flood Recovery, Innovation and Response I, WIT Press, Southampton, UK, WIT Trans. Ecol. Envir., 118, 315–324, https://doi.org/10.2495/FRIAR080301, 2008.
Thieken, A. H., Seifert, I., Elmer, F., Maiwald, H., Haubrock, S., Schwarz, J., Müller, M., and Seifert, J.: Standardisierte Erfassung und Bewertung von Hochwasserschäden, Hydrol. Wasserbewirts., 53, 198–207, 2009.
Thieken, A. H., Bessel, T., Kienzler, S., Kreibich, H., Müller, M., Pisi, S., and Schröter, K.: The flood of June 2013 in Germany: how much do we know about its impacts?, Nat. Hazards Earth Syst. Sci., 16, 1519–1540, https://doi.org/10.5194/nhess-16-1519-2016, 2016.
Totschnig, R. and Fuchs, S.: Mountain torrents: Quantifying vulnerability and assessing uncertainties, Eng. Geol., 155, 31–44, 2013.
Tschoegl, L., Below, R., and Guha-Sapir, D.: An Analytical Review of Selected Data Sets on Natural Disasters and Impacts, UNDP/CRED Workshop on Improving Compilation of Reliable Data on Disaster Occurrence and Impact, 2–4 April 2006, Bangkok, Thailand, available at: http://www.cred.be/sites/default/files/TschoeglDataSetsReview.pdf (last access: 10 September 2020), 2006.
UN (United Nations): International Standard Industrial Classification of All Economic Activities (ISIC), Revision 4, Statistical Papers, Series M No. 4, Rev. 4, United Nations, New York, available at: https://unstats.un.org/unsd/publication/seriesM/seriesm_4rev4e.pdf (last access: 10 September 2020), 2008.
Van Ootegem, L., Verhofstadt, E., Van Herck, K., and Creten, T.: Multivariate pluvial flood damage models, Environ. Impact Asses., 54, 91–100, 2015.
Vogel, K., Weise, L., Schröter, K., and Thieken, A. H.: Identifying Driving Factors in Flood Damaging Processes Using Graphical Models, Water Resour. Res., 54, 8864–8889, https://doi.org/10.1029/2018WR022858, 2018.
Wagenaar, D. J., de Bruijn, K. M., Bouwer, L. M., and de Moel, H.: Uncertainty in flood damage estimates and its potential effect on investment decisions, Nat. Hazards Earth Syst. Sci., 16, 1–14, https://doi.org/10.5194/nhess-16-1-2016, 2016.
Wagenaar, D., Lüdtke, S., Schröter, K., Bouwer, L. M., and Kreibich, H.: Regional and temporal transferability of multivariable flood damage models, Water Resour. Res., 54, 3688–3703, https://doi.org/10.1029/2017WR022233, 2018.
Wang, R. and Strong, D.: Beyond Accuracy: What Data quality Means to Data Consumers, J. Manage. Inform. Syst., 12, 5–34, 1996.
Wenzel, F., Zschau, J., Kunz, M., Daniell, J. E., Khazai, B., and Kunz-Plapp, T.: Near Real-Time Forensic Disaster Analysis, in: Proceedings of the 10th International ISCRAM Conference, Baden–Baden, Germany, 12–15 May 2013, edited by: Comes, T., Fiedrich, F., Fortier, S., Geldermann, J., and Müller, T., Karlsruhe Inst. of Technology, Karlsruhe, Germany, 2013.
Zhai, G. F., Fukuzono, T., and Ikeda, S.: Modeling flood damage: Case of Tokai flood 2000, J. Am. Water Resour. As., 41, 77–92, 2005.