the Creative Commons Attribution 4.0 License.
the Creative Commons Attribution 4.0 License.
 | 14 Sep 2020
Storm tide amplification and habitat changes due to urbanization of a lagoonal estuary
Eric W. Sanderson
Stefan A. Talke
Mario Giampieri
Kytt MacManus
In recent centuries, human activities have greatly modified the geomorphology of coastal regions. However, studies of historical and possible future changes in coastal flood extremes typically ignore the influence of geomorphic change. Here, we quantify the influence of 20th-century man-made changes to Jamaica Bay, New York City, on present-day storm tides. We develop and validate a hydrodynamic model for the 1870s based on detailed maps of bathymetry, seabed characteristics, topography, and tide observations for use alongside a present-day model. Predominantly through dredging, landfill, and inlet stabilization, the average water depth of the bay increased from 1.7 to 4.5 m, tidal surface area decreased from 92 to 72 km2, and the inlet minimum cross-sectional area expanded from 4800 to 8900 m2. Total (freshwater plus salt) marsh habitat area has declined from 61 to 15 km2 and intertidal unvegetated habitat area from 17 to 4.6 km2. A probabilistic flood hazard assessment with simulations of 144 storm events reveals that the landscape changes caused an increase of 0.28 m (12 %) in the 100-year storm tide, even larger than the influence of global sea level rise of about 0.23 m since the 1870s. Specific anthropogenic changes to estuary depth and area as well as inlet depth and width are shown through targeted modeling and dynamics-based considerations to be the most important drivers of increasing storm tides.
- Article
(5838 KB) - Full-text XML
- BibTeX
- EndNote


The characteristics of storm tides and the probability of flooding depend on both far-field forcing (meteorological, tidal) and on local characteristics (bathymetry, bottom roughness, floodplain size). Therefore, changes to local mean sea level, shipping channel depths, and wetland land cover as well as storm intensities, sizes, speeds, and tracks can all potentially alter system response and flood probabilities. Recent nonstationary, probabilistic hazard assessments have demonstrated spatially coherent variability in common storm tides (Marcos et al., 2015) as well as extreme storm tides (Wahl and Chambers, 2016) and have begun revealing the climate modes (e.g., NAO and ENSO index) that modulate storm tides in some regions. Similarly, long-term cycles in astronomic forcing (e.g., the 18.6-year nodal cycle) affect both nuisance flooding (Ray and Foster, 2016) and the probability of high-impact events (Talke et al., 2018). In some estuaries, such as Boston Harbor, flood hazard remains statistically stationary after accounting for sea level rise and tidal variability (Talke et al., 2018). In others, flood hazard is nonstationary. For example, a recent study of New York Harbor (NYH) showed an increase in the 10-year storm tide of 0.28 m since the mid-1800s in addition to the local relative sea level rise of 0.44 m (Talke et al., 2014).
Climatic and astronomical variability in hydrodynamic forcing coincides with several centuries of human-induced geomorphic change to estuaries and harbors (e.g., Sanderson, 2009; Grossinger, 2001; Talke et al., 2018; Jaffe et al., 1998). Wetlands have been reclaimed; in NYH, a typical case, approximately 80 % of predevelopment wetlands have been lost (USACE, 2009). Harbors and estuaries have been deepened, with the controlling depth of channels often doubled or even tripled (Orton et al., 2015; Familkhalili and Talke, 2016; Ralston et al., 2019; Helaire et al., 2020; Chant et al., 2011). Coastal boundaries have been hardened and raised, preventing overland flooding except in extreme cases. Natural wave breakers have been destroyed, including oyster reefs that may have once reduced coastal wave energy in New York's outer harbor by between 30 % and 200 % (Brandon et al., 2016).
The sum effect of changing bathymetry is an altered hydrodynamic regime, with effects on astronomical tides, storm surges, and morphodynamic feedbacks (e.g., de Jonge et al., 2014; Chernetsky et al., 2010; Talke and Jay, 2020). A study of the Cape Fear Estuary showed that tide range had doubled since the 1880s in Wilmington, NC, due to a doubling of the shipping channel depth. Moreover, idealized modeling showed a ∼0.5 to 2 m storm surge increase at Wilmington across a variety of hurricane intensities (Familkhalili and Talke, 2016). Model simulations of Hurricane Katrina's flooding with present-day versus estimated historical conditions (ca. 1900) suggest that wetland loss exacerbated flooding well beyond the influence of sea level rise (Irish et al., 2014). Within the Hudson River estuary, Ralston et al. (2019) showed that a doubling of channel depth near Albany (New York) more than doubled tide range and increased the magnitude of storm surge compared to 19th century conditions. Within New York Harbor, deepening of the inlet produced a smaller shift in the lunar semidiurnal tidal constituent amplitude of 7 % at the Battery (Ralston et al., 2019). Within nearby Newark Bay and the Passaic River, tides have been amplified by ∼10 % over the past century, reflecting a change in the controlling channel depth at some locations from ∼3 to 15 m (Chant et al., 2011). In parts of Jamaica Bay, another subembayment of New York Harbor, tide range changes are much larger and have grown by 41 %, from 1.16 m in 1899 to 1.64 m in 2007 (Swanson and Wilson, 2008). Numerical experiments within Jamaica Bay suggest that individual storm tide events such as Hurricane Sandy are quite sensitive to depth modifications (Orton et al., 2015). However, the implications of historical channel deepening and land cover changes on flood hazard have not yet been quantified through a probabilistic assessment.
In this contribution, we investigate the influence of extreme changes in bathymetry and wetland cover on storm tide hazard. Jamaica Bay, New York, was a back bay lagoonal system that was converted to a deepwater port (Sanderson, 2016; Swanson and Wilson, 2008; Seavitt et al., 2015; Swanson et al., 2016). Although the system's morphology was evolving in the 18th and 19th centuries and possibly earlier, the most dramatic alterations occurred in the early 20th century (Black, 1981). The Jamaica Bay Improvement Commission (1907) proposed to reconfigure the bay into a port (Figs. 1 and 2), and the River and Harbor Acts of 1910 and 1925 set in motion a plan to reconfigure the entrance channel to a depth of at least 9 m and width of 450 m, protected by jetties. Groins were placed along the seaward side of the Rockaway Peninsula (labeled in Fig. 1 as “Rockaway Beach”), and a jetty was constructed at the tip to stabilize the barrier island (Hess and Harris, 1987). The bay's perimeter channels were extensively dredged for several decades, and dredged sediments were used for landfill development over the fringe wetlands surrounding the bay, creating neighborhoods and the Floyd Bennett Field airport (Black, 1981). Midcentury, additional dredging and landfill occurred at the northeastern end of the bay for the creation of John F. Kennedy (JFK) International Airport, leaving “borrow” pits that today are up to 15 m deep. As the 20th century progressed, the port was never realized, and the primary port for the region ended up across New York Harbor in Newark Bay.
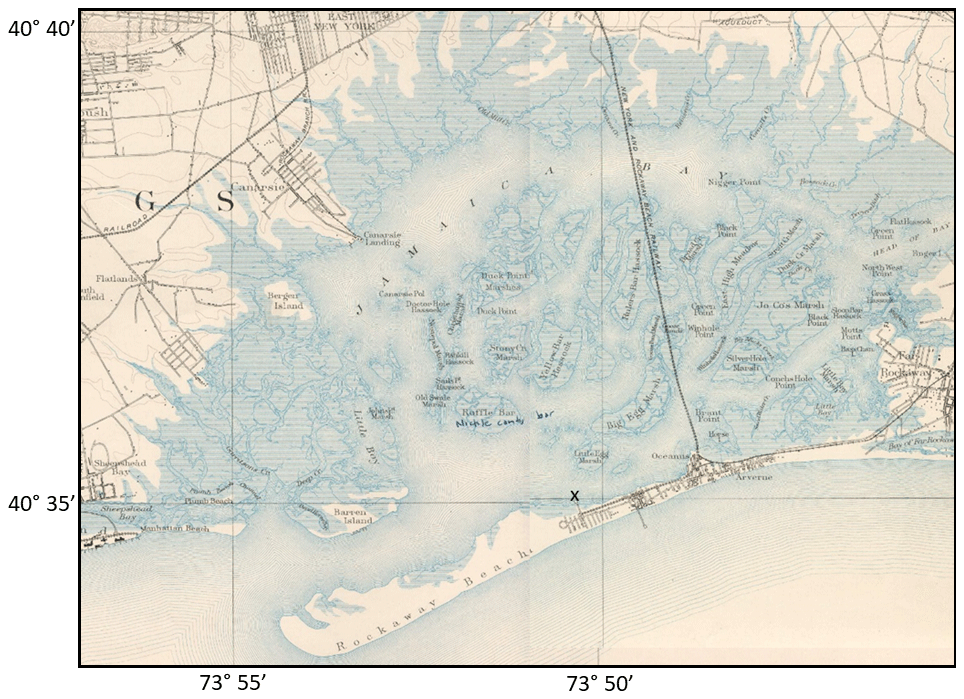
Figure 1An 1888-1889 survey map of Jamaica Bay, in southeast New York City, portraying the morphology and marsh cover (blue hatching). The map is excerpted from Powell (1891), and the “x” marks the Holland House pier tide measurement location.

Figure 2Plan for converting Jamaica Bay into a port (Jamaica Bay Improvement Commission, 1907).
Here we present a quantitative assessment of Jamaica Bay landscape changes and use retrospective modeling to estimate the impacts on storm tides and flooding. A detailed hydrodynamic model of the 1870s was developed based on maps of bathymetry and seabed characteristics for use alongside an existing present-day model. Modeling of 144 storm tide events for both the 1870s landscape and the present-day landscape is used to develop a probabilistic flood hazard assessment. We show that man-made geomorphic changes in Jamaica Bay have produced an important and heretofore underappreciated and unquantified increase in storm tides. Given the environmental and societal value of the Jamaica Bay wildlife refuge, JFK Airport, the Gateway National Recreation Area, several city and state parks, and the lives of the hundreds of thousands of people in flood zones around the bay, our results have implications for the future management of the system.
To evaluate how and why flood hazard has changed due to landscape changes in Jamaica Bay, we applied a quantitative approach – the use of numerical models to produce a probabilistic hazard assessment (e.g., Orton et al., 2016b) – to both the historical (1870s era) and modern bathymetries and landscapes of Jamaica Bay. Below, we describe our landscape reconstruction (Sect. 2.1), our modeling approach (Sect. 2.2), our hazard assessment methodology (Sect. 2.3), and the set of experiments designed to isolate the specific landscape changes that result in growing storm tides (Sect. 2.4).
2.1 Jamaica Bay landscape reconstructions
Although maps and charts of the Jamaica Bay landscape extend back to the 17th century (Sanderson, 2016), the first thorough bathymetric and topographic maps were made by the US Coast Survey between the 1840s and 1870s. The first tidal measurements also date from this period (e.g., Talke and Jay, 2013). Because the 1870s time period predates most channel deepening, this period constitutes a good proxy for conditions prior to major 20th century anthropogenic modifications.
To develop numerical models of the “present-day” and 1870s conditions, we first created digital elevation models and land cover maps at 30 m resolution. The domain extends eastward and northward to land up to 6 m NAVD88 elevation and extends westward past Coney Island. The landscape reconstruction from the 1870s forms a waypoint between the pre-European landscape of ca. 1609 and modern conditions (Sanderson, 2016). Since no bathymetric data are available from before the 19th century, comparisons between the 1600s and 1800s are qualitative (see Sect. 4.3).
2.1.1 Present-day landscape
The present-day digital elevation model is based (by order of preference) on United States Geological Survey (USGS) bathymetric and topographic data collected by lidar in 2013–2014, slightly older data collected in 2007–2008 by Flood (2011), and older National Oceanic and Atmospheric Administration (NOAA) bathymetric survey data for a few remaining small areas of the bay. The lidar data cover dry land, marsh islands, and shallow waters (shallower than approximately 2 m), and the Flood (2011) data cover the navigation channel and other deepwater regions. Bare-earth land elevations in populated areas are based on 2010 New York City lidar data. Present-day land cover data for the Jamaica Bay watershed at 30 m resolution are from the 2011 National Land Cover Dataset (NLCD), as described in Homer et al. (2015).
2.1.2 Historical landscape data
Bathymetric and benthic character data for the 1870s model are from a pair of H-sheets from 1877 and 1878 for Jamaica Bay: Maynard (1877) and Moore (1878). The Maynard (1877) survey was drawn at 1:5000 scale, while the Moore (1878) survey was drawn at a scale of 1:10 000. Both show grids of depth surveys, with parallel lines approximately 100 m apart and with sounding data approximately every 20 m (Fig. 3). Moore (1878) includes depth contour lines that mark out channels between the marshy islands and other underwater features. While earlier H-sheets depicted the bathymetry of Rockaway Inlet and Broad Channel, the Maynard (1877) and Moore (1878) manuscript maps are the first to depict the bathymetry of the entirety of Jamaica Bay. Approximately 20 000 individual sounding points were digitized to describe the interior of the bay. Raw data were corrected for tidal stage and reduced to the mean low water datum, based on local tide gauge measurements. Since we have recovered and digitized these hand-collected tide records from the US National Archives (see e.g., Talke and Jay, 2017), we are able to validate our model results for the historical model against contemporary 1870s data (see Sect. 2.2).
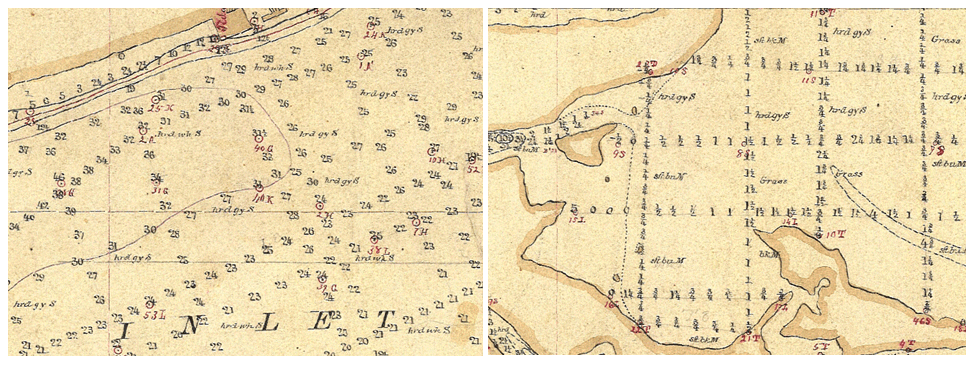
Figure 3Detail view of two portions of the 1877 survey dataset (left panel) at Rockaway Inlet (at bottom left of Figs. 1 and 2) and (right panel) a shallow bay area with mud, sand, and grass areas (Maynard, 1877). Shown are measured depths (in feet) and bottom characterization notes (e.g., “sft” for soft, “hrd” for hard, “gy” for gray, “S” for sand, “M” for mud, and “Grass” likely for eelgrass beds), with typical spacing of 100–150 m. The mapped area on the right is now covered by fill and a former airport, Floyd Bennett Field.
Topographic and land cover data were digitized and synthesized from T-sheets and other surveys drawn by Bien and Vermule (1891b), Bache (1882), Bien and Vermule (1891a), Dorr (1860), Gilbert (1855, 1856a, b), Gilbert and Sullivan (1857), Jenkins (1837a, b), Powell (1891), and Wilson (1897). Historic maps and charts were georeferenced using a first-order rectification to the modern city grid with less than 50 m root mean square error using control points located at road intersections, buildings, railroads, or other features that are present historically and can be located today. To reduce to a common datum and assess temporal evolution, we tracked the datum of each map or chart and the publication date.
Because historical surveys usually neglected intertidal areas, we use inferential techniques to approximate the historical elevations within this region using known plant cover data. Specifically, the present-day vertical zonation of salt marshes around New York City was used to approximate the historical elevation of marshes. The seaward extent of salt marsh was assumed to represent the mean sea level (the lower edge of the low salt marsh; Edinger, 2014), while the landward edge was assumed to represent the extent of the highest astronomical tide flooding (the upper edge of the high salt marsh; Edinger, 2014). Locations where maps showed a contour between low and high salt marsh were assigned an elevation equal to mean high water.
Vertical datum adjustments were made by relating the topographic zero of each map and chart to the mean sea level reconstruction provided by Kemp and Horton (2013). They studied foraminiferal assemblages over the past 2 centuries from salt marsh sediment in nearby Barnegat Bay, New Jersey. Their results were used to identify the mean sea level in the southern coastal areas of New York City at the time the map or chart represents. To estimate the NAVD88 elevation of the topographic zero for the map, we noted that the Kemp and Horton (2013) study places the zero level of their sea level reconstruction at 0.10 m above NOAA's modern (1983–2001) mean sea level datum in Barnegat Bay, which was converted to NAVD88 using NOAA Tides & Currents adjustment values for Barnegat Inlet (Station 8533615).
Raster digital elevation models (DEMs) were created in ArcGIS 10.3 with the “Topo to Raster” interpolation method to create hydrologically correct DEMs (ESRI, 2016).In addition to contour line and point elevation data, historical stream and pond data were also added. To preserve the winding characteristics of marsh creeks during the interpolation, creek beds were converted to point features, and their elevation was set at the mean low water datum of the appropriate date.
2.2 Flood and tide modeling and validation
A hydrodynamic model was applied to the historical and modern “landscapes” (land surface elevation and roughness) and used to simulate an ensemble of storm tide events described in Sect. 2.3. The Stevens Estuarine and Coastal Ocean Model (sECOM) is a free-surface, hydrostatic, primitive equation model with terrain-following (sigma) vertical coordinates set on an orthogonal, curvilinear Arakawa C-grid (Georgas and Blumberg, 2010; Blumberg et al., 1999). The model has been further developed with regard to wind stress formulations (Orton et al., 2012), coupled wave modeling (Georgas et al., 2007), and land wetting and drying (Blumberg et al., 2015). It has been used to provide validated and accurate ensemble 3D storm tide predictions as part of the NY Harbor Observation and Prediction System (NYHOPS; Georgas and Blumberg, 2010) and the Stevens Flood Advisory System (Jordi et al., 2018). Typical errors in hindcasts of extreme storm tides (e.g., Hurricane Sandy) are 0.15–0.20 m (Orton et al. 2016b).
The Jamaica Bay model grid was a 30 m×30 m square-cell grid (Orton et al., 2015). This grid was doubly nested inside two larger model domains that represent (1) the regional coastal ocean and estuaries from Maryland to Cape Cod and (2) the Atlantic Ocean from Cape Hatteras to Nova Scotia (Orton et al., 2016b). Storm meteorological forcing for the regional and large-scale grids was spatially and temporally variable and is described in Orton et al. (2016b) and the next section.
Simplifying assumptions are used for the model simulations on the Jamaica Bay grid for computational efficiency in simulating a large number of storms. While the regional coastal and estuary modeling used 3D simulations, the model's 2D mode was used for Jamaica Bay (e.g., Orton et al., 2015). This is a common practice in estuary storm tide modeling (Familkhalili and Talke, 2016; Kennedy et al., 2011). While stratification can have a small influence on storm tides in stratified estuaries (Orton et al., 2012), Jamaica Bay has limited freshwater input and weak stratification (Marsooli et al., 2018). For computational efficiency and because our focus here is on storm tides and “still-water” elevations, a wave model is not coupled with the local Jamaica Bay grid. The broad shallow continental shelf at the apex of the New York Bight leads to relatively small impacts of waves on estuary storm tide temporal maxima (e.g., due to wave setup; Marsooli and Lin, 2018; Lin et al., 2012). Lastly, the time-varying meteorological forcing was assumed spatially constant on the Jamaica Bay grid because the bay is only ∼10 km wide.
The gridded land elevation and land cover type datasets for the 1870s and present day were interpolated onto the model grid to create land elevation and Manning's n roughness model input files. The 30 m resolution modeling does not resolve fine-scale features such as elevated seawalls, though they are rare in this area. In 2D tide and storm surge modeling studies, a common simplified approach (Irish et al., 2014; Mattocks and Forbes, 2008; Szpilka et al., 2016) to representing the effects of wetlands and other natural features is to treat them as enhanced landscape roughness features through a variable called Manning's n. Reasonable estimates for Manning's n values are 0.045 for intertidal wetlands and eelgrass (Zostera marina) beds, 0.020 for unvegetated continental shelf and estuary substrate, and 0.10 and 0.13 for medium- and high-intensity developed land, respectively (Mattocks and Forbes, 2008). This approach has previously been applied to Jamaica Bay (Orton et al., 2015).
Depending on the purpose, different mean sea levels were used in the study. To determine habitat and tidal datum changes, we run tide-only simulations using the mean sea level that existed for a given landscape year. Storm simulations for both the modern and historic (1870s) period use 2015 mean sea level to quantify the effect of landscape change on flood hazard and isolate this process from the effect of sea level change. Mean sea level for the 1870s was −0.28 m (Kemp and Horton, 2013), and in 2015 it was +0.09 m (based on smoothed recent trends), both relative to the 1983–2001 mean sea level datum at the Battery (NOAA station 8518750). These values are −0.37 and 0.00 m NAVD88, respectively, based on conversions for the Jamaica Bay Inwood tide gauge (USGS station 01311850). An elevated (or reduced) mean sea level was imposed as a constant offset to a given simulation's offshore elevation boundary conditions at the edge of the Jamaica Bay grid. This is a reasonable simplification here because recent work showed virtually no change to tides at nearby Sandy Hook (NOAA station 8531680) when there is sea level rise (below a 1 % change to tide range per meter of sea level rise; Kemp et al., 2017).
Tide-only simulations for 1878 were run for a 40 d period that overlapped with water level observations made from 13 August through 21 September 1878 at a pier on the north side of the Rockaway Peninsula (Fig. 1). The tide simulation for the present day covers a 35 d period from 1 August through 5 September 2015. Since wind forcing during the late summer is typically weak, these tide-only simulations are useful for direct validation of the model.
Model validations were performed for the 1870s era model, and the present-day model was previously validated (Orton et al., 2015). The prior storm validation of the present-day model for Hurricane Sandy showed a time series RMSE of 20 cm and high water mark RMSE of 19 cm (Orton et al. 2015). The tidal validations here use summertime periods without strong wind influences, and modeled time series were compared to observations for both 1878 and 2015 using RMSE and the Willmott skill (e.g., Warner et al., 2005). The 2015 period included 7920 samples taken at 6 min intervals over a 33 d period at the Inwood USGS gauge station. The 1878 period included only daytime measurements, with 2438 samples taken at 10 min intervals over a 37 d period at the Holland House pier on the north side of Rockaway Peninsula. The mean error is subtracted before computing statistics to account for possible remote sea level anomalies or steric sea level variations and because the 1878 tide staff datum is poorly known. The results for the tide modeling time series validation for 1878 were 0.09 m RMSE and 0.991 skill, while the results for the 2015 period were 0.09 m RMSE and 0.989 skill.
Historic and modern tidal datums, tidally wetted area, and intertidal zones were assessed by the following methodology. First, simulated water levels after a 2 d spin-up period were harmonically analyzed (Pawlowicz et al., 2002) at historic gauge locations. A year-long synthetic tide time series was then produced using appropriate nodal corrections, and once- and twice-daily water level minima and maxima were compiled and averaged to compute tidal datums such as mean lower low water (MLLW) and mean higher high water (MHHW). The tidally wetted area was then defined as the area wetted at high tide in Jamaica Bay after MHHW conditions at Rockaway Inlet. The intertidal area is similarly defined as the difference between the tidally wetted area and the area flooded at the low tide occurring after a predicted MLLW tide at Rockaway Inlet.
2.3 Probabilistic flood hazard assessment
A probabilistic flood hazard assessment was used to quantify the annual probabilities of exceedance (or inversely, the return periods) for any given storm tide. We applied the storm set and statistical framework utilized by Orton et al. (2016b), which employed a joint probability method of flood hazard assessment that is an ensemble simulation of a diverse set of possible storms (the storm climatology) including both synthetic tropical cyclones (TCs; e.g., hurricanes) and historical extratropical cyclones (ETCs; e.g., nor'easters). The synthetic TCs spanned all combinations of a complete range of intensities (6 bins), sizes (3 bins), speeds (3 bins), landfall locations (5 bins), and angles (3 bins), and each simulated TC had an estimated annual frequency of occurrence based on an extensive simulation with a statistical–stochastic TC model (Hall and Yonekura, 2013). The wind and pressure meteorological forcing for ETCs came from historical reanalysis data from Oceanweather, Inc., whereas the forcing for TCs came from simplified parametric TC models. The assessment methods were validated by comparison to historical data at multiple levels of the study, demonstrating unbiased storm tide simulations and storm tide hazard estimates (versus return period) relative to historical events (Orton et al., 2016b). Additional details of the assessment, including historical data, validations, storm climatology development, statistical analysis, and uncertainty quantification, are given in Orton et al. (2016b). The storm tide modeling results from the larger-scale model grids in this prior study were applied as offshore boundary conditions to the Jamaica Bay domain simulations for the present study.
Some simplifications of the application of the Orton et al. (2016b) flood hazard assessment to our Jamaica Bay submodels are noted here. The prior flood hazard assessment included 1516 storm simulations (606 TCs and 961 ETCs), but we use an abbreviated storm set to reduce the computational expense. The abbreviated set of 80 ETCs includes all the same storm events but fewer random tide permutations for each storm. Instead of 50 simulations for the top 19 historical ETC storm tide events, there were 5 or 10 simulations each for the 11 highest ETC storm tides that are most relevant for the 5-year and higher return periods. The abbreviated set of 64 TCs includes a range of storm tide events from low to high magnitude (1.5 to 6.0 m). Model results for simulated TC events at a given magnitude are then used as a proxy for all the events at that magnitude, thus representing all 606 storms. A statistical comparison of the abbreviated versus full storm set showed minor differences of less than 5 % across 5- to 500-year storm return periods, validating our approach. The historic and modern model landscapes are subjected to the same set of storms, and therefore any differences in storm tide hazard reflect geomorphic changes rather than artifacts of the simplified hazard assessment.
2.4 Hurricane storm surge leverage experiments
Simple “leverage experiments” were then used to isolate the effects of specific historical landscape changes on the simulated water levels during a fast-moving, Category 3 hurricane that approximates an event from 1821 (Orton et al., 2015). The storm surge from this hurricane (3.4±0.4 m) likely exceeded the surge in Hurricane Sandy (2.76 m) and produced water levels of ∼3 m above the 1821 mean sea level despite occurring near low tide (Orton et al., 2016b). Meteorological forcing for the simulations was created from parametric models (Orton et al., 2015). The following experiments were performed using modifications to the modern-day landscape to mimic the historical landscape's main features one by one:
-
tapered shallowing of the channel depth from offshore (8 m) into the inlet (5 m) and into the innermost areas of the bay (1 m depth);
-
narrowing of the inlet so that its narrowest point is reduced by 50 %;
-
bay perimeter floodplain and wetland restoration, including reducing elevation and altering friction coefficients to represent wetland land cover;
-
wetland restoration in the center of bay to the 1870s footprint;
-
inclusion of additional roughness to mimic the effect of eelgrass and oyster shells;
-
restoration of a shoal off the west end of Rockaway Peninsula;
-
shallowing the deep borrow pit area on the northeast side of the bay;
-
restoration of the landform north of the inlet to wetlands;
-
narrowing channels in the interior of the bay.
Our digitization of the historical landscape shows that changes to Jamaica Bay land cover and elevation since the 1870s are dramatic, with widespread urbanization of upland areas and marshlands that once surrounded the bay. Maps of estimated Jamaica Bay area land cover for the present-day and 1870s periods are shown in Fig. 4. The most dramatic land cover change is from large areas of fringing wetlands (light blue) to urbanized areas (red), but also the center of the bay has shifted from marshes to open waters (dark blue). Mapped land elevations (topography, bathymetry) and Manning's n roughness values are shown in Fig. 5. Obvious geomorphic changes include a lengthening of Rockaway Peninsula and reconfiguration of the inlet (bounded by red lines). The land roughness (Manning's n) change reflects the widespread change from marshes (light blue) to urbanized land (red) or open water (dark blue). These changes in habitat type are quantified in Sect. 3.1 below.
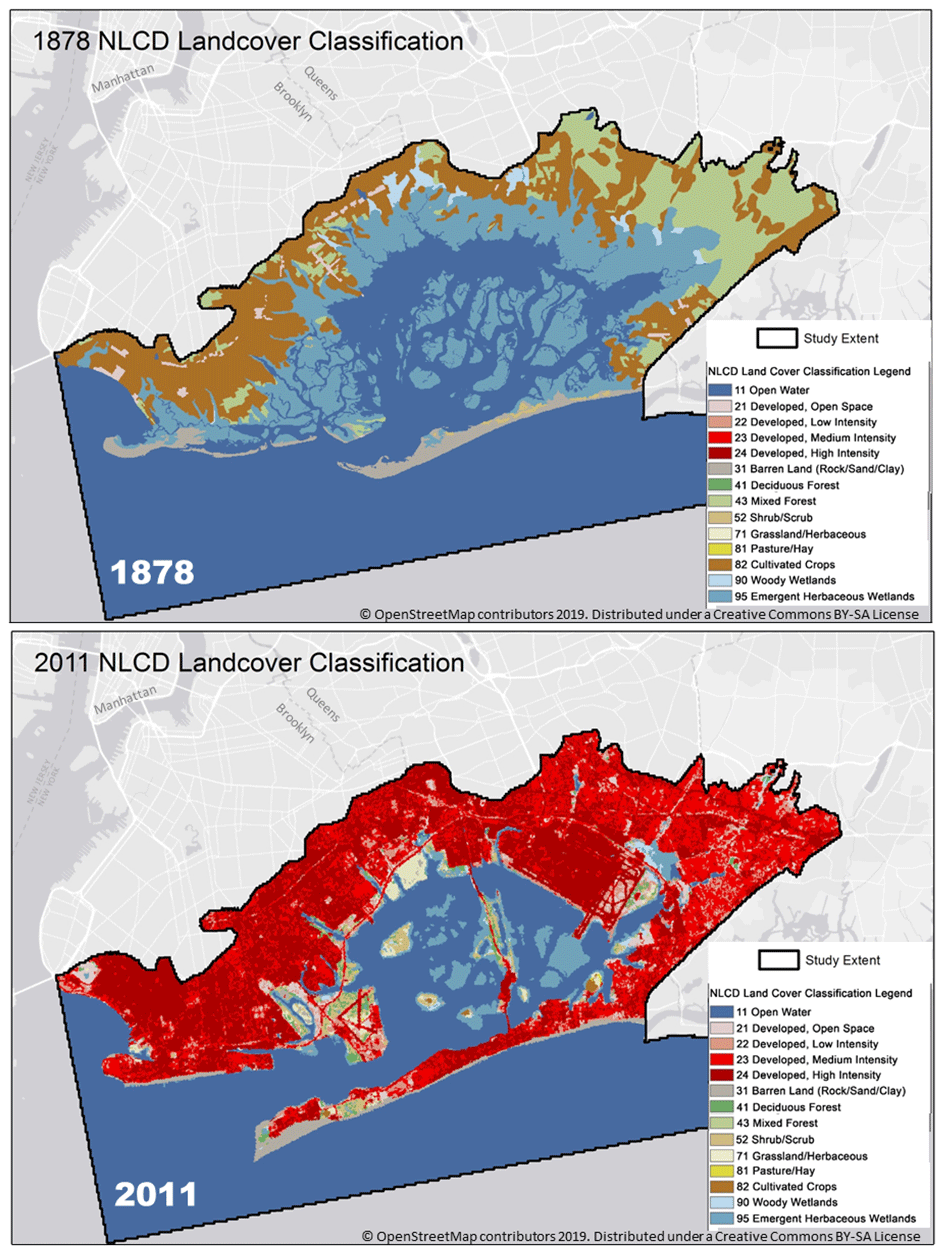
Figure 4Land cover of the Jamaica Bay watershed (top panel) reconstructed for the 1870s and (bottom panel) for present day.
Simulations suggest that the mean water depth in Jamaica Bay has increased by either 2.8 or 3.1 m, with the exact result dependent on how calculations are made. If only wetted regions are included in the average, water depth in Jamaica Bay increased from 1.7 to 4.5 m between the 1870s and 2015; of this change, 0.37 m can be attributed to sea level rise. If the entire tidally wetted bay area is used in an average (with dry grid cells included as zero depth), a historical and modern mean depth of 1.1 and 4.2 m is found. Our values are consistent with and improve upon the approximate estimate of a historical change from 1 to 5 m made by Swanson et al. (1992). In conclusion, our results show a large historical change in bay-wide mean depth but slightly smaller than prior studies have suggested.
3.1 Habitat changes
The surface areas of many habitat types have changed dramatically since the 1870s in spite of an only 23 % reduction in interior bay area wetted by average daily high tides (Table 1). The reduction in total area is caused by the reclamation of fringing floodplain and marshlands but is partially offset by a growth of the bay westward due to an increase in inlet length.
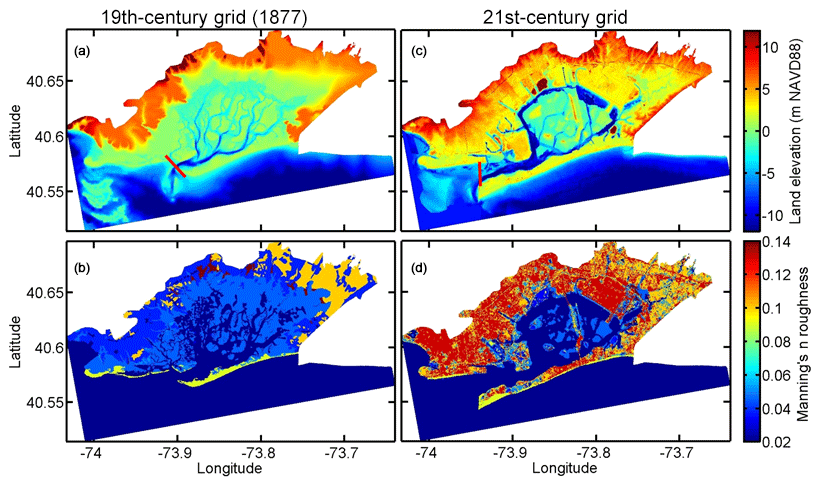
Figure 51870s and early 21st-century landscape data used as inputs to the hydrodynamic model. Panels (a, c) are land elevation maps, and (b, d) are land cover roughness (Manning's n) maps. Panels (a, b) show the 1870s and (c, d) show the present-day landscape. Red lines delineate the inlet boundary for defining the interior of the bay and tidal prism.
Table 1Estuarine habitat types and their area for the 1870s and present day.
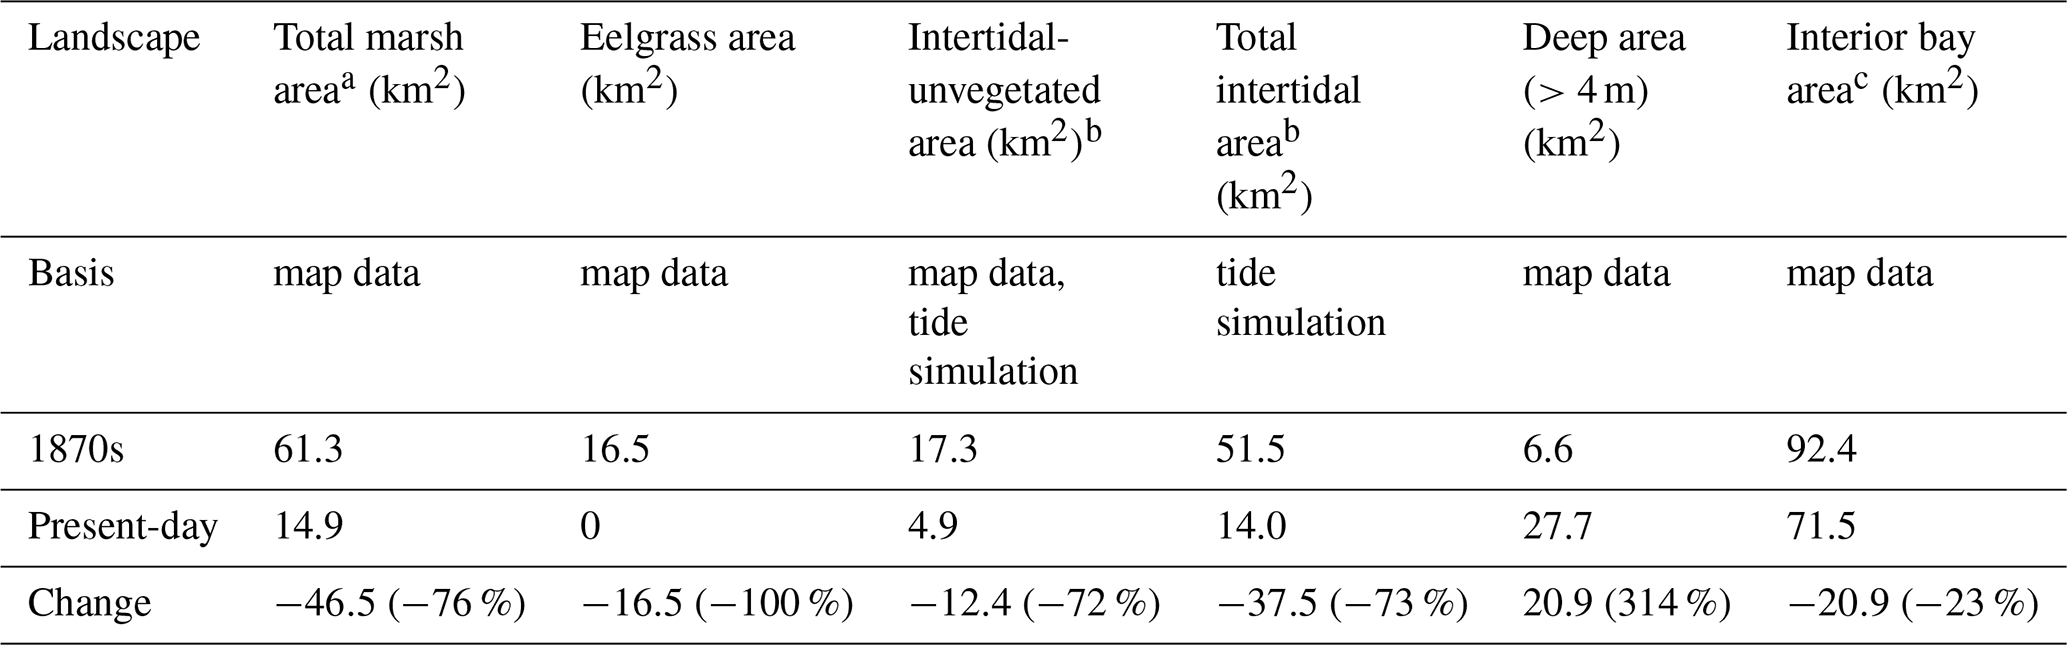
a Includes all saline marsh and freshwater marsh within the model domain, some not tidal; b intertidal area is the difference in area wetted by MHHW and MLLW, based on modeling (Sect. 2.2); c interior bay area is the wetted area at MHHW, based on modeling (Sect. 2.2).
Total marsh area has declined by 76 %, eelgrass area by 100 %, intertidal unvegetated area by 72 %, and total intertidal area by 73 %. The deepwater area (>4 m) has increased by 314 % (or alternatively, the 1870s had 76 % less deepwater area than the present). The estimates for wetland area and loss are nearly identical to the prior estimate of a loss of 75 %, from 64 to 16 km2 (NYC-DEP, 2007), but here we provide greater context of changes to other habitat types. The habitat type changes are computed within the differing bay interiors for the 1870s and present day, as enclosed by inlet boundaries (red lines) shown in the top panels of Fig. 5.
3.2 Storm tide changes
The flood hazard assessment shows similar basic features as found in the prior study of New York Harbor form which methods and offshore model boundary conditions were taken (Orton et al., 2016b). The estimated storm tide for return periods below 30 years is determined predominantly by the relatively frequent extratropical cyclones, and the curve (Fig. 6) has a relatively small slope of storm tide with increasing return period. For return periods above 30 years, tropical cyclones become increasingly important, and the slope abruptly increases at about the 70-year return period.
Table 2Storm tide elevation and flood area for 1870s versus present-day landscapes*.
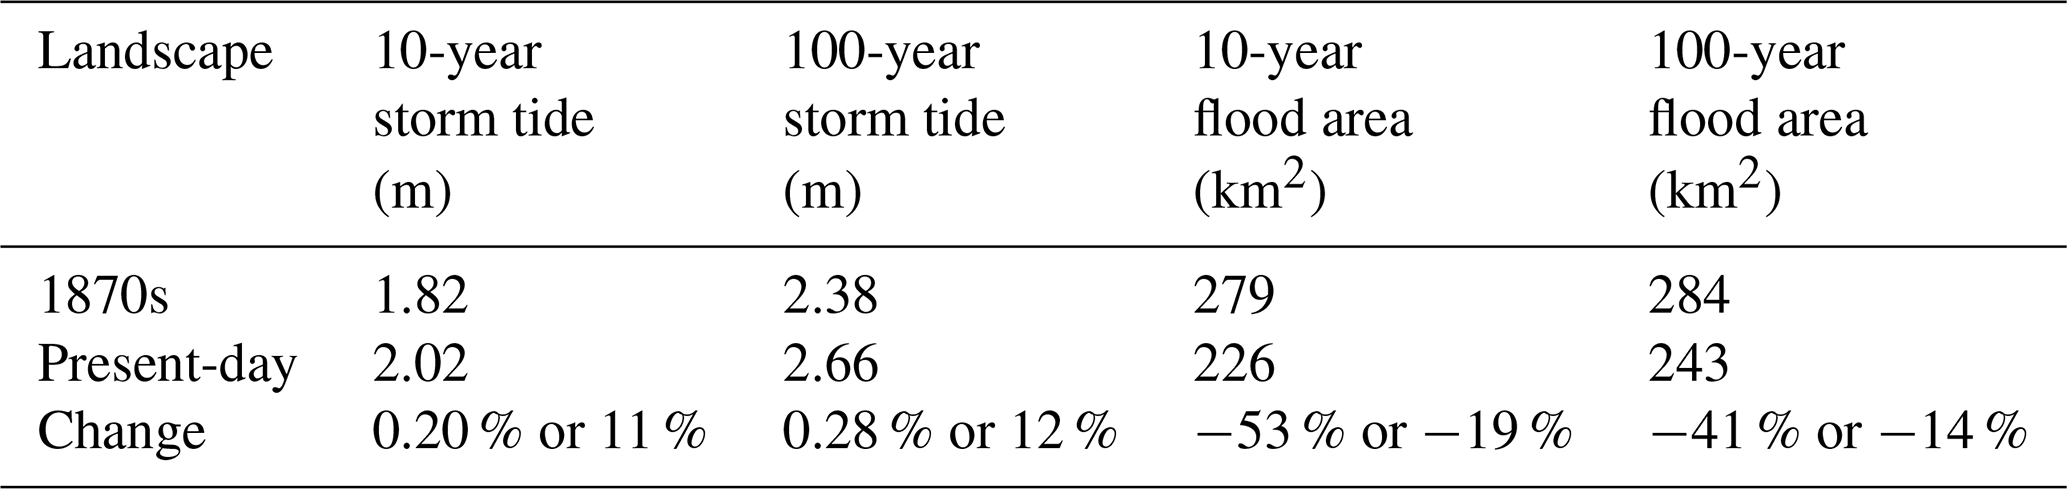
* These are tallied across the entire model domain.

Figure 6Storm tide exceedance curves at Inwood (eastern end of the bay) for the 1870s and present-day Jamaica Bay landscapes. Storm tide is the water level above mean sea level, and storms for both cases were simulated with the mean sea level for 2016.
The results reveal that storm tides are markedly larger on the present-day landscape than the historical landscape across a wide range of return periods (Fig. 6; Table 2). Holding sea level constant at 2015 levels, the modern 10- and 100-year storm tides of 2.02 and 2.66 m are larger than historical simulations by 0.20 and 0.28 m, respectively, at the eastern end of the bay (Inwood). By contrast, sea level rise effects are small; when we simulate storms in the 1870s landscape with the 1870s sea level, the 100-year storm tide difference increases by 0.02 m, from 0.28 to 0.30 m. The increase in storm tides is attributable to decreased frictional effects, which scale as 1∕H (e.g., Friedrichs and Aubrey, 1994). Because the ∼3 m increase in average depth caused by landscape changes is much larger than the ∼0.37 m increase in sea level, landscape changes dominate long-term changes to flood hazard.
Storm tides for the 1870s landscape are seen to clearly decrease with distance into the bay, with the 100-year flood elevation declining from 2.54 m outside the inlet to 2.42 m in the eastern part of the bay (Fig. 7). By contrast, present-day storm tides (and tides) amplify within the bay, and therefore the 100-year flood hazard increases from 2.56 (outside the inlet) to 2.70 m (eastern bay).
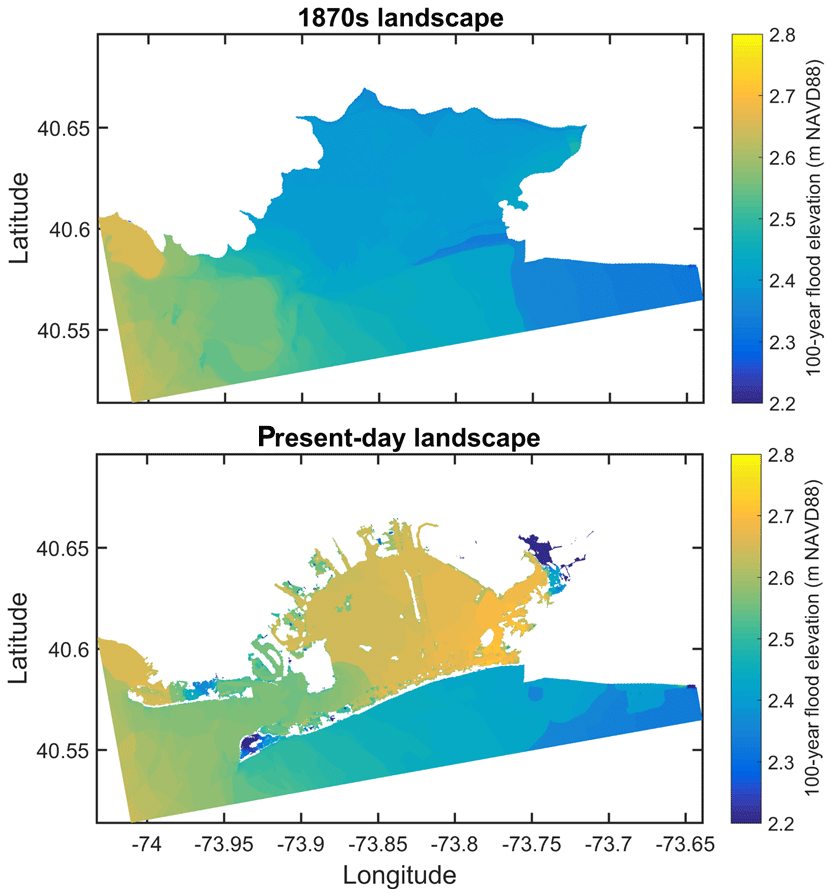
Figure 7Maps of the 100-year flood for the present-day and 1870s landscapes. In both cases, floods were simulated with a 2016 mean sea level.
Increases in storm tide magnitudes in the bay do not necessarily lead to increases in flooding extent. While Fig. 6 shows that storm tides are increased substantially by the landscape changes from the 1870s to present, Fig. 7 demonstrates that the flooded area has substantially decreased for the 100-year flood. Table 2 shows that the 100-year flood area decrease is 41 km2, and the 10-year flood area decrease is 53 km2 across the model domain (both including the Coney Island and Jamaica Bay areas). The simple explanation for this is that fringing marshes across the region that were −0.25 to 0.50 m NAVD88 elevation in the 1870s were converted using landfill into elevated neighborhoods and airports at 1.5–3.0 m NAVD88 and thus are above this extra 0.20–0.28 m of storm tide. Similarly, for the United Kingdom the frequency of extreme sea level events increased over the last 100 years, yet coastal flooding has not increased (Haigh and Nicholls, 2017) because of improvements in forecasting and warning as well as flood defenses.
It was previously established that the bay's tide ranges have grown substantially (Swanson and Wilson, 2008), and we find similar results. Averaging high and low waters for daytime minima and maxima in 1878 over 37 d gives an observed tide range of 1.35 m, while observations for the entire year 2015 show a tide range of 1.73 m. This increase of 28 % is smaller than the prior estimate of the tide range change from 1899 to 2000 from Swanson and Wilson (2008), which was 1.16 to 1.64 m, or 41 %. However, the 1878 measurements are for a location at midbay (Holland House), whereas the 1899 measurements are for the easternmost end of the bay (Inwood or Norton Point), where tide attenuation (e.g., due to narrow, shallow channels and wetlands) was likely more pronounced.
3.3 Leverage experiment results
Three of the leverage experiments led to large reductions in hurricane storm tide. The tapered shallowing leads to a change in the peak hurricane storm tide of −56 cm, or −23 % (Fig. 8a and b). The inlet narrowing leads to a change of −19 cm, or −8 % (Fig. 8c and d). Bay perimeter floodplain and wetland restoration results in a change of 31 cm, or −13 % (Fig. 8e and f). All the other landscape changes showed smaller impacts, indicating that they likely play little role in the long-term changes to storm tides. For example, extensive wetland restoration in the center of the bay (not the fringing wetlands) leads to a change in peak storm tide of only −2 % . A small rise in Manning's n across the entire bay's seabed from 0.020 to 0.025 (mimicking bay-wide lost eelgrass, sand bedforms, or shells) changed the peak by −3 %.
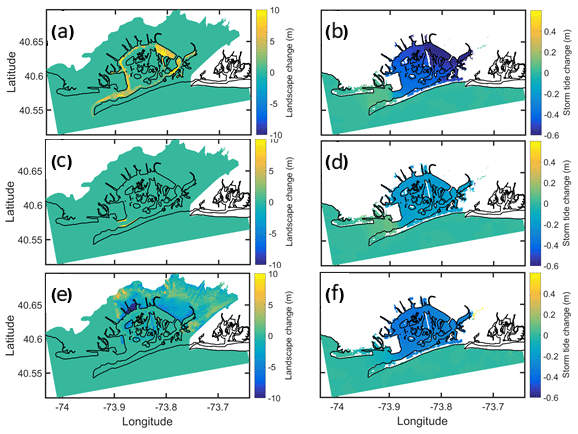
Figure 8Results of “leverage experiments” used to isolate the effects of specific historical landscape changes, testing their influence on the storm tide for a Category 3 hurricane. Panels (a, c, e) show the imposed changes made to the present-day landscape, where the black line shows the present-day coastline. Panels (b, d, f) show the resulting modeled storm tide changes. Panels (a, b) are channel shallowing, (c, d) inlet narrowing, and (e, f) interior floodplain restoration.
In recent centuries, human activities have greatly modified the geomorphology and ecology of coastal regions, yet studies of historical and possible future changes in coastal flood extremes typically ignore the influence of geomorphic change (e.g., Lin et al., 2016; Orton et al., 2019). Jamaica Bay exemplifies an extreme case of “estuary urbanization” marked by landfill, diking, channel deepening, and wetland loss (e.g., Marsooli et al., 2018). The upland changes reflected in Figs. 4 and 5 and Table 1 include widespread landfill and urbanization of fringe wetlands, the most visible result of these activities. Our results show that urbanization extends below the estuary water surface, with deepening of channels for shipping and excavation of borrow pits for landfill. The primary insight from this study that estuary urbanization amplifies storm tides likely applies to many urban subembayments worldwide since basin engineering and wetland landfill for port development are globally common and ongoing processes (e.g., Murray et al., 2014; Paalvast and van der Velde, 2014; Schoukens, 2017). Systems with likely impacts include those with substantial changes to inlets, mean estuary depths, and wetland landfill or reclamation (Talke and Jay, 2020) and could potentially be identified by observed long-term changes to tides.
As discussed below (Sect. 4.1), the leverage experiments demonstrate that the specific changes to the bay that amplify storm tides (channel, inlet depths and widths, landfill) were all directly imposed by humans. Some contribution of the landscape and storm tide changes, such as the wetland erosion in the center of the bay, may be influenced by natural erosion or changing sediment supply (Peteet et al., 2018; Hu et al., 2018; Wang et al., 2017). However, the complex morphologic study required to separate these human and natural factors is beyond the scope of the present study. A broader discussion of the influence of the landscape changes on estuarine conditions and processes is given below (Sect. 4.2). Broader discussions of the multicentury landscape change at Jamaica Bay (Sect. 4.3) and the general implications of these results for dredged harbors and urbanized estuaries (Sect. 4.4) are also included herein.
4.1 Anthrogeomorphic amplification of storm tides
The 1870s landscape mitigates storm tide elevations (Fig. 6) and damps them as they propagate into the bay (Fig. 7) by several mechanisms identified in the leverage experiments (Fig. 8). First, the natural floodplain and its wetlands act as a storage reservoir, allowing a given volume of water to spread over a larger area but rise to a lesser vertical extent than a confined (modern) system (Fig. 8e and f). Second, as also pointed out in Orton et al. (2015), the shallower historical channels produce a more frictional environment that damped long waves such as tides and storm surge (Fig. 8a and b). Third, the narrower (Fig. 8c and d) and shallower inlet alter the impedance of the storm surge entering the estuary.
As has been shown previously, extensive wetland restoration in the center of the bay (not the fringing wetlands) leads to a change in peak storm tide of only −2 % because deep shipping channels around the wetlands are the primary conduit for flood waters (Orton et al., 2015; Marsooli et al., 2016). These results are also consistent with prior studies that showed that the influence of lagoonal wetland loss on water levels is different when it comes to lateral erosion versus landfill reclamation. Reductions in the tidally wetted area through wetland reclamation increase storm tides, while wetland retreat due to lateral erosion has the opposite effect (e.g., Donatelli et al., 2018; Picado et al., 2010).
Scaling suggests that the conveyance of long waves (e.g., storm surges, tides) through an inlet into a lagoonal estuary depends on the inlet choking number , i.e., on the drag coefficient (Cd), inlet width (b), length (L), and depth (H) as well as tide or surge amplitude (η), the long-wave period (T), and estuary surface area (Ae; e.g., MacMahan et al., 2014; Stigebrandt, 1980). For decreasing values of P, the inlet is increasingly “choked”, meaning that long-wave amplitudes strongly decrease entering the lagoon. For low values of P (below 5), choking becomes important, and for high P (above 10), the inlet geometry is unimportant (Stigebrandt, 1980). The dependence of P on H3∕2 conveys a strong sensitivity to water depth, and dependencies on b and Ae convey modest sensitivities to inlet width and estuary area.
Our landscape reconstruction and numerical results suggest that the choking of long waves at Rockaway Inlet has been strongly reduced. For typical tides, we estimate that P increased from 4.5 in the 1870s to 13 at present. For a large-amplitude, short-timescale storm surge such as the 1821 hurricane, P has changed from 0.69 to 2.0. These changes are driven by a 41 % increase in the inlet's average depth (from 6.0 to 8.5 m), a 50 % increase in average width (from 1000 to 1500 m), and a 23 % reduction in bay area. A lengthening of the inlet (from 6600 to 9900 m) due to the growth of Rockaway Peninsula slightly counteracts these effects on choking number, however. Measured at its minimum along-inlet location, there is an 85 % increase in the cross-sectional area of the inlet, from 4800 to 8900 m2. Reflection and possibly resonance likely play a role in the amplification of tides in the present-day estuary, whereas the shallow water depths and frictional effects of fringing wetlands would also reduce these effects in the 1870s system.
The dependence of the inlet choking number on both geometric properties and long-wave characteristics helps interpret numerical results. Changes to inlet geometry and channel depth have most strongly changed the large-amplitude, high-impact storm surges caused by TCs such as the 1821 event. Smaller-amplitude events (e.g., ETCs) are less likely to be affected by inlet geometry; this is one of the reasons that there is a lesser change in the 5-year storm tide than the 100-year storm tide (Fig. 6). The difference between the 500-year storm tide for 1877 and present-day landscapes is not larger than that of the 100-year storm tide. This may arise because overtopping of Rockaway Peninsula becomes important, circumventing the inlet and invalidating the above scaling arguments.
Similarly, the tide or surge timescale (wave period) T impacts the conveyance of surge or tide into estuaries and back bays (Aretxabaleta et al., 2017; Kennedy et al., 2011) as well as the damping that occurs within them (Orton et al., 2015). Slow surge events such as Hurricane Sandy (e.g., those building to a peak over more than 18 h) are less affected by hydrodynamic drag (due to smaller flow velocity), potentially producing more severe estuarine floods (Familkhalili and Talke, 2016; Orton et al., 2015). These considerations suggest that modeling flood hazard or designing infrastructure using a representative “storm of record” can produce bias; instead, using an ensemble approach (such as that used here) with both small- and large-timescale events produces better results.
The primary reasons for increased storm tides – the floodplain (bay area) reduction, inlet width and depth increases, and bay channel depth increases (Fig. 8) – were all imposed by human activities such as landfilling, dredging, inlet stabilization (e.g., with the jetties), and shoreline hardening. Moreover, sea level rise of 37 cm since the 1870s raised total water levels during storms but only changed the storm tide by 2 cm. Because the ∼3 m increase in average depth caused by landscape changes is much larger than this increase in mean sea level, landscape changes dominate the long-term changes to flood hazard. Therefore, we conclude that the amplification in storm tides is primarily of anthropogenic origin.
4.2 Ecological importance of landscape changes since the 1870s
The present-day landscape of Jamaica Bay supports a highly eutrophic but in many ways healthy estuarine ecosystem, with oxygen levels slowly rising over recent decades (Walsh et al., 2018; NYC-DEP, 2018). However, the abundance of various indicator species, particularly those that depend on intertidal habitats (e.g., diamondback terrapin), has continued to decline (Walsh et al., 2018). Here, we note some likely ecological influences of the landscape and habitat changes summarized in Figs. 4 and 5 and Table 1.
Our landscape reconstruction confirms that the bay's eelgrass beds have disappeared completely, and wetland area has declined dramatically since the 1800s. The wetland decline may be stopped with marsh island restoration and reconstruction activities, which have been occurring over the past decade (Seavitt et al., 2015). Eelgrass beds provide many similar ecological services in estuaries, including nursery and refuge for a diverse and dense faunal community, trapping of sediment, and erosion prevention (Orth et al., 2006). They are known to decline in eutrophic conditions due to the reduced sunlight that results from increased turbidity (Vaudrey et al., 2010; Orth et al., 2006). Salt marshes are widely known for their ecological importance, including many of the same roles as eelgrass beds but also including intertidal habitat. At Jamaica Bay, this habitat serves diamondback terrapin and birds such as the sharp-tailed sparrow, egrets, herons, and geese.
Our landscape reconstruction shows that unvegetated intertidal area has decreased by 12.7 km2, a loss of 74 %. This change is of equal magnitude in square kilometers to the loss of eelgrass beds (Table 1). Mudflats, sandbars, oyster and mussel reefs, and other unvegetated intertidal areas are forms of “shallows” and provide important habitats for benthic invertebrates like polychaetes, snails, clams, crabs, and blue mussels as well as birds that feed on them such as the oystercatcher and willet. They are also used by terrapins for feeding and by horseshoe crabs for reproduction.
The center of the bay (inside the channels that circle the bay today) has not only lost marsh islands, it has had its land elevation drop substantially, most areas by about 1 m since the 1800s (Fig. 5). What were once large expanses of intertidal unvegetated area have shifted to being subtidal. This drop may reduce the sediment supply to the remaining marsh islands' substrate during storms (Wang et al., 2017). Furthermore, an increased depth in front of the marsh can increase wave energy and promote lateral erosion (Fagherazzi et al., 2006). As a result, the loss of intertidal zones and associated increased water depths may be detrimental to the sustainability of the remaining marsh islands and their critical habitat.
The increase from 7 to 28 km2 of deep habitat areas (Table 1) may attract more large fish such as striped bass due to increased swimming space, the reduction in thermal variability caused by a deep water column, or stratified deep water's lower temperature in summertime. It is unknown whether there were more or fewer striped bass in Jamaica Bay in the 1800s, but their presence today has the benefit of supporting a small fleet of fishing charter boats. However, there are several square kilometers of poorly flushed deepwater regions, predominantly in Grassy Bay, immediately southwest of JFK Airport, that are prone to hypoxia and even anoxia in late summer, providing compromised habitat areas for many organisms (NYC-DEP, 2018).
Our landscape reconstruction and modeling suggest that the residence time of water within the bay has more than doubled between the 1870s and today, with potential adverse ecological implications. The residence time of water in an estuary that receives large wastewater-derived nutrient inputs like Jamaica Bay is an important control on hypoxia, with longer residence times often leading to worsened hypoxia (e.g., Sanford et al., 1992). A simple model of the residence time of a lagoonal-type estuary system is the volume of the bay divided by the tidal flux rate, the latter of which is the tide prism (volume of water between mean high water and mean low water) over the tide period (12.42 h; e.g., Sanford et al., 1992). For the 1870s landscape and sea level, the average modeled tidal prism of the bay was 8.0×10⁷ m3, and the volume was 9.7×10⁷ m3, leading to a residence time of 0.63 d. For the 2015 landscape and sea level, the average modeled tidal prism of the bay was 1.02×10⁸ m3, and the volume was 2.9×10⁸ m3, leading to a computed residence time of 1.5 d. This simple model was shown for the modern landscape to underestimate residence times (relative to modeled tracer releases) but nevertheless shows that the changes in bay morphology lead to a substantial increase in residence time by a factor of 2–3 mainly due to the much greater volume of the present-day bay. More detailed analyses of water quality and residence time have been performed in other recent studies, and these results are being reported on in separate papers but generally support this interpretation (Marsooli et al., 2018; Fischbach et al., 2018).
4.3 Earlier Jamaica Bay landscapes: the estimated 1609 landscape
The 1870s landscape of Jamaica Bay was already influenced by humans. Prior to European colonization, Jamaica Bay was likely more open to the ocean, with an actively migrating inlet located further to the east, a barrier island system, and extensive fringing marshlands but far fewer marsh islands than in the 1870s (Black, 1981; Sanderson, 2016). A less well-constrained model for the pre-European landscape was also produced for this study, and modeling suggests storm tide reductions (from offshore into the bay) were caused by the landscape of the 17th century (Orton et al., 2016a). The model was based on 17th- and 18th-century maps that showed coastlines and major features, such as an inlet which was in the center of today's Rockaway Peninsula and a general absence of marsh islands in the bay, calling the bay “Jamaica Sound”. However, the maps did not show bathymetry measurements, and therefore the actual hydrodynamic behavior of the system is highly uncertain relative to the 1870s and present-day landscape (Orton et al., 2016a). Ongoing research is helping improve our understanding of the landscape of the 1600s and long-term evolution through analyses of sediment cores from the west central area and eastern ends of the bay (Peteet et al., 2018). That study showed that European settlement led to increases in inorganic sediment delivered to the bay, likely due to forest clearance for agriculture and subsequent erosion, which may explain the increase in marsh island area in the 1700s and 1800s. These considerations suggest that, on century timescales, hard-to-quantify factors such as the anthropogenically mediated sediment supply may also exert an important influence on long-term system evolution.
4.4 Broader context
Remarkably, despite the visions of the Jamaica Bay Improvement Commission (1907) and the River and Harbor Acts of 1910 and 1925, the present-day commercial shipping activity through this largely man-made, 1 km wide, 8–16 m deep shipping channel (measured at Floyd Bennett Field, the narrowest part) is limited to an average of three one-way trips per day servicing gravel and sand companies, sewage treatment plants, and bulk fuel companies (USACE, 2016). Our results show that maintaining these shipping channels leads to higher storm tides in the bay even though the economic activity that justified their construction is largely absent.
Globally, common development approaches such as dredging for port development and landfilling for neighborhood development can have major economic benefits but can also raise vulnerability as they did for Jamaica Bay (Talke and Jay, 2020). The movement towards “New-Panamax” and larger ships is leading major harbors to dredge wider channels and depths of approximately 16 m (Briggs et al., 2015). Other dredged estuaries have been shown to cause enhanced inland propagation of storm tides, such as with the Cape Fear estuary (Familkhalili and Talke, 2016). The Mississippi River–Gulf Outlet Canal was originally created through dredging and was recently deauthorized and blocked in part because of a debate over whether it increased storm surge penetration inland (Shaffer et al., 2009). Within the St. Johns River, in Florida, channel deepening to a controlling depth of >14 m is continuing despite model results that showed increases in tide range and storm surge of 0.1–0.2 m in some locations (USACE, 2014).
The results presented here suggest that evaluating changes to flood hazard should be part of the cost–benefit analysis of any environmental impact study or restoration study, particularly projects that propose altering inlet geometry or channel depth. Our results can help inform debates about whether to continue maintaining underused ports since allowing inlets and channel depths to return to predevelopment geometry is potentially a way to mitigate against future sea level rise effects. Given adequate sediment supply, many systems quickly return to predevelopment depths; for example, the lower Passaic River in New Jersey has accumulated as much as 5 m of sediment after maintenance dredging ceased in the early 1980s (Chant et al., 2011).
This study applied a historical reconstruction approach for a case study of how natural and urbanized estuary systems modify coastal storm tides. A Jamaica Bay flood model for the 1870s was developed, and simulation results were contrasted with those from a present-day model to quantify the influences of 20th-century changes in bathymetry and habitat on storm tide hazard. The hydrodynamic model landscape (land elevation and friction) for the 1870s was estimated from detailed maps of topography, bathymetry, and seabed characteristics and validated using tide observations. The models were used for tide simulations, supplementing map data with tidal datums for additional analysis of habitat change (e.g., estuary intertidal area), and for coastal storm flood modeling and probabilistic hazard assessment.
Major changes to land elevation and land cover were quantified and translated into habitat area changes, more precisely constraining previous estimates of mean depth change and previously reported estimates of marsh loss. Predominantly through dredging, landfill, and inlet stabilization, the average water depth of the Jamaica Bay has increased from 1.7 to 4.5 m, tidal surface area diminished from 92 to 72 km2, and the inlet cross-sectional area was expanded from 4800 to 8900 m2. Total (freshwater plus salt) marsh habitat area was estimated to decline by 74 %, intertidal area by 73 %, and intertidal unvegetated habitat area by 72 %, both by about a factor of 4. Deepwater habitat increased by 314 %, also about a factor of 4. Submerged grasses (e.g., eelgrass) disappeared completely.
A probabilistic flood hazard assessment with simulations of 144 storm events revealed that the landscape changes caused an increase of 0.28 m (12 %) in the 100-year storm tide, similar to the separate effect of a global sea level rise of 0.23 m (Church and White, 2011; Hay et al., 2015) and local sea level rise of 0.37 m from the 1870s to 2015 (Kemp and Horton, 2013). The 10-year storm tide increased by 0.20 m (11 %). In spite of these rising storm tides, flood area for the 10- and 100-year storm tides is smaller than it was in the 1870s, by 19 % and 14 %, respectively, due to landfill conversion of fringing wetlands into elevated neighborhoods.
Specific anthropogenic changes to estuary depth and area as well as inlet depth and width were shown through targeted modeling and dynamics-based considerations to be important drivers of these changing storm tides, with depth changes being the strongest factor. The dependence of inlet choking of a long wave such as tide or surge depends on estuary area squared, inversely on inlet width squared, and inversely on inlet or estuary depth cubed. These choking effects are also enhanced with short-duration sea level anomalies such that a rapid-pulse storm surge rising in a matter of a few hours is damped more than a semidiurnal tide or long-duration storm surge event. Similar scaling shows that damping within the estuary has also decreased.
Our study highlights that anthropogenic changes to estuary geomorphology can affect storm tide hazard to a degree that is comparable to historical sea level rise. An improved understanding of historical estuarine landscapes as well as their hydrodynamic and sedimentary processes can help inform nature-based flood and climate mitigation efforts. Studies such as this one that reconstruct the historical landscape can be used to assess strategies to minimize floods into the future, as demonstrated on the broader nature-based adaptation study (Orton et al., 2016a) website and flood adaptation mapper tool (Orton et al., 2016c). These results have influenced adaptation considerations after Hurricane Sandy spurred a strong interest in flood adaptation. Concepts of bay shallowing and inlet narrowing were considered as options in a stakeholder-driven study of nature-based options for flood and hypoxia mitigation, with narrowing being one of the more deeply evaluated alternatives (Fischbach et al., 2018).
Model DEMs, still-water elevation data, and animations of model simulations for the 1870s and present day are available by download from the project's flood mapper (http://AdaptMap.info/jamaicabay/, Orton et al., 2016c; 5-year through 1000-year still-water elevation, in GeoTIFF and CSV formats). Observed tide data for 1877–1878 are available at the US National Archives in College Park, MD, in Record Group 23, Entry 148, PI. 105. Tide data used for 2015 are available from the United States Geological Survey (station 01311850) via https://waterdata.usgs.gov (USGS, 2020).
The paper and its methodology were conceptualized and developed by PMO and EWS; the analyses were performed by PMO and MG, and the data were curated by PMO and KM. The original draft preparation was by PMO; further reviewing and editing was by PMO, EWS, and SAT. Visualization was handled by PMO, EWS, and MG. Project administration was performed by PMO, and funding acquisition by PMO, EWS, KM, and SAT.
The authors declare that they have no conflict of interest.
The lead author would like to thank Stevens Institute of Technology graduates Larry Yin and Ziyu Wu for their assistance in model development and other aspects of the project, as well as Alan Blumberg and Nickitas Georgas (both now at Jupiter Intelligence) for model development and project guidance. We would like to acknowledge the contribution of Mark G. Becker (1961–2014), who was an original Principal Investigator for the project.
Philip M. Orton was funded by the United States (US) National Science Foundation (NSF PREEVENTS award no. 1855037) and National Oceanic and Atmospheric Administration (grant no. NOAA NA16OAR4310157). Eric W. Sanderson, Mario Giampieri, and Kytt MacManus were funded by the NOAA (grant no. NA13OAR4310144). Stefan A. Talke was funded by the NSF (Career Award 1455350), the US Army Corps of Engineers (award no. W1927N-14-2-0015), and NSF PREEVENTS (1854946).
This paper was edited by Animesh Gain and reviewed by Carmine Donatelli and two anonymous referees.
Aretxabaleta, A. L., Ganju, N. K., Butman, B., and Signell, R. P.: Observations and a linear model of water level in an interconnected inlet-bay system, J. Geophys. Res., 122, 2760–2780, 2017.
Bache, A. D.: New York Bay and Harbor, New York, Coast Chart No. 20, United States Coastal Survey, Washington, D.C., 1882.
Bien, J. R. and Vermeule, C. C.: The Narrows to Jamaica Bay-Coney Island, north to Brooklyn, Atlas of the Metropolitan Area and Adjacent Country, Julius Bien & Co, New York, NY, 1891a.
Bien, J. R. and Vermeule, C. C.: Jamaica Bay, Atlas of the Metropolitan District and adjacent country, Julius Bien & Co, New York, NY, 1891b.
Black, F. R.: Jamaica Bay: A History (Cultural Resource Management Study No. 3), United States Department of the Interior, National Parks Service, Washington, D.C., 1981.
Blumberg, A., Georgas, N., Yin, L., Herrington, T., and Orton, P.: Street scale modeling of storm surge inundation along the New Jersey Hudson River waterfront, J. Atmos. Ocean. Tech., 32, 1486–1497, https://doi.org/10.1175/JTECH-D-14-00213.1, 2015.
Blumberg, A. F., Khan, L. A., and St John, J.: Three-dimensional hydrodynamic model of New York Harbor region, J. Hydraul. Eng., 125, 799–816, 1999.
Brandon, C. M., Woodruff, J. D., Orton, P. M., and Donnelly, J. P.: Evidence for Elevated Coastal Vulnerability Following Large-Scale Historical Oyster Bed Harvesting, Earth Surf. Proc. Land., 41, 1136–1143, https://doi.org/10.1002/esp.3931, 2016.
Briggs, M., Kopp, P., Silver, A., and Wiggins, W.: Probabilistic model for predicting deep-draught channel design: Savannah, GA entrance channel, Ocean Eng., 108, 276–286, 2015.
Chant, R. J., Fugate, D., and Garvey, E.: The shaping of an estuarine superfund site: Roles of evolving dynamics and geomorphology, Estuar. Coasts, 34, 90–105, 2011.
Chernetsky, A. S., Schuttelaars, H. M., and Talke, S. A.: The effect of tidal asymmetry and temporal settling lag on sediment trapping in tidal estuaries, Ocean Dynam., 60, 1219–1241, 2010.
Church, J. A. and White, N. J.: Sea-level rise from the late 19th to the early 21st century, Surv. Geophys., 32, 585–602, 2011.
de Jonge, V. N., Schuttelaars, H. M., van Beusekom, J. E., Talke, S. A., and de Swart, H. E.: The influence of channel deepening on estuarine turbidity levels and dynamics, as exemplified by the Ems estuary, Estuar. Coast. Shelf Sci., 139, 46–59, 2014.
Donatelli, C., Ganju, N. K., Zhang, X., Fagherazzi, S., and Leonardi, N.: Salt marsh loss affects tides and the sediment budget in shallow bays, J. Geophys. Res.-Earth, 123, 2647–2662, 2018.
Dorr, F. W.: Part of Far Rockaway, Long Island (U.S. Coast Survey T-Sheet 798), US Coast Survey, Washington, D.C., 1860.
Edinger, G. J., Evans, D. J., Gebauer, S., Howard, T. G., Hunt, D. M., and Olivero, A. M.: Ecological Communities of New York State: Second Edition, A Revised and Expanded Edition of Carol Reschke's Ecological Communities of New York State, NYS Department of Environmental Conservation, Albany, NY, 2014.
ESRI: How Topo to Raster works – Help | ArcGIS for Desktop, available at: http://pro.arcgis.com/en/pro-app/tool-reference/3d-analyst/how-topo-to-raster-works.htm, last access: 29 June 2016.
Fagherazzi, S., Carniello, L., D'Alpaos, L., and Defina, A.: Critical bifurcation of shallow microtidal landforms in tidal flats and salt marshes, P. Natl. Acad. Sci. USA, 103, 8337–8341, 2006.
Familkhalili, R. and Talke, S. A.: The effect of channel deepening on tides and storm surge: A case study of Wilmington, NC, Geophys. Res. Lett., 43, 9138–9147, 2016.
Fischbach, J., Knopman, D., Smith, H., Orton, P., Sanderson, E., Fisher, K., Moray, N., Friedberg, A., and Parris, A.: Building Resilience in a Coastal Environment: Integrated, Science-Based Planning in Jamaica Bay, RAND Corporation, New York, 118 pp., 2018.
Flood, R.: High-Resolution bathymetric and backscatter mapping in Jamaica Bay, Final Report to the National Park Service, State University of New York at Stony Brook, Stony Brook, NY, 2011.
Georgas, N. and Blumberg, A. F.: Establishing Confidence in Marine Forecast Systems: The Design and Skill Assessment of the New York Harbor Observation and Prediction System, Version 3 (NYHOPS v3), in: Eleventh International Conference in Estuarine and Coastal Modeling (ECM11), Seattle, Washington, USA, 660–685, 2010.
Georgas, N., Blumberg, A., and Herrington, T.: An operational coastal wave forecasting model for New Jersey and Long Island waters, Shore Beach, 75, 30–35, 2007.
Gilbert, S. A.: Coney Island and Dead Horse Inlet (U.S. Coast Survey T-Sheet 586), US Coast Survey, Washington, D.C., 1855.
Gilbert, S. A.: Gowanus Bay and Vicinity, Long Island (U.S. Coast Survey T-Sheet 597), US Coast Survey, Washington, D.C., 1856a.
Gilbert, S. A.: Gowanus Bay and Vicinity, Long Island (U.S. Coast Survey T-Sheet 598), US Coast Survey, Washington, D.C., 1856b.
Gilbert, S. A. and Sullivan, J. A.: Gowanus Bay and Vicinity, Long Island (U.S. Coast Survey T-Sheet 599), US Coast Survey, Washington, D.C., 1857.
Grossinger, R. M.: Documenting local landsape change: the Bay Area Historical Ecology Project, in: The Historical Ecology Handbook: A Restorationist's Guide to Reference Ecosystems, edited by: Egan, D. and Howell, E. A., Island Press, Washington, D.C., 2001.
Haigh, I. D. and Nicholls, R. J.: Coastal Flooding, MCCIP Sci. Rev., 2017, 98–104, https://doi.org/10.14465/2017.arc10.009-cof, 2017.
Hall, T. and Yonekura, E.: North American tropical cyclone landfall and SST: A statistical model study, J. Climate, 26, 8422–8439, 2013.
Hay, C. C., Morrow, E., Kopp, R. E., and Mitrovica, J. X.: Probabilistic reanalysis of twentieth-century sea-level rise, Nature, 517, 481–484, 2015.
Helaire, L. T., Talke, S. A., Jay, D. A., and Mahedy, D.: Historical changes in lower Columbia River and Estuary floods: a numerical study, J. Geophys. Res.-Oceans, 124, 7926–7946, 2020.
Hess, L. and Harris, W. H.: Effect of storm energy and shoreline engineering on the sediment budget of a barrier beach, Rockaway, New York, Northeast. Geol., 9, 110–115, 1987.
Homer, C. G., Dewitz, J. A., Yang, L., Jin, S., Danielson, P., Xian, G., Coulston, J., Herold, N. D., Wickham, J., and Megown, K.: Completion of the 2011 National Land Cover Database for the conterminous United States – Representing a decade of land cover change information, Photogram. Eng. Remote Send., 81, 345–354, 2015.
Hu, K., Chen, Q., Wang, H., Hartig, E. K., and Orton, P. M.: Numerical modeling of salt marsh morphological change induced by Hurricane Sandy, Coast. Eng., 132, 63–81, 2018.
Irish, J. L., Sleath, A., Cialone, M. A., Knutson, T. R., and Jensen, R. E.: Simulations of Hurricane Katrina (2005) under sea level and climate conditions for 1900, Climatic Change, 122, 635–649, 2014.
Jaffe, B. E., Smith, R. E., and Torresan, L. Z.: Sedimentation and bathymetric change in San Pablo Bay, 1856–1983, Open-File Report 98-759, US Geological Survey, Reston, VA, https://doi.org/10.3133/ofr98759, 1998.
Jamaica Bay Improvement Commission: Report of the Jamaica Bay Improvement Commission, Martin B. Brown Press, New York, 157 pp., 1907.
Jenkins, T. A.: Map of the Interior of Long Island from Brooklyn to Jaimaica, New York (U.S. Coast Survey T-Sheet 36), US Coast Survey, Washington, D.C., 1837a.
Jenkins, T. A.: Map of the Interior of Long Island from Brooklyn to Jaimaica, New York (U.S. Coast Survey T-Sheet 37), US Coast Survey, Washington, D.C., 1837b.
Jordi, A., Georgas, N., Blumberg, A., Yin, L., Chen, Z., Wang, Y., Schulte, J., Ramaswamy, V., Runnels, D., and Saleh, F.: A next generation coastal ocean operational system: probabilistic flood forecasting at street scale, B. Am. Meteorol. Soc., 100, 41–54, https://doi.org/10.1175/BAMS-D-17-0309.1, 2018.
Kemp, A. C. and Horton, B. P.: Contribution of relative sea-level rise to historical hurricane flooding in New York City, J. Quaternary Sci., 28, 537–541, 2013.
Kemp, A. C., Hill, T. D., Vane, C. H., Cahill, N., Orton, P. M., Talke, S. A., Parnell, A. C., Sanborn, K., and Hartig, E. K.: Relative sea-level trends in New York City during the past 1500 years, Holocene, 27, 1169–1186, https://doi.org/10.1177/0959683616683263, 2017.
Kennedy, A. B., Gravois, U., Zachry, B. C., Westerink, J. J., Hope, M. E., Dietrich, J. C., Powell, M. D., Cox, A. T., Luettich, R. A., and Dean, R. G.: Origin of the Hurricane Ike forerunner surge, Geophys. Res. Lett., 38, 8, https://doi.org/10.1029/2011GL047090, 2011.
Lin, N., Emanuel, K., Oppenheimer, M., and Vanmarcke, E.: Physically based assessment of hurricane surge threat under climate change, Nat. Clim. Change, 2, 462–467, 2012.
Lin, N., Kopp, R. E., Horton, B. P., and Donnelly, J. P.: Hurricane Sandy's flood frequency increasing from year 1800 to 2100, P. Natl. Acad. Sci. USA, 113, 12071–12075, 2016.
MacMahan, J., van de Kreeke, J., Reniers, A., Elgar, S., Raubenheimer, B., Thornton, E., Weltmer, M., Rynne, P., and Brown, J.: Fortnightly tides and subtidal motions in a choked inlet, Estuar. Coast. Shelf Sci., 150, 325–331, 2014.
Marcos, M., Calafat, F. M., Berihuete, Á., and Dangendorf, S.: Long-term variations in global sea level extremes, J. Geophys. Res., 120, 8115–8134, 2015.
Marsooli, R. and Lin, N.: Numerical modeling of historical storm tides and waves and their interactions along the US east and Gulf Coasts, J. Geophys. Res., 123, 3844–3874, 2018.
Marsooli, R., Orton, P. M., Georgas, N., and Blumberg, A. F.: Three-Dimensional Hydrodynamic Modeling of Coastal Flood Mitigation by Wetlands, Coast. Eng., 111, 83–94, 2016.
Marsooli, R., Orton, P. M., Fitzpatrick, J., and Smith, H.: Residence time of a highly urbanized estuary: Jamaica Bay, New York, J. Mar. Sci. Eng., 6, 44, https://doi.org/10.3390/jmse6020044, 2018.
Mattocks, C. and Forbes, C.: A real-time, event-triggered storm surge forecasting system for the state of North Carolina, Ocean Model., 25, 95–119, 2008.
Maynard, W.: Western Part of Jamaica Bay Including Canarsie Landing (U.S. Coast Survey H01358), US Coast Survey, Washington, D.C., 1877.
Moore, W. I.: Jamaica Bay Eastern Part (U.S. Coast Survey H01392), US Coast Survey, Washington, D.C., 1878.
Murray, N. J., Clemens, R. S., Phinn, S. R., Possingham, H. P., and Fuller, R. A.: Tracking the rapid loss of tidal wetlands in the Yellow Sea, Front. Ecol. Environ., 12, 267–272, 2014.
NYC-DEP: Jamaica Bay Watershed Protection Plan, in: Volume 1, New York City Department of Environmental Protection (DEP), New York, NY, USA, 128 pp., 2007.
NYC-DEP: Jamaica Bay Watershed Protection Plan Update 2018, Bureau of Environmental Planning and Analysis, New York City Department of Environmental Protection, New York, NY, USA, 60 pp., 2018.
Orth, R. J., Carruthers, T. J., Dennison, W. C., Duarte, C. M., Fourqurean, J. W., Heck, K. L., Hughes, A. R., Kendrick, G. A., Kenworthy, W. J., and Olyarnik, S.: A global crisis for seagrass ecosystems, AIBS Bull., 56, 987–996, 2006.
Orton, P., Georgas, N., Blumberg, A., and Pullen, J.: Detailed modeling of recent severe storm tides in estuaries of the New York City region, J. Geophys. Res., 117, C09030, https://doi.org/10.1029/2012JC008220, 2012.
Orton, P. M., Talke, S. A., Jay, D. A., Yin, L., Blumberg, A. F., Georgas, N., Zhao, H., Roberts, H. J., and MacManus, K.: Channel Shallowing as Mitigation of Coastal Flooding, J. Mar. Sci. Eng., 3, 654–673, https://doi.org/10.3390/jmse3030654, 2015.
Orton, P., MacManus, K., Sanderson, E., Mills, J., Giampieri, M., Fisher, K., Yetman, G., Doxsey-Whitfield, E., Wu, Z., Yin, L., Georgas, N., and Blumberg, A.: Project Final Technical Report: Quantifying the Value and Communicating the Protective Services of Nature-Based Flood Mitigation using Flood Risk Assessment, available at: http://adaptmap.info/jamaicabay/technical_report.pdf (last access: 1 August 2016), 2016a.
Orton, P. M., Hall, T. M., Talke, S., Blumberg, A. F., Georgas, N., and Vinogradov, S.: A Validated Tropical-Extratropical Flood Hazard Assessment for New York Harbor, J. Geophys. Res., 121, 12, https://doi.org/10.1002/2016JC011679, 2016b.
Orton, P., MacManus, K., Sanderson, E., Mills, J., Giampieri, M., Fisher, K., Yetman, G., Doxsey-Whitfield, E., Wu, Z., Yin, L., Georgas, N., and Blumberg, A: AdaptMap: Flood, Sea Level Rise and Adaptation Viewer for Jamaica Bay, NYC, available at: http://AdaptMap.info/jamaicabay (last access: 1 September 2020), 2016c.
Orton, P., Lin, N., Gornitz, V., Colle, B., Booth, J., Feng, K., Buchanan, M., and Oppenheimer, M.: New York City Panel on Climate Change 2019 Report Chapter 4: Coastal Flooding, Ann. N. Y. Acad. Sci., 1439, 95–114, https://doi.org/10.1111/nyas.14011, 2019.
Paalvast, P. and van der Velde, G.: Long term anthropogenic changes and ecosystem service consequences in the northern part of the complex Rhine-Meuse estuarine system, Ocean Coast. Manage., 92, 50–64, 2014.
Pawlowicz, R., Beardsley, B., and Lentz, S.: Classical tidal harmonic analysis including error estimates in MATLAB using T_TIDE, Comput. Geosci., 28, 929–937, 2002.
Peteet, D. M., Nichols, J., Kenna, T., Chang, C., Browne, J., Reza, M., Kovari, S., Liberman, L., and Stern-Protz, S.: Sediment starvation destroys New York City marshes' resistance to sea level rise, P. Natl. Acad. Sci. USA, 115, 10281–10286, 2018.
Picado, A., Dias, J. M., and Fortunato, A. B.: Tidal changes in estuarine systems induced by local geomorphologic modifications, Cont. Shelf Res., 30, 1854–1864, 2010.
Powell, J. W.: USGS Brooklyn NY Quadrangle, US Geological Survey, Washington, D.C., 1891.
Ralston, D. K., Talke, S., Geyer, W. R., Al'Zubadaei, H., and Sommerfield, C. K.: Bigger tides, less flooding: Effects of dredging on barotropic dynamics in a highly modified estuary, J. Geophys. Res., 124, 196–211, https://doi.org/10.1029/2018JC014313, 2019.
Sanderson, E. W.: Mannahatta: A Natural History of New York City, Abrams, New York, NY, 2009.
Sanderson, E. W.: Cartographic Evidence for Historical Geomorphological Change and Wetland Formation in Jamaica Bay, New York, Northeast. Nat., 23, 277–304, 2016.
Sanford, L. P., Boicourt, W. C., and Rives, S. R.: Model for estimating tidal flushing of small embayments, J. Waterw. Port C., 118, 635–654, 1992.
Schoukens, H.: Proactive Habitat Restoration and the Avoidance of Adverse Effects on Protected Areas: Development Project Review in Europe After Orleans, J. Int. Wildlife Law Policy, 20, 125–154, 2017.
Seavitt, C., Alexander, K., Alessi, D., and Sands, E.: Shifting Sands: Sedimentary Cycles for Jamaica Bay, New York, in Structures of Coastal Resilience, Phase 1: Context, Site and Vulnerability Analysis, Self-published, New York, NY, USA, 215 pp., 2015.
Shaffer, G. P., Day Jr., J. W., Mack, S., Kemp, G. P., van Heerden, I., Poirrier, M. A., Westphal, K. A., FitzGerald, D., Milanes, A., and Morris, C. A.: The MRGO Navigation Project: a massive human-induced environmental, economic, and storm disaster, J. Coast. Res., 54, 206–224, 2009.
Stigebrandt, A.: Some aspects of tidal interaction with fjord constrictions, Estuar. Coast. Mar. Sci., 11, 151–166, 1980.
Swanson, L., Dorsch, M., Giampieri, M., Orton, P., Parris, A., and Sanderson, E. W.: Chapter 4: Dynamics of the biophysical systems of Jamaica Bay, in: Prospects for Resilience: Insights from New York City's Jamaica Bay, edited by: Sanderson, E. W., Solecki., W. D., Waldman, J. R., and Parris, A. S., Island Press, Washington, D.C., 2016.
Swanson, R., West-Valle, A., and Decker, C.: Recreation vs. waste disposal: The use and management of Jamaica Bay, Long Isl. Hist. J., 5, 21–41, 1992.
Swanson, R. L. and Wilson, R. E.: Increased tidal ranges coinciding with Jamaica Bay development contribute to marsh flooding, J. Coast. Res., 24.6, 1565–1569, 2008.
Szpilka, C., Dresback, K., Kolar, R., Feyen, J., and Wang, J.: Improvements for the Western North Atlantic, Caribbean and Gulf of Mexico ADCIRC Tidal Database (EC2015), J. Mar. Sci. Eng., 4, 1–55, 2016.
Talke, S., Orton, P., and Jay, D.: Increasing storm tides at New York City, 1844–2013, Geophys. Res. Lett., 41, 3149–3155, https://doi.org/10.1002/2014GL059574, 2014.
Talke, S., Kemp, A., and Woodruff, J.: Relative Sea Level, Tides, and Extreme Water Levels in Boston Harbor From 1825 to 2018, J. Geophys. Res., 6, 3895–3914, https://doi.org/10.1029/2017JC013645, 2018.
Talke, S. A. and Jay, D. A.: Nineteenth century North American and Pacific tidal data: Lost or just forgotten?, J. Coast. Res., 29, 118–127, 2013.
Talke, S. A. and Jay, D. A.: Archival water-level measurements: Recovering historical data to help design for the future, CWTS Report 2017-02, USACE Climate Preparedness and Resilience, Portland, OR, 45 pp., 2017.
Talke, S. A. and Jay, D. A.: Changing tides: The role of natural and anthropogenic factors, Annu. Rev. Mar. Sci., 12, 121–151, https://doi.org/10.1146/annurev-marine-010419-010727, 2020.
USACE: Hudson-Raritan Estuary Comprehensive Restoration Plan, Volume 1, 155 pp., 2009.
USACE: Final Integrated General Reevaluation Report II and supplemental Environmental Impact Statement. Jacksonville Harbor, Duval County, Florida. United States Army Corps of Engineers, Jacksonville District, Appendix A, Attachment J, Jacksonville, FL, 1623–1646, 2014.
USACE: Atlantic Coast of New York, East Rockaway Inlet to Rockaway Inlet and Jamaica Bay: Draft Integrated Hurricane Sandy General Reevaluation Report and Environmental Impact Statement, United States Army Corps of Engineers, New York District, New York, NY, 270 pp., 2016.
USGS: Water Data for the Nation, United States Geological Survey, available at: http://waterdata.usgs.gov, last access: 1 January 2020.
Vaudrey, J. M., Kremer, J. N., Branco, B. F., and Short, F. T.: Eelgrass recovery after nutrient enrichment reversal, Aquat. Bot., 93, 237–243, 2010.
Wahl, T. and Chambers, D. P.: Climate controls multidecadal variability in US extreme sea level records, J. Geophys. Res., 121, 1274–1290, 2016.
Walsh, B., Costanzo, S., and Taillie, D.: Natural Resource Condition Assessment, Gateway National Recreation Area, Natural Resource Report NPS/GATE/NRR–2018/1774, Department of the Interior, National Parks Service, Fort Collins, CO, 170 pp., 2018.
Wang, H., Chen, Q., Hu, K., Snedden, G. A., Hartig, E. K., Couvillion, B. R., Johnson, C. L., and Orton, P. M.: Numerical modeling of the effects of Hurricane Sandy and potential future hurricanes on spatial patterns of salt marsh morphology in Jamaica Bay, US Geological Survey, Open File Report 2017-1016, New York, NY, USA, 43 pp., ISSN: 2331-1258, 2017.
Warner, J. C., Geyer, W. R., and Lerczak, J. A.: Numerical modeling of an estuary: A comprehensive skill assessment, J. Geophys. Res., 110, C05001, https://doi.org/10.1029/2004jc002691, 2005.
Wilson, H. M.: Hempstead NY Quadrangle, US Geological Survey, Washington, D.C., 1897.