the Creative Commons Attribution 4.0 License.
the Creative Commons Attribution 4.0 License.
 | 11 Sep 2020
Uncertainties in coastal flood risk assessments in small island developing states
Matteo U. Parodi
Alessio Giardino
Ap van Dongeren
Jeremy D. Bricker
Ad J. H. M. Reniers
Considering the likely increase in coastal flooding in small island developing states (SIDSs) due to climate change, coastal managers at the local and global levels have been developing initiatives aimed at implementing disaster risk reduction (DRR) and adaptation measures. Developing science-based adaptation policies requires accurate coastal flood risk (CFR) assessments, which in the case of insular states are often subject to input uncertainty. We analysed the impact of a number of uncertain inputs on coastal flood damage estimates: (i) significant wave height, (ii) storm surge level and (iii) sea level rise (SLR) contributions to extreme sea levels, as well as the error-driven uncertainty in (iv) bathymetric and (v) topographic datasets, (vi) damage models, and (vii) socioeconomic changes. The methodology was tested through a sensitivity analysis using an ensemble of hydrodynamic models (XBeach and SFINCS) coupled with a direct impact model (Delft-FIAT) for a case study of a number of villages on the islands of São Tomé and Príncipe. Model results indicate that for the current time horizon, depth damage functions (DDFs) and digital elevation models (DEMs) dominate the overall damage estimation uncertainty. When introducing climate and socioeconomic uncertainties to the analysis, SLR projections become the most relevant input for the year 2100 (followed by DEM and DDF). In general, the scarcity of reliable input data leads to considerable predictive uncertainty in CFR assessments in SIDSs. The findings of this research can help to prioritize the allocation of limited resources towards the acquisitions of the most relevant input data for reliable impact estimation.
- Article
(2154 KB) - Full-text XML
- BibTeX
- EndNote


Small island developing states (SIDSs) are increasingly under threat of coastal flooding, hindering the growth of their economies and challenging the safety of their societies (OECD World Bank, 2016). The consequences that they will face due to climate-change-induced coastal flooding may overwhelm their intrinsic resilience. For example, sea level rise (SLR) will exacerbate the impacts and frequency of coastal hazards for many islands around the world (Storlazzi et al., 2018; UN-OHRLLS, 2015). This situation has recently led to initiatives (e.g. Small Island States Resilience Initiatives SISRI by the World Bank) aiming to increase the resilience of insular communities by using robust coastal flood risk (CFR) assessments using hydrodynamical models as a necessary first step to develop sustainable adaptation strategies.
Risk is computed as a combination of hazard, exposure and vulnerability (Kron, 2005). Specifically, “hazard” is the probability and magnitude of an event with negative impacts. “Exposure” means the assets that are exposed to the hazard, and “vulnerability” refers to the damage inflicted upon the exposed asset, under a specific hazard. A coastal flood damage assessment entails the computation of damages under a specific flood event, for a given vulnerability and exposure. To estimate the overall CFR, damage assessments for every possible coastal flood event must be performed.
Existing hydrodynamic models can achieve satisfactory levels of accuracy in estimating flood hazards, particularly at the local scale (Bertin et al., 2014; Dresback et al., 2013; Giardino et al., 2018; Monioudi et al., 2018; Storlazzi et al., 2018). Nevertheless, CFR assessments are subject to a wide range of errors and uncertainties, divided into aleatory uncertainties, i.e. related to the intrinsic randomness of reality, and epistemic uncertainties, due to imperfect knowledge and lack of data (Uusitalo et al., 2015). The second type is particularly applicable to small islands as accurate input data are often scarce, due to their remoteness and limited economic resources.
As a consequence, datasets covering the entire globe in low resolution must often be used in the absence of detailed local data. These global datasets are often inaccurate, which negatively affects the trustworthiness of the model and ultimately the outcome of the study. Cook and Merwade (2009), Kulp and Strauss (2019), and Van de Sande et al. (2012) have acknowledged the unreliability of publicly available digital elevation models (DEMs) to represent the exposure to coastal floods, while Cea and French (2012), Hare et al. (2011), and Plant et al. (2002) have highlighted the significant uncertainty that low-resolution bathymetric datasets bring into coastal hazard modelling. Global bathymetric datasets (e.g. GEBCO) lack information on nearshore depth, especially over reefs or in bays, while global topographic datasets (e.g. SRTM, ASTER) experience contamination of terrain elevation data due to buildings, vegetation canopies, and other objects that are averaged into the elevation representing each coarse pixel of the dataset. To reduce these errors, considerable efforts are being directed to improve the quality of satellite-derived DEMs. Very recently, improved global datasets such as MERIT (Yamazaki et al., 2017) and CoastalDEM (Kulp and Strauss, 2019) have been published, which correct for vegetation and building elevation biases.
The damage assessment represents a step of a CFR analysis severely affected by both the paucity of reliable damage information (Apel et al., 2006; Merz and Thieken, 2009; De Moel and Aerts, 2011; Prahl et al., 2016; Wagenaar et al., 2016) and the simplifications that are necessary to quantify the vulnerability of human and natural assets. Furthermore, the uncertainty of damage modelling is exacerbated in data-poor SIDSs, where accurate data and models are lacking, requiring strong assumptions. Indeed, often damage curves are taken from literature and applied in different areas, making few, if any, adjustments (Schroter et al., 2014; Wagenaar et al., 2016). Furthermore, extreme sea level (ESL) events constitute a considerable portion of the uncertainties in a CFR analysis, as their statistical estimation method is based on extrapolating from limited duration of recorded data and requires the choice of a probability distribution function (pdf) (Wahl et al., 2017).
Finally, to develop long-term adaptation plans, future risk estimates including changes to human and natural systems are required, which introduce further assumptions and uncertainty. Indeed, both future climatological and societal changes can significantly impact the model outcome, and disregarding them may lead to poor coastal zone planning and underestimation of future damages (Bouwer, 2013; Bouwer et al., 2010).
Several studies have attempted to quantify the uncertainty in flood risk estimates, for both coastal (Hinkel et al., 2014; De Moel et al., 2012; Vousdoukas et al., 2018b) and riverine floods (Apel et al., 2006; Egorova et al., 2008). Vousdoukas et al. (2018b) and De Moel et al. (2012) performed an uncertainty analysis on CFR assessments for two case studies in Europe, indicating the quality of coastal protection information and the shape of the depth damage functions (DDFs) as the most influential input for flood damage estimate uncertainty, respectively.
A quantification of the relative contribution of the uncertainty sources has yet not been conducted for SIDSs, where the scarcity of input data exacerbates the model outcome error and uncertainty. We therefore present a method to directly compare the relative importance of uncertainty sources on the estimation of coastal flood damages, extending the analysis to present-day and future risk predictions by modelling future damages for the years 2050, 2070 and 2100. For this purpose, this study describes a developed framework that examines different uncertainty sources, including the components contributing to ESLs, namely (i) significant wave height, (ii) storm surge level and (iii) SLR projections; (iv) bathymetry dataset; (v) DEM; (vi) damage models; and (vii) socioeconomic growth.
The methodology was applied to two coastal villages Pantufo and Praia Abade in the Democratic Republic of São Tomé and Príncipe, an archipelago that comprises two main islands and several islets, located in the Gulf of Guinea (Fig. 1a). The two villages were selected based on their high vulnerability to coastal flooding hazards and on the availability of local information to conduct the CFR assessment (Deltares and CDR, 2019). The small size and location of the islands, in combination with their colonial history, have significantly hampered their economic development, increasing their susceptibility to natural disasters and hindering a sustainable future for the communities (Giardino et al., 2012). The village of Pantufo is situated on the north-east side of the island of São Tomé (Fig. 1b), bordered by a partially sandy and rocky beach (Fig. 1c). The village of Praia Abade is located on the north-east side of the island of Príncipe, at the southern end of a bay (Fig. 1b), and it is bordered by a sandy pocket beach (Fig. 1d). Fishing represents the main economic activity for both villages. Near the coastline, houses are often made of wood or poor-quality concrete and elevated to prevent flooding damages.
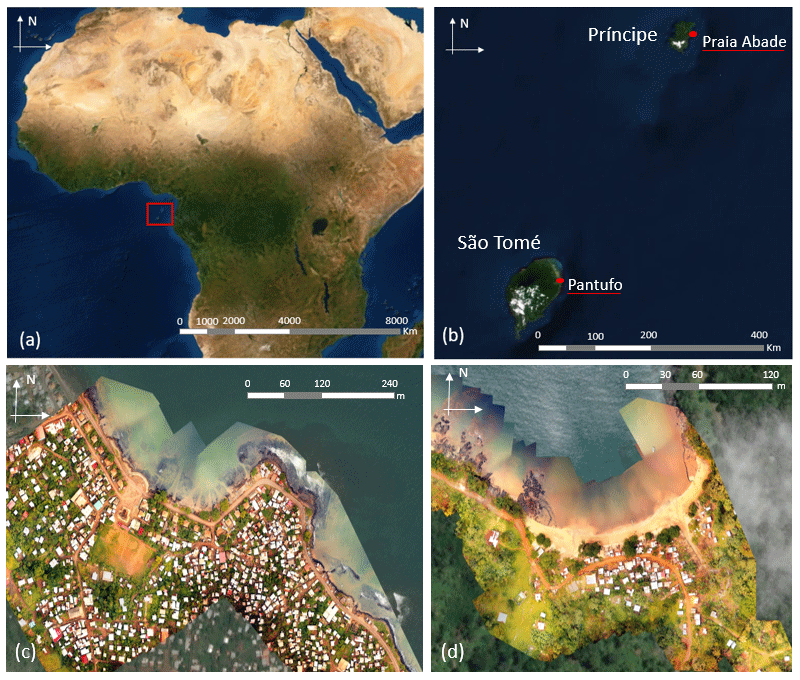
Figure 1Case study site. (a) Geographical location of the islands of São Tomé and Príncipe in the Gulf of Guinea. (b) Geographical location of the communities of Pantufo and Praia Abade on the two islands. (c) Aerial view of the communities of Pantufo and (d) Praia Abade. Panels (a) and (b) are provided by ESRI, DigitalGlobe and the GIS community. Panels (c) and (d) were reproduced with permission from CDR International.
Both communities are on the lee side of the islands sheltered from the largest and most frequent southerly swell waves. The area is not in the track of tropical cyclones and storms, experiencing a calmer wave climate than other extratropical regions (Alves, 2006). However, these communities are still prone to hazardous rainfall and coastal flooding from occasional big southerly swells, which damage buildings and fishing boats (Deltares and CDR, 2019).
3.1 Modelling approach
Coastal flood damages at the two villages were estimated using a chain of models and data as shown in Fig. 2. Hazard, exposure and vulnerability were modelled separately and are show in green, orange and yellow boxes. Most of the input data are characterized by uncertainties that contribute to uncertainty in the final damage estimates. The major sources of uncertainty considered in this study are highlighted with red boxes in Fig. 2: (i) significant wave height, (ii) storm surge level, (iii) SLR projections, (iv) bathymetry dataset, (v) DEM, (vi) damage models and (vii) socioeconomic growth.
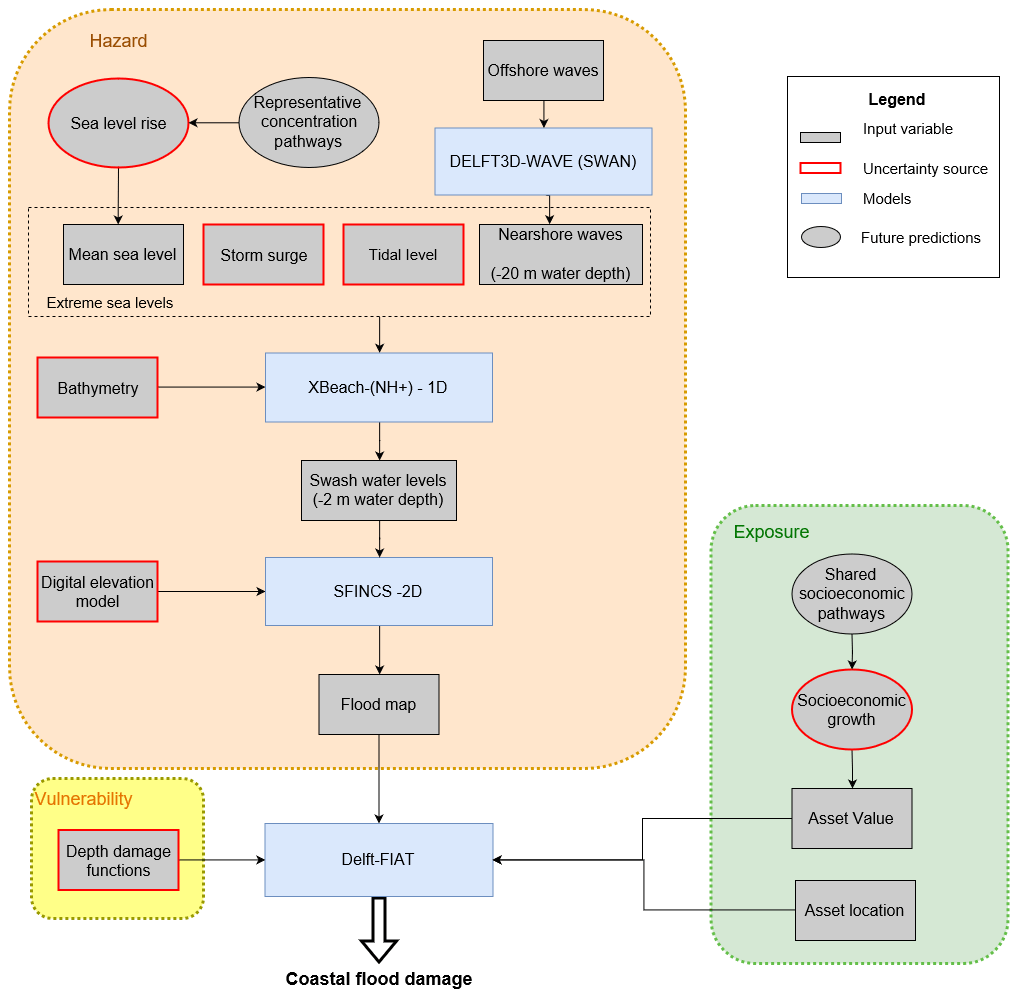
Figure 2Schematic representation of the modelling chain used to carry out the damage assessment and including the different source of uncertainties analysed (red boxes). The blue rectangles show the numerical models (XBeach and SFINCS) and tools (Delft-FIAT). The inputs used to model the hazard, exposure and vulnerability are included in the orange, green and yellow boxes, respectively. Inputs used to model the present condition are represented with rectangles, whereas those used for future scenarios are represented with ellipses. Extreme sea levels are estimated by combining mean sea water levels, astronomical tides, storm surges and single waves. The earth surface is represented by bathymetric and digital elevation model (DEM) data. The inundation map produced by SFINCS is combined with depth damage functions (DDFs) and asset value to compute flood damages. Sea level rise (SLR) and socioeconomic growth are used to assess future predictions. Arrows indicate the data flow.
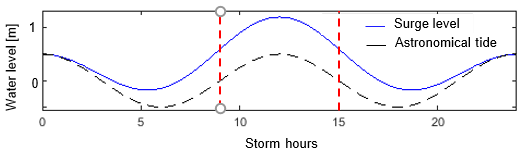
Figure 3Qualitative example of the hydrograph of the storm water level: surge level (blue) and astronomical tide (black) over the length of a 24 h storm. The red lines mark the modelled central 6 h of the storm.
Coastal floods are driven by nearshore ESLs, computed as a combination of mean sea level, tidal level, SLR, storm surge level and short wave contribution, based on the peak 6 h of a 24 h time frame reference storm. To describe the storm, which has a temporal resolution of 1 h, a storm surge water level was imposed over a spring tidal water level, and offshore waves are explicitly included (Fig. 3). The nearshore wave boundary conditions are computed using transformation matrixes in the DELFT3D-WAVE (SWAN) model (Booij et al., 1997) as described in Deltares and CDR (2019).
To transform the nearshore ESLs, we used cross-shore transects (Fig. 2) of the nonhydrostatic version of the model of XBeach (Roelvink et al., 2009, 2018; Smit et al., 2010). These transects had a minimum grid size of 1 m, running from approximately 20 m water depth offshore to an inland elevation of approximately 10 m.
Flood maps representing the coastal flood hazards were computed using a 2-D SFINCS (Leijnse et al., 2020) model, with land surface elevation derived from a DEM (Fig. 2). SFINCS is a computationally efficient coastal zone flood model and covered the area of interest with a rectilinear grid and a spacing of 5 m. SFINCS is forced with water levels taken at 2 m water depths from the XBeach cross-shore transects (Fig. 2)
The damage assessment was conducted through the model Delft-FIAT (Slager et al., 2016). FIAT (Flood Impact Assessment Tool) is a flexible open-source toolset, where direct damages are estimated at the unit level (e.g. a single building or piece of infrastructure). Combining information on the exposed assets, DDFs, and flood maps, expected damages from single events were obtained (Fig. 2).
DDFs define, for each asset type, the relation between a given flood depth and the consequent direct damages (Messner and Meyer, 2006) and are widely used in flood damage modelling due to their simplicity (Schroter et al., 2014). In this analysis, arbitrarily chosen extreme 100-year-return-period sea levels were modelled since, for this case, events with smaller return periods had only a small difference in intensity and computed flood damages than the 100-year-return-period event. The analysis focused on direct and tangible damages to boats and buildings. A proper site-specific calibration of the different models used was hampered by the limitation in available local data. Flood maps and impacts were verified based on all available information derived from field inspections, questionnaires and interviews, following a collaborative modelling approach (Basco-Carrera et al., 2017). High-water marks were mapped and cross-validated with information retrieved from about a hundred semi-structured interviews across all communities (Deltares and CDR; 2019). The flood hazard maps derived according to community perception were then used for calibration and validation of the flood hazard models. Similarly, the estimated impacts were validated with information on damages and local repair costs after flooding events.
3.2 Data
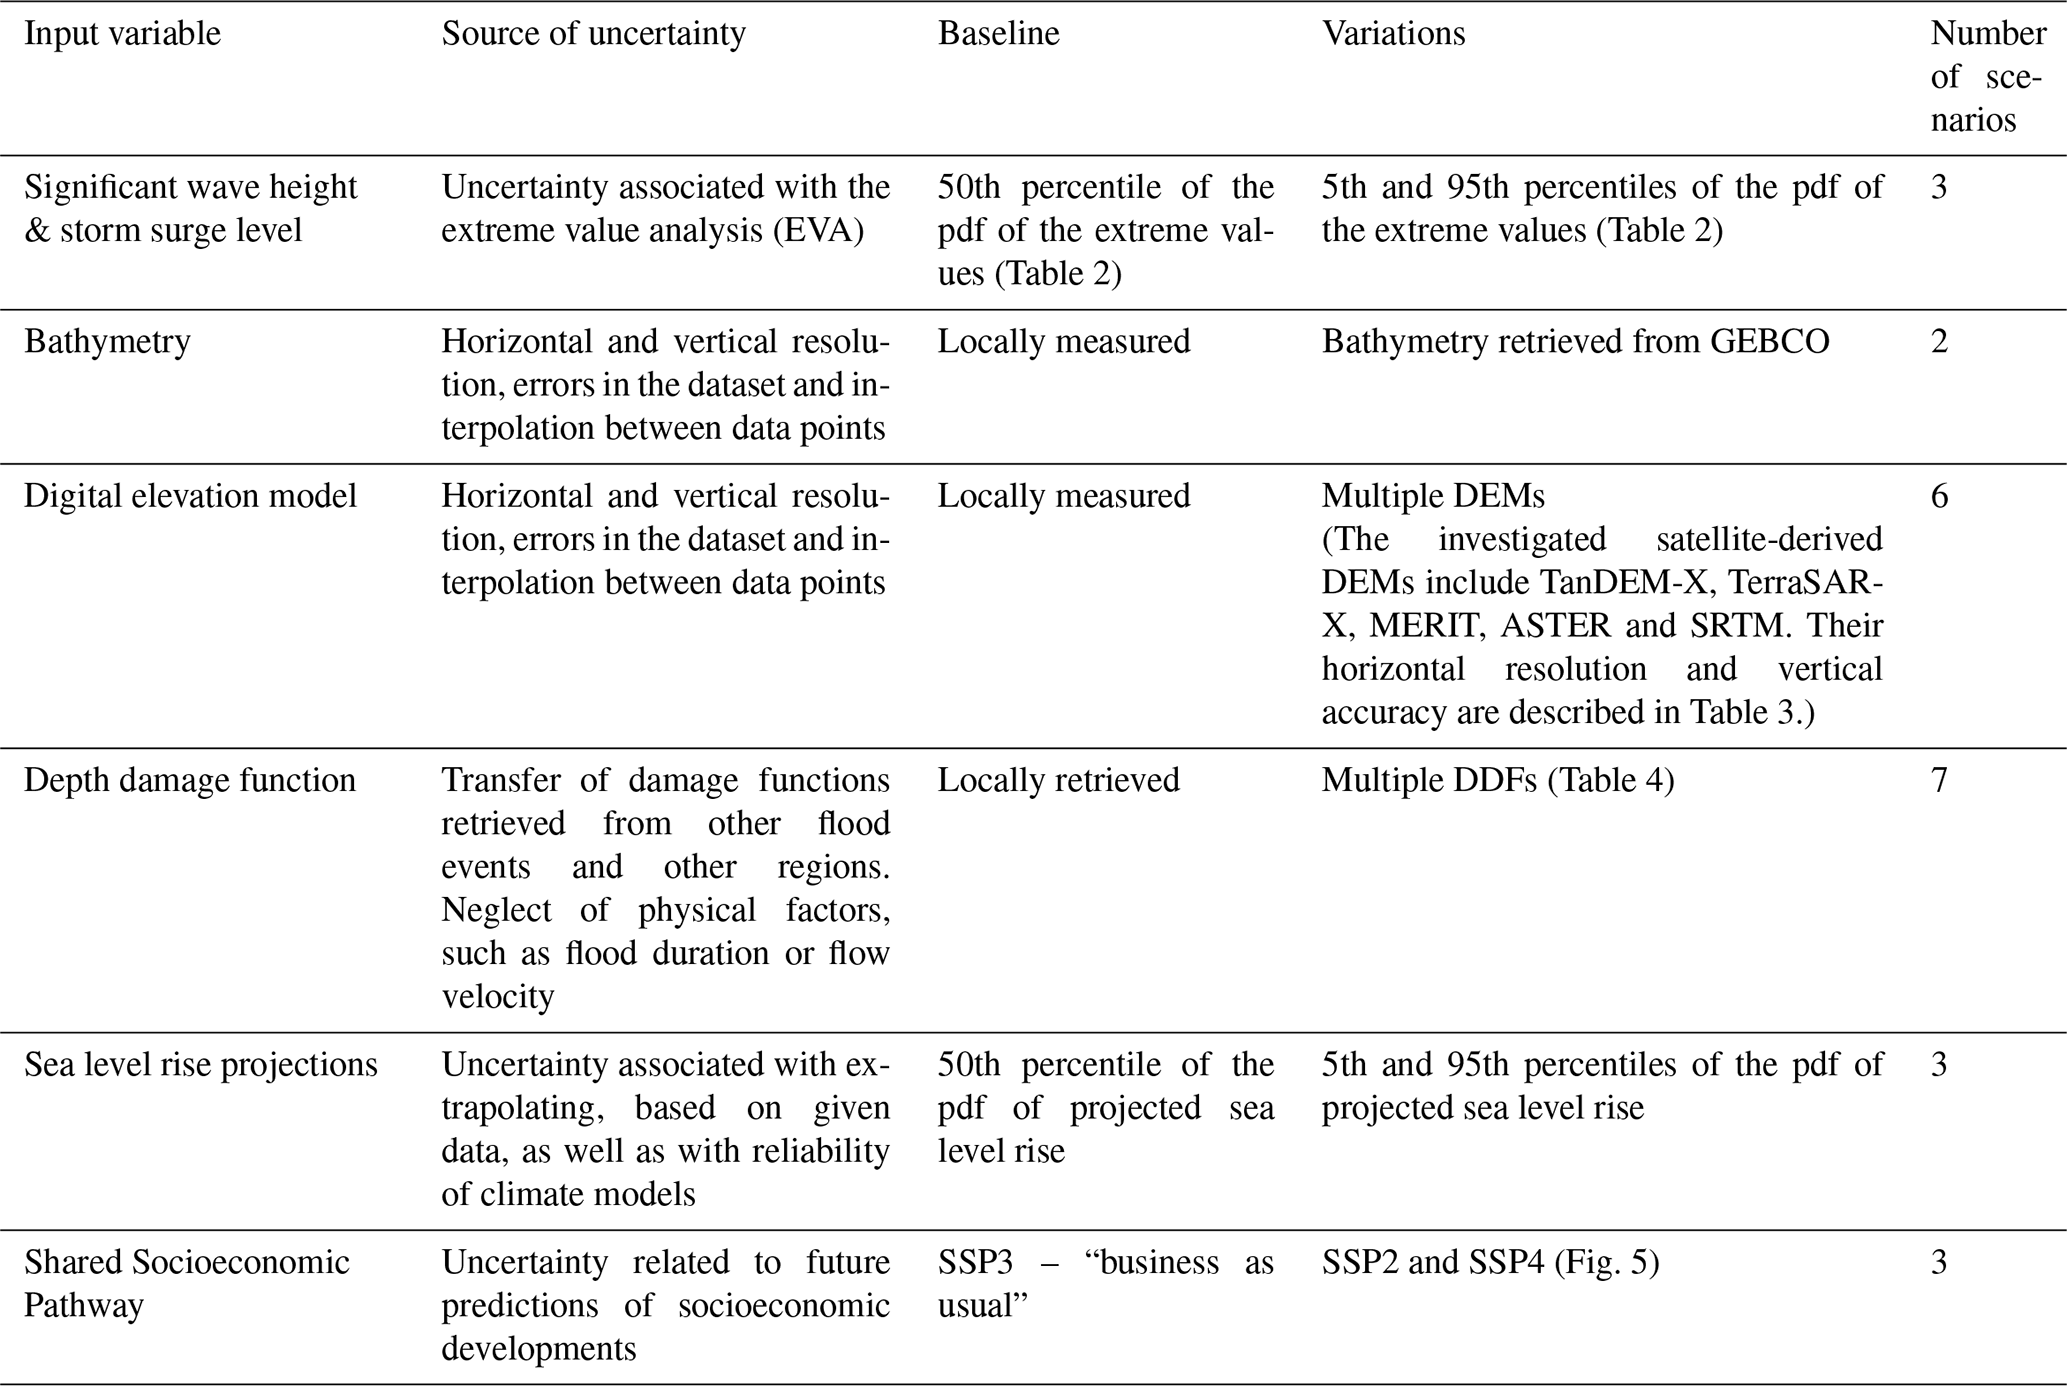
Multiple data sources were used as a basis to perform the CFR analysis. Table 1 contains an overview of the uncertainty sources investigated, indicating their baseline values and the variations from it, for each different input variable investigated. The baseline scenario uses a combination of the best available input data (i.e. highest resolution or value in which we have the highest confidence). To estimate the uncertainty in our CFR analysis, we tested variations from this baseline scenario using alternative available data sources or high and low percentiles of a given probability distribution. Each input variable and related source of uncertainty for present and future conditions is described in the next two sections.
Table 1Overview of all uncertainty sources investigated (input variable), with descriptions of their source of uncertainty, baseline value and the variations from the baseline value as used for the CFR analysis.
3.2.1 Present scenario
Significant wave height
The ERA-Interim dataset (Dee et al., 2011) by ECMWF (European Centre for Medium-Range Weather Forecasts), which covers the period from 1 January 1989 until present, was used. The dataset provides 6-hourly significant wave height (Hs) of combined wind and swell data and was used to estimate the 100-year-return-period event for Hs, conducting an extreme value analysis (EVA)1. A peak-over-threshold technique (Caires, 2011) was conducted on the nearshore wave conditions, fitting a generalized Pareto distribution (GPD) (Pickands, 1975) to the peaks of clustered excesses over a threshold. The 98th percentile of the Hs distribution was selected as threshold, as recommended by Wahl et al. (2017). To ensure the clustered peaks were independent and identically distributed, 60 h consecutive extremes were not sampled together.
Commonly, extreme hydrodynamic boundary conditions are represented with probability distributions. However, these distributions are fit to measured data and attempt to estimate values for return periods longer than the length of the available data, thus already introducing uncertainty in the model. Furthermore, the nearshore wave conditions were estimated from transformation matrices in the DELFT3D-WAVE (SWAN) model, which increases the uncertainty of Hs by introducing model errors. Therefore, the uncertainty was taken into account by using the 5th, 50th and 95th percentile values of Hs (Table 2) in XBeach (Fig. 2).
Table 2Overview of Hs and storm surge variations considered and corresponding to the 5th, 50th and 95th percentiles. The baseline value is italicized.

Storm surge
The estimation of storm surge levels was based on the dataset by Muis et al. (2016), a global water level reanalysis based on daily maxima over the time period 1979–2014. In an identical manner to Hs, the 5th, 50th and 95th percentile values for the 100-year2 storm surge level were estimated (Table 2), aiming to reproduce its uncertainty. The probability distribution of storm surge and significant wave height were assumed to be independent of each other, therefore without making use of a joint probability distribution.
Bathymetry
Bathymetry controls the wave transformation mechanisms and ultimately the flooding on land. Therefore, uncertainty and errors in bathymetric datasets could lead to an increased uncertainty in wave and storm surge simulations, increasing the potential for modelling error and biases.
To explore the role of bathymetry data uncertainty, two datasets were used. The General Bathymetric Chart of the Oceans (GEBCO) (Weatherall et al., 2015), a publicly available bathymetric dataset, was compared to a locally collected dataset (Deltares and CDR, 2019). GEBCO has a coarser horizontal resolution than the local dataset (approximately 900 and 50–100 m, respectively). Using bathymetry data points with coarse resolutions to generate a digital seabed introduces several errors and uncertainty, due to the unresolved terrain variability between measured points (Hare et al., 2011; Plant et al., 2002). The local measurements were taken during a campaign in December 2018, when cross-shore transect profiles were collected at the two communities, using a handheld echo sounder (Deltares and CDR, 2019).
Digital elevation model
Digital elevation models are numerical representations of the earth surface elevation. Similar to bathymetric datasets, DEMs with lower resolution will introduce more uncertainty, due to interpolation errors. Furthermore, systematic errors that stem from a bias in the elevation values are often included in the datasets and have a considerable impact on flood risk estimates (Bove et al., 2020; Cook and Merwade, 2009; Kulp and Strauss, 2019; Paprotny et al., 2019; Van de Sande et al., 2012). Indeed, global and satellite-derived DEMs often have a low vertical accuracy for CFR assessments, being surface models where terrain elevation values may be overestimated due to land cover (e.g. tree canopies and the built environment).
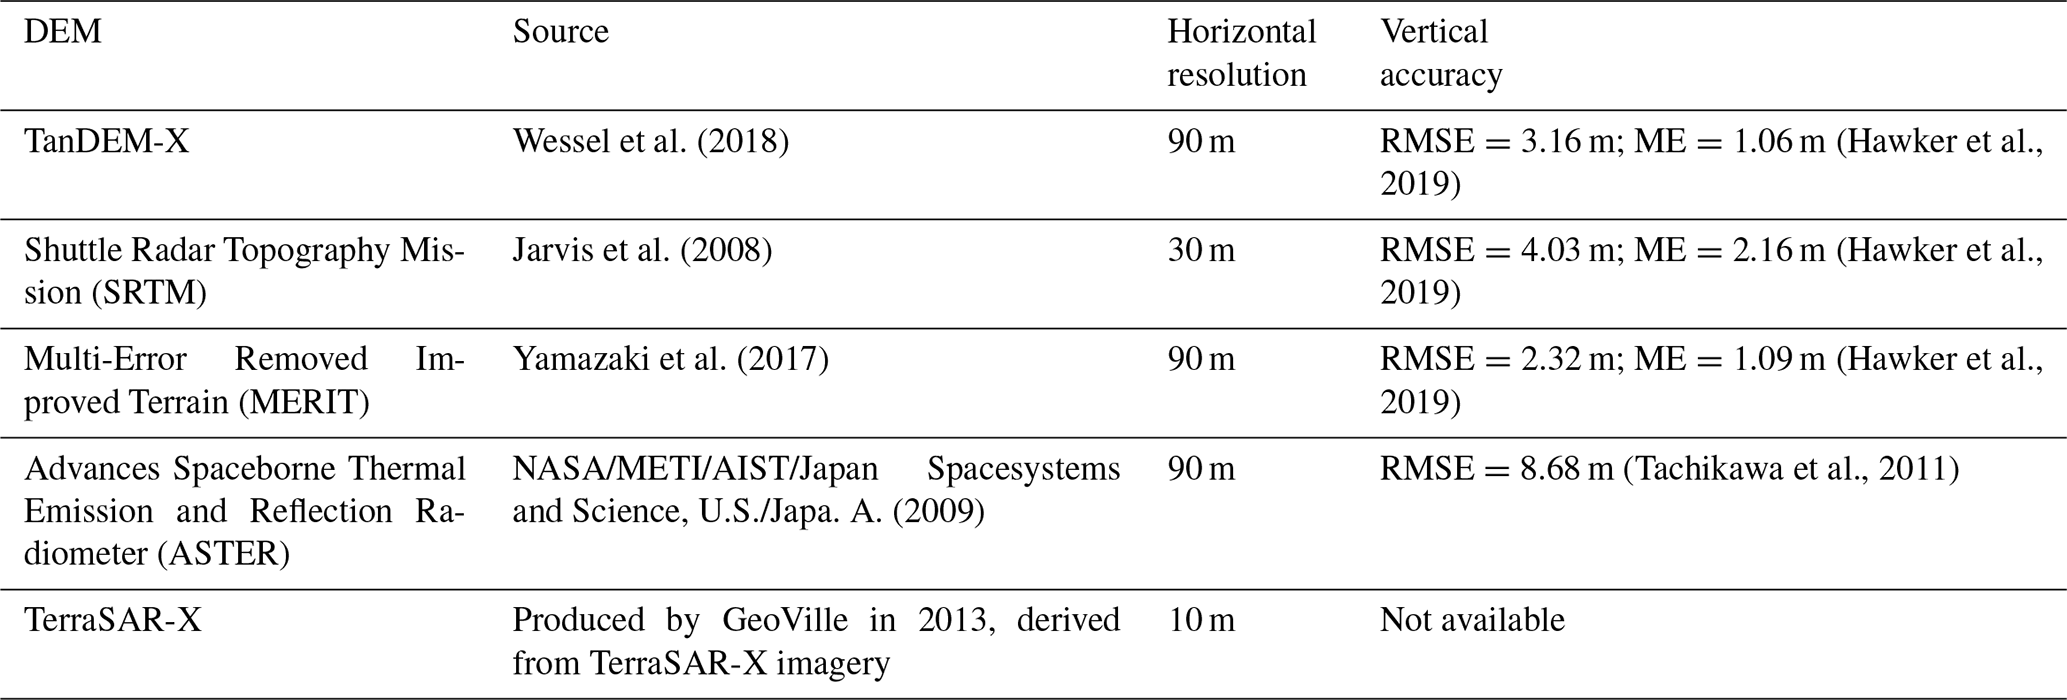
During the site campaign, topography information was derived from unmanned aerial vehicle (UAV) imagery (Deltares and CDR, 2019), using the Drone2Map software from ESRI, and referenced to the WGS84 vertical datum. UAV-derived DEMs have been proven to show higher vertical accuracy than satellite-derived DEMs (Gonçalves and Henriques, 2015; Hashemi-Beni et al., 2018; Leitão et al., 2016). The UAV measurements were horizontally and vertically referenced using one ground control point in EGS 1984 ellipsoid vertical datum. In order to quantify the effect of the DEM vertical accuracy on flood estimates, multiple globally available, satellite-derived datasets were collected and compared against the UAV-derived DEM. The latter, with a horizontal resolution of roughly 10 cm, was assumed to have the highest vertical accuracy. The investigated satellite-derived DEMs include TanDEM-X, TerraSAR-X, MERIT, ASTER and SRTM. Their horizontal resolution and vertical accuracy are described in Table 3.
Table 3Overview of investigated globally available satellite DEMs: TanDEM-X, SRTM, MERIT, ASTER and TerraSAR-X. Horizontal resolution and global error metrics of RMSE and mean error (ME) for the vertical accuracy are also provided.
Depth damage function
Depth damage functions (DDFs) describe the vulnerability of the assets at risk in the event of a flood, relating a given flood depth to a damage factor that indicates the percentage of the lost asset value. DDFs span a large variety of flooding types and building strengths, allowing for the computation of different damage scenarios (Schroter et al., 2014). However, numerous simplifications are introduced in designing such curves, such as fitting them to sparse data values and often disregarding important processes like wave forces and flooding duration. This is partly due to the high complexity of damage physics (which still lack thorough understanding) and to the scarcity of building information (Apel et al., 2006; Merz et al., 2007; Merz and Thieken, 2009; Wagenaar et al., 2016). In SIDSs, locally derived DDFs are rarely available, forcing risk modellers to apply DDFs originally derived for different geographic areas and flood types. The uncertainty of this input was represented by using a variety of possible shapes and types used in CFR analyses retrieved from literature. Figure 4 and Table 4 contain a summary of the DDFs used in this study. Generally, two main types of DDFs are used. Convex curves are representative of more flood-resilient assets that only undergo significant damage at high flood depths (e.g. American Samoa and damage scanner model (DSM) curves in Fig. 4). On the other hand, a concave shape represents less flood-resilient building, undergoing significant damages already at small flood depths (e.g. Sint Maarten or Joint Research Centre (JRC) curves in Fig. 4). Concave-shaped DDFs may be preferable at most SIDSs, representing buildings in developing countries. Economic values for different building types were collected during site visits (Deltares and CDR, 2019). In this research, a single economic value was used to represent an average building in each community.
Table 4Overview of the considered depth damage functions (DDFs), their geographical application area and flood type. Different DDF curves are shown in Fig. 4.
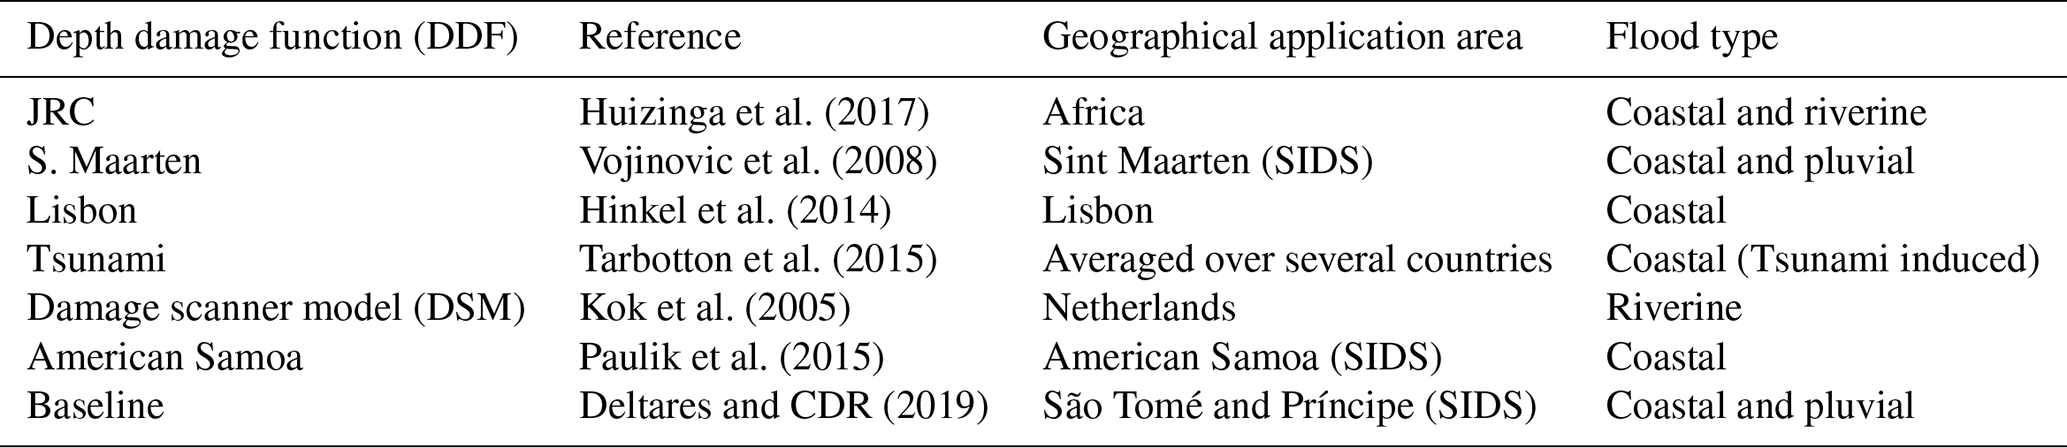
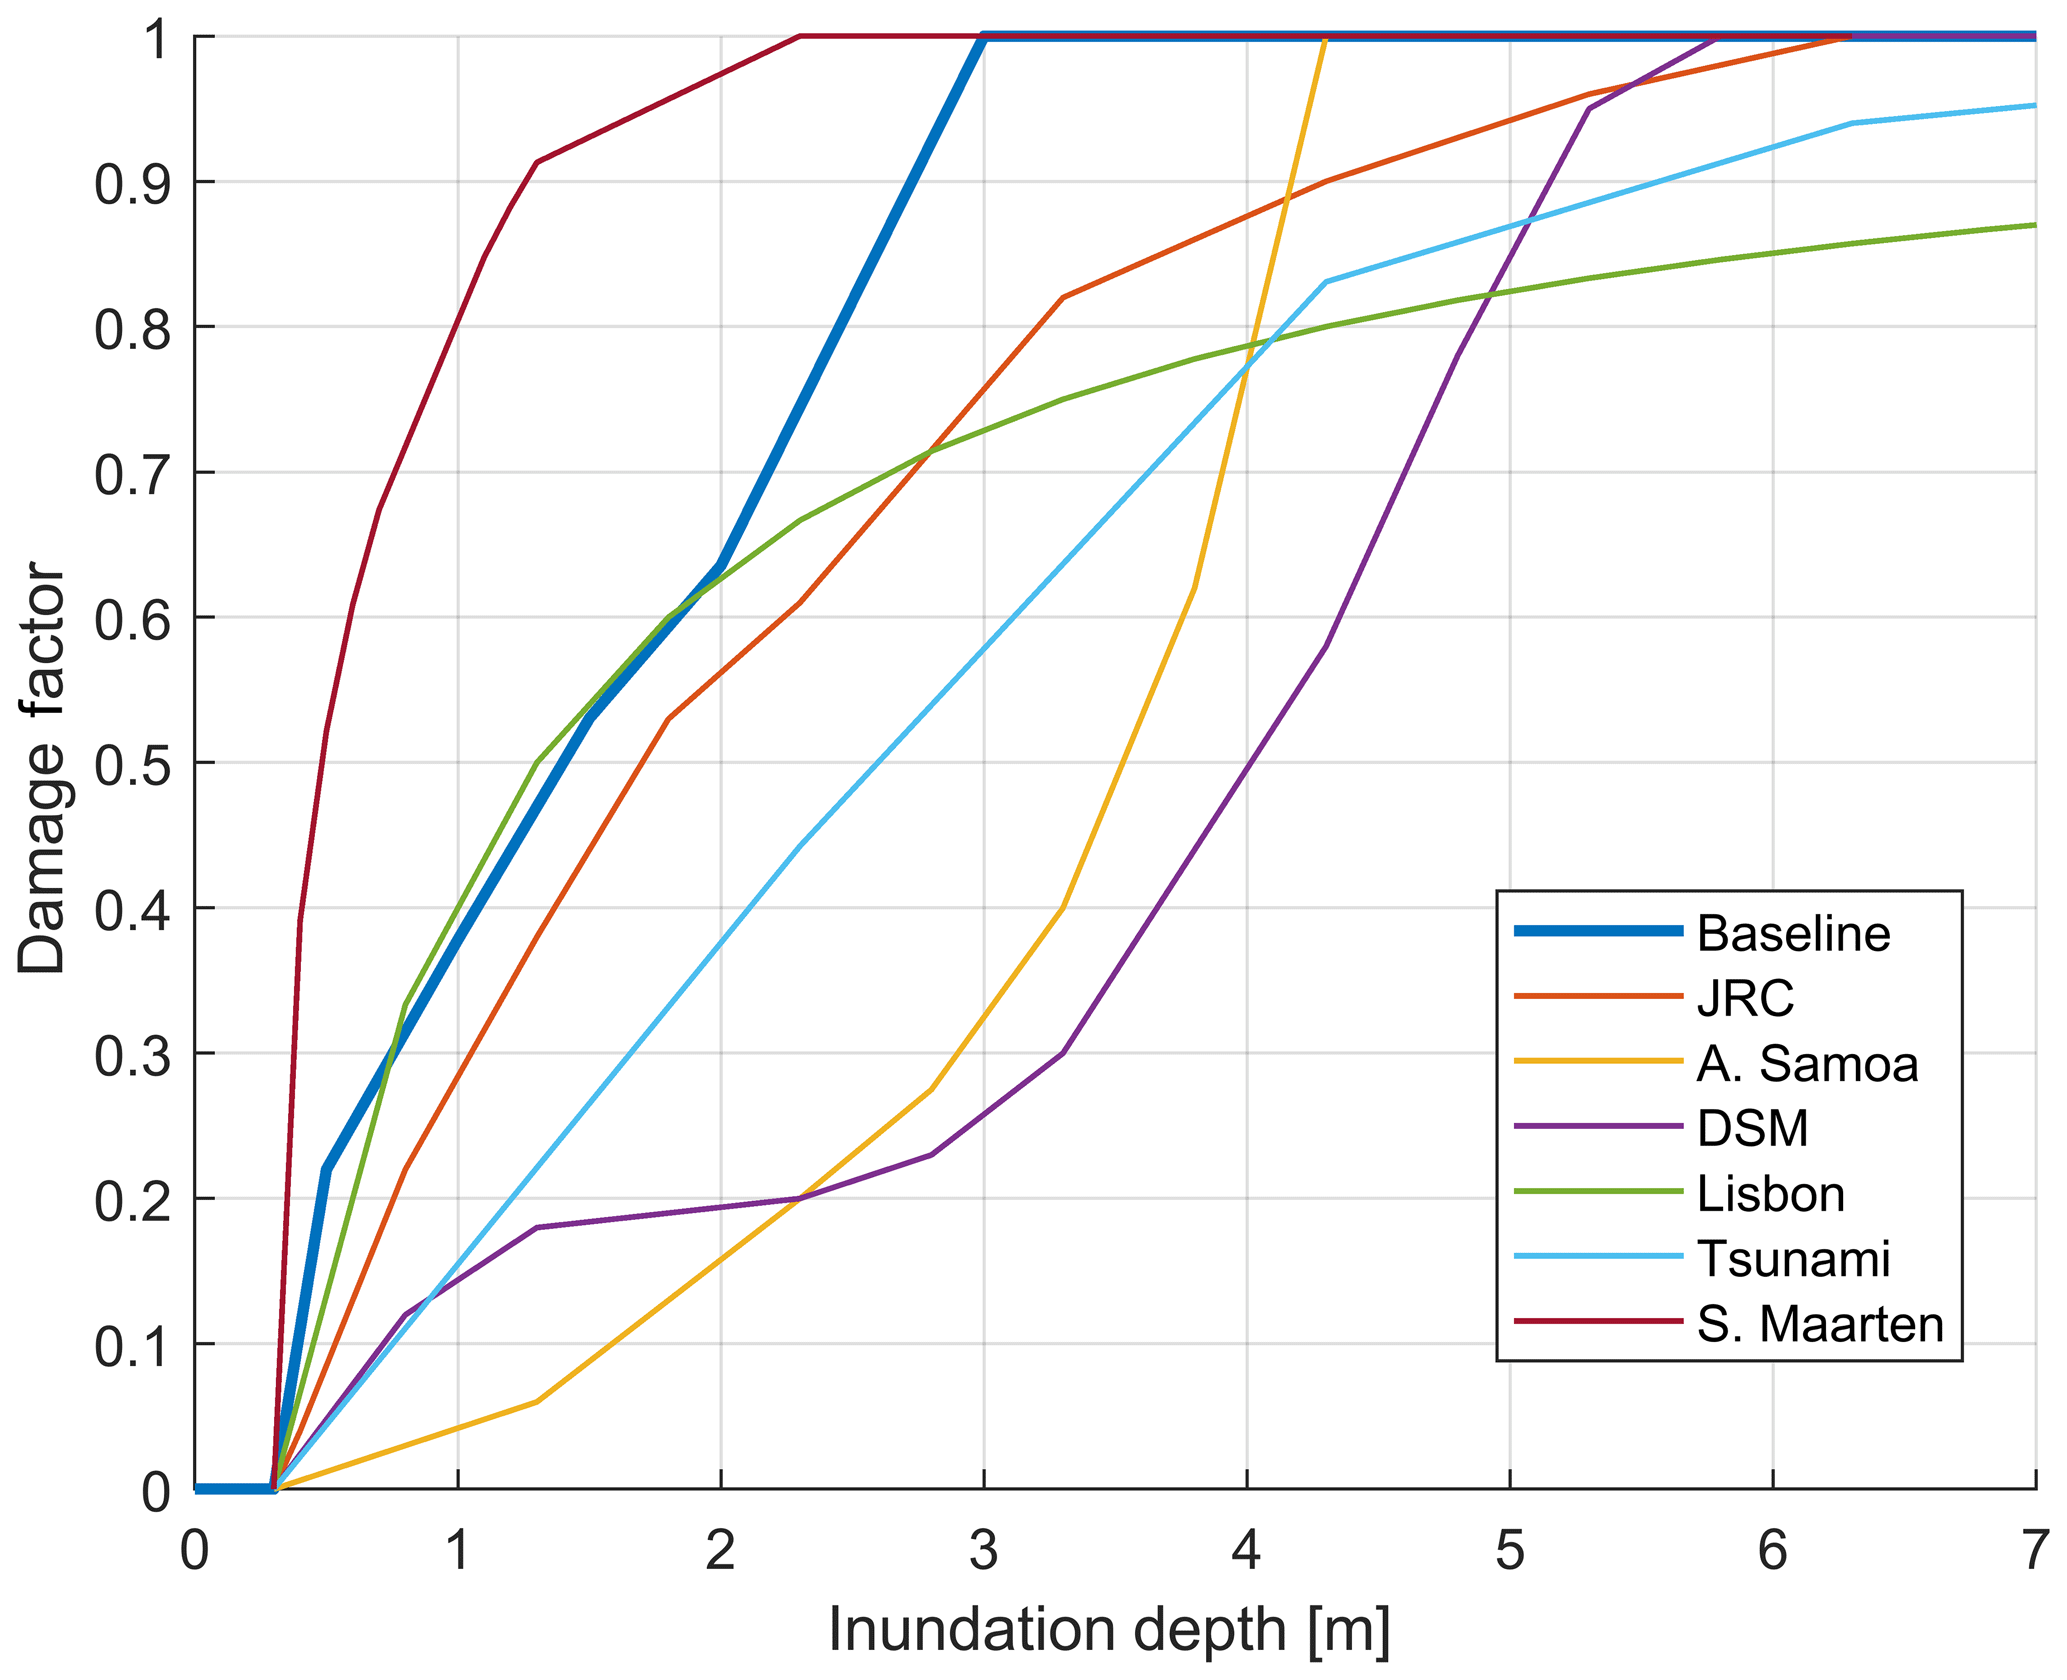
Figure 4Overview of the different DDFs investigated in the study, including concave (Baseline, JRC, Lisbon, S. Maarten and Tsunami) and convex (American Samoa and damage scanner model, DSM) types. See Table 3 for details of curves.
3.2.2 Future scenarios
To perform future risk analyses, changes in the drivers and receptors of risks must be accounted for; thus, climatic changes and socioeconomic development were included in the study. To account for future climatic changes, only SLR was included. Other processes, such as astronomical tides, storm surge levels, wave heights and local morphology were assumed to be constant in time. This is consistent with other uncertainty studies (Hinkel et al., 2014; Vousdoukas et al., 2018b), where only the mean sea level was assumed to be affected by climate change. However, the future predictions of the mentioned processes can have a significant uncertainty and impact on estimated flood damages, particularly under climate change (Chowdhury et al., 2007; Karim and Nobuo, 2008)
Sea level rise scenario
The dataset of global probabilistic projection of sea levels under the Representative Concentration Pathway (RCP) 8.5 scenario, developed by the Joint Research Centre (JRC) (Vousdoukas et al., 2018a), was used. The choice of RCP8.5 relies on the fact that, for the area of interest, the 90 % confidence interval of SLR projections under this scenario also captures the 50 %–90 % percentiles of SLR projections under the RCP4.5 scenario; i.e. it includes the more severe half of this milder scenario.
In our approach, SLR scenarios were used to increase the static water level (Fig. 2). However, the range of future SLR remains uncertain, considering the variability of the numerous processes that affect it. Therefore, choosing a single SLR scenario limits the understanding of the system susceptibility to future flood risk and hides the uncertainty in the prediction. To reproduce this uncertainty, the 5th, 50th and 95th percentiles values of SLR projections for the study area were simulated (Table 5), for the three future time horizons 2050, 2070 and 2100.
Table 5Overview of the considered SLR projections for the study area for the years 2050, 2070 and 2100, according to Vousdoukas et al. (2018a). The baseline values are italicized.
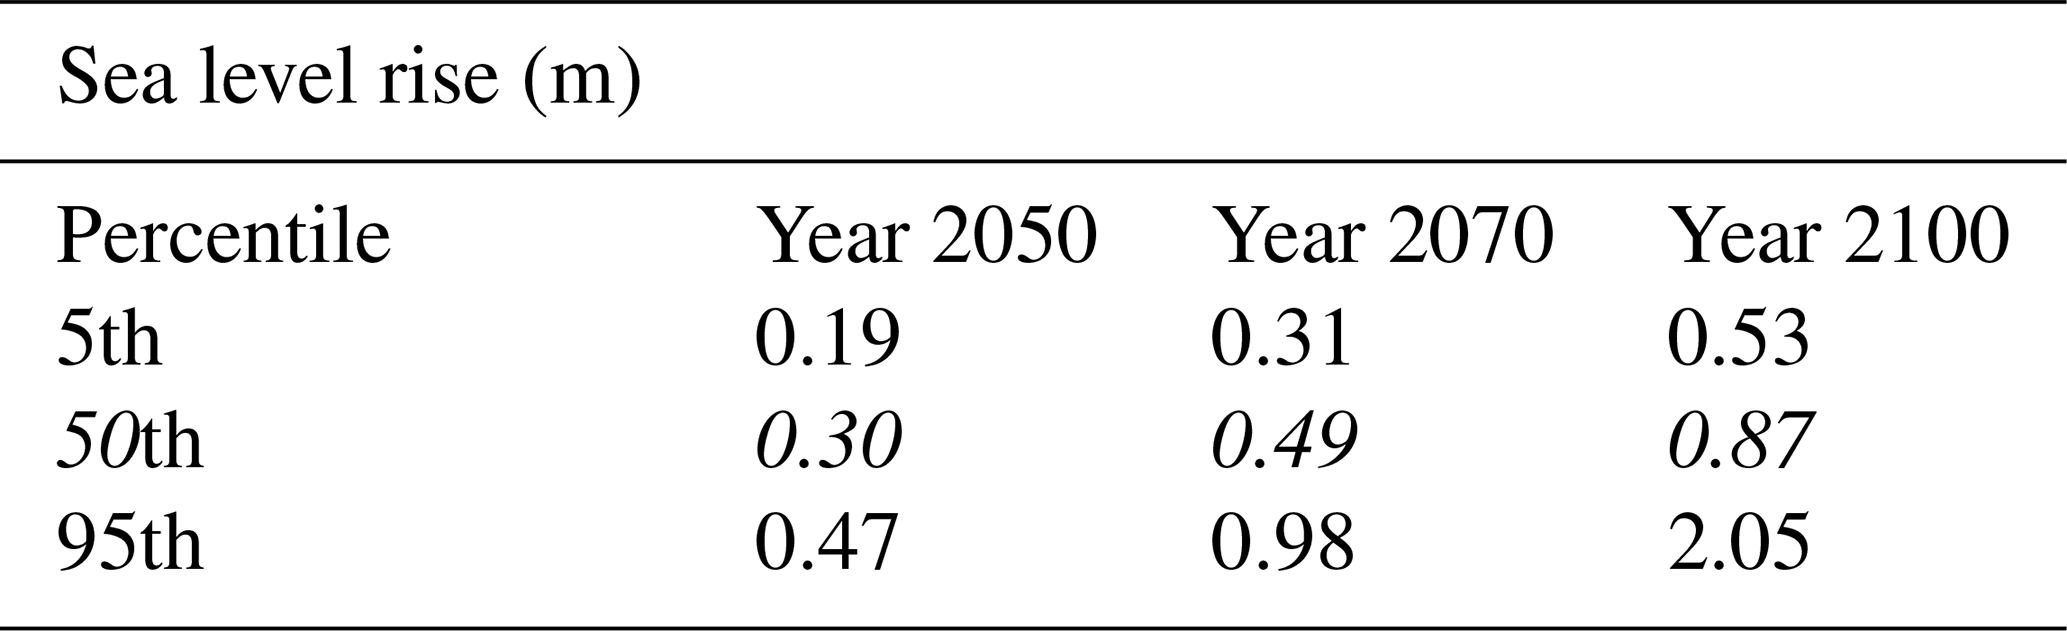
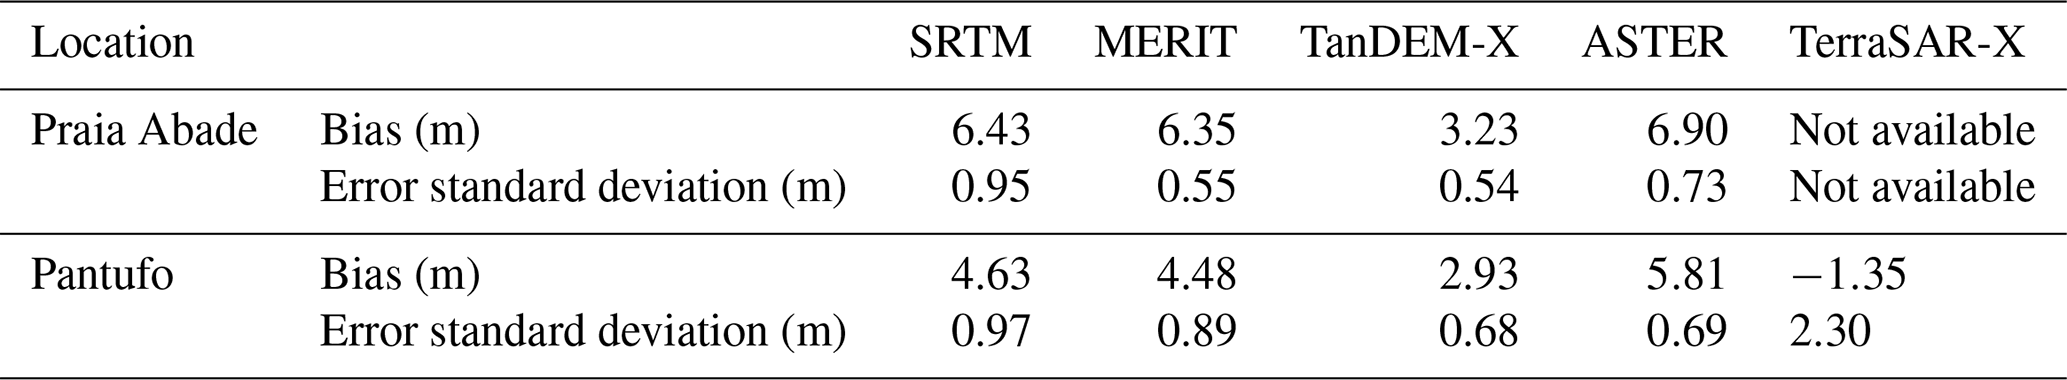
Table 6Error metrics of the studied publicly available DEMs for the two locations. The bias and error standard deviation from the UAV-derived DEM for SRTM, MERIT, TanDEM-X, ASTER and TerraSAR-X, in Praia Abade and Pantufo.
Socioeconomic scenario
For the case of São Tomé and Príncipe, urbanization and global development trends drive an increase in the number and value of exposed assets in coastal communities, for both mid- and long-term time horizons (2050, 2070 and 2100; Deltares and CDR, 2019). Riahi et al. (2017), in collaboration with the IPCC panel, have developed a set of possible societal developments, Shared Socioeconomic Pathways (SSPs), which vary according to the efforts adopted to mitigate and adapt to climate change pressures. They are designed to span a wide range of uncertainty in future human developments and define future economic variables, such as the gross domestic product (GDP). The dataset used is publicly available and produced by the International Institute for Applied Scientific Analysis3. GDP and population growth rate were used in this analysis as a proxy to compute future asset values as follows:
where GDPt,s is the GDP at the year t, under the SSP s. Three SSPs (SSP 2, 3 and 4) were considered to reproduce socioeconomic growth uncertainty, as they cover the largest range of GDP growth values for the year 2100 (Fig. 5). Although some SSP scenarios are only compatible with certain RCP scenarios at the global or regional scale (van Vuuren and Carter, 2014), at the local scale of individual and small countries RCP and SSP may not be necessarily correlated, since RCPs represent a global process while SSPs reflect more the socioeconomic development of the single country.
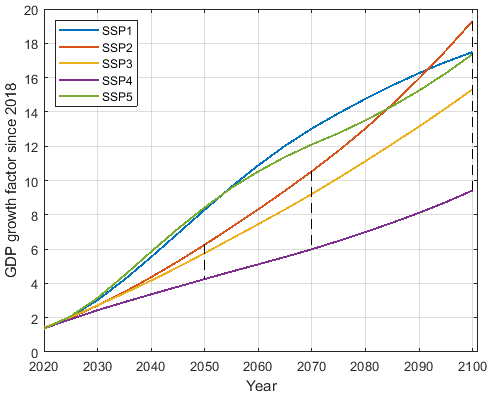
Figure 5GDP growth factors for five different SSP scenarios through time. The different lines indicate the projected GDP growth according to the five SSPs. The black dashed lines indicate the three simulated time horizons and the range of used GDP projections.
3.3 Baseline scenario and variations
We conducted a sensitivity analysis on the full parameter space of model inputs (Table 1). This led to combinations of (a) three Hs scenarios, (b) three storm surge scenarios, (c) two bathymetry scenarios, (d) six DEM scenarios, (e) seven DDF scenarios, (f) three SLR scenarios and (g) three SSP scenarios over (h) four different time horizons (current4, 2050, 2070 and 2100), ultimately leading to a total of 21 168 simulations for each community.
We considered the following scenario as the “baseline”: offshore ESLs described by the 50th percentile of storm surge, Hs and SLR, the locally measured bathymetry, the DEM derived by UAV aerial imagery, the DDF developed for São Tomé and Príncipe, and the “business as usual” SSP 3. For each input and simulation, the ratio of change of the damage estimate from the simulation with the baseline value for that input was computed. Values higher and lower than 1 express, respectively, an over- and underestimation of the damages, while the range of values expresses the introduced uncertainty around each input parameter, as summarized in Table 1.
The computed flood maps for Praia Abade and Pantufo for the baseline scenario are shown in Fig. 6. Praia Abade is more flood-prone than Pantufo, where the coastal topography is steeper and the village is on higher ground. The effect of each input on the estimated damages is presented as the ratio between estimated damages for a given scenario compared to the baseline scenario, for different time horizons (Fig. 7). Changes in the range of results through time for a particular input may be explained by both a variation in the intrinsic uncertainty of the input and a change of its sensitivity due to the influence of another input. For example, a change in the terrain slope may alter the sensitivity of flood damages to changes in the storm surge level.
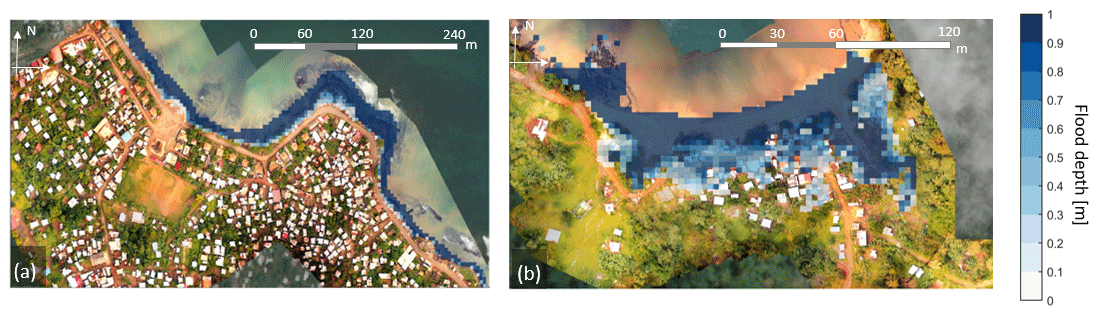
Figure 6Flood depth map estimated by SFINCS for the baseline scenario for Pantufo (a) and Praia Abade (b). Flood depths are expressed in metres. Both aerial images were reproduced with permission from CDR International.
4.1 Hydrodynamic forcing
As expected, varying the values of Hs and storm surge affects the estimated damages by between 0.5–1.75 and 0.7–1.6 times the baseline scenario, respectively, in the current time horizon (Fig. 7a, yellow and turquoise boxes). Both their impacts on output uncertainty decrease in time, as can be seen from the decreasing size of the boxes and whiskers in Fig. 7b–d. As these inputs are assumed stationary in time, their impact reduction is due to the influence of other inputs to their sensitivity.

Figure 7Absolute impacts on damage estimate uncertainty. Box plots of the ratio of damages from the baseline scenario for Hs, storm surge, bathymetry, DEM, DDFs, SLR and SSP (a–d), for the four time horizons (present day, 2050, 2070 and 2100). Mean values are represented by the black lines inside the boxes. The 25th and 75th percentiles are indicated by the edges of the boxes. The black thin whiskers extend to 1.5 times the interquartile distance, outside of which are outliers, shown with red crosses. The black dashed line shows the reference of the baseline scenario.
4.2 Bathymetry
Modelling the damages using the coarser GEBCO bathymetry dataset rather than with the locally measured dataset increases the mean damage distribution of 1.25 with respect to the baseline scenario and under the current time horizon (Fig. 7a, blue box). This is due to the lower elevation values in the nearshore given by GEBCO, which leads to higher waves nearshore. This suggests that the coarse resolution of GEBCO does not resolve nearshore bathymetry features that have an impact on wave dissipation. Similar to storm surge and Hs, the impact of bathymetry on the damage estimates decreases in time, with the boxes and whiskers decreasing in size in Fig. 7b–c–d. Figure 8 shows the histograms of damages for the current time horizon (1260 simulations) using a single bathymetry dataset, highlighting the effect of using one dataset over another. Comparing the distribution of estimated damages for the current time horizon from all input combinations with a single bathymetry dataset shows an increase in the mean for both locations when GEBCO is used while the width of the 50 % confidence interval of results increases by 20 %. This indicates that the GEBCO profiles are more sensitive to changes in other input conditions than the locally collected profiles.
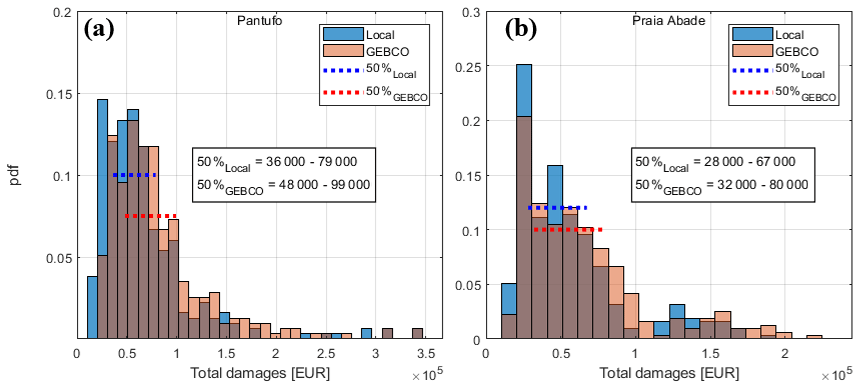
Figure 8Impact of using global bathymetric data versus local measured data. Histograms of damages from all 1260 simulations of the present scenario, using a single bathymetry dataset, the locally collected bathymetry (blue histograms) and GEBCO (orange histograms) for Pantufo (a) and Praia Abade (b). Dotted lines indicate the width of the 50 % confidence interval. Damages are expressed in euros (EUR).
4.3 Digital elevation model
Most DEMs highly underestimate flood risk compared to the UAV-derived DEM (Fig. 7a, green box). The global DEMs indicate that almost no flooding will occur, as a result of their low vertical accuracy and positive bias. For both locations, TanDEM-X has the highest vertical accuracy amongst all satellite-derived DEMs with a positive bias of 3.2 m in Praia Abade and 2.9 m in Pantufo (Table 6), although it underestimates the damages (Fig. 9). The impact on damage uncertainty is considerable for all four time horizons, particularly in 2100, with estimated damages ranging between 0.25 and 2.9 times the baseline scenario (Fig. 7d, green box). This indicates that the effect of DEMs becomes more sensitive in time to changes in other input conditions. TerraSAR-X is the only DEM underestimating the elevation, explaining the considerable number of upper outliers in the box plots (Fig. 7a–d green boxes).
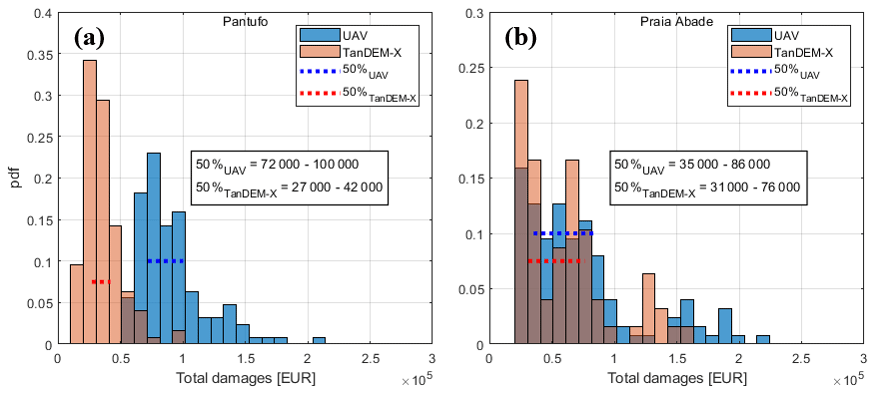
Figure 9Impact of using global DEMs versus local DEMs. Histograms of damages from all 1260 simulations of the present scenario, using a single DEM dataset, the UAV-derived scenario (blue histograms) and TanDEM-X (orange histograms) for Pantufo (a) and Praia Abade (b). Dotted lines indicate the width of the 50 % confidence interval. Damages are expressed in euros (EUR).
Comparing the distribution of estimated damages from all input combinations but using only the UAV-derived vs. TanDEM-X datasets, one can see that the latter results in a considerably smaller mean damage in Pantufo (from EUR 73 000 to EUR 43 000, Fig. 9a) and Praia Abade (from EUR 89 000 to EUR 35 000, Fig. 9b). Furthermore, the 50 % confidence interval is reduced. An explanation of the very low reliability of satellite-derived DEMs for our case study might be found in the negative correlation between their vertical accuracy and terrain slope. Indeed, Gorokhovich and Voustianiouk (2006) have found an increase in the prediction error given by SRTM on steeper slopes and mountainous areas, such as the volcanic islands of São Tomé and Príncipe.
4.4 Depth damage function
The estimated damages show a considerable uncertainty and spread of results depending on the DDF applied. For the current time horizon, DDFs hold the largest impact on model outcome of any input variable, with estimated damages ranging between 0.25 and 4 times the baseline scenario (Fig. 7a, purple box). Their range of uncertainty only slightly decreases through time (Fig. 7b–d). The majority of alternative DDFs are concave and show lower impacts compared to the convex baseline DDF, in particular for low flood depths (Fig. 4), therefore resulting in a box with a mean smaller than 1 (Fig. 7, green boxes).
4.5 Sea level rise
SLR initially has a similar impact on the uncertainty of the damages for the year 2050 as Hs and storm surge (Fig. 7b, black box), although this significantly increases for time horizons further in the more distant future. Indeed, sea level rise has the most considerable spread of results in the year 2100, 0.5–3.7 times the baseline scenario (Fig. 7d, black box). This is partially due to the increasing uncertainty in SLR estimates for the year 2100, as future climate modelling assumptions become weaker for longer time horizons.
4.6 Socioeconomic scenarios
The uncertainty brought by socioeconomic changes is limited in this framework. Indeed, varying the selected SSP does not yield a significant variation in the model outcome, and the highest spread of results is found for the year 2100 (0.6–1.3 times the baseline, Fig. 7d), when uncertainties in the prediction of social development become larger. However, including socioeconomic factors in the risk estimates increases the economic value of the assets at risk, and thus increases the potential damage. Figure 10 shows the computed damages through time, using three modelling approaches: including only climate-change-induced SLR, including only socioeconomic changes and including both. Future damages are remarkably higher when taking the economic development of the communities into account. When both changes are included, the damages of the baseline scenario increase by a factor of 35 in Pantufo and 50 in Praia Abade for the year 2100 (Fig. 10a–b, blue line). Combining SLR and socioeconomic growth increases the damages non-linearly, as the former increases the hazard and the latter affects the value of exposed assets, therefore acting on different risk components.
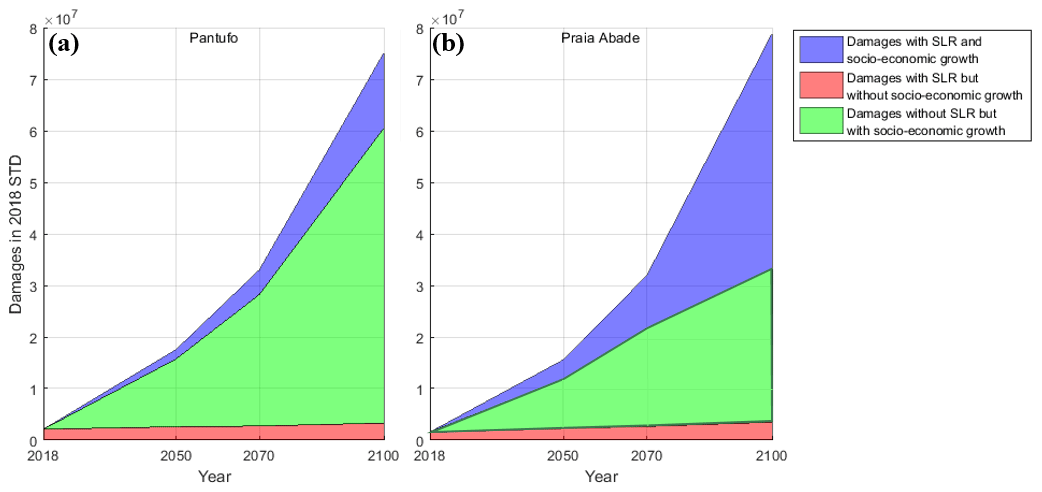
Figure 10The relevance of socioeconomic changes. (a) Damages under the baseline scenario expressed in São Toméan dobras (STD) for Pantufo and (b) Praia Abade over time, differentiated by contributing factors: damages driven only by climate-change-induced SLR (red), damages driven only by socioeconomic changes (green) and damages driven by both (blue).
4.7 Relative importance
To obtain an estimate of the uncertainty of each input variable through time, the range of possible values within the damage estimate of each input is considered (Fig. 7). The relative importance of each variable is computed as the ratio between its range of possible values and the sum of all ranges of possible values of each input, scaled to unity. DDFs and DEMs have the largest relative importance of all investigated input variables for the current time horizon (Fig. 11). For future risk estimates, the uncertainty due to SLR continuously increases and becomes dominant for the year 2100, followed by DDFs and DEMs. Socioeconomic changes have a somewhat more constrained relative impact, although they increase in time. Hs, storm surge and bathymetry have the smallest relative effect on damage estimates, decreasing with time. However, their impact also decreases absolutely, as their range of results becomes narrower through time (Fig. 7a–d, yellow, turquoise and blue boxes). Their reduction is linked to the change in mean sea level due to SLR, which leads to the exceedance of thresholds in the elevation that reduce the sensitivity of flood damage estimates to these inputs.
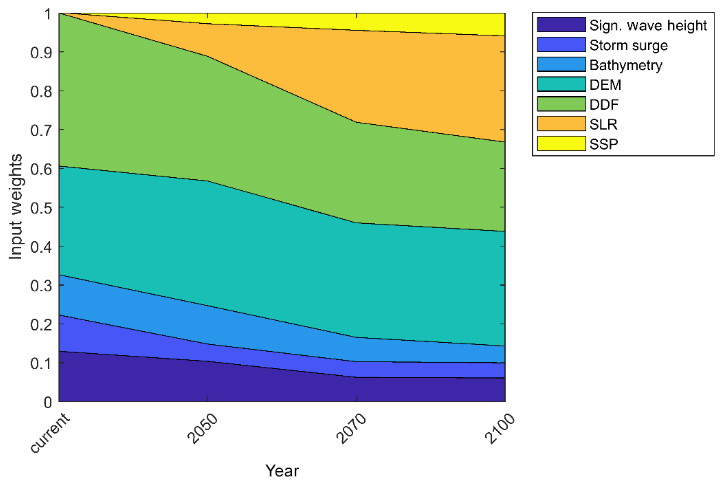
Figure 11Inputs' relative contribution to damage estimate uncertainty. Relative importance of the investigated inputs' (Hs, storm surge, bathymetry, DEMs, DDFs, SLR and SSP) effect on the damage estimate uncertainty over the four time horizons considered.
This paper presents an investigation of multiple uncertainty sources in relation to CFR assessment at two small islands, highlighting the consequences of the scarcity of reliable input data for SIDS. The results provide a useful indication and highlight the need of collecting higher-quality data. Furthermore, the impact of SLR predictions becomes significantly more important with time, becoming dominant for risk estimates at the end of this century. The baseline scenario is composed by the best available input data (i.e. value in which we have most confidence or with the highest resolution). To assess the uncertainty in our CFR analysis, we varied this scenario based on alternative available data sources or high and low percentiles of a given probability distribution, estimating the impact brought by each uncertainty source on the damage estimation. However, there are several assumptions that go into these estimates, which are discussed below.
5.1 Assumptions and limitations
5.1.1 Present-day scenario
We used advanced hydrodynamic models which enabled us to include short-wave processes and their effect on floods, an aspect that can lead to intensified flooding consequences (Storlazzi et al., 2018). However, each model contains numerous assumptions and simplifications that translate into further uncertainties in the output estimate (Loucks and Van Beek, 2017; Uusitalo et al., 2015). These model uncertainties were disregarded as we focused only on uncertainties related to data input.
We performed a global sensitivity analysis, exploring the whole input space domain. All possible input combinations were tested, leading to the presence of dependencies in the behaviour and response of some inputs. This approach has the advantage of examining input combinations that may include non-linear interactions (Uusitalo et al., 2015). Most notably, Hs and storm surge have experienced a decrease in their impact on damage estimate uncertainty in more distant time horizons (Fig. 7a–d). This was linked to the action of SLR, which led to a change in the terrain slope at the coastline that altered the sensitivity of damage estimates to changes in storm surge and Hs. This demonstrates how uncertainty in one input variable can affect the uncertainty in the estimate brought by another input variable. To further improve the presented methodology, a Monte Carlo analysis that considers a pdf for each uncertain input to estimate the pdf of the expected damages could be performed, although the computational effort is prohibitive. To avoid the computational burden of a Monte Carlo analysis, an ANOVA (analysis of variance) may be performed, as shown for example by Gangrade et al. (2020).
The choice of uncertainty sources and their range of values and datasets, although subjective, allow for an indication of the most important uncertainty regarding risk analyses in SIDS. The choice of inputs that were analysed was balanced carefully between comprehensiveness of the analysis and computational expenses. Therefore, several factors were discarded, including small-scale adaptation measures that are not represented in the DEMs and other sources of flood hazards (e.g. rainfall events).
Compound flooding events (e.g. coastal and riverine) can significantly increase the damages more than single events only (Ganguli and Merz, 2019; Kumbier et al., 2018; Wahl et al., 2015; Ward et al., 2017), and further research could estimate the added uncertainty. Moreover, the interdependency between different ESL components has been neglected, although tide and sea level changes are often correlated, adding further uncertainty in the analysis (Devlin et al., 2017). The combination of storm surge peak with the spring neap tidal variability (Vousdoukas et al., 2018b) has also been disregarded, to model a worst-case scenario where the storm peak and spring high tide occur simultaneously (Fig. 3).
Separate datasets with different recorded lengths were used for the statistical estimation of the storm surge level and significant wave height 100-year-return-period values, which is an additional source of uncertainty in the damage prediction.
Finally, in the damage estimation, only direct and tangible damages were considered, whereas loss of life, natural habitat and other indirect damages were discarded, therefore leading to an underestimation of the total damages.
5.1.2 Future scenarios
Societal developments have been implemented in a rather simplistic way, considering only future asset and population growths. In particular, migration patterns, global economic trends, technological advancement, projected land use and wealth distribution could be included to further strengthen the methodology. However, the results have still shown the detrimental effect of disregarding socioeconomic changes, responsible for an increase of a factor 50 in the damage estimates (Fig. 10a, blue line).
The spatial distribution of houses built in the future was assumed to be identical to the current one. Since people may relocate to areas with lower flood risk, this assumption could result in an overestimation of the damages. Furthermore, the possibility of exceeding the level of available land for new constructions is not considered, which may have led to estimating an unrealistic population growth in the communities. Moreover, only one representative type of building was included in the analysis, using a weighted averaging approach based on the distribution of building types. This assumption could yield an underestimation of flood damages in the case that most highly valuable buildings are in the most hazard-prone area. Nevertheless, this assumption was supported by the heterogeneous spatial distribution of buildings in Praia Abade and Pantufo. The investigation of uncertainty in future exposure has not been extensively studied but can have a strong impact on the risk assessment (Bouwer, 2013).
Climate change impacts on future risk predictions were only considered in a limited way, evaluating just the role of SLR. Changes in significant wave height, storm surge and bathymetry were omitted from our analysis, as in other similar studies (Hinkel et al., 2014; Vousdoukas et al., 2018b), which leaves their impact on future damage estimates unquantified.
5.1.3 Applicability of the results to other locations
The methodology was applied to two coastal communities on the islands of São Tomé and Príncipe. Although the two villages were located at two different islands, with rather different local geomorphology, the results were rather similar. Therefore, we believe that the general findings from this research could be translated to other SIDSs.
This study aims to better understand uncertainty of input data in coastal flood risk (CFR) in small island developing states (SIDSs). The methodology and outcomes were derived based on an assessment of two villages located on the two islands of São Tomé and Príncipe where locally measured data were available to be compared with publicly available global datasets. Investigating the uncertainty propagation from imperfect input data along the whole risk assessment may guide the allocation of limited financial resources to collect the most relevant data more accurately for CFR analyses in SIDSs.
The uncertainty investigation was performed using an ensemble of hydrodynamic and impact models, estimating flood damages for a 100-year event. Different input sources of uncertainty were investigated, including (i) significant wave height, (ii) storm surge level, (iii) SLR projections to ESLs, (iv) bathymetry and (v) topography datasets, (vi) damage models (DDFs), and (vii) socioeconomic changes.
Considerable uncertainty is found in the estimation of flood damages, highlighting the challenges of performing CFR analyses for SIDSs. For the current time horizon, the choice of DDF, followed by topography information (DEM), is the main contributor affecting the uncertainty of the output, varying the estimated damages, with a factor ranging between 0.25–4 and 0.3–2.5 relative to the baseline case. For future damage estimates, SLR predictions become the input with the highest impact on damages estimates. DEMs and DDFs still carry considerable uncertainty and are ranked second and third in importance (Fig. 11). SLR and especially economic and population growth drive enormous increases in future expected risk, with mean damage estimates of the baseline scenario increasing by up to a factor of 50 from the present day. Nevertheless, socioeconomic changes have a smaller uncertainty compared to other inputs, partially due to their limited model implementation. We thus recommend future research in improving the implementation of socioeconomic changes in risk modelling. Hs, storm surge and bathymetry have a more confined impact on the overall damage estimate uncertainty, and their relative weight slightly decreases through time.
Using low-quality input data leads to a significant error in the prediction, together with a variation in the level of uncertainty reproduced by the model. This negatively affects the model's trustworthiness, as it may give unwarranted confidence in its output. Complex hydrodynamic models that include multiple physical processes and which can achieve a high level of accuracy in the prediction already exist. However, the efforts put into developing these models can be futile whenever incorrect input data are used, suggesting that the improvement of data-collecting techniques should become a priority. If reducing uncertainty requires obtaining additional information, then the value of this additional information must exceed the cost of obtaining it. This value will be the reduction of the uncertainty brought by the information.
Furthermore, we recommend focusing on improving DEM quality, collecting damage information and improving the reliability of SLR projections, as they represent the critical factors affecting the uncertainty in coastal flood damage estimates in SIDSs.
This work relied on public data as inputs, which are available from the providers cited in Sect. 3. Locally measured topographic and bathymetric information is made available from Deltares and CDR International.
MUP, AG, AvD and SGP jointly conceived the study. MUP analysed the data and together with AG prepared the paper, with all the authors discussing results and implications and co-writing the paper at all stages.
The authors declare that they have no conflict of interest.
The authors would like to thank Elena Vandebroek, Luisa Torres Dueñas, Tim Leijnse, Kees Nederhoff and Bouke Ottow from Deltares and Jenny Pronker and Herald Vervoorn from CDR International for their essential contribution in setting up the hazard and risk modelling framework and collecting the local data used in the study. Furthermore, we would like to thank the Ministry of Public Works, Infrastructures, Natural Resources and Environment (MOPIRNA) of the Democratic Republic of São Tomé and Príncipe and the World Bank WACA programme (West Africa Coastal Area Management) for the support received during the study. In particular, we would like to thank Eng. Arlindo Carvalho, Olivio Diogo and Abnilde de Ceita Lima from the local technical team of WACA for their invaluable support, in particular during the field missions. We are also grateful for the feedback from the three anonymous reviewers, whose comments have strengthened our manuscript. Finally, we would like to thank Naraya Carrasco and Nicolas Desramaut from the World Bank team.
This paper was edited by Animesh Gain and reviewed by three anonymous referees.
Alves, J. H. G. M.: Numerical modeling of ocean swell contributions to the global wind-wave climate, Ocean Model., 11, 98–122, https://doi.org/10.1016/j.ocemod.2004.11.007, 2006.
Apel, H., Thieken, A. H., Merz, B., and Blöschl, G.: A probabilistic modelling system for assessing flood risks, Nat. Hazards, 38, 79–100, https://doi.org/10.1007/s11069-005-8603-7, 2006.
Basco-Carrera, L., Warren, A., van Beek, E., Jonoski, A., and Giardino, A.: Collaborative modelling or participatory modelling? A framework for water resources management, Environ. Model. Softw., 91, 95–110, https://doi.org/10.1016/j.envsoft.2017.01.014, 2017.
Bertin, X., Li, K., Roland, A., Zhang, Y. J., Breilh, J. F., and Chaumillon, E.: A modeling-based analysis of the flooding associated with Xynthia, central Bay of Biscay, Coast. Eng., 94, 80–89, 2014.
Booij, N., Holthuijsen, L. H., and Ris, R. C.: The “Swan” Wave Model for Shallow Water, Coast. Eng., 1996, 668–676, https://doi.org/10.1061/9780784402429.053, 1997.
Bouwer, L. M.: Projections of Future Extreme Weather Losses Under Changes in Climate and Exposure, Risk Anal., 33, 915–930, https://doi.org/10.1111/j.1539-6924.2012.01880.x, 2013.
Bouwer, L. M., Bubeck, P., and Aerts, J. C. J. H.: Changes in future flood risk due to climate and development in a Dutch polder area, Global Environ. Chang., 20, 463–471, https://doi.org/10.1016/j.gloenvcha.2010.04.002, 2010.
Bove, G., Becker, A., Sweeney, B., Vousdoukas, M. I., and Kulp, S. A.: A method for regional estimation of climate change exposure of coastal infrastructure: Case of USVI and the influence of digital elevation models on assessments, Sci. Total Environ., 710, 136–162, https://doi.org/10.1016/j.scitotenv.2019.136162, 2020.
Caires, S.: Extreme Value Analysis?: Wave Data, Jt. WMO/IOC Tech. Comm. Oceanogr. Mar. Meteorol. Tech. Rep. 57, 33, 2011.
Cea, L. and French, J. R.: Bathymetric error estimation for the calibration and validation of estuarine hydrodynamic models, Estuar. Coast. Shelf S., 100, 124–132, https://doi.org/10.1016/j.ecss.2012.01.004, 2012.
Chowdhury, R., Chu, P. and Schroeder, T.: ENSO and seasonal sea-level variability – A diagnostic discussion for the U.S.-Affiliated Pacific Islands, Theor. Appl. Climatol., 88, 213–224, https://doi.org/10.1007/s00704-006-0245-5, 2007.
Cook, A. and Merwade, V.: Effect of topographic data, geometric configuration and modeling approach on flood inundation mapping, J. Hydrol., 377, 131–142, 2009.
Dee, D. P., Uppala, S. M., Simmons, A. J., Berrisford, P., Poli, P., Kobayashi, S., Andrae, U., Balmaseda, M. A., Balsamo, G., Bauer, P., Bechtold, P., Beljaars, A. C. M., van de Berg, L., Bidlot, J., Bormann, N., Delsol, C., Dragani, R., Fuentes, M., Geer, A. J., Haimberger, L., Healy, S. B., Hersbach, H., Hólm, E. V., Isaksen, L., Kållberg, P., Köhler, M., Matricardi, M., Mcnally, A. P., Monge-Sanz, B. M., Morcrette, J. J., Park, B. K., Peubey, C., de Rosnay, P., Tavolato, C., Thépaut, J. N., and Vitart, F.: The ERA-Interim reanalysis: Configuration and performance of the data assimilation system, Q. J. Roy. Meteor. Soc., 137, 553–597, https://doi.org/10.1002/qj.828, 2011.
Deltares and CDR: Geomorphology, coastal dynamics, and adaptation options for eight coastal communities in São Tomé and Príncipe, Technical Report, (No. 11202885-002-ZKS-0005), 2019.
Devlin, A. T., Jay, D. A., Talke, S. A., Zaron, E. D., Pan, J., and Lin, H.: Coupling of sea level and tidal range changes, with implications for future water levels, Sci. Rep.-UK, 7, 1–12, https://doi.org/10.1038/s41598-017-17056-z, 2017.
Dresback, K. M., Fleming, J. G., Blanton, B. O., Kaiser, C., Gourley, J. J., Tromble, E. M., Luettich, R. A., Kolar, R. L., Hong, Y., Van Cooten, S., Vergara, H. J., Flamig, Z. L., Lander, H. M., Kelleher, K. E., and Nemunaitis-Monroe, K. L.: Skill assessment of a real-time forecast system utilizing a coupled hydrologic and coastal hydrodynamic model during Hurricane Irene (2011), Cont. Shelf Res., 71, 78–94, https://doi.org/10.1016/j.csr.2013.10.007, 2013.
Egorova, R., van Noortwijk, J. M., and Holterman, S. R.: Uncertainty in flood damage estimation, Int. J. River Basin Manag., 6, 139–148, https://doi.org/10.1080/15715124.2008.9635343, 2008.
Gangrade, S., Kao, S. C., and McManamay, R. A.: Multi-model Hydroclimate Projections for the Alabama-Coosa-Tallapoosa River Basin in the Southeastern United States, Sci. Rep.-UK, 10, 1–12, https://doi.org/10.1038/s41598-020-59806-6, 2020.
Ganguli, P. and Merz, B.: Extreme Coastal Water Levels Exacerbate Fluvial Flood Hazards in Northwestern Europe, Sci. Rep.-UK, 9, 1–14, https://doi.org/10.1038/s41598-019-49822-6, 2019.
Giardino, A., Bettencourt, S., Carvalho, A., Filatova, T., Keizer, O., De, Schellekens, J., and Ottow, B.: Hydrology and Coastal Morphology At São Tomé, in 8th International Conference on Coastal and Port Engineering in Developing Countries PIANC-COPEDEC VIII, p. 12., 2012.
Giardino, A., Nederhoff, K., and Vousdoukas, M.: Coastal hazard risk assessment for small islands: assessing the impact of climate change and disaster reduction measures on Ebeye (Marshall Islands), Reg. Environ. Chang., 18, 2237–2248, https://doi.org/10.1007/s10113-018-1353-3, 2018.
Gonçalves, J. and Henriques, R.: UAV photogrammetry for topographic monitoring of coastal areas, ISPRS J. Photogramm. Remote Sens., 104, 101–111, 2015.
Gorokhovich, Y. and Voustianiouk, A.: Accuracy assessment of the processed SRTM-based elevation data by CGIAR using field data from USA and Thailand and its relation to the terrain characteristics, Remote Sens. Environ., 104, 409–415, https://doi.org/10.1016/j.rse.2006.05.012, 2006.
Hare, R., Eakins, B., and Amante, C.: Modelling bathymetric uncertainty, Int. Hydrogr. Rev., 1, 31–42, 2011.
Hashemi-Beni, L., Jones, J., Thompson, G., Johnson, C., and Gebrehiwot, A.: Challenges and Opportunities for UAV-Based Digital Elevation Model Generation for Flood-Risk, Sensors, 18, 3843, https://doi.org/10.3390/s18113843, 2018.
Hawker, L., Neal, J., and Bates, P.: Accuracy assessment of the TanDEM-X 90 Digital Elevation Model for selected floodplain sites, Remote Sens. Environ., 232, 111319, https://doi.org/10.1016/j.rse.2019.111319, 2019.
Hinkel, J., Lincke, D., Vafeidis, A. T., Perrette, M., Nicholls, R. J., Tol, R. S. J., Marzeion, B., Fettweis, X., Ionescu, C., and Levermann, A.: Coastal flood damage and adaptation costs under 21st century sea-level rise, P. Natl. Acad. Sci. USA, 111, 3292–3297, https://doi.org/10.1073/pnas.1222469111, 2014.
Huizinga, J., de Moel, H., and Szewczyk, W.: Global flood depth-damage function : Methodology and the Database with Guidelines, Joint Research Centre (JRC), 1–108, https://doi.org/10.2760/16510, 2017.
Jarvis, A., Guevara, E., Reuter, H. I., and Nelson, A. D.: Hole-filled SRTM for the globe Version 4, available from the CGIAR-CSI SRTM 90 m Database, CGIAR Consort. Spat. Inf., available at: http://srtm.csi.cgiar.org/ (last access: 13 May 2019), 2008
Karim, M. F. and Nobuo, M.: Impacts of climate change and sea-level rise on cyclonic storm surge floods in Bangladesh, Global Environ. Chang., 18, 490–500, 2008.
Kok, M., Huizinga, H. J., Vrouwenvelder, A. and Barendregt, A.: Standaardmethode 2004–Schade en Slachtoffers als gevolg van overstromingen, RWS Dienst Weg-en Waterbouwkunde, DWW-2005-0, 2005.
Kron, W.: Flood risk = hazard values vulnerability, Water Int., 30, 58–68, 2005.
Kulp, S. A. and Strauss, B. H.: New elevation data triple estimates of global vulnerability to sea-level rise and coastal flooding, Nat. Commun., 10, 1–12, https://doi.org/10.1038/s41467-019-12808-z, 2019.
Kumbier, K., Carvalho, R. C., Vafeidis, A. T., and Woodroffe, C. D.: Investigating compound flooding in an estuary using hydrodynamic modelling: a case study from the Shoalhaven River, Australia, Nat. Hazards Earth Syst. Sci., 18, 463–477, https://doi.org/10.5194/nhess-18-463-2018, 2018.
Leijnse, T., van Ormondt, M., Nederhoff, K., and van Dongeren, A.: Modeling compound flooding including wave-driven processes using a computationally efficient reduced-physics solver, Coast. Eng., in review, 2020.
Leitão, J. P., Moy de Vitry, M., Scheidegger, A., and Rieckermann, J.: Assessing the quality of digital elevation models obtained from mini unmanned aerial vehicles for overland flow modelling in urban areas, Hydrol. Earth Syst. Sci., 20, 1637–1653, https://doi.org/10.5194/hess-20-1637-2016, 2016.
Loucks, D. P. and Van Beek, E.: An Introduction to Probability, Statistics, and Uncertainty, in: Water Resource Systems Planning and Management, 213–300, Springer, Cham, 2017.
Merz, B. and Thieken, A. H.: Flood risk curves and uncertainty bounds, Nat. Hazards, 51, 437–458, https://doi.org/10.1007/s11069-009-9452-6, 2009.
Merz, B., Thieken, A. H., and Gocht: Flood risk mapping at the local scale: Concepts and challenges, Adv. Nat. Technol. Hazards Res., 25, 231–251, https://doi.org/10.1007/978-1-4020-4200-3_13, 2007.
Messner, F. and Meyer, V.: Flood damage, vulnerability and risk perception – challenges for flood damage research, in: Flood Risk Management – Hazards, Vulnerability and Mitigation Measures, edited by: Schanze, J., Zemn, E., and Marsalek, J., Springer, Dordrecht, 2006.
De Moel, H. and Aerts, J. C. J. H.: Effect of uncertainty in land use, damage models and inundation depth on flood damage estimates, Nat. Hazards, 58, 407–425, https://doi.org/10.1007/s11069-010-9675-6, 2011.
de Moel, H., Asselman, N. E. M., and Aerts, J. C. J. H.: Uncertainty and sensitivity analysis of coastal flood damage estimates in the west of the Netherlands, Nat. Hazards Earth Syst. Sci., 12, 1045–1058, https://doi.org/10.5194/nhess-12-1045-2012, 2012.
Monioudi, I., Asariotis, R., Becker, A., Bhat, C., Dowding-Gooden, D., Esteban, M., Feyen, L., Mentaschi, L., Nikolaou, A., Nurse, L., Phillips, W., Smith, D., Satoh, M., Trotz, U. O., Velegrakis, A. F., Voukouvalas, E., Vousdoukas, M. I., and Witkop, R.: Climate change impacts on critical international transportation assets of Caribbean Small Island Developing States (SIDS): the case of Jamaica and Saint Lucia, Reg. Environ. Chang., 18, 2211–2225, https://doi.org/10.1007/s10113-018-1360-4, 2018.
Muis, S., Verlaan, M., Winsemius, H. C., Aerts, J. C. J. H., and Ward, P. J.: A global reanalysis of storm surges and extreme sea levels, Nat. Commun., 7, 1–11, https://doi.org/10.1038/ncomms11969, 2016.
NASA/METI/AIST/Japan Spacesystems and Science, U.S./Japa. A.: ASTER Global Digital Elevation Model [Data set], NASA EOSDIS Land Processes DAAC, https://doi.org/10.5067/ASTER/ASTGTM.002, 2009.
OECD World Bank: Climate and Disaster Resilience Financing in Small Island Developing States, OECD Publishing Paris, https://doi.org/10.1787/9789264266919-en, 2016.
Paprotny, D., Morales-nápoles, O., Vousdoukas, M. I., Jonkman, S. N. and Nikulin, G.: Accuracy of pan-European coastal flood mapping, J. Flood Risk Manag., 12, e12459, https://doi.org/10.1111/jfr3.12459, 2019.
Paulik, R., Smart, G., Turner, R., and Blind, J.: Development of preliminary depth-damage functions for samoa buildings, Natl. Inst. Water Atmos. Res., 2015.
Pickands, J.: Statistical inference using extreme order statistics, Ann. Stat., 15, 1580–1592, 1975.
Plant, N. G., Holland, K. T., and Puleo, J. A.: Analysis of the scale of errors in nearshore bathymetric data, Mar. Geol., 191, 71–86, https://doi.org/10.1016/S0025-3227(02)00497-8, 2002.
Prahl, B. F., Rybski, D., Boettle, M., and Kropp, J. P.: Damage functions for climate-related hazards: unification and uncertainty analysis, Nat. Hazards Earth Syst. Sci., 16, 1189–1203, https://doi.org/10.5194/nhess-16-1189-2016, 2016.
Riahi, K., van Vuuren, D. P., Kriegler, E., Edmonds, J., O'Neill, B. C., Fujimori, S., Bauer, N., Calvin, K., Dellink, R., Fricko, O., Lutz, W., Popp, A., Cuaresma, J. C., KC, S., Leimbach, M., Jiang, L., Kram, T., Rao, S., Emmerling, J., Ebi, K., Hasegawa, T., Havlik, P., Humpenöder, F., Da Silva, L. A., Smith, S., Stehfest, E., Bosetti, V., Eom, J., Gernaat, D., Masui, T., Rogelj, J., Strefler, J., Drouet, L., Krey, V., Luderer, G., Harmsen, M., Takahashi, K., Baumstark, L., Doelman, J. C., Kainuma, M., Klimont, Z., Marangoni, G., Lotze-Campen, H., Obersteiner, M., Tabeau, A., and Tavoni, M.: The Shared Socioeconomic Pathways and their energy, land use, and greenhouse gas emissions implications: An overview, Global Environ. Chang., 42, 153–168, https://doi.org/10.1016/j.gloenvcha.2016.05.009, 2017.
Roelvink, D., Reniers, A. J. H. M., Dongeren, A. Van, Thiel de Vries, J. S. M. Van, McCall, R., and Lescinski, J.: Modelling storm impacts on beaches, dunes and barrier islands, Coast. Eng., 56, 1133–1152, 2009.
Roelvink, D., McCall, R., Mehvar, S., Nederhoff, K., and Dastgheib, A.: Improving predictions of swash dynamics in XBeach: The role of groupiness and incident-band runup, Coast. Eng., 134, 103–123, https://doi.org/10.1016/j.coastaleng.2017.07.004, 2018.
Van de Sande, B., Lansen, J., and Hoyng, C.: Sensitivity of coastal flood risk assessments to digital elevation models, Water, 4, 568–579, https://doi.org/10.3390/w4030568, 2012.
Schroter, K., Kreibich, H., Vogel, K., Riggelsen, C., Scherbaum, F. and Merz, B.: How useful are complex flood damage models?, Water Resour. Res., 50, 3378–3395, https://doi.org/10.1002/2013WR014396, 2014.
Slager, K., Burzel, A., Bos, E., De Bruikn, K., Wagenaar, D. J., Winsemius, H. C., Bouwer, L. M., and Van der Doef, M.: User Manual Delft-FIAT version 1, available at: https://publicwiki.deltares.nl/display/DFIAT/Delft-FIAT+Home (last access: 22 September 2019), 2016
Smit, P., Stelling, G., Roelvink, D., Thiel de Vries, J. S. M. Van, McCall, R., Dongeren, A. Van, Zwinkels, C., and Jacobs, R.: XBeach: Non-hydrostatic model: Validation, verification and model description, Delft Univ. Technol 2010.
Storlazzi, C. D., Gingerich, S. B., Van Dongeren, A., Cheriton, O. M., Swarzenski, P. W., Quataert, E., Voss, C. I., Field, D. W., Annamalai, H., Piniak, G. A., and McCall, R.: Most atolls will be uninhabitable by the mid-21st century because of sea-level rise exacerbating wave-driven flooding, Sci. Adv., 4, 1–10, https://doi.org/10.1126/sciadv.aap9741, 2018.
Tachikawa, T., Kaku, M., Iwasaki, A., Gesch, D., Oimoen, M., Zhang, Z., Danielson, J., Krieger, T., Curtis, B., Haase, J., Abrams, M., Crippen, R., and Carabajal, C.: ASTER Global Digital Elevation Model Version 2 – Summary of Validation Results, NASA, 2011.
Tarbotton, C., Dall'Osso, F., Dominey-Howes, D., and Goff, J.: The use of empirical vulnerability functions to assess the response of buildings to tsunami impact: Comparative review and summary of best practice, Earth-Sci. Rev., 142, 120–134, https://doi.org/10.1016/j.earscirev.2015.01.002, 2015.
UN-OHRLLS: Small Island Developing States In Numbers: Climate Change Edition 2015, 41, available at: http://unohrlls.org/custom-content/uploads/2015/12/SIDS-IN-NUMBERS-CLIMATE-CHANGE-EDITION_2015.pdf (last access: 17 July 2019), 2015.
Uusitalo, L., Lehikoinen, A., Helle, I., and Myrberg, K.: An overview of methods to evaluate uncertainty of deterministic models in decision support, Environ. Model. Softw., 63, 24–31, https://doi.org/10.1016/j.envsoft.2014.09.017, 2015.
Vojinovic, Z., Ediriweera, J. C. W. and Fikri, A. K.: An approach to the model-based spatial assessment of damages caused by urban floods, 11th Int. Conf. Urban Drain., 31, 2008.
Vousdoukas, M. I., Mentaschi, L., Voukouvalas, E., Verlaan, M., Jevrejeva, S., Jackson, L. P., and Feyen, L.: Global Ex- 70 treme Sea Level projections, European Commission, Joint Research Centre (JRC) [Dataset], https://doi.org/10.2905/jrc-liscoast-10012, 2018a.
Vousdoukas, M. I., Bouziotas, D., Giardino, A., Bouwer, L. M., Mentaschi, L., Voukouvalas, E., and Feyen, L.: Understanding epistemic uncertainty in large-scale coastal flood risk assessment for present and future climates, Nat. Hazards Earth Syst. Sci., 18, 2127–2142, https://doi.org/10.5194/nhess-18-2127-2018, 2018b.
van Vuuren, D. P. and Carter, T. R.: Climate and socio-economic scenarios for climate change research and assessment: Reconciling the new with the old, Clim. Change, 122, 415–429, https://doi.org/10.1007/s10584-013-0974-2, 2014.
Wagenaar, D. J., de Bruijn, K. M., Bouwer, L. M., and de Moel, H.: Uncertainty in flood damage estimates and its potential effect on investment decisions, Nat. Hazards Earth Syst. Sci., 16, 1–14, https://doi.org/10.5194/nhess-16-1-2016, 2016.
Wahl, T., Jain, S., Bender, J., Meyer, S., and Luther, M.: Increasing risk of compound flooding from storm surge and rainfall for major US cities., Nat. Clim. Chang., 5, 1093–1097, 2015.
Wahl, T., Haigh, I. D., Nicholls, R. J., Arns, A., Dangendorf, S., Hinkel, J., and Slangen, A. B. A.: Understanding extreme sea levels for broad-scale coastal impact and adaptation analysis, Nat. Commun., 8, 1–12, https://doi.org/10.1038/ncomms16075, 2017.
Ward, P. J., Couasnon, A., Haigh, I. D., Muis, S., Veldkamp, T., Winsemius, H. C., and Wahl, T.: Dependency of high coastal wa- 95 ter level and river discharge at the global scale, EGUGA, 2723, 2017.
Weatherall, P., Marks, K. M., Jakobsson, M., Schmitt, T., Tani, S., Arndt, J. E., Rovere, M., Chayes, D., Ferrini, V. and Wigley, R.: A new digital bathymetric model of the world’s oceans, Earth Sp. Sci., 2, 331–345, https://doi.org/10.1002/2015EA000107, 2015.
Wessel, B., Huber, M., Wohlfart, C., Marschalk, U., Kosmann, D., and Roth, A.: Accuracy assessment of the global TanDEM-X Digital Elevation Model with GPS data, ISPRS J. Photogramm. Remote Sens., 139, 171–182, https://doi.org/10.1016/j.isprsjprs.2018.02.017, 2018.
Yamazaki, D., Ikeshima, D., Tawatari, R., Yamaguchi, T., O'Loughlin, F., Neal, J., Sampson, C., Kanae, S., and Bates, P. D.: A high-accuracy map of global terrain elevations, Geophys. J. Lett., 44, 5844–5853, https://doi.org/10.1002/2017GL072874, 2017.
The 10-year-period 50th percentile value and 90 % confidence interval values: 1.24 m (1.19–1.31 m).
The 10-year-period 50th percentile value and 90 % confidence interval values: 1.06 m (1.04–1.08 m).
Download link: https://tntcat.iiasa.ac.at/SspDb/dsd?Action=htmlpage&page=about (last access: 13 July 2019).
For the current time horizon, no SLR and SSP scenarios are present, reducing the number of simulations required.