the Creative Commons Attribution 4.0 License.
the Creative Commons Attribution 4.0 License.
 | 26 Aug 2020
GIS-based DRASTIC and composite DRASTIC indices for assessing groundwater vulnerability in the Baghin aquifer, Kerman, Iran
Mohammad Malakootian
The present study estimates the Kerman–Baghin aquifer vulnerability using DRASTIC and composite DRASTIC (CDRASTIC) indices with the aid of geographic information system (GIS) techniques. Factors affecting the transfer of contamination, including water table depth, soil media, aquifer media, the impact of the vadose zone, topography, hydraulic conductivity, and land use, were used to calculate the DRASTIC and CDRASTIC indices. A sensitivity test was also performed to determine the sensitivity of the parameters. Results showed that the topographic layer displays a gentle slope in the aquifer. Most of the aquifer was covered with irrigated field crops and grassland with a moderate vegetation cover. In addition, the aquifer vulnerability maps indicated very similar results, identifying the north-west parts of the aquifer as areas with high to very high vulnerability. The map removal sensibility analysis (MRSA) revealed the impact of the vadose zone (in the DRASTIC index) and hydraulic conductivity (in the CDRASTIC index) as the most important parameters in vulnerability evaluation. In both indices, the single-parameter sensibility analysis (SPSA) demonstrated net recharge as the most effective factor in vulnerability estimation. According to the results, parts of the studied aquifer have a high vulnerability and require protective measures.
- Article
(1129 KB) - Full-text XML
- BibTeX
- EndNote


Groundwater is a significant and principal freshwater resource in most parts of the world, especially non-arid and semi-arid areas. Water quality has been emphasized in groundwater management (Neshat et al., 2014; Manap et al., 2013, 2014a; Ayazi et al., 2010). The potential groundwater contamination by human activities at or near the surface of groundwater has been considered to be the major basis for managing this resource by implementing preventative policies (Tilahun and Merkel, 2010).
Groundwater vulnerability is a measure of how easy it is for pollution or contamination at the land surface to reach a production aquifer. In other words, it is a measure of the “degree of insulation” that natural and artificial factors provide to keep pollution away from the groundwater (Sarah and Patricia, 1993; Neshat et al., 2014). Vulnerability maps are commonly plotted at the sub-region and regional scales. Normally, they are not applied to site-specific evaluations, including zones smaller than a few tens of square kilometres (Baalousha, 2006; Tilahun and Merkel, 2010). Various techniques have been developed to assess groundwater susceptibility with great precision (Javadi et al., 2010, 2011). Most of these techniques are based on analytic tools to associate groundwater contamination with land operations. There are three types of evaluation methods: process-based simulations, statistic procedures, and overlay and index approaches (Neshat et al., 2014; Dixon, 2004).
Process-based approaches involve numerical modelling and are useful at the local but not at the regional level. Statistical approaches involve correlating actual water quality data to spatial variables and require a large number of site-specific data (National Research Council, 1993). Overlay and index procedures emphasize the incorporation of various zonal maps by allocating a numeral index. Both procedures are simple to implement in the geographic information system (GIS), especially on a zonal measure. Hence, these methods are the most popular procedures applied for vulnerability estimation (Neshat et al., 2014). The overlay and index methods have some significant advantages; first, they have become popular because the methodology is fairly straightforward and can be easily implemented with any GIS application software. The concept of overlaying data layers is easily comprehensible, even by less experienced users. In addition, the data requirement can be considered to be moderate since nowadays most data come in a digital format. Hydrogeological information is either available or could be estimated using relevant data. Consequently, these methods yield relatively accurate results for extensive areas with a complex geological structure. Last, the product of this approach could be easily interpreted by water resource managers and incorporated into decision-making processes. Even a simple visual inspection of the vulnerability map can reveal important contamination hotspots. Probably the most important and obvious disadvantage of these methods raised by scientists and experts is the inherent subjectivity in the determination of the rating scales and the weighting coefficients (National Research Council, 1993).
The most extensively used methods for groundwater vulnerability evaluation are GODS (Ghazavi and Ebrahimi, 2015), IRISH (Daly and Drew, 1999), AVI (Raju et al., 2014), and DRASTIC (Neshat et al., 2014; Baghapour et al., 2014, 2016).
The DRASTIC index, proposed by Aller et al. (1985), is regarded as one of the best indices for groundwater vulnerability estimation. This method ignores the influence of zonal properties. Thus, identical weights and rating values are utilized. In addition, this technique fails to apply a standard validation test for the aquifer. Therefore, several investigators developed this index using various techniques (Neshat et al., 2014). A higher DRASTIC index represents a greater contamination potential and vice versa. After calculating the DRASTIC index, it should be possible to identify the zones that are more prone to pollution. This index only provides a relative estimation and is not created to make a complete assessment (Baalousha, 2006).
Many studies have been conducted using the DRASTIC index to estimate groundwater vulnerability in different regions of the world (Jaseela et al., 2016; Zghibi et al., 2016; Kardan Moghaddam et al., 2017; Kumar et al., 2016; Neshat and Pradhan, 2017; Souleymane and Tang, 2017; Ghosh and Kanchan, 2016; Saida et al., 2017); however, there are still a number of studies that have employed the CDRASTIC index for groundwater vulnerability evaluation (Baghapour et al., 2014, 2016; Secunda et al., 1998; Jayasekera et al., 2008, 2011; Shirazi et al., 2012). Boughriba et al. (2010) utilized the DRASTIC index in a GIS environment to estimate aquifer vulnerability. They provided the DRASTIC-modified map prepared from total DRASTIC indices and small monitoring network maps, including high and medium classes. Then, they integrated the map with a land use map to prepare a contamination potential map. They reported the newly obtained groundwater vulnerability map, including three classes, namely very high, high, and medium. Babiker et al. (2005) used the DRASTIC index to determine the points prone to contamination from human activities in the aquifer. They reported that the western and eastern parts of the aquifer fall in the high and medium classes, respectively, in terms of vulnerability. The final aquifer vulnerability map represented that a high risk of pollution is found in the eastern part of the aquifer due to agricultural activities. They also observed that net recharge inflicts the largest impact on aquifer vulnerability, followed by soil media, topography, the impact of the vadose zone, and hydraulic conductivity.
The average annual precipitation in Iran is 257 mm (less than one-third of the average annual precipitation at the global level). Water scarcity is a critical problem in Iran (Chitsazan and Akhtari, 2006; Modabberi et al., 2017), and groundwater reduction has exacerbated the problem. Groundwater is the only freshwater resource in Kerman Province, Iran, due to the lack of surface water. The Baghin aquifer is located in the central part of Kerman Province. Due to recent droughts, this aquifer has been under heavy pumping stress to irrigate crops, which caused a gradual drop in water level. Consequently, this could increase the contamination potential by changing the physical and chemical properties of water in the aquifer. Therefore, the aim of this research was to provide a vulnerability map for the Kerman–Baghin aquifer and perform a sensitivity analysis to identify the most influential factors in vulnerability assessment.
2.1 Study area
The Kerman province covers both arid and semi-arid lands. The present study included a 2023 km2 area (29∘47′ to 30∘31′ N latitude and 56∘18′ to 57∘37′ E longitude) located in the central part of Kerman Province (Fig. 1). The study area is mostly covered with agricultural lands (Neshat et al., 2014). The mean annual rainfall is 108.3 mm (during 2017) in the study area; the highest and lowest topographic elevation is 1980 and 1633 m above sea level, respectively; and the mean, minimum, and maximum annual temperatures equal 17, −12, and 41 ∘C, respectively (during 2017).
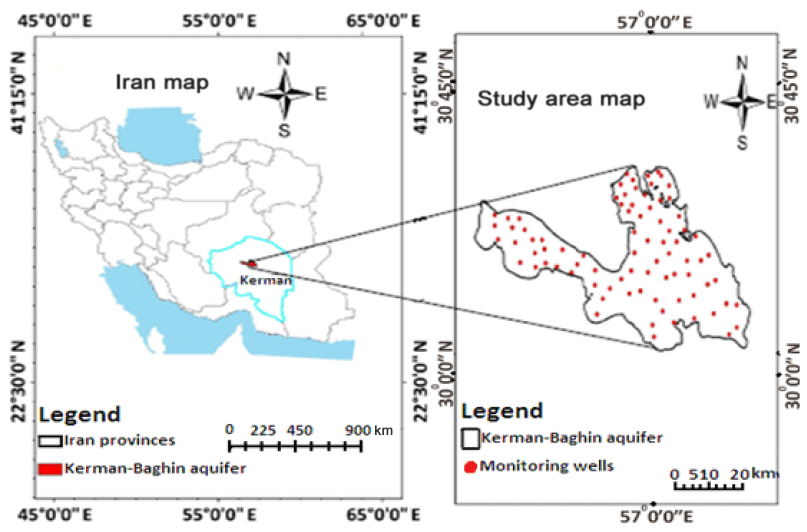
Figure 1Location map of the Kerman–Baghin aquifer.
2.2 Computation of DRASTIC and CDRASTIC indices
DRASTIC is a procedure developed by the United States Environmental Protection Agency (US EPA) to evaluate groundwater pollution (Aller et al., 1985). The DRASTIC index is obtained using the following equation (Kardan Moghaddam et al., 2017; Neshat and Pradhan, 2017) :
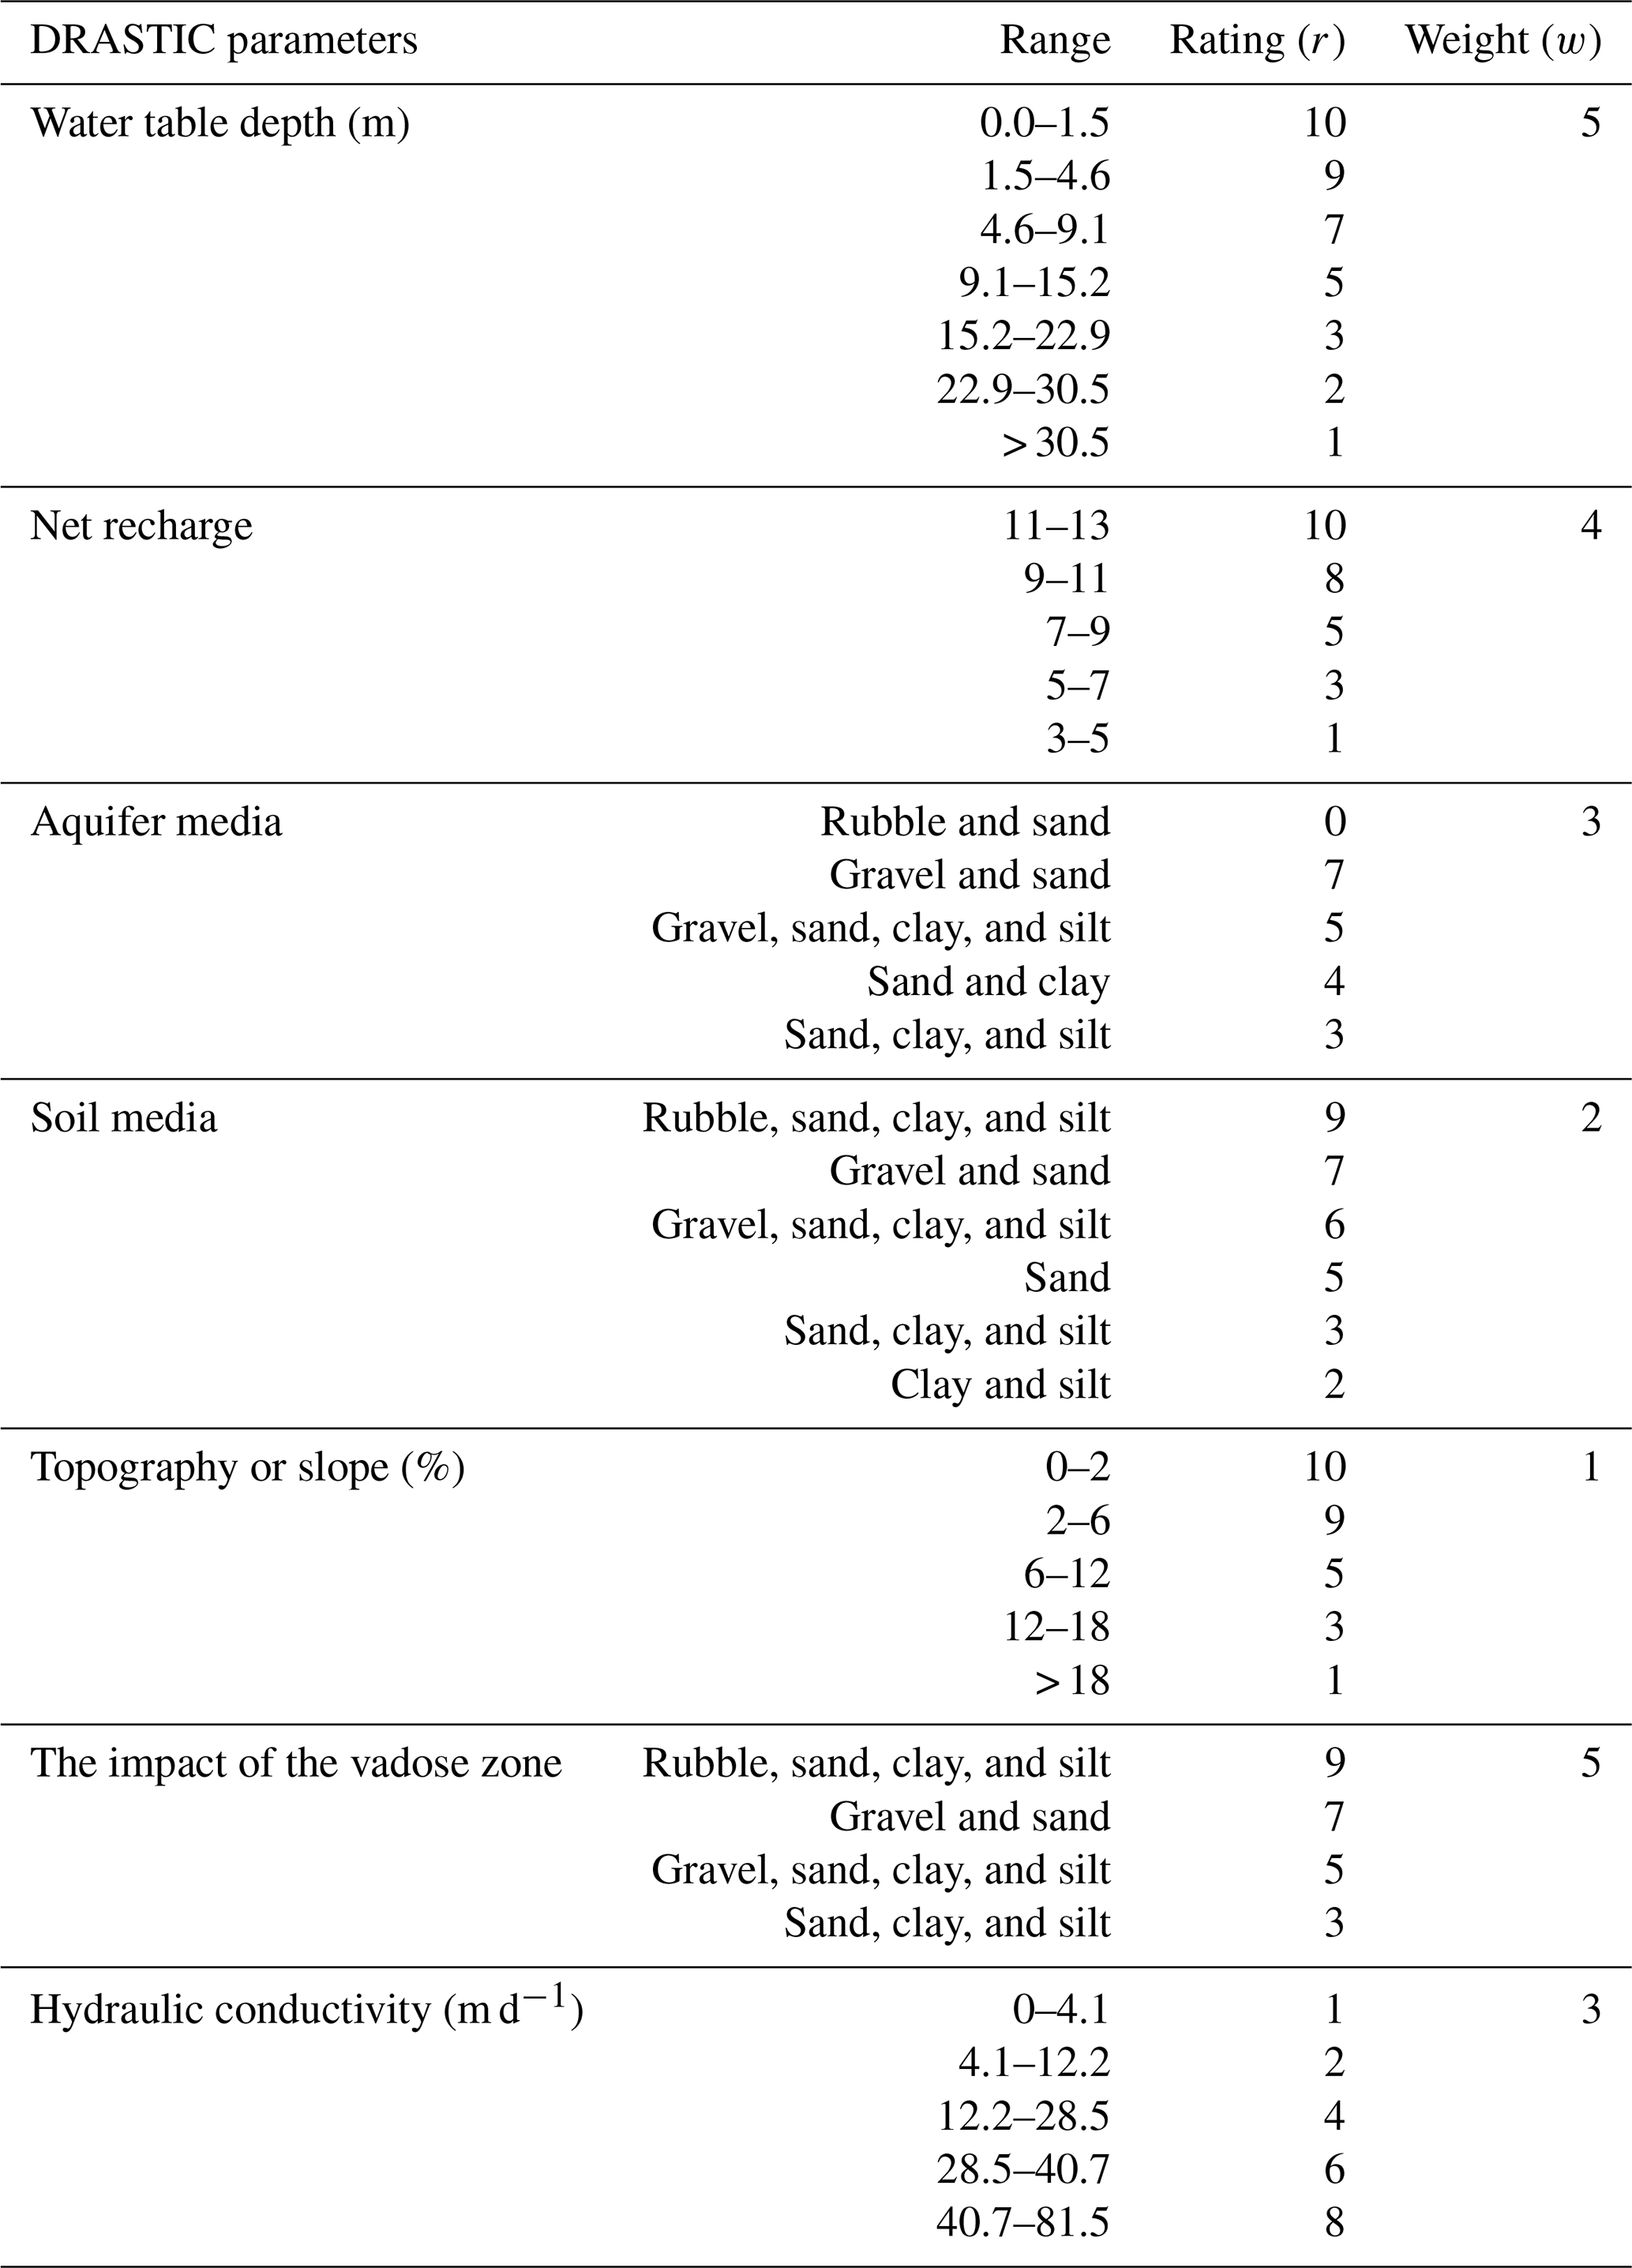
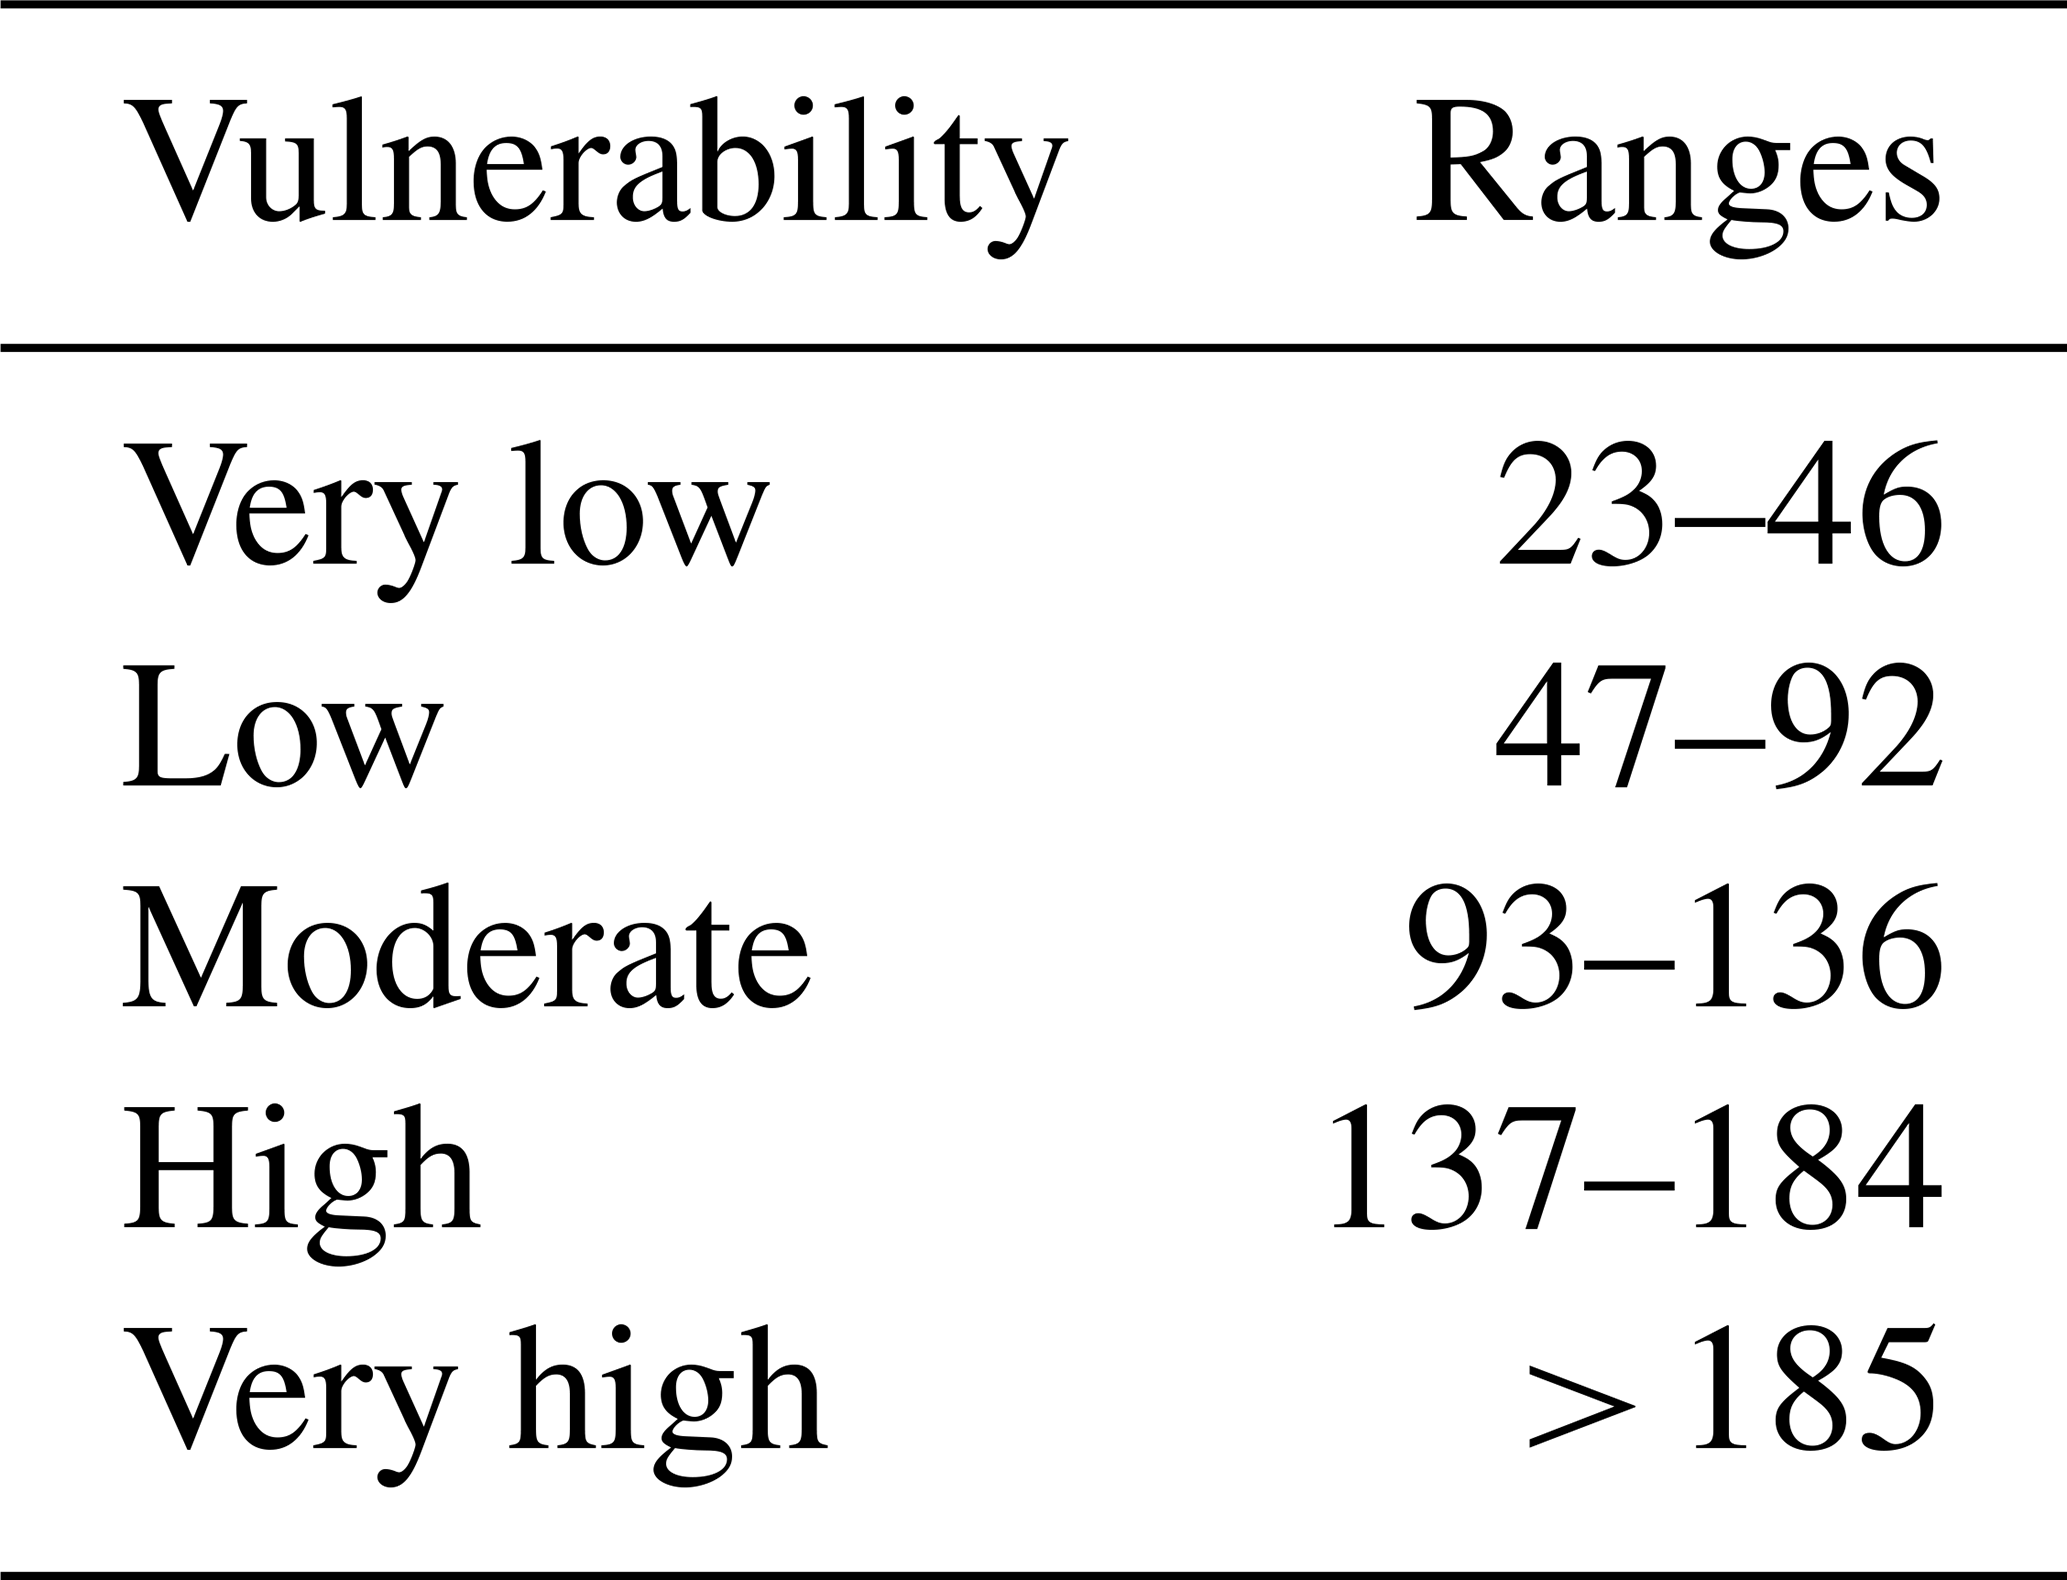
where DRASTIC comprises the effective factors in the DRASTIC index; , and C stand for water table depth, net recharge, aquifer media, soil media, topography, the impact of the vadose zone, and hydraulic conductivity, respectively, and “r” and “w” denote the rating and weight of each factor, respectively. The ratings and weights of the factors are presented in Table 1. A high DRASTIC index corresponds to the high vulnerability of the aquifer to pollution. In the DRASTIC index, each parameter is rated on a scale from 1 to 10 that shows the relative contamination potential of that parameter for that area. In addition, in the DRASTIC index, one weight (1 to 5) is assigned to each parameter. Weight values indicate the relative significance of the parameters with respect to one another. Ranges of vulnerability corresponding to the DRASTIC index are presented in Table 2.
Table 1Ratings and weights related to DRASTIC index factors (Aller et al., 1985).
In the CDRASTIC index, the DRASTIC index is modified by adding a new parameter called land use. The role of land use in aquifer vulnerability potential is determined. Thus, the CDRASTIC index was obtained as follows:
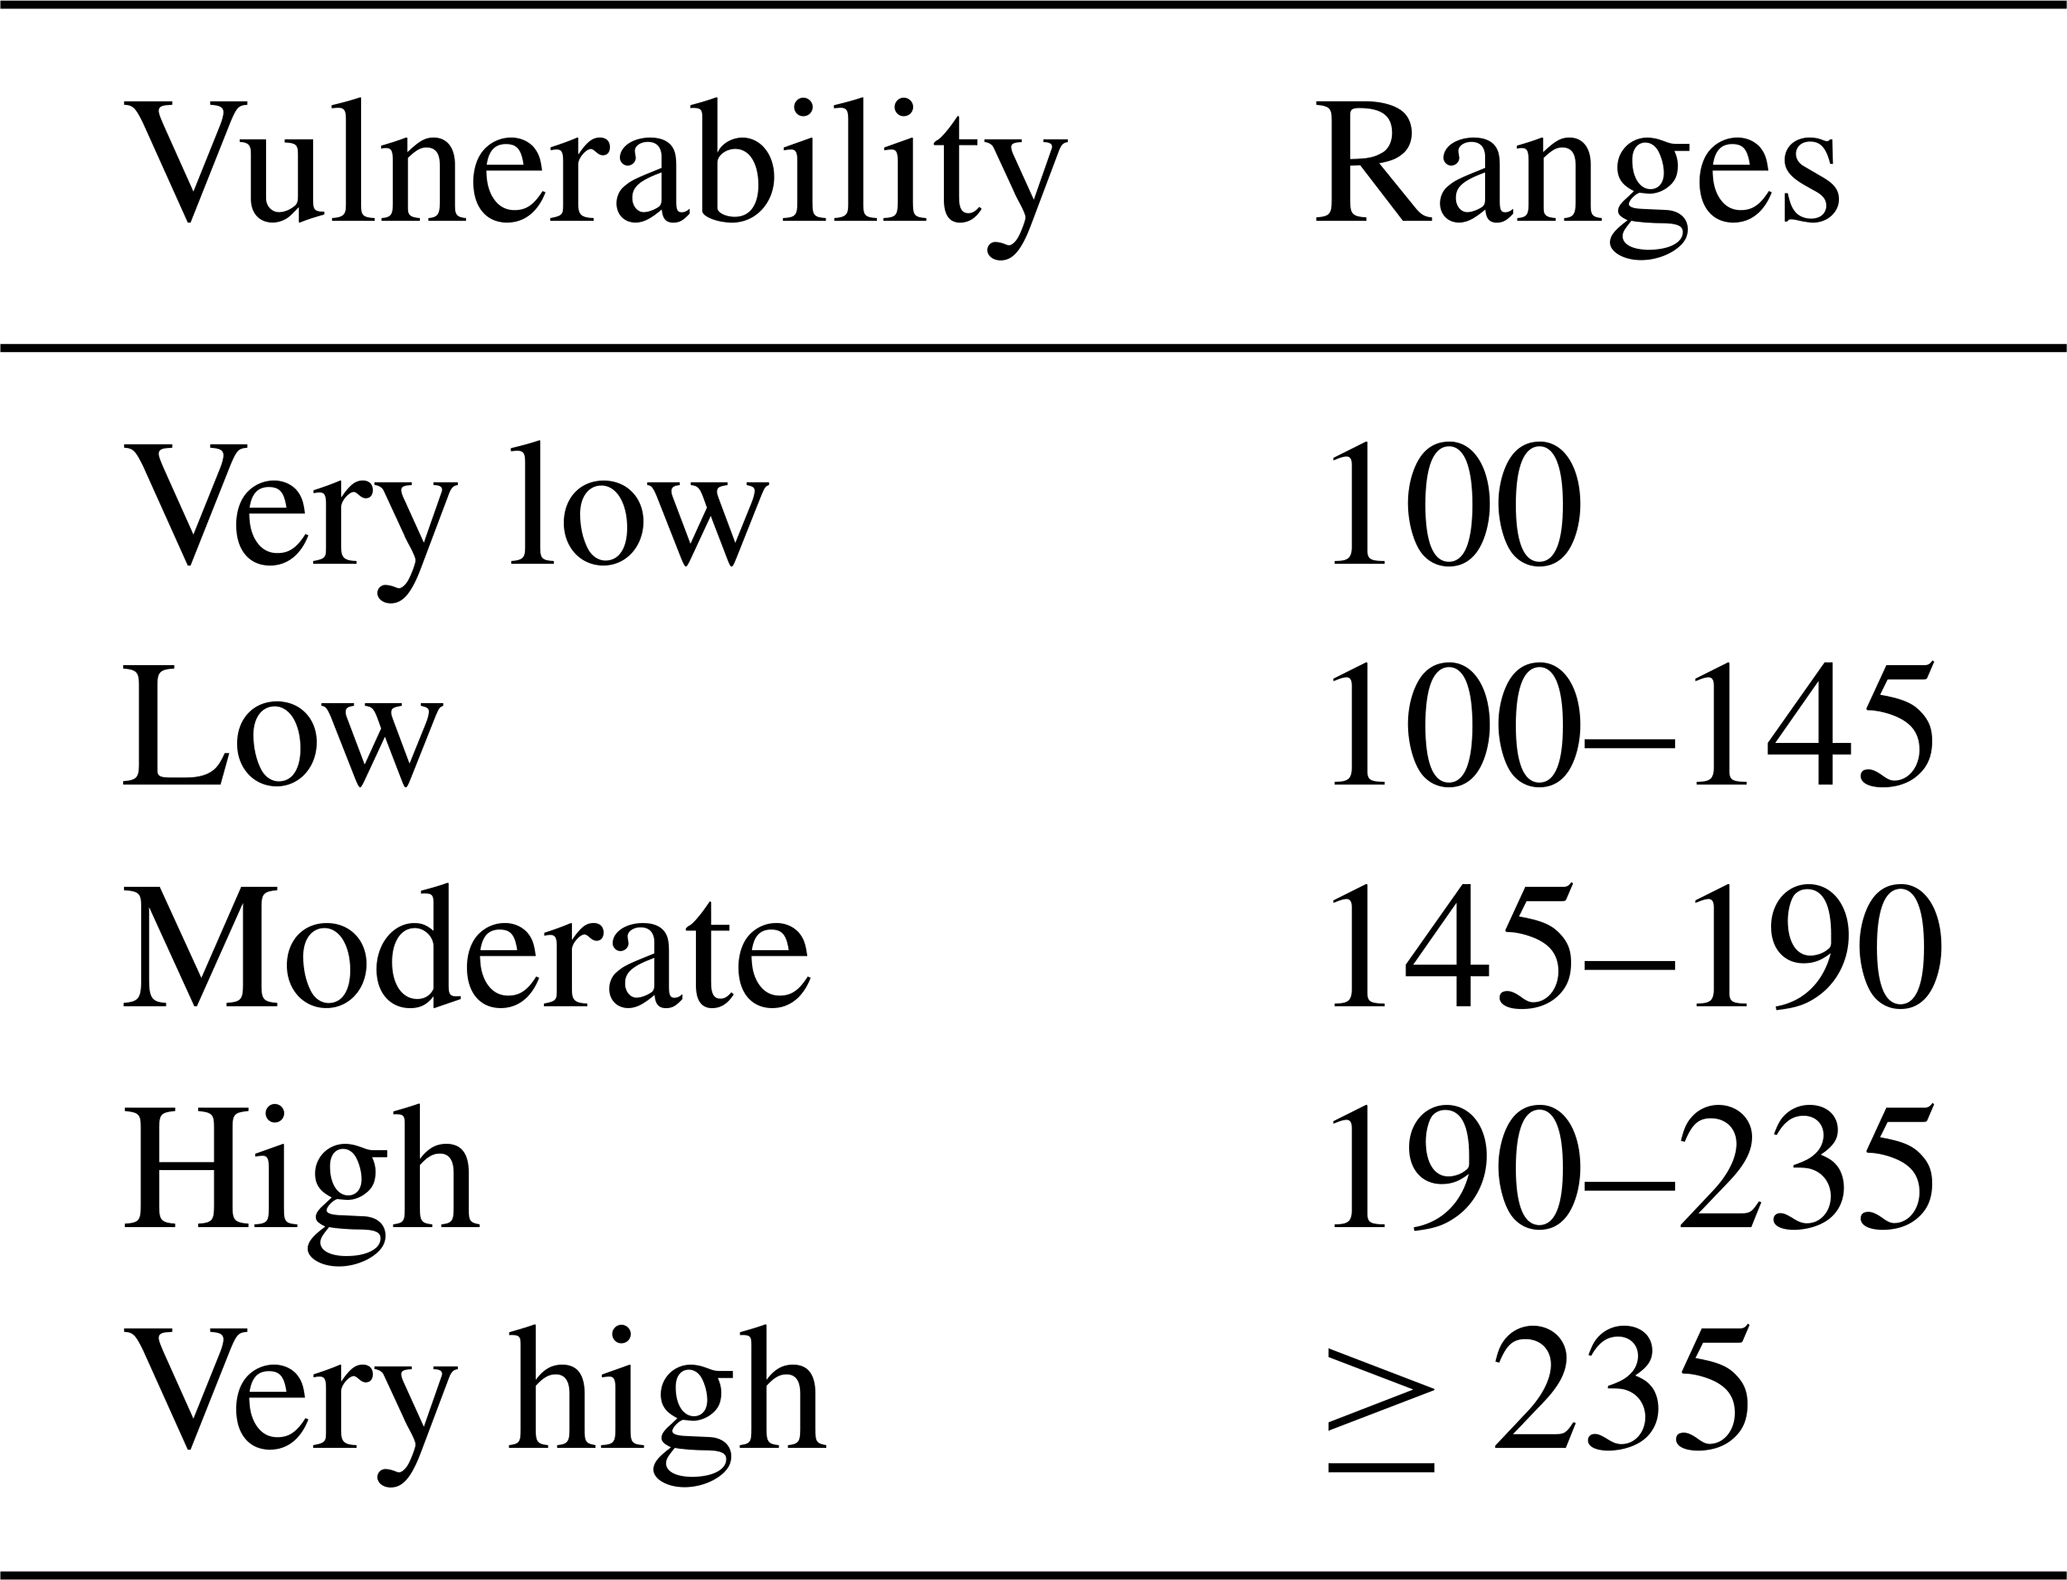
where Lw and Lr are the relative weight and rating related to land use, respectively. Ratings and weightings applied to the pollution potential are presented in Table 3 and are related to land use based on the CDRASTIC index. The final outputs of the CDRASTIC index range from 28 to 280. Vulnerability ranges based on the CDRASTIC index are presented in Table 4.
Table 3Ratings and weighting applied to the pollution potential related to land use based on the CDRASTIC index (Aller et al., 1985).

2.3 Factors affecting the transfer of contamination
Water table depth is the distance of the water table from the ground surface in a well (Baghapour et al., 2016). Eighty-three wells were utilized in the Kerman–Baghin aquifer to obtain this factor. The interpolation procedure was adopted to provide a raster map of the water table depth, which was categorized based on Table 2.
Net recharge is the amount of runoff that has penetrated into the ground and has reached the groundwater surface (Singh et al., 2015; Ghosh and Kanchan, 2016). This research used the Piscopo method (Chitsazan and Akhtari, 2009) to provide a net recharge layer for the Kerman–Baghin aquifer according to the following equation and Table 5:
In the above equation, the percentage of the slope was calculated from a topographical map using a digital elevation model. In addition, a soil permeability map was created using the Kerman–Baghin aquifer soil map (scale of 1:250 000) and the drilling logs of 83 wells. Finally, a map of the rainfall rate in the area was plotted based on annual average precipitation. The ratings and weights of net recharge are presented in Table 5.
Table 5Weight, rating, and range of net recharge (Aller et al., 1985).

Aquifer media control the movement of groundwater streams in the aquifer (Aller et al., 1985; Singh et al., 2015). To obtain this layer, the drilling log data of 83 wells were used. Data were collected from the Kerman Regional Water Office (KRWO). The range of the aquifer media layer is shown in Table 2.
Soil media has a considerable impact on the amount of water surface that can penetrate the aquifer. Therefore, where the soil layer is thick, the debilitation processes such as absorption, filtration, degradation, and evaporation may be considerable (Singh et al., 2015). A soil media raster map was provided using the Kerman–Baghin aquifer soil map and the wells' drilling logs. The range of the soil media layer is presented in Table 2.
Topography controls the residence time of water inside the soil and the degree of penetration (Singh et al., 2015). To obtain this layer, the percentage of the slope was obtained from the topographical map using a digital elevation model. Data were collected from the KRWO. The range of the topographic layer is presented in Table 2.
A vadose zone is an unsaturated area located between the topographic surface and the groundwater level (Singh et al., 2015). It plays a significant role in decreasing groundwater contamination by pollutant debilitation processes such as purification, chemical reaction, and dispersal (Shirazi et al., 2012). This study used the lithologic data of 83 observation and exploration wells to design the impact of the vadose zone raster map of the aquifer. The data were collected from the KRWO. The range of the impact of the vadose zone layer is depicted in Table 2.
Hydraulic conductivity refers to the capability of the aquifer to transfer water. Areas with a high hydraulic conductivity demonstrate a high potential for groundwater contamination (Singh et al., 2015; Aller et al., 1985). To prepare this layer, data derived from pumping tests of wells were used. The range of the hydraulic conductivity layer is given in Table 2.
Land use affects groundwater resources through changes in recharge and by changing demands for water. Land use is obligatory since it is required by the CDRASTIC index. Indian remote-sensing satellite information was utilized to create the land use raster map. The weight and rating related to the land use layer are presented in Table 3.
2.4 Sensitivity analyses
One of the main advantages of the DRASTIC index is the evaluation performance because a high number of input data are used, and this helps restrict the effects of errors on final results. Nevertheless, some authors, namely Babiker et al. (2005), Barber et al. (1993), and Merchant (1994), reported that similar results could be obtained using fewer data and at lower costs. The unavoidable subjectivity related to the selection of seven factors, ranks, and weights used to calculate the vulnerability index has also been criticized. Therefore, in order to eliminate the aforementioned criticisms, two sensitivity analyses were performed as follows (Napolitano and Fabbri, 1996).
2.4.1 Map removal sensibility analysis (MRSA)
The MRSA value indicates the vulnerability map's sensibility to the removal of one or more maps from the suitability analysis. MRSA is calculated as follows (Babiker et al., 2005; Martínez-Bastida et al., 2010; Saidi et al., 2011; Modabberi et al., 2017) :
where S stands for the sensibility value expressed in terms of the variation index; V is the intrinsic vulnerability index (real vulnerability index); V′ is the intrinsic vulnerability index after removing X (one layer); and N and n are the number of data pieces used to calculate V and V′, respectively (Babiker et al., 2005; Martínez-Bastida et al., 2010; Saidi et al., 2011; Modabberi et al., 2017).
2.4.2 Single-parameter sensibility analysis (SPSA)
SPSA was first introduced by Napolitano and Fabbri (1996). This test shows the effect of each DRASTIC factor on the final vulnerability index. Using this test derived from Eq. (5), the real and effective weight of each factor, compared to the theoretical weight assigned by the analytical model, was calculated by Babiker et al. (2005), Martínez-Bastida et al. (2010), Saidi et al. (2011), and Modabberi et al. (2017):
where W represents the effective weight of each factor; Pr and Pw are the rank and weight assigned to P, respectively; and V denotes the intrinsic vulnerability index (Martínez-Bastida et al., 2010; Babiker et al., 2005; Saidi et al., 2011; Modabberi et al., 2017).
3.1 DRASTIC and CDRASTIC parameters
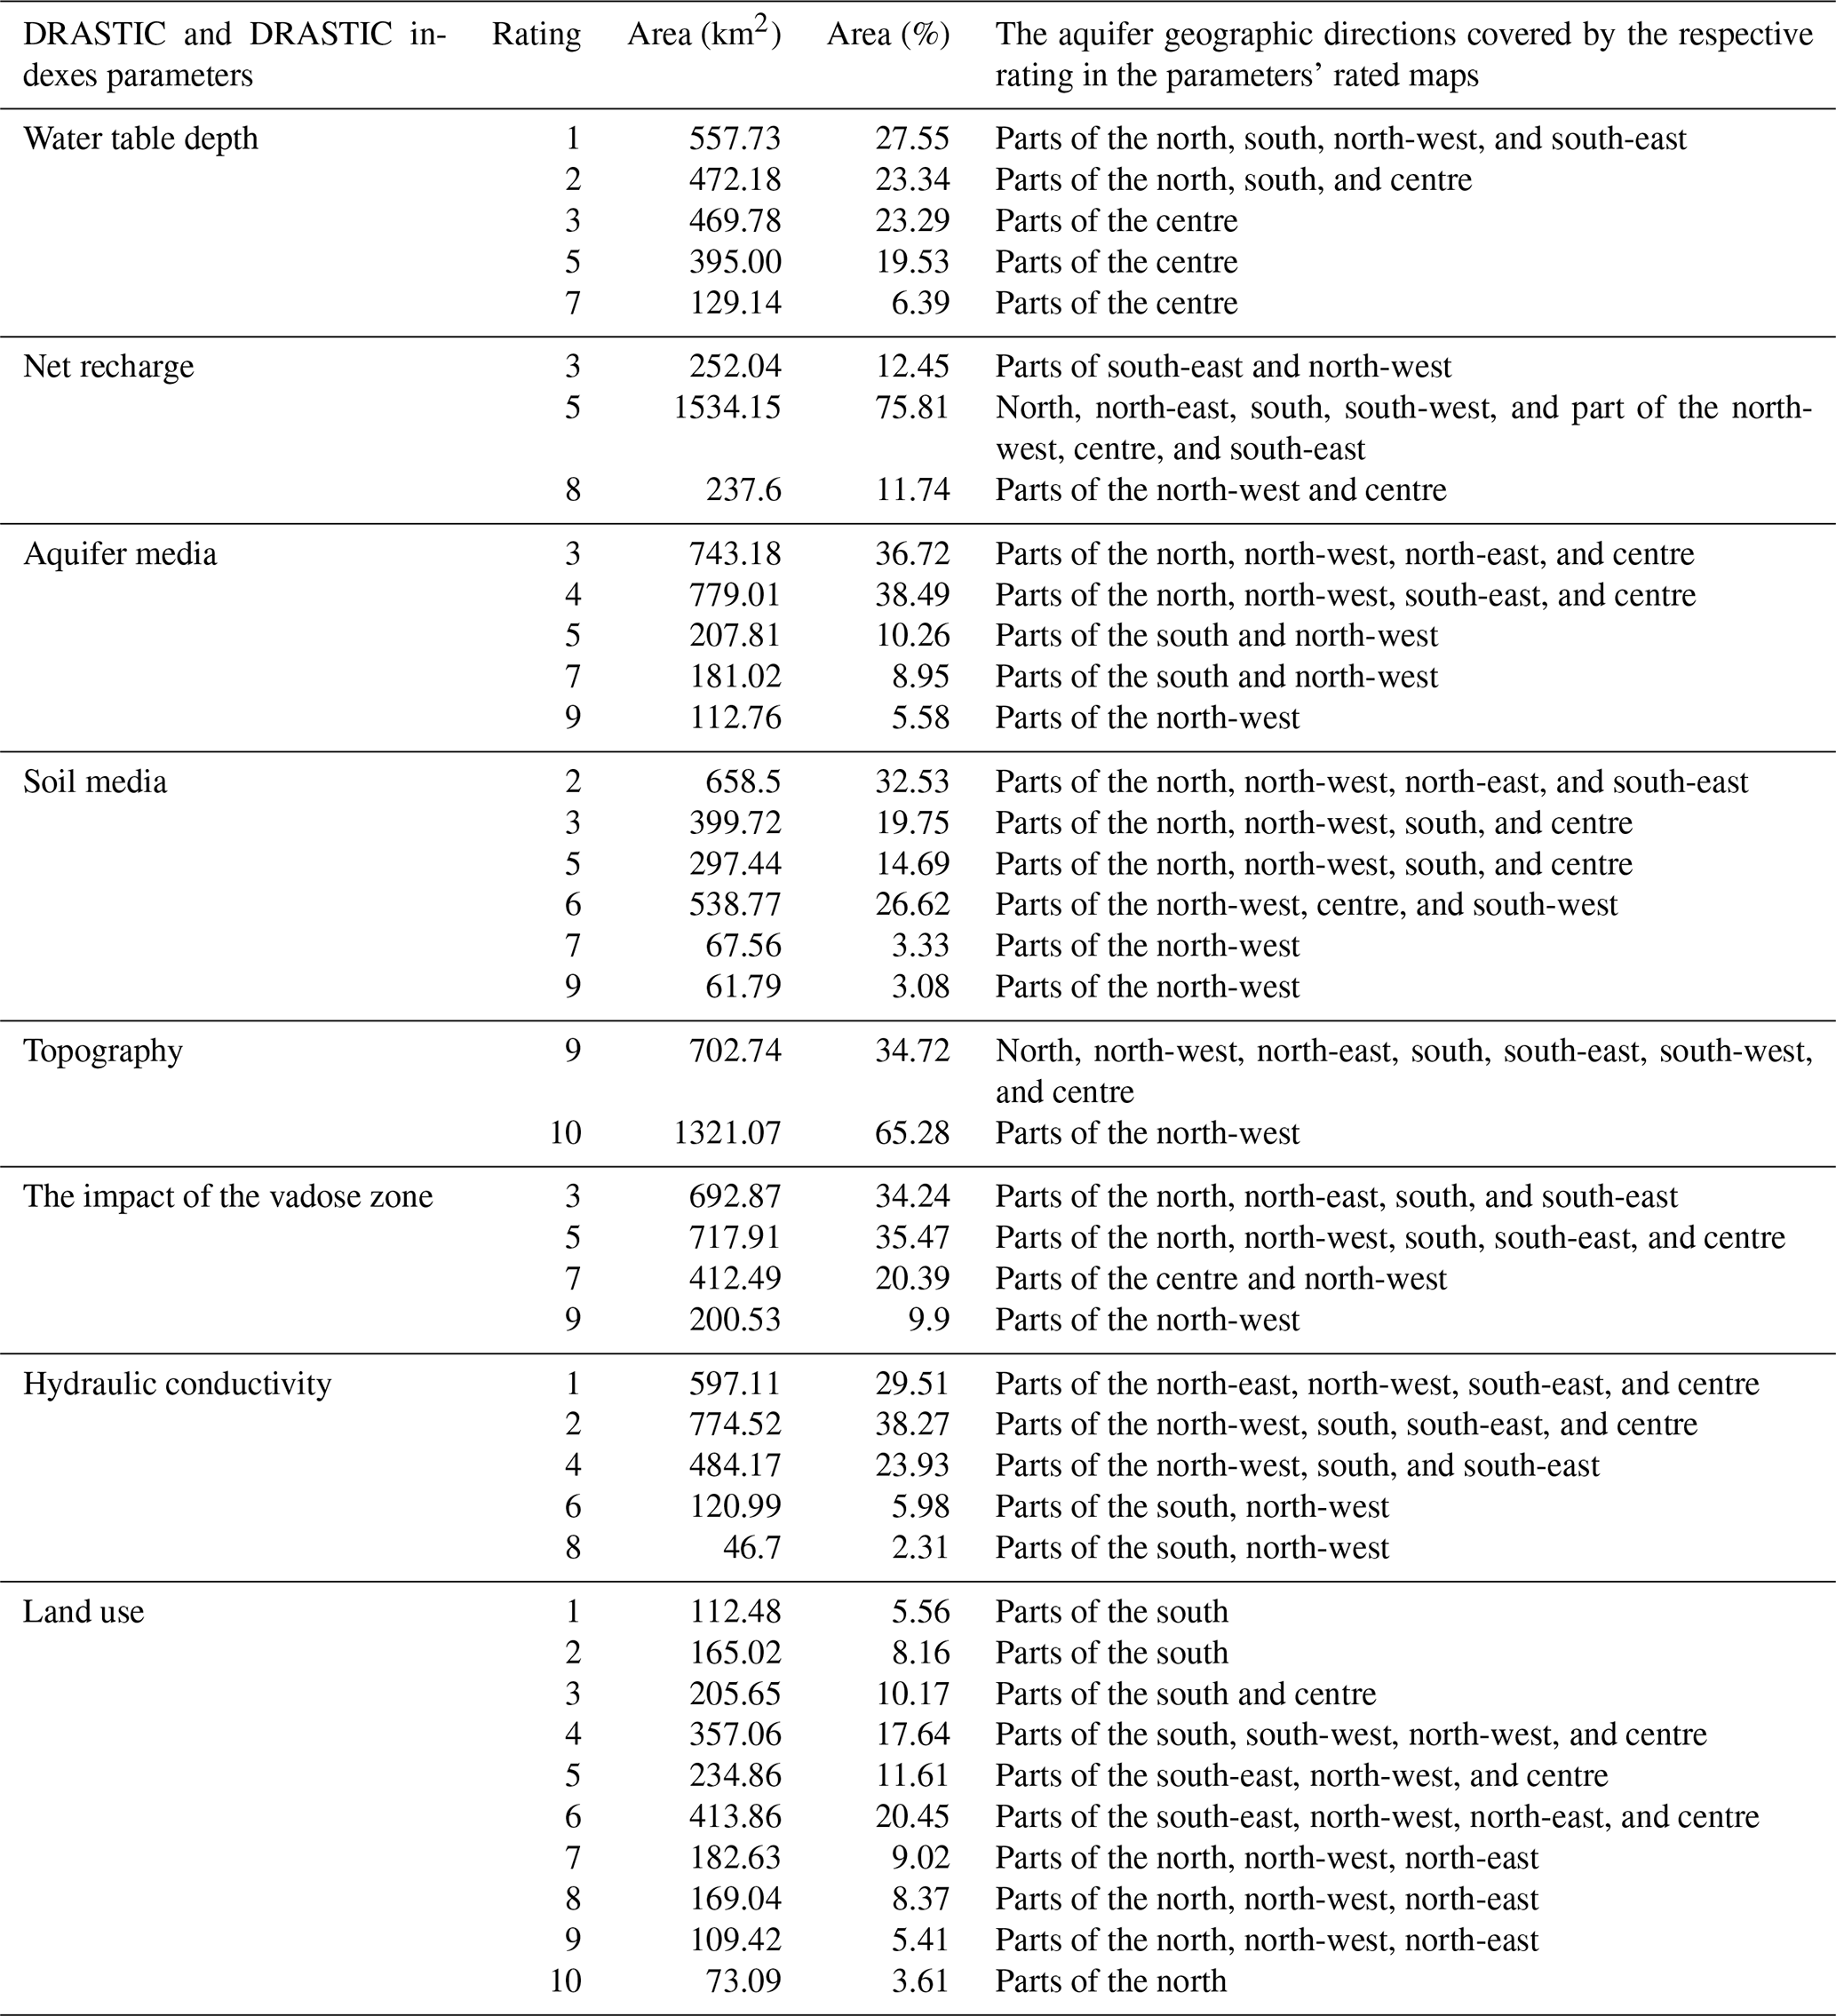
Based on the data shown in Table 2, the assigned rating of water table depth varies from 1 to 10. In addition, based on the results presented in Table 6, water table depth in the aquifer varies from 4.6 to > 30.5 m (rating 1 to 7). About 27.55% of the aquifer has a depth of > 30.5 m, and 66.16 % of the aquifer has a depth ranging from 9.1 to 30.5 m. Less than 7 % of the aquifer has a depth between 4.6 and 9.1 m. The Kerman–Baghin aquifer rated map of water table depth is depicted in Fig. 2a. According to Fig. 2a and Table 6, the minimum impact of water table depth on aquifer vulnerability occurs in the central parts (6.39 %), whereas the maximum impact occurs in the northern, southern, north-western, and south-eastern parts (27.55 %).
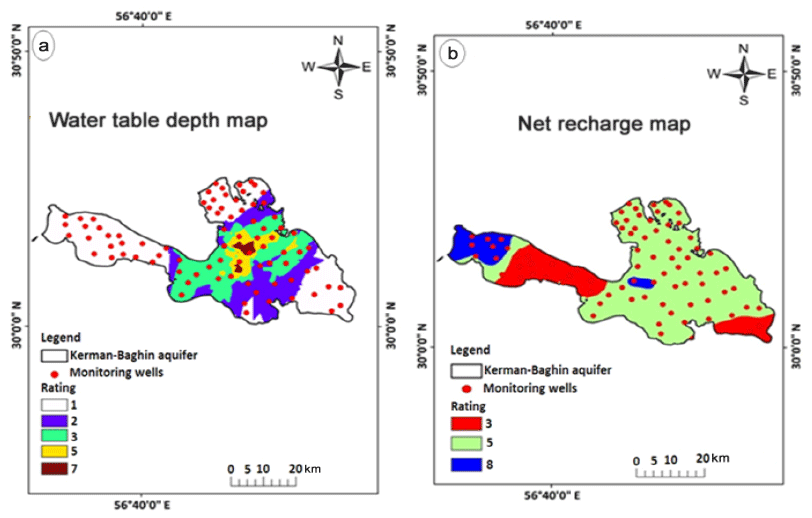
Figure 2The Kerman–Baghin aquifer rated maps of (a) water table depth and (b) net recharge.
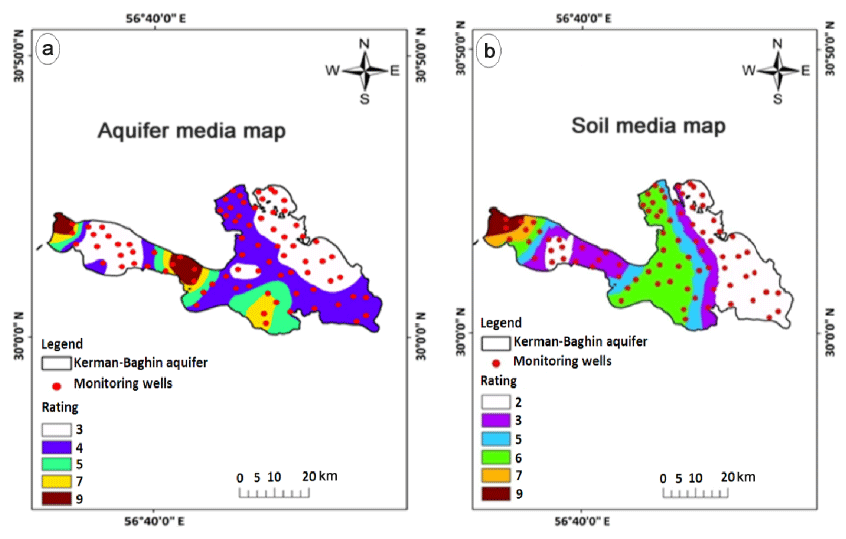
Figure 3The Kerman–Baghin aquifer rated maps of (a) aquifer media and (b) soil media.
According to the results presented in Table 6, 75.81 % of the aquifer has a net recharge value of 7 to 9 cm yr−1. A net recharge value between 9 and 11 cm yr−1 was found for 11.74 % of the aquifer. The Kerman–Baghin aquifer rated map of net recharge is illustrated in Fig. 2b. According to the Piscopo method, the Kerman–Baghin aquifer was divided into three classes with regard to net recharge. The highest net recharge value was observed in the northern, north-eastern, southern, and south-western parts of the north-west as well as parts of the centre and parts of the south-east (75.81 %), whereas the lowest net recharge value appeared in parts of the north-west and centre (11.74 %), as shown in Fig. 2b and Table 6.
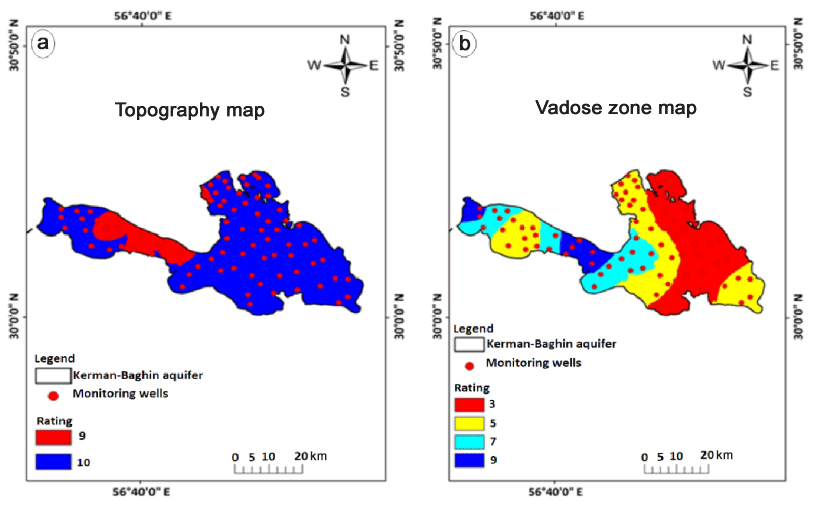
Figure 4The Kerman–Baghin aquifer rated maps of (a) topography and(b) the vadose zone.
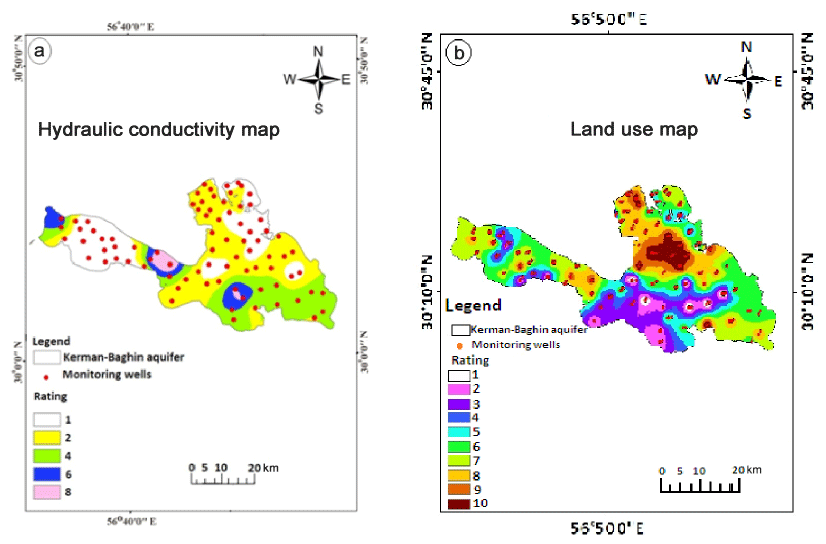
Figure 5The Kerman–Baghin aquifer rated maps of (a) hydraulic conductivity and (b) land use.
As observed in Table 6, the majority of the Kerman–Baghin aquifer media are composed of sand, clay, and silt (75.21 %). The Kerman–Baghin aquifer rated map of the aquifer media is presented in Fig. 3a. Parts of the aquifer in the north, north-west, north-east, centre, and south-east are composed of sand, clay, and silt. Parts of the aquifer in the north-west are composed of rubble and sand (5.58 %). Parts of the aquifer in the south and north-west are composed of gravel and sand (8.95 %) as well as gravel, sand, clay, and silt (10.26 %).
The Kerman–Baghin aquifer rated map of soil media is presented in Fig. 3b. The soil map depicts six soil classes. The highest rank (rank =9) was assigned to rubble, sand, clay, and silt (a combination of rubble, sand, clay, and silt soils). In addition, the lowest rank (rank =2) was assigned to clay and silt (a combination of clay and silt soils). Most of the aquifer soil media are covered with silt, sand, and clay (about 80 %).
The Kerman–Baghin aquifer rated map of topography is shown in Fig. 4a. The topographical layer demonstrates a gentle slope (0 % to 6 %) over most of the aquifer, hence gaining the ranks of 9 and 10. A slope range of 0 % to 2 % includes 34.72 % of the study area, and its rating (slope range =0 %–2%) is 10. In addition, 65.28 % of the aquifer has a slope range of 2 % to 6 % (parts of the north-west), as shown in Fig. 4a and Table 6. As the gradient increases, the runoff increases as well (Israil et al., 2006), leading to less penetration (Jaiswal et al., 2003). According to Madrucci et al. (2008), the gradients higher than 35∘ are considered to be restrictions on groundwater desirability because of the lack of springs.
The Kerman–Baghin aquifer rated map of the impact of the vadose zone is indicated in Fig. 4b. According to the results, the soil with a rank of 5 (gravel, sand, clay, and silt) is more effective in terms of aquifer vulnerability (35.47 %). Other types of soils – such as sand, clay, and silt (parts of the north, north-east, south, and south-east); gravel and sand (parts of the centre and north-west); and rubble, sand, clay, and silt (parts of the north-west) – cover 34.24 %, 20.39 %, and 9.9 % of the aquifer, respectively, as shown in Fig. 4b and Table 6. Sandy soil is effective in terms of groundwater occurrence because of the high rate of penetration (Srivastava and Bhattacharya, 2006). However, clay soil is arranged poorly because of low infiltration (Manap et al., 2014b).
The Kerman–Baghin aquifer rated map of hydraulic conductivity is illustrated in Fig. 5a. Hydraulic conductivity shows a high degree of variability. The findings showed that the hydraulic conductivity of the Kerman–Baghin aquifer varies from 0 to 81.5 m d−1. The potential for groundwater contamination was greater in zones with high hydraulic conductivity (38.27%). As shown in Fig. 5a and Table 6, 29.51 %, 23.93 %, 5.98 %, and 2.31 % of the study areas have hydraulic conductivity in the ranges of 0 to 4.1, 12.2 to 28.5, 28.5 to 40.7, and 40.7 to 81.5 m d−1, respectively.
The Kerman–Baghin aquifer rated map of land use is presented in Fig. 5b. The results indicated that the majority of the Kerman–Baghin aquifer is covered with irrigated field crops and grassland with a moderate vegetation cover (20.45 %). Less than 4 % of the study area is composed of irrigated field crops and urban areas (3.61 %), and 58.47 % of the study area consists of irrigated field crops with urban areas, grassland with poor and moderate vegetation cover, fallow land, woodland, and rocky ground. In addition, 10.17 % of the study area is fallow land with poor grassland and moderate vegetation, and 13.72 % of the study area is sand dunes with poor grassland and moderate vegetation cover and woodland, as displayed in Fig. 5b and Tables 3 and 6.
Table 6Area of rating (square kilometres and per cent) of DRASTIC and CDRASTIC parameters.
3.2 DRASTIC and CDRASTIC vulnerability indices
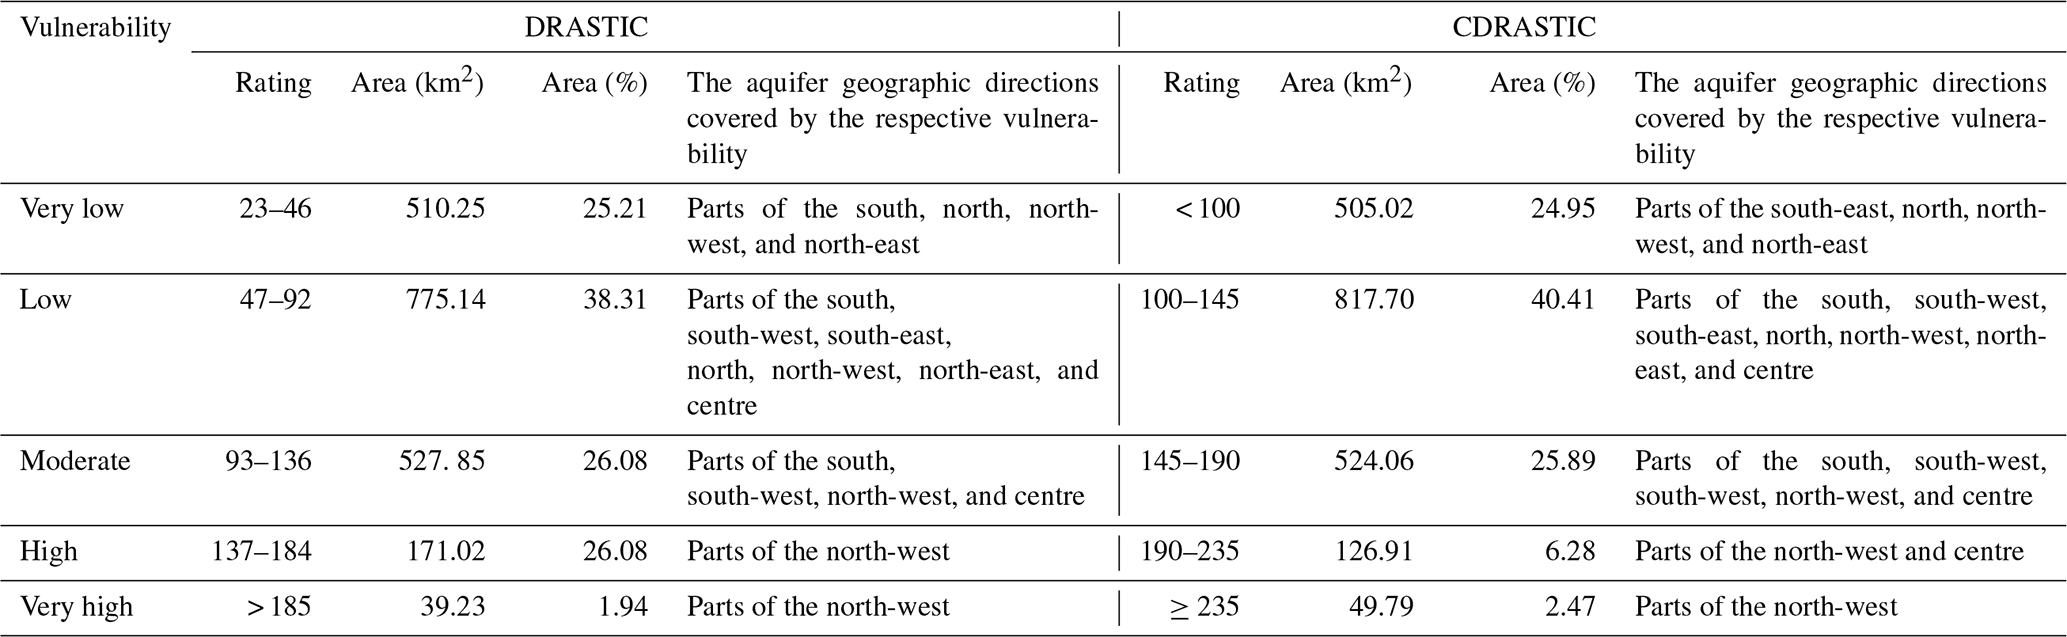
The Kerman–Baghin aquifer vulnerability map obtained using DRASTIC and CDRASTIC indices is given in Fig. 6. In the studied aquifer, vulnerability falls under very-high-, high-, moderate-, low-, and very-low-vulnerability areas. It is found that in both indices, the northern, north-eastern, north-western, southern, south-western, south-eastern, and central parts are classified as having low and very low vulnerability. This could be attributed to the low water depth, hydraulic conductivity, and net recharge characterizing these aquifer areas; another reason might be that the aquifer media are mostly clay, sand, and silt soils. The vulnerability area, identified by the investigated indices, is illustrated in Table 7. Zones with a low and very low vulnerability cover 25.21 % and 38.31 % of the Kerman–Baghin aquifer, respectively, using the DRASTIC index. Very-low- and low-vulnerability zones cover 24.95 % and 40.41 %, respectively, using the CDRASTIC index. This is primarily due to water table depth and the relatively low permeability of the vadose zone in those aquifers (Colins et al., 2016). About 26 % of the studied aquifer had moderate groundwater pollution potential using DRASTIC and CDRASTIC indices. This does not mean that these areas are without pollution; rather, they are relatively prone to pollution when compared to other areas (Colins et al., 2016). From the DRASTIC index values, it was found that 10.4 % of the studied aquifer had high (8.46 %) and very high (1.94 %) vulnerability. The results revealed that 8.75 % of the aquifer fell in the range of 190 to 235 and greater than 235 in the CDRASTIC index (Table 7). According to these two indices, the vulnerability maps indicated very similar findings, suggesting that the north-western part of the aquifer has zones with high and very high vulnerability. The high vulnerability can be attributed to great water depth, hydraulic conductivity, and net recharge in these aquifer areas. In addition, this can be due to the great slope in this area.

Figure 6Vulnerability maps of the Kerman–Baghin aquifer by DRASTIC and CDRASTIC indices.
Table 7Area of vulnerability (square kilometres and per cent) identified by DRASTIC and CDRASTIC indices.
3.3 Sensitivity of the DRASTIC index
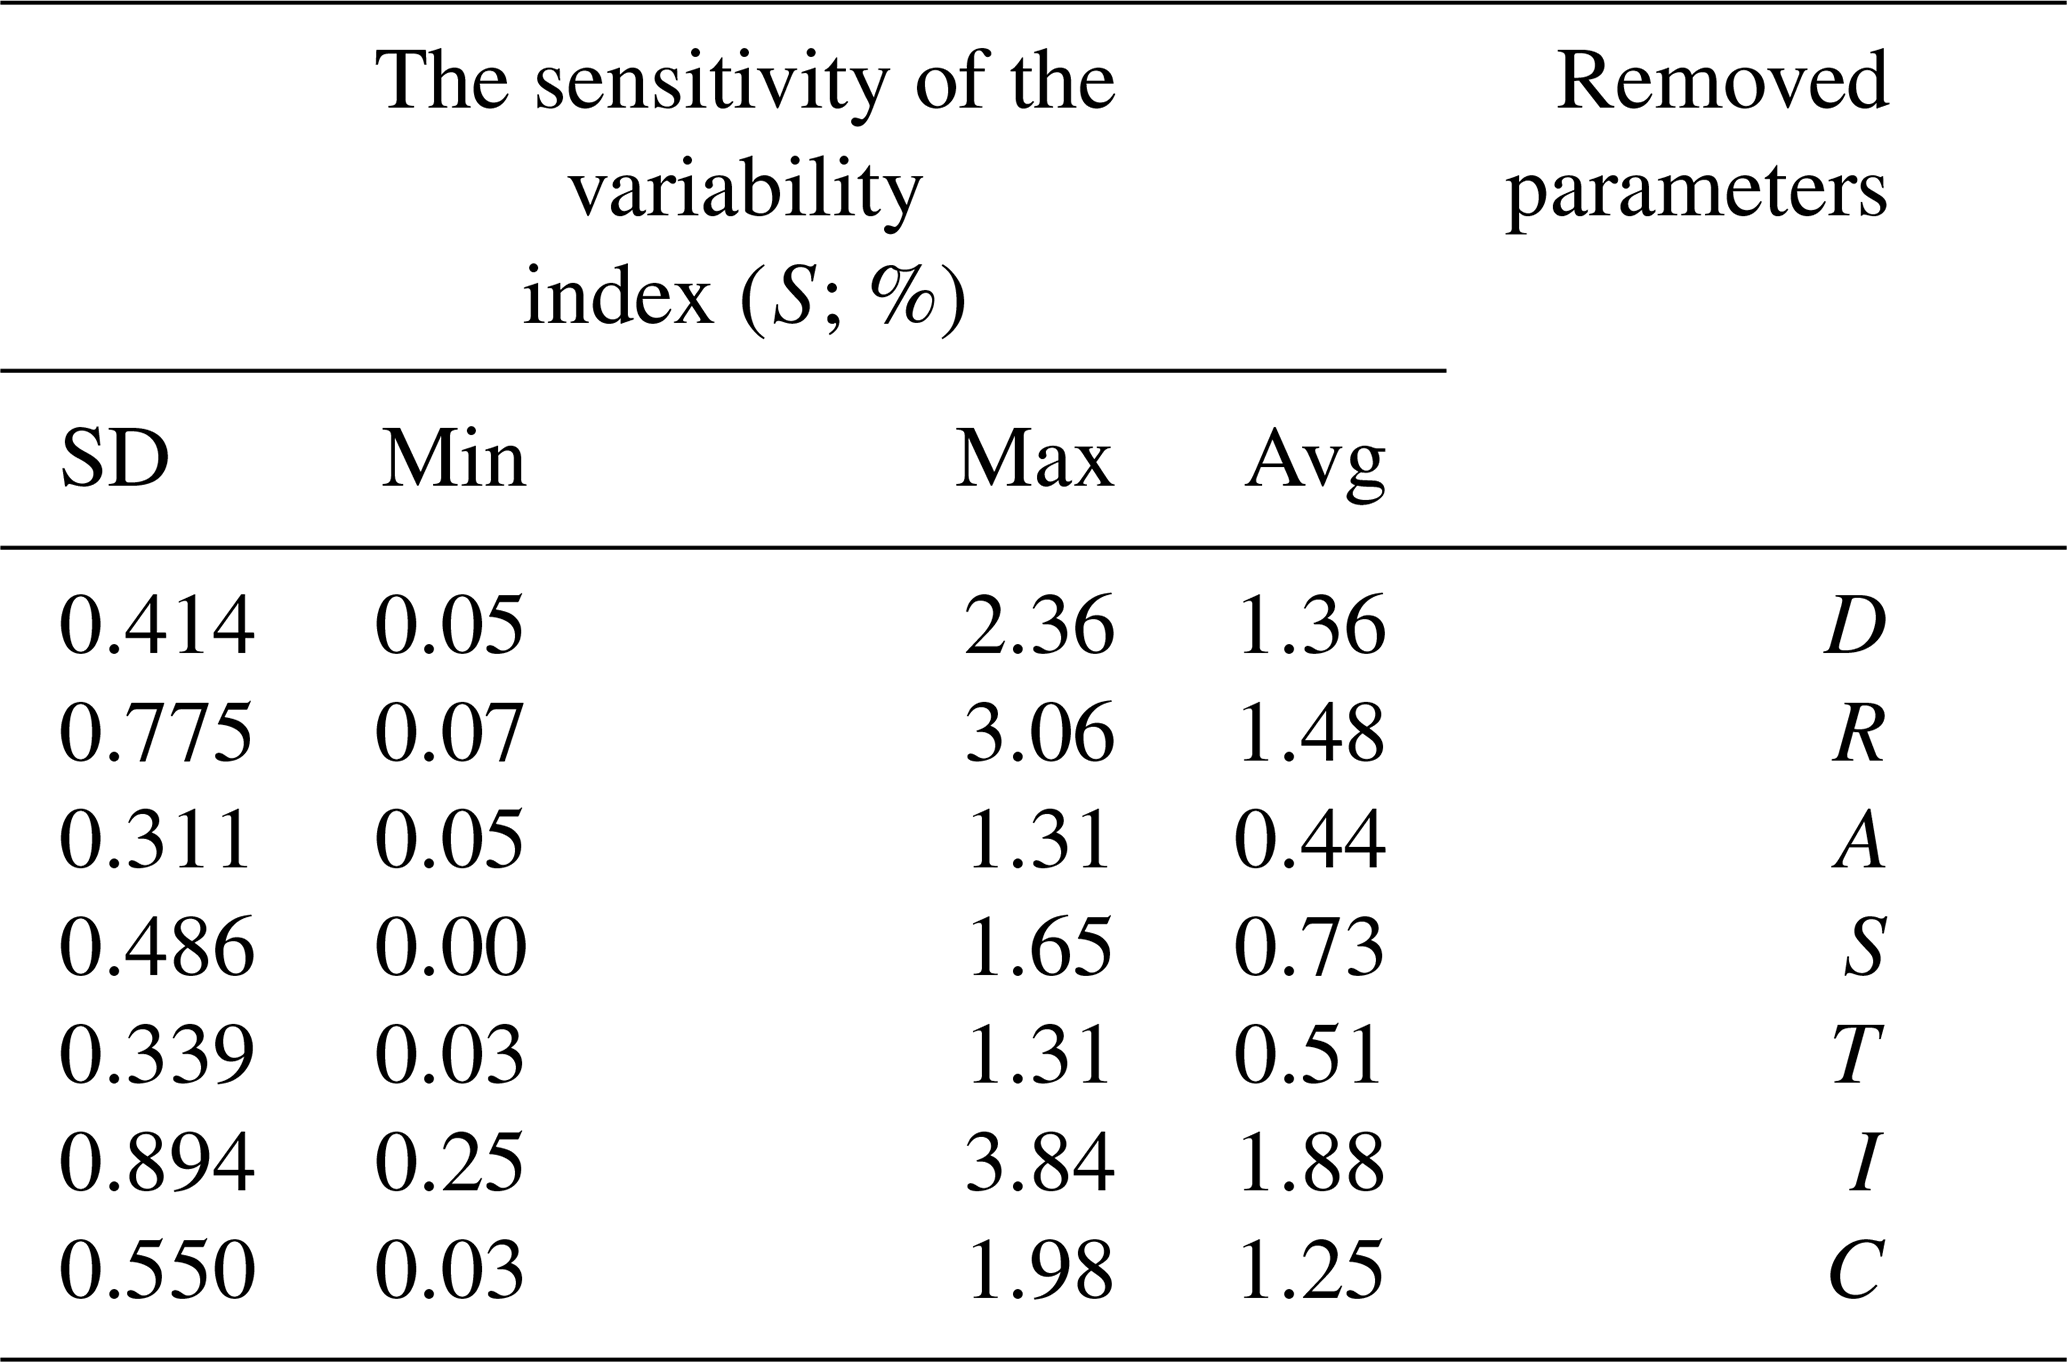
The MRSA in the DRASTIC index is performed by eliminating the data of one layer at a time as indicated in Table 8. The results showed a high variation in the vulnerability index when the impact of the vadose zone was removed such that the average variation index was 1.88 %. This shows that the factor is more effective in vulnerability assessment using the DRASTIC index. When this parameter is removed from the overlay process, a significant decrease was observed in the vulnerability index. This could be due to the high theoretical weight assigned to this factor (weight =5). These findings are similar to those obtained by Dibi et al. (2012), who have shown that, in addition to this parameter, topography, net recharge, and water table depth have a high impact on the vulnerability index. In addition, according to Samake et al. (2011), the vadose zone and hydraulic conductivity had a significant impact on the vulnerability index that appears to have a moderate sensitivity to the deletion of water table depth (1.48 %), net recharge (1.36 %), and hydraulic conductivity (1.25 %). The minimum menu variation index was achieved after eliminating the aquifer media (0.44 %), as indicated in Table 8.
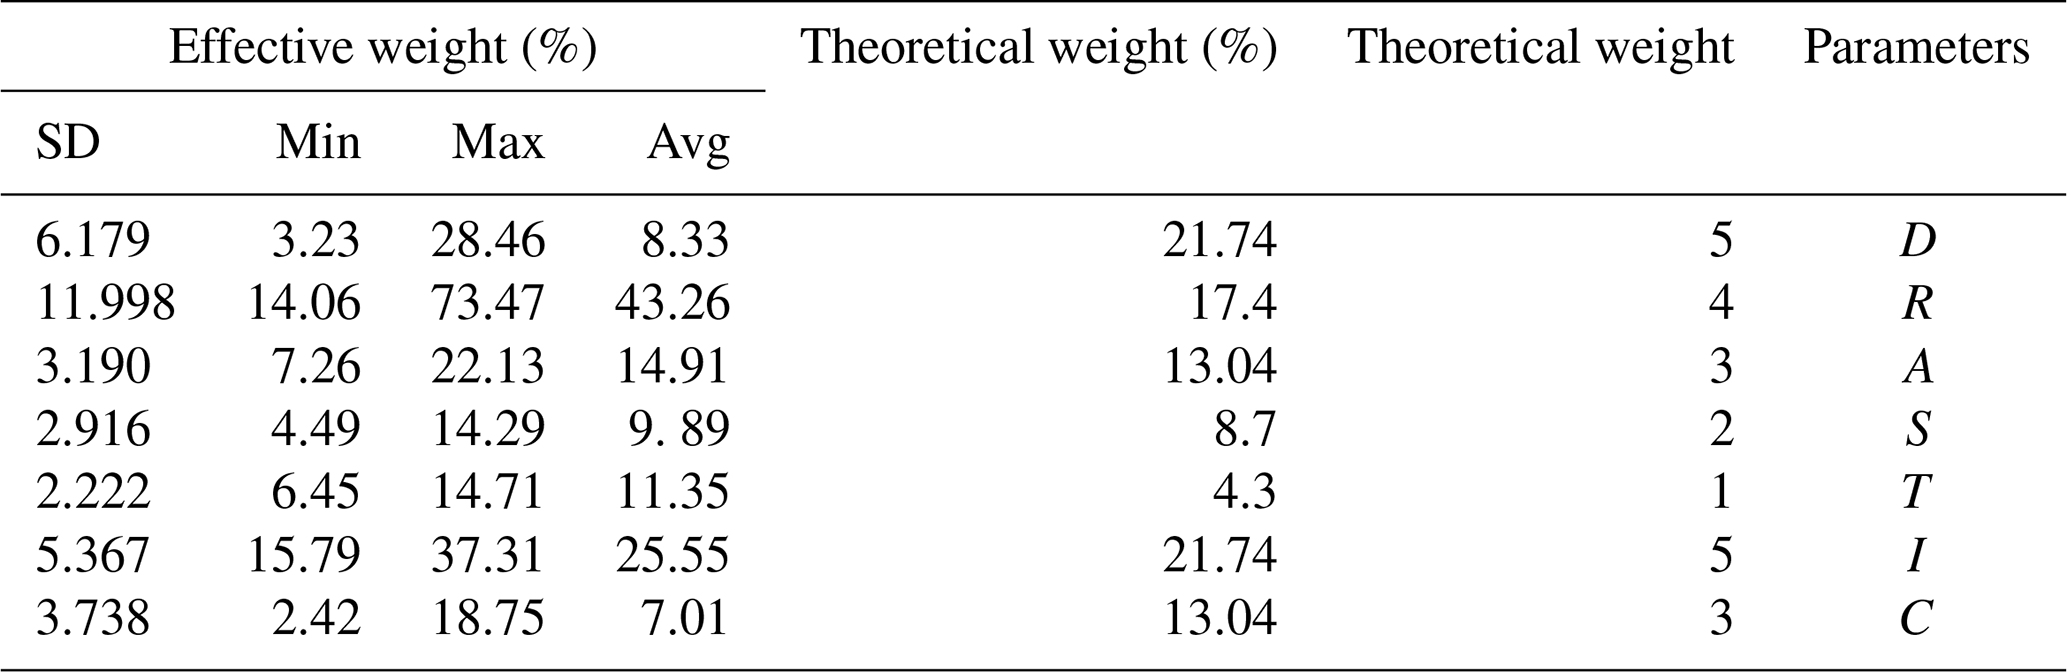
To estimate the effect of individual factors on aquifer vulnerability, the SPSA was performed. A summary of the results of the SPSA in the DRASTIC index is given in Table 9. The SPSA compares the effective and theoretical weights. The average effective weight of the net recharge was 43.26%, and its theoretical weight (%) was 17.4 %. This shows that the factor is more effective in vulnerability assessment using the DRASTIC index. The results reported by other studies (Babiker et al., 2005; Doumouya et al., 2012) are similar to those of the present study. The water table depth and impact of the vadose zone parameters had high theoretical weights (21.74 %) and have received an effective weight with an average value of 8.33 % and 25.55 % (Table 9). The remaining factors demonstrated an average effective weight of 14.91 % (aquifer media), 9.89 % (soil media), 11.35 % (topography), and 7.01 % (hydraulic conductivity). The theoretical weights assigned to the water table depth, net recharge, topography, and hydraulic conductivity were not in agreement with the effective weight. The highest and lowest impact on aquifer vulnerability belonged to net recharge and hydraulic conductivity, respectively (Table 9).
3.4 Sensitivities of the CDRASTIC index
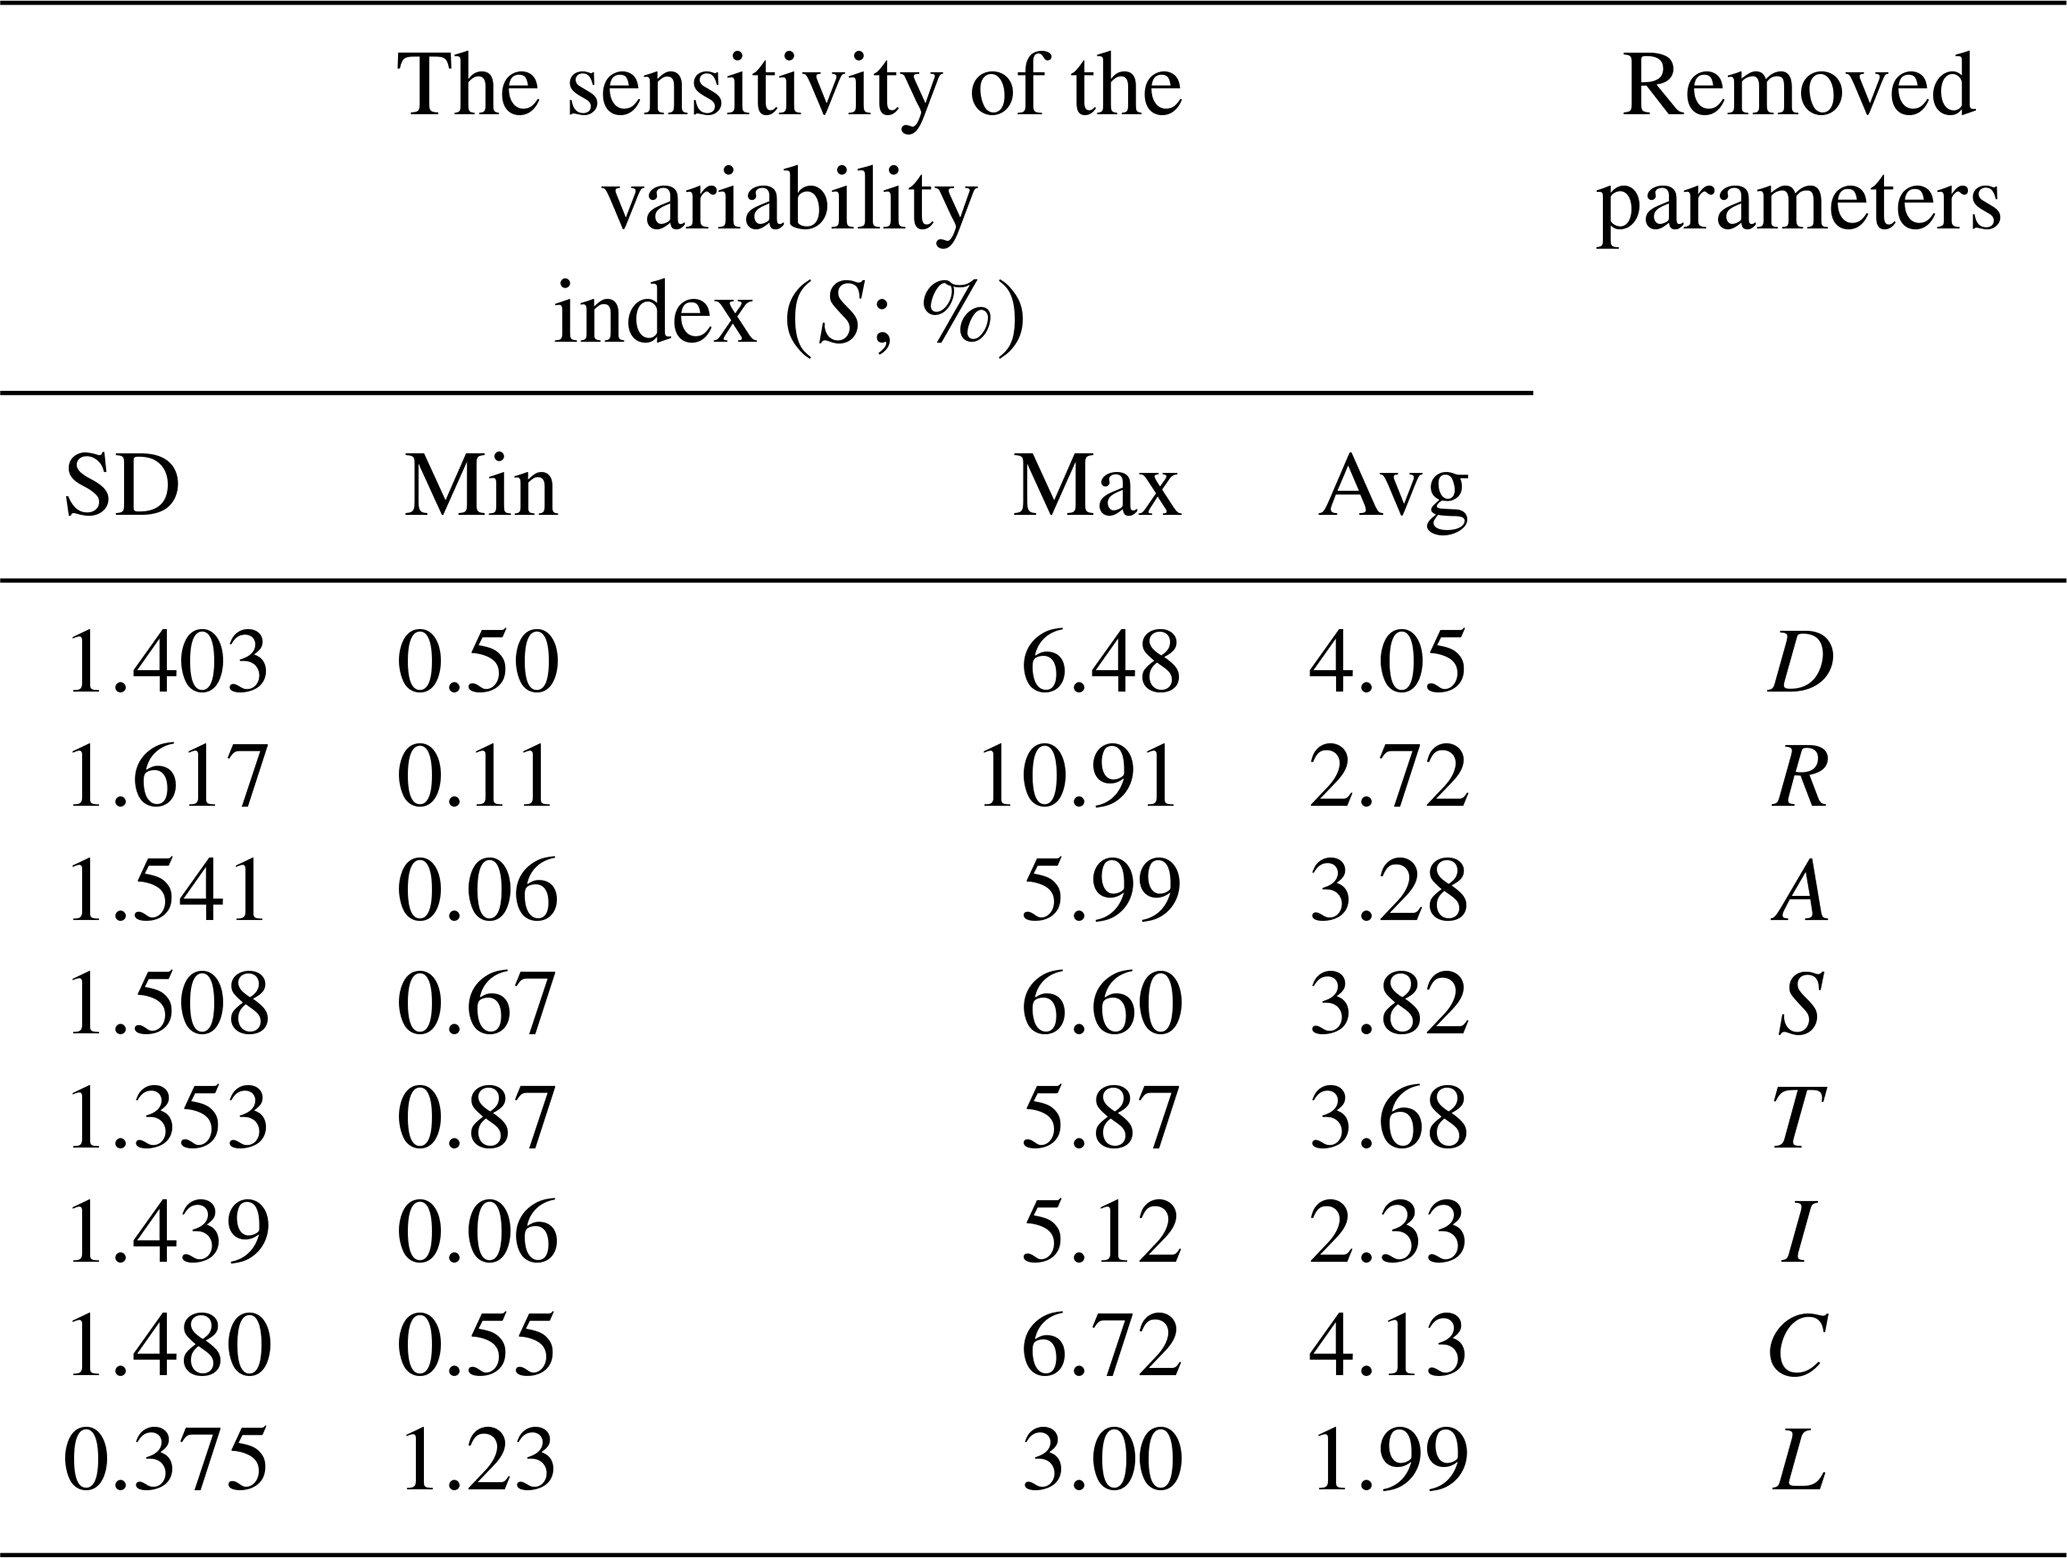
The MRSA in the CDRASTIC index was performed by eliminating one data layer at a time, as indicated in Table 10. The mean variation index of hydraulic conductivity was 4.13 %. Hydraulic conductivity had the greatest effect on the aquifer vulnerability, followed by water table depth (4.05 %), soil media (3.82 %), topography (3.68 %), aquifer media (3.28 %), net recharge (2.72 %), the impact of the vadose zone (2.33 %), and land use (1.99 %).
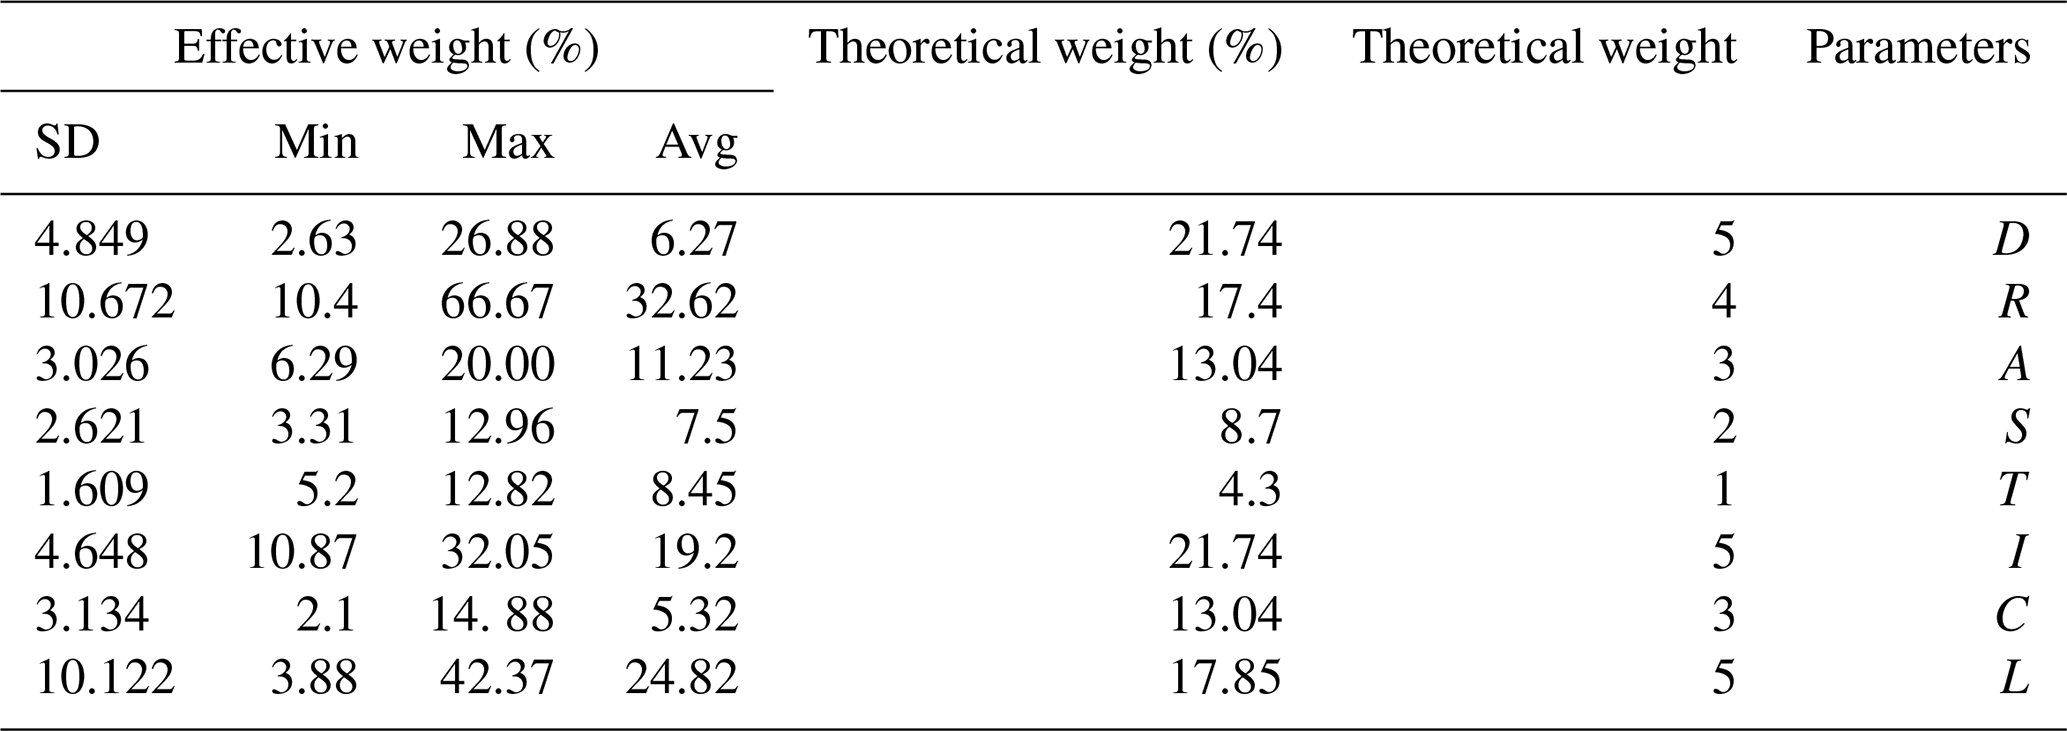
The effective weight derived from the SPSA to the CDRASTIC index is shown in Table 11. The average effective weight of net recharge was 32.62 %. This shows that the factor is more effective in vulnerability assessment using the CDRASTIC index. Hydraulic conductivity displays the lowest effective weight (5.32 %). Topography, net recharge, and land use parameters had the maximum effective weights with respect to the theoretical weights specified for them. The average effective weight of land use was 24.82 %. This suggests that the parameter was the second-most effective parameter in aquifer vulnerability using the CDRASTIC index (Table 11).
Evaluations of vulnerability indices for the Kerman–Baghin aquifer were conducted using the GIS-based DRASTIC and CDRASTIC indices. Seven hydrogeological factors (as the letters of the acronym show) were considered in the determination of aquifer vulnerability using DRASTIC, and eight parameters were considered in the CDRASTIC approach. From the DRASTIC index values, it was determined that 10.4 % of the aquifer has high (8.46 %) to very high (1.94 %) vulnerability. From the CDRASTIC index values, it was determined that 8.75% of the aquifer has high (6.28 %) to very high (2.47 %) vulnerability. In addition, we found that parts of the north, south, south-east, and north-west have low to very low vulnerability based on the DRASTIC and CDRASTIC indices. The MRSA signifies that hydraulic conductivity and the impact of the vadose zone induce a high risk of aquifer contamination according to the DRASTIC and CDRASTIC indices, respectively. For both methods, the SPSA analysis revealed that net recharge has a high risk of aquifer contamination. Based on the results, parts of the Kerman–Baghin aquifer tend to be contaminated, a point which merits the attention of regional authorities. Regarding urban planning and the organization of agricultural activities in Kerman Province, the vulnerability map prepared in this study could be valuable in the protection of groundwater quality. In areas with high and very high vulnerability to groundwater pollution, there should be restrictions on soil fertilization as well as permanent pasture, or afforestation should be introduced in the arable land. In addition, these areas should not be converted into housing developments. Groundwater vulnerability maps of the Kerman–Baghin aquifer are ideal for use in future land use planning.
The datasets generated and/or analysed during the current study are not publicly available as the authors are currently analysing for further work, but they are available from the corresponding author on reasonable request.
MN constructed the idea, planned the methodology, interpreted the results, and then reached conclusions. MM supervised the whole process and provided personal, environmental, and financial support for the research work. MN took responsibility for literature review and finalizing the whole paper and in the end critically reviewed the paper before submission.
The authors declare that they have no conflict of interest.
The authors would like to thank the Environmental Health Engineering Research Center, Kerman University of Medical Sciences, for their scientific support.
This paper was edited by Mario Parise and reviewed by two anonymous referees.
Aller, L., Bennett, T., Lehr J. H., and Petty, R. J.: DRASTIC: a standardized system for evaluating ground water pollution potential using hydrogeologic settings, U.S Environmental Protection Agency, USA, 1985.
Ayazi, M. H., Pirasteh, S., Arvin, A., Pradhan, B., Nikouravan, B., and Mansor, S.: Disasters and risk reduction in groundwater: Zagros Mountain Southwest Iran using geoinformatics techniques, Disaster Adv., 3, 51–57, 2010.
Baalousha, H.: Vulnerability assessment for the Gaza Strip, Palestine using DRASTIC, J. Environ. Geol., 50, 405–414, https://doi.org/10.1007/s00254-006-0219-z, 2006.
Babiker, I. S., Mohamed, M. A., Hiyama, T., and Kato, K.: A GIS-based DRASTIC model for assessing aquifer vulnerability in Kakamigahara Heights, Gifu Prefecture, central Japan, Sci. Total Environ., 345, 127–140, https://doi.org/10.1016/j.scitotenv.2004.11.005, 2005.
Baghapour, M. A., Talebbeydokhti, N., Tabatabee, H., and Nobandegani, A. F.: Assessment of groundwater nitrate pollution and determination of groundwater protection zones using DRASTIC and composite DRASTIC 404 (CD) models: the case of Shiraz unconfined aquifer, J. Health. Sci. Surveill. Syst., 2, 54–65, 2014.
Baghapour, M. A., Nobandegani, A. F., Talebbeydokhti, N., Bagherzadeh, S., Nadiri, A. A., Gharekhani, M., and Chitsazan, N.: Optimization of DRASTIC method by artificial neural network, nitrate vulnerability index, and composite DRASTIC models to assess groundwater vulnerability for unconfined aquifer of Shiraz Plain, Iran, J. Environ. Health Sci., 14, 1–16, https://doi.org/10.1186/s40201-016-0254-y, 2016.
Barber, C., Bates, L. E., Barron, R., and Allison, H.: Assessment of the relative vulnerability of groundwater to pollution: a review and background paper for the conference workshop on vulnerability assessment, AGSO J. Aust. Geol. Geophys., 14, 147–154, 1993.
Boughriba, M., Barkaoui, A.-E., Zarhloule, Y., Lahmer, Z., El Houadi, B., and Verdoya, M.: Groundwater vulnerability and risk mapping of the Angad transboundary aquifer using DRASTIC index method in GIS environment, Arab. J. Geosci., 3, 207–220, https://doi.org/10.1007/s12517-009-0072-y, 2010.
Chitsazan, M., and Akhtari, Y.: Evaluating the potential of groundwater pollution in Kherran and Zoweircherry plains through GIS-based DRASTIC model, J. Water. Wastewater, 17, 39–51, 2006.
Chitsazan, M. and Akhtari, Y.: A GIS-based DRASTIC model for assessing aquifer vulnerability in Kherran Plain, Khuzestan, Iran, Water Resour. Manag., 23, 1137–1155, https://doi.org/10.1007/s11269-008-9319-8, 2009.
Colins, J., Sashikkumar, M., Anas, P., and Kirubakaran, M.: GIS-based assessment of aquifer vulnerability using DRASTIC Model: A case study on Kodaganar basin, Earth Sci. Res. J., 20, 1–8, https://doi.org/10.15446/esrj.v20n1.52469, 2016.
Daly, D. and Drew, D.: Irish methodologies for karst aquifer protection, in: Beek B (ed) Hydrogeology and engineering geology of sinkholes and karst, Balkema, Rotterdam, 267–272, 1999.
Dibi, B., Kouame, K. I., Konan-Waidhet, A. B., Savane, I., Biemi, J., Nedeff, V., and Lazar, G.: Impact of agriculture on the quality of groundwater resources in peri-urban zone of Songon (Cote D'ivoire), Environ. Engine. Manage. J., 11, 2173–2182, https://doi.org/10.30638/eemj.2012.271, 2012.
Dixon, B.: Prediction of ground water vulnerability using an integrated GIS-based Neuro-Fuzzy techniques, J. Spat. Hydro., 4, 1–38, 2004.
Doumouya, I., Dibi, B., Kouame, K. I., Saley, B., Jourda, J. P., Savane, I., and Biemi, J.: Modelling of favourable zones for the establishment of water points by geographical information system (GIS) and multicriteria analysis (MCA) in the Aboisso area (South-east of Côte d'Ivoire), Environ. Earth. Sci., 67, 1763–1780, https://doi.org/10.1007/s12665-012-1622-2, 2012.
Ghazavi, R. and Ebrahimi, Z.: Assessing groundwater vulnerability to contamination in an arid environment using DRASTIC and GOD models, Inte. J. Environ. Sci. Te., 12, 2909–2918, https://doi.org/10.1007/s13762-015-0813-2, 2015.
Ghosh, T. and Kanchan, R.: Aquifer vulnerability assessment in the Bengal alluvial tract, India, using GIS based DRASTIC model, Model Earth Syst. Environ., 2, 2–13, https://doi.org/10.1007/s40808-016-0208-5, 2016.
Israil, M., Al-hadithi, M., Singhal, D., Kumar, B., Rao, M. S., and Verma, S.: Groundwater resources evaluation in the Piedmont zone of Himalaya, India, using Isotope and GIS techniques, J. Spatial. Hydro., 6, 107–119, 2006.
Jaiswal, R., Mukherjee, S., Krishnamurthy, J., and Saxena, R.: Role of remote sensing and GIS techniques for generation of groundwater prospect zones towards rural development – an approach, Int. J. Remote Sens., 24, 993–1008, https://doi.org/10.1080/01431160210144543, 2003.
Jaseela, C., Prabhakar, K., and Harikumar, P. S. P.: Application of GIS and DRASTIC modeling for evaluation of groundwater vulnerability near a solid waste disposal site, Int. J. Geoscien., 7, 558–571, https://doi.org/10.4236/ijg.2016.74043, 2016.
Javadi, S., Kavehkar, N., Mousavizadeh, M., and Mohammadi, K.: Modification of DRASTIC model to map groundwater vulnerability to pollution using nitrate measurements in agricultural areas, J. Agr. Sci. Tech., 13, 239–249, 2010.
Javadi, S., Kavehkar, N., Mohammadi, K., Khodadadi, A., and Kahawita, R.: Calibrating DRASTIC using field measurements, sensitivity analysis and statistical methods to assess groundwater vulnerability, Water. Int., 36, 719–732, https://doi.org/10.1080/02508060.2011.610921, 2011.
Jayasekera, D., Kaluarachchi, J. J., and Villholth, K. G.: Groundwater Quality Impacts Due to Population Growth and Land Use Exploitation in the Coastal Aquifers of Sri Lanka, Southern Illinois University Carbondale 2008, 43, 1–12, 2008.
Jayasekera, D. L., Kaluarachchi, J. J., and Villholth, K. G.: Groundwater stress and vulnerability in rural coastal aquifers under competing demands: a case study from Sri Lanka, Environ. Monit. Assess., 176, 13–30, https://doi.org/10.1007/s10661-010-1563-8, 2011.
Kardan Moghaddam, H., Jafari, F., and Javadi, S.: Vulnerability evaluation of a coastal aquifer via GALDIT model and comparison with DRASTIC index using quality parameters, Hydrolog. Sci. J., 62, 137–146, https://doi.org/10.1080/02626667.2015.1080827, 2017.
Kumar, P., Thakur, P. K., Bansod, B. K., and Debnath, S. K.: Assessment of the effectiveness of DRASTIC in predicting the vulnerability of groundwater to contamination: a case study from Fatehgarh Sahib district in Punjab, India, Environ. Earth. Sci., 75, 1–13, https://doi.org/10.1007/s12665-016-5712-4, 2016.
Madrucci, V., Taioli, F., and de Araújo, C. C.: Groundwater favorability map using GIS multicriteria data analysis on crystalline terrain, Sao Paulo State, Brazil, J. Hydrol., 357, 153–173, https://doi.org/10.1016/j.jhydrol.2008.03.026, 2008.
Manap, M. A., Sulaiman, W. N. A., Ramli, M. F., Pradhan, B., and Surip, N.: A knowledge driven GIS modeling technique for groundwater potential mapping at the Upper Langat Basin, Malaysia, Arabian. J. Geosci., 6, 1621–1637, https://doi.org/10.1007/s12517-011-0469-2, 2013.
Manap, M. A., Nampak, H., Pradhan, B., Lee, S., Sulaiman, W. N. A., and Ramli, M. F.: Application of probabilistic-based frequency ratio model in groundwater potential mapping using remote sensing data and GIS, Arabian. J. Geosci., 7, 711–724, https://doi.org/10.1007/s12517-012-0795-z, 2014a.
Manap, M. A., Nampak, H., Pradhan, B., Lee, S., Sulaiman, W. N. A., and Ramli, M. F.: Application of probabilistic-based frequency ratio model in groundwater potential mapping using remote sensing data and GIS, Arabian. J. Geosci., 7, 711–724, https://doi.org/10.1007/s12517- 012-0795-z, 2014b.
Martínez-Bastida, J. J., Arauzo, M., and Valladolid, M.: Intrinsic and specific vulnerability of groundwater in central Spain: the risk of nitrate pollution, Hydrol. J., 18, 681–698, https://doi.org/10.1007/s10040-009-0549-5, 2010.
Merchant, J. W.: GIS-based groundwater pollution hazard assessment: a critical review of the DRASTIC model, Photogramm. Eng. Remote Sensing, 60, 1117–1127, 1994.
Modabberi, H., Hashemi, M. M. R., Ashournia, M., and Rahimipour, M. A.: Sensitivity Analysis and Vulnerability Mapping of the Guilan Aquifer Using Drastic Method, Rev. Environ. Earth. Sci., 4, 27–41, https://doi.org/10.18488/journal.80.2017.41.27.41, 2017.
Napolitano, P. and Fabbri, A.: Single-parameter sensitivity analysis for aquifer vulnerability assessment using DRASTIC and SINTACS, Proceedings of the Vienna Conference, the Netherlands, 559–566, 1996.
National Research Council: Ground water vulnerability assessment: Predicting relative contamination potential under conditions of uncertainty, National Academies Press, USA, 224, 1993.
Neshat, A., Pradhan, B., Pirasteh, S., and Shafri, H. Z. M.: Estimating groundwater vulnerability to pollution using a modified DRASTIC model in the Kerman agricultural area, Iran, Environ. Earth. Sci., 71, 3119–3131, https://doi.org/10.1007/s12665-013-2690-7, 2014.
Neshat, A. and Pradhan, B.: Evaluation of groundwater vulnerability to pollution using DRASTIC framework and GIS, Arabian. J. Geosci., 10, 2–8, https://doi.org/10.1007/s12517-017-3292-6, 2017.
Raju, N. J., Ram, P., and Gossel, W.: Evaluation of groundwater vulnerability in the lower Varuna catchment area, Uttar Pradesh, India using AVI concept, J. Geol. Soc. India., 83, 273–278, https://doi.org/10.1007/s12594-014-0039-9, 2014.
Saida, S., Tarik, H., Abdellah, A., Farid, H., and Hakim, B.: Assessment of groundwater vulnerability to nitrate based on the optimised DRASTIC models in the GIS Environment (Case of Sidi Rached Basin, Algeria), Geosciences, 7, 2–23, https://doi.org/10.3390/geosciences7020020, 2017.
Saidi, S., Bouri, S., and Ben Dhia, H.: Sensitivity analysis in groundwater vulnerability assessment based on GIS in the Mahdia-Ksour Essaf aquifer, Tunisia: a validation study, Hydrolog. Sci. J., 56, 288–304, https://doi.org/10.1080/02626667.2011.552886, 2011.
Samake, M., Tang, Z., Hlaing, W., Mbue, I. N., Kasereka, K., and Balogun, W. O.: Groundwater vulnerability assessment in shallow aquifer in Linfen Basin, Shanxi Province, China using DRASTIC model, J. Sustain. Develop., 4, 53–71, https://doi.org/10.5539/jsd.v4n1p53, 2011.
Sarah, C. and Patricia l, C.: Ground water vulnerability assessment: Predicting relative contamination potential under conditions of uncertainty, National Academies Press, USA, 1993.
Secunda, S., Collin, M., and Melloul, A. J.: Groundwater vulnerability assessment using a composite model combining DRASTIC with extensive agricultural land use in Israel's Sharon region, J. Environ. Manage., 54, 39–57, https://doi.org/10.1006/jema.1998.0221, 1998.
Shirazi, S. M., Imran, H., and Akib, S.: GIS-based DRASTIC method for groundwater vulnerability assessment: a review, J. Risk. Res., 15, 991–1011, https://doi.org/10.1080/13669877.2012.686053, 2012.
Singh, A., Srivastav, S., Kumar, S., and Chakrapani, G. J.: A modified-DRASTIC model (DRASTICA) for assessment of groundwater vulnerability to pollution in an urbanized environment in Lucknow, India, Environ. Earth. Sci., 74, 5475–5490, https://doi.org/10.1007/s12665-015-4558-5, 2015.
Souleymane, K. and Zhonghua, T.: A novel method of sensitivity analysis testing by applying the DRASTIC and fuzzy optimization methods to assess groundwater vulnerability to pollution: the case of the Senegal River basin in Mali, Nat. Hazards Earth Syst. Sci., 17, 1375–1392, https://doi.org/10.5194/nhess-17-1375-2017, 2017.
Srivastava, P. K. and Bhattacharya, A. K.: Groundwater assessment through an integrated approach using remote sensing, GIS and resistivity techniques: a case study from a hard rock terrain, Int. J. Remote. Sens., 27, 4599–4620, https://doi.org/10.1080/01431160600554983, 2006.
Tilahun, K. and Merkel, B. J.: Assessment of groundwater vulnerability to pollution in Dire Dawa, Ethiopia using DRASTIC, Environ. Earth. Sci., 59, 1485–1496, https://doi.org/10.1007/s12665 009-0134-1, 2010.
Zghibi, A., Merzougui, A., Chenini, I., Ergaieg, K., Zouhri, L., and Tarhouni, J.: Groundwater vulnerability analysis of Tunisian coastal aquifer: an application of DRASTIC index method in GIS environment, Groundwater. Sustain. Develop., 2, 169–181, https://doi.org/10.1016/j.gsd.2016.10.001, 2016.