the Creative Commons Attribution 4.0 License.
the Creative Commons Attribution 4.0 License.
 | 26 Aug 2020
The mudflow disaster at Villa Santa Lucía in Chilean Patagonia: understandings and insights derived from numerical simulation and postevent field surveys
Marcelo A. Somos-Valenzuela
Joaquín E. Oyarzún-Ulloa
Ivo J. Fustos-Toribio
Natalia Garrido-Urzua
Ningsheng Chen
The evaluation of potential landslides in mountain areas is a very complex process. Currently, event understanding is scarce due to information limitations. Identifying the whole chain of events is not a straightforward task, and the impacts of mass-wasting processes depend on the conditions downstream of the origin. In this paper, we present an example that illustrates the complexities in the evaluation of the chain of events that may lead to a natural disaster. On 16 December 2017, a landslide occurred in the Yelcho mountain range (southern Chile). In that event, 7 million m3 of rocks and soil fell on the Yelcho glacier, depositing 2 million m3 on the glacier terminal, and the rest continued downstream, triggering a mudflow that hit Villa Santa Lucía in Chilean Patagonia and killing 22 people. The complex event was anticipated in the region by the National Geological and Mining Survey (Sernageomin in Spanish). However, the effects of the terrain characteristics along the run-out area were more significant than anticipated. In this work, we evaluate the conditions that enabled the mudflow that hit Villa Santa Lucía. We used the information generated by Sernageomin's professionals after the mudflow. We carried out geotechnical tests to characterize the soil. We simulated the mudflow using two hydrodynamic programs (r.avaflow and Flo-2D) that can handle the rheology of the water–soil mixture.
Our results indicate that the soil is classified as volcanic pumices. This type of soil can be susceptible to the collapse of the structure when subjected to shearing (molding), flowing as a viscous liquid. From the numerical modeling, we concluded that r.avaflow performs better than Flo-2D. The mudflow was satisfactorily simulated using a water content in the mixture ranging from 30 % to 40 %, which would have required a source of about 3 million m3 of water. Coupling the simulations and the soil tests that we performed, we estimated that in the area scoured by the mudflow, there were probably around 2 800 000 m3 of water within the soil. Therefore, the conditions of the valley were crucial to enhancing the impacts of the landslide. This result is relevant because it highlights the importance of evaluating the complete chain of events to map hazards. We suggest that in future hazard mapping, geotechnical studies in combination with hydrodynamic simulation should be included, in particular when human lives are at risk.
- Article
(23851 KB) - Full-text XML
- BibTeX
- EndNote


Landslide processes are particularly dangerous in areas close to human settlements. They can affect nearby villages, directly destroying houses and taking human lives (Gariano and Guzzetti, 2016) or indirectly affecting the connectivity of remote areas (Winter et al., 2016). The impacts of landslides are a function of the size of the event but also of the conditions downstream, for example glacial lakes susceptible to overflow as well as unstable valleys that, given the right soil matrix and water content, can mobilize and produce mudflows (Carey et al., 2011; Haeberli et al., 2013). Areas where glaciers are receding worsen this situation because they expose unstable hillslopes that can collapse as well as potentially create glacier lakes. Currently, baseline information availability is still critical in austral zones of South America, especially in northern Patagonia, with a low population density that has not encouraged rigorous evaluation. Moreover, in recent years landslide events have increased due to anthropic and climatic effects (Aldunce and González, 2009). At the same time, northern Patagonia shows an increase in the population (INE, 2018), increasing the risk. Therefore, a better understanding of the mudflows' chain of events triggered by landslides is urgent.
In our contribution, we evaluate the generation of a cascade of events associated with the Villa Santa Lucía mudflow in northern Patagonia. In this study, we evaluate the mechanisms that enable a landslide of 7×10⁶ m3 to evolve to the catastrophic mudflow that destroyed Villa Santa Lucía in Chilean Patagonia, resulting in 22 people dead. The landslide, which may have been triggered by hydrometeorological conditions and destabilization of the wall around the receding glacier in the Yelcho range, led to the generation of a mudflow at the head of the Río Burritos that traveled around 10 km and affected 50 % of the urban area of Villa Santa Lucía on 16 December 2017. The first observations indicated that the event was possible because of the presence of a glacier lake. However, field results do not allow the support of this hypothesis in the area. Therefore, this study, which seeks to understand the conditions that enabled the event without the presence of a glacier lake, has a twofold application. First, it allows us to understand the mechanisms of the chain of events leading to the 2017 mudflow in Villa Santa Lucía, and second – and probably most important – it allows us to update the criteria for mapping risks associated with mudflows in Chilean Patagonia.
2.1 Location
Villa Santa Lucía is located in the valley of the Rio Frío, 75 km south of Chaitén (closest town), along the Carretera Austral, in the Los Lagos region, Chile. The landslide event started at the head of the Río Burritos basin (43.413∘ S, 72.367∘ W) that runs to the west of Villa Santa Lucía (Fig. 1). It begins on the eastern slope of the western side of the regional Andes, in the Yelcho glacier.
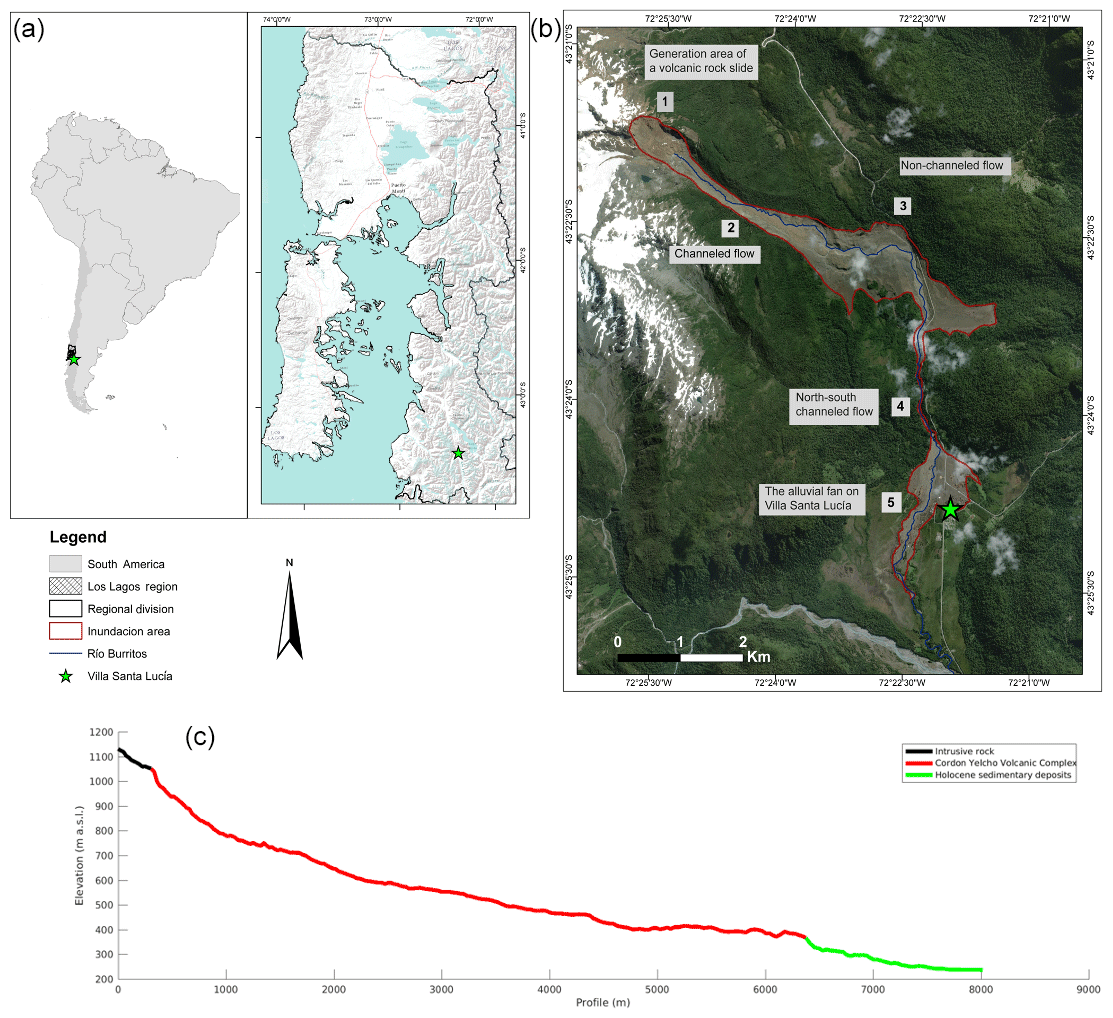
Figure 1a Study area and extension mudflow (South America and Los Lagos region layer from https://tapiquen-sig.jimdo.com (last access: 19 November 2019), b Río Burritos blue line layer from http://datos.cedeus.cl/ (last access: 19 November 2019, background © ESRI). c Elevation profile and geological formation along the mudflow path.
This area was under tectonic modeling associated with the Liquiñe–Ofqui fault system (LOFS), forming north–south-trending valleys (Hervé et al., 2017). The geomorphological analysis shows glacier erosion in the Rio Frío valley and Yelcho Lake during the Pleistocene followed by sedimentary deposition of volcanic and river processes (Sernageomin, 2018). The climate of the area presents intense thermal variations, high summer temperatures, and freezing temperatures in the winter. The rainfall reaches 3000 mm annually, decreasing to the east (CECS, 2017).
2.2 Geological setting
The study area consists mainly of nine geological units (Fig. 2). The dominant geological unit corresponds to an intrusive rock (Cretaceous and Miocene age) composed of tonalites, granodiorites, granites, diorites, and others. Moreover, the basement material is an old metamorphic rock. This unit is composed of micaceous shales, and amphibolite. Volcanic and volcaniclastic rocks represent, in part, the NW–SE volcanic arc, called the Cordón–Yelcho volcanic complex (Sernageomin, 1995). Sedimentary rocks, mainly sandstone, shales, and conglomerates are presented as intercalations. Recent sedimentary deposits are mainly associated with river, alluvial, colluvial, morainic, and glaciolacustrine deposits (Aguilera et al., 2014; Fig. 2).
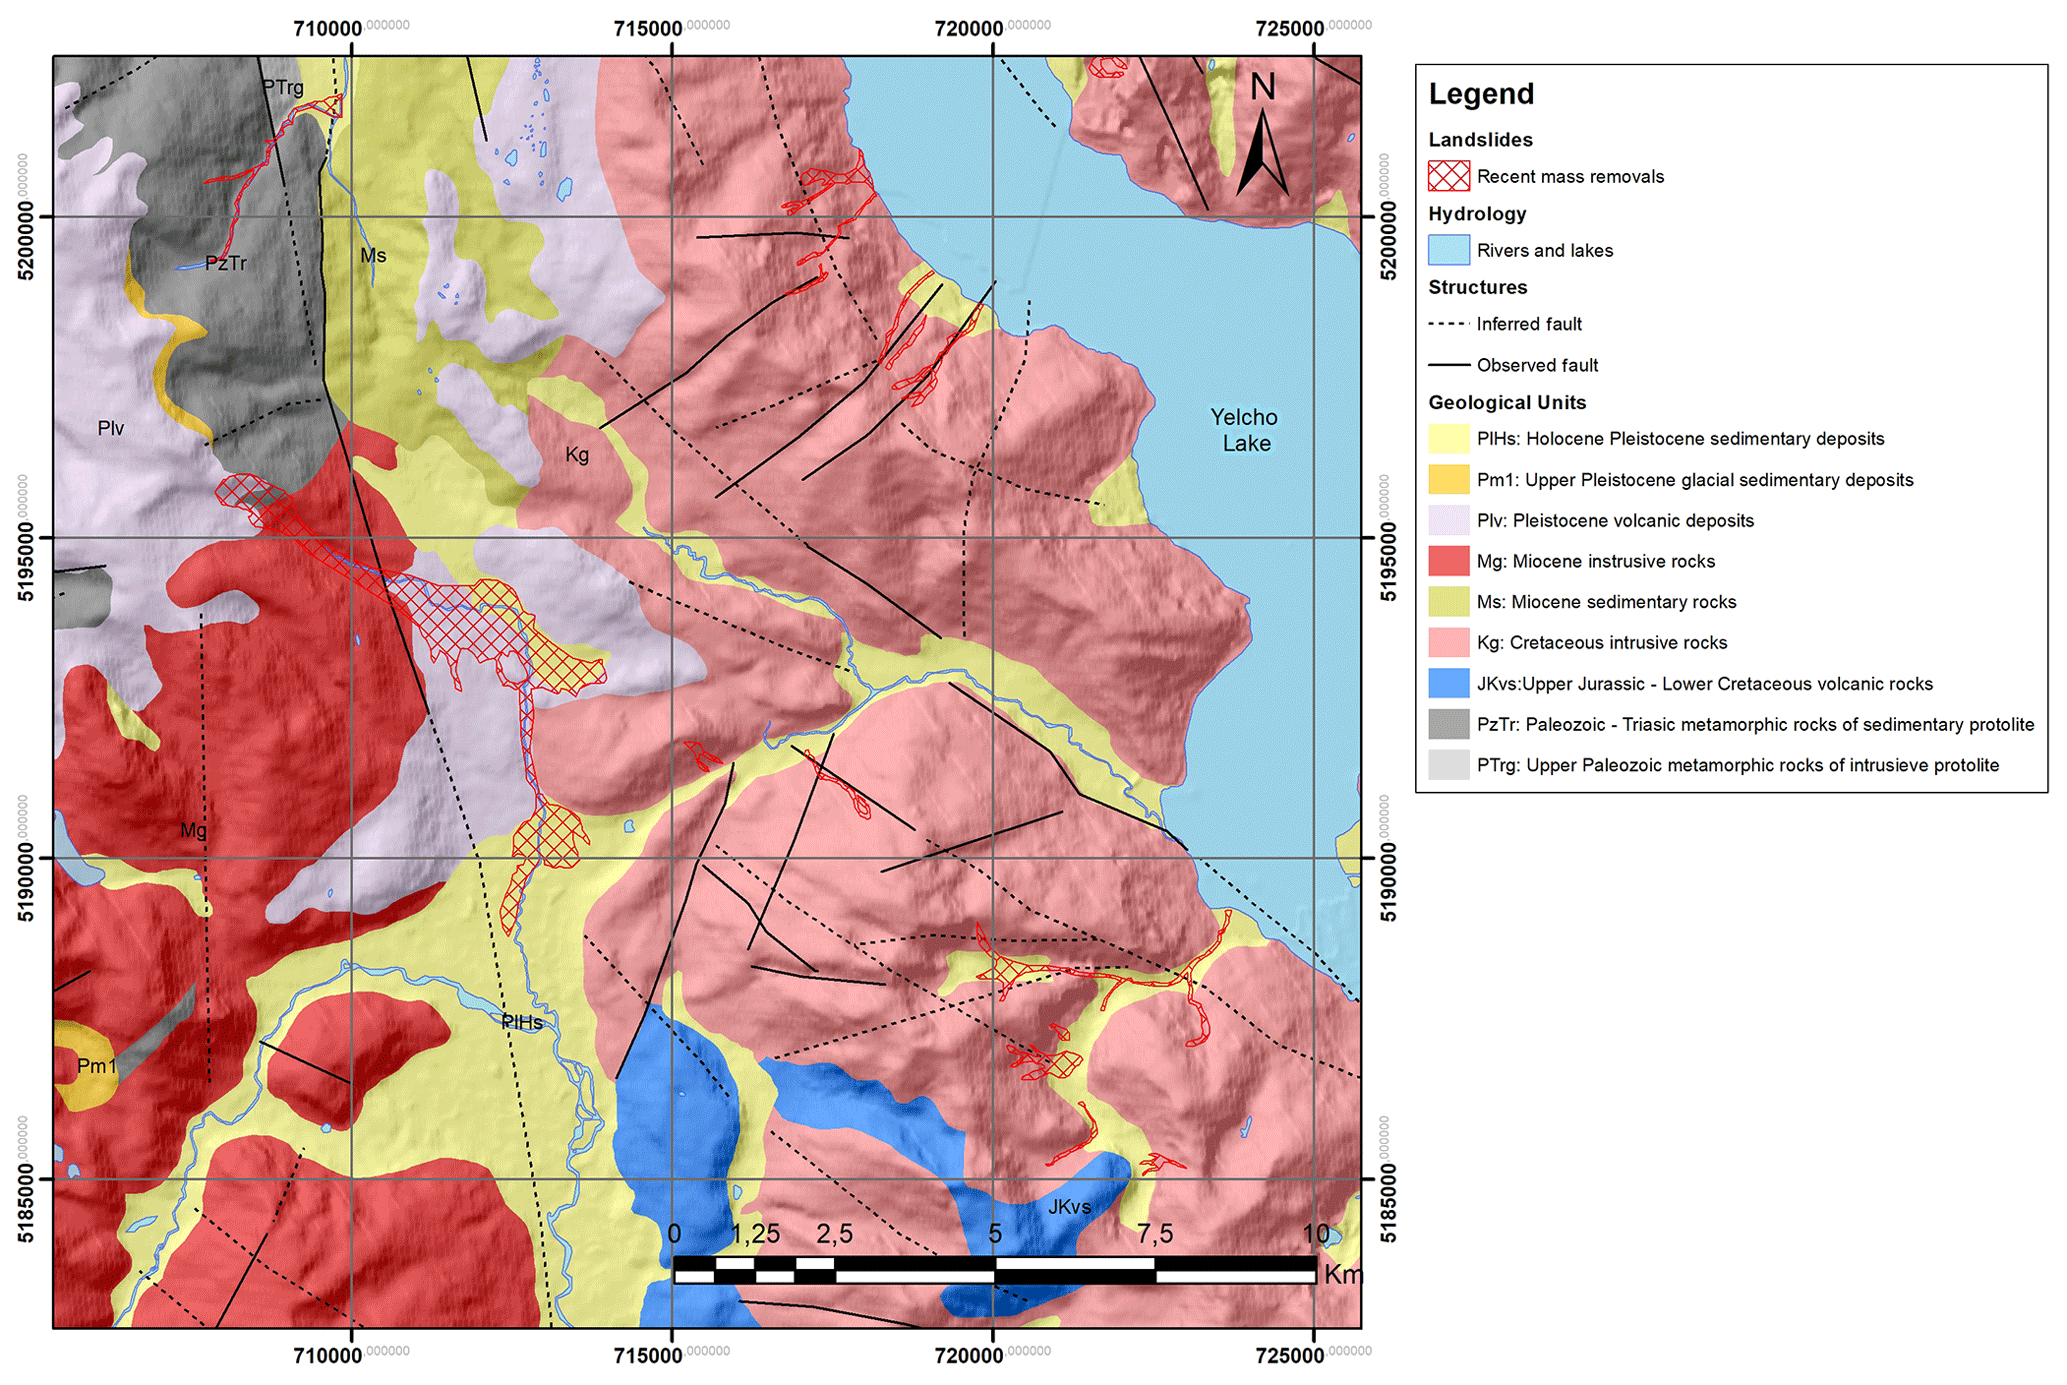
Figure 2Geology of the study area (modified from Sernageomin, 1995).
2.3 Event background
The event in Villa Santa Lucía was triggered during a rainfall event that passed over the area. The event generated a significant record of rainfall surplus. Therefore, the hydrometeorological condition could constitute a condition of soil saturation that is favorable to natural hazards (Nguyen et al., 2018).
According to the information provided by the General Water Directorate (DGA in Spanish), the annual average rainfall in this area is 3420 mm. At the time of the event, the total annual rainfall was 3650 mm, and in the 30 h prior to the event the rainfall reached 124.8 mm, with a maximum intensity of 10.6 mm h−1 at 16:00 LT on 15 December 2017. This hydrometeorological event exceeds 99 % of the historical precipitation events in the area (CECS, 2017). The precipitation events in Villa Santa Lucía occurred after 2 weeks with maximum daily temperatures that exceeded 22 ∘C on at least 9 d between 1 and 15 December, with 2 and 5 December being the hottest days, with temperatures that exceeded 27 ∘C. During December, before the event, the air temperature reached an average of 14.9 ∘C (CECS, 2017). The Center for Scientific Studies (CEC in Spanish) determined through the data of a radiosonde located at Puerto Montt El Tepual (41.44∘ S, 73.09∘ W) that the isothermal level on 15 December was 2771 m a.s.l. (above sea level) for the Villa Santa Lucía coordinates. This implies that in the study area, there was only liquid precipitation on the days before the event, even in the glaciers of the Yelcho range, considering that the maximum heights of the peaks do not exceed approximately 1800 m a.s.l.
Previous studies show that the surroundings of the Villa Santa Lucía present a high and moderate risk of being affected by mass-wasting processes, highlighting possible debris flows at the bottom of the valleys and in active channels (Sernageomin, 2008). Areas not classified as high or moderate risk have low or no risk, which should be assessed in greater detail. High flood hazards should affect only the flood plain adjacent to Villa Santa Lucía, although some degree of risk in the town itself must be evaluated on a more detailed scale. This shows that the area of Villa Santa Lucía and its surroundings were and are prone to mass-wasting phenomena. Although the town itself was not at risk, it was mentioned that more detailed studies are needed in the area.
2.4 Description of the event
On 16 December 2017, a 7 million m3 volcanic rock slide detached (Fig. 3, point 1), falling next to the Yelcho glacier toe that sits on an intrusive formation that has a drop of about 80 m. The glacier has shown a retreat of at least 250 m during the last decade. Sernageomin (2018) indicated that there might have been a small lake and water available on top of the intrusive formation, but there is no conclusive information. Satellite images before the events do not indicate a lake above the intrusive unit. Also, there were indications that ice contributed to the mudflow. Remote-sensing data do not show that the landslide fell on top of the glacier unless detritus had covered the glacier, although we could see ice on top of the flank that collapsed. However, we do not have data to prove or rule out the covered ice on the intrusive unit nor to determine how much water it contributed to the mix. A total of 2 million m3 of the landslide material stayed above the intrusive unit, and 5 million m3 of material continued downstream, sliding on the intrusive unit at a slope of more than 70∘. At this point, the mudflow reached the Río Burritos with high topographic differences. The flow continued along with the drainage network at high speed (Figs. 1 and 3, point 2), adding a significant amount of sediment into the mudflow. The sediments are mainly associated with glaciolacustrine deposits (easy to mobilize) and ancient alluvials present in the valley and on the river walls.
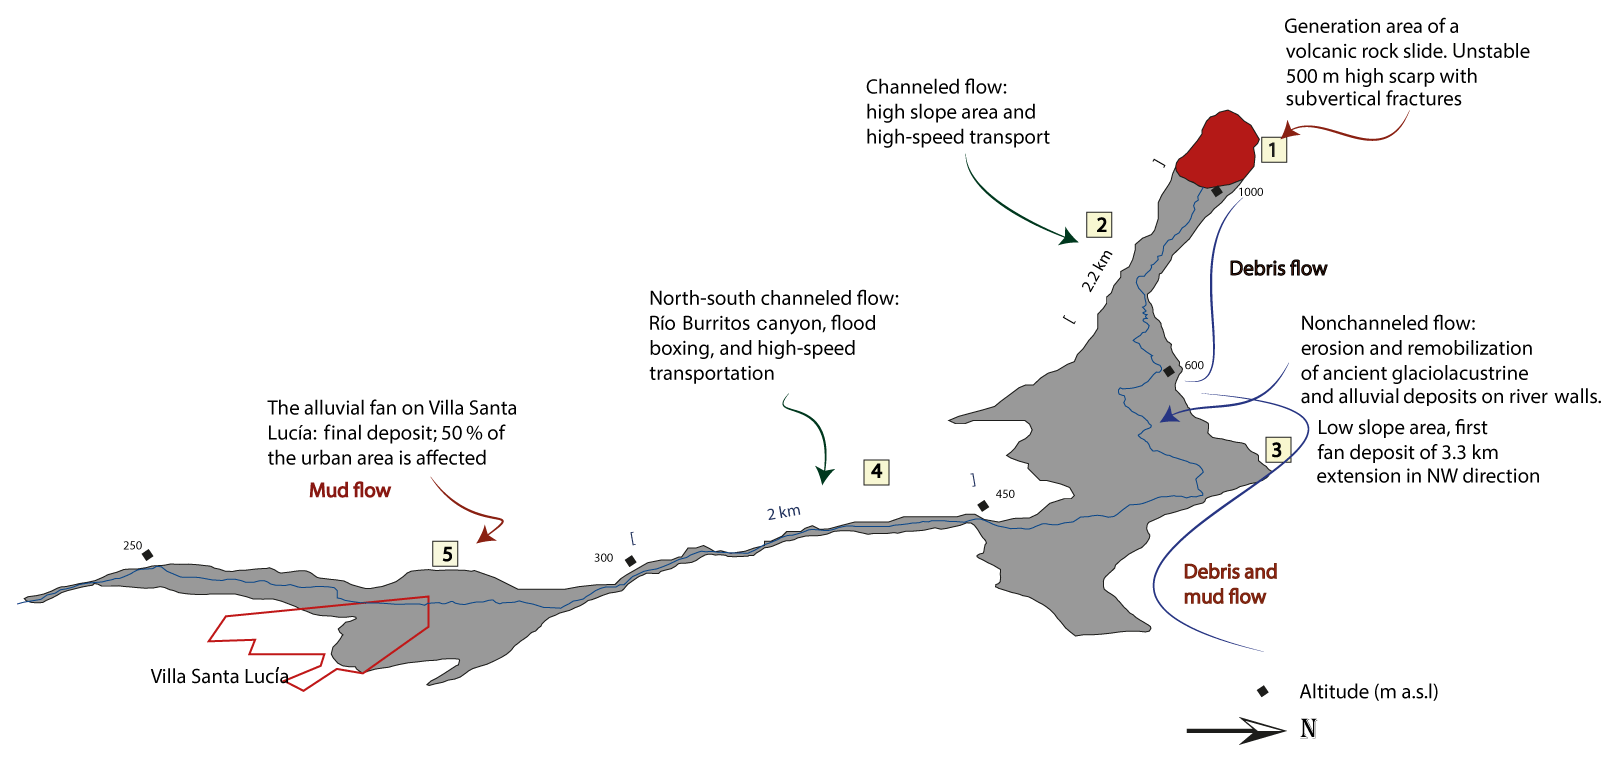
Figure 3Flow trajectory scheme and details of the five key sections identified by Sernageomin and our fieldwork.
Additionally, the soil was almost saturated, which added water to the mix, transforming the landslide flow into a mudflow. Moreover, a dense forest was present, which added a significant amount of biomass to the mix. Then the mudflow reached an area with low slopes at a distance of 8.6 km from its origin through the Río Burritos to the east. In its trajectory, the mudflow crossed Route 7 (Carretera Austral) in a stretch estimated to be 2 km long and filled an old wetland. In that sector, the flow was channeled in a canyon oriented north–south toward Villa Santa Lucía in a section of 1.5 km (Figs. 1 and 3, point 4). Once the flood reached Villa Santa Lucía, it slowed down and deposited the sediment in an alluvial fan 600 to 1000 m wide with variable height between 1 and 5 m (Figs. 1 and 3, point 5). The mudflow destroyed 50 % of Villa Santa Lucía, killing 22 people and blocking two out of three accesses to the village (Route 7 and Route 235).
Through field observations, we identified five key sections that describe what happened in Villa Santa Lucía (Figs. 1 and 3).
-
Generation area: it has a range of peaks between 1000 and 1400 m a.s.l., with the main escarpment 900 m long and 520 m wide. The north wall has maximum slopes between 77 and 81∘ (Figs. 3 and 4a).
As a result of the chain processes, the material deposited acts as a dam, creating two small lakes. The largest lake has a length of 180 m and an average width of 50 m (Sernageomin, 2018).
-
Channeled flow: this corresponds to the upper segment at the foothills; the flow is channeled and travels 2 km. The flow width was between 200 and 400 m wide. Using photointerpretation of the digital elevation models (DEMs; SAF, 2017) and aerial photos, Sernageomin personnel (Sernageomin, 2018) estimated an approximate wave 20 m high (Figs. 3 and 4b).
-
Nonchanneled flow: this section has a length of 2.3 km in a west-to-east direction until the Río Burritos changes its orientation to a north–south direction. The elevation goes from 600 to 380 m a.s.l. The slopes decrease, slowing down the flow which deposited sediments. The nonchanneled flow width reaches 1.4 km. In this sector, the flow goes over the road (Carretera Austral), 1.3 km to the east, affecting an old wetland (Figs. 3 and 4c and d).
-
North–south channeled flow: the flow descends through the enclosed channel at the Río Burritos canyon from 380 to 250 m a.s.l. on a 2 km long section (Figs. 3 and 4e and f).
-
The alluvial fan on Villa Santa Lucía: due to the loss in confinement, the flow expands 600 to 1000 m with a radial distribution in a southeast–southwest direction (Figs. 3 and 4g and h).

Figure 4(a) Area of slope failure slide and deposit; (b) channeled flow at the foothills; (c, d) aerial photo of nonchanneled flood deposited in an old wetland captured with an Inspire II UAV; (e, f) photos of the channel in the last section before entering Villa Santa Lucía: (e) captured with an Inspire II UAV and (f) picture of the channel facing downstream. (h, i) Villa Santa Lucía after the mudflow (from Sernageomin, 2018).
In addition, Sernageomin (2018) estimated the volume of material mobilized during the event using DEMs created from photointerpretation of the orthomosaic provided by SAF (2017). Sernageomin (2018) identified the release and the intrusive formation before the mudflow started. They compared digital elevation models (Intermap and SRTM 30) before the event with the DEM created by SAF (2017) estimated a volume of 7 200 000 m3. Likewise, they estimated that approximately 2 200 000 m3 of sediments were deposited in the upper part of the basin and that approximately 5 000 000 m3 were the contribution to the flow.
The speed of the flow at the Río Burritos canyon (Fig. 4e and f) and at the beginning of Villa Santa Lucía when the flow opens (Fig. 4g and h) is approximately 20 m s−1 (Sernageomin, 2018).
3.1 Fieldwork, topography, and soil characteristics
A fieldwork campaign was carried out in January 2019 to map in high resolution the area using an unmanned aerial vehicle (UAV). We used aerial photogrammetry to produce a high-resolution DEM for some parts of the study area. Aerial photogrammetry creates 3D models from 2D images, obtaining geometric characteristics of the objects they represent. We used an Inspire II UAV with a Zenmuse X4 camera to capture aerial photos (Fig. 5). We did not have differential GPS during this survey to take control points to correct the DEM generated. Therefore, we just used this DEM to corroborate that the DEMs with lower resolution and that were freely available were able to capture specific features such as canyons or small changes in slopes that could affect the hydrodynamic simulation and the path of the flood. We also generated a high-resolution mosaic to observe details of the mudflow deposition to improve the delimitation of the affected area. We used the software Agisoft PhotoScan Professional 1.4 desktop to process the images. The software performs the reconstruction of images by spatial coincidence among the elements represented in each image.
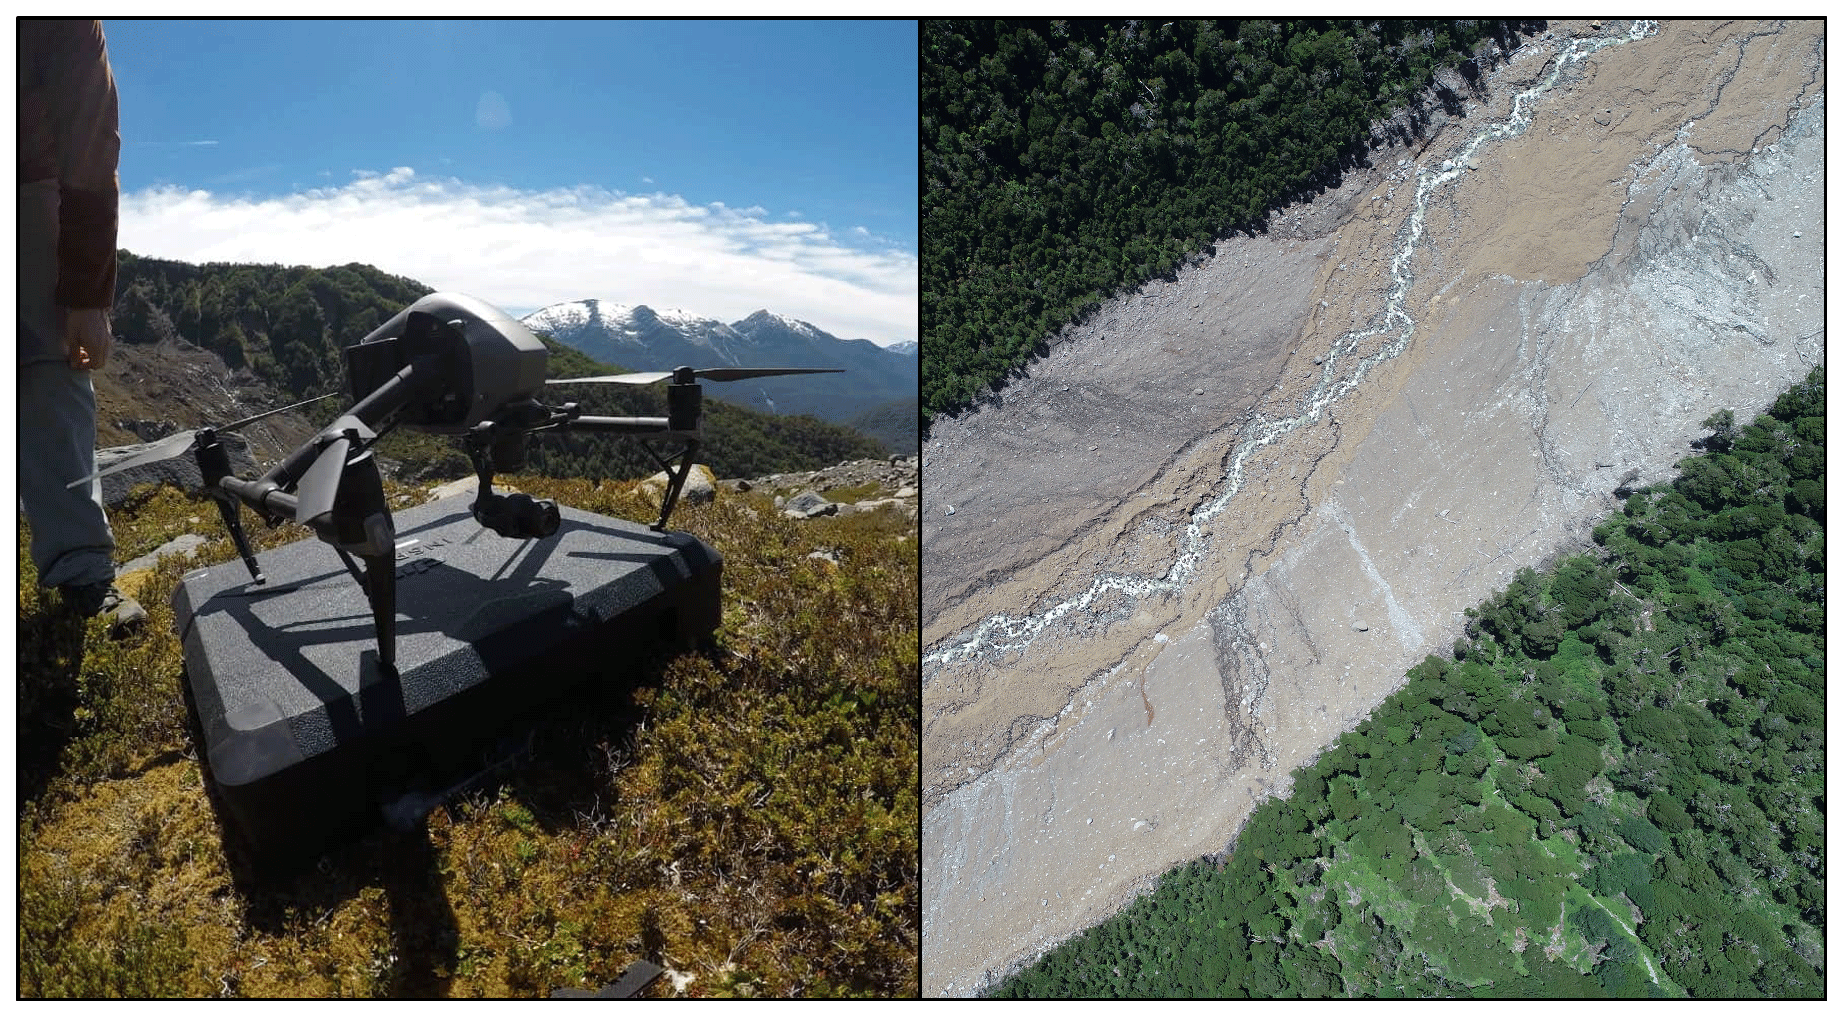
Figure 5UAV mapping survey.
In the study area, we have two freely available DEMs: the Shuttle Radar Topography Mission (SRTM) DEM of 30 m resolution and the ALOS-PALSAR DEM of 12.5 m spatial resolution. Alganci et al. (2018) and Caglar et al. (2018) compare these two DEMs and other global products, concluding that ALOS-PALSAR has fewer errors. Therefore, we used it for numerical simulation. We resampled the resolution of ALOS-PALSAR to 30 m to speed up the simulations.
3.1.1 Geotechnical sampling
It was not possible to carry out the extraction of unaltered geotechnical samples from the upper part, mainly due to the 5 km of steep terrain, including a section that needed to be climbed to transport the material by foot. However, we extracted soil samples in the middle-low part of the first section of the flow (Fig. 6). The geotechnical soil sample represents the material added to the mudflow during the event. Therefore, the soil properties become relevant to reproduce the mudflow flow of Villa Santa Lucía.

The tests performed to determine the geotechnical properties of the primary materials were a direct shear test, unconfined compression, density, and soil classification following the American Society of Testing Materials ASTM D3080 (ASTM, 2017a). The parameters obtained in each laboratory test serve as constraints for the numerical modeling of the mudflow of Villa Santa Lucía.
For the soil moisture, a wet portion of the soil was extracted and allowed to dry in an oven at 60 ∘C for 2 d. We then estimated mass soil water content (by weight) using the relation 1.96 gwater∕gsolid.
Then, a fraction of the soil sample was covered with paraffin to seal all pores and thus determine its density through the submerged weight difference. The wet soil density was 1.24 g cm−3, and the dry soil's apparent density was 0.419 g cm−3. The specific weight Gs was 2.65 g. Therefore, the void ratio was 5.324. Using these values, it turned out that the soil porosity was 84.18 % and the water saturation of the soil sample 97.4 %; therefore, 81.95 % of the total unaltered soil volume corresponded to water.
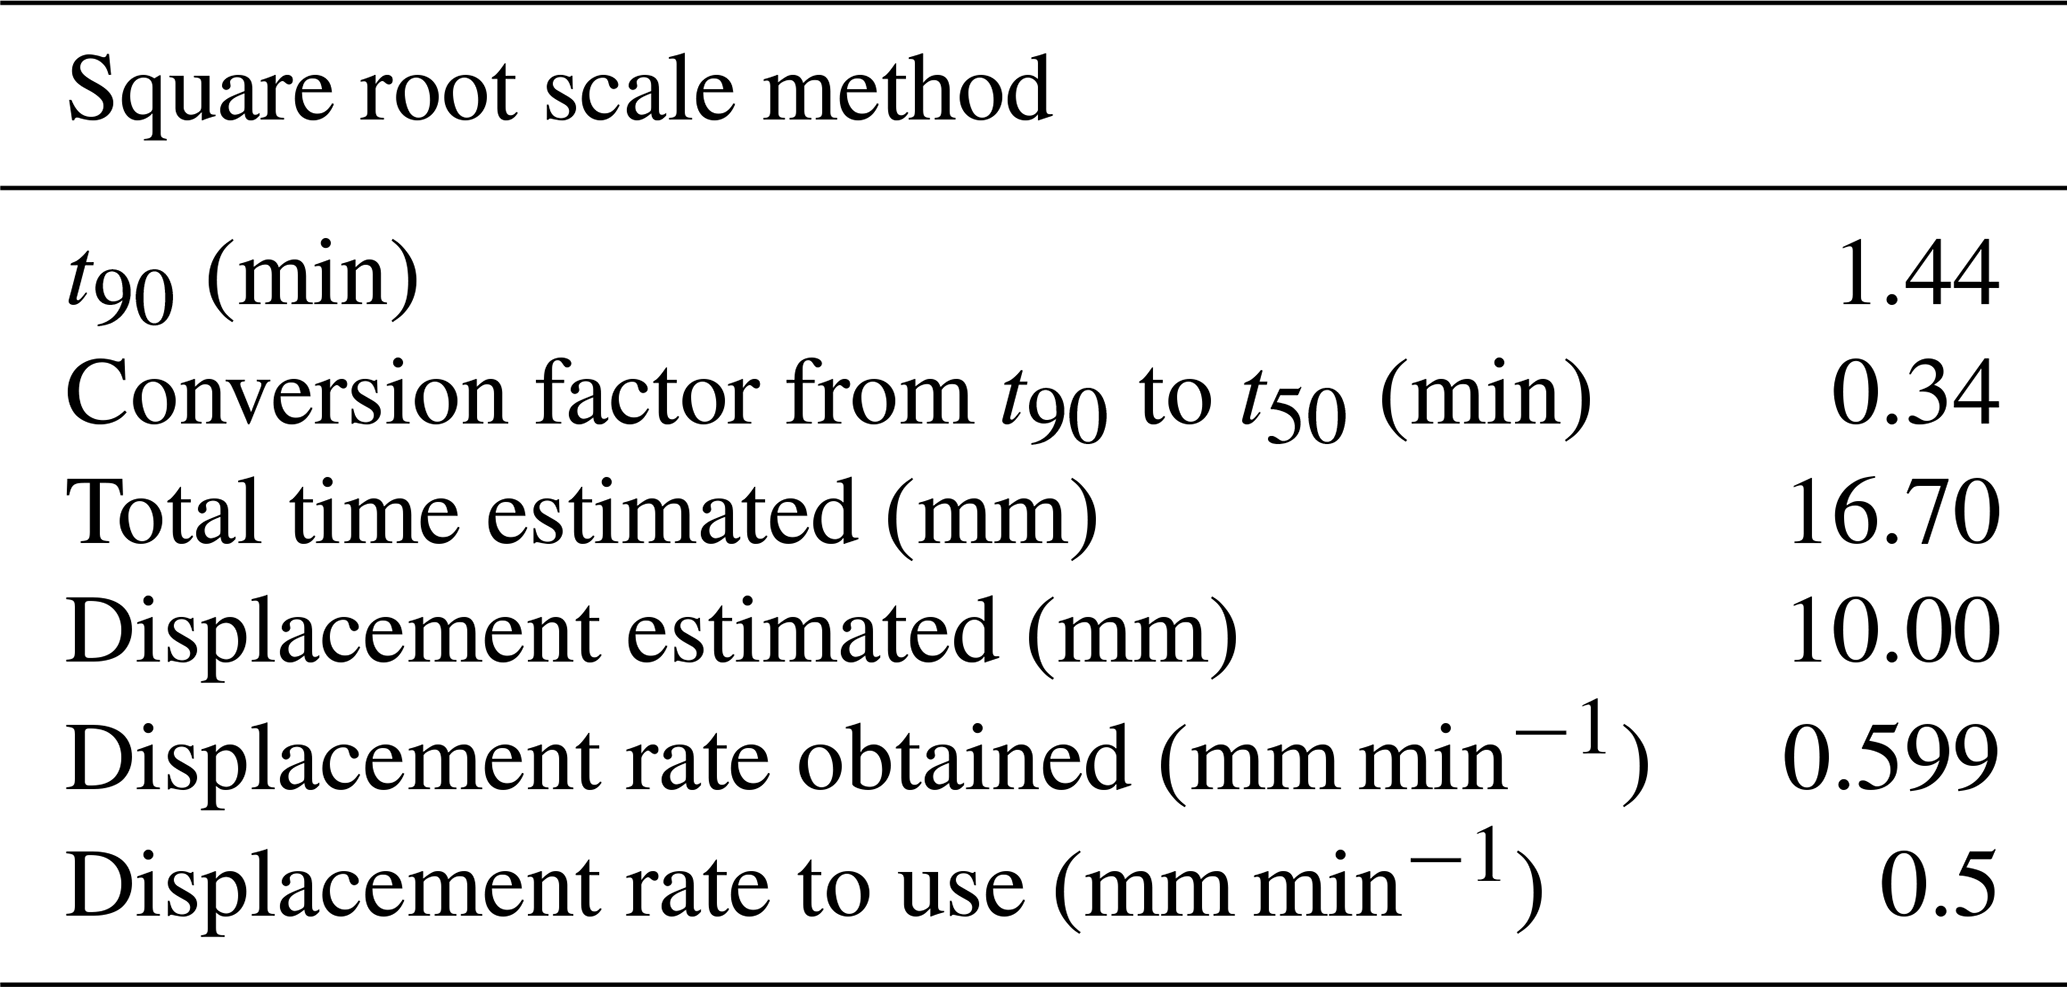
Then a direct shear test was performed in three probes. Each probe was loaded with 2, 4, and 8 kg, respectively, allowing them to consolidate for 24 h. We recorded the deformations versus time in the first sample to determine the speed for the direct shear test using the square root scale method (Table 1).
Finally, we estimated a cohesion value of 22.5 kPa and an internal friction angle of 23.8∘.
3.1.2 Soil classification
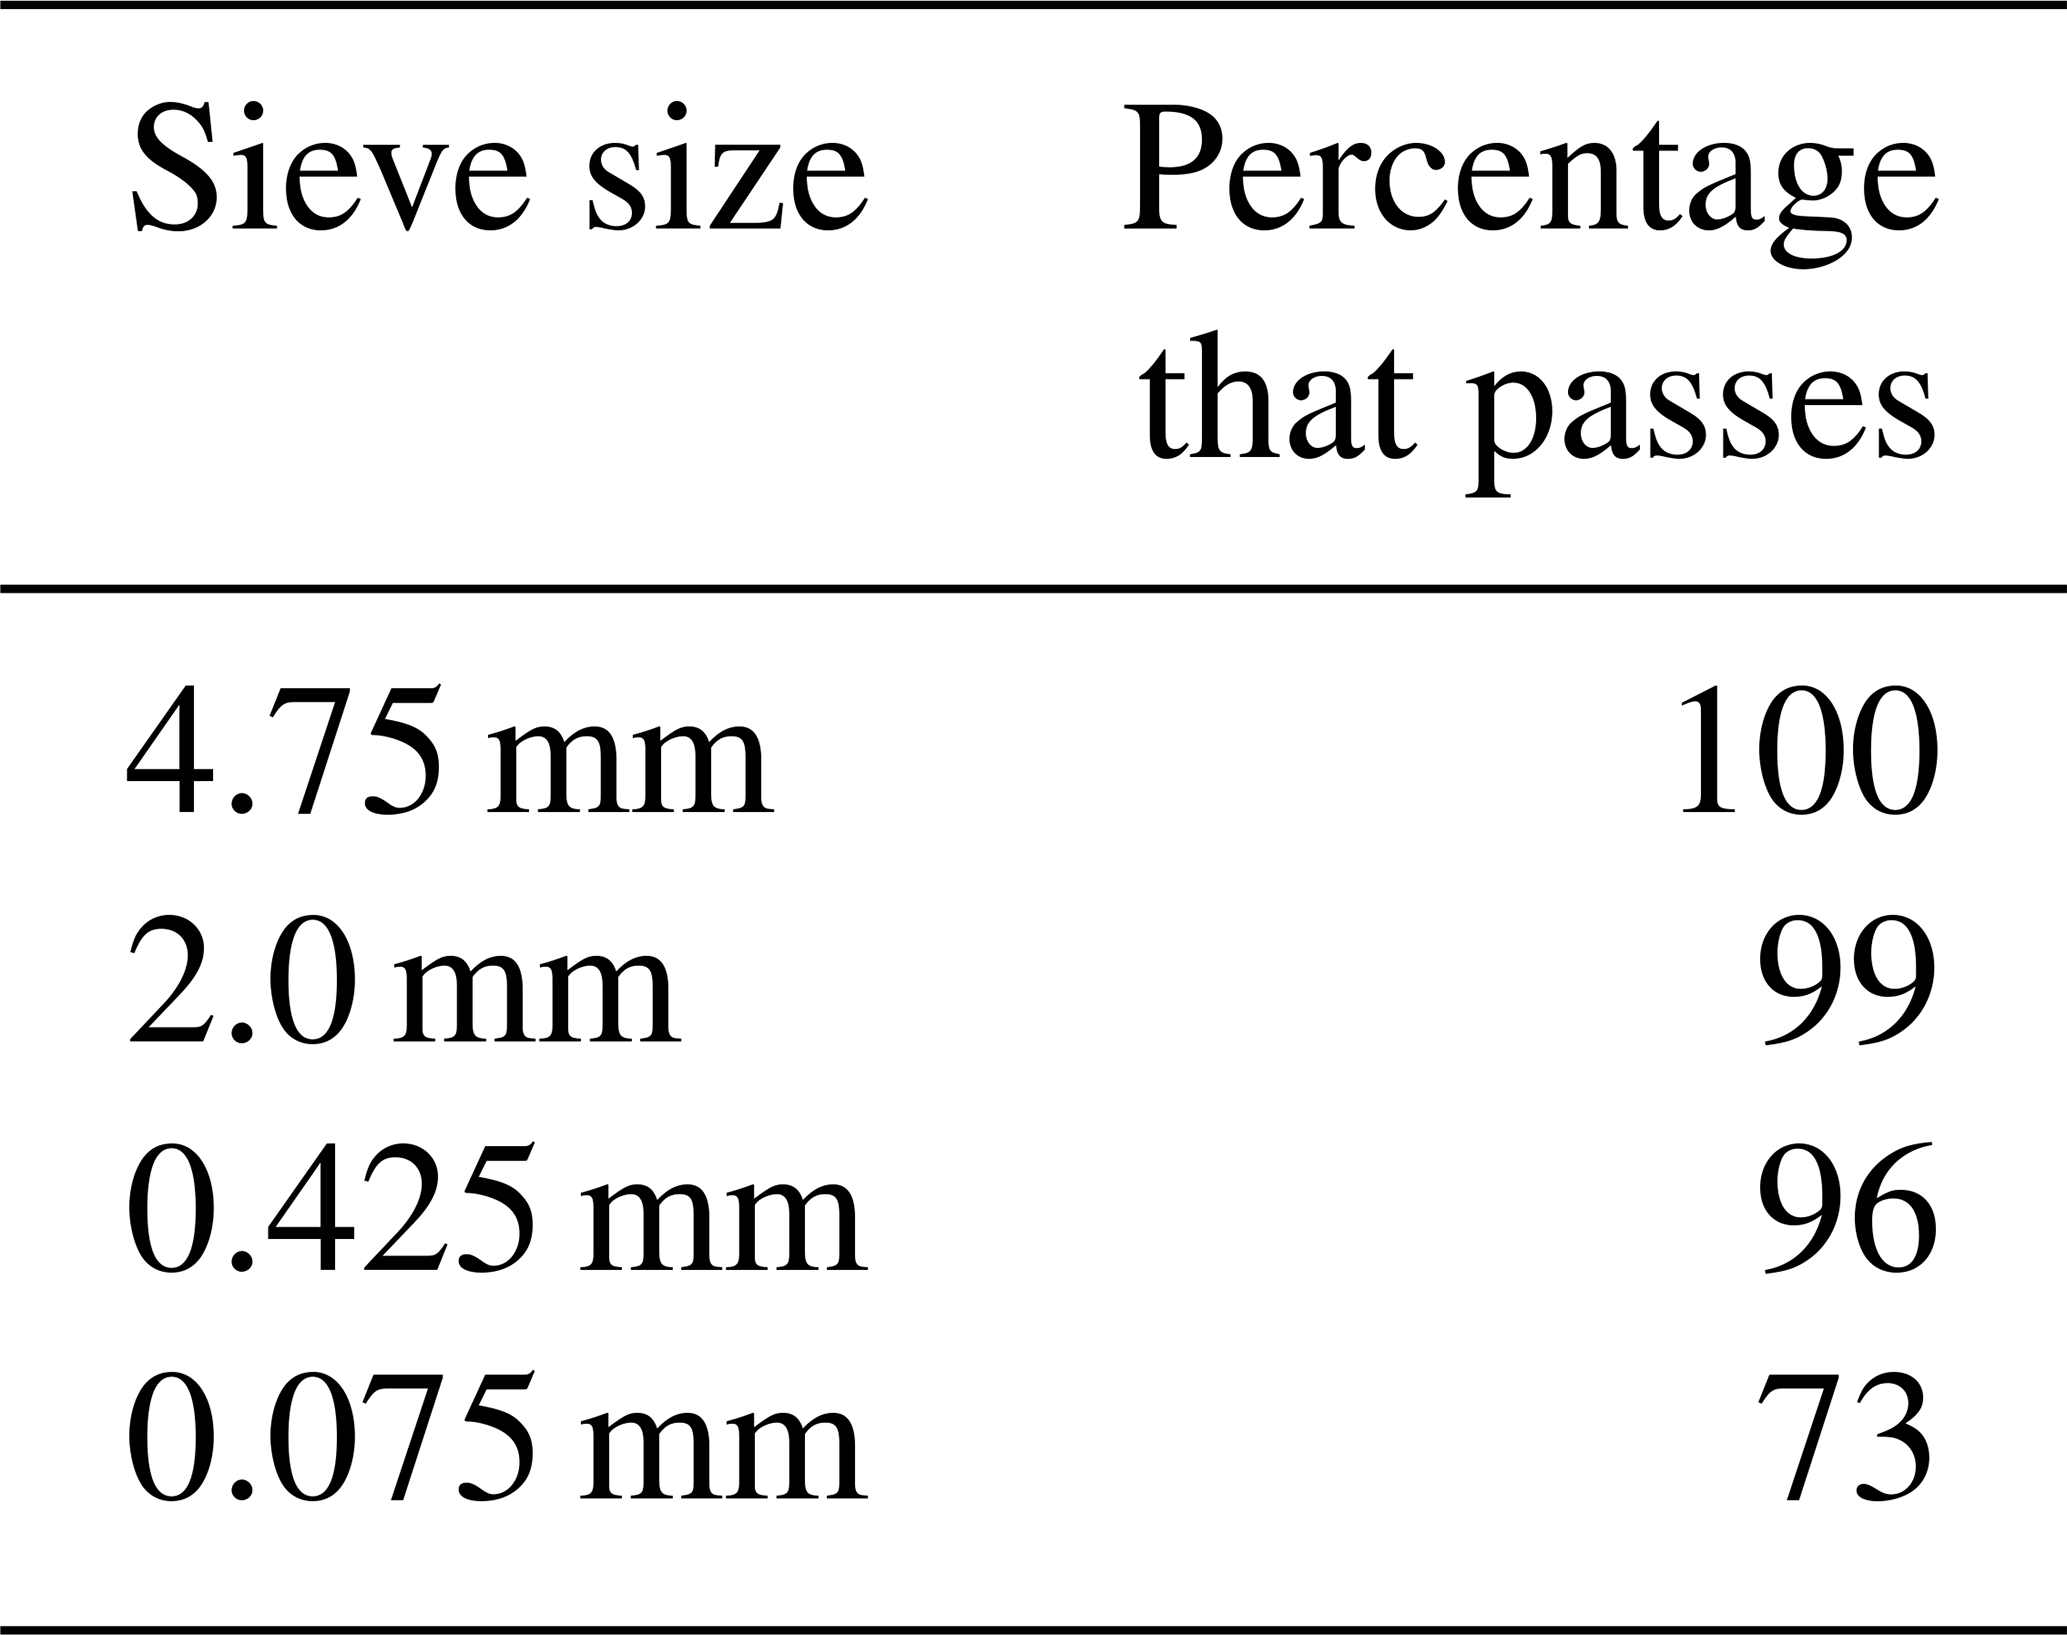
In order to carry out the classification of the soil, we used two tests. First, we determined the soil granulometry using the American Society of Testing Materials ASTM D2487 (ASTM, 2017a), and then we determined soil consistency limits (liquid and plastic) using the American Society of Testing Materials ASTM D4318-17e1 (ASTM, 2017b). For the granulometry, Table 2 shows what percentages pass through the different sieve sizes. We omitted the larger sieves since 100 % of the material passed through them.
Finally, the liquid and plastic limits of the soil are 50 % and 27 %, respectively. According to the Unified Soil Classification System (USCS) classification, the soil corresponds to a CH, an inorganic clay of high plasticity, whereas for the American Association of State Highway and Transportation Officials (AASHTO) classification, it is considered to be clay.
3.2 Numerical modeling
The modeling of the mudflow was carried out using two pieces of software: r.avaflow and Flo-2D, which we describe below. According to the antecedents of the event, the landslide fell on the intrusive formation. A fraction of the material stayed deposited between the glacier and the intrusive formation. The difference (about 5 million m3 of sediment) continued downstream, initiating the scouring process and mudflow that led to the Villa Santa Lucía event. Therefore, the domain of the models starts at the base of the intrusive formation with an initial volume of 5 000 000 m3.
3.2.1 r.avaflow
The software r.avaflow is an open-source model that offers a practical, innovative, and unified solution to simulate granular and debris flows produced in high mountains around the world. The model can handle rapid mass flows, including avalanches and two-phase flows (Mergili and Pudasaini, 2019). It calculates the propagation of mass flows from one or more given release areas on a defined baseline topography until (i) all material has been stopped and deposited, (ii) all the material has left the area of interest, or (iii) the maximum simulation time has been reached. The r.avaflow software is developed in two formats for its environment and operation, r.avaflow expert and r.avaflow professional. The latter is an autonomous version with reduced functionalities. It operates through a graphical user interface (GUI). In this study, we used the professional version (Mergili et al., 2017). This model represents a complete open-source computational framework based on a geographic information system (GIS) that offers a two-phase flow model. The entrainment of material along the flow path was also considered. These characteristics facilitate the simulation of complex mass flows as well as chained processes and interactions.
For the propagation of the flow, we used the Pudasaini model (Pudasaini, 2012), which is a two-phase mass flow model. Solid and fluid materials can be dragged from the bottom and incorporated into the flow. The r.avaflow output consists mostly of raster maps of solid and fluid flow heights, velocities, pressures, kinetic energies, and scoured heights.
3.2.2 Flo-2D
Flo-2D is a two-dimensional finite-differences model (FLO-2D, 2018; O'Brien and Zhao, 2004) that simulates non-Newtonian flow. The model creates simulations in complex topographies, urbanized areas, and floodplains, allowing fluid exchange between the channels and the floodplain. It can model water flows, hyperconcentrated sediment flows, and mudflows (FLO-2D, 2018; O'Brien and Zhao, 2004). The input data required are a digital topography of the land, the geometry of the channel, estimated values of the channel roughness and the flood plain, liquid and solid inputs, precipitation, and rheological properties of the water–sediment mixture. The software calculates the surface flow in eight directions, considering the conservation of the mass. It uses a variable time step by increasing and decreasing the scheme that incorporates efficient numerical stability criteria (FLO-2D, 2018). The rheological model used in Flo-2D is based on the work of Julien and Lan (2007), O'Brien et al. (1993), and O'Brien and Julien (1988), which describes the dynamic viscosity and the shear stress of the mixture as an exponential function of the sediment content (FLO-2D, 2018).
3.2.3 Model calibration
For the calibration of the models we used a trial-and-error approach seeking too match the following three pieces of data available from Sernagomin: (1) inundated area, which was mapped after the event using aerial imagery (SAF, 2017); (2) flow heights estimated by Sernageomin in Villa Santa Lucía and at the beginning of the canyon; and (3) flow velocities in the canyon curve and at the beginning of Villa Santa Lucía (Fig. 7). See Table 3 for the values.
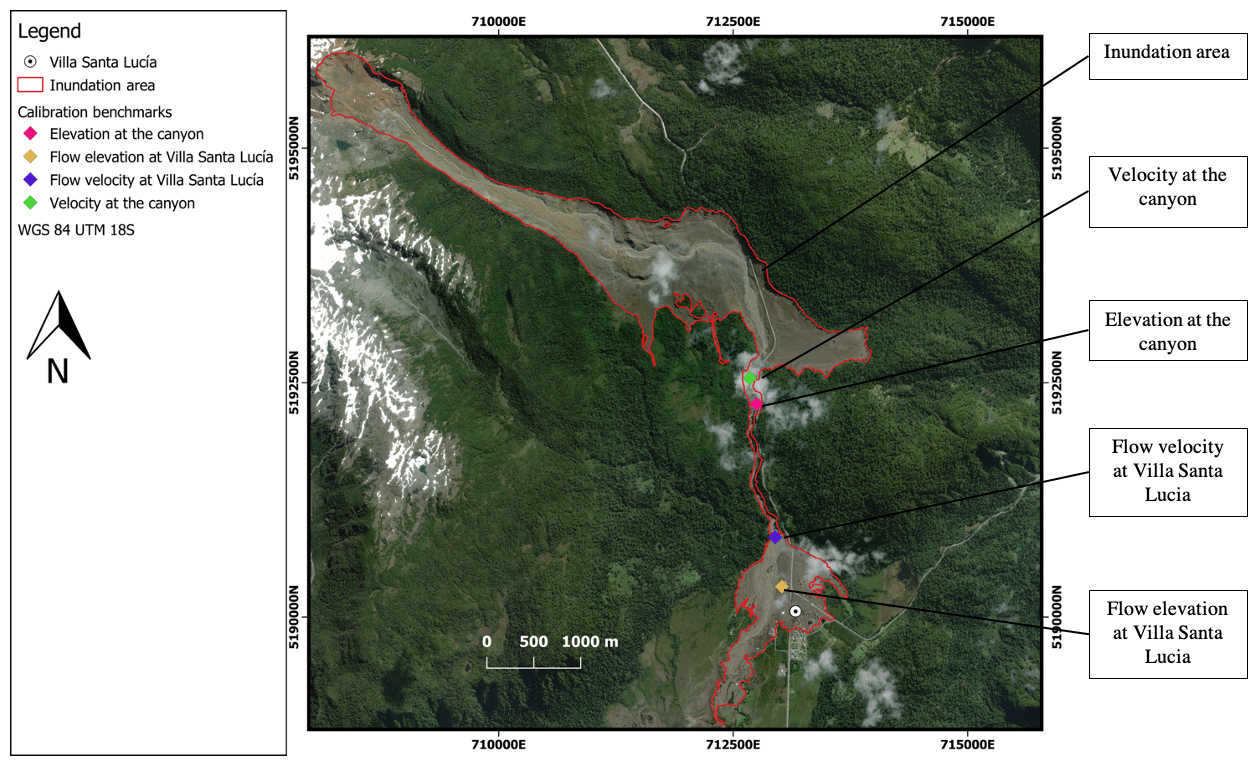
Figure 7Location of the parameter estimation for the calibration of the models (background © ESRI).
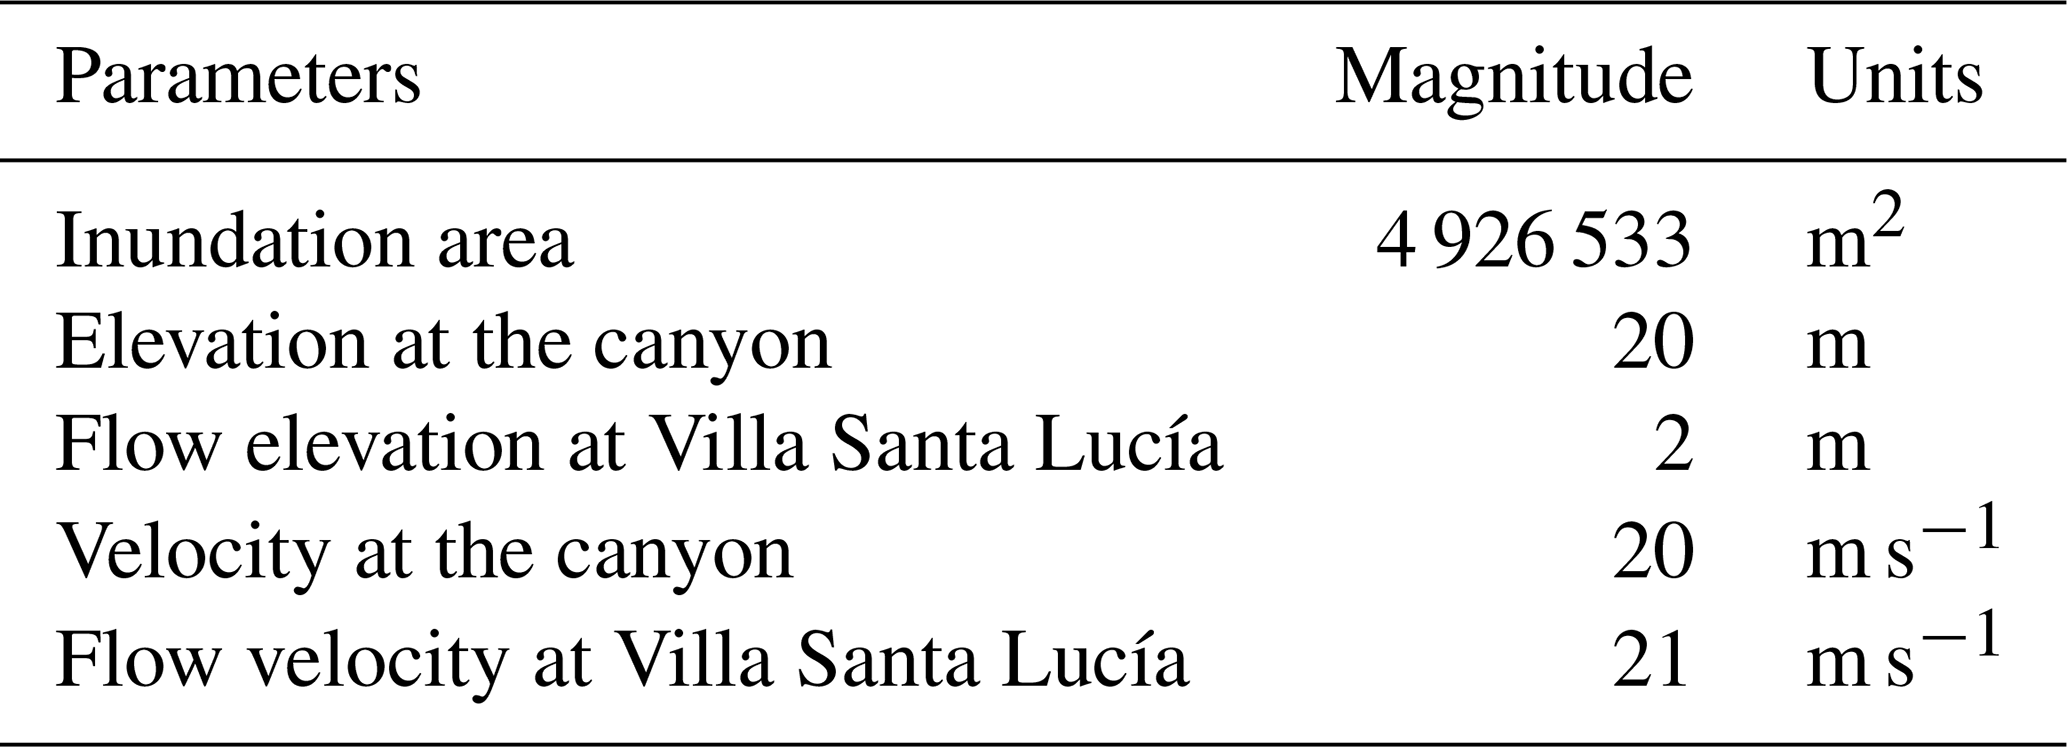
To define the model that best adjusts to Sernageomin's estimations, we calculated the standard deviation from the modeling results and the parameters from Table 3. The parameterization of the model with less standard deviation is considered the best parameterization for the particular software used.
4.1 r.avaflow
To simplify the calibration, we divided the process into two. First, we set the sediment concentration by volume of the mudflow at 50 % and changed the entrainment coefficient, basal friction angle, ambient drag coefficient, and fluid friction coefficient. For the description of the parameters in r.avaflow see Mergili et al. (2017). Table 4 shows the first set of parameters used.
The best set of parameters is 10−5.75, 2, 0.022, and 0.0005 for the entrainment coefficient, basal friction angle, ambient drag coefficient, and fluid friction coefficient, respectively, and the corresponding map result is in Fig. 8.
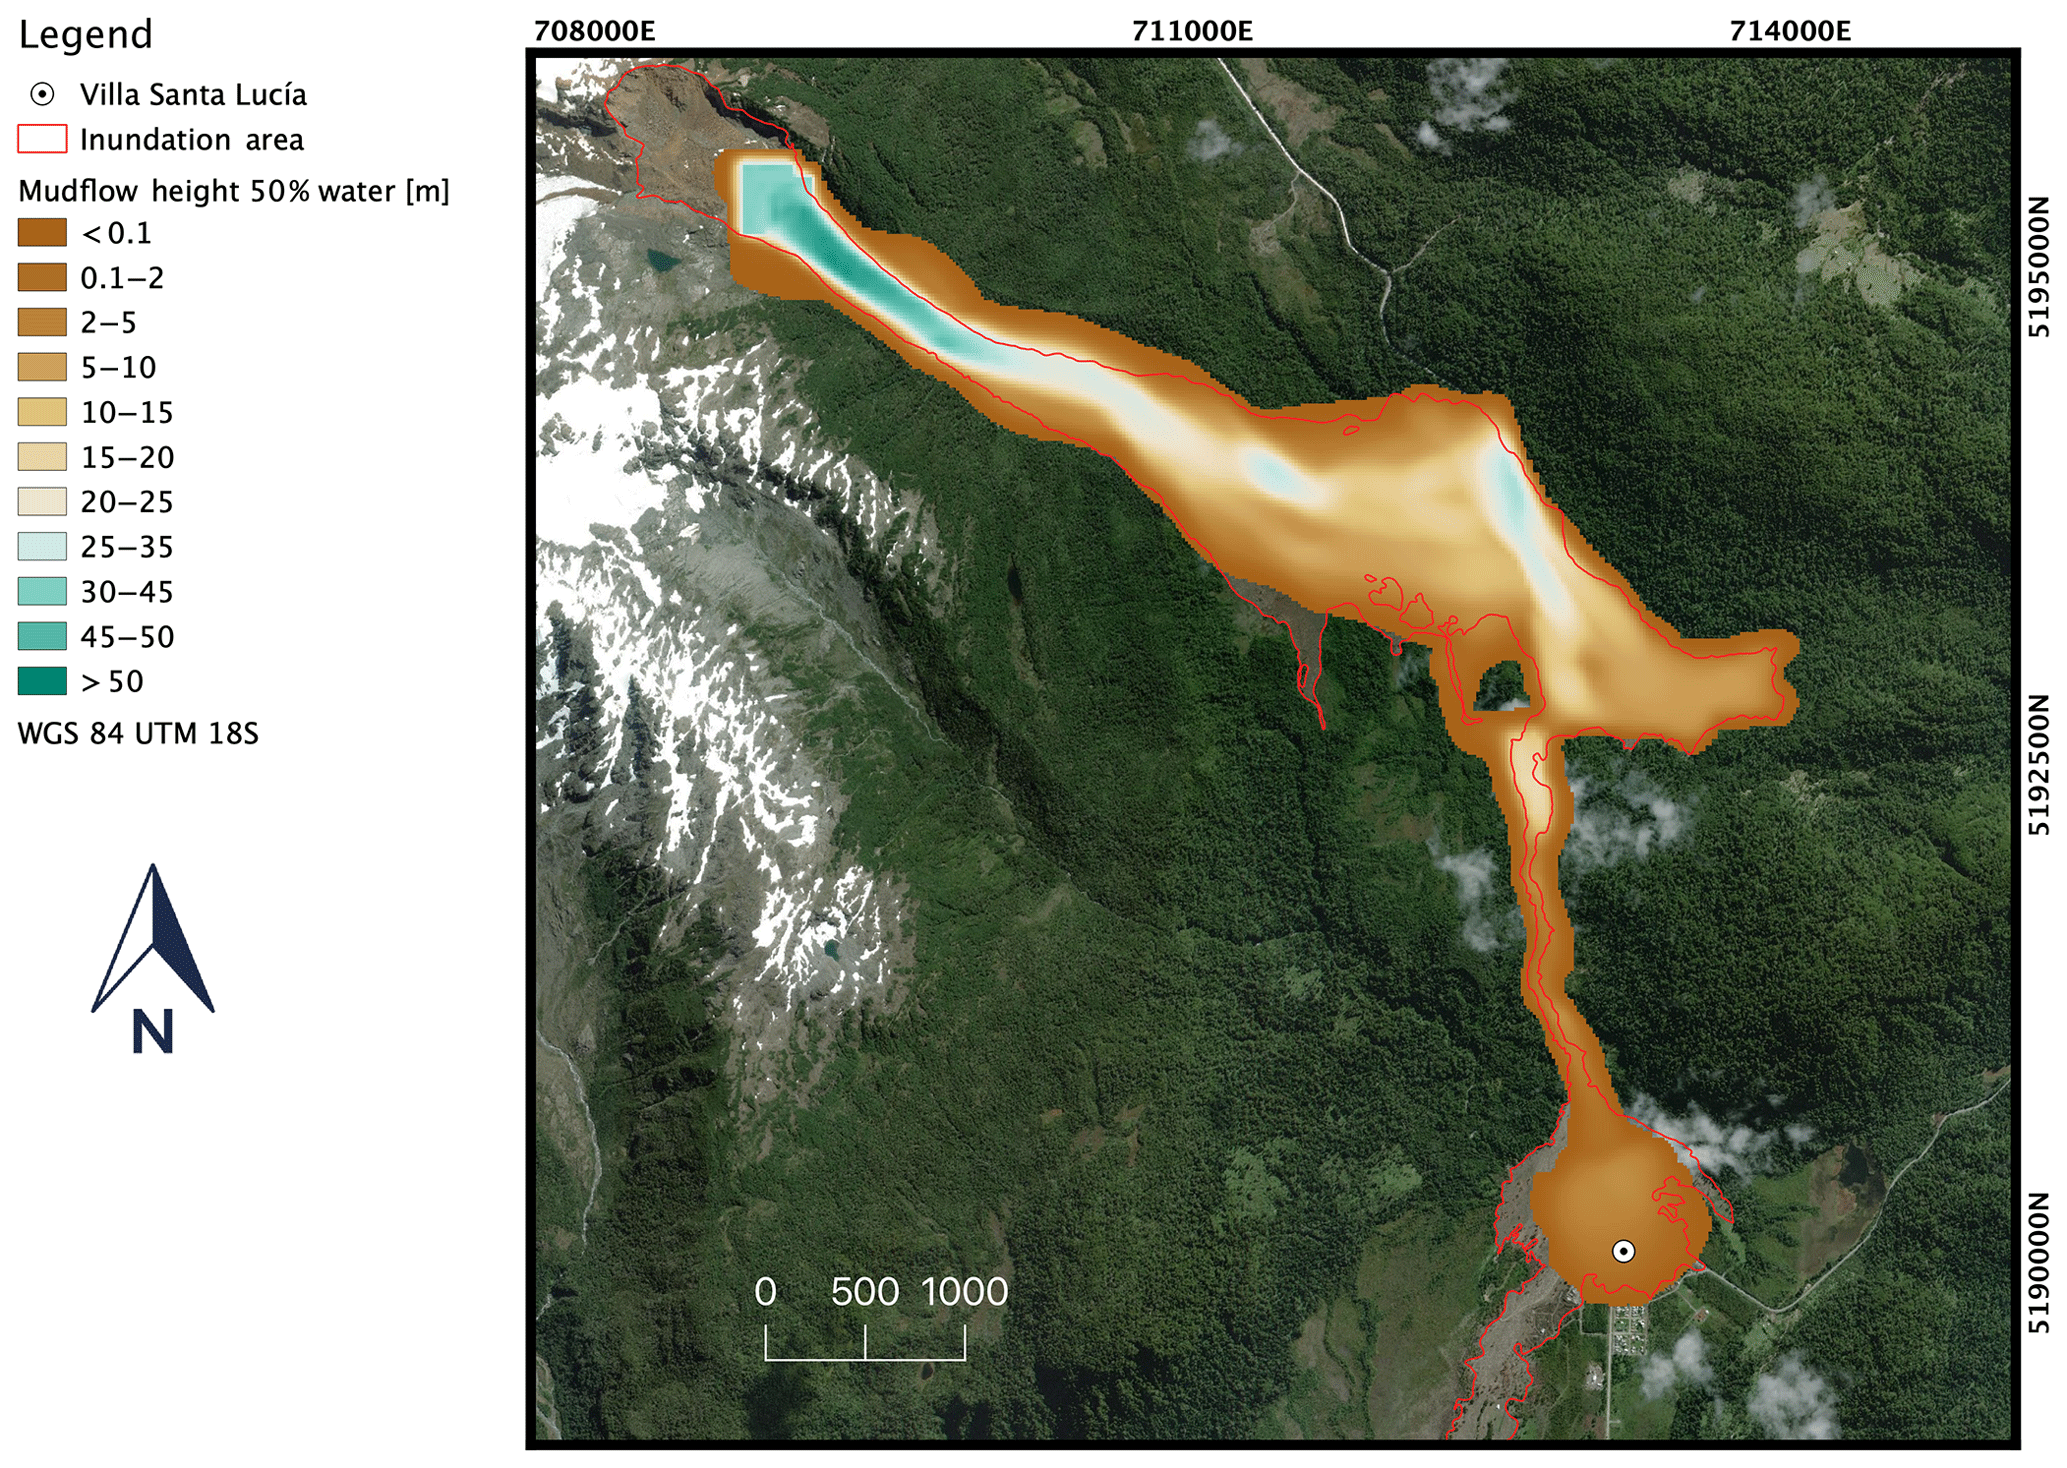
Figure 8Model results of r.avaflow for a concentration by volume of 50 % (background © ESRI).
Figure 8 shows good agreement with what was reported by Sernageomin (2018). However, the mixture is still largely fluidized, and it does not follow the edges of the inundation. For this reason, we performed simulations with the same input parameters but a varying percentage of initial water. We varied the percentage of water between 20 % and 70 %. The error for the heights and speeds calculated in each model is in Fig. 9. Therefore, we propose that a mudflow with a 30 % water volume could best reproduce the Villa Santa Lucía event (Fig. 10).
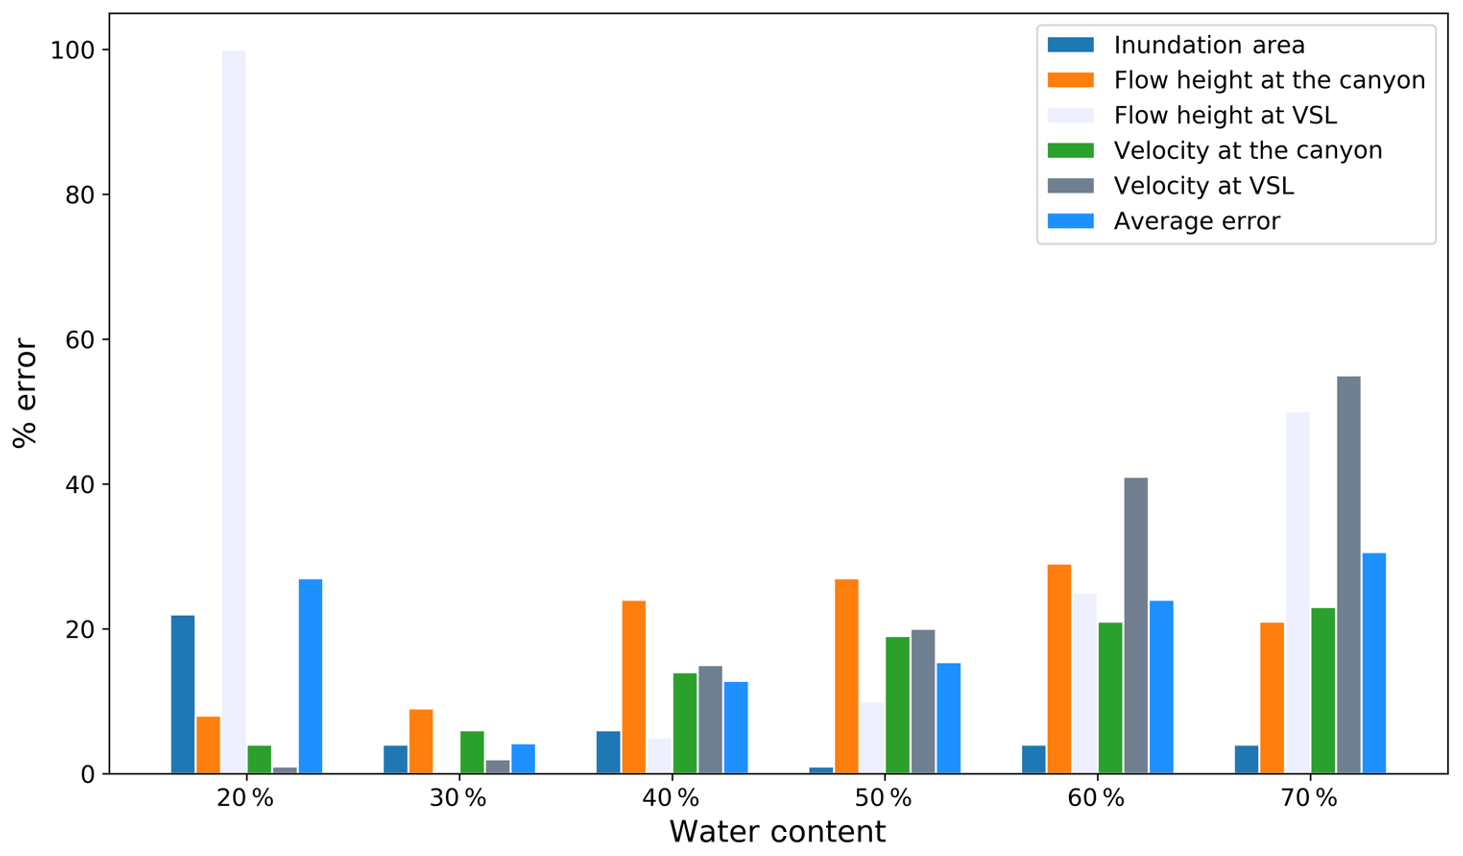
Figure 9Error obtained with different water content and the best set of parameters obtained in the first calibration (VSL: Villa Santa Lucía).

Figure 10Simulation results using the calibrated parameters for r.avaflow and 30 % water content (background © ESRI).
4.2 Flo-2D
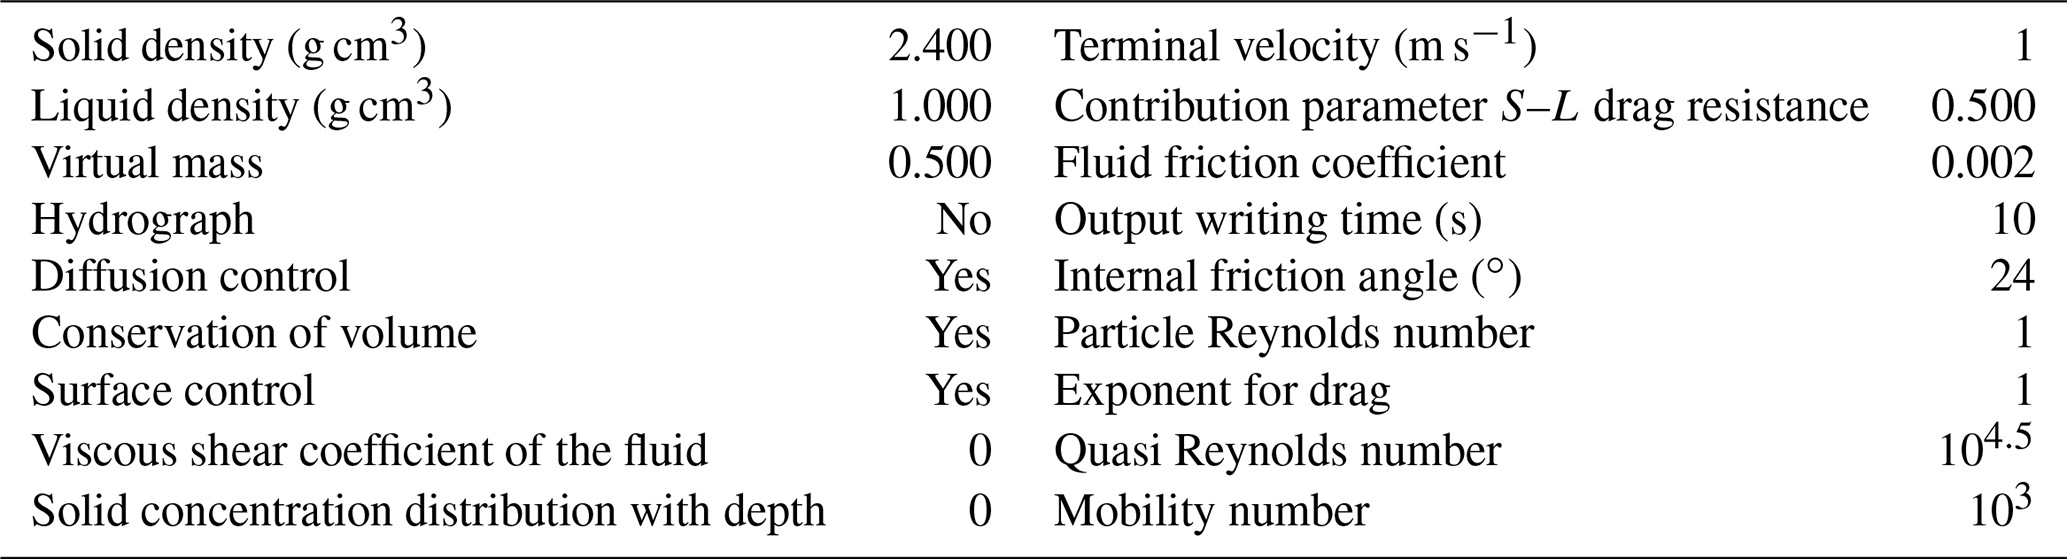
The main results from Flo-2D for the mudflow flow in Villa Santa Lucía are presented below. For the laminar resistance k, we used the default number 3000. The influence of the value of k does not affect simulations significantly compared to other parameters related to flow resistance (Hsu et al., 2010). The specific gravity of sediments Gs is equal to 2.65 g cm−3. For the sediment concentration by volume, we used values between 40 % and 50 %, which correspond to mudflow flows. The error for the heights and speeds calculated in each model is in Fig. 11. Figure 12 shows the extension of the best model using Flo-2D.
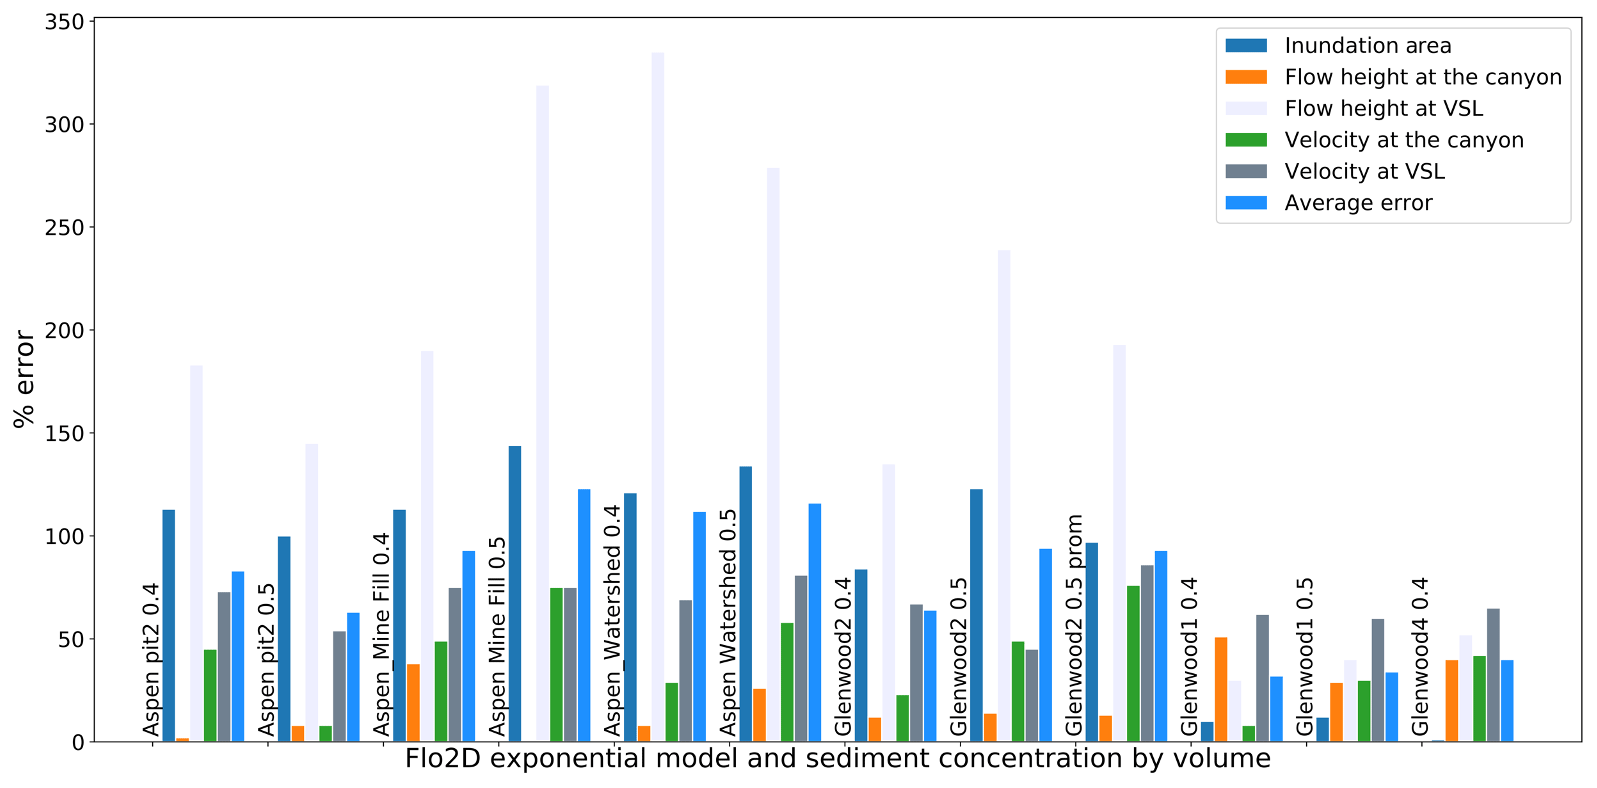
Figure 11Sensitivity analysis for different dynamic viscosity and shear stress models (VSL: Villa Santa Lucía; FLO-2D, 2018).
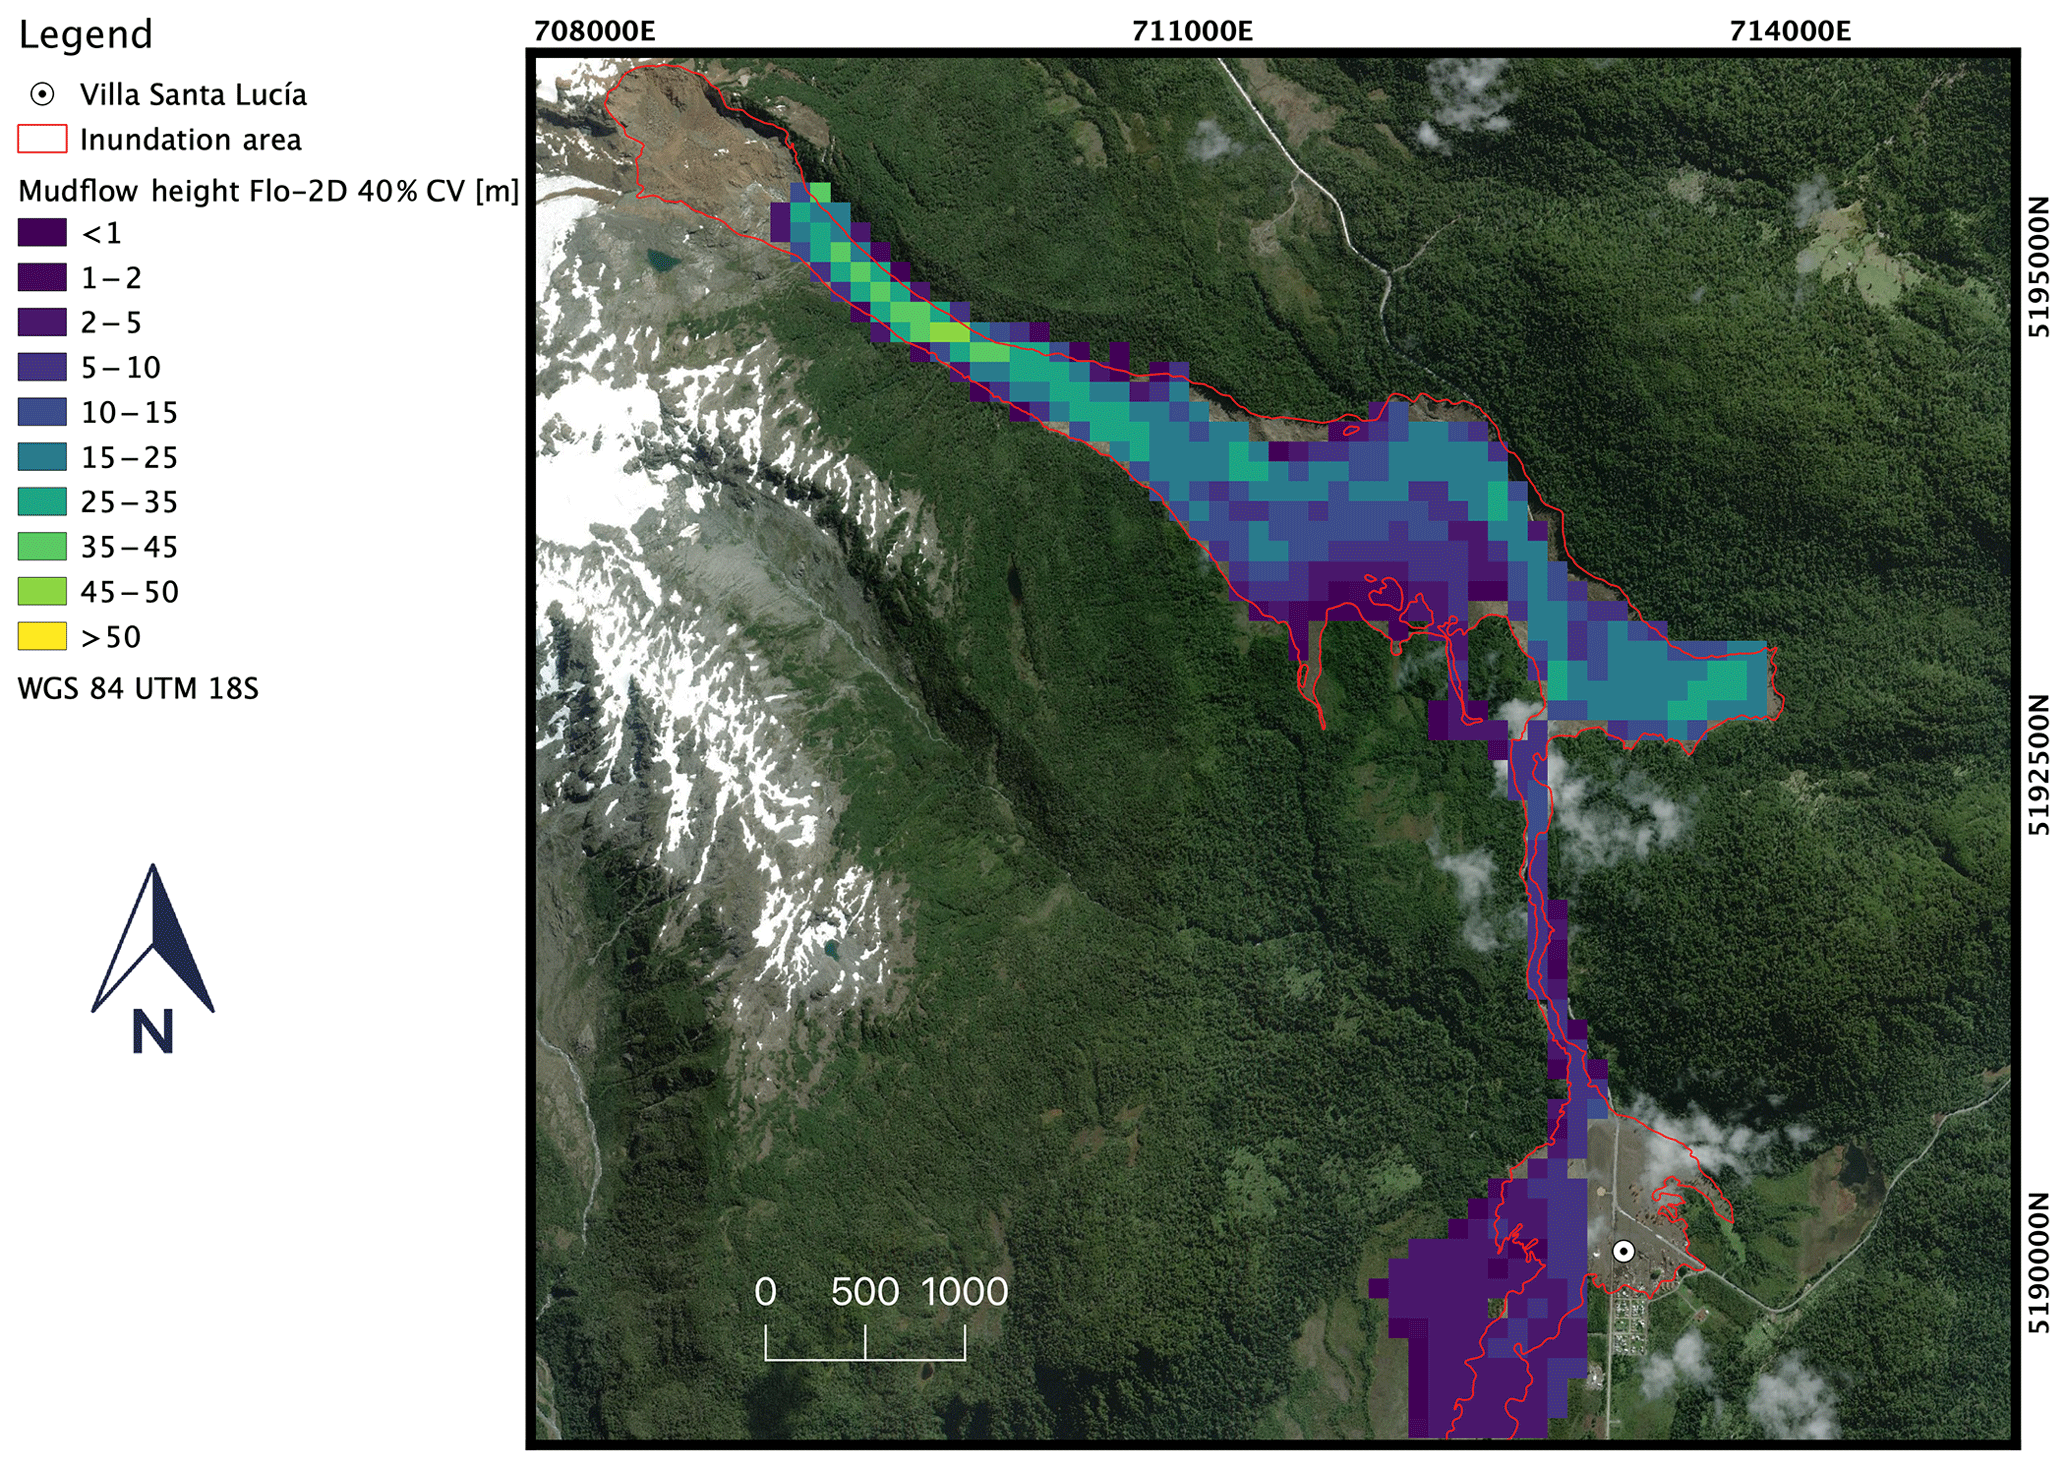
Figure 12Result for Glenwood 1 using a 40 % concentration of water by volume (background © ESRI).
5.1 Geotechnical sample
Our geotechnical data show the soil corresponds to clay with high plasticity (CH). The soil has an internal friction angle of 23.8∘ and a cohesion value of 22.5 kPa, characteristic of a consolidated clay. However, the soil extracted had various types of soils and minerals in its composition, which made this a rare soil not described or classified by the USCS.
For the granulometry, 72 % of the soil passed through sieve no. 200. Mainly sand and volcanic soils did not pass sieve no. 200. Similar results were found by Gonzalez-Pulgar (2012) in volcanic soils that have an internal soil friction angle of 25∘ and a cohesion value of 2.9 kPa. Moreover, our results were consistent with their high soil water content, greater than 150 %, and a very low dry density of solids with values between 0.4 and 0.7 kg cm−3. The values obtained by Gonzalez-Pulgar (2012) are comparable to the results of this study.
The results of the dry density and natural moisture determination tests help to ascertain the natural state of the unaltered soil sample obtained in the mudflow zone of Villa Santa Lucía. Additionally, these tests help to calculate intrinsic soil parameters, such as the relative density of solid particles (2.65 g cm−3), the void ratio, the degree of saturation, and porosity. The humidity estimated under ASTM D2216-19 (ASTM, 2019) showed a value of 195.85 % and a dry-soil density of 48.1 kPa. The soil saturation was 97.4 %. Therefore, 81.58 % of the soil volume was water.
The previous result is relevant because the liquid and plastic limits are 50 % and 27 %, respectively. These parameters indicate whether the soil has a more liquid or plastic behavior given the moisture content. Also, incorporating the moisture of the soil sample of 195.85 %, the liquidity index was determined at a value of 7. When the liquid index is higher than 1, and the soil is subjected to cutting, it has a viscous liquid behavior. Such soils can be susceptible to the collapse of the soil structure. As long as they are not altered, they can be relatively stable, but if these soils are subjected to shearing (molding), and the soil structure collapses, then they can easily flow like a viscous liquid (Holtz and Kovacs, 1981). These results show that the area downstream of the collapsed wall was prone to producing a mudflow due to the high water content, and the perturbation produced by the mudflow mobilized the soil bed, producing the mudflow flow that affected Villa Santa Lucía.
5.2 Back-calculation of the mudflow
The modeling in the r.avaflow software successfully reproduced the mudflow flow of Villa Santa Lucía. The model was able to reproduce the area affected, reference heights, and speeds during the back-calculations. Moreover, our results were highly consistent with in situ measurements 2 d after the event (Sernageomin, 2018). We ran 300 simulations to calibrate the model. We determined that the general ambient drag coefficient is the most sensitive of all since even a change of a decimal in the coefficient changed the viscosity of the flow, reducing or exaggerating the run-out. The sensitivity analysis showed that r.avaflow is also sensitive to changes in the basal friction angle. These strongly condition the rheology of the flow, determining the height and speeds. The results obtained in the modeling in the Flo-2D software were diverse. We could not achieve the same level of r.avaflow's results. The inundation area was the most sensitive result in the concentration of sediments by volume and the rheology model selected within Flo-2D (Fig. 11). The best combination of parameters was the Glenwood 1 rheology model and a 40 % concentration sediment, which has an error of 32 %. We concluded that we could reproduce the mudflow satisfactorily using r.avaflow with water content in the mixture ranging from 30 % to 40 % (Fig. 11).
For the calibration, we calculated the standard deviation from the modeling results and the parameters from Table 3. The parameter combination that results in less standard deviation is considered the best parameterization for the particular software used. Our procedure, as described in Saltelli and Annoni (2010), corresponds to a one-factor-at-a-time type of calibration where we changed one parameter at a time manually, trying to match Table 3. The limitations of this procedure, according to Saltelli and Annoni (2010), are that its efficiency is poor, and the method does not capture the interaction of the factors because that would require the movement of more than one element at a time. Therefore, the approach assumed that all the variables are independent, and the processes are linear, which is not usually the case. Another limitation of our calibration is the potential presence of equifinality. We did not test whether different combinations of parameters would provide similar performance. We selected the best combination of parameters without checking the degrees of freedom that these variables may have had to replicate the observations (Beven, 1996).
5.3 Source of water
From the observation and information provided by Sernageomin, our soil sample analyses, and numerical simulation, we found that the primary source of water was in the soil. Our analyses determined that in the area scoured, the soil has a porosity of 84.18 %. Similar values were reported by Cuevas et al. (2013) in volcanic soils in the south of Chile. From our observations, we also noticed the ground is saturated all the time. We did fieldwork after a couple of weeks of no rain, and the whole area around the river was saturated; indeed, our soil sample had a saturation of 97.4 %. Therefore, using the results from r.avaflow, we estimated that a volume of 3 402 100 m3 was scoured. Consequently, there was the potential of adding roughly 2.8 million m3 of water and 600 000 m3 of soil, which turned into a mudflow due to the water added to the event. Additionally, extra water not quantified in this study was added from the ice pieces that detached from the glacier and were carried by the landslide first and the mudflow later.
Our results highlight the importance of considering the potential chain of events in risk analysis and hazard mapping. In the practice of predicting a mudflow hazard, we seek areas where evident water sources are available, such as glacial lakes. However, in this work, we showed that it is possible to have the catastrophic event that hit Villa Santa Lucía only with the water within the soil in the valleys downstream of the landslide. Additionally, the soil has a particular volcanic origin, and it is highly fluidizable under low lateral effort. This result is relevant for the Patagonia region because, in order to update the hazard maps, we need to consider not only the primary events but also the potential reactions from the downstream elements of the chain of events, which as in this case, may not be evident prior to the event.
What actually triggered the landslide event is not clear and not part of this research. We focused on what conditions in the valley enabled the landslide to evolve into a mudflow and travel all the way to Villa Santa Lucía. We have no information to guess how much water was available at the glacier terminal, so we wanted to understand whether this event was possible without a lake or large water reservoir at the glacier. Our results show that in fact the water available around the Río Burritos was sufficient to transform the avalanche into a mudflow. Our numerical models and geotechnical work show that the mudflow event was possible due to pre-existing water in the saturated soil. Geotechnical evidence demonstrates a high-plasticity soil (CH) with a low internal friction angle associated with volcanic soils of the Holocene age. Hence, weak soils are prone to mass-wasting events due to their geomechanical properties.
Given the complexity and the potential increase in future extreme-event occurrences that can trigger landslides, we suggest that hazard studies should consider the structural conditions present in the area of influence of the mudflows. Soil characteristics ought to be included because they may be a crucial factor amplifying the impacts of local events triggered by hydroclimatic events. Such was the case of Villa Santa Lucía, where the water necessary to fluidize the mudflow mixture was in the soil in a volatile system that was easy to mobilize.
The combination of geotechnical tests and r.avaflow, which is a freely available computational software, to model mudflow is useful to characterize and reproduce mass-wasting events, such as the mudflow that occurred in December 2017 in Villa Santa Lucía, in Chile. Our results present the possibility of open-source software implementation to represent mudflow events in the Patagonian Andes with a good performance. These types of studies will allow for the integration of better methodologies to enhance risk scenarios related to mudflow events in active subduction zones like the Andes.
The ALOS-PALSAR DEM is publicly accessible at https://search.asf.alaska.edu/#/?dataset=ALOS (last access: 10 January 2019) (ASF DAAC, 2015). The r.avaflow model's setup used for the simulations is available at https://doi.org/10.5281/zenodo.3998134 (Oyarzún-Ulloa et al., 2020).
JOU contributed to the conceptualization and methodology of the research and performed the formal analysis, visualization, and validation. MSV and JOU contributed most of the writing of the original draft. MSV was involved in the funding, conceptualization, and supervision as well as in the translation, review, and editing of the paper. IFT contributed with the supervision, review, and editing of the paper. NGU and NC provided input in terms of methodology and the review and editing of the paper.
The authors declare that they have no conflict of interest.
We want to thank the reviewers, Martin Mergili and Haruyuki Hashimoto, and the anonymous reviewer, whose suggestions helped improve and clarify this paper. We would also like to thank the research unit at the University of La Frontera for their support with the English review.
This study was made possible thanks to the Chilean National Agency of Research and Development (ANID in Spanish) through the Program of International Cooperation (PCI in Spanish; grant no. PII-180008) and the “Fondecyt Iniciación” program (grant no. 11170609).
This paper was edited by Daniele Giordan and reviewed by Martin Mergili, Haruyuki Hashimoto, and one anonymous referee.
Aguilera, F., Honores, C., Lemus, M., Neira, H., Pérez, Y., and Rojas, J.: Evaluación de los recursos geotérmicos de la Región de Los Lagos, Informe Registrado, Servicio Nacional de Geología y Minería, Santiago, Chile, 2014.
Aldunce, P. and González, M.: Desastres asociados al clima en la agricultura y medio rural en Chile, Fundación para la Innovación Agraria, Ministerio de Agricultura Chile, Santiago, 2009.
Alganci, U., Besol, B., and Sertel, E.: Accuracy assessment of different digital surface models, ISPRS Int. J. Geo-Inform., 7, 1–16, https://doi.org/10.3390/ijgi7030114, 2018.
ASF DAAC: ALOS PALSAR_Radiometric_Terrain_Corrected_hi_res; Includes Material ©JAXA/METI 2011, https://doi.org/10.5067/Z97HFCNKR6VA, 2015.
ASTM: D2487-17, Standard Practice for Classification of Soils for Engineering Purposes (Unified Soil Classification System), ASTM International, West Conshohocken, PA, 2017a.
ASTM: D4318-17e1, Standard Test Methods for Liquid Limit, Plastic Limit, and Plasticity Index of Soils, ASTM International, West Conshohocken, PA, 2017b.
ASTM: D2216-19, Standard Test Methods for Laboratory Determination of Water (Moisture) Content of Soil and Rock by Mass, ASTM International, West Conshohocken, PA, 2019.
Beven, K.: Equifinality and uncertainty in geomorphological modelling, in: Sci. Nat. Geomorphol. Proceeding 27th Binghamt. Symp. Geomorphol., September 1996, Urbana-Champaign, IL, 289–314, 1996.
Caglar, B., Becek, K., Mekik, C., and Ozendi, M.: On the vertical accuracy of the ALOS world 3D-30m digital elevation model, Remote Sens. Lett., 9, 607–615, https://doi.org/10.1080/2150704X.2018.1453174, 2018.
CECS: Informe glaciológico sobre el flujo de detritos que afectó Villa Santa Lucía el 16 de diciembre del 2017, Laboratorio de Glaciológia, Centro de Estudios Científicos, Valdivia, Chile, 2017.
Cuevas, J., Horn, R., Seguel, O., and Dörner, J.: Hydraulic conductivity variation in chilean volcanic soils due to wheeling and management, J. Soil Sci. Plant Nutr., 13, 756–766, https://doi.org/10.4067/S0718-95162013005000060, 2013.
FLO-2D: Reference Manual, FLO-2D Software, Inc., Nutrioso, AZ, 2018.
Gonzalez-Pulgar, C. A.: Propiedades Geomecánicas De Dos Suelos De Origen Volcánico, Universidad de Chile, available at: http://repositorio.uchile.cl/handle/2250/102764 (last access: 20 June 2020), 2012.
Hervé, F., Fuentes, F. J., Calderón, M., Fanning, M., Quezada, P., Pankhurst, R., and Rapela, C.: Ultramafic rocks in the North Patagonian Andes: is their emplacement associated with the Neogene tectonics of the Liquiñe–Ofqui Fault Zone?, Andean Geol., 44, 1–16, https://doi.org/10.5027/andgeoV44n1-a01, 2017.
Holtz, D. R. and Kovacs, D. W.: An Introduction to Geotechnical Engineering, Prentice Hall, Englewood Cliffs, New Jersey, 733 pp., 1981.
Hsu, S. M., Chiou, L. B., Lin, G. F., Chao, C. H., Wen, H. Y., and Ku, C. Y.: Applications of simulation technique on debris-flow hazard zone delineation: a case study in Hualien County, Taiwan, Nat. Hazards Earth Syst. Sci., 10, 535–545, https://doi.org/10.5194/nhess-10-535-2010, 2010.
INE: Memoria del Censo 2017 – Chile, Instituto Nacional de Estadísticas, Santiago, Chile, 2018.
Julien, P. Y. and Lan, Y.: Rheology of Hyperconcentrations, J. Hydraul. Eng., 117, 346–353, https://doi.org/10.1061/(asce)0733-9429(1991)117:3(346), 2007.
Mergili, M. and Pudasaini, S. P.: r.avaflow – The mass flow simulation tool, r.avaflow 2.0 Software 2014–2019, available at: http://r.avaflow.org/software.php (last access: 20 June 2020), 2019.
Mergili, M., Fischer, J. T., Krenn, J., and Pudasaini, S. P.: R.avaflow v1, an advanced open-source computational framework for the propagation and interaction of two-phase mass flows, Geosci. Model Dev., 10, 553–569, https://doi.org/10.5194/gmd-10-553-2017, 2017.
Nguyen, D. H., Van Nguyen, T. H., Le, Q. H., Pham, V. S., and Nguyen, H. K.: TXT-tool 2.084-3.1 Rainfall Thresholds for Triggering Geohazards in Bac Kan Province (Vietnam), in: Landslide Dynamics: ISDR-ICL Landslide Interactive Teaching Tools, vol. 1, edited by: Sassa, K., Guzzetti, F., Yamagishi, H., Arbanas, Ž., Casagli, N., McSaveney, M., and Dang, K., Springer International Publishing, Cham, 351–360, 2018.
O'Brien, J. S. and Julien, P. Y.: Laboratory Analysis of Mudflow Properties, J. Hydraul. Eng., 114, 877–887, https://doi.org/10.1061/(ASCE)0733-9429(1988)114:8(877), 1988.
O'Brien, J. S. and Zhao, B.: Real Time Rainfall-Runoff Modeling on Alluvial Fans, Floodplains, and Watersheds, in Critical Transitions in Water and Environmental Resources Management, American Society of Civil Engineers, Reston, VA, 1–9, 2004.
O'Brien, J. S., Julien, P. Y., and Fullerton, W. T.: Two-Dimensional water Flood and mudlow simulation, J. Hydraul. Eng., 119, 244–261, 1993.
Oyarzún-Ulloa, Somos-Valenzuela, and Fustos-Toribio: R.avaflow model for the VSL event, Zenodo, https://doi.org/10.5281/zenodo.3998134, 2020.
Pudasaini, S. P.: A general two-phase debris flow model, J. Geophys. Res.-Earth, 117, F03010, https://doi.org/10.1029/2011JF002186, 2012.
SAF: Aluvión NIR, SAF Fuerza Aérea de Chile, Santiago, available at: https://www.saf.cl/ (last access: 10 May 2019), 2017.
Saltelli, A. and Annoni, P.: How to avoid a perfunctory sensitivity analysis, Environ. Model. Softw., 25, 1508–1517, https://doi.org/10.1016/j.envsoft.2010.04.012, 2010.
Sernageomin: Carta Metalogénica X Región sur, Informe Registrado IR-95-05, 4 Tomos, 10 Vols., 95 mapas, diferentes escalas, available at: http://www2.sernageomin.cl/biblioteca/cgi/wxis.exe?IsisScript=plus.xis&mfn=011094&base=Bsngm (last access: 20 June 2020), 1995.
Sernageomin: Evaluación Preliminar de los Peligros Geológicos en la localidad de Villa Santa Lucía, Provincia de Palena, Región de Los Lagos, Servicio Nacional de Geología y Minería, Puerto Varas, Chile, 2008.
Sernageomin: Origen y efectos de la remoción en masa del 16.12.2017 que afectó la localidad de Villa Santa Lucía, comuna de Chaitén, Región de los Lagos, Servicio Nacional de Geología y Minería, Puerto Varas, Chile, 57 pp., 2018.