the Creative Commons Attribution 4.0 License.
the Creative Commons Attribution 4.0 License.
 | 22 Jul 2020
Analysis of the Universal Thermal Climate Index during heat waves in Serbia
Milica M. Pecelj
Milica Z. Lukić
Dejan J. Filipović
Branko M. Protić
Uroš M. Bogdanović
The objective of this paper is to assess the bioclimatic conditions in Serbia during summer in order to identify biothermal heat hazard. Special emphasis is placed on the bioclimatic index UTCI (Universal Thermal Climate Index), whose purpose is to evaluate the degree of thermal stress that the human body is exposed to. For this research, mean daily and hourly (07:00 and 14:00 CET) meteorological data from three weather stations (Zlatibor, Novi Sad and Niš) have been collected for the period from 1998 to 2017. In order to identify patterns of biothermal heat stress conditions, the thresholds of the daily UTCI (UTCI ≥38 ∘C, referred to as very strong heat stress, VSHS) at 14:00 CET are compared with the thresholds of daily maximum air temperature ( ∘C, referred to as hot days, HDs), which are further termed as heat wave events (HWEs). The findings show that the UTCI heat stress category “very strong heat stress“ at 14:00 CET indicates heat waves. The most extreme heat wave events occurred in 2007, 2012, 2015 and 2017. Moreover, three HWEs at Niš that occurred in July 2007 lasted 3, 10 and 4 d. HWEs and very strong heat stress events (VSHSEs) recorded in July 2007 (lasted 10 d each), 2012 (lasted 9 and 12 d) and 2015 (lasted 7 and 10 d) were of the longest duration and are considered to be the indicators of biothermal heat hazard. The daily UTCI14 h heat stress becomes more extreme in terms of severity and heat wave duration up to very strong heat stress.
- Article
(1447 KB) - Full-text XML
- BibTeX
- EndNote


Extreme weather events such as heat waves, floods, droughts and storms have shown an increased frequency in recent decades (Brown et al., 2008; Easterling et al., 1997; IPCC, 2012; Rahmstorf and Coumou, 2011; Seneviratne and Nicholls, 2012). Heat and drought events are of great importance not only in most Mediterranean climate regions but also in most of southern and southeastern Europe because of the diverse and costly impact that they have on various economic sectors and on the environment (Peña-Gallardo et al., 2019). In their study, Spinoni et al. (2015) made a list of the most severe drought events that occurred in Europe from 1950 to 2012. They singled out the Balkans (particularly Serbia) as an area that is susceptible to extreme weather and drought (the longest drought was registered in 2007 and the most severe drought event in 2011). Furthermore, in 2012, the Balkan Peninsula and southeastern Europe experienced the hottest summer and one of the worst droughts in nearly 40 years (Unkašević and Tošić, 2015; Tolika et al., 2014).
Extremely high temperatures, especially during the summer months, beg the question as to how heat could affect the everyday lives of humans. Heat waves as a hazard often have a negative effect, causing heat stress in the human body. They have both direct effects on human health, affecting the body's physiological responses and functions, and indirect effects on human health, increasing challenges regarding food and water safety (Lee et al., 2019). Bioclimatic conditions provide a base for considering the effects of climatic conditions on humans and give special importance to the social factors that mitigate or reinforce the consequences of environmental changes (Bleta et al., 2014). The impact of the weather and climate on humans is most commonly described as the biothermal conditions of a certain area, presented by bioclimatic indices. Over the last century many models and indices have been developed for the assessment of human exposure to heat, ranging from simple physical instruments designed to imitate human heat exchange with the environment to complex thermophysiological models that simulate external and internal body heat transfer and allow detailed simulation of different work loads, clothing and climate scenarios (Havenith and Fiala, 2016). According to Epstein and Moran (2006), there are over 100 heat stress indices that could describe extreme bioclimatic conditions in relation to humans. Many thermal indices have been developed for the purpose of describing the complex conditions of heat exchange between the human body and its thermal environment (Fanger, 1970; Landsberg, 1972; Parsons, 2003). There are two meteorological parameter indices: the ones used for cold environment conditions, combining the air temperature and the wind velocity (Osczevski and Bluestein, 2005; Siple and Passel, 1945;), and the ones used for heat environment conditions combining the air temperature and humidity (Masterton and Richardson, 1979; Steadman, 1984; Yaglou and Minard, 1957). Considering their shortcomings, i.e., the fact that they are not universally applicable to all climatic regions (including different seasons), the dominance in the analysis of biothermal conditions and thermal stress over the last 30 years has been taken over by so-called heat budget indices (Blazejczyk, 1994; Höppe, 1999; Jendritzky et al., 2012). The heat budget indices are based on the thermal exchange between humans and the environment. Methodologically, they use variables related to meteorological (air temperature, wind velocity, radiation, air humidity) and physiological (most commonly metabolic heat) processes and clothing insulation. The issue that should be emphasized during the analysis of thermal stress is the influence that extreme temperatures have on the physiological parameters in humans. According to McGregor and Vanos (2018), generated heat load can undermine the human body's ability to hold its core temperature within the range of optimal physiological performance.
For the purpose of estimating the thermal effect of the environment on the human body, the total effects of all the thermal components are considered by the Universal Thermal Climate Index (UTCI). The UTCI is a heat budget index that considers both physiological and meteorological parameters and describes the physiological heat stress that the human body experiences while achieving thermal equilibrium with the surrounding outdoor environment (Błażejczyk et al., 2013). Compared to other indices, the UTCI is more sensitive to changes in all of the environment parameters, particularly air temperature, solar radiation, humidity and wind speed (Błażejczyk et al., 2012). According to Jendritzky et al. (2012) the UTCI evaluates the outdoor thermal environment for biometeorological applications by simulating the dynamic physiological response with a model of human thermoregulation together with a modern clothing model. The UTCI provides multiple opportunities for investigation and has many applications in weather forecasting for outdoor activities, appropriate behavior and climate therapies as well as in extreme thermal stress alerts. These analyses can have applications in tourism, the health sector, and urban and regional planning (Jendritzky et al., 2012). In the past decade, a large number of publications in Europe have concerned analyses of bioclimatic conditions in accordance with the UTCI (Błażejczyk et al., 2014, 2017; Bleta et al., 2014; Di Napoli et al., 2018, 2019; Matzarakis et al., 2014; Milewski, 2013; Nastos and Matzarakis 2012; Nemeth, 2011; Tomczyk and Owczarek, 2020; Urban and Kyselý, 2014).
Although in recent years articles have been published in Serbia containing analysis of bioclimatic conditions conducted by means of other heat budget indices (Basarin et al., 2016, 2018; Lukić et al., 2019; Milovanović et al., 2017; Pecelj et al., 2017, 2018; Stojicević et al., 2016), detailed bioclimatic conditions have not yet been thoroughly analyzed by means of the UTCI, especially in the case of heat waves. Heat waves are prolonged periods of unusually high air temperature that cause changes in everyday life and may cause health and well-being effects due to heat stress. Even though heat waves are understood as meteorological events, their significance and influence could not be adequately presented without showing their clear impact on humans (Robinson, 2001). There is a need to study the evolution of such indices regarding heat stress that affects the human thermoregulatory system as a result of heat exchange between the body and its thermal environment.
Considering the fact that extreme temperature is one of the most significant climatic parameters in the universal context of climate change, analyses of heat waves in Serbia have been performed using several different approaches, and all of them show a growing trend in maximum temperature (Drljača et al., 2009; Unkašević and Tošić, 2009a, b, 2013) and heat waves (Unkašević and Tošić, 2011, 2015; Malinović-Milićević, 2013; Malinović-Milićević et al., 2016), especially since 2000.
Keeping this fact in mind, the basic idea of this study is to conduct analysis of human bioclimatic conditions over the last 20 years in Serbia, where, according to the previous studies mentioned above, warming has been perceived and recorded, especially since 2000. Determining extreme weather events from the aspect of heat budget indices allows other meteorological parameters to be taken into account because high temperatures and humidity generate a heat load more rapidly unless the wind and direct radiation are taken into account. The analysis of bioclimatic conditions implies the determination of UTCI thermal stress during the summer months and different heat stress that has occurred in the past 20 years in different geographical landscapes in Serbia. In addition to UTCI thermal stress, extreme temperature thresholds were analyzed in order to observe biothermal stress related to heat waves. The conducted human bioclimatic evaluation of UTCI thermal stress in Serbia was considered to be of great importance due to the identification of biothermal heat hazard and the study of the evolution of such indices regarding climate change. This evaluation is aimed at addressing the following topics in this study:
-
providing a comprehensive assessment of the human heat stress associated with the UTCI and
-
comparing it to heat waves defined by meteorological parameters.
Study area
The Republic of Serbia is located in southeastern Europe, in the area of the southern Pannonian Plain and the central Balkans. Northern Serbia is mainly flat, while its central and southern areas consist of highlands and mountains (Gocić and Trajković, 2014), as the map of the relief characteristics shows (Fig. 1). The territory of Serbia is characterized by temperate continental and mountain climate, and the spatial distribution of climate parameters is determined by geographical location. The Serbian territory is of the Cfb type according to Koppen–Geiger climate classification, and it is characterized by a warm, temperate, humid climate with warm summers and maximum precipitation during late spring and early summer.
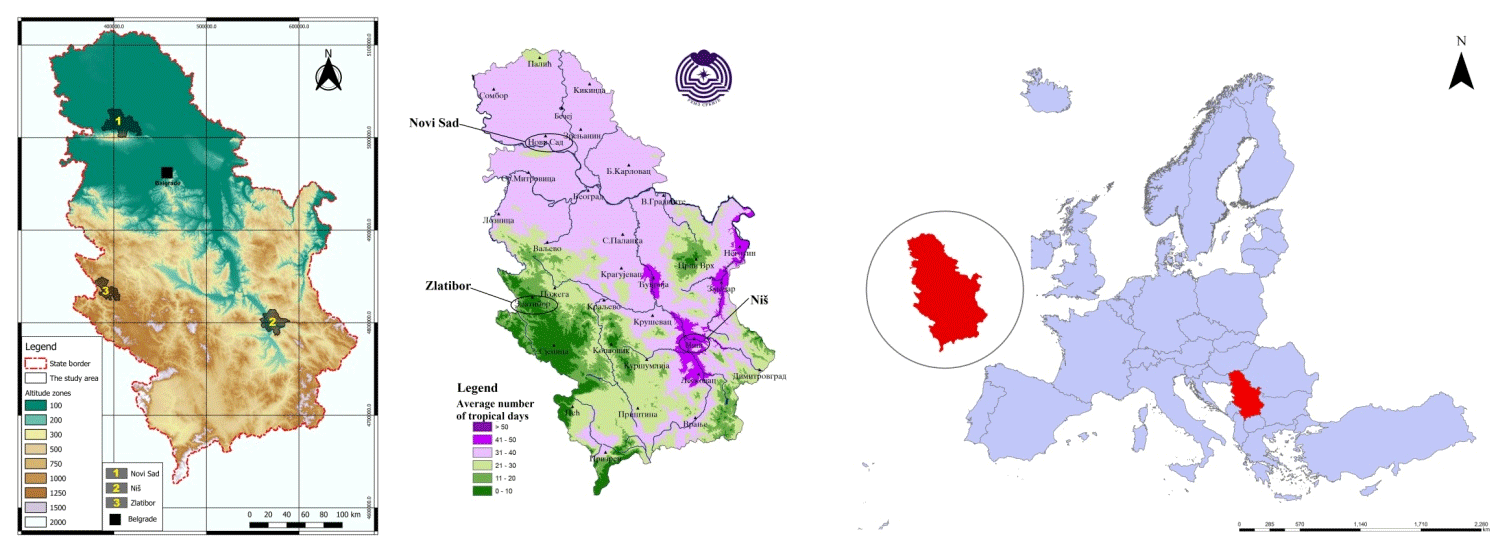
Figure 1Relief map of Serbia with the studied areas: (1) Novi Sad, (2) Niš and (3) Zlatibor (left). Map of the average number of tropical days in Serbia per year for the period 1981–2010 (middle; source: Republic Hydrometeorological Service of Serbia, RHMSS) and a map of the geographical location of Serbia in Europe (right). Maps were created using QGIS 3.8 software on the basis of the European Commission's official (Eurostat) data sets (available at https://ec.europa.eu/eurostat/web/gisco/geodata/reference-data/, last access: 3 February 2020; map ratio: 1 : 1 900 000; map projection: WGS 84/UTM, Zone 34N, the official national coordinate system).
The research involved studying three synoptic stations located in different geographical areas of Serbia: (i) Novi Sad, (ii) Niš and (iii) Zlatibor (Fig. 1).
The first weather station (at an altitude of 86 m) is located in the territory of Novi Sad, which is the administrative urban center of the province of Vojvodina and the South Bačka District (Fig. 1, area 1). The city is located in the southern part of the Pannonian Basin, on the Danube riverbank near Fruška Gora and the national park bearing the same name. Novi Sad has a temperate continental climate, summers are warm, and winters are cold, with a small amount of snow (Lazić et al., 2006). The second station is Niš (at an altitude of 202 m), and it is located in the Niš Fortress. This city is the administrative urban center of the Nišava District in southern Serbia, and it is situated in the Nišava valley, located in the central part of a spacious geological depression called the Nišava basin (Fig. 1, area 2). According to Köppen–Geiger climate classification, the Nišava valley belongs to the Cfwax type – the Danube type of moderately warm and humid climate characterized by hot summers (the highest precipitation is recorded at the beginning of the summer) and somewhat dry winters (Prokić, 2018). Compared to other cities in this valley (Dimitrovgrad, Pirot and Bela Palanka), Niš is the hottest, with an average annual temperature of 11.8 ∘C (Prokić, 2018).
The third station is Zlatibor, a mountain in western Serbia, which belongs to the mountain range of the Dinaric Alps (Fig. 1, area 3). The Zlatibor weather station lies at an altitude of 1029 m a.s.l. In the area of the Zlatibor plateau, mountains meet air currents from the Adriatic Sea, which, as it can be assumed, creates a favorable climate. For this reason Zlatibor has already been confirmed as a climatic resort (Pecelj et al., 2017). The mountain climate of Zlatibor involves long and cold winters, short and fresh summers, and less pronounced spring and autumn.
The present study implements the methodological approach of the UTCI. As a thermal comfort indicator, the UTCI considers combined meteorological and physiological parameters describing thermal comfort through the evaluation of human energy balance. In terms of physiological conditions, metabolic rate plays an important role. Metabolic processes in the human body create heat that is constantly exchanged with the environment, achieving a state of thermal equilibrium in the body for maintaining a constant body temperature. The amount of the heat that is produced and released depends on the following: physical activity, clothing, sex, age, body mass, diet, mental state, health, external conditions, acclimatization etc. The unit of “MET” was introduced as a measure of physical activity; 1 MET equals the heat release of 58.2 W m−2 from the average skin surface area of an adult (1.8 m2). It is equal to the energy rate produced per unit surface area of an average person seated at rest (ANSI/ASHRAE Standard 55, 2017). According to ISO 8996 (2004), the metabolic heat energy of a person moving at the speed of 1.1 m s−1 is M=135 W m−2, i.e., 2.3 MET.
2.1 The Universal Thermal Climate Index (UTCI)
For valid assessment of the outdoor thermal environment in the fields of public weather services, public health systems, urban planning, tourism and recreation, and climate impact research, the UTCI was developed based on the most recent scientific progress in human thermophysiology in biophysics and heat exchange theory. The UTCI is the result of an approach which was developed in the International Society of Biometeorology (ISB) Commission 6 and was later improved by COST Action 730 (Jendritzky et al., 2012). The design of the UTCI is of great importance due to the fact that it is applicable to all seasons and climates together with all spatial and temporal scales.
Human reaction was simulated by the UTCI-Fiala multinode model of human thermoregulation, which was integrated with an adaptive clothing model. For any combination of meteorological parameters (Eq. 1), based on the conception of an equivalent temperature, the UTCI is the air temperature of the reference environment, which, according to the model, produces an equivalent dynamic physiological response under a set of reference conditions (Bröde et al., 2012). In other words, this model simulates the same sweat production or skin wettedness in human body response as the actual environment condition (Błażejczyk et al., 2013, 2014). This is derived from the multidimensional dynamic response of a state-of-the-art multinode thermophysiological model of human heat transfer and thermoregulation (Fiala et al., 2012). The UTCI can be represented as a general function as below:
For appropriate use, the UTCI can only be approximated using a regression equation abbreviated from sample calculations performed by computing centers (Bröde et al., 2012; Jendritzky et al., 2012). The UTCI index (approximated using a regression equation) causes a narrow range of input parameters it can manage. For the reference environment, the ISB Commission on the UTCI decided to use (i) a wind speed (v) of =0.5 m s−1 at 10 m height (approximately 0.3 m s−1 at 1.1 m), (ii) a mean radiant temperature (tmrt) equal to air temperature and (iii) vapor pressure that represents a relative humidity (f) of 50 %; at high air temperatures (>29 ∘C) the reference humidity was taken to be constant at 20 hPa (Błażejczyk et al., 2013). Physiological parameters, the metabolic rate (M) and the thermal properties of clothing (clothing insulation, permeability) are taken as universal constants in the model due to the evaluation by means of the regression equation. This implies an outdoor activity of a person walking at the speed of 4 km h−1 (1.1 m s−1), corresponding to heat production of 135 W m−2 (2.3 MET) of metabolic energy (Błażejczyk et al., 2013; Jendritzky et al., 2012) and clothing insulation that is self-adapting according to the environmental conditions (Havenith et al., 2012). Clothing insulation, vapor resistance and the insulation of surface air layers are strongly influenced by changes in wind speed and body movement and will therefore also influence physiological responses (Błażejczyk et al., 2012). Particular ranges of the UTCI are categorized according to thermal stress (Table 1).
Table 1UTCI thermal stress classification.
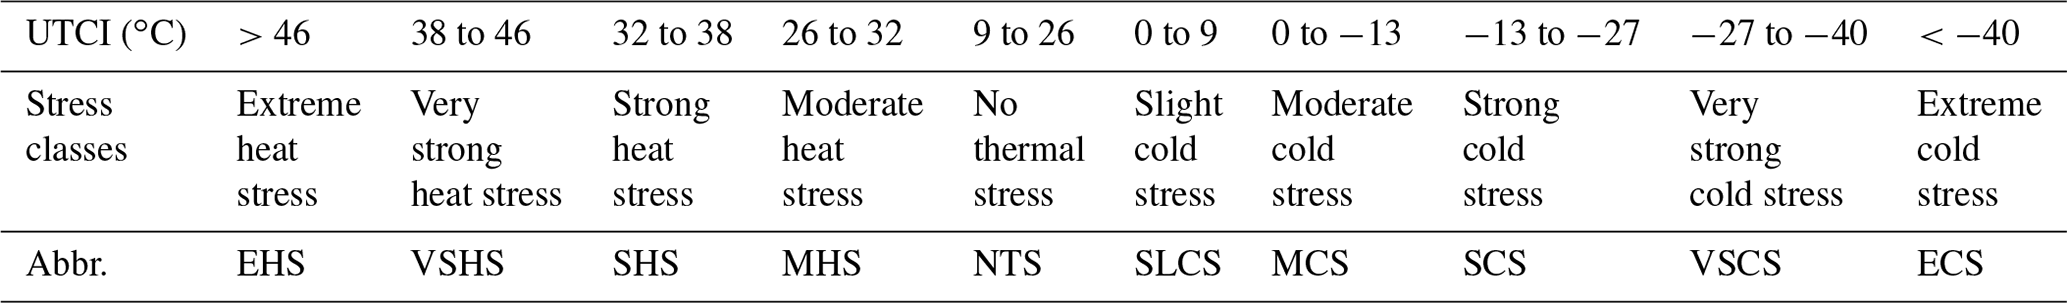
Source: Błażejczyk et al. (2013).
2.2 Data and indices considered in the study
The meteorological data set from the period from 1998 to 2017 was recorded for two urban weather stations (Novi Sad and Niš) and one rural mountain station (Zlatibor). Mean daily and hourly meteorological parameters (07:00, 14:00 CET) of air temperature (t), air humidity (f) and wind speed (v) from the above weather stations were considered for the calculation of particular UTCI thermal heat stress in the summer months (July, August and September). The meteorological data set used in the study was retrieved from the Meteorological Yearbook for the period from 1998 to 2017 (Republic Hydrometeorological Service of Serbia, 2018), while the UTCI was calculated by applying the BioKlima 2.6 software package (available at http://www.igipz.pan.pl/Bioklima-zgik.html, last access: 10 May 2019).
Although extreme temperatures are one of the most effective climatic parameters in the universal case of hot days and heat waves, the influence of other parameters, especially clothing insulation and metabolic rate, can justify thermal discomfort and the other way around. In that regard, the summer (July, August and September) daily maximum and minimum temperatures (tmax, tmin) for the same stations were analyzed in terms of particular thresholds to identify the frequency of extremely high temperatures and heat waves in the period observed and to compare them with the discomfort recorded by the UTCI.
The first stage of the study presented mean daily (UTCIavg), morning (UTCI7 h) and midday (UTCI14 h) UTCIs. They are presented by months (July, August, September) for each station to identify the general differences caused by the geographical origin of the stations under study. The quantification of human bioclimatic conditions in Serbia was designed for the UTCIs on a daily basis for each defined stress category. To obtain better insight into the UTCI values during the summer months, the averaged monthly UTCI14 h was provided for each year to see how much the UTCI14 h fluctuated in relation to the average monthly value.
Table 2Definition of indices used in the study.

t: air temperature; f: relative humidity; v: wind speed; tmrt: mean radiant temperature; tmax: maximum air temperature; tmin: minimum air temperature.
For the second stage, midday UTCI14 h heat stress indices (strong heat stress, SHS; very strong heat stress, VSHS; extreme heat stress, EHS) and thermal indices based on the maximum and minimum temperatures (hot day, HD, and hot night, HN) were identified. During the midday observation (14:00 CET), SHS, which refers to a UTCI range of 32 to 38 ∘C, and VSHS, which refers to a UTCI range of 38 to 46 ∘C (Table 2), are particularly prominent. The occurrence of thermal stress days was presented for each month (July, August and September) in the last 20 years. EHS, which refers to a UTCI range above 46 ∘C, was presented separately when it occurred.
Thermal indices (HD and HN) were identified on the basis of the threshold of the maximum and minimum temperatures. Considering the influence of extreme temperatures, as stated by Collins et al. (2000), the following indices were marked in relation to the thresholds of maximum and minimum temperature: hot days (HD ∘C) and hot nights (HN ∘C; Table 2). Such a high temperature (35 ∘C or higher), taken as a threshold of what is defined as a heat wave, is assumed to be related to the very strong heat stress category of the UTCI. It should be taken into account that, according to the Serbian National Weather Service, a daily maximum temperature of 30 ∘C or higher is taken as the threshold of what is called a tropical day.
For the last stage of the study, with the purpose of identifying thermal discomfort during the period observed, a heat wave event (HWE = 3 HDs of ∘C) is determined as an illustration of a threshold based on the duration of HDs and HNs. In addition, as an illustration of a threshold based on the duration of VSHS, a very strong heat stress event (VSHSE) is determined, and it is caused by the occurrence of 5 consecutive VSHS days (Table 2).
As a result of comparing UTCI thermal stress to the selected thresholds of maximum and minimum temperatures, biothermal discomfort was identified during extremely high temperatures for the geographical area of Serbia. The recorded number of days with VSHS was compared to the number of days when the maximum air temperature was above 35 ∘C.
On the basis of the conducted bioclimatic analysis and comparison of biothermal conditions given in the two urban meteorological stations Novi Sad and Niš as well as Zlatibor, which represents a rural and lower mountain area, some differences in weather conditions were perceived in the summer period as was expected. The results are presented in three sections: (i) UTCIs (UTCIavg, UTCI7 h, UTCI14 h), (ii) UTCI heat stress indices (SHS, VSHS and EHS) and thermal indices (HD and HN), and (iii) heat waves (HWEs and VSHSEs).
3.1 UTCIs (UTCIavg, UTCI7 h, UTCI14 h)
This section presents the results of the heat budget index UTCI calculated for mean daily (UTCIavg), morning (UTCI7 h) and midday (UTCI14 h) data for the period of 20 years. In particular, physiological stress in the category of “strong heat stress” occurred quite frequently in 1998, 2000, 2004, 2007, 2011, 2012, 2015 and 2017 at Niš (July and August) and slightly less frequently at Novi Sad, where “strong heat stress” occurred more frequently in July and August of 2000, 2002, 2006, 2007, 2009, 2013, 2015, 2016 and 2017. A much smaller amount of strong heat stress was observed at Zlatibor. There were periods in which the categories of “moderate” and “strong heat stress” were evenly distributed in the months of July and August over the period that was investigated. It is important to emphasize that the category of “strong heat stress” occurred most frequently at Zlatibor in 2000, 2004, 2007, 2012, 2015 and 2017, which generally coincided with the other two stations. These are the years when significant heat waves were recorded. The results depicted in Fig. 2 show the frequency (in percentages) of all stress categories for each index (UTCIavg, UTCI7 h, UTCI14 h) that occurred in July, August and September for the period that was observed.
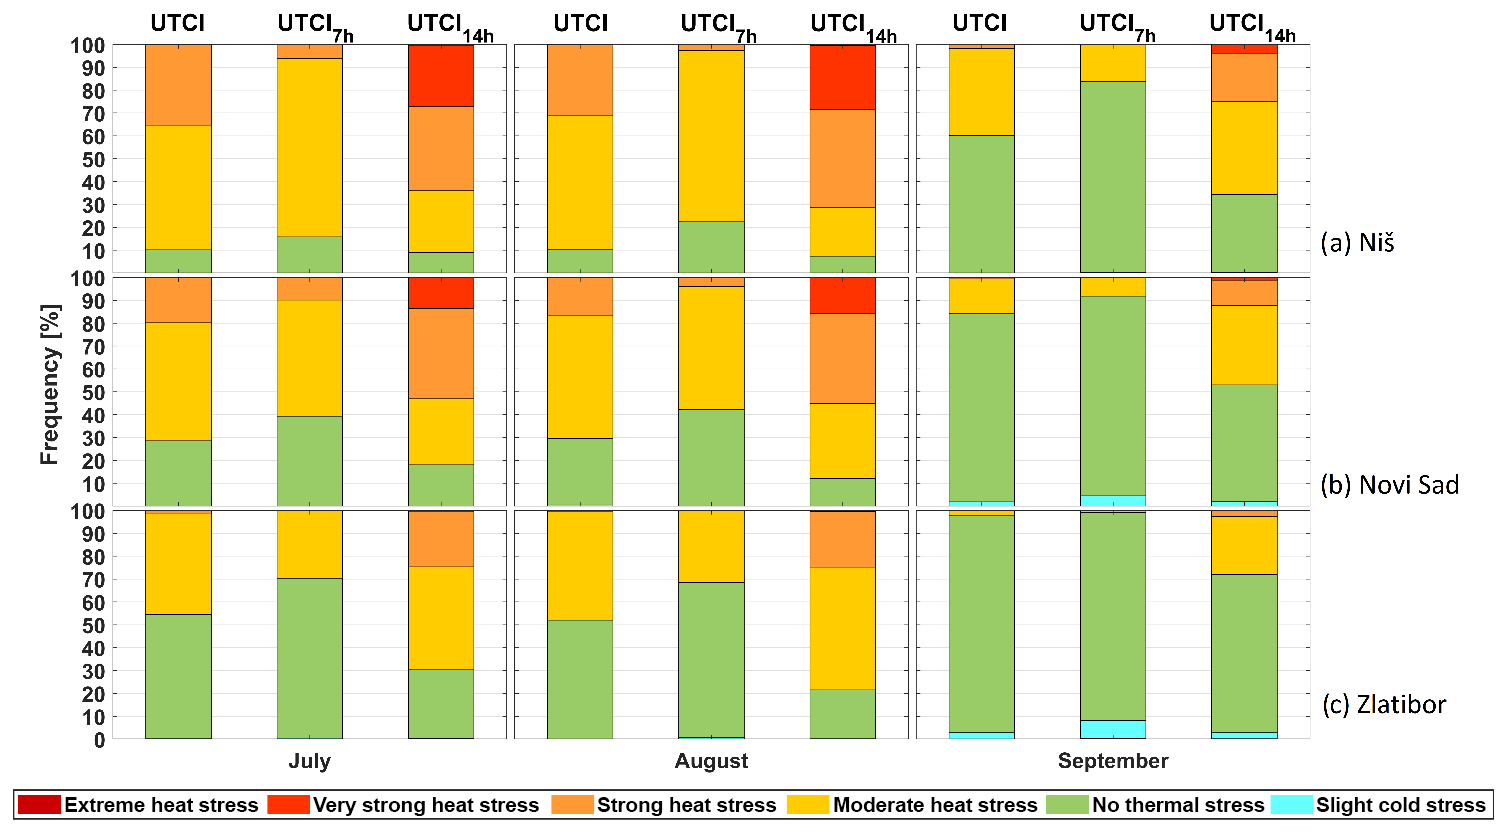
Figure 2Monthly frequency of the days with different UTCI stress classes for mean daily (UTCIavg), morning (UTCI7 h) and midday (UTCI14 h) indices during the period from July to September, 1998–2017: (a) Niš, (b) Novi Sad, (c) Zlatibor. x axis: time (months); y axis: frequency (number of days).
Bioclimatic conditions at Niš are certainly the most unpleasant ones given the domination of the “strong heat stress” and not-so-rare “very strong heat stress” categories during the period of 20 years. Extreme heat stress for the midday UTCI14 h was observed on 5 d. The most pleasant bioclimatic conditions can be observed in the morning hours (UTCI7 h), when the dominant categories are “moderate heat stress” (July and August) and “no thermal stress” in September (Fig. 2a). Niš is located in the south of Serbia and belongs to the areas that are most endangered by drought and extreme high temperatures in Serbia. This is confirmed by Tošic and Unkasević (2014) in the study of dry periods in Serbia during the period between 1949 and 2011. It was found that the frequency of droughts in the southern part of Serbia was higher than in the other parts of the country. The most severe drought occurred at Niš and lasted from July 2006 to March 2008 (with a duration of 21 months and severity of 63.0).
Novi Sad is located in the northern part of Serbia, on the slopes of Fruška Gora, and is characterized by a temperate continental and continental climate. Therefore, bioclimatic conditions at Novi Sad are more pleasant than those at Niš. Nevertheless, this does not rule out the occurrence of high temperatures and severe dry periods during the warm part of the year. This idea is based on the findings of Leščešen et al. (2019), when they analyzed drought periods in Vojvodina for over 60 years (1956–2016). All the regions of Vojvodina that were investigated experienced at least one extreme drought event over the reference period, in particular in 2000, 2001–2002 and 2011–2012. Moreover, the same results were obtained in other similar studies (Gocić and Trajković, 2013, 2014; Milanović, et al., 2014). At the mean daily level (UTCIavg) the most frequent category is “moderate heat stress”, while at the hourly level (UTCI14 h) the most frequent category is “strong heat stress”. This is related to the statements made by Di Napoli et al. (2018) about two thermal climates in Europe; one of them is associated with heat stress condition and is predominant in the southern part of Europe, including the Balkans, when moderate and strong heat stress occurs at central daytime hours, which reflects the general relationship between heat load and insolation.
Days with very strong heat stress were observed in July and August (Fig. 2b), and there was 1 d with extreme heat stress in July 2007. Zlatibor has distinctive characteristics of the submountain and mountain climate. Among these three stations, the bioclimatic conditions of Zlatibor are the most pleasant, considering the dominant category of “no thermal stress” at the daily level of the UTCIavg. The thermal conditions with a morning UTCI7 h are similar to the UTCIavg, while the UTCI14 h shows the prevailing categories of “moderate heat stress” and slightly less significant categories of “strong heat stress” and “very strong heat stress”. It is important to emphasize that the UTCI category of “slight cold stress” for all the indices (UTCIavg, UTCI7 h, UTCI14 h) was recorded several times during the 3 months of the period observed. The lowest value of the UTCI was −2.84 ∘C, and it occurred on 5 September 2007 at Zlatibor as moderate cold stress (Fig. 2c).
Of all the calculated UTCIs, mean daily data (UTCIavg), morning data (UTCI7 h) and midday data (UTCI14 h), the midday UTCI14 h shows the most extreme values for identifying heat waves and biothermal heat discomfort. In this regard, for further data analysis in this study, the UTCI14 h is used. To gain better insight into the UTCI14 h values during the summer months, for the investigated period, the averaged monthly UTCI14 h for each year was provided for all three stations. The mean monthly values are presented in Fig. 3 together with the trends in the UTCI14 h and mean absolute deviation of the UTCI14 h in order to see how much the UTCI14 h fluctuated in relation to the mean monthly value. The results show a significant increase in the extreme values of the UTCI14 h over the last 10 years, presented mainly as VSHS. A series of peaks can be observed in the years that have been marked as extremely warm. In addition, there is a growing trend of the UTCI14 h in all the summer months and all the weather stations, i.e., a series of peaks with successively higher values during the investigated period (1998–2017). The highest trend can be seen in September at Niš and Zlatibor, while the lowest trend can be observed in August at Zlatibor.
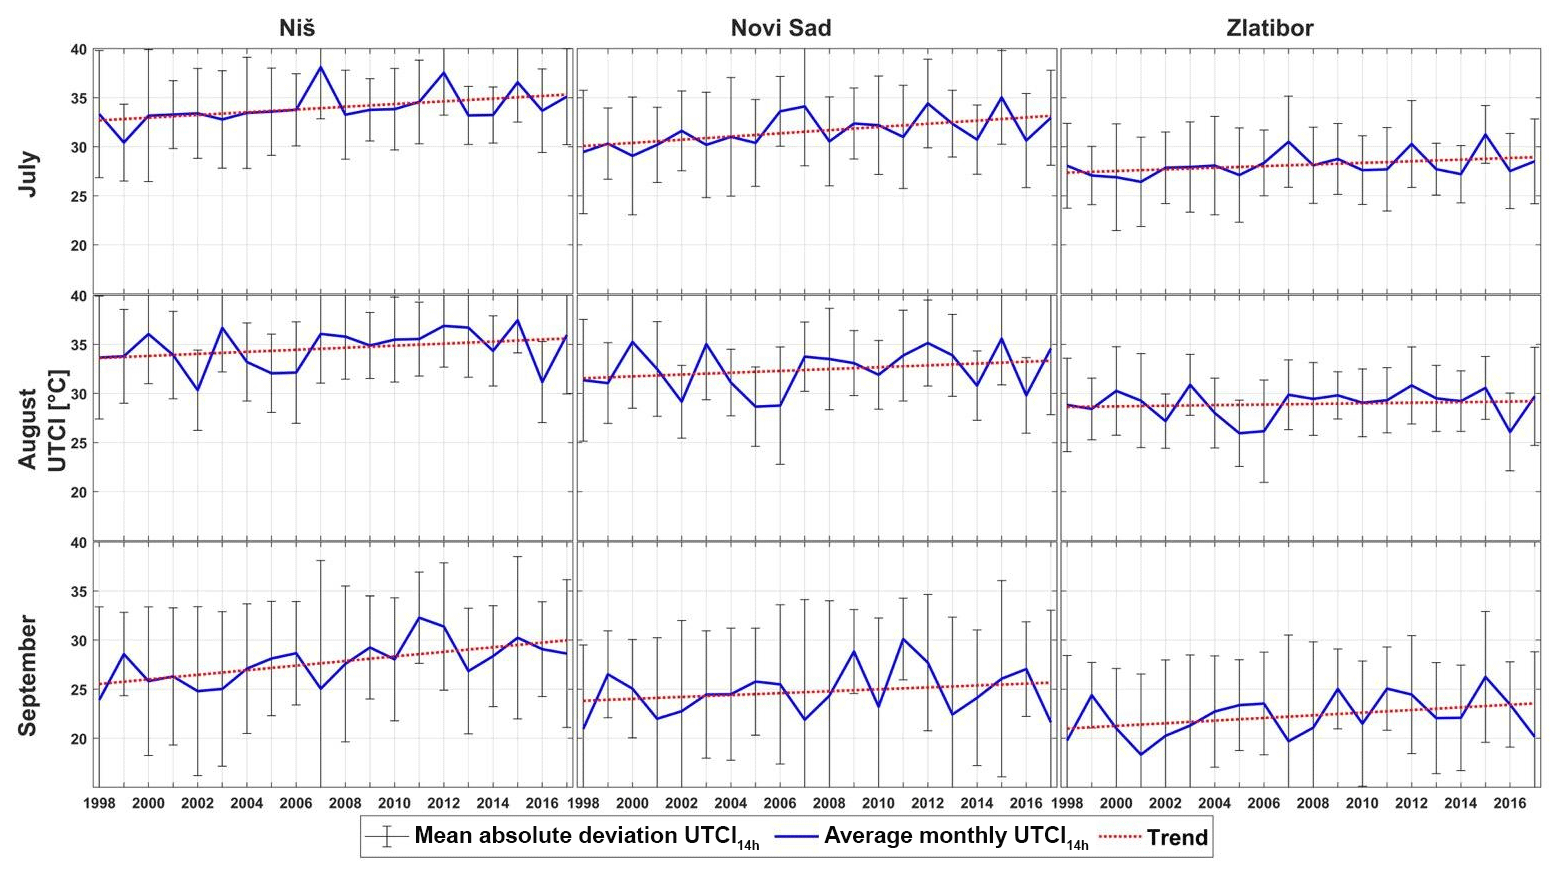
Figure 3The mean monthly UTCI14 h during the period 1998–2017. x axis: time (years); y axis: UTCI (∘C).
As regards the severity of the daily UTCI, there were 5 d recorded at Niš when the UTCI14 h exceeded the limit value for EHS. This happened on 5 July 2000 (UTCI14 h=47.08 ∘C), 24 July 2007 (UTCI14 h=48.26 ∘C), 24 August 2007 (UTCI14 h=46.29 ∘C), 5 August 2017 (UTCI14 h=46.75) and 6 August 2017 (UTCI14 h=46.76 ∘C). The maximum value of the UTCI at Novi Sad was recorded on 24 July 2007 (UTCI =48.42 ∘C). In the area of Zlatibor, extreme heat stress has not been recorded in the last 20 years. The highest values of the UTCI at Zlatibor occurred on 22 and 24 July 2007 (UTCI14 h=38.62 ∘C and UTCI14 h=38.37 ∘C). The year 2007 is rated as the most unfavorable, particularly the date of 24 July, when the highest temperature ever in Serbia was recorded (Smederevska Palanka, ∘C, source: Republic Hydrometeorological Service of Serbia, RHMSS).
3.2 Thermal indices and UTCI heat stress indices
This section identifies the midday UTCI14 h heat stress indices (SHS and VSHS) and thermal indices marked in relation to the thresholds of the maximum and minimum temperatures in particular (HD and HN). Figure 4 presents the frequency (number of days) of HDs, HNs, SHS and VSHS for each month (July, August and September) in the last 20 years. The results of the UTCI that were obtained show compatibility with previous analyses in relation to the occurrence of heat waves, especially since 2000 (Basarin et al., 2018; Unkašević and Tošić, 2009a, b, 2013).
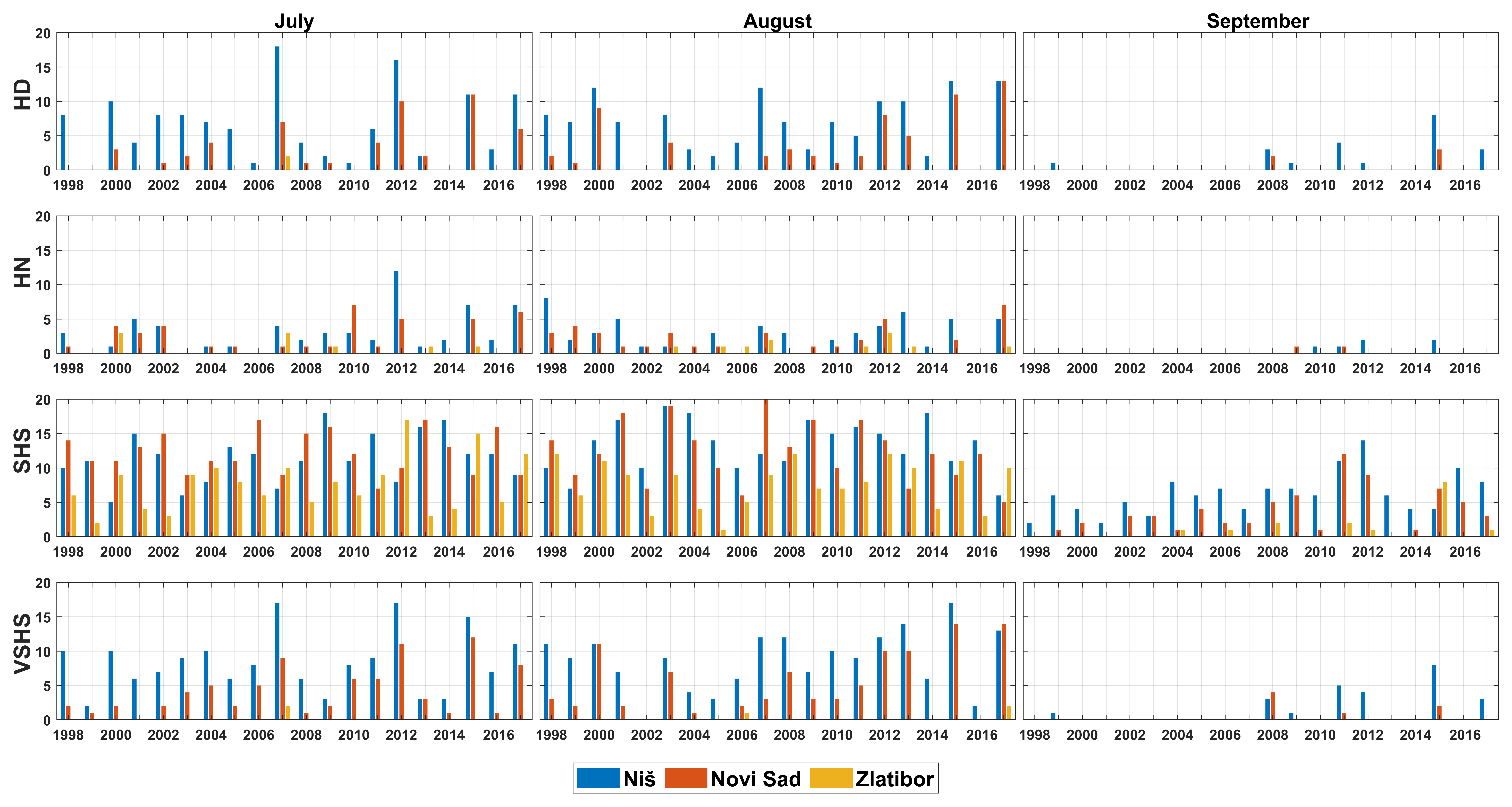
Figure 4Number of HDs and HNs as well as SHS and VSHS days at Niš, Novi Sad and Zlatibor (July, August, September 1998–2017). x axis: time (years); y axis: number of days.
In accordance with the thresholds of maximum temperatures in July, there were several years at Niš with 10 or more HDs in July, when the temperature was above 35 ∘C, as shown in Fig. 4. This can be observed in July of 2000, 2007, 2012, 2015 and 2017; in total, it amounts to 10, 18, 16, 11 and 11 HDs, respectively, for each year. As regards the thresholds of maximum temperature at Novi Sad, there were 10 or more HDs with temperatures above 35 ∘C; more specifically there were 10 and 11 HDs in July of 2012 and 2015, respectively. At Zlatibor only 2 HDs were recorded in July 2007. In August, this can be observed in 2000, 2007, 2012, 2013, 2015 and 2017, and in total it amounts to 12, 12, 10, 10, 13 and 13 HDs, respectively, for each year at Niš. The highest number of days with a temperature over 35 ∘C was recorded in 2000, 2012, 2015 and 2017, and in total for each year it amounts to 9, 8, 11 and 13, respectively. At Zlatibor there are no HDs recorded in August (Fig. 4).
For the period investigated (1998–2017), the total number of hot days recorded in July, August and September at Niš was 126, 133 and 21, respectively, while Novi Sad saw about half of the said number of hot days, namely 52, 63 and 3 HDs, respectively. At Zlatibor 2 HDs were recorded in July.
As regards HNs, there is generally a lower intensity of HNs compared to HDs. Generally, during the observed period, up to 4 HNs were recorded, although an increase in the HNs has been observed in the last 10 years. For example, in 2012, 2015 and 2017 the number of HNs recorded at Niš in July was 12, 7 and 7, respectively, and in 2000, 2013, 2015 and 2017 the number of HNs recorded in August was 8, 6, 5 and 5, respectively. Since 2010 up to 2 HNs have been recorded in September. At Novi Sad, in 2010, 2012, 2015 and 2017 there were 7, 5, 5 and 6 HNs, respectively, recorded in July, while in August of 2012 and 2017 there were 5 and 7 HNs, respectively. In September, 1 HN was recorded in 2009 and 2011 (Fig. 4). The total number of hot nights recorded in July, August and September for the investigated period at Niš was 60, 56 and 6 HNs, respectively, while at Novi Sad there was a significantly lower number of hot nights: 41, 38 and 2, respectively. At Zlatibor 9 HNs were recorded in July, and 11 HNs were recorded in August for the period investigated.
Midday UTCI14 h SHS occurs most commonly at all three stations. For example, SHS is particularly important to Zlatibor, located at an altitude above 1000 m, since there has been an increase in the number of days with SHS at Zlatibor over the last decade. The best indicator is the increase in SHS in September. Similarly, the indicator of biothermal discomfort, VSHS, has been occurring more frequently in the last decade, reaching a maximum of 17 d in July 2007 and 2012 and in August 2015 at Niš. The number of VSHS days at Novi Sad reached a maximum of 12 d in July 2015 and 14 d in August 2015 and 2017. The total number of VSHS days recorded in July, August and September for the investigated period at Niš was 167, 174 and 25, respectively, while at Novi Sad there was a significantly lower number of VSHS days: 83, 97 and 7, respectively. At Zlatibor 2 VSHS days were recorded in July and 3 VSHS days were recorded in August. The recorded numbers of VSHS days indicate slightly greater biothermal discomfort duration in relation to the number of HDs. The HD and VSHS indices are significantly correlated during the summer months as they are directly derived from the maximum air temperatures and the UTCI14 h (Table 3). The UTCI14 h and tmax for the Niš and Novi Sad urban stations have a significantly high linear correlation.

For Zlatibor the correlation is slightly lower in July and August, while in September it is weak compared to the urban stations, but neither HD nor VSHS indices occurred at Zlatibor. Similar results of the linear relationship between the air temperature and the UTCI (r=83; r=0.98) were shown in the studies of Urban and Kyselý (2014) for summer in the urban areas of South Bohemia in the Czech Republic and in the studies of Nassiri et al. (2017) for Iran.
3.3 Heat waves (HWEs and VSHSEs)
After UTCI thermal stress was compared to the selected thresholds of maximum temperature, biothermal discomfort was identified during extremely high temperatures for the geographical area of Serbia. During the observed period, an HWE was determined, caused by 3 consecutive HDs, as was a VSHSE, caused by the occurrence of 5 consecutive VSHS days.
Table 4Number of HWEs and VSHSEs at Niš and Novi Sad (July, August and September 1998–2017).
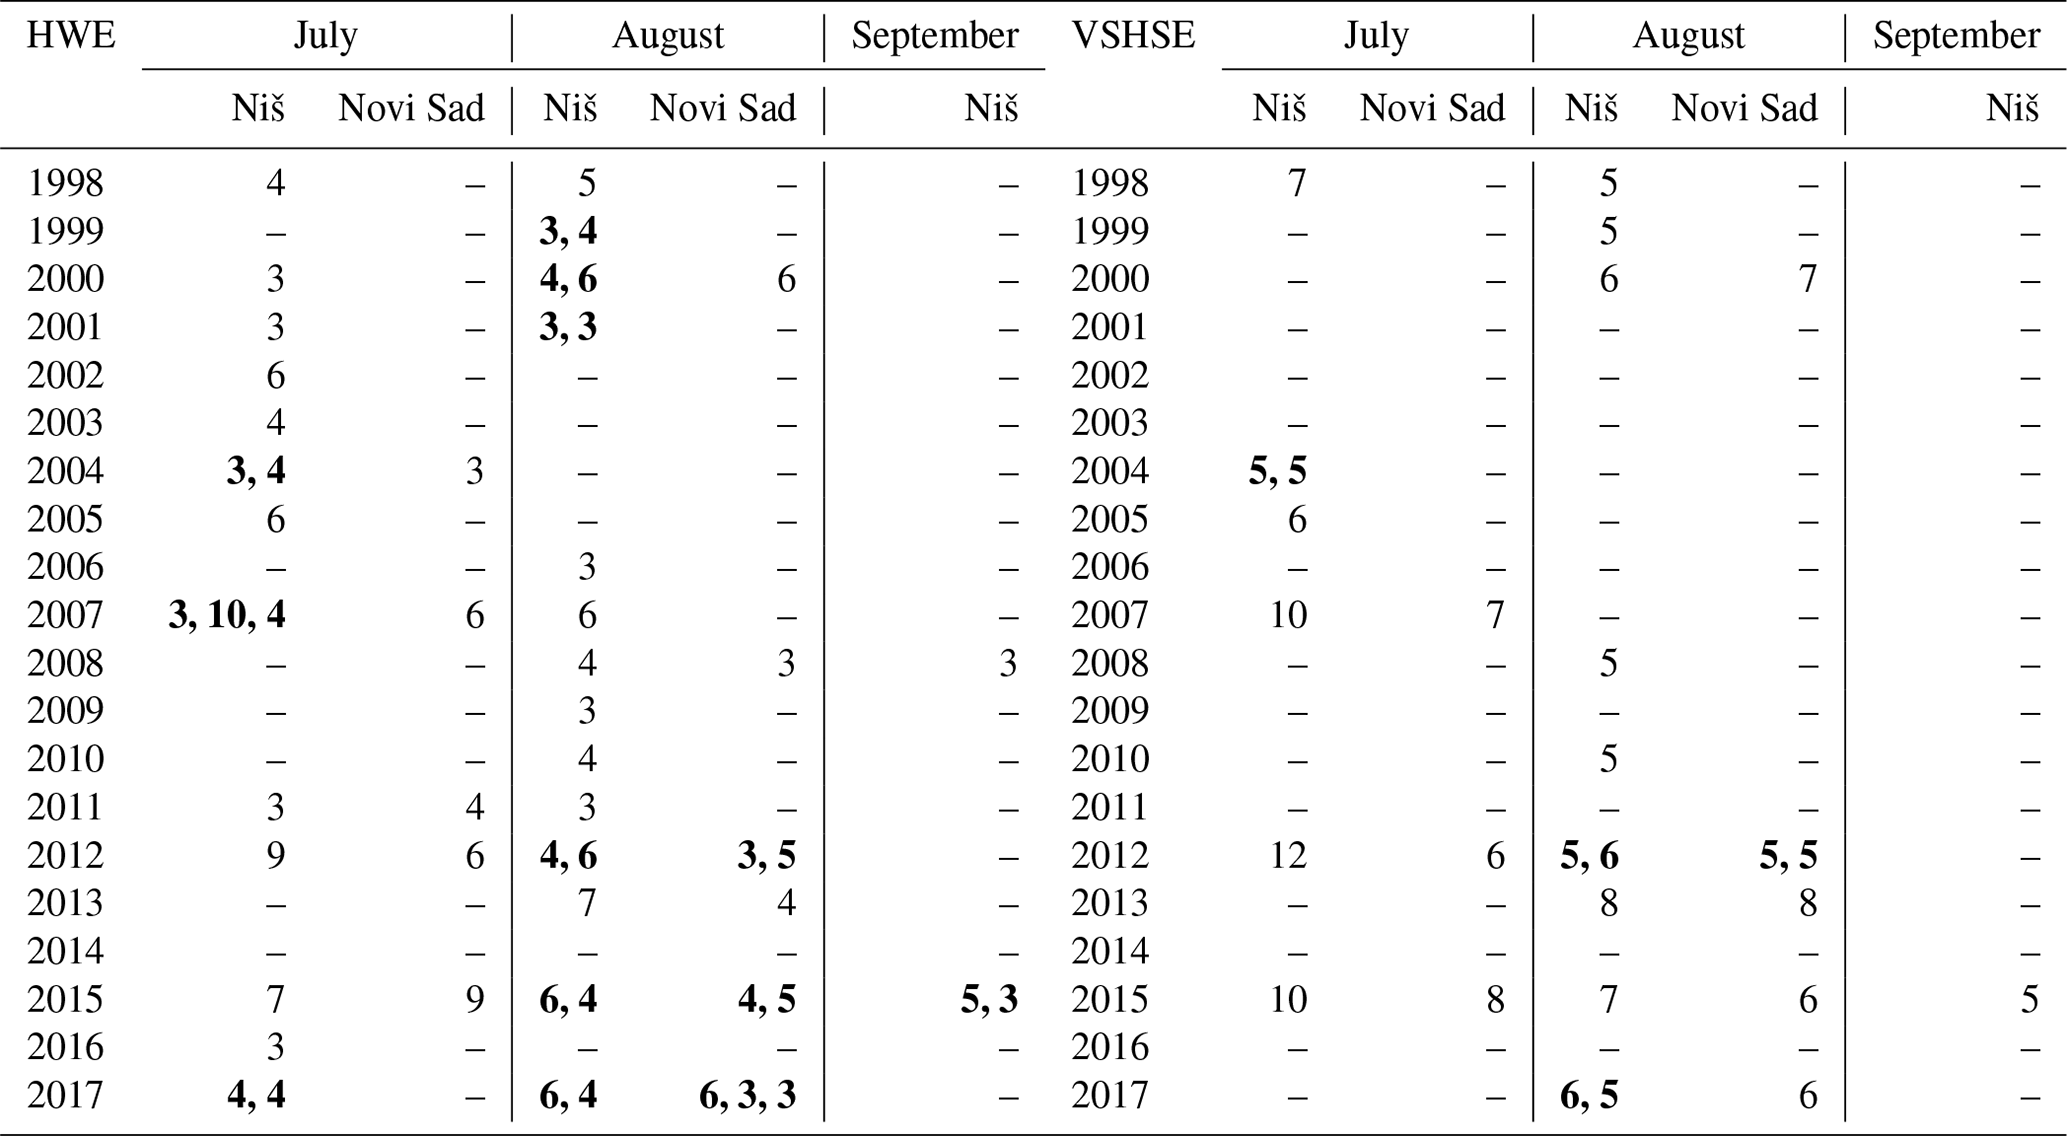
Note: bold cells have more than one HWE and VSHSE and are defined by the number of consecutive days.
Table 4 lists the identified heat waves that refer to the UTCI14 h VSHS (VSHSEs) and HD index (HWEs). It has a very similar layout. However, shadowed differences can be observed, especially in the duration of the heat wave event. The results are presented for Niš and Novi Sad since there were no recorded heat waves at Zlatibor. More heat waves, both HWEs and VSHSEs, have been identified in the last 10 years.
An HWE of 10 d in a row (Niš, from 15 to 24 July 2007) represents the maximum number of consecutive days with such high temperatures when all three stations are compared. In the same month, HWEs of 3 d in a row (8 to 10 July) and 4 d in a row (27 to 30 July) were observed (HWE in Table 4). Altogether, HWEs occurred three times, and they lasted 3, 10 and 4 d in July 2007, which is certainly an extreme for the observed period. The HWEs, which lasted 3 or 4 d in a row, occurred in 9 of the 20 years in the observed period. From that source, HWEs occurred twice and lasted 3 to 4 d in July 2004 and 2017 (Table 4). It is necessary to point out that heat waves in July 2002, 2005, 2007, 2012 and 2015 lasted more than 5 HDs in a row, with tmax above 35 ∘C, amounting to 6, 6, 10, 9 and 7 HDs, respectively. In August HWEs with 3 to 6 HDs in a row occurred twice in 1999, 2000, 2001, 2012, 2015 and 2017. Furthermore, in August, series of heat wave events with 5 HDs in a row or more were observed in 1998, 2000, 2007, 2012, 2013, 2015 and 2017, amounting to 5, 6, 6, 6, 7 and 6 HDs in a row, respectively. As regards the thresholds at Novi Sad, there were two HWEs with 3 and 4 HDs in a row, which occurred in August of 2012 and 2015. In 2017 three HWEs occurred with 6, 3 and 3 HDs in a row. It is certainly important that two HWEs occurred in September 2015 and lasted 3 and 5 HDs in a row, with tmax above 35 ∘C (Table 4). This justifies the finding of Tomczyk (2016) that the heat waves began to occur in September in the last decade. As shown in Fig. 4, the number of HDs in September during the period of 20 years increased significantly after 2007, especially at Niš.
There were 21 HDs in September at Niš, and only 1 HD was recorded in the first decade (1998–2007) of the investigated period, while the remaining HDs were recorded over the last decade (2008–2017), especially in 2011 and 2015. In the second decade of the investigated period, the year 2015 stands out with two HWEs (1–5 and 17–19 September). In the same year the highest daily temperature was recorded in September (on 18 September; ∘C). A similar situation occurred in the area of Novi Sad. During the first 10 years, not a single HD was recorded in September, while after 2007, 5 such days were recorded. For Niš and Novi Sad the year 2015 stands out, and the hottest September days were 17 and 18 September, with and 36.4 ∘C.
For both weather stations in the second decade, together with the increase in the number of HDs, there was also an increase in the number of HNs. In September, the daily air temperature increases, so days with temperatures around 30 ∘C and higher are more frequent. At this weather station, the year 2015 stands out, with the same date of the hottest day in September (18 September; ∘C). This correlates with the heat wave analysis in Athens, where a period of heat waves lasted from mid-June to the beginning of September (Papanastasiou et al., 2014). In the area of Zlatibor, there was no significant phenomenon of extreme temperatures, and therefore no HWEs were recorded.
Bioclimatic conditions analyzed by means of the UTCI show that the calculated data observed at 14:00 CET are related to the marked HWEs. When the UTCI14 h thermal stress category of VSHS is compared to the selected HWEs, a subindex is defined. It is called a VSHSE, and it is caused by the occurrence of 5 consecutive VSHS days. The VSHSE corresponds to a heat wave event and provokes severe biothermal discomfort, so it was used as an indicator of extremely unfavorable bioclimatic conditions (biothermal heat hazard). Along these lines, the VSHSE at Niš occurred in July of 1998, 2004, 2005, 2007, 2012 and 2015, when 7, 5 (on two occasions), 6, 10, 12 and 10 VSHS days in a row were recorded, respectively (VSHSE in Table 4). In August, a VSHSE was recorded 5 VSHS days in a row in 1998, 1999, 2008, 2010, 2012 and 2017, while in 2000, 2012, 2013, 2015 and 2017, a VSHSE was recorded 6, 6, 8, 7 and 6 VSHS days in a row, respectively. It should be emphasized that there were two VSHSE events in 2012 and 2017, corresponding to 5 and 6 VSHS days in a row, respectively. September 2015 saw a VSHSE with 5 VSHS days in a row. According to Unkašević and Tošić (2009b) the highest temperatures ever at Niš were recorded during the summer of 2007 (44.2 ∘C) and the summer of 2000 (42.5 ∘C), covering the data period from 1948 to 2007. The VSHSE occurred at Novi Sad in July 2007 (7 VSHS days in a row), 2012 (6 VSHS days in a row) and 2015 (8 VSHS days in a row) as well as in August 2000 (7 VSHS days in a row), 2013 (8 VSHS days in a row), 2015 (6 VSHS days in a row) and 2017 (6 VSHS days in a row). In August 2012 there were two VSHSEs, and each time 5 VSHS days in a row were recorded. There was no VSHSE recorded at Zlatibor.
The purpose of this study is to investigate biothermal conditions in Serbia during summer and provide a comprehensive assessment of human heat stress connected with the UTCI during heat waves. The results obtained in the study indicate the general increase in biothermal discomfort associated with heat waves defined by maximum air temperature above 35 ∘C and the UTCI “very strong heat stress” above 38 ∘C. The morning, midday and average UTCIs show a significant occurrence of thermal heat stress (moderate, strong and very strong heat stress) during the summer months and an increase in biothermal discomfort especially for the UTCI14 h. This is confirmed by the obtained distribution of the average monthly UTCI14 h showing a significant increase in the extreme values of the UTCI14 h in the last 10 years, presented mainly as VSHS together with a growing trend of the UTCI14 h in all the summer months for all three investigated weather stations, primarily at Niš. These findings show that heat waves and biothermal heat discomfort may be more frequent and longer in the future, and this indicates the need for biothermal heat warnings. The increase in extreme biothermal heat conditions is the most evident in the number of days with UTCI thresholds between 38 and 46 ∘C, defined in the study as “very strong heat stress” (VSHS), and maximum air temperature thresholds above 35 ∘C, defined in the study as “hot days” (HDs). Thus, most HDs (18 d) occurred in 2007 and then in 2012 (16 d), meaning that more than half of July in these years was characterized by extremely high temperatures. Of particular importance is the increasing number of HDs and HNs as well as SHS and VSHS days in September since 2008 (Fig. 4). Similar results about increase in daily maximum air temperature were obtained by Unkašević and Tošić (2011), when record values of the maximum temperatures were observed for almost the whole territory of Serbia in 2007. As reported by Papanastasiou et al. (2014), the summer of 2007 was the warmest summer in Athens in the last 100 years. This follows the statement made by Di Napoli et al. (2018) about the UTCI reference value from the period between 1979 and 2016, when the UTCI at 12:00 UTC was about 0.5 ∘C colder in the period between 1980 and 1999, while it was 0.5 ∘C warmer in the period between 2000 and 2009 and 1 ∘C warmer in the period between 2010 and 2016.
The significant findings from this study imply that the UTCI category of VSHS defines extreme biothermal heat discomfort that can be considered to be a biothermal heat hazard. The UTCI14 h category of VSHS correlates with HDs, and there has been an increase in the number of such days over the last 10 years. Particularly severe biothermal heat discomfort occurred in 2007 (18 VSHS days) and 2012 (17 VSHS days). Nevertheless, the total number of VSHS days (558 d) at all three stations for the investigated period is greater than the total number of HDs (400 d), which indicates a slightly longer duration of biothermal heat discomfort defined by the UTCI compared to the number of HDs. This is important because there is a difference between the biothermal heat stress defined by VSHS and potential heat stress defined by maximum temperatures, where the calculation of the UTCI, apart from temperature, includes some other parameters such as humidity, wind speed and direct solar radiation together with metabolic rate and clothing insulation. Extremely high temperature does not necessarily cause heat stress if the wind is strong, and the relative humidity is low if a person is not being physically active. For instance, the situation at Novi Sad on 30 July 2007, when the maximum temperature was higher than the calculated UTCI ( ∘C; UTCI14 h=15.7 ∘C; no thermal stress), does not necessarily indicate biothermal heat stress if the wind speed is high (6.7 m s−1) or the relative humidity is lower (52 %). On the other hand, the situation on 26 August 2002, when the maximum air temperature was lower than the calculated UTCI ( ∘C; UTCI14 h=30.6 ∘C), indicates that heat stress may still occur if the wind speed is low (0.8 m s−1) or the relative humidity is higher (57 %). This indicates the sensitivity of the index to environmental parameters, especially wind speed, humidity, air temperature and solar radiation. In this sense, determining extreme weather events from the aspect of human heat budget indices allows other meteorological parameters to be taken into account. Apart from temperature and humidity, wind and direct solar radiation have been considered together with metabolic rate and clothing insulation.
The identified heat waves based on the threshold of the UTCI correspond to the identified heat waves based on the threshold of maximum air temperatures. Furthermore, there has been a significant increase in heat waves (HWEs and VSHSEs) and the duration of such events over the last 10 years at Niš and Novi Sad, especially at Niš. Similar results about the increase in heat waves at Novi Sad defined by another heat budget index, physiological equivalent temperature (PET), for the period from 1949 to 2012 were reported in Basarin et al. (2016); the highest number of heat waves was observed in the last 2 decades and in the first decade of the investigated period, while the number of the days above particular thresholds for the period 1961–2014 shows an increase along with the number of heat waves per year since 1981. Urban areas have a high risk of heat absorption of buildings and asphalt, which results in the formation of high temperatures during the night (Giannopoulou et al., 2014). Rural and mountainous areas rich in forests and greenery, like Zlatibor, are less exposed to these phenomena, but during the hottest summer months, days and nights with high temperatures can occur (Fig. 2c).
It is important to point out that several heat waves occurred in summer. The analysis highlights 2007, 2012, 2015 and 2017 as the years with the most heat waves registered as HWEs, with special emphasis on Niš, where the longest HWE lasted for 10 d in July 2007, with a UTCI over 38 ∘C and maximum temperature over 35 ∘C (Table 4). This agrees with the findings of Unkašević and Tošić (2011, 2015) that there has been a growing trend of heat waves in Serbia, especially since 2000. In order to justify the present research for the last 20 years, the earlier results related to the increase in heat waves are discussed in more detail. In that regard, previous research on heat waves at Niš for the period from 1949 to 2007, based on the autoregressive–moving-average model, observed the warmest years during three periods: 1951–1952, 1987–1998 and 2000–2007 (Unkašević and Tošić, 2009b). According to this research, the longest heat wave was recorded at Niš in 1952, with 21 d, while in 2003, 29 consecutive tropical days were observed. It should be taken into account that, according to the Serbian National Weather Service, tropical days are days with a maximum temperature over 30 ∘C. Furthermore, based on the Heat Wave Duration Index (HWDI), i.e., daily maximum values of air temperature, Drljača et al. (2009) determined the duration and strength of heat waves at Niš during the summer season. The analysis showed Niš with a greater number of heat waves compared to the larger urban area of Belgrade. As stated in the research, since the mid-1980s, heat waves have had a higher frequency, and on average they have occurred every year. Prior to that period heat wave fluctuations were generally reported in 1 of 2 years (Niš during the summer; Drljača et al., 2009). While studying the characteristics of the heat waves in central Serbia (1949–2007), Unkašević and Tošić (2011) detected an increase in heat wave duration in addition to an increase in heat wave frequency of occurrence during the period from 1999 to 2007. Moreover, based on the HWDI, heat waves at Novi Sad show a trend of increasing tropical days ( ∘C) from 1960 to 2010, indicating the years 1994, 1998, 2000, 2003, 2007, 2009 (Malinović-Milićević, 2013).
Further, two HWEs lasting 5 and 3 d were highlighted in September 2015, and a VSHSE that lasted 5 d was also highlighted. This agrees with the statement of Tomczyk (2016) that, in the last decades, heat waves have begun to occur in September in southeastern Europe, where the highest number of HWEs is usually recorded in July and August.
Biothermal discomfort identified in July and August as the hottest summer months in Serbia could provoke health disorders more frequently. Human sensitivity to extreme-heat weather can also be seen in the impact of heat waves on daily mortality in Belgrade during the summer, when the strong correlation between heat waves and daily mortality can be observed in July 2007 (Stanojević et al., 2014). Similarly, Bogdanović et al. (2013) reported a significant short-term excess mortality on 16 July in Belgrade, when the maximum daily temperature exceeded 35 ∘C, leading to 167 excess deaths (38 % increase compared to the number of expected deaths) for 9 consecutive days of heat, with a progressive return to almost normal mortality as the maximum temperature dropped below 35 ∘C on 25 July. Specific HWE characteristics such as intensity and duration may have devastating effects on human health and well-being. In certain cases, heat waves cause problems for children, elderly people, chronic patients and workers, who are particularly susceptible to them.
However, this study probably has potential limitations. The period under observation could be longer for the purposes of keeping track of the trend of extremes. This shortcoming was attenuated by referencing a more detailed review of previous studies on the trend of maximum temperatures in Serbia reported by Unkašević and Tošić (2009a, 2011, 2015), Drljača et al. (2009), Malinović-Milićević (2013), and Malinović-Milićević et al. (2016). Furthermore, complete hourly weather data are missing, and therefore they are not sufficient for a more detailed analysis of UTCI values, which might be used for healthcare purposes. As for the UTCI, it should be emphasized that the model is limited by a fixed metabolic rate that approximates light physical activity (1.1 m s−1). In other words, biothermal heat discomfort can cause a stronger heat load in humans if the physical activity is more intense. However, considering a wide spatial dimension of diverse geographic and climate regions where the UTCI has been applied, adaptation to existing biothermal conditions, hot or cold, should be excluded.
Nevertheless, the research results of this study highlight the importance that the UTCI as a bioclimatic indicator has for biothermal heat discomfort, particularly if it is connected to the effects on human health. This study features a human bioclimatic method of analyzing a biothermal condition with special emphasis on heat stress so that the impact on human health and well-being can be understood better.
The application of the standardized bioclimatic heat budget index UTCI helps improve the understanding of biothermal conditions related to heat waves. The results obtained from this study show that UTCI14 h heat stress becomes more extreme in terms of severity and heat wave duration up to VSHS. The biothermal indices investigated for the three weather stations follow the trend of general warming. As reported by Vuković et al. (2018), future change analysis in Serbia concerning the base period 1986–2005, in compliance with the Intergovernmental Panel on Climate Change (IPCC) Fifth Assessment Report (AR5), shows an increase in temperature by the end of the 21st century, which proves that it is necessary to take immediate measures to alleviate negative impacts. In light of climatic changes and other negative factors resulting from this global phenomenon, it is becoming a true challenge to minimize their effects and improve living conditions in urban and rural areas (Stevović et al., 2017). Bearing in mind the above, the findings of this study indicate the need to make plans regarding adaptation and mitigation measures in public weather services, public health systems, urban planning, tourism and recreation, and climate impact research. This implies creating a high-density network of urban measuring stations for the potential monitoring of biothermal heat discomfort as long as the UTCI has applications in weather forecasting regarding outdoor activities, appropriate behavior and climate therapies, and extreme thermal stress alerts. For future research, it is necessary to expand spatial analyses in the region of Balkans. However, human heat budget indices are increasingly serving as determinants of extreme weather conditions (Di Napoli et al., 2018; Matzarakis et al., 2014; Theoharatos et al., 2010; Urban and Kyselý, 2014). The UTCI improves the understanding of extreme thermal stress, serving as one of the criteria for initiating heat alerts about extreme thermal stress in Serbia.
The present research of the human bioclimatic evaluation of UTCI thermal stress in Serbia is considered important due to the identification of biothermal heat hazard and the study of the evolution of such indices regarding climate change. This evaluation aims to provide a comprehensive assessment of the human heat stress associated with the UTCI and heat waves defined by UTCI very strong heat stress and maximum air temperature.
The assessment of human biothermal conditions for the investigated period from 1998 to 2017 was provided for three synoptic stations: two urban stations (Niš and Novi Sad) and one station representing mountain areas of an altitude up to 1500 m (Zlatibor). All of them are located in different geographical areas in Serbia. It was found that the morning, midday and average UTCIs show significant occurrences of all heat stress categories during the summer months and increases in biothermal discomfort, especially for the UTCI14 h. The findings in the study show an increase in biothermal discomfort associated with heat waves defined by UTCI14 h VSHS above 38 ∘C and heat waves defined by maximum air temperature above 35 ∘C. VSHS describes an alarming biothermal state and has occurred frequently in the last 10 years, particularly at Niš and Novi Sad. The findings indicate UTCI14 h VSHSEs as an indicator of biothermal heat hazard, corresponding to heat waves defined by maximum air temperature. The most extreme heat waves (HWEs and VSHSEs) occurred in 2007, 2012, 2015 and 2017. HWEs lasting 10 d in July 2007 and 9 d in July 2012, VSHSEs lasting 10 d in July 2007 and July 2015, and those lasting 12 d in July 2012, which occurred at Niš, are the events with a maximum duration. The fact that heat waves occurred twice in September in 2015 is certainly an important finding. Undoubtedly, heat wave events are one of the natural hazards with an increasing impact in urban areas related to higher population density. Considering these facts, it can be deduced that heat waves are becoming more frequent, stronger and longer. Thus, frequent heat waves since 2007 with a UTCI above 38 ∘C certainly indicate biothermal heat hazard. The longer events of bioclimatic discomfort could indicate a more stressful effect on bioclimatic conditions for human health and well-being.
However, the results of the study highlight the importance of the UTCI as a bioclimatic indicator of biothermal hazard in Serbia particularly if it can serve as one of the criteria for initiating heat warnings in public weather services, public health systems, urban planning, tourism and recreation, and research on climate impact in Serbia.
The data used in the study are available from the Republic Hydrometeorological Service of Serbia (http://www.hidmet.gov.rs/latin/meteorologija/klimatologija_godisnjaci.php, Republic Hydrometeorological Service of Serbia, 2018).
MMP designed the study; collected, analyzed and interpreted the data; wrote the manuscript; and processed the figures. MZL collected the data, supported the writing and processed the figures. DJF carried out the management activities. BMP participated in technical support. UMB contributed to the interpretation of the results and the improvement of the figures. All authors contributed to the discussion and interpretation of the results.
The authors declare that they have no conflict of interest.
This article is part of the special issue “Advances in extreme value analysis and application to natural hazards”. It is not associated with a conference.
The paper represents the results of research on the national projects supported by the Ministry of Education, Science and Technological Development, Republic of Serbia (nos. III 47007, 176017 and 176008). The authors highly appreciate the comments and suggestions of the reviewers.
This paper was edited by Yasser Hamdi and reviewed by two anonymous referees.
ANSI/ASHARE Standard 55: Thermal Environmental Conditions for Human Occpancy, ANSI/ASHRAE Approved, available at: http://www.techstreet.com/ashrae/standards (last access: 31 January 2020), 2017.
Basarin, B., Lukić, T., and Matzarakis, A.: Quantification and assessment of heat and cold waves in Novi Sad, Northern Serbia, Int. J. Biometeorol., 60, 139–150, https://doi.org/10.1007/s00484-015-1012-z, 2016.
Basarin, B., Lukić, T., Mesaroš, M., Pavić, D., Djordjević, J., and Matzarakis, A.: Spatial and temporal analysis of extreme bioclimatic condition in Vojvodina, Northern Serbia, Int. J. Climatol., 38, 142–157, https://doi.org/10.1002/joc.5166, 2018.
Błażejczyk, K.: New climatological and physiological model of the human heat balance outdoor (MENEX) and its application in bioclimatological studies in different scales, Zeszyty IGiPZ PAN, 28, 27–58, 1994.
Błażejczyk, K., Epstein, Y., Jendritzky, G., Staiger, H., and Tinz, B.: Comparison of UTCI to selected thermal indices, Int. J. Biometeorol., 56, 515–535, https://doi.org/10.1007/s00484-011-0453-2, 2012.
Błażejczyk, K., Jendritzky, G., Bröde, P., Fiala, D., Havenith, G., Epstein, Y., Psikuta, A., and Kampmann, B.: An introduction to the Universal Thermal Climate Index, Geogr. Pol., 86, 5–10, https://doi.org/10.7163/GPol.2013.1, 2013.
Błażejczyk, K., Kuchcik, M., Błażejczyk, A., Milewski, P., and Szmyd, J.: Assessment of urban thermal stress by UTCI – experimental and modelling studies: an example from Poland, ERDE, 145, 16–33, https://doi.org/10.12854/erde-145-3, 2014.
Błażejczyk, A., Błażejczyk, K., Baranowski, J., and Kuchicik, M.: Heat stress mortality and desired adaptation responses of healthcare system in Poland, Int. J. Biometeorol., 62, 307–318, https://doi.org/10.1007/s00484-017-1423-0, 2017.
Bleta, A., Nastos, P. T., and Matzarakis, A.: Assessment of bioclimatic condition in Crete Island, Greece, Reg. Environ. Change., 14, 1967–1981, https://doi.org/10.1007/s10113-013-0530-7, 2014.
Bogdanović, D., Milošević, Z., Lazarević, K., Dolićanin, Z., Ranđelović, D., and Bogdanović, S.: The impact of the July 2007 heat wave on daily mortality in Belgrade, Serbia, Cent. Eur. J. Publ. Heal., 21, 140–145, https://doi.org/10.21101/cejph.a3840, 2013.
Bröde, P., Fiala, D., Błażejczyk., K, Holmér, I., Jendritzki, G., Kampmann, B., Tinz, B., and Havenith, G.: Deriving the operational procedure for the Universal Thermal Climte Index (UTCI), Int. J. Biometeorol., 56, 481–494, https://doi.org/10.1007/s00484-011-0454-1, 2012.
Brown, S. J., Caesar, J., and Ferro, C. A. T.: Global changes in extreme daily temperature since 1950, J. Geophys. Res., 113, 1–11, https://doi.org/10.1029/2006JD008091, 2008.
Collins, D. A., Della-Marta, P. M., Plummer, N., and Trewin, B. C.: Trends in annual frequencies of extreme temperature events in Australia, Aust. Meteorol. Mag., 49, 277–292, 2000.
Di Napoli, C., Pappenberg, F., and Cloke, H. L.: Assessing heat-related health risk in Europe via the Universal Thermal Climate Index (UTCI), Int. J. Biometeorol., 62, 1155–1165, https://doi.org/10.1007/s00484-018-1518-2, 2018.
Di Napoli, C., Pappenberger, F., and Cloke, H. L.: Verification of Heat Stress Thresholds for a Health-Based Heat-Wave Definition, J. Appl. Meteorol. Clim., 58, 177–1194, https://doi.org/10.1175/jamc-d-18-0246.1, 2019.
Drljača, V., Tošić, I., and Unkašević, M.: An analysis of heat waves in Belgrade and Niš using the climate index, J. Geogr. Inst. Jovan Cvijić SASA, 59, 49–62, https://doi.org/10.2298/IJGI0959049D, 2009.
Easterling, D. R., Horton, B., Jones, P. D., Peterson, T. C., Thomas, R. K., David, E. P., Salinger, M. J., Razuvayev, V., Plummer, N., Jamason, P., and Folland, C. K.: Maximum and minimum temperature trends for the globe, Science, 277, 364–367, https://doi.org/10.1126/science.277.5324.364, 1997.
Epstein, Y. and Moran, D. S.: Thermal comfort and heat stress indices, Ind. Health, 44, 388–398, https://doi.org/10.2486/indhealth.44.388, 2006.
Fanger, P. O.: Thermal Comfort: analysis and applications in environmental engineering, Danish Technical Press, Copenhagem, Denmark, 1970.
Fiala, D., Havenith, G., Bröde, P., Kampmann, B., and Jendritzky, G.: UTCI-Fiala multi-node model of human heat transfer and temperature regulation, Int. J. Biometeorol., 56, 429–441, https://doi.org/10.1007/s00484-011-0424-7, 2012.
Giannopoulou, K., Livada, I., Santamouris, M., Saliari, M., Assimakopoulos, M., and Caouris, Y.: The influence of air temperature and humidity on human thermal comfort over the greater Athens area, Sustain. Cities Soc., 10, 184–194, https://doi.org/10.1016/j.scs.2013.09.004, 2014.
Gocić, M. and Trajković, S.: Analysis of precipitation and drought data in Serbia over the period 1980–2010, J. Hydrol., 494, 32–42, https://doi.org/10.1016/j.jhydrol.2013.04.044, 2013.
Gocić, M. and Trajković, S.: Spatiotemporal characteristics of drought in Serbia, J. Hydrol., 510, 110–123, https://doi.org/10.1016/j.jhydrol.2013.12.030, 2014.
Havenith, G. and Fiala, D.: Thermal Indices and Thermophysiological Modeling for Heat Stress, Compr. Physiol., 6, 255–302, https://doi.org/10.1002/cphy.c140051, 2016.
Havenith, G., Fiala, D., Błazejczyk, K., Richards, M., Bröde, P., Holmer, I., Rintamaki, H., Benshabat, Y., and Jendritzky, G.: The UTCI-clothing model, Int. J. Biometeorol., 56, 461–470, https://doi.org/10.1007/s00484-011-0451-4, 2012.
Höppe, P.: The physiological equivalent temperature – a universal index for the biometeorological assessment of the thermal environment, Int. J. Biometeorol., 43, 71–75, https://doi.org/10.1007/s004840050118, 1999.
IPCC: Special Report of theIntergovernmental Panel on Climate Change, in: Managing the Risks of Extreme Events and Disasters to Advance Climate Change Adaption, edited by: Field, C. B., Barros, V., Stocker, T. F., Qin, D., Dokken, D. J., Ebi, K. L., Mastrandrea, M. D., Mach, K. J., Plattner, G. K., Allen, S. K., Tignor, M., and Midgley, P. M., Cambridge University Press, Cambrigde, UK, 582 pp., 2012.
ISO 8996: Ergonomics of the thermal environment – Determination of metabolic rate, available at: https://www.iso.org/standard/34251.html (last access: 2 February 2020), 2004.
Jendritzky, G., De Dear, R., and Havenith, G.: UTCI-Why another thermal index?, Int. J. Biometeorol., 56, 421–428, https://doi.org/10.1007/s00484-011-0513-7, 2012.
Kottek, M., Greiser, J., Beck, C., Rudolf, B., and Rubel, F.: World Map of the Koppen-Geiger Climate Classification Updated, Meteorol. Z., 15, 259–263, https://doi.org/10.1127/0941-2948/2006/0130, 2006.
Landsberg, H. E.: The Assessment of Human Bioclimate: a limited review of physical parameters, World Meteorological Organization, WMO, 331, Geneva, Switzerland, 1972.
Lazić, L., Savić, S., and Tomić, Ž.: Analysis of the Temperature Characteristics and Trends in Novi Sad Area (Vojvodina, Serbia), Geogr. Pannon., 10, 14–21, https://doi.org/10.5937/GeoPan0610014L, 2006.
Lee, V., Zermoglio, F., and Ebi, K.: Heat waves and human health – emerging evidence and experience to inform risk management in a warming world, Technical Report, United States Agency for International Development USAID, Washington, D.C., USA, 2019.
Leščešen, I., Dolijan, D., Pantelić, M, and Popov, S.: Drought assessment in Vojvodina (Serbia) using k-means cluster analysis, J. Geogr. Inst. Jovan Cvijić SASA, 69, 17–27, https://doi.org/10.2298/IJGI1901017L, 2019.
Lukić, M., Pecelj, M., Protić, B., and Filipović, D.: An evaluation of summer discomfort in Niš (Serbia) using Humidex, J. Geogr. Inst. Jovan Cvijić SASA, 69, 109–122, https://doi.org/10.2298/IJGI1902109L, 2019.
Malinović-Milićević, S.: Summer hazards in Novi Sad, J. Geogr. Inst. Jovan Cvijić SASA, 63, 335–344, https://doi.org/10.2298/IJGI1303335M, 2013.
Malinovic-Milicevic, S., Radovanovic, M. M., Stanojevic, G., and Milovanović B.: Recent changes in Serbian climate extreme indices from 1961 to 2010, Theor. Appl. Climatol., 124, 1089–1098, https://doi.org/10.1007/s00704-015-1491-1, 2016.
Masterton, J. and Richardson, F. A.: Humidex, a method of quantifying human discomfort due to excessive heat and humidity, Atmospheric Environment Service Canada, Ontario, Downsview, Canada, 1979.
Matzarakis, A., Muthers, S., and Rutz, F.: Application and comparison of UTCI and PET in temperate climate conditions, Finisterra, 48, 21–31, https://doi.org/10.18055/Finis6453, 2014.
McGregor, G. and Vanos, J.: Heat: A primer for public health researchers, Public Health, 161, 138–146, https://doi.org/10.1016/j.puhe.2017.11.005, 2018.
Milewski, P.: Application of the UTCI to the local bioclimate of Poland's Ziemia Kłodzka region, Geogr. Pol., 86, 47–54, https://doi.org/10.7163/GPol.2013.6, 2013.
Milovanović, B., Radovanović, M., Stanojević, G., Pecelj, M., and Nikolić, J.: Klima Srbije (Climate of Serbia), in: Geografija Srbije (Geography of Serbia), edited by: Radovanović, M., Geogr. Inst. Jovan Cvijić SASA, Belgrade, Serbia, 94–156, 863 pp., 2017.
Milovanović, M., Gocić, M., and Trajković, S: Analysis of meteorological and agricultural droughts in Serbia, Adv. Eng. Res., 12, 253–264, https://doi.org/10.2298/FUACE1403253M, 2014.
Nassiri, P., Monazzam, M. R., Golbabaei, F., Dehghan, S. F., Rafieepour, A., Mortezapour, A., and Asghari, M. P.: Application of Universal Thermal Climate Index (UTCI) for assessment of occupational heat stress in open-pit mines, Ind. Health, 55, 437–443, https://doi.org/10.2486/indhealth.2017-0018, 2017.
Nastos, P. and Matzarakis, A.: The effect of air temperature and human thermal indices on mortality in Athens, Greece, Theor. Appl. Climatol., 108, 591–599, https://doi.org/10.1007/s00704-011-0555-0, 2012.
Nemeth, A.: Changing thermal bioclimate in some Hungarian cities, Acta Climatologica et Chorologica, 44–45, 93–101, 2011.
Osczevski, R. J. and Bluestein, M.: The new wind chill equivalent temperature chart, B. Am. Meteorol. Soc., 86, 1453–1458, https://doi.org/10.1175/BAMS-86-10-1453, 2005.
Papanastasiou, D. K., Melas, D., and Kambezidis, H. D.: Heat Waves characteristics and their relation to air quality in Athens, Global Nest J., 16, 919–928, https://doi.org/10.30955/gnj.001530, 2014.
Parsons, K. C.: Human thermal environments: the effects of hot, moderate, and cold environments on human health, comfort and performance, Taylor & Francis Group, Abingdon, UK, 2003.
Pecelj, M., Đordđević, A., Pecelj, M. R., Pecelj-Purković, J., Filipović, D., and Šećerov, V.: Biothermal conditions on Mt. Zlatibor based on thermophysiological indices, Arch. Biol. Sci., 69, 455–461, https://doi.org/10.2298/ABS151223120P, 2017.
Pecelj, M., Lukić, M., Vučičević, A., De Una-Alvarez, E., Esteves da Silva, C.G.J., Freinkin, I., Ciganović, S., and Bogdanović, U.: Geoecological evaluation of local surroundings for the purposes of recreational tourism, J. Geogr. Inst. Jovan Cvijić SASA, 68, 215–231, https://doi.org/10.2298/IJGI1802215P, 2018.
Peña-Gallardo, M., Vicente-Serrano, S. M., Domínguez-Castro, F., and Beguería, S.: The impact of drought on the productivity of two rainfed crops in Spain, Nat. Hazards Earth Syst. Sci., 19, 1215–1234, https://doi.org/10.5194/nhess-19-1215-2019, 2019.
Prokić, M.: Climate trends of temperature and precipitation in Nišava river valley (Serbia) for 1960-2015 period, J. Geogr. Inst. Jovan Cvijić SASA, 68, 35–50, https://doi.org/10.2298/IJGI1801035P, 2018.
Rahmstorf, S. and Coumou, D.: Increase of extreme events in a warming world, P. Natl. Acad. Sci. USA, 108, 17905–17909, https://doi.org/10.1073/pnas.1101766108, 2011.
Republic Hydrometeorological Service of Serbia: Meteorological Yearbook for the period from 1998 to 2017, available at: http://www.hidmet.gov.rs/latin/meteorologija/klimatologija_godisnjaci.php, last access: 15 July 2018.
Robinson, J. P.: On the definition of a Heat Wave, J. Appl. Meteor., 40, 762–775, https://doi.org/10.1175/1520-0450(2001)040<0762:OTDOAH>2.0.CO;2, 2001.
Seneviratne, S. I. and Nicholls, N.: Changes in Climate extremes and their impacts on the natural physical environment, in: Managing the Risks of Extreme Events and Disasters to Advance Climate Change Adaption, edited by: Field, C. B., Barros, V., Stocker, T. F., Qin, D., Dokken, D. J., Ebi, K. L., Mastrandrea, M. D., Mach, K. J., Plattner, G. K., Allen, S. K., Tignor, M., and Midgley, P. M., Cambridge University Press, Cambrigde, UK, 109–230, 2012.
Siple, P. and Passel, C. F.: Measurements of dry atmospheric cooling in subfreezing temperatures, P. Am. Philos. Soc., 89, 177–199, available at: http://www.jstor.org/stable/985324 (last access: 5 February 2020), 1945.
Spinoni, J., Naumann, G., Vogt, J., and Barbosa, P.: The biggest drought events in Europe from 1950 to 2012, J. Hydrol. Reg. Stud., 3, 509–524, https://doi.org/10.1016/j.ejrh.2015.01.001, 2015.
Stanojević, G., Stojićević, J., Spalević, A., and Kokotović, V.: The Impact of heat waves on daily mortality in Belgrade (Serbia) during summer, Environ. Hazard., 13, 329–342, https://doi.org/10.1080/17477891.2014.932268, 2014.
Steadman, R. G.: A Universal Scale of Apparent Temperature, J. Appl. Meteorol., 23, 1674–1687, https://doi.org/10.1175/1520-0450(1984)023<1674:AUSOAT>2.0.CO;2, 1984.
Stevović, S., Mirjanić, S., and Đurić, N.: Sustainable urban environment and conflict of resources management, Archives for Technical Sciences, 17, 79–87, https://doi.org/10.7251/afts.2017.0917.079S, 2017.
Stojićević, G., Basarin, B., and Lukić, T.: Detailed bioclimate analysis of Banja Koviljača (Serbia), Geogr. Pannon., 20, 127–135, https://doi.org/10.18421/GP20.03-01, 2016.
Theoharatos, G., Pantavou, K., Mavrakis, A., Spanou, A., Katavoutas, G., Efstathiou, P., Mpekas, P., and Asimakopoulos, D.: Heat waves observed in 2007 in Athens, Greece: Synoptic conditions, bioclimatological assessment, air quality levels and health effects, Environ. Res., 110, 152–161, https://doi.org/10.1016/j.envres.2009.12.002, 2010.
Tolika, K., Maheras, P., Pytharoulis, I., and Anagnostopoulou, C.: The anomalous low and high temperatures of 2012 over Greece – an explanation from a meteorological and climatological perspective, Nat. Hazards Earth Syst. Sci., 14, 501–507, https://doi.org/10.5194/nhess-14-501-2014, 2014.
Tomczyk, M. A.: Impact of atmospheric circulation on the occurrence of heat waves in southeastern Europe, Idojárás., 120, 395–414, 2016.
Tomczyk, M. A. and Owczarek, M.: Occurrence of strong and very strong heat stress in Poland and its circulation conditions, Theor. Appl. Climatol., 139, 893–905, https://doi.org/10.1007/s00704-019-02998-3, 2020.
Tošić, I. and Unkašević, M.: Analysis of wet and dry periods in Serbia, Int. J. Climatol., 34, 1357–1368, https://doi.org/10.1002/joc.3757, 2014.
Unkašević, M. and Tošić, I.: An analysis of heat waves in Serbia, Global Planet. Change, 65, 17–26, https://doi.org/10.1016/j.gloplacha.2008.10.009, 2009a.
Unkašević, M. and Tošić, I.: Heat waves in Belgrade and Niš, Geogr. Pannon., 13, 4–10, https://doi.org/10.5937/GeoPan0901004U, 2009b.
Unkašević, M. and Tošić, I.: The maximum temperatures and heat waves in Serbia during the summer of 2007, Climatic Change, 108, 207–223, https://doi.org/10.1007/s10584-010-0006-4, 2011.
Unkašević, M. and Tošić, I.: Trends in temperature indices over Serbia: relationships to large-scale circulation patterns, Int. J. Climatol., 33, 3152–3161, https://doi.org/10.1002/joc.3652, 2013.
Unkašević, M. and Tošić, I.: Seasonal analysis of cold and heat waves in Serbia during the period 1949–2012, Theor. Appl. Climatol., 120, 29–40, https://doi.org/10.1007/s00704-014-1154-7, 2015.
Urban, A. and Kyselý J.: Comparison of UTCI with other thermal indices in the assessment of heat and cold effects on cardiovascular mortality in the Czech Republic, Int. J. Environ. Res. Pu., 11, 952–967, https://doi.org/10.3390/ijerph110100952, 2014.
Vuković, J. A., Vujadinović, P. M., Rendulić, M. S., Djurdjević, S. V., Ruml, M. M., Babić, P. V., and Popović, P. D.: Global Warming Impact on Climate Change in Serbia, Therm. Sci., 22, 2267–2280, https://doi.org/10.2298/TSCI180411168V, 2018.
Yaglou, C. P. and Minard, D.: Control of heat casualties at military training centers, Am. Med. Assoc. Arch. Ind. Health, 16, 302–316, 1957.
Very strong heat stressdescribes an alarming biothermal state and has occurred frequently in the last 10 years. The findings indicate the UTCI14 h index
very strong heat stress event(VSHSE) as an indicator of biothermal heat hazard.