the Creative Commons Attribution 4.0 License.
the Creative Commons Attribution 4.0 License.
 | 22 Jul 2020
Spatial database and website for reservoir-triggered seismicity in Brazil
George Sand França
Maristela Holanda
Alexandro Gonçalves
After confirming that impoundment of large reservoirs could cause earthquakes, studies on reservoir-triggered seismicity (RTS) have had a considerable scientific incentive. Most of the studies determined that the vertical load increase due to reservoir load, and the reduction of effective force due to the increase in pore pressure, can modify the stress field in the reservoir region, possibly triggering earthquakes. In addition, the RTS is conditioned by several factors such as pre-existing tectonic stresses, reservoir height/weight, area-specific geological and hydromechanical conditions, constructive interaction between the orientation of seismotectonic forces, and additional load caused by the reservoir. One of the major challenges in studying RTS is to identify and correlate the factors in the area of influence of the reservoir, capable of influencing the RTS process itself. A spatial seismicity-triggered reservoir database was created to facilitate the research in this field, based on the specifications of the national spatial data infrastructure (INDE), and to assemble data pertinent to the RTS study in the area of reservoirs. In this context, this work presents the procedures and results found in the data processing of seismotectonic factors (dam height, reservoir capacity, lithology, and seismicity) and compared first to the dams that triggered earthquakes and secondly to the Brazilian dam list. The list has been updated with four more cases, making a total of 30 cases. The results indicate that the occurrence of RTS increases significantly with dam height since dams less than 50 m high cause only 2 % of earthquakes while those higher than 100 m cause about 54 %. The reservoir volume also plays a role, and it was estimated that RTS occurrence requires a limiting minimum value of km3. There was no clear correlation between the geology and geological provinces with RTS. The delayed response time of the reservoirs represents 43 % of the total; that is, almost half of them have hydraulic behavior. The highest magnitude, 4.2, was observed at a reservoir with a volume greater than 10−3 km3. As a practical outcome, to assist the analysis by the general community, the web viewer RISBRA (Reservoir Induced Seismicity in Brazil) was developed to serve as an interactive platform for Reservoir-Triggered Seismicity Database (BDSDR) data.
- Article
(15191 KB) - Full-text XML
- BibTeX
- EndNote


The reservoir-triggered seismicity (RTS) phenomenon was first observed during the filling of Lake Mead at the Hoover Reservoir (US) in the mid-1930s, and occurrences of RTS in the case of the following reservoirs was also detected: Hsinfenghiang (China), Kariba (Zambia), Kremasta (Greece), and Koyna (India) in the late 1960s (Marza et al., 1999). Currently, there are more than 150 events identified as RTS (Gupta, 2002; Wilson at al., 2017; Foulger at al., 2017), and the worst case may be the major earthquake in May 2008 in Sichuan, China. The 7.9 magnitude earthquake killed about 80 000 people, broke nearly 300 000 m of fault,w and damaged 2380 dams, including the 156 m high Zipingpu Dam (International Rivers, 2009) (Fig. 1). Filling large reservoirs, mining underground mines, injecting high-pressure fluids into deep wells, removing fluids during oil exploration, and the aftereffects of large nuclear explosions can cause earthquakes (Simpson, 1986). Among these, we highlight the RTS phenomenon related to geoengineering works that can have major social, economic, environmental, and legal impacts, among others.
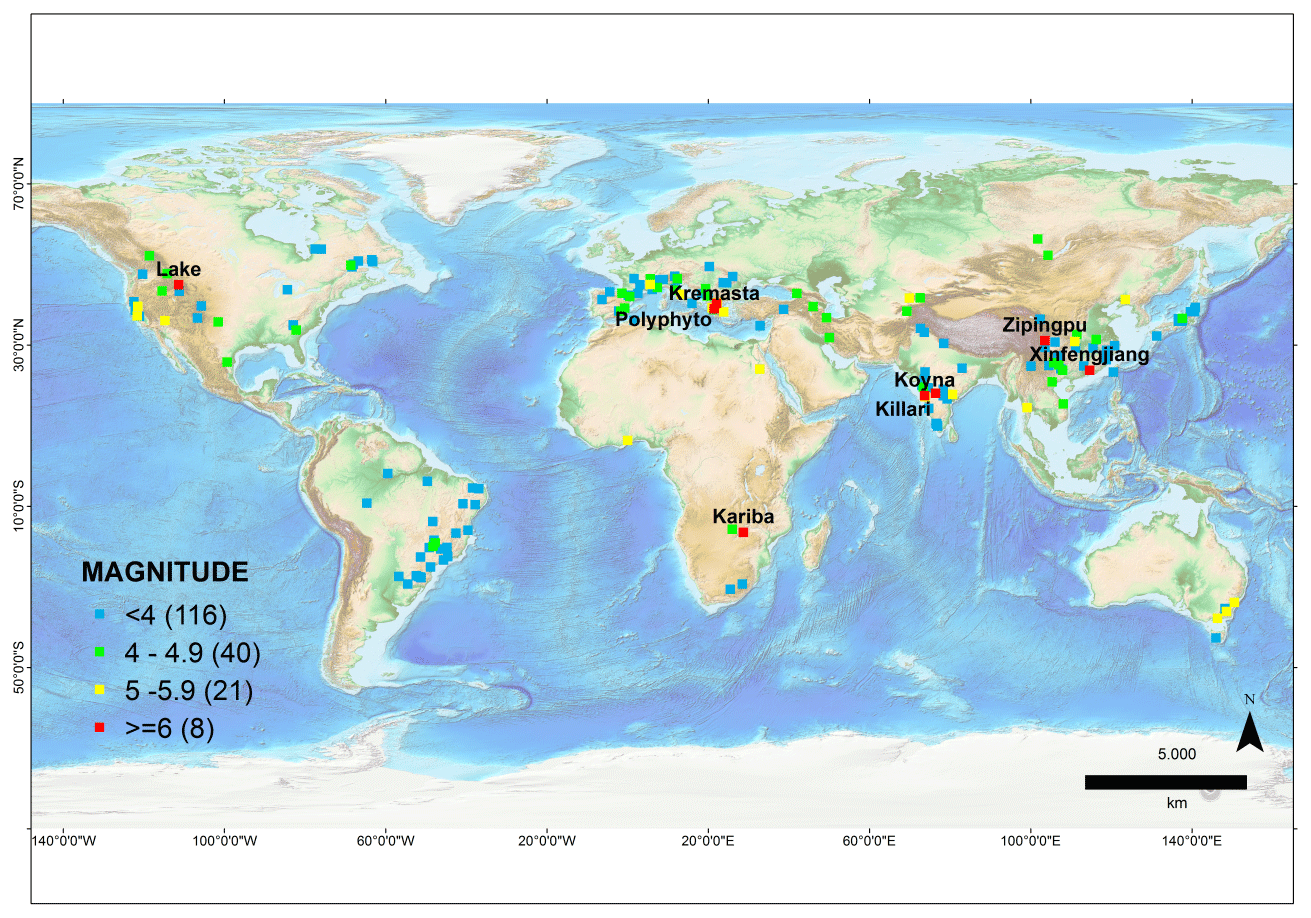
Figure 1World map of events triggered by reservoirs. (Data from the http://inducedearthquakes.org/; last access: 10 May 2020.)
In Brazil, the first RTS case was a 3.7 magnitude earthquake with intensity V–VI (MMI) recorded at the reservoir of Carmo do Cajuru, MG, in 1971. Approximately 185 RTS cases are known worldwide, of which 30 happened in Brazil (Foulger et al., 2017; Wilson et al., 2017) (Fig. 1). There are several studies on reservoirs capable of triggering earthquakes (Assumpção et al., 2002; Ferreira et al., 2008; Veloso and Gomide, 1997); few of them, however, correlate the physical and geological information as possible agents of the triggered earthquakes. Making this correlation expands the ability to understand this phenomenon. Thus, this work presents the procedures and results found in the data processing concerning the following parameters (height, volume, area, geology, and local seismicity level) and comparing them with the dams that triggered earthquakes and the Brazilian dam catalog. Finally, a spatial database model of the reservoirs and their geological and geophysical characteristics was developed.
This work is based on the work developed by the Comissão Nacional de Cartografia (CONCAR, 2010) and the Technical Specification for the Structuring of Vector Geospatial Data of Defense of the Earth Force – ET-EDGV (BRASIL, 2015, 2016). Because these specifications are still being developed, the diagrams of the dam systems are not yet adequately represented. The amount of information and probable effects of RTS require the standardization of information, which was accomplished in accordance with the National Spatial Data Infrastructure (INDE).
The work is based on the OMT-G (Object Modelling Technique for Geographic Applications) model (Davis, 2000; Borges et al., 2001, 2005) also used in these documentations. This model aims to be more faithful to the modeled reality by using a smaller set of graphic objects than would be used in other models for geographic data.
The motivation for creating the Reservoir-Triggered Seismicity Database (BDSDR) arose from the research in the cases that occurred in Brazilian reservoirs when observing the lack of cohesion of information, pertinent to the study, presenting only isolated cases or listing with the locations of occurrences.
According to the NeDiMAH WG4 the use of digital collections for research has an impact on the creation, management, and long-term sustainability of digital data, and the use of digital resources for the creation and publication of new knowledge is a vital part of the digital life cycle. Then we used this group as the basis of our database (NeDiMAH Working Groups and European Science Foundation, 2020). The purpose of the database is to gather all the available information such as physical, structural, geological, and geophysical data on each reservoir and to store it in a standardized way while sharing and making it accessible so that the database can assist in RTS studies.
2.1 National Spatial Data Infrastructure (INDE/NSDI)
The body responsible for developing spatial data structures is the Comissão Nacional de Cartografia (CONCAR) that is linked to the former Ministry of Budget and Management Planning. CONCAR is responsible for elaborating the technical specifications related to the spatial data that make up the Infraestrutura Nacional de Dados Espaciais (INDE), regulated by decree no. 6.666/2008. According to this decree, INDE is an integrated set of technologies, policies, mechanisms, and procedures for coordinating and monitoring standards and agreements, necessary to facilitate the storage, access, sharing, dissemination, and use of geospatial data that belong to the federal, state, district, and municipal spheres of government (BRASIL, 2008).
The spatial data infrastructure defines the standards for the data composition and can be presented as a technical specification. In 2006, CONCAR set up the Specialized Committee for the Structuring of the Digital National Map (CEMND), which developed the Technical Specifications for the Structuring of the Geospatial Vector Data (ET-EDGV) for application in the National Cartographic System (SCN) and INDE (CONCAR, 2017).
The specifications proposed for the EDGV (CONCAR, 2017) divide the Brazilian geographical space into two groups. The first group consists of the object classes usually produced in small-scale mapping (MapTopoPE), elaborated in the systematic mapping of the National Cartographic System (SCN) (scales of 1:25 000 and smaller). The second group consists of the object classes usually acquired in the topographic mapping of large scales. This work will use only the small-scale topographic model.
MapTopoPE is divided into 14 categories: energy and communications (ENC), economic structure (ECO), hydrography (HID), boundaries/limits and localities (DML), reference points (PTO), relief (REL), basic sanitation (SAB), vegetation (VEG), transport system (TRA), transport system/airport subsystem (AER), transport system/duct subsystem (DUT), transport system/rail subsystem (FER), transport system/hydro subsystem (HDV), and transportation system/road subsystem (ROD).
In conceptual modeling, the object classes are grouped into categories with common functional aspect. Among the categories, the hydrography package covering the dam class is the class of interest for this paper. However, the other classes inserted in the proposed model do not have definitions pre-established by the INDE. According to the INDE Action Plan (CONCAR, 2017), the data or datasets associated with each of these EDGV classes are considered to be reference geospatial data in the INDE.
The action plan for implementing INDE classifies the data into thematic and reference data. Thematic data are sets of data and information on a phenomenon or a theme, such as climate, education, vegetation, and industry, among others, in a region or across the country. Whereas, according to CONCAR (2010), the reference data are defined as
datasets that provide general information of non-particular use, elaborated as indispensable bases for the geographic referencing information on the surface of the national territory and can be understood as basic inputs for georeferencing and geographical contextualization of all the specific territorial themes.
To implement the data in the database management system, three phases are required: conceptual modeling, logical modeling, and physical modeling or implementation. This same method is used for modeling spatial databases.
3.1 First phase: conceptual modeling
Conceptual modeling is not directly linked to implementation; its main objective is to capture the semantics of the problem and the needs of the study in question (Cardoso and Cardoso, 2012).
The OMT-G (Object Modelling Technique for Geographic Applications) data model was used to create the conceptual model of the Reservoir-Triggered Seismicity Database (BDSDR). This model was chosen following the NSDI specification.
Which entities would compose this database and which attributes each one of them possesses was analyzed. We also check which entities are related and define the cardinality of each relationship. From the studies on the metadata archives of the seismological data, a model consisting of 20 entities it was initially defined: stress regime, fault orientation, fault mechanism, chronostratigraphy, structure, lithology, reservoir, dam, federative unit, municipality, hydrometry, magnetometry, electromagnetometry, gravimetry, pluviometry, regional stress regime, hydrography, crustal thickness, seismic event, and seismographic station.
Table 1Explanation of the OMT-G model for the reservoir-triggered seismicity database.
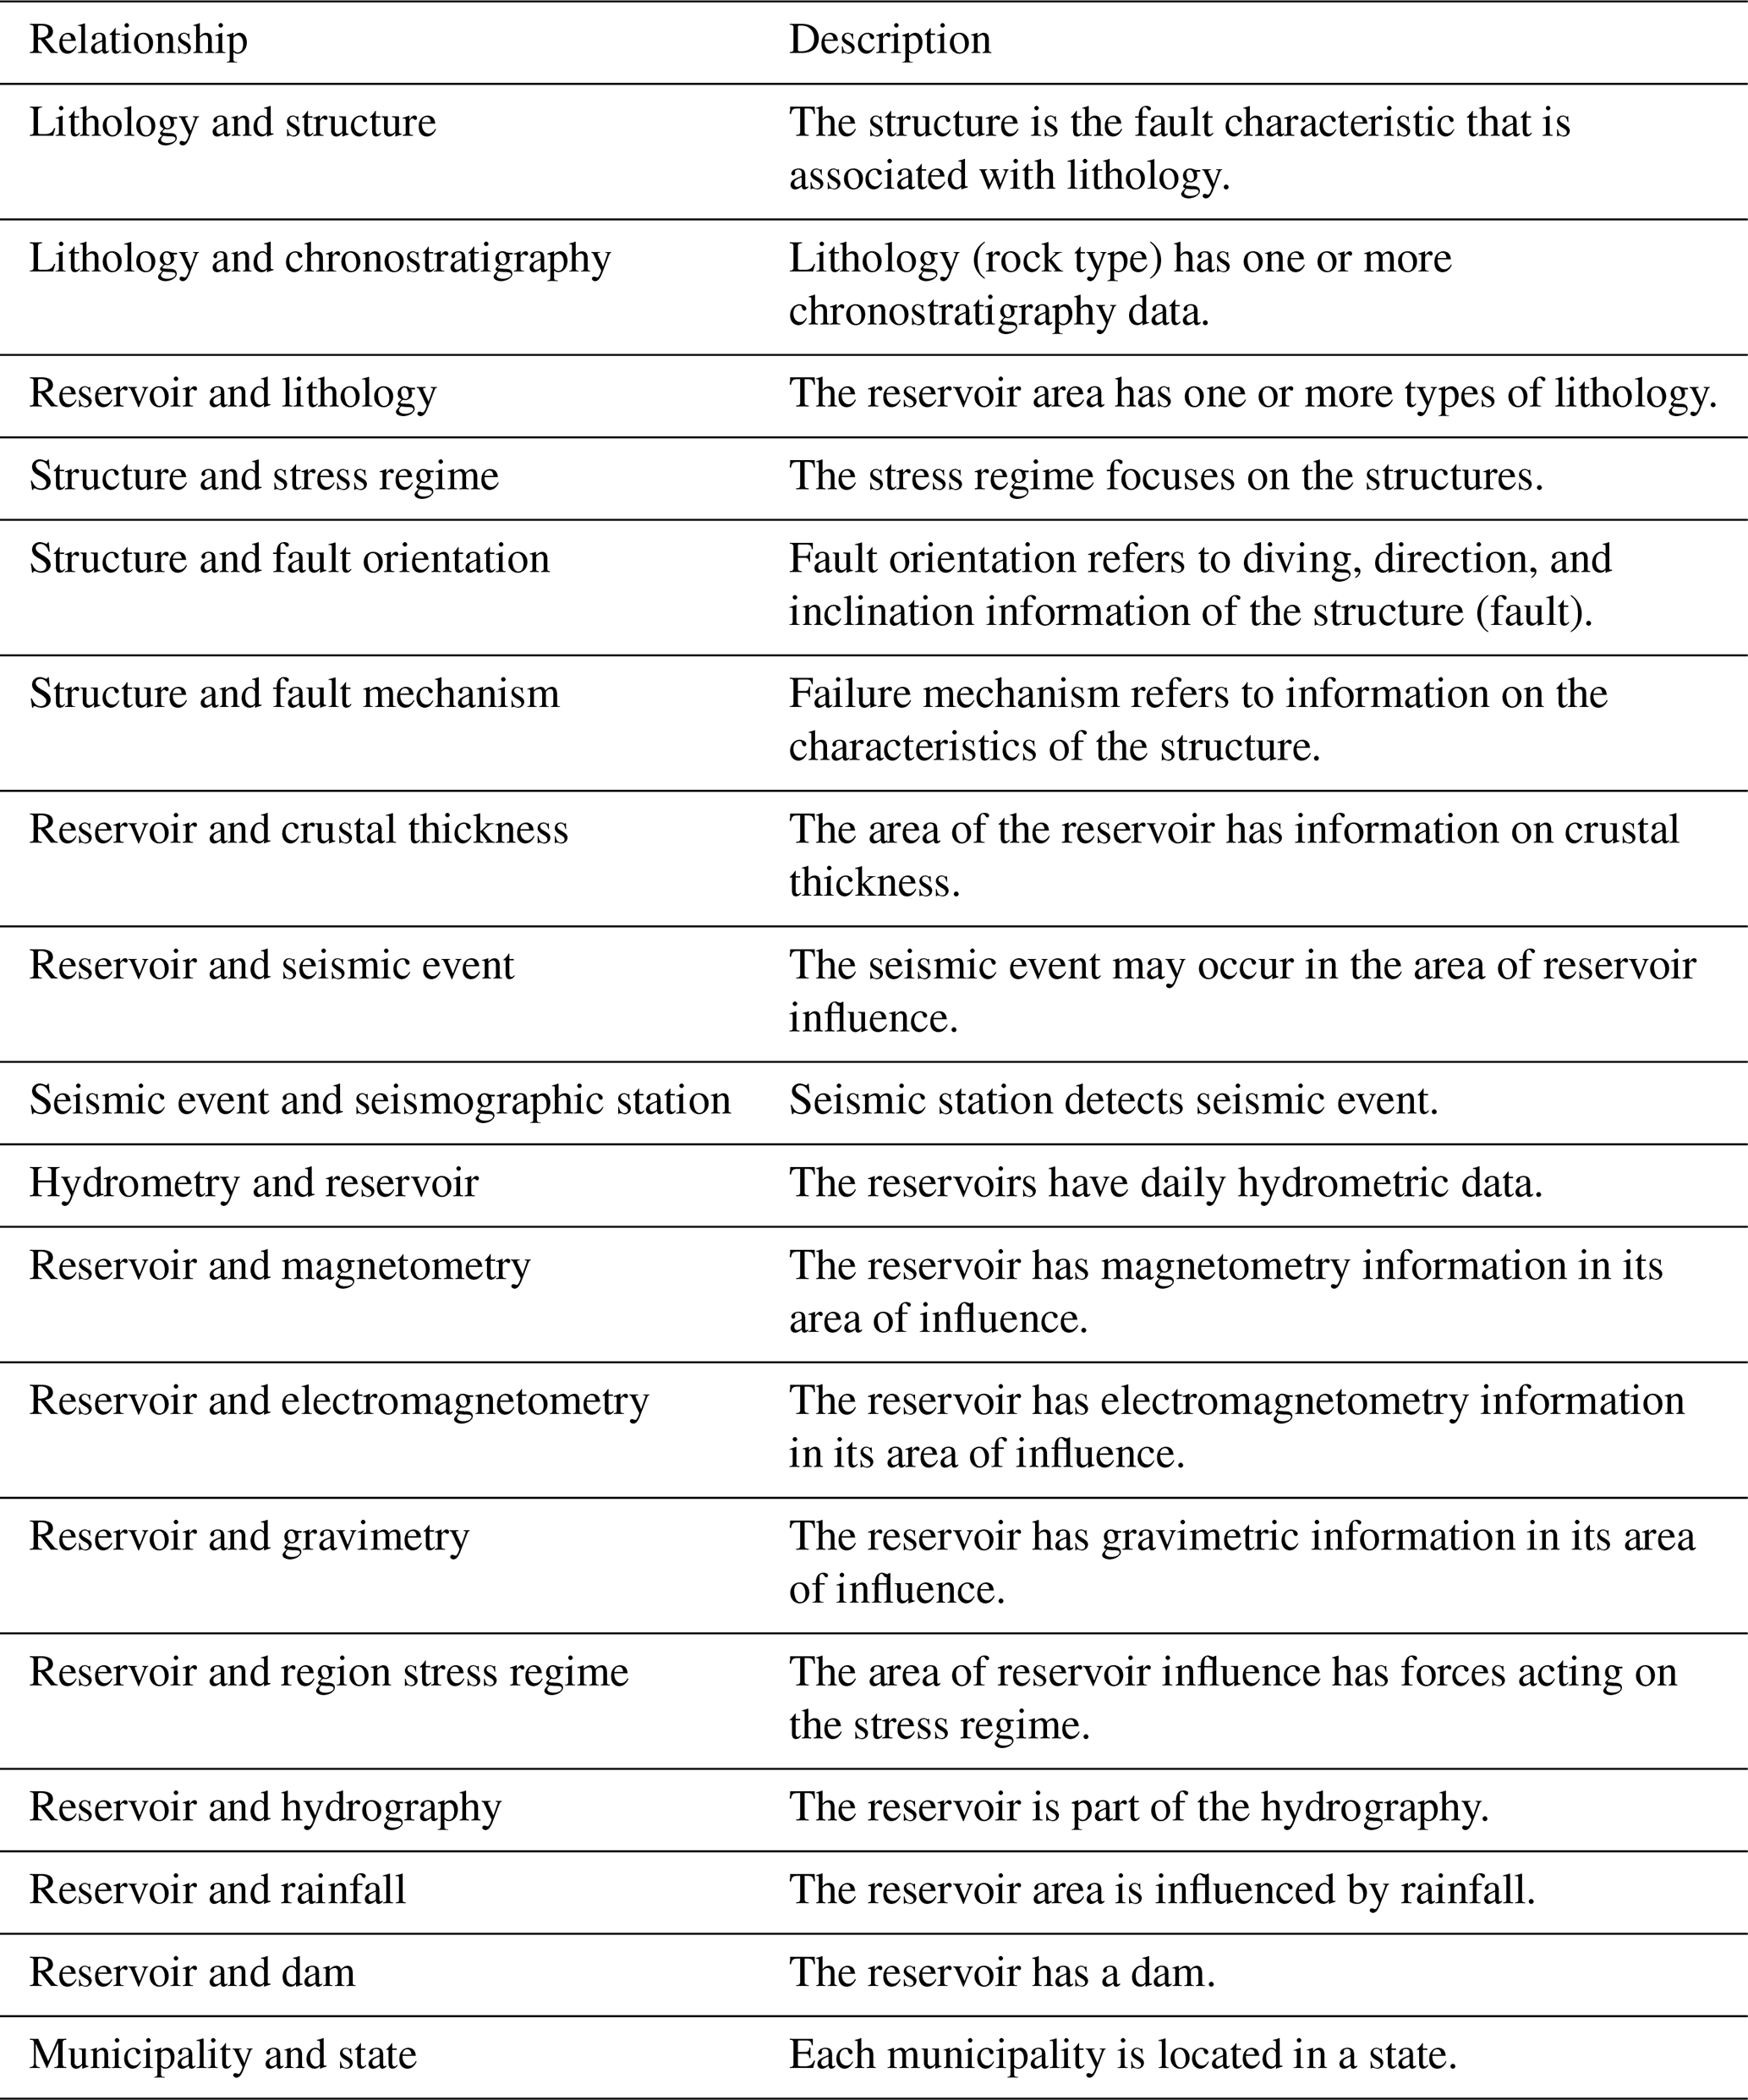
In this process, it was observed that a reservoir (main entity) is related to hydrometric entities, dams, municipalities, gravimetry, chemical events, crustal thickness, hydrography, the region's stress regime, pluviometry, electromagnetism, and magnetometry. So, as it is an entity with the highest number of relationships, it is placed at the center of the model. Opt for the OMT-G model to elaborate the conceptual model, as Borges et al. (2005) models like this are better suited to the needs of geographical applications, both in the form of presentation and in the way of relating. So, when using the OMT-G model, it is easily identifiable how conceptual or relational tables are non-geographic data or a type of geographic data that the table represents. When creating tables in the OMT-G model, the user applies the type of geographic data similar to the correct mode or type of display for an entity. So, if an entity is implemented in the database, it will be a table point other than the upper left corner, a star; if it is a polygon or a multipolygon, in its upper left corner, and so on. The types of representation used in this modeling were point – represented by a star, polygon or multipolygon – represented by a square, line – represented by a line, and a level variation – represented by isolines.
Figure 2 presents the conceptual model based on OMT-G, developed in the StarUML 5.0.2.1570 software while Table 1 explains each relationship of the OMT-G model.

3.2 Second phase: logical modeling
Creating the reservoir-triggered seismicity database in a database management system (DBMS) required transforming the conceptual model into an implementation model. This transformation consists of converting the OMT-G model into the relational model (MR) that represents the data in the database as a collection of relationships (tables).
At this stage, key attributes such as imposing relational integrity, creating unique indexes, attributing data types, and the height of the fields to store information are defined and identified.
Finally, the relational model was implemented after completing the process of developing the conceptual model. A creation of the relational model consists of taking elaborated tables in the conceptual model and inserting them as primary key identifications in the key characters and inserting the type of each attribute (integer, real, text, char, varchar, etc.). It can be seen in the figures of both the conceptual and the relational model that the screens are executed by dotted lines, because the OMT-G model entities with georeferenced characteristics are applied by dotted lines. And if a simple (nonspatial) relationship is performed, an indication of this relationship is made by continuous lines.
The logical model was created using the StarUML 5.0.21570 software.
Figure 3 shows the BDSDR relational model that was created from this conversion.

3.3 Third phase: physical modeling
The last phase of the database design consists of creating a physical schematic, which depends on the used database management system (DBMS) (Cardoso and Cardoso, 2012). DBMS is the set of computer programs that can change the logical and physical structure of the database. The degree of freedom of the data is higher than in the older systems (Teorey et al., 2014).
Database management systems use database management software (DBMS), for example Medeiros (2012). For the development of the spatial database, in Linux environment, PostgreSQL (2018) was used with raster extensions PostGIS (2018), pgAdmin III (2018), and Quantum GIS (QGIS, 2018) version 3.12.
Most database management systems do not support the spatial data implementation natively, requiring the use of spatial extensions. The extension used in the implementation of BDSDR was PostGIS 2.4. The PostgreSQL is an open-source object-relational database management system that allows anyone to study, modify, and distribute the software free of charge for any purpose. Object relational refers to the spatial database system optimized for storing and querying data related to objects in space, including points, lines, and polygons (Elmasri and Navathe, 2011).
3.4 Web viewer
A web viewer is an interactive map in an application that allows the user to interact with elements on the map and obtain information on these elements.
The web viewer, named RISBRA (Reservoir Induced Seismicity in Brazil), was created using the leaflet, Node.js, and Redis libraries. Leaflet is an open-source JavaScript library for interactive maps that provides great tools for implementing map applications for browser interaction (Leaflet, 2018). Redis is an open-source network application, in-memory data structure store, used as a database, cache, and message broker (Redis, 2018). Finally, Node.js is an open-source JavaScript interpreter that focuses on migrating client-side JavaScript to the server side (Node.js, 2018).
We developed a menu, named LAYERS, which contains all the tables of the bank that can be represented in the map. Figure 4 shows the RISBRA interface and the earthquake icon selected. The image shows the table layers, where the data can be accessed by the user at any time (reservoir, dam, crustal thickness, seismographic station, structure, seismic event, hydrography, lithology, fault orientation, pluviometry, stress regime, triggered earthquakes, chronostratigraphy, and fault mechanism). The data are arranged in the interactive map using icons with the conventional symbology of different formats and colors. All elements are georeferenced on the map of Brazil. The zoom tool in the lower right corner of the screen allows the map to be expanded to the street level.
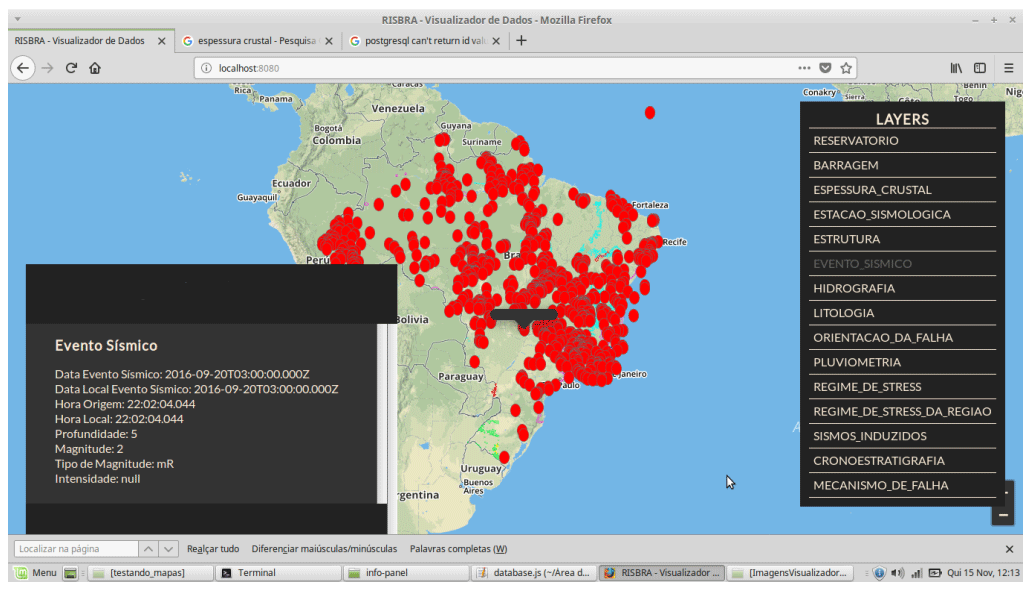
Figure 4Example of researching Brazilian seismicity in RISBRA. The seismic events are represented by the red ball and table to the left with information regarding this seismic event layer.
3.5 Reservoir-triggered seismicity list updated for the database
Data linked to geology and/or geophysics are dispersed, varying from reservoir to reservoir. The Brazilian bibliography of dam studies presents isolated cases and a general listing of the cases. Marza et al. (1999) created the reservoir-triggered seismicity list, which was later updated by Assumpção et al. (2002), França et al. (2010), and Barros et al. (2018). However, a systematic database containing this information has not yet been established.
From 1966 to 2018, 626 events were classified as RTS using Geiger's method (data from the seismic bulletin of the IAG-USP and SISBRA-Brazilian bulletin cataloged by SIS-UnB), with seismic recurrence in several dams, the largest being 4.2 recorded in the dams of Porto Colombia and Volta Grande, at the border between the states of Minas Gerais and São Paulo. Figure 5 shows a histogram for the 367 events with a magnitude greater than 1, according to the data from the seismic bulletin of the IAG-USP and SISBRA (Brazilian bulletin cataloged by SIS-UnB). This histogram clearly shows the seismic swarms in the Itapebi and Carmo Cajuru dams in 2003 and Lajeado and Nova Ponte in 2006. These swarms were well monitored by local networks. The histogram also shows the increased monitoring and dam construction since 2002 (Oliveira, 2018).
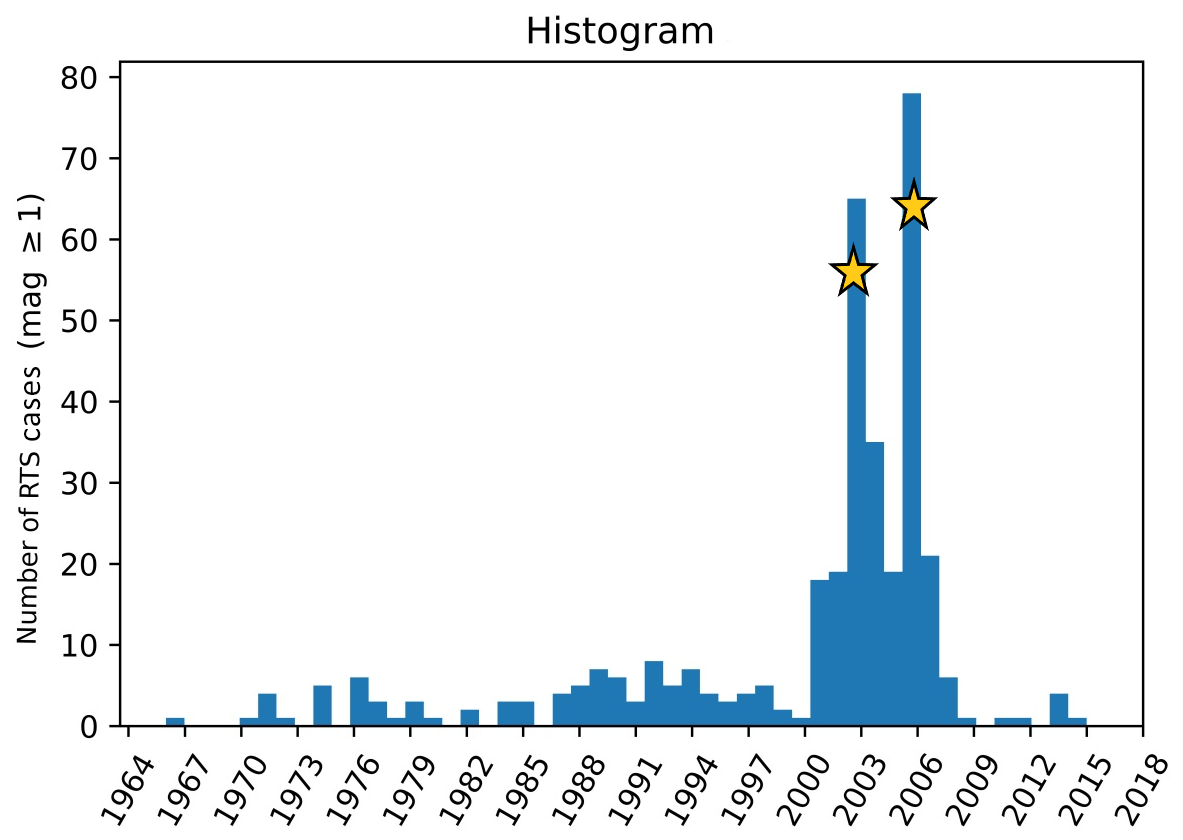
Figure 5Histogram of the RTS numbers with a magnitude greater than 1, per year. The yellow stars highlight the seismic swarms at the Itapebi and Carmo Cajuru dams in 2003 and Lajeado and Nova Ponte in 2006.
In this work, the RTS cases are compared using the unified list (Table 2), where the maximum magnitude recorded in each dam is considered from the reviewed list of all Brazilian dams. The objective is to calculate the potential for triggering an earthquake according to dam height, reservoir capacity, lithology, and seismicity. Therefore, we use the data available in the National Register of Dams from the Brazilian Committee of Dams which lists a total of 1413 dams with different purposes. We selected a total of 348 reservoirs, at least 20 m high, built for producing electricity (hydroelectric), except for the Açu and Castanhão reservoirs that fight drought and irrigation, respectively. Dams lower than 20 m high were discarded since these dams have low probability of triggering earthquakes (e.g., Assumpção et al., 2002).
Table 2Seismicity cases triggered in Brazil.
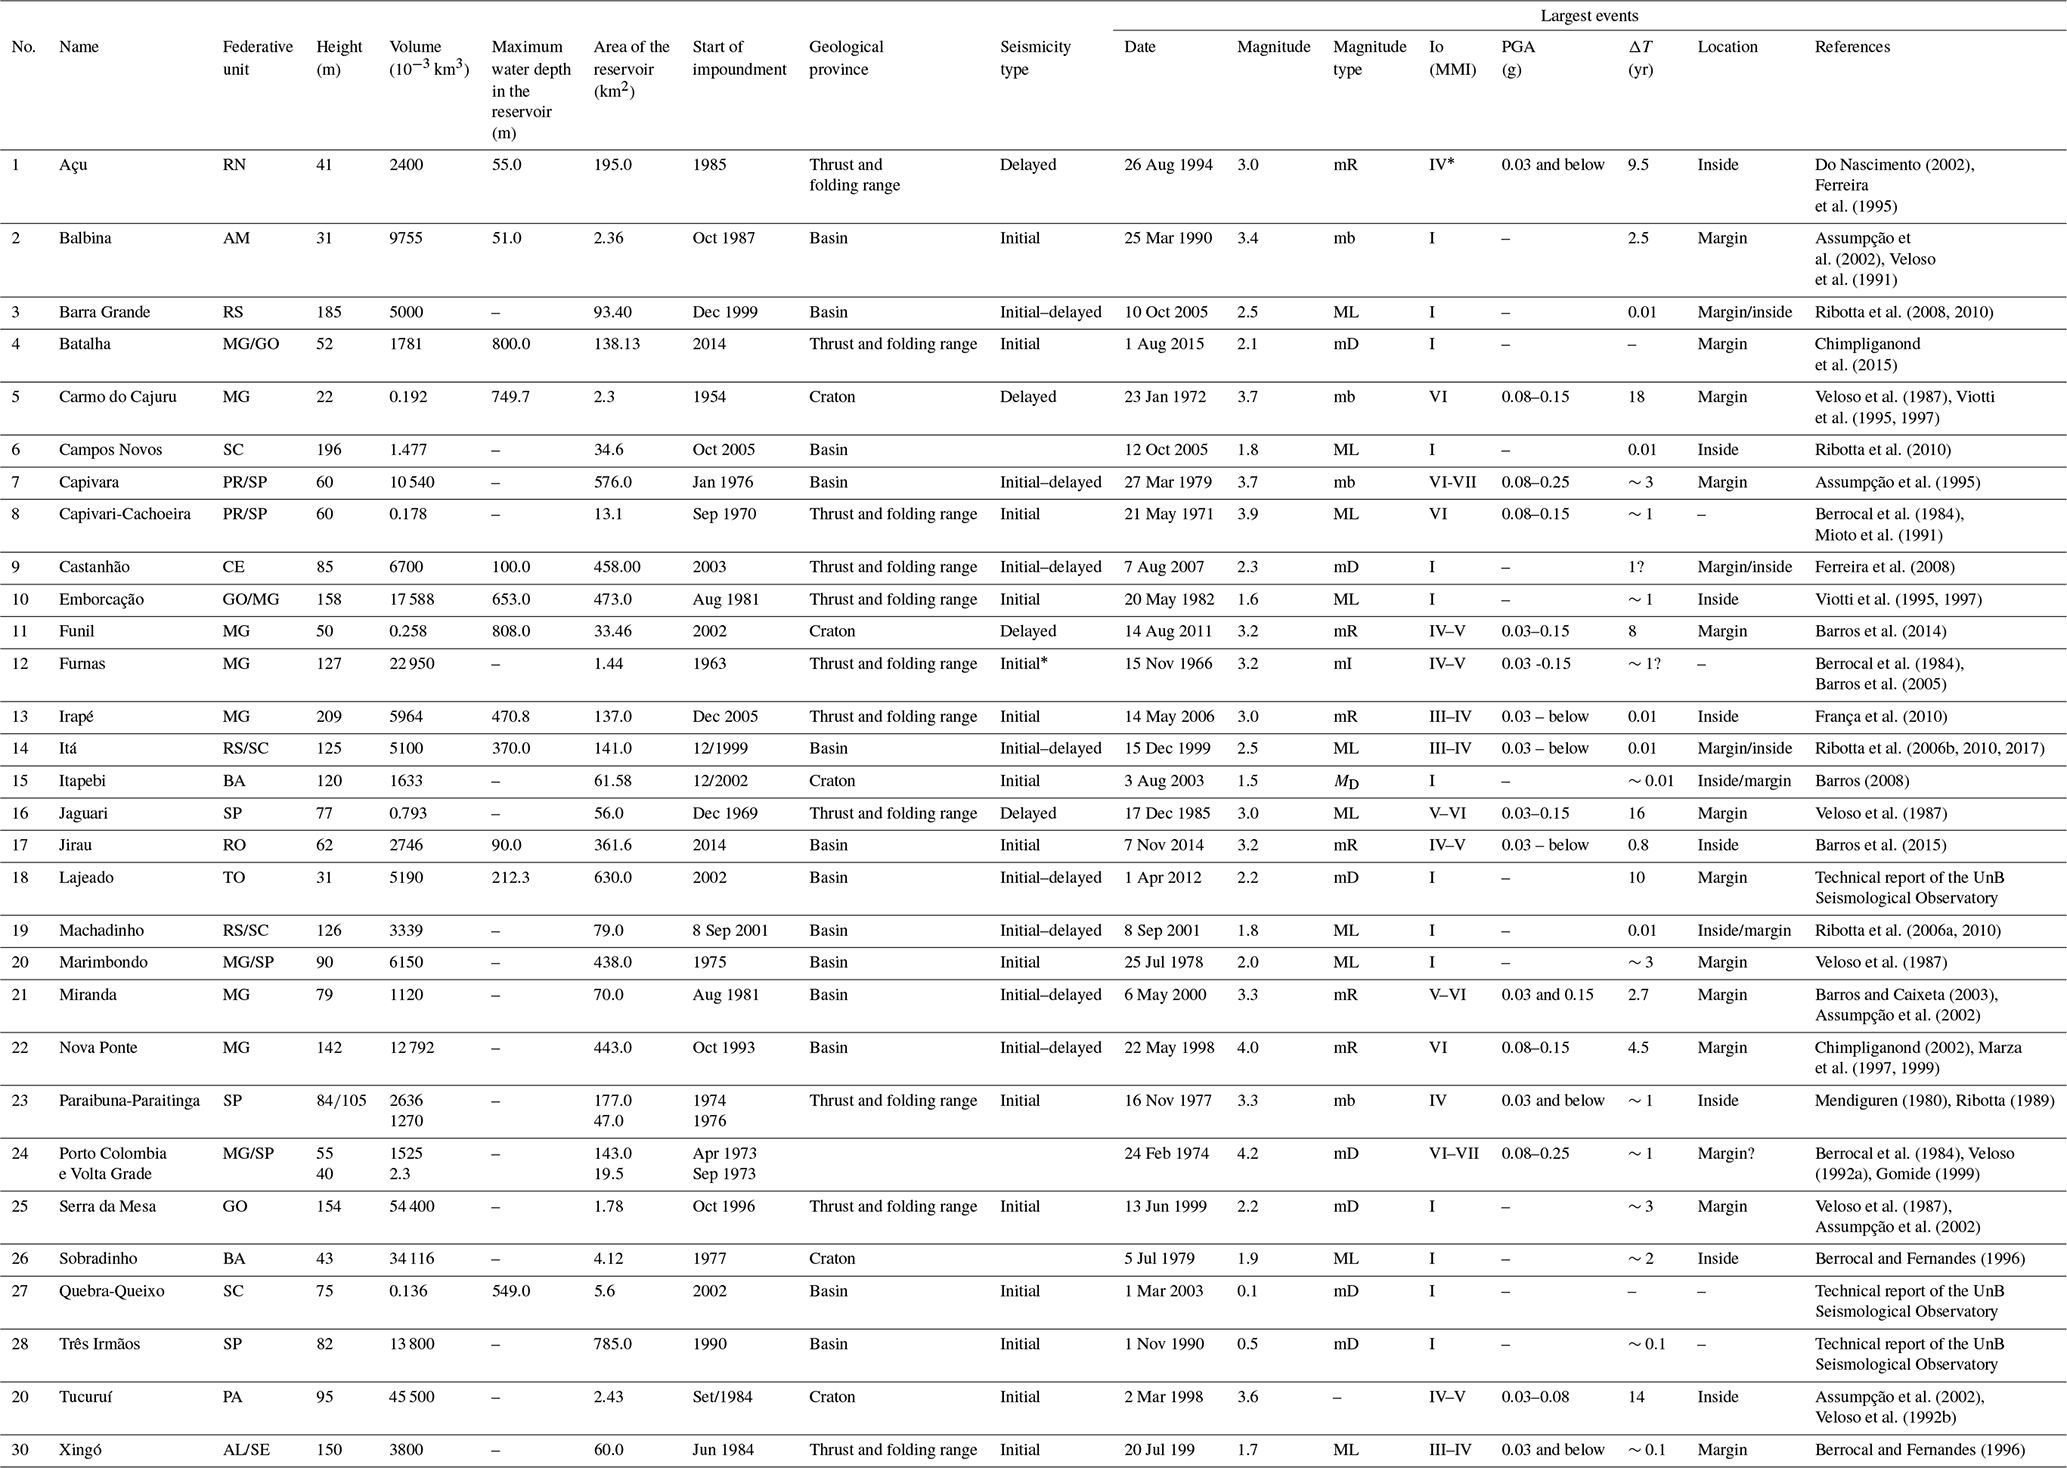
ΔT: time interval (years) since the beginning of filling; MMI: modified Mercalli scale; doubtful cases; PGA(g): peak ground acceleration; adapted by Marza et al. (1999).
Table 2 and Fig. 6 present the updated RTS cases, which increased from 17 (Marza et al., 1999) to a total of 30 cases. Table 2 is based on the work of Marza et al. (1999), to which we added other data such as area of reservoirs, type of seismicity, maximum magnitude, predominant geological type of the reservoir (craton, fold, and thrust belt and basins), location of the event in relation to the reservoir, and the references.
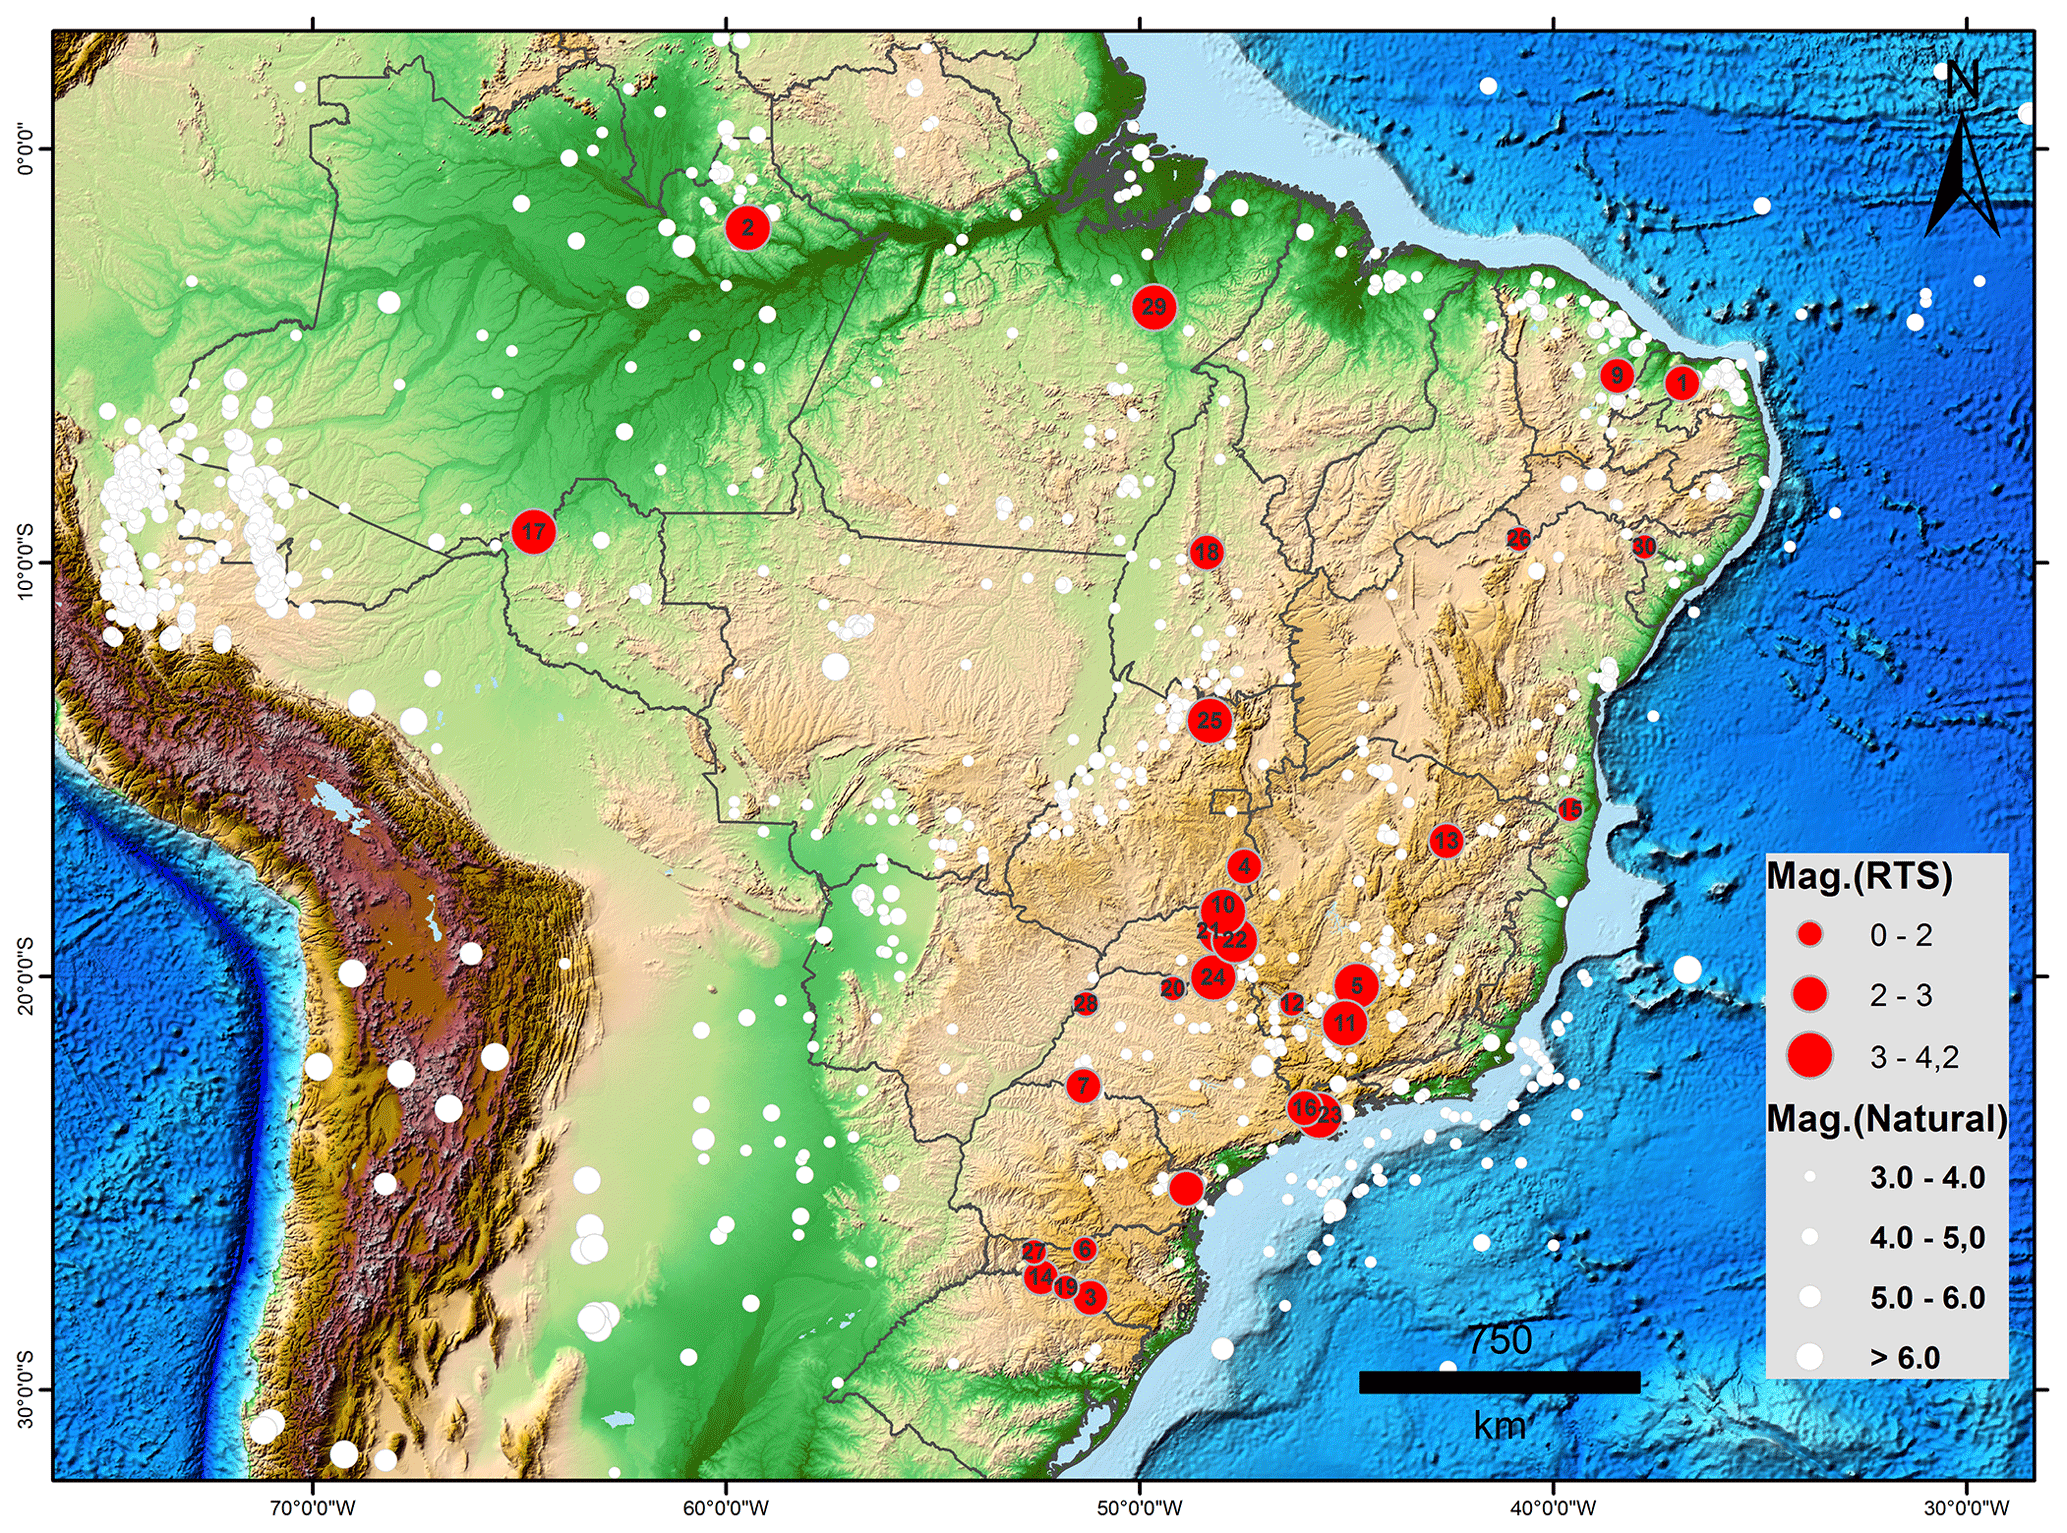
Figure 6Map of Brazil showing natural earthquakes (white circles, with magnitude) and RTS in Brazil (red circles, with magnitude, numbered as stated by Table 2). Data from the bulletin of the IAG-USP and SISBRA-UnB.
The known RTS cases have significant common features, especially during the initial filling phase of the reservoir, when reservoir-triggered earthquakes generally begin to occur. Factors such as dam height, volume, area, local geology, maximum magnitude, and seismicity in the region may interfere with RTS; each one of these factors is addressed below.
4.1 RTS
In general, from the total of 348 reservoirs, only 8.6 % of those presented RTS, and only two events had a maximum magnitude greater than or equal to 4.0 (Table 3 and Figs. 7 and 8). Regarding damage, the highest seismic intensity of VI–VII (MMI) or peak ground acceleration (PGA) of 0.08–0.25 was estimated in Porto Colombia and Volta Grande while the seismicity type was mostly initial (Table 2).
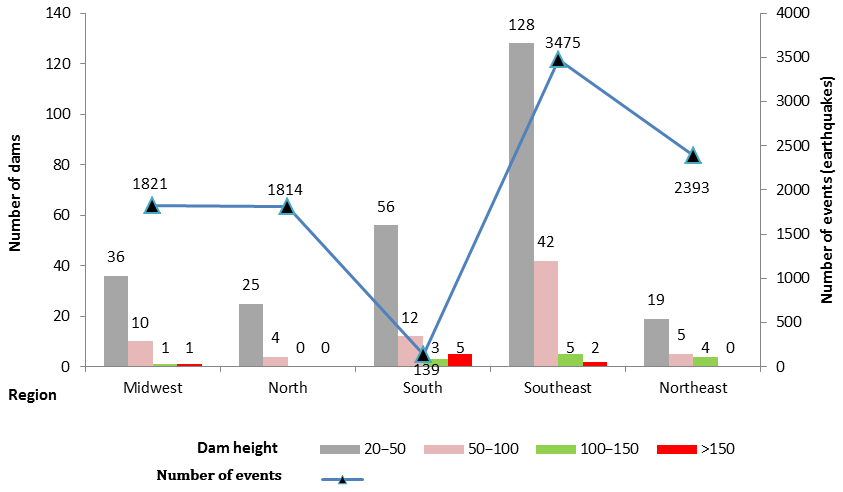
Figure 7Graph showing the earthquakes, dams, and regions of the country. The southeastern region concentrates the highest and the most dams in the country.
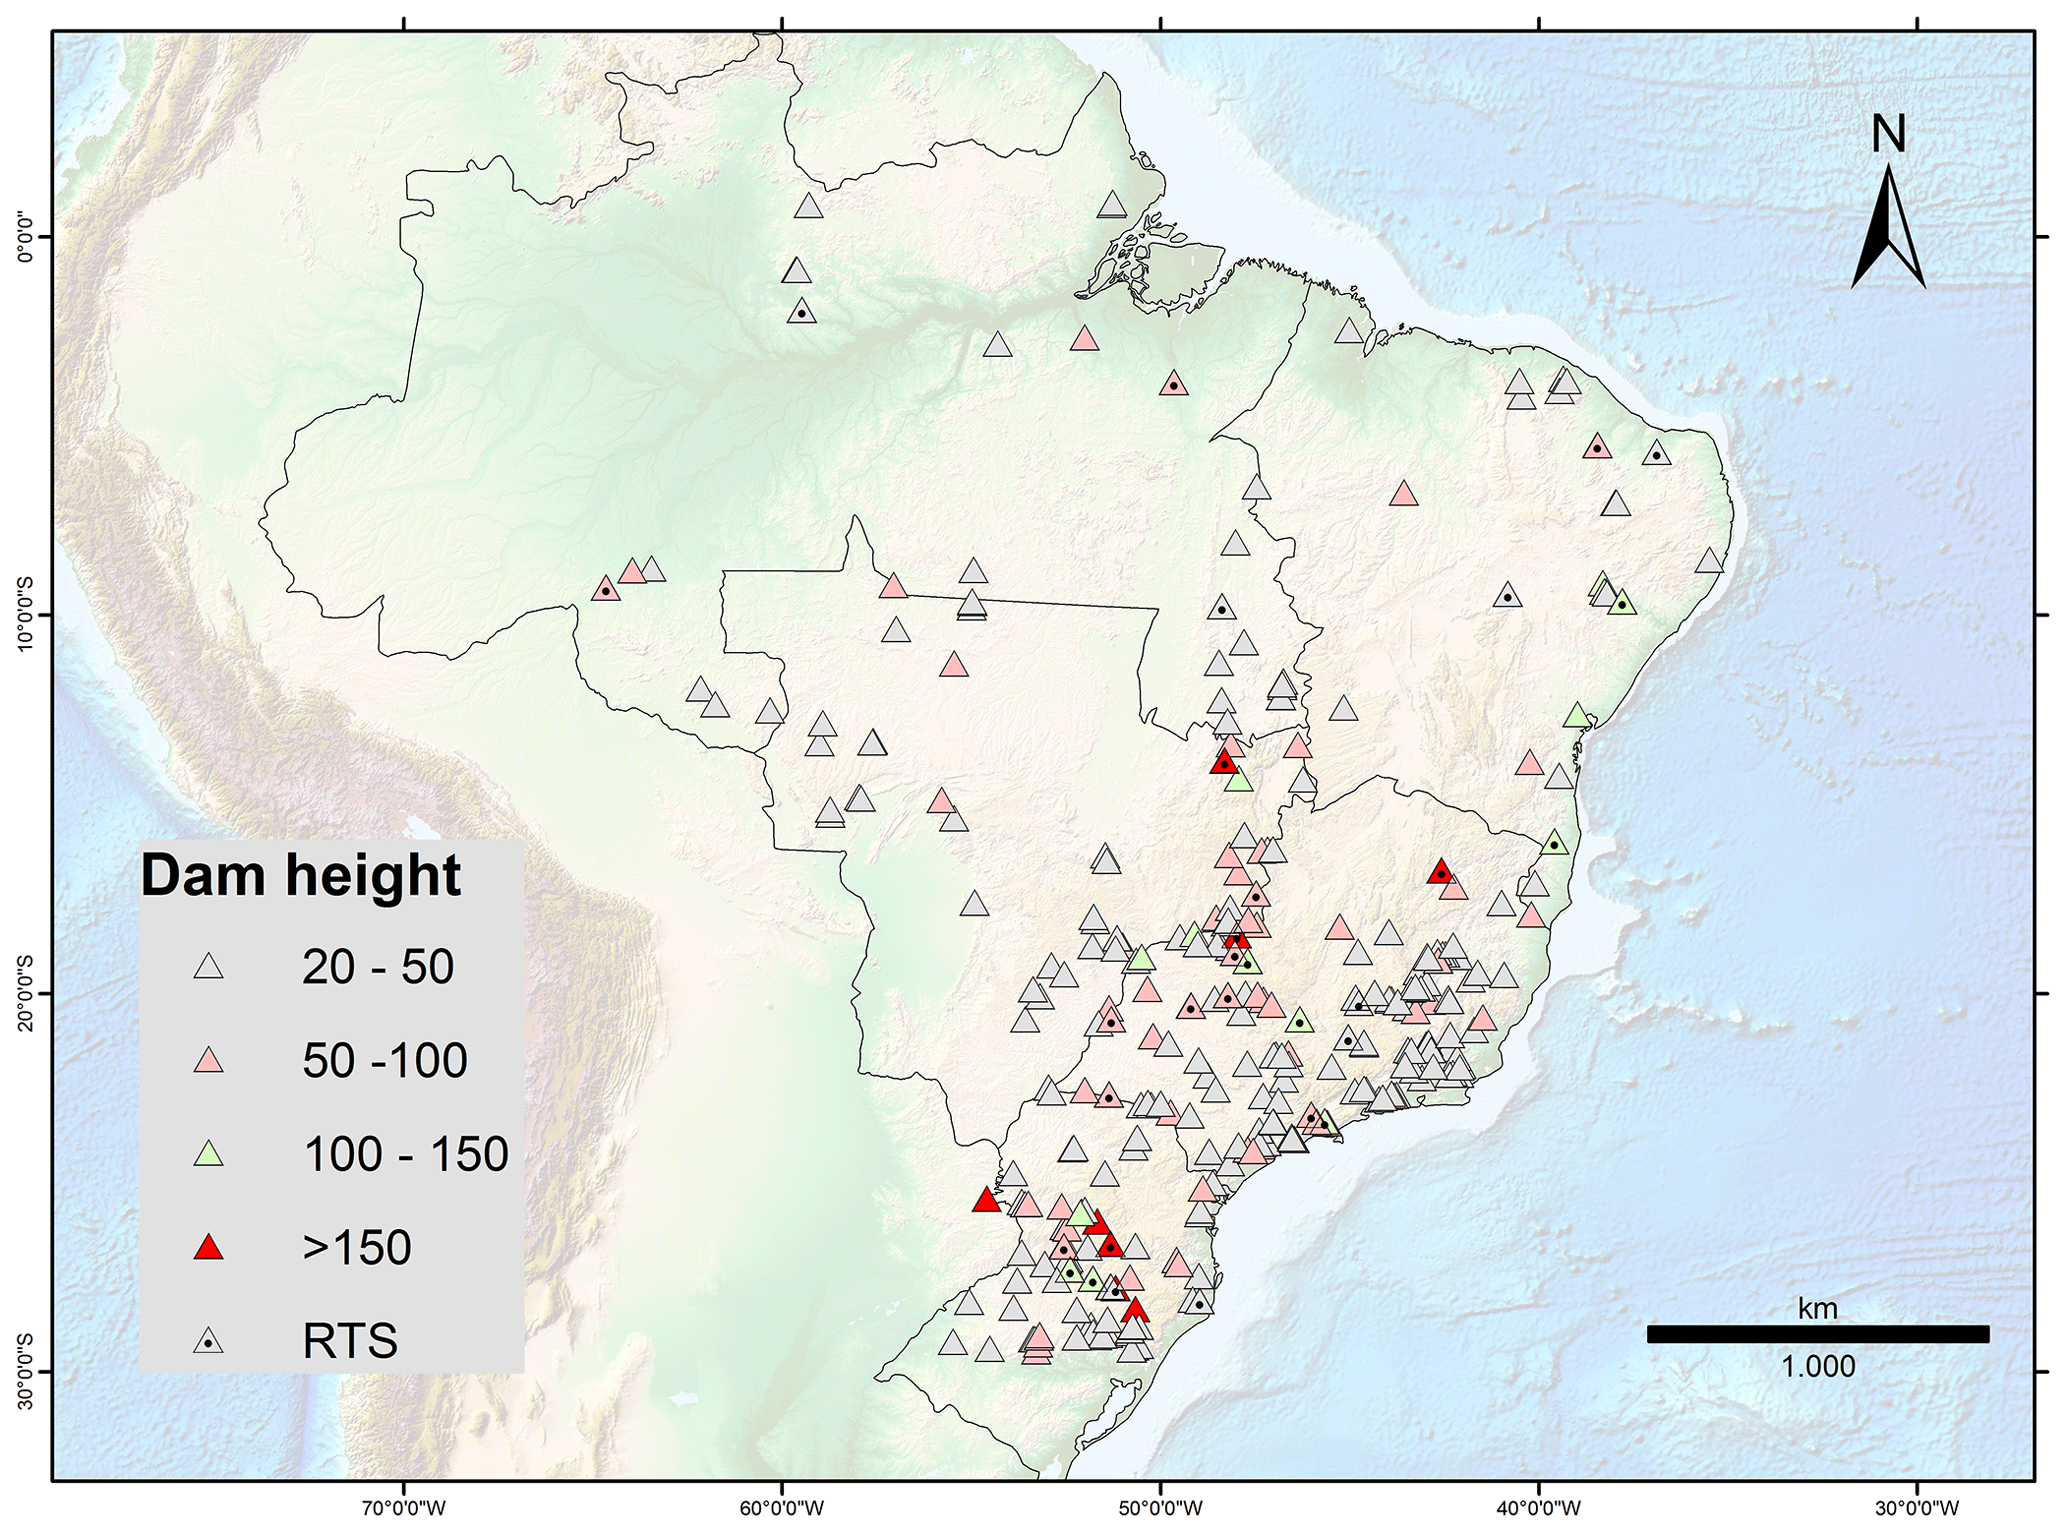
Figure 8Map showing the location and classification by the dam height. Data by Brazilian Committee on Dams.
Table 3Number of dams, RTSs and natural earthquakes by country regions.
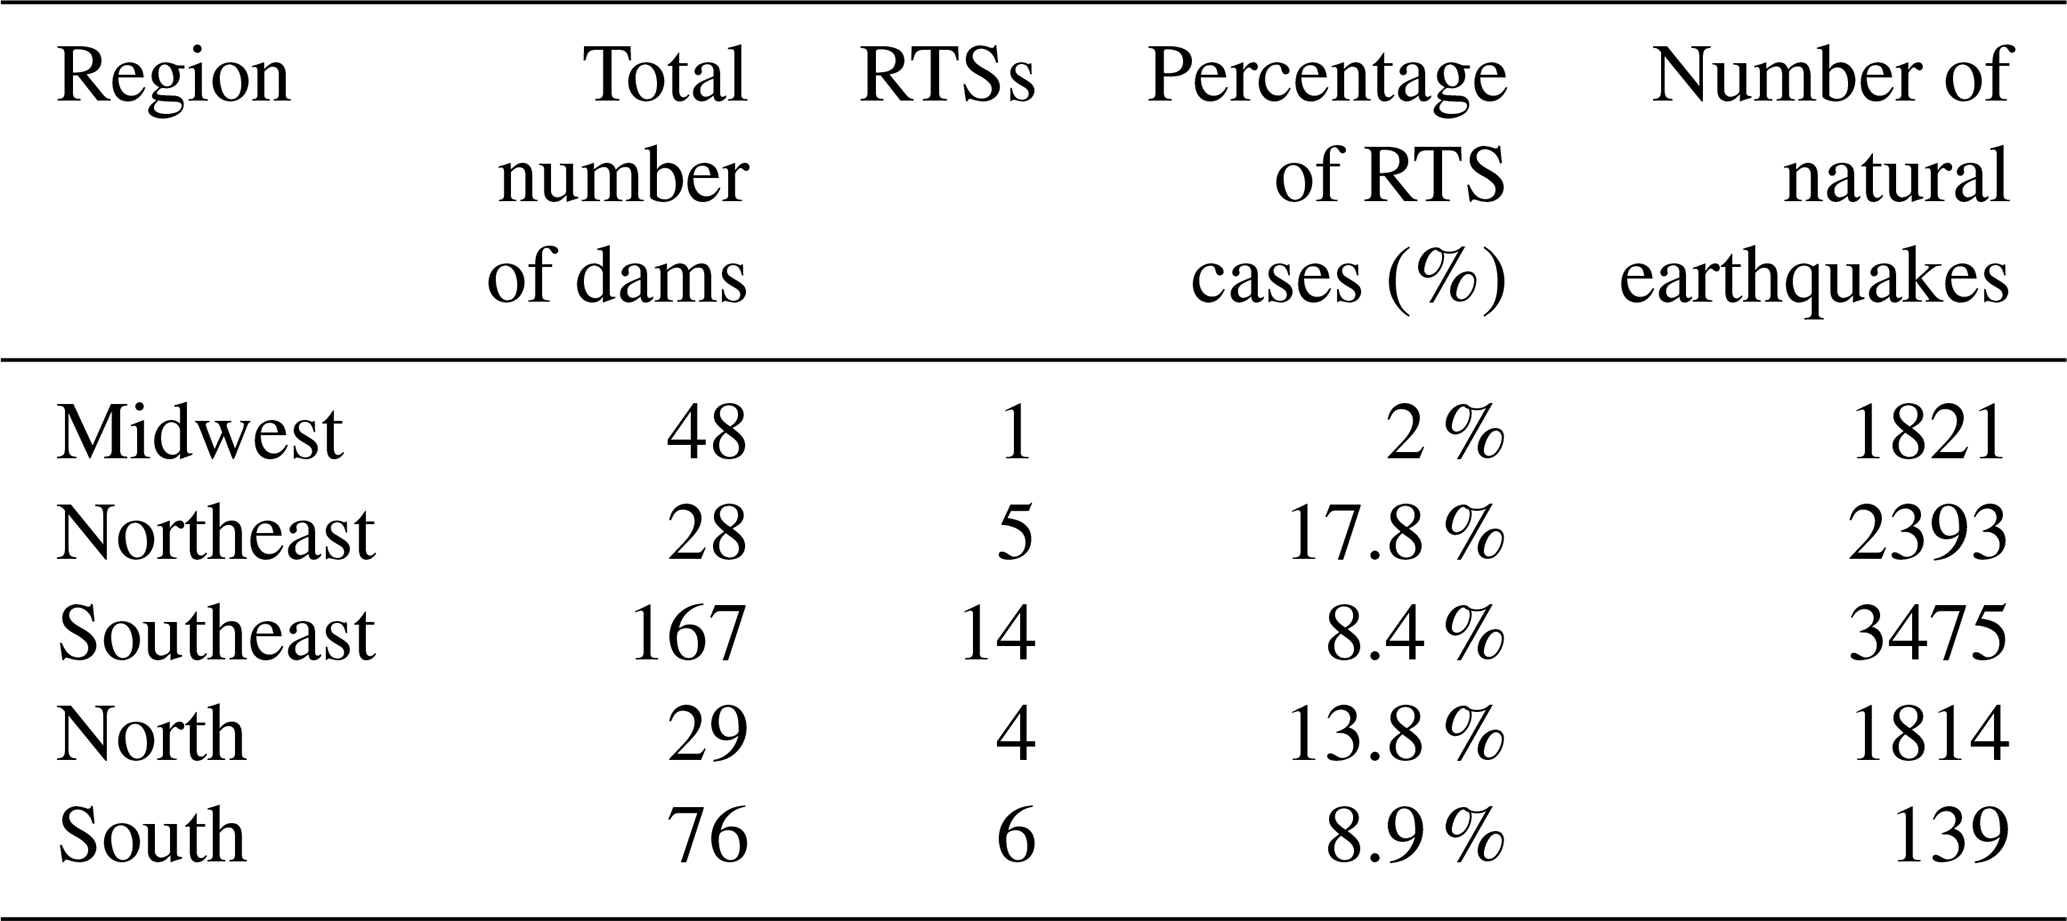
Geographically, Brazil is divided into five regions; north, northeast, southeast, south, and midwest. From the regional viewpoint, the southeastern region has the highest number of cases, which is directly related to the high number of reservoirs in the region that account for 43 % of the country's reservoirs. Additionally, the southeast also has a concentration of the largest number of reservoirs higher than 50 m (Table 3 and Figs. 7 and 8) and the greatest occurrence of natural earthquakes cataloged in Brazil, thus explaining the highest number of RTS events in the southeastern region. However, compared to the number of RTS events, 17.8 % of the total number of reservoirs in the northeast shows that although there are fewer cases in the region, the relative value is comparatively higher. Surprisingly the north region also has a considerable percentage, indicating a potential region for RTS, whereas the midwest region has the lowest percentage.
4.2 Correlation of RTS with geological characteristics
The hydromechanical properties of the rocks related to the RTS phenomenon were discussed by Snow (1972), Brace (1974), Howells (1974), Bell and Nur (1978), and Do Nascimento (2002). Despite the laboratory test determining these properties, little progress has been made, especially due to the great practical difficulties in mapping the huge number of rocks below and in the vicinity of a reservoir in terms of porosity, permeability, existence of faults, cracks, etc. (Assumpção et al., 2002). It is known that permeability determines the diffusion velocity of the fluid pressure and controls the volume of affected rocks while possibly being one of the most important factors in the change of seismicity level in the vicinity of a reservoir (Do Nascimento, 2002). The existence of fractures and faults, besides generating a weakness zone due to the low resistance to rupture, also facilitates liquid penetration all the way to the deepest and most distant reservoir zones, increasing the pressure in the pores. Thus, depending on the orientation of the natural efforts in relation to the fault system, a small effort/stress, even a very small one, of the reservoir may be sufficient to trigger earthquakes (Assumpção et al., 2002).
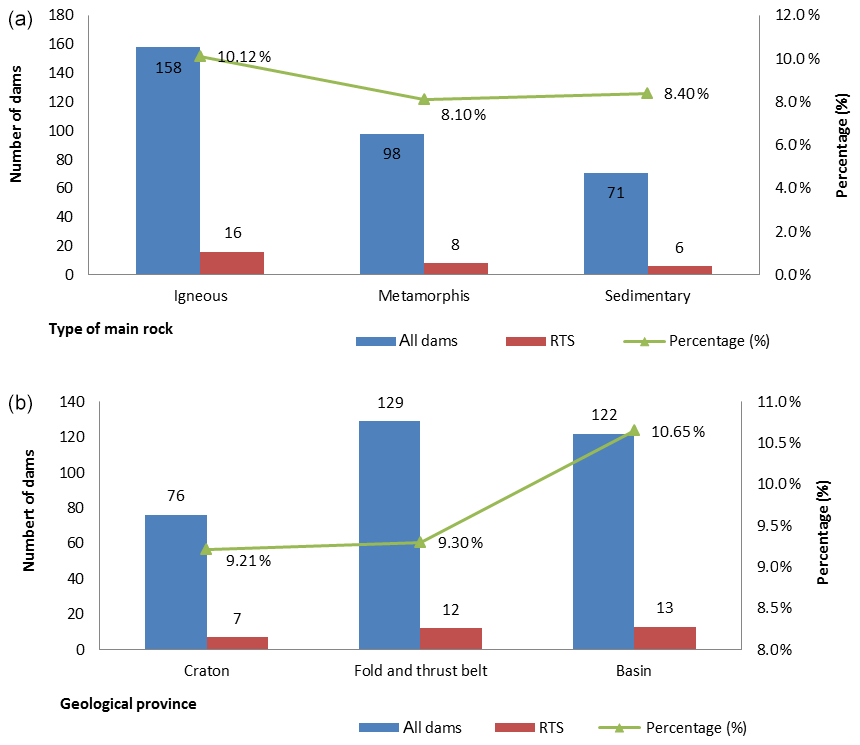
Figure 9(a) Percentage of cases of reservoir-triggered seismicity in Brazil as stated by main rock types (sedimentary, metamorphic, and igneous) in the dam area. (b) Classification as stated by the main geological provinces.
In order to correlate the probability of RTS with the geotectonic characteristics, the local number of reservoir-triggered seismicity cases was compared with the local lithology (types of rocks), igneous, metamorphic, and sedimentary, as indicated in Fig. 9a, and the geological province as well. Baecher and Keeney (1982) were among the first to propose comparing the number of cases of RTS with local lithology. The results we had with the same correlation show that igneous rocks have a higher percentage of occurrence of RTS (10.1 %) than sedimentary (8.4 %) and metamorphic (8.1 %) rocks. This is contrary, for example, to what Baecher and Keeney (1982) estimated for deep, very deep, or very large reservoirs (that is, height > 100 m or volume > 10 km3): sedimentary rocks are slightly more likely (16 %) compared to metamorphic or igneous (about 10 % each).
Thus, the RTS was also compared to the main geological provinces that are classified by the CPRM (Mineral Resources Research Company) (Figs. 9b and 10) into three categories: craton, basins, and fold and thrust belt. The values were again very close, with the tendency of a higher number of RTS cases in the region of basins (10.65 %).
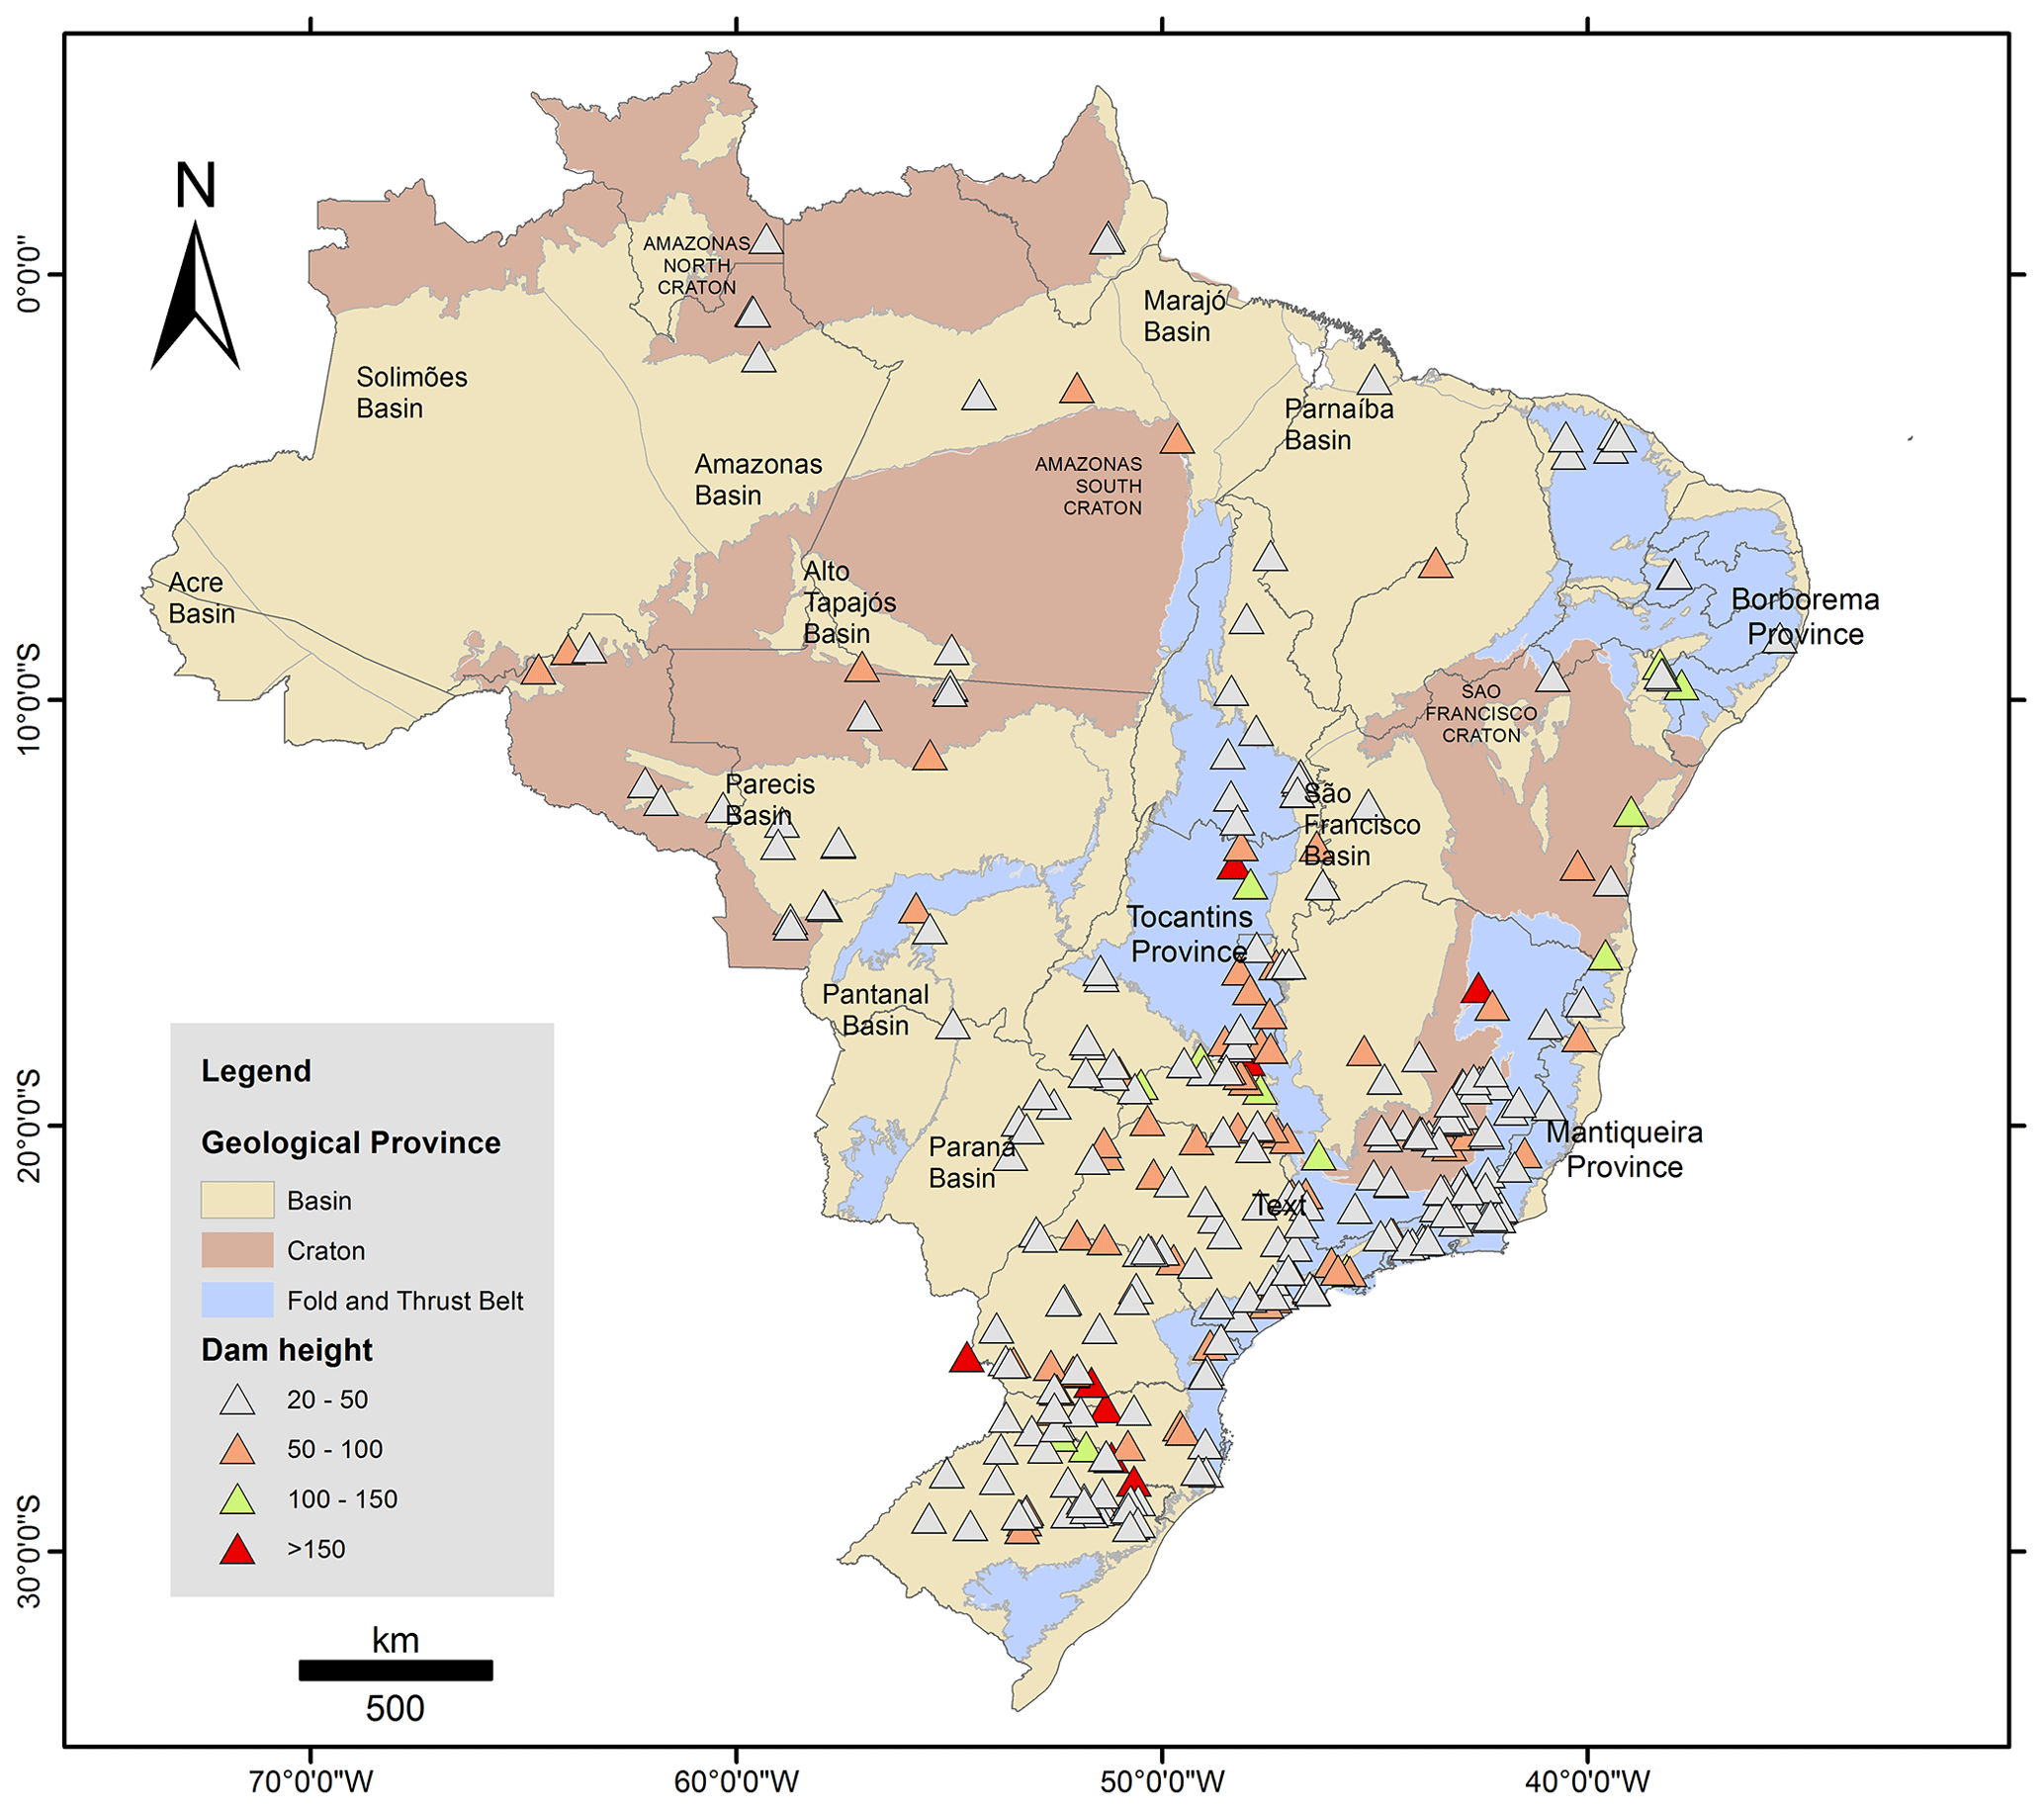
Figure 10Map of Brazil with 348 dams with a height of 20 m or more (data from the Brazilian Committee on Dams, 2018). The colors refer to the main geological provinces (data from CPRM – Mineral Resources Research Company).
Although the results show a slight tendency toward igneous rocks in the geological context and basins in geological provinces, it is impossible to determine with certainty the trend of these parameters. Therefore, we suggest an in-depth study on the local structural geology of the dams so that the geological influence can be determined more clearly.
4.3 Dimensional physical properties and their correlations
Simpson (1986) observed that the higher the dam the greater the probability of triggering an earthquake and that the most common RTS occurrence is observed in reservoirs with a maximum height greater than or equal to 100 m. The tectonic, geological, and hydrogeological environment of the reservoirs is most affected by the increase in the vertical efforts, via its own weight and/or via the increase in water pressure that infiltrates through pores, faults, and fractures.
Thus, in Brazil, a comparison between the RTS cases and the dam heights indicates that dams smaller than 50 m are only 2 % likely to trigger seismicity while those higher than 100 m are approximately 54 % (Fig. 11a) more likely to trigger earthquakes, confirming the findings of Simpson (1986).
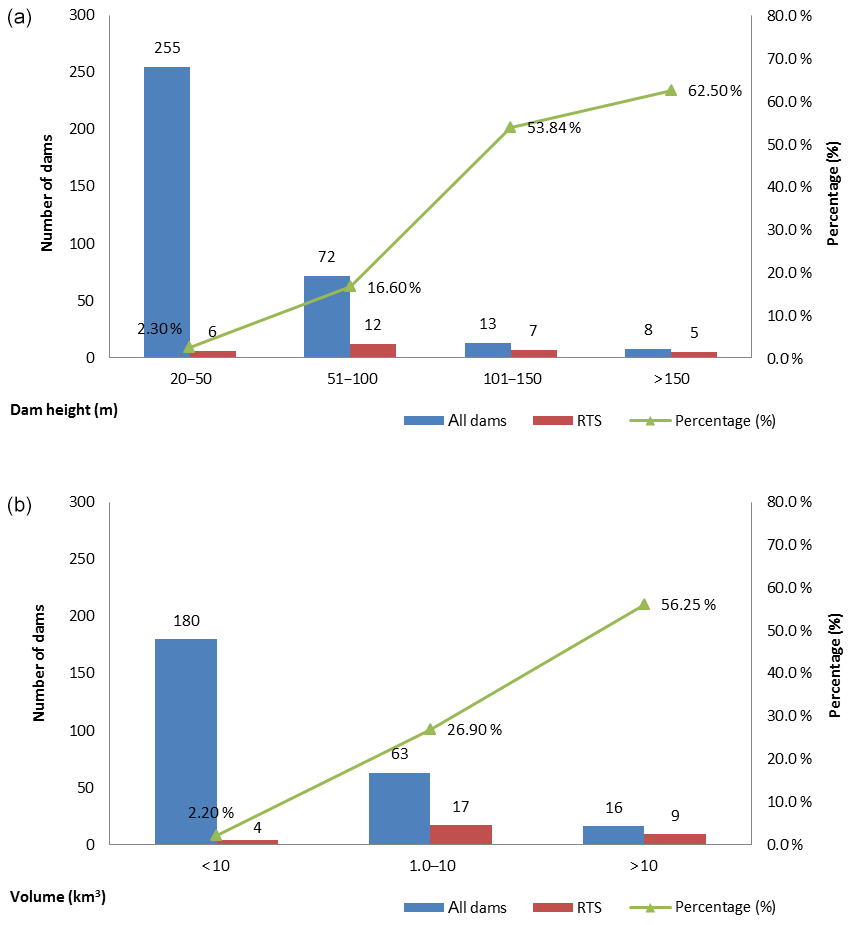
Figure 11Percentage of cases of reservoir-triggered seismicity as stated by (a) dam height and (b) reservoir volume. A total of 54 % of dams taller than 100 m trigger earthquakes and 32 % of reservoirs larger than km3 trigger earthquakes.
According to the Brazilian Committee on Dams (CBDB) databank, the volume parameter is available for only 256 reservoirs. Figure 11b shows that 47 % of the reservoirs with a volume greater than km3 triggered earthquakes, and since this percentage decreases linearly with volume, reservoirs with a volume less than km3 have a low estimated probability of triggering earthquakes. This result demonstrates the influence of volume (pressure) that is clearly related to the type of RTS in Brazil, which is mostly of the initial type (Table 2 and Fig. 11b).
Figure 12 shows the correlation between volume and height for RTS cases. We observe that the height does not have a limit between 20 and 209 m, which is the height of the largest dam. However, regarding volume, we estimate a minimum value of km3 for generating a RTS, which is represented by a black bar in Fig. 12.
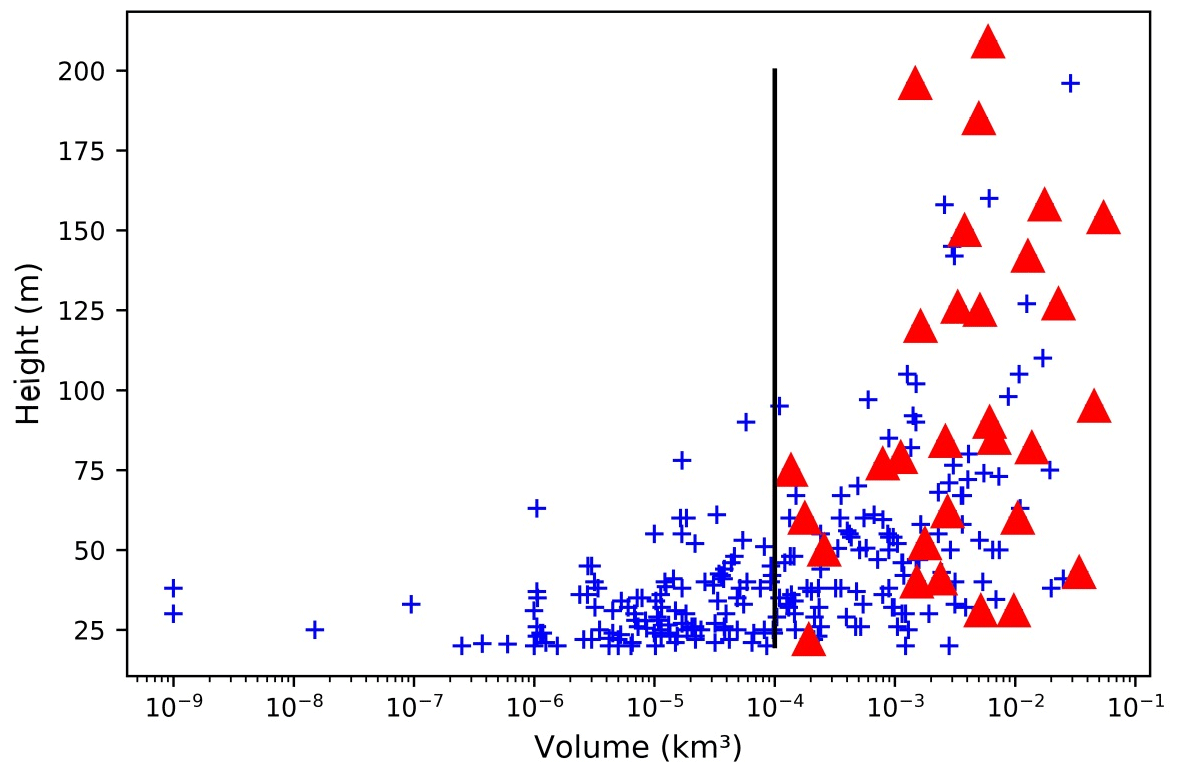
Figure 12Graph of reservoir volume and dam height for all dams in Brazil. The triangles indicate the RTS cases and the crosses other reservoirs. The black bar is the limit of RTS cases.
4.4 Response time
Seasonal variations in the water level of the reservoir can trigger earthquakes. Simpson (1986) and Talwani (1995) divided the seismic response of a reservoir into two categories, depending on the spatial and temporal pattern of RTS: (i) initial seismicity and (ii) steady-state/initial- or delayed-response seismicity.
The initial seismicity occurs with the initial damming/impounding of the water or large oscillation of the water level in the lake, which is observed more frequently. Cases of steady-state or delayed-response seismicity occur at a certain time after the filling/impoundment when the steady state is reached and present a more lasting associated seismicity. These different responses may correspond to two fundamental mechanisms by which a reservoir can modify the force in the crust – one related to the rapid increase in elastic stress due to the reservoir load (mechanical behavior) and the other to the more gradual diffusion of water from the reservoir to hypocentral depths (hydraulic behavior). The force may decrease as a result of changes in the elastic stress (decrease in normal stress or increase in shear stress) or reduction of effective normal stress due to increased pore pressure. The pore pressure at hypocentral depths can increase rapidly, from a coupled elastic response due to the pore compaction, or more slowly with the diffusion of surface water.
Of the 30 RTS cases, only four were considered to be a delayed response while 17 cases had only an initial response (Fig. 13). These different responses may correspond to two fundamental mechanisms by which a reservoir can modify the force in the crust – one related to the rapid increase in elastic stress due to the reservoir load (mechanical behavior) and the other to the more gradual diffusion of water from the reservoir to hypocentral depths (hydraulic behavior).
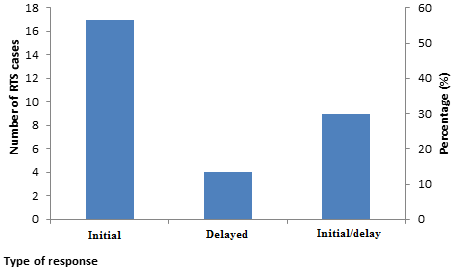
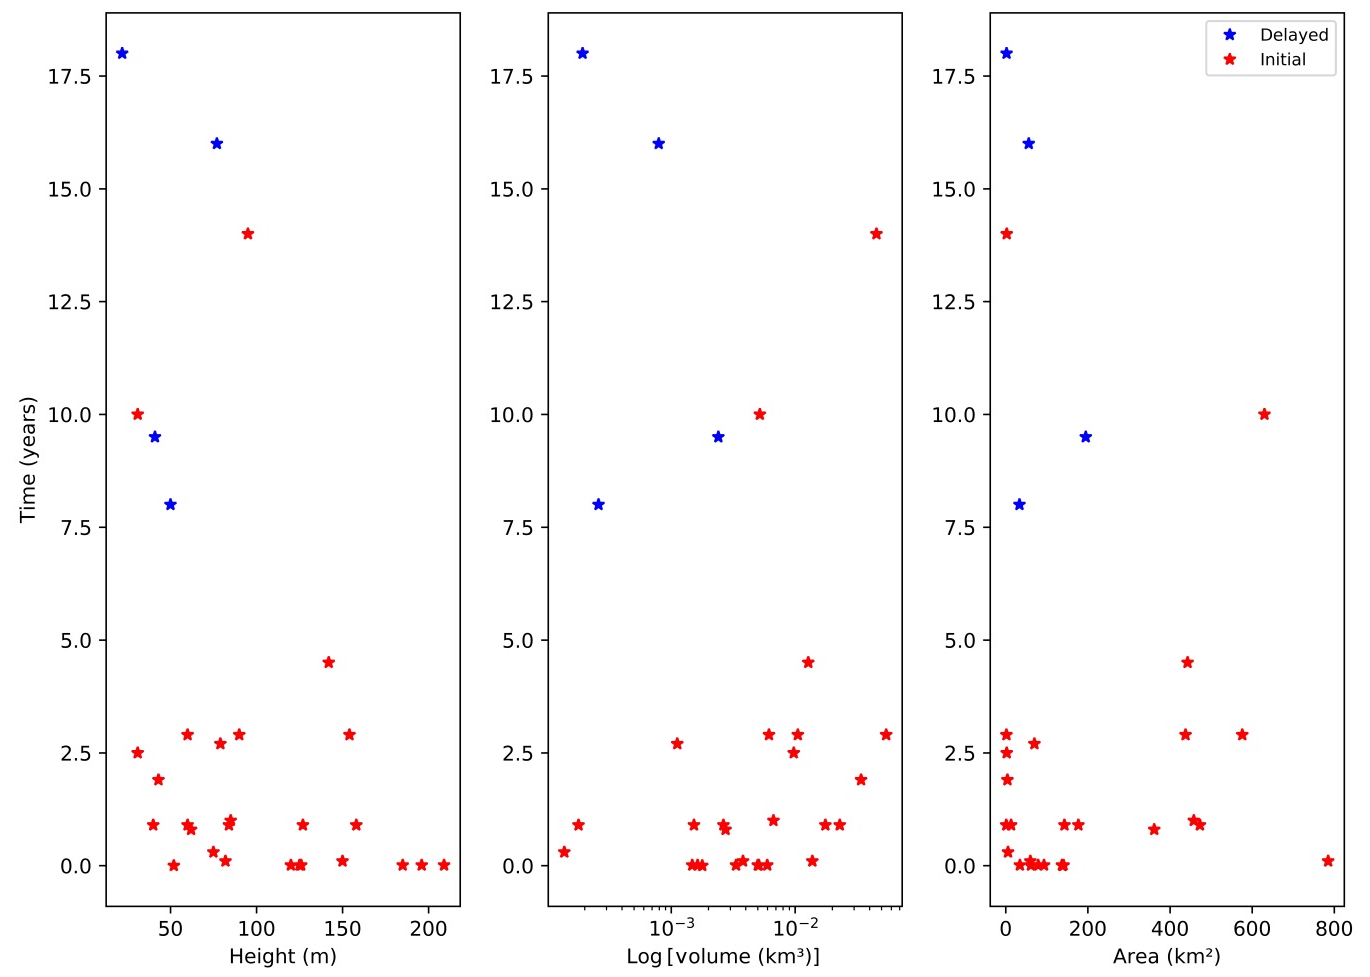
Figure 14 shows reservoir height, volume, and area versus the delay time. The dispersion of the results indicates that correlating any of these parameters with time delay is impossible.
4.5 Highest magnitude
It is known that in large reservoirs, the chance of pressure in the rock pores affecting the existing seismic structures in the area below the reservoir increases; however, there are cases in the literature of small reservoirs triggering earthquakes that released stresses with magnitudes far exceeding the sum of all additional stresses resulting from the lake. As an example, in 1974 in Brazil, the largest RTS event (4.2 mb magnitude) occurred near the Porto Colombia and Volta Grande reservoirs, with heights of 40 and 55 m and areas of 19.5 and 143 km2, respectively (number 24 in Table 2). Furthermore, small reservoirs such as Açu and Carmo Cajuru with dams only 31 and 23 m high have triggered earthquakes with magnitudes higher than 3.0 (Veloso and Gomide, 1997; Ferreira et al., 1995).
Based on Klose (2013), the reservoir volume showed a small tendency to generate higher-magnitude events compatible with the affected area of the reservoir, depending on its dimensions. Figure 15 shows that most of the events occur in reservoirs with volumes greater than 10−3 and with a magnitude of 4.2 in most cases, events with magnitudes between 3 and 4 occur in dams lower than 100 m.
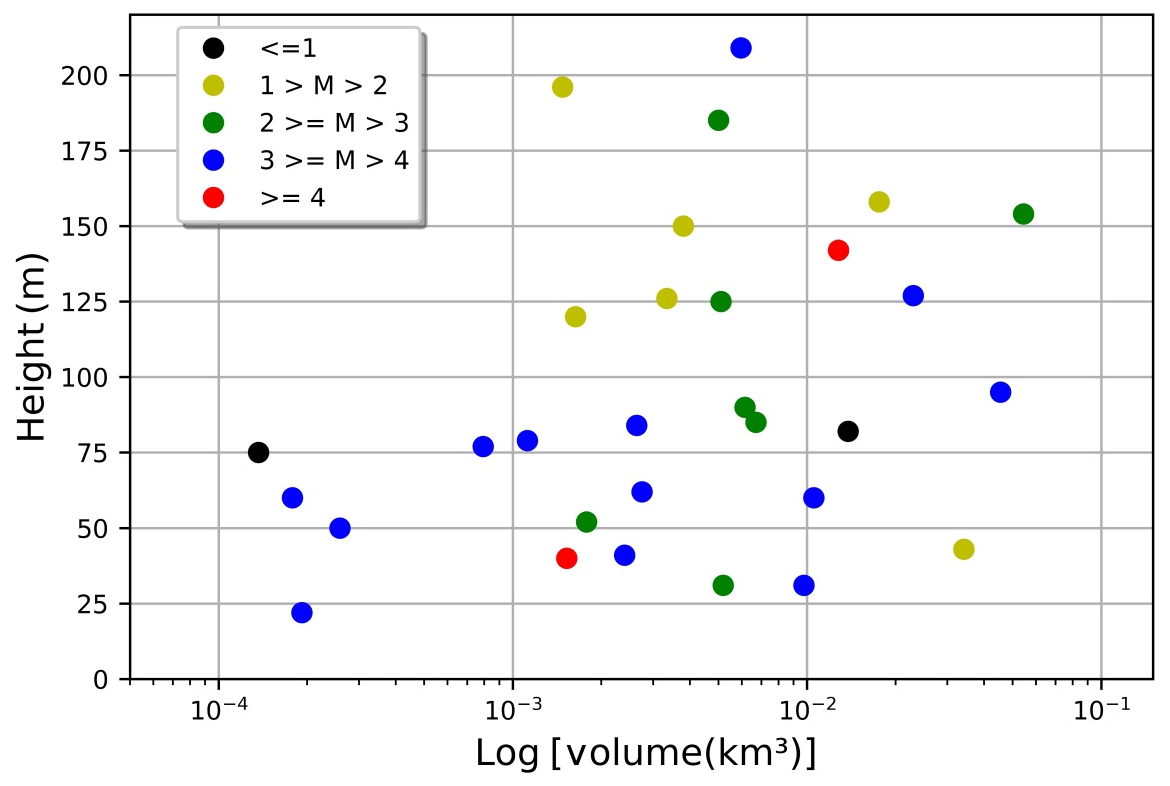
Figure 15Distribution of reservoir volume and dam height versus the reservoir-triggered seismicity maximum magnitude cases.
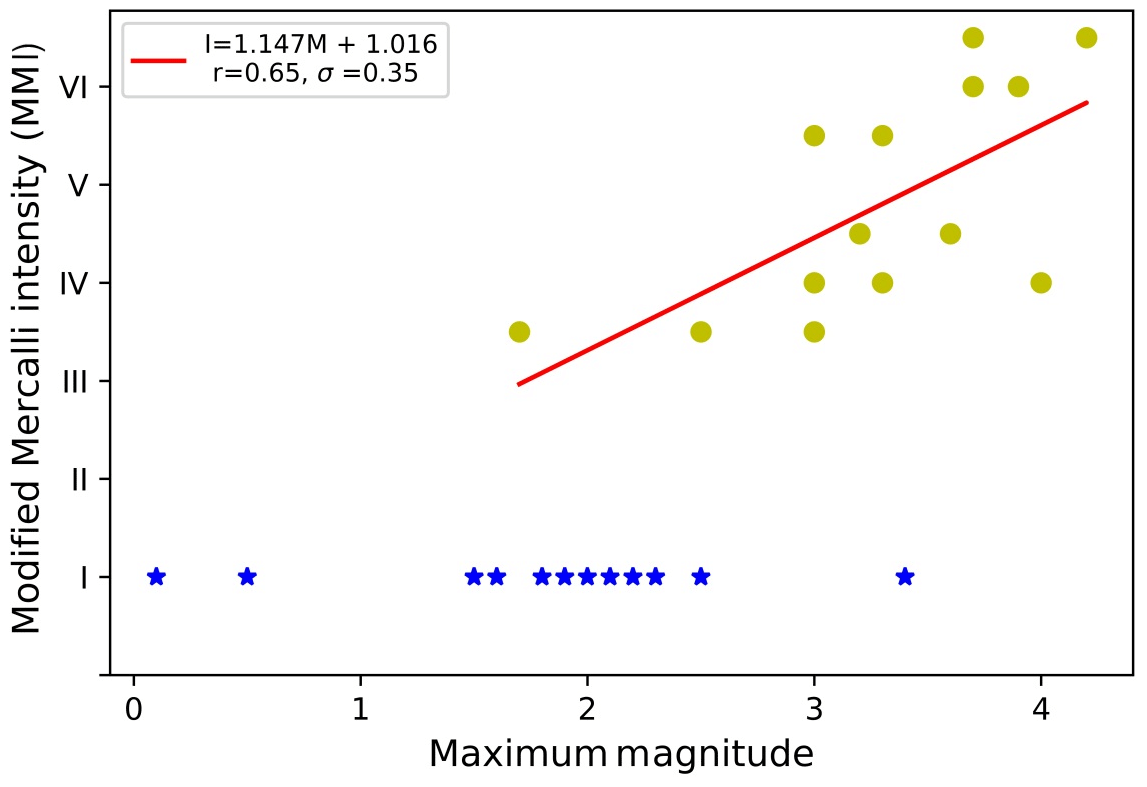
Figure 16Graph showing maximum magnitude and intensity. The linear adjustment (bar) was performed only with data represented by circles. The blue stars indicate cases of intensity I.
4.6 The intensity and highest magnitude
Several events were not felt, or there was no microseismic survey to define their intensity; for these we consider intensity I. Figure 16 shows a linear correlation between magnitude and intensity, disregarding the intensity I data. Thus, a linear least-squares adjustment was performed and resulted in the equation below:
The correlation coefficient of 0.66 reflects the small number of data available. It is characteristic of the intraplate intensity that the value estimated for intensity is greater than that estimated for magnitude.
The complete compilation of reservoir-triggered seismicity occurrences, including spatial–temporal behavior, allows a better evaluation of the seismic risk of future reservoirs. Thus, the database allows the systematic presentation in one location of all the pertinent data regarding RTS cases in Brazil, including all the known parameters influencing the RTS process.
The created web viewer, RISBRA, presents an interactive platform with easy access and great potential to improve knowledge on the RTS in Brazil.
The histogram of the RTS cases reflects seismic swarms, greater monitoring and the construction of dams since 2002. We highlight that, since the establishment of the Brazilian Seismographic Network (RSBR), in 2011, the acquisition of seismic monitoring data has improved. The RSBR is the joint work of four different institutions: Universities of São Paulo (USP), Brasília (UnB), Rio Grande do Norte (UFRN), and National Observatory (ON). The network consists of more than 90 stations (in January 2020) operated by these four institutions (Bianchi et al., 2018).
From the regional viewpoint, the considerable percentage of RTS in the northern region indicates a potential RTS region, considering the exploratory growth. Despite having a small number of RTS events, five cases, the northeast region has a comparatively higher relative value of RTS compared to other regions.
Although the results show a trend with higher numbers of RTS in igneous rocks (rock type) and sedimentary basins (geological provinces) being more prone to RTS, such trends cannot be backed up with the currently available data. Therefore, we suggest an in-depth analysis of the structural geology at the dam sites in order to understand and identify in more detail the geological influence.
The dam height has been confirmed as one of the main indicators of the dam capability of triggering earthquakes. Dams less than 50 m high are only 2 % likely to cause seismicity while those more than 100 m high are about 54 % more likely to cause an earthquake.
The reservoir volume also strongly influences its capability of causing an earthquake, and we estimate the limiting minimum value of km3 for the occurrence of RTS.
The delayed response of the reservoirs represents 43 % in total, indicating hydraulic behavior for almost half of the reservoirs. For higher magnitudes (4.2, the highest recorded), we found that most events occur in reservoirs with volumes larger than 10−3 km3.
An equation “” has been determined to describe the relationship between intensity and the highest magnitude. Here “I” is the estimated intensity and “M” is the determined magnitude.
Practical difficulty of mapping soil layers below the dams hinders the evaluation of the seismic risk of a reservoir, and, therefore, it is essential to obtain key parameters such as local stresses, rock mass permeability, and fracture system geometry. Thus, studies of previous cases are useful when trying to assess the seismic risk posed by future reservoirs. Most importantly, this work shows that the possibility of RTS occurrence in Brazil cannot be neglected and highlights the importance of continuous monitoring, before, during, and after the construction of a dam.
The data used in this article were extracted from the seismic bulletin and SISBRA. Data and information from the SISBRA can be downloaded from the Seismological Observatory of the University of Brasília (SIS/UnB), Center of Seismology of the University of São Paulo (USP): http://obsis.unb.br/portalsis/?pg=bulletin (Seismological Observatory of the University of Brasília, 2018); http://www.sismo.iag.usp.br/eq/bulletin/ (Center of Seismology of the University of São Paulo, 2018). Information on the dams was taken from the Brazilian Committee of Dams (CBDB), http://www.cbdb.org.br/ (last access: October 2018) (CBDB, 2018).
ES designed the study, extracted and analyzed the data, designed the database and the web server, and wrote the manuscript. GS designed the study, extracted and analyzed the data, and wrote the manuscript. MH provided in-depth feedback on the structuring of the database and the web server. AG built the database and the web server.
The authors declare that they have no conflict of interest.
This article is part of the special issue “Natural hazard impacts on technological systems and infrastructures”. It is a result of the EGU General Assembly 2019, Vienna, Austria, 7–12 April 2019.
The authors thank the Comitê Brasileiro de Barragens for providing the data from the Cadastro Nacional de Barragens.
This paper was edited by Maria Bostenaru Dan and reviewed by two anonymous referees.
Assumpção, M., Freire, M., and Ribotta, L. C.: Sismicidade Induzida no reservatório de Capivara: resultados preliminares sobre localização de fraturas ativas, in: IV International Congress of the Braziliam Geophysical Society, 20–24 August 1995, Rio de Janeiro, Brasil, 961–964, 1995.
Assumpção, M., Marza, V. I., Barros, L. V., Chimpliganond, C. N., Soares, J. E., Carvalho, J. M., Caixeta, D. F., Amorim, A., and Cabral, E.: Reservoir induced seismicity in Brazil, Pure Appl. Geophys., 159, 597–617, https://doi.org/10.1007/PL00001266, 2002.
Baecher, B. G. and Keeney, R. L.: Statistical examination of reservoir induced seismicity, B. Seismol. Soc. Am., 72, 553–569, 1982.
Barros, L. V. and Caixeta, D. F.: Induced seismicity at Miranda Reservoir – A fine example of immediate seismic response, 8th International Congress of the Brazilian Geophysical Society, 14–18 September 2003, Rio de Janeiro, Brazil, 5 pp., 2003.
Barros, L. V.: Relatório Síntese (2001–2007) do monitoramento sismológico do reservatório de Itapebi/BA, Brasília, Brazil, 2008.
Barros, L. V., Caixeta, D. F., Chimpliganond, C. N., and Fontenele, D. P.: Evolution of the Areado/MG seismic sequence – Started in January, 2004, in: International Congress of the Brazilian Geophysical Society, 11–14 September 2005, Salvador, Bahia, Brazil, 6 pp., 2005.
Barros, L. V., Carvalho, J. M., Ferreira, V. M., Albuquerque, D. F., Von Huelsen, M. G., Caixeta, D., and Fontenele, D. P.: Determination of source seismic parameters of micro-earthquakes with epicenter in the south of Minas Gerais State-Brazil, in: 6th International Congress of the Brazilian Geophysical Society, 14–17 October 2014, Porto Alegre, Brazil, 2014.
Barros L. V., Carvalho, J. M., Ferreira, V. M., Von Huelsen, M. G., Caixeta, D. F., and Fontenele, D. P.: Recent seismicity close to the Jirau reservoir in Rondônia State, Brazil, in: 14th International Congress of the Brazilian Geophysical Society, Rio de Janeiro, Brazil, 3–6 August 2015.
Barros, L. V., Assumpção, M., Ribotta, L. C., Ferreira, V. M., Carvalho, M. J., Bowen, M. D. B., and Albuquerque, F. D.: Reservoir – Triggered Seismicity in Brazil: Statistical Characteristics in a Midplate Environment, Bull. Seismol. Soc. Am., 20, 4–6, https://doi.org/10.1785/0120170364, 2018.
Bell, M. L. and Nur, A.: Strength Changes Due to Reservoir-Induced Pore Pressure and Stresses and Application to Lake Oroville, J. Geophys. Res., 83, 4469–4483, https://doi.org/10.1029/JB083iB09p04469, 1978.
Berrocal, J., Assumpção, M., Antezana, R., Dias Neto, C., Ortega, R., França, H., and Veloso, J. A.: Sismicidade do Brasil, Instituto Astronômico e Geofísico, Universidade de São Paulo e Comissão Nacional de Energia Nuclear, São Paulo, Brazil, Esperança, 320 pp., 1984.
Berrocal, J. and Fernandes, C.: Estudo de Sismicidade Induzida na Área dos Reservatórios Hidroelétricos da Chesf, Sessão Regular da Academia Brasileira de Ciências: Ciências da Terra e o Meio Ambiente, Anais da Academia Brasileira de Ciências, São Paulo, Brasil, 68, 613–620, 1996.
Bianchi, M. B., Assumpção, M., Rocha, M. P., Carvalho, J. M., Azevedo, P. A., Fontes, S. L., Dias, F. L., Ferreira, J. M., Nascimento, A. F., Ferreira, M. V., and Costa, I. S. L.: The Brazilian Seismographic Network (RSBR): Improving Seismic Monitoring in Brazil, Seismol. Res. Lett., 89, 452–457, https://doi.org/10.1785/0220170227, 2018.
Borges, K. A. V., Davis Jr., C. A., and Laender, A. H. F.: OMT-G: an object-oriented data model for geographic applications, GeoInformatica, 5, 221–260, 2001.
Borges, K. A. V., Davis, C. A., and Laender, A. H. F.: Modelagem Conceitual de Dados Geográficos, in: Banco de Dados Geográficos, Curitiba, Editora MundoGeo, Casanova, M. A., Câmara, G., edited by: Davis Jr., C. A., Vinhas, L., and Queiroz, G. R., available at: http://www.dpi.inpe.br/livros/bdados/cap3.pdf (last access: 1 March 2017), 2005.
Brace, W. F.: Experimental Studies of Seismic Behavior of Rocks Nader Crustal Conditions, Eng. Geol., 8, 109–127, https://doi.org/10.1016/0013-7952(74)90018-0, 1974.
BRASIL: Decreto no. 6.666, de 27 de novembro de 2008, Institui, no Âmbito do Poder Executivo Federal, a Infraestrutura Nacional de Dados Espaciais – INDE, e de outras providências, available at: http://planalto.gov.br/ccivil_03/_Ato2007-2010/2008/Decreto/D6666.htm, (last access: 1 March 2017), 2008.
BRASIL. Portaria no. 011 - DCT, de 22 de abril de 2015, Aprova a Norma da Especificação Técnica para Estruturação de Dados Geoespaciais Vetoriais de Defesa da Força Terrestre (EB80-N-72.002) – 1 Parte, 1 Edição, available at: http://www.geoportal.eb.mil.br/imagens/PDF/EDGV_Defesa-Forca_Terrestre_2015.pdf (last access: 10 May 2017), 2015.
BRASIL. Portaria no. 007 – DCT, de 10 de fevereiro de 2016, Aprova a Norma da Especificação Técnica para Estruturação de Dados Geoespaciais Vetoriais de Defesa da Força Terrestre (EB80-N-72.002) – 1 Parte, 2 Edição, available at: http://www.geoportal.eb.mil.br/images/PDF/EDGV_DEFESA_F_Ter_2a_Edicao_2016_Aprovada_Publicada_BE_7_16.pdf (last access: 15 June 2017), 2016.
Cardoso, V. and Cardoso, G.: Sistemas de Banco de Dados: uma abordagem introdutória e aplicada, First Issue, Saraiva Publications, Brazil, 142 pp., 2012.
CBDB – Brazilian Committee of Dams: National Dam Registry, available at: http://www.cbdb.org.br/, last access: 23 October 2018.
Center of Seismology of the University of São Paulo (USP): Seismic Catalog, available at: http://www.sismo.iag.usp.br/eq/bulletin/, last access: December 2018.
Chimpliganond, C. N.: Characterization of induced seismicity at the Nova Ponte Reservoir/MG, Brasil, MSc Dissertation, University of Brasilia, Brazil, 2002.
Chimpliganond, C. N., Von Huelsen, M. G., Vinícius, A., França, G. S., Barros, L. V., and Teixeira, C.: Estudo da sismicidade na área de influência do Reservatório de Batalha, Brasil – possível caso de SDR, in: 1st Brazilian Symposium on Seismology, Brasília, Brazil, 4–6, 2015.
CONCAR – Comissão Nacional de Cartografia: Plano de ação para implantação da infraestrutura nacional de dados espaciais (INDE), Rio de Janeiro, available at: https://www.concar.gov.br/pdf/PlanoDeAcaoINDE.pdf (last access: 3 April 2018), 2010.
CONCAR – Comissão Nacional de Cartografia: Especificações técnicas para estruturação da infraestrutura nacional de dados espaciais digitais vetoriais, Edição 3.0, available at: https://www.concar.gov.br/temp/365@ET-EDGV_versao_3.0_2018_05_20.pdf (last access: 4 April 2018), 2017.
PRM – Brazilian Geological Survey: Mineral provinces and geological domains, available at: http://www.cprm.gov.br/, last access: 1 May 2018.
Davis Jr., C. A.: Múltiplas Representações em Sistemas de Informação Geográficos, Tese apresentada ao Curso de Pós-Graduação em Ciência da Computação do Instituto de Ciências Exatas da Universidade Federal de Minas Gerais, Belo Horizonte, 15–23, 2000.
Do Nascimento, A. F.: The role of pore pressure diffusion in a reservoir-induced seismicity site in NE Brazil, Doctoral thesis, University of Edimburgo, Edimburgo, 9–11, 2002.
Elmasri, R. and Navathe, S. B.: Fundamentals of database systems,Pearson Education, Inc., Addison-Wesley, United States of America, 60–67, 2011.
Ferreira J., Oliveira, M., Assumpção M., Moreira, J. A. M., Pearce, R. G., and Takeya, M. K., Correlation of seismicity and water level in the Açu reservoir – an example from Northeast Brazil, Bull. Seismol. Soc. Am., 85, 1483–1489, 1995.
Ferreira J., França, G. S., Vilar, S., and Assumpção, M.: Induced seismicity in the Castanhão Reservoir, NE Brazil – Preliminary results, Tectonophysics, 456, 103–110, 2008.
Foulger, G. R., Wilson, M., Gluyas, J., Julian, B. R., and Davies, R.: Global review of human-induced earthquakes, Earth-Sci. Rev., 178, 438–514, 2017.
França, G. S., Assumpção, M., Ribotta, L. C., Von Huelsen, M. G., and Chimpliganond, E. C. N., Updated compilation of reservoir triggered seismicity in Brazil, in: 2010 The Meeting of the Americas (AGU – American Geophysical Union), Foz do Iguaçu, Paraná, Brazil, 2010.
Gomide, L. C.: Nature and history of reservoir induced seismicity in Brazil, MSc Dissertation,, University of South Carolina, United States of America, 1999.
Gupta, H. K.: A review of recent studies of triggered earthquakes by artificial water reservoirs with special emphasis on earthquakes in Koyna, India, Earth-Sci. Rev. 58, 279–310, https://doi.org/10.1016/S0012-8252(02)00063-6, 2002.
Howells, D. A.: Mechanical properties of rock at the depth of earthquake ignition, Eng. Geol., 8, 129–134, 1974.
International Rivers: A Faultline Runs Through It: Exposing the Hidden Dangers of Dam-induced Earthquakes, available at: https://www.internationalrivers.org/sites/default/files/attached-files/ris_final_lorez2.pdf (last access: 10 May 2020), 2009.
Klose, C. D.: Mechanical and statistical evidence of the causality of human-made mass shifts on the Earth's upper crust and the occurrence of earthquakes, J. Seismol., 17, 109–135, https://doi.org/10.1007/s10950-012-9321-8, 2013.
Leaflet: Leaflet 1.3.4, available at: https://leafletjs.com/, last access: 5 April 2018.
Marza, V., Veloso, J. A. V., Carvalho, J. M., Barros, L. V., and Gomide, L. C.: Reservoir induced seismicity at Nova Ponte (MG): Revisited, in: 5th International Congress of the Brazilian Geophysical Society, São Paulo, Brazil, 968–971, 1997.
Marza, V., Barros, L. V., Soares, J. E., Carvalho, J. M., Fontenele, D., Chimpliganond, C., Caixeta, D., Gomes, I. P., Furtado, G. O., Carim, A. L., Souza, G. F., Caliman, E. H., and Barros, J. B.: Aspectos da Sismicidade Induzida por Reservatórios no Brasil, in: XXIII Semana Nacional de Grandes Barragens Belo Horizonte, Minas Gerais, 199–211, 1999.
Medeiros, A. M. L.: Aplicações geográficas do postgresql e seu módulo postGIS, Revista FOSSGIS Brasil, Coluna Banco de Dados Geográficos, 25–27, available at: http://www.fossgisbrasil.com.br (last access: April 2018), 2012.
Mendiguren, J. A.: A procedure to resolve areas of different source mechanisms when using the method of composite nodal plane solution, Bull. Seismol. Soc. Am., 70, 985–998, 1980.
Mioto, J. A., Ribotta, L. C., and Verdiani, A. C.:Aspectos geológico estruturais da sismicidade relacionada ao reservatório de Capivara (SP/PR), in: II International Congress of the Brazilian Society of Geophysics, Salvador, Brazil, 1, 513–520, 1991.
NeDiMAH Working Groups and European Science Foundation: Network for Digital Methods in the Arts and Humanities, available: http://archives.esf.org/coordinating-research/research-networking-programmes/humanities-hum/nedimah/thematic.html, last access: 10 June 2020.
Node.js: OpenJS Foundation,, available at: https://nodejs.org/en/, last access: 6 April 2018.
Oliveira, N. C. C.: A grande aceleração e a construção de barragens hidrelétricas no Brasil, Varia Historia, Belo Horizonte, 34, 315–346, https://doi.org/10.1590/0104-87752018000200003, 2018.
PgAdmin III: pgAdmin III 1.22.2 documentation, available at: https://www.pgadmin.org/docs/pgadmin3/1.22/, last access: 6 April 2018.
PostGIS: PostGIS manual, available at: http://postgis.net/docs/manual-2.4/, last access: 7 May 2018.
PostgreSQL: PostgreSQL manual, available at: https://www.postgresql.org/docs/9.3/index.html, last access: 9 April 2018.
QGIS: Quantum GIS Documentation, available at: https://docs.qgis.org/2.14/en/docs/, last access: 9 April 2018.
Redis: Redis manual, available at: https://redis.io/, last access: 9 April 2018.
Ribotta, L. C.: Aspectos da sismicidade na área do reservatório de Paraibuna/ Paraitinga, MS dissertation, USP, São Paulo, 147 pp., 1989.
Ribotta, L. C., Mioto, J. A., and Regina, J. V. M.: Sismicidade na área do reservatório de Itá, SC/RS, in: Anais do II Simpósio Brasileiro de Geofísica da SBGf, Natal, Rio Grande do Norte, Brazil, 2006a.
Ribotta, L. C., Mioto, J. A., and Regina, J. V. M.: Sismicidade na área do reservatório de Machadinho, SC/RS, in: Anais do XLIII Congresso Brasileiro de Geologia, Aracaju, Sergipe, Brazil, 2006b.
Ribotta, L. C., Mioto, J. A., Manuzzi, J. L., Carvalho, A. M. B. E., and Vinciprova, G.: Sismicidade na área do reservatório de Barra Grande, SC/RS, in: Anais do III Simpósio Brasileiro de Geofísica, Belém, Pará, Brazil, 2008.
Ribotta, L. C., Assumpção, M., Manuzzi, J. L., Carvalho, A. M. B. E., and Regina, J. V. M.: Seismicity induced in 4 deep reservoirs, southern Brazil, 2010, in: The Meeting of the Americas (AGU – American Geophysical Union), Foz do Iguaçu, Paraná, Brazil, 2010.
Ribotta, L. C., Moreira, L. D., Souzas, S. L. E., and Regina, J. V.: Reservatório de Itá, SC/RS, 19 Anos de Sismicidade, in: Anais do II Simpósio Brasileiro de Sismologia, João Pessoa, Paraíba, Brazil, 2017.
Seismological Observatory of the University of Brasília: Boletim Sísmico, available at: http://obsis.unb.br/portalsis/, last access: December 2018.
Simpson, D. W.: Triggered Earthquakes, Annu. Rev. Earth Planet. Sci., 14, 21–42, 1986.
Snow, D. J.: Geodynamics of seismic reservoirs, in: Proceedings of the International Symposium on Percolation Through Fissured Rocks, Stuttgart, Germany, 18–19 September, 1–19, 1972.
Talwani, P.: Two categories of reservoir induced seismicity, in: Proceedings of the International Symposium on Reservoir-induced Seismicity (ISORI'95), Beijing, China, 1–5 November, 44–64, 1995.
Teorey, T. J., Lightstone, S., and Nadeau, T.: Projeto e modelagem de banco de dados. Tradução Daniel Vieira, Elsevier, Burlington, MA, 2, 309 pp., 2014.
Veloso, J. A. V.: Terremotos induzidos pelo homem, Ciência Hoje, 14, 269–273, 1992a.
Veloso, J. A. V.: Cases of RIS in the Brazilian Amazon area, in: Proceedings Tenth World Conference on Earthquake Engineering, Madrid, Spain, 1, 269–273, 1992b.
Veloso, J. A. V. and Gomide, L. C.: Induced seismicity at Cajuru Reservoir, Minas Gerais, Brazil, in: Proceedings 19th of the International Congress on Large Dams, Florence, Italy, 1211–1225, 1997.
Veloso, J. A. V., Assumpção, M., Gonçalves, E. S., Reis, J. C., Duarte, V. M., and Mota, C. G.: Registro de SIR em reservatórios da CEMIG e FURNAS, in: Anais do V Congresso Brasileiro de Geologia de Engenharia, São Paulo, Brazil, 135–146, 1987.
Veloso, J. A. V., Carvalho, J. M., Fernandes, E. P., Blum, M. L. B., and Araújo, D. P.: Micro earthquakes and the Balbina Lake, a possible case of induced seismicity in the Amazon are, in: 2th International Congress of the Brazilian Geophysical Society, Salvador, Brazil, 2, 508–512, 1991.
Viotti, C. B., Gomide, L. C., and Brito, S. N. A.: Induced seismicity in CEMIG's reservoir in Minas Gerais – Brazil, in: Proceedings of the International Symposium on Reservoir-induced Seismicity (ISORIS'95), Beijing, China, 205–212, 1995.
Viotti, C. B., Veloso, J. A. V., and Gomide, L. C.: Induced seismicity at Cajuru Reservoir, Minas Gerais, Brazil, in: 19th International Congress on Large Dams Proceedings, Florence, Italy, 1211–1225, 1997.
Wilson, M. P., Foulger, G. R., Gluyas, J. G., Davies, R. J., and Julian, B. R.: HiQuake: The human-induced earthquake database, Seismol. Res. Lett., 88, 1560–1565, https://doi.org/10.1785/0220170112, 2017.