the Creative Commons Attribution 4.0 License.
the Creative Commons Attribution 4.0 License.
 | 30 Jun 2020
Present and future changes in winter climate indices relevant for access disruptions in Troms, northern Norway
Anita Verpe Dyrrdal
Ketil Isaksen
Jens Kristian Steen Jacobsen
Irene Brox Nilsen
A number of seaside communities in Troms, northern Norway, are vulnerable to sudden weather-induced access disruptions due to high-impact weather and dependency on one or few roads. In this paper we study changes in winter weather known to potentially cause access disruptions in Troms, for the present climate (1958–2017) and two future periods (2041–2070; 2071–2100). We focus on climate indices associated with snow avalanches and weather that may lead to for example slippery road conditions. In two focus areas, the most important results show larger snow amounts now compared to 50 years ago, and heavy snowfall has become more intense and frequent. This trend is expected to turn in the future, particularly at low elevations where snow cover during winter might become a rarity by 2100. Strong snow drift, due to a combination of snowfall and wind speed, has slightly increased in the two focus areas, but a strong decrease is expected in the future due to less snow. Events of heavy rain during winter are rather infrequent in the present winter climate of Troms, but we show that these events are likely to occur much more often in all regions in the future.
- Article
(8036 KB) - Full-text XML
- BibTeX
- EndNote


Since the turn of the century, there has been a considerable increase in the number of rapid mass movements that affect highways in Norway, according to registrations by the Norwegian Public Roads Administration (NPRA, 2014), although some of this increase might be explained by an increase in the use of the database (Jaedicke et al., 2009).
One-fourth of Norway's public roads are, according to estimates, vulnerable to snow avalanches and rockfalls (Frauenfelder et al., 2013). Small communities in Troms, northern Norway, are among the most vulnerable to weather-induced access disruptions. Both snow avalanches and landslides have led to fatalities in Troms. An analysis of the Norwegian mass movement database (http://skredregistrering.no/, last access: 15 January 2020, database version December 2019) shows that for the period 1730–2014, 376 casualties were registered in Troms: snow avalanches resulted in 295 casualties, whereof 121 people were hit in buildings and 9 on roads. Since 2014, an additional 12 casualties are registered, according to https://varsom.no/ (last access: 15 January 2020; all were skiing or driving a snow mobile). For other rapid mass movements, namely rockfalls, slushflows, icefalls, debris avalanches and quick clay slides, 81 casualties are registered in Troms, whereof 57 were in buildings and 2 on roads.
Quite a few highway stretches along alpine mountain sides in Troms are sporadically closed during winter due to weather-induced incidents, as well as in times with imminent avalanche danger such as polar low pressure alerts. According to Jacobsen et al. (2016), many communities in Troms experience sudden access interruptions nearly every winter due to snow avalanches and slushflows, heavy snowfall, and/or strong winds and drifting snow in these areas. Access highways have been regarded as lifelines – connections that health, safety, comfort, and social and economic life depend on (Holand, 2013). Social science studies have revealed that roadside avalanches and winter-weather-induced road closures commonly lead to worries about road travel and numerous practical problems for inhabitants, businesses and the public sector (Hovelsrud et al., 2018; Leiren and Jacobsen, 2018). Although many residents have been able to prepare and adjust to reduce their vulnerabilities to such recurrent lifeline disconnections during the winter (Jacobsen et al., 2016), there might be negative long-term impacts for communities that have been repeatedly isolated and often exposed to risky cold season road travel (Hovelsrud et al., 2018).
Whether climate change has led to lower or higher probability of snow avalanches is much debated. Studies performed using historical data and projections in western Canada did not suggest a substantial increase in avalanches reaching transportation corridors (Jamieson et al., 2017). Results by Sinickas et al. (2016) suggested that natural avalanche occurrence rates over the past 30 years in western Canada had decreased or stayed constant. However, the results were associated with a very high level of uncertainty. On the other hand, Ballesteros-Canovas et al. (2018) states that the transformation of dry snowpacks into wet snowpacks is decisive for the release of snow avalanches, which explains an increase in wet-snow avalanches in the Western Himalayas as winters have become milder. According to Teick et al. (2012) and Eckert et al. (2013), avalanche numbers and run-out distance have decreased in parts of the European Alps where snow depth decreased and air temperature increased (Hock et al., 2020). Castebrunet et al. (2014) shed some light on these contradicting arguments, as they projected a general decrease in mean and interannual variability of avalanche activity in the French Alps, with an amplified decrease in spring and at low elevations, while in winter and at higher elevations they projected an increase, because conditions that favour wet-snow avalanches come earlier in the season.
The Arctic region, which Troms is part of, has experienced a major change in climate over the past few decades, driven by increasing temperatures (AMAP, 2017; Vikhamar-Schuler et al., 2016; Hanssen-Bauer et al., 2019). For instance, Vikhamar-Schuler et al. (2016) found that five indices describing winter warming events in the Nordic arctic region have increased significantly during the past 50 years. This trend, being stronger in autumn and winter months, is significantly larger than the global average (Cohen et al., 2014). Using a daily interpolated dataset, Dyrrdal et al. (2012) performed a Norwegian national analysis of past changes in weather variables that can trigger natural hazards. For Troms, they found that the frequency of moderate to strong precipitation events, and the intensity of strong precipitation events, had increased during the period 1957–2010. Snow amounts had increased in colder areas (inland), while in warmer areas (coast and seaside fjord areas) snow amounts were somewhat reduced. Analysing large snowfalls and the number of days with snowfall revealed similar patterns, but trends were weaker. The number of near-zero events had also increased during the same period.
Hock et al. (2020) stated that more avalanches involving wet snow are expected to occur in the future. Similarly, Hanssen-Bauer et al. (2019) stated that an increase in heavy snowfall or heavy rain on snow may increase the occurrence of snow avalanches (including wet-snow avalanches and slushflows), while a shorter snow season and reduction in the maximum annual snow amounts may decrease the probability of dry-snow avalanches. According to a report on projected climate-related changes, “Troms climate fact sheet” (Hisdal et al., 2017), annual mean temperature in Troms is expected to increase by about 5 ∘C towards the end of the present century (compared to the historical period 1971–2000) under a high-emission scenario (RCP8.5), with a slightly larger increase during winter. Annual precipitation is expected to increase by about 15 %, with a larger (30 %) increase during summer. Further, days with heavy precipitation are expected to become more frequent and with higher precipitation intensity, resulting in an increased probability of precipitation-induced landslides, debris flows, and slushflows. The same report states that snow amounts will likely decrease drastically in lower elevations and episodes of melting will become more frequent in winter, while some higher-altitude regions might expect increasing snow amounts towards the middle of the century. From the development of snow amounts alone, we might expect that the probability of both dry- and wet-snow avalanches in these regions will increase during the first decades, followed by reduction of dry-snow avalanches towards the end of the century (Hisdal et al., 2017).
In northern Norway, wind-induced hazards represent significant challenges along the coast and some exposed mountain passes. Wind projections are highly uncertain and show no strong indication of change according to Hisdal et al. (2017) and Hanssen-Bauer et al. (2017). However, some studies have shown a change in cyclone density in the region; for instance, a study by Bengtsson et al. (2006) indicated that the location and intensity of storms are expected to change considerably in the future while the change in the total number of cyclones will be small. Empirical–statistical downscaling of CMIP5 simulations suggests an increase in storm activity in northern Norway and in the Barents region in the far future (Parding and Benestad, 2016).
How winter weather that might have negative consequences on vulnerable coastal communities has changed, and is expected to change in the future, is not much studied. Nor are the effects of these changes on the community and different sectors.
The current study presents past and future changes in selected winter climate indices known to potentially cause access disruptions in Troms, northern Norway. We have focused on the most common access disruptions and selected climate indices which in literature are known to be potential triggers of snow avalanches, including slushflows (thus focusing on natural avalanche occurrences), or somehow generate difficult road/transport conditions in exposed coastal and fjord areas in Troms.
The study will supplement social science investigations and advance natural hazard understandings by providing an overview of historical development and projected future changes in climate indices associated with winter season road travel safety and lifeline disruptions in Troms. Seeing past and future changes together, we believe strengthens the results and our understanding of the effects of climate change on relevant winter weather in these regions.
We present the study region and climate (Sect. 2), describe the data and method, and identify relevant climate indices (Sect. 3), before presenting results (Sect. 4) and wrapping up with discussion (Sect. 5) and conclusions (Sect. 6).
Troms was until 1 January 2020 the second northernmost county in Norway (see map in Fig. 1), located between 68.3 and 70.3∘ N, but was merged with the neighbouring county of Finnmark to form the new Troms og Finnmark county. Troms is part of the Arctic region, though with a partly sub-Arctic climate. In 2018, Troms consisted of 24 municipalities with a total area of nearly 26 000 km2 and around 165 000 inhabitants. The long coastline with thousands of small islands and islets, including some of Norway's large and mountainous islands, meets steep mountains further inland, resulting in a complex topography (see map in Fig. 1). The climate in Troms is strongly influenced by the complex topography with large gradients between coast/fjords and inland regions. During the winter season, Troms is characterized by a relatively mild and wet climate in coastal and fjord areas, while the inner parts are cold and dry (see Fig. 2). Mean winter temperatures range from slightly above zero along the seaside to around −12 ∘C in high-elevation areas inland. Valley regions in the inner parts of Troms are particularly dry, with mean winter precipitation of less than 200 mm, while values in southern coastal regions reach about 1200 mm. Polar lows, common for this region, can give sudden periods with strong winds and heavy precipitation in wintertime.
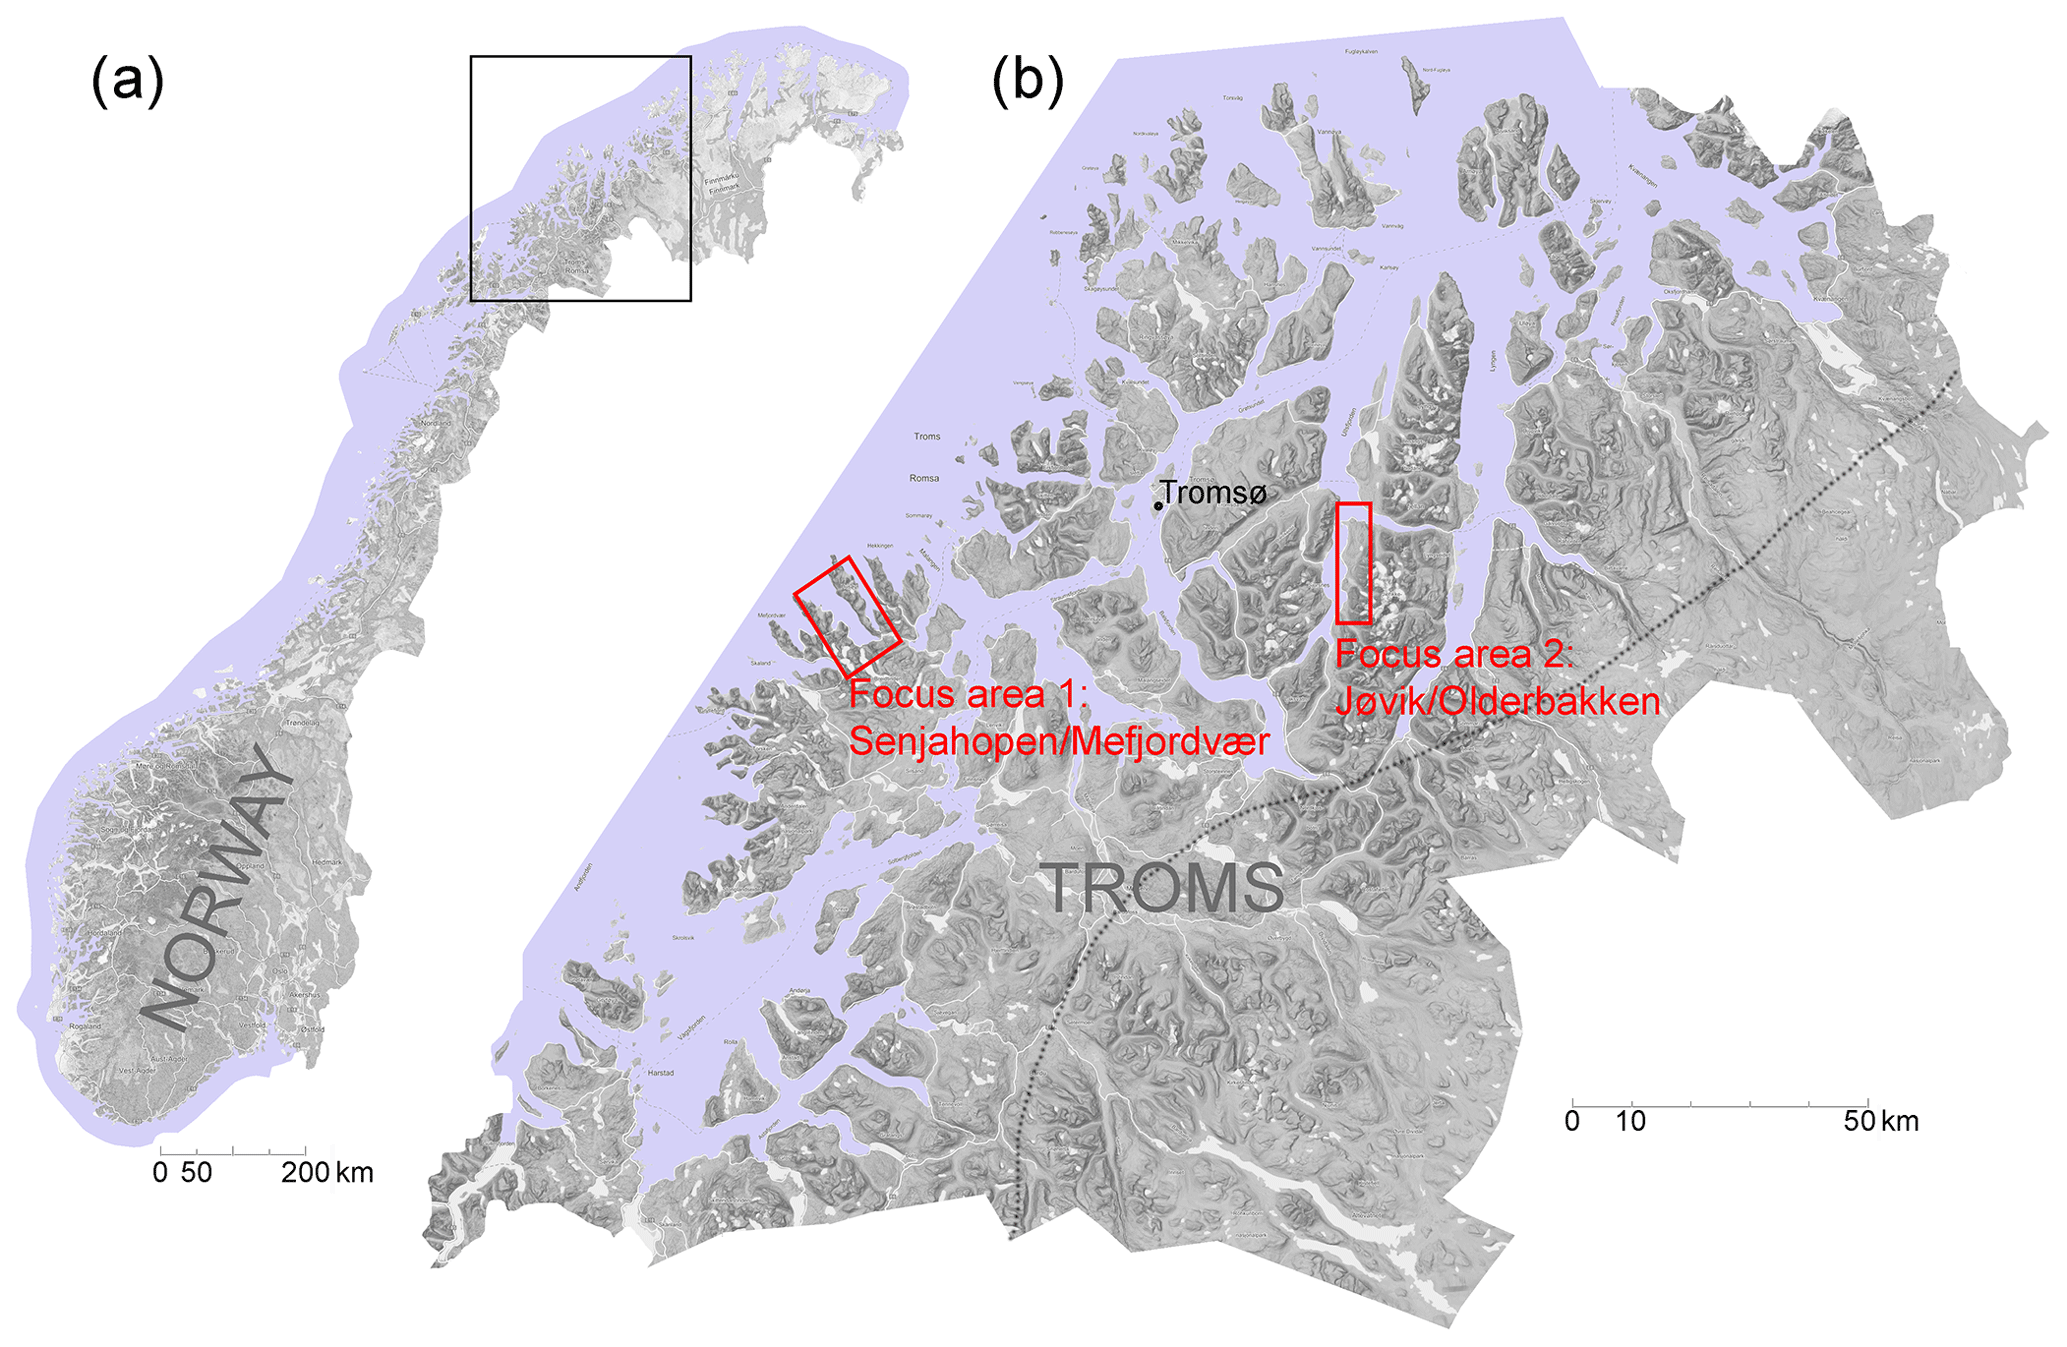
Figure 1Map of Norway (a) and Troms (b), with inland and coastal regions separated by the stippled line, and our two focus areas, focus area 1 and focus area 2 in red squares.
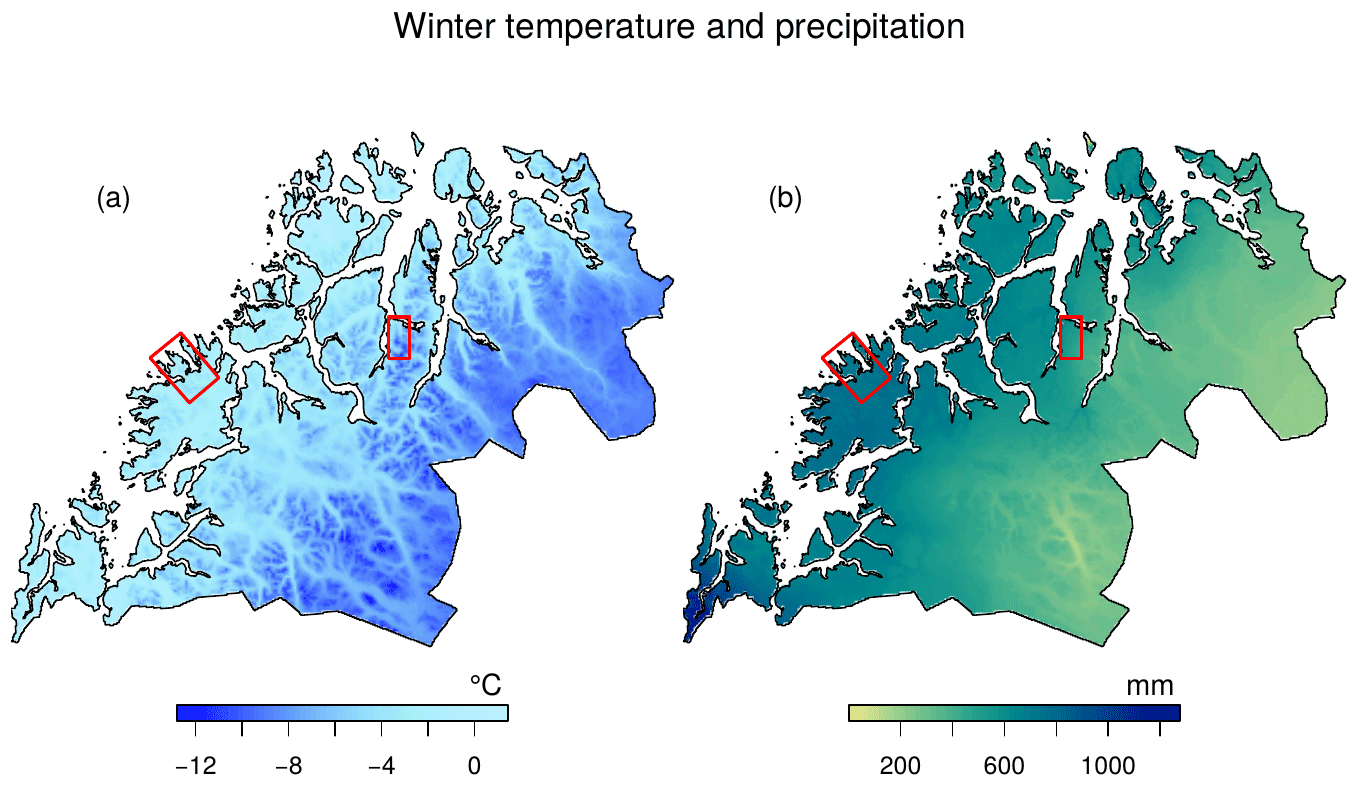
Figure 2Mean winter temperature and total winter precipitation averaged over the period 1981–2010.
Large parts of the population and infrastructure in Troms are located in narrow zones along the seaside, partly in fjords surrounded by steep mountain slopes. The topography, along with geological and meteorological conditions, make many roads particularly prone to avalanches. In parts of Troms, as much as 50 % of roads are located within susceptibility maps for snow avalanches and rockfall (NGI, 2013). Numerous road stretches in Troms go along alpine mountain sides and escarpments prone to snow avalanches (NPRA, 2014), and are thus vulnerable to closures and damages, as well as represent a threat to people's safety. Eckerstorfer et al. (2017) concluded that Tamokdalen in Troms (about 50 km south of focus area 2; see below) has a transitional snow climate (between maritime and continental climates), where also midwinter rain-on-snow events lead to extensive wet-snow avalanche cycles.
In the present study we focus particularly on two communities: focus area 1 – Senjahopen and Mefjordvær, next to the fjord Mefjorden in the Berg municipality; and focus area 2 – Jøvik and Olderbakken, next to the fjord Sørfjorden in Tromsø municipality (see Fig. 1 for the location of the two focus areas). Both areas lie within or close to an avalanche zone as defined by Norwegian Water Resources and Energy Directorate (NVE; https://www.nve.no/flaum-og-skred/kartlegging/aktsemdkart/aktsomhetskart-for-snoskred/, last access: 15 January 2020). Only along Mefjorden there are 18 known avalanche tracks with run-out zones encompassing the access highway for the fishing villages Senjahopen and Mefjordvær (Sjømatklyngen Senja, 2017). In our gridded data, focus area 1 covers 416 grid cells (1 km×1 km), ranging from 0 to slightly more than 800 m a.s.l. (metres above sea level). Real elevation might be higher due to smoothing in the gridded elevation data. Focus Area 2 is smaller with 162 grid cells, but with steeper topography ranging from 0 to almost 1800 m a.s.l.
Three weather variables are of main interest in this study, namely precipitation (including snow), air temperature, and wind, and combinations of these. We computed changes in selected indices (see Sect. 3.3) based on these weather variables using datasets that cover the recent climate (1958–2017) and projected future climate (2041–2070 and 2071–2100). As most disruptions due to weather occur during the extended winter season, this is our season of focus. Winter season is here defined as the months of October through April (212 d in total).
3.1 Gridded observation-based data
To obtain spatially continuous information on the recent climate, the Norwegian Meteorological Institute (MET Norway) provides gridded datasets of daily mean, minimum and maximum air temperature (T, Tmin, Tmax) and daily precipitation sum (P) for the Norwegian mainland. The dataset, referred to as “seNorge”, is based on observations interpolated to a 1 km×1 km grid covering the period 1957–present. Different versions of seNorge exist, based on different interpolation methods and input data. For temperature, we here analysed seNorge1 (e.g. Tveito et al., 2002) as it includes minimum (Tmin) and maximum temperature (Tmax) from which we calculated zero crossings. seNorge1 temperature was developed through residual kriging using terrain and geographic position to describe the deterministic component. seNorge2 temperature (Lussana et al., 2018a) and precipitation (Lussana et al., 2018b) are based on Bayesian spatial interpolation and optimal interpolation (OI) to propagate information from coarser to finer scales. We here analysed precipitation from seNorge2. Snow variables, including daily total snow water equivalent (SWE) and fresh snow water equivalent (FSW; change in SWE from one day to the next), was computed from seNorge2 T and P using the seNorge snow model v1.1.1 (Saloranta, 2014). This consists of a precipitation/degree-day snow model with a snow routine similar to the HBV model (Bergström, 1975), as described in Engeset et al. (2004). In seNorge snow model v1.1.1 a temperature-independent melt term is added to the temperature-dependent degree-day term, while the melt threshold temperature is kept at 0 ∘C. The new melt term is proportional to the potential solar radiation, thus varying with the combination of latitude and time of the year. Saloranta (2014) found that the average station-wise median bias for snow depth from the seNorge snow model v1.1.1 lies between −12 % and +17 % for the period January to April. Hereby, we refer to all seNorge datasets as seNorge, followed by the variable of interest, for instance seNorge Tmax. seNorge is an operational product updated every day, and available at http://www.senorge.no (last access: 15 January 2020), and provides important input to the avalanche forecasting in Norway presented at https://varsom.no (last access: 26 June 2020).
For wind, a dataset of daily mean 10 m wind speed (FF), named KliNoGrid, is available on a grid similar to seNorge for the period 1957–2015. This dataset is downscaled from a high-resolution (10 km) hindcast of wind and waves for the North Sea, the Norwegian Sea and the Barents Sea (NORA10; Reistad et al., 2011), evaluating relatively well along the coast of Norway. The downscaling was performed with a quantile mapping approach (Bremnes, 2004) to match the climatology of the high-resolution numerical weather prediction model AROME-MetCoOp (Müller et al., 2017). KliNoGrid is available for public download at https://thredds.met.no/thredds/catalog/metusers/klinogrid/KliNoGrid_16.12/FFMRR-Nor/catalog.html (last access: 15 January 2020).
3.2 Future projections
To assess expected future climate development, we used projections from climate models. The model chain starts with low-resolution general circulation models (GCMs) covering the entire earth, the output of which is used in regional climate models (RCMs) that simulate climate on a finer grid over a region. Finally, an ensemble of 10 simulations from the EURO-CORDEX project (Jacob et al., 2014), representing different combinations of GCMs and RCMs, has been downscaled to a grid similar to the seNorge grid described above (1 km horizontal resolution). Due to the systematic biases in the climate model output and their mismatch in scale with impact models' data requirement, a post-processing is necessary to obtain plausible time series for use in local impact studies. The downscaled EURO-CORDEX ensemble for the entire period 1971–2100 was bias adjusted towards seNorge version 1.1 for daily mean temperature and daily precipitation sum (Wong et al., 2016), while for daily mean wind speed the KliNoGrid dataset described above was used as reference for the bias adjustment. An empirical quantile mapping method was used in the bias adjustment of precipitation and wind. For mean temperature the same method was used on the anomalies, while for minimum and maximum temperature a quantile delta mapping method (Cannon et al., 2015) was used on the projections.
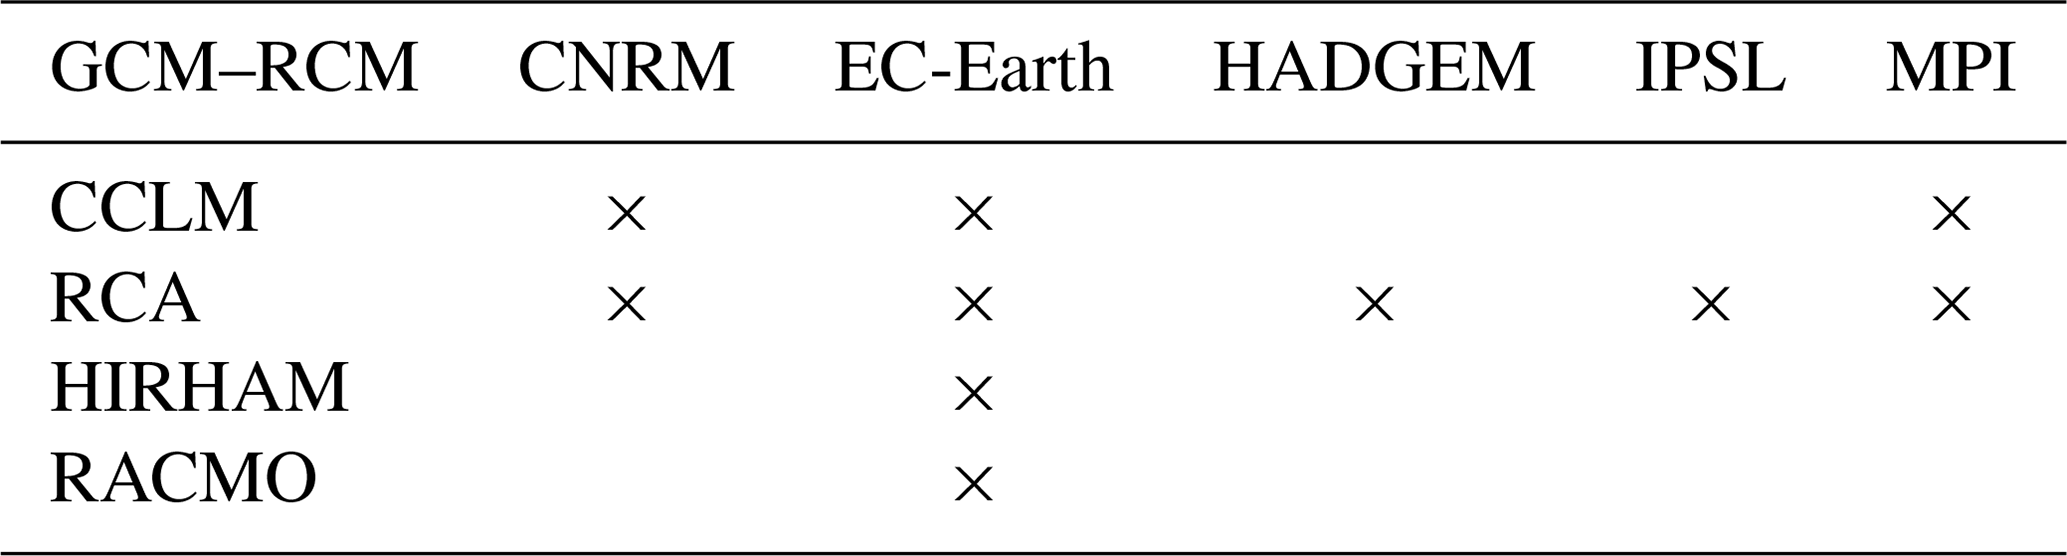
We refer to the corrected datasets of temperature, precipitation and wind as “EUR11-Nor1”, where EUR11 stands for EURO-CORDEX with 0.11∘ resolution, Nor stands for Norway and 1 stands for 1 km resolution. Temperature and precipitation was then used to force a spatially distributed, gridded hydrological model (the HBV model) (Wong et al., 2016) to generate daily time series of different hydrological components. Here we focused on daily SWE, from which we also computed daily FSW (FSW-1d). The Norwegian government recommends, as a precautionary principle, using the high-emission scenario when assessing the effects of climate change (Norwegian Ministry of Climate and Environment, 2013); thus we only analysed projections from the RCP8.5 emission scenario. Datasets of precipitation, temperature and hydrological variables described here contribute to the natural scientific basis for climate adaptation in Norway, as described in Hanssen-Bauer et al. (2017). Some of them (P, T, Tmax, Tmin and SWE), are available through the Norwegian Climate Data Store: https://nedlasting.nve.no/klimadata/kss (last access: 15 January 2020). The 10 GCM–RCM combinations in the EURO-CORDEX ensemble are shown in Table A1 in the Appendix. In the results, we report on the ensemble mean of the 10 simulations, not individual model simulations.
3.3 Climate indices
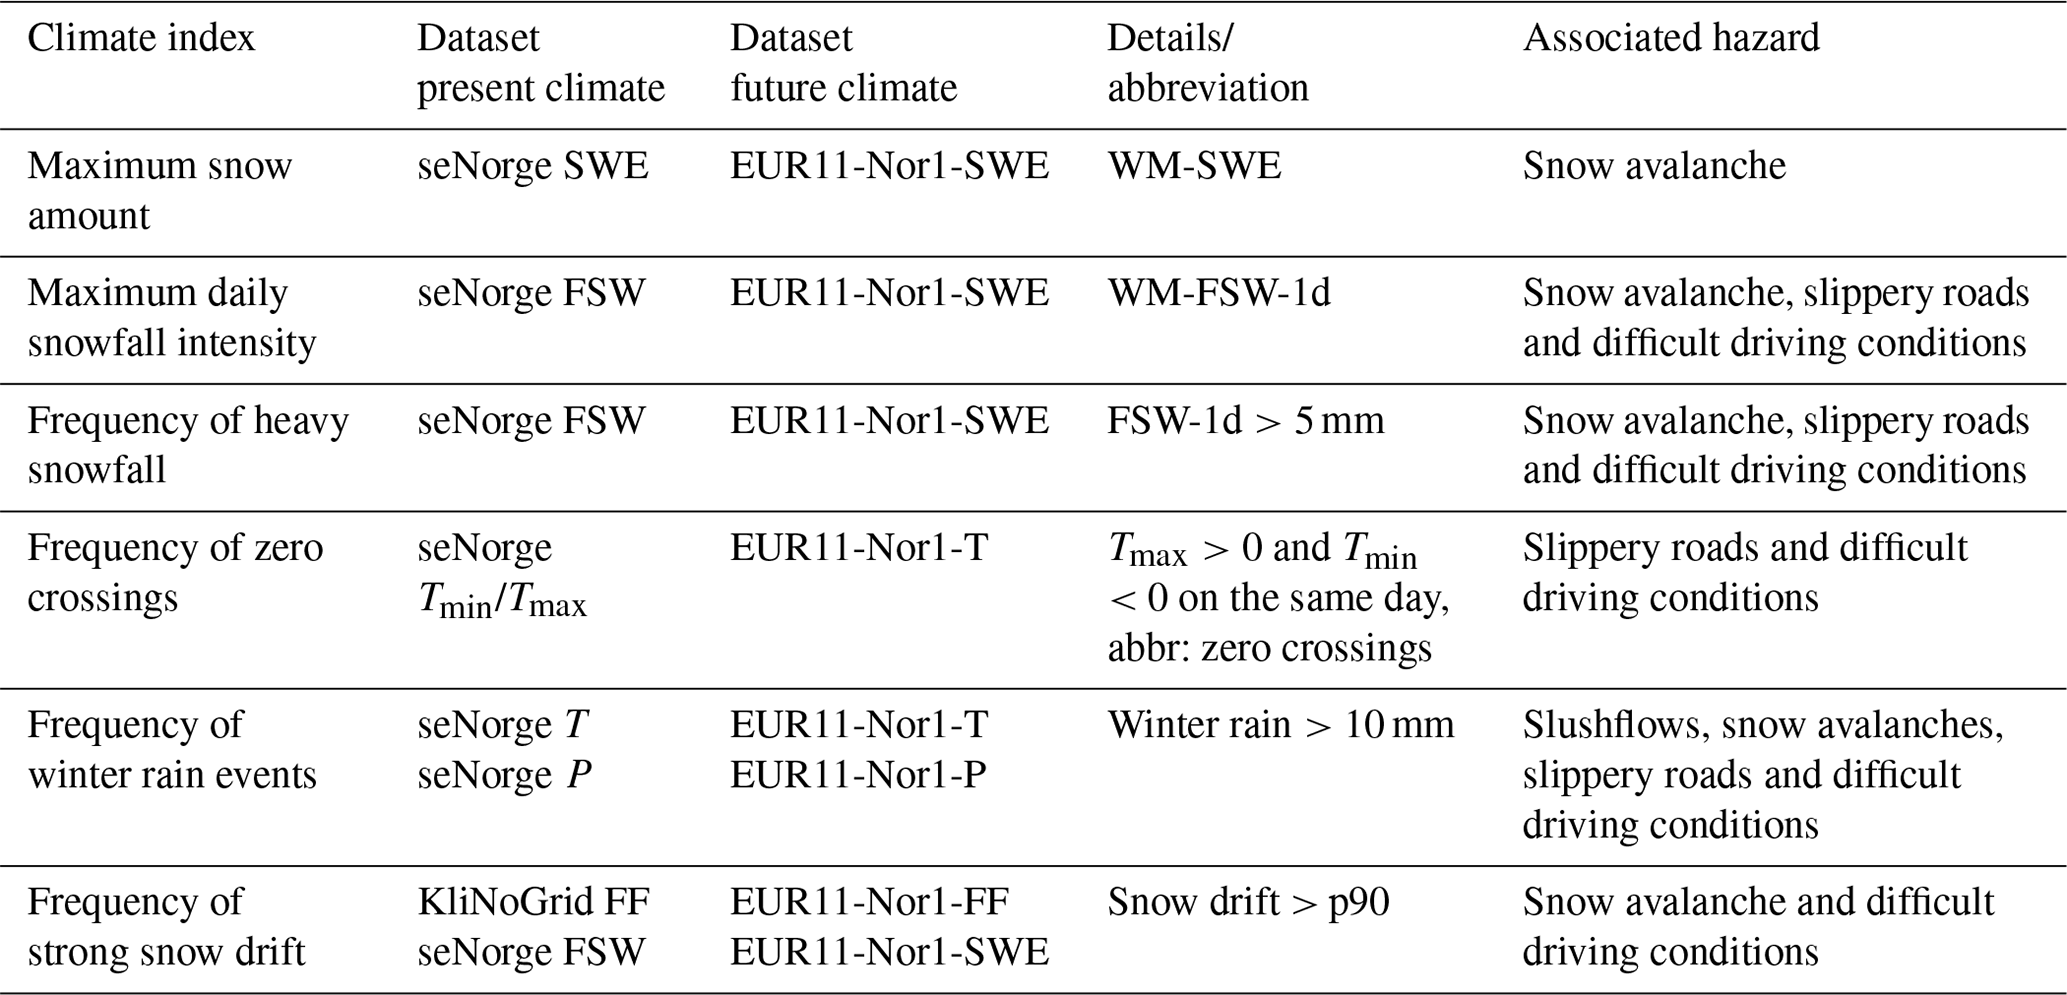
We identified indices describing weather elements known to be potential triggers of snow avalanches or that somehow lead to difficult road and driving conditions. The derived indices were identified from literature referred to in the following text and presented in Table 1. For frequency indices, we pragmatically selected the thresholds to facilitate a trend analysis, but we believe that the pattern of changes for low-threshold events can be transformed to higher-threshold events. The final choice of selected indices was also influenced by the availability of the parameters as gridded data, for both historical and future periods.
In this paper, we use snow avalanches as a common term for all kinds of snow avalanches (including slushflows) and landslides as a common term for rock avalanches (including rockfall) and debris avalanches (debris flows, mudflows), except where a specification into type is needed. We have followed the classification from Kristensen et al. (2015).
Jaedicke et al. (2008, 2009) coupled 20 000 historical landslide and avalanche events in Norway with meteorological data for the period 1961–2005. This dataset was further used in a classification tree analysis to identify the most relevant meteorological elements causing avalanches and landslides. Results showed that snow avalanches had the highest correlation with meteorological elements such as wind and precipitation (Jaedicke et al., 2008). The study also revealed that the most important elements triggering landslides or avalanches varied spatially over Norway. While 1 d precipitation was the most important trigger for snow avalanches in the coastal south-western part of the country, both wind and precipitation played an important role in northern Norway. Sandersen et al. (1996) found that particularly strong storms with heavy rain and snowfall frequently initiate landslides and snow avalanches, and they concluded that debris and slushflows in Norway are often initiated at times of high water supply from intense rainfall and/or rapid snowmelt. NVE (2014) indicated a critical threshold of 40 mm d−1 of total rain plus melt, given by field experience and measurements. Here we studied winter rainfall events (precipitation amount on days with T>0∘) exceeding a threshold of 10 mm d−1. During such rainfall events one can expect an extra contribution to water supply through melting. Although the threshold of 10 mm d−1 is significantly lower than the 40 mm d−1 indicated in NVE (2014), 10 mm d−1 is recommended by the CCl/CLIVAR/JCOMM Expert Team to define a “heavy precipitation day” (https://www.ecad.eu/download/millennium/millennium.php, last access: 15 January 2020), and the same threshold is used in for example Vincent and Mekis (2006) and Dyrrdal et al. (2012).
NVE (2014) stated that at least 0.5 m of fresh snow in 2–3 d, along with strong winds, is required to trigger a snow avalanche of significant size. This is in agreement with Schweizer et al. (2003), who stated that about 30–50 cm of accumulation of new snow is critical for naturally released avalanches. The combination of wind speed and fresh snow can be defined as a so-called snow drift factor, which has proven high skill in avalanche prediction. Davis et al. (1999), Hendrikx et al. (2005) and Kronholm et al. (2006) all used classification trees to show that snow drift factors rate among the top indices for avalanche activity. Davis et al. (1999) used the expressions from Pomeroy and Gray (1995) to derive the wind drift factor as the product of the 24 h snowfall and wind speed to the fourth power, as follows:
Here we adopted this definition of snow drift, using 1 d snowfall (FSW-1d) and daily mean wind speed (FF).
Due to the large uncertainties associated with wind, and particularly the high influence from local conditions, we selected the grid cells of highest wind exposure in each focus area (6/8 out of 416/162 grid cells in focus area 1/2, respectively). We computed the snow drift factor according to Eq. (1) above. Further, we calculated the number of events when the snow drift factor exceeded the 90th percentile (p90), where p90 was computed from all days and all years in the selected grid cells of each focus area. Finally, we computed the percentage change from spatially averaged frequencies.
Road disruptions in Troms include road blockages by trailers during slippery conditions (Jacobsen et al., 2016, Jacobsen, 2020). Slippery conditions can arise under a wide range of near-zero conditions (Table 21.2.3 in NPRA, 2011, and Table 1 in Arvidsson et al., 2012). Here, we use zero crossings based on air temperature as a proxy for slippery conditions. A zero crossing is defined as Tmin <0 and Tmax >0 on the same day (Geiger et al., 2007; Kerguillec, 2015). Although zero crossings calculated from 2 m air temperature do not coincide perfectly with slippery conditions, they have the advantage of being available for the future period at 1 km resolution, as opposed to road temperature and dew point temperature and humidity. In lieu of adequate climate projections to calculate zero crossings and/or skid resistance on the road, we therefore report results from recently available downscaled projections of air temperature (Tmax and Tmin; Wong and Nilsen, 2019). A simple index like zero crossings, for which measurements and gridded products are well represented, we believe captures the main fluctuations and direction of change of slippery conditions.
3.4 Method
Past trends in winter maxima and peak-over-threshold events were assessed through the rank-based nonparametric Mann–Kendall trend test (R package Kendall) to identify positive and negative trends and evaluate their statistical significance at a 5 % level. Mann–Kendall tests the null hypothesis that the data are independent and identically distributed, and they are well suited to study hydrometeorological time series, as these are usually non-normally distributed (Yue and Pilon, 2004). In addition, we computed the percentage change between the mean values from the first 30-year period (1958–1987) and the last 30-year period (1988–2017). For snow drift, which is only computed for selected grid cells in the two focus areas, no trend analysis is performed.
To assess expected future change, we computed the percentage change in temporal mean between the historical period, 1981–2010, and two future periods, 2041–2070 (near future) and 2071–2100 (far future), through the methods described above.
For both past and future changes, we present mean spatial statistics over the whole of Troms and for the two focus areas. Within each focus area we additionally identified two elevation bands representing likely snow avalanche release zones (>700 m a.s.l. in focus area 1 and between 1000 and 1300 m a.s.l. in focus area 2) and likely avalanche run-out zones (<200 m a.s.l.). These zones are relevant for roads exposed to avalanches in the focus areas (Jacobsen, 2020). All roads in the study areas are located below 200 m, while the high-elevation bands were defined in collaboration with local avalanche experts. We report on changes computed for grid cells falling into these elevation bands.
In the attempt to identify the period for which snow avalanches may become a larger threat, and at which point they become a decreasing threat, we investigated the past and projected development in maximum snow amounts for different elevations. We also analysed future changes in the median elevation where winter maximum SWE is lower than certain thresholds (100 mm), representing part of the low-lying fjord and coastal areas; valley bottoms where roads and communities are established (200 mm), representing the more humid low-lying coastal areas; the larger forested inland areas of Troms (400 mm), representing upland areas adjacent to forest line and coastal areas with high precipitation; and 600 mm, representing the highest mountain areas. Due to the large gradients in climate variables in Troms, the latter analysis was performed for separate inland and coastal/seaside regions as defined in Fig. 1.
In Fig. 3 we show how winter temperature and precipitation has varied over the last 150 years at a meteorological station in Tromsø, the administrative centre of the county. Winter temperature fluctuates between −5 and 0.5 ∘C, and winter precipitation typically fluctuates between 250 and 950 mm. The temperature time series indicate multi-decadal variability, with a relatively cold period between the 1910s and the 1920s, a relatively warm period during the subsequent two decades, a temperature decrease from the 1950s to the 1960s, and thereafter a general temperature increase. Other parts of the Arctic have a similar pattern (e.g. Polyakov et al., 2003; AMAP, 2017). The linear trend during the 60-year period 1958–2017, which is the period we focus on in the current study, shows a significant increase in winter temperature (0.26 ∘C per decade) and a moderate increase in winter precipitation (2.2 % per decade) in Tromsø.
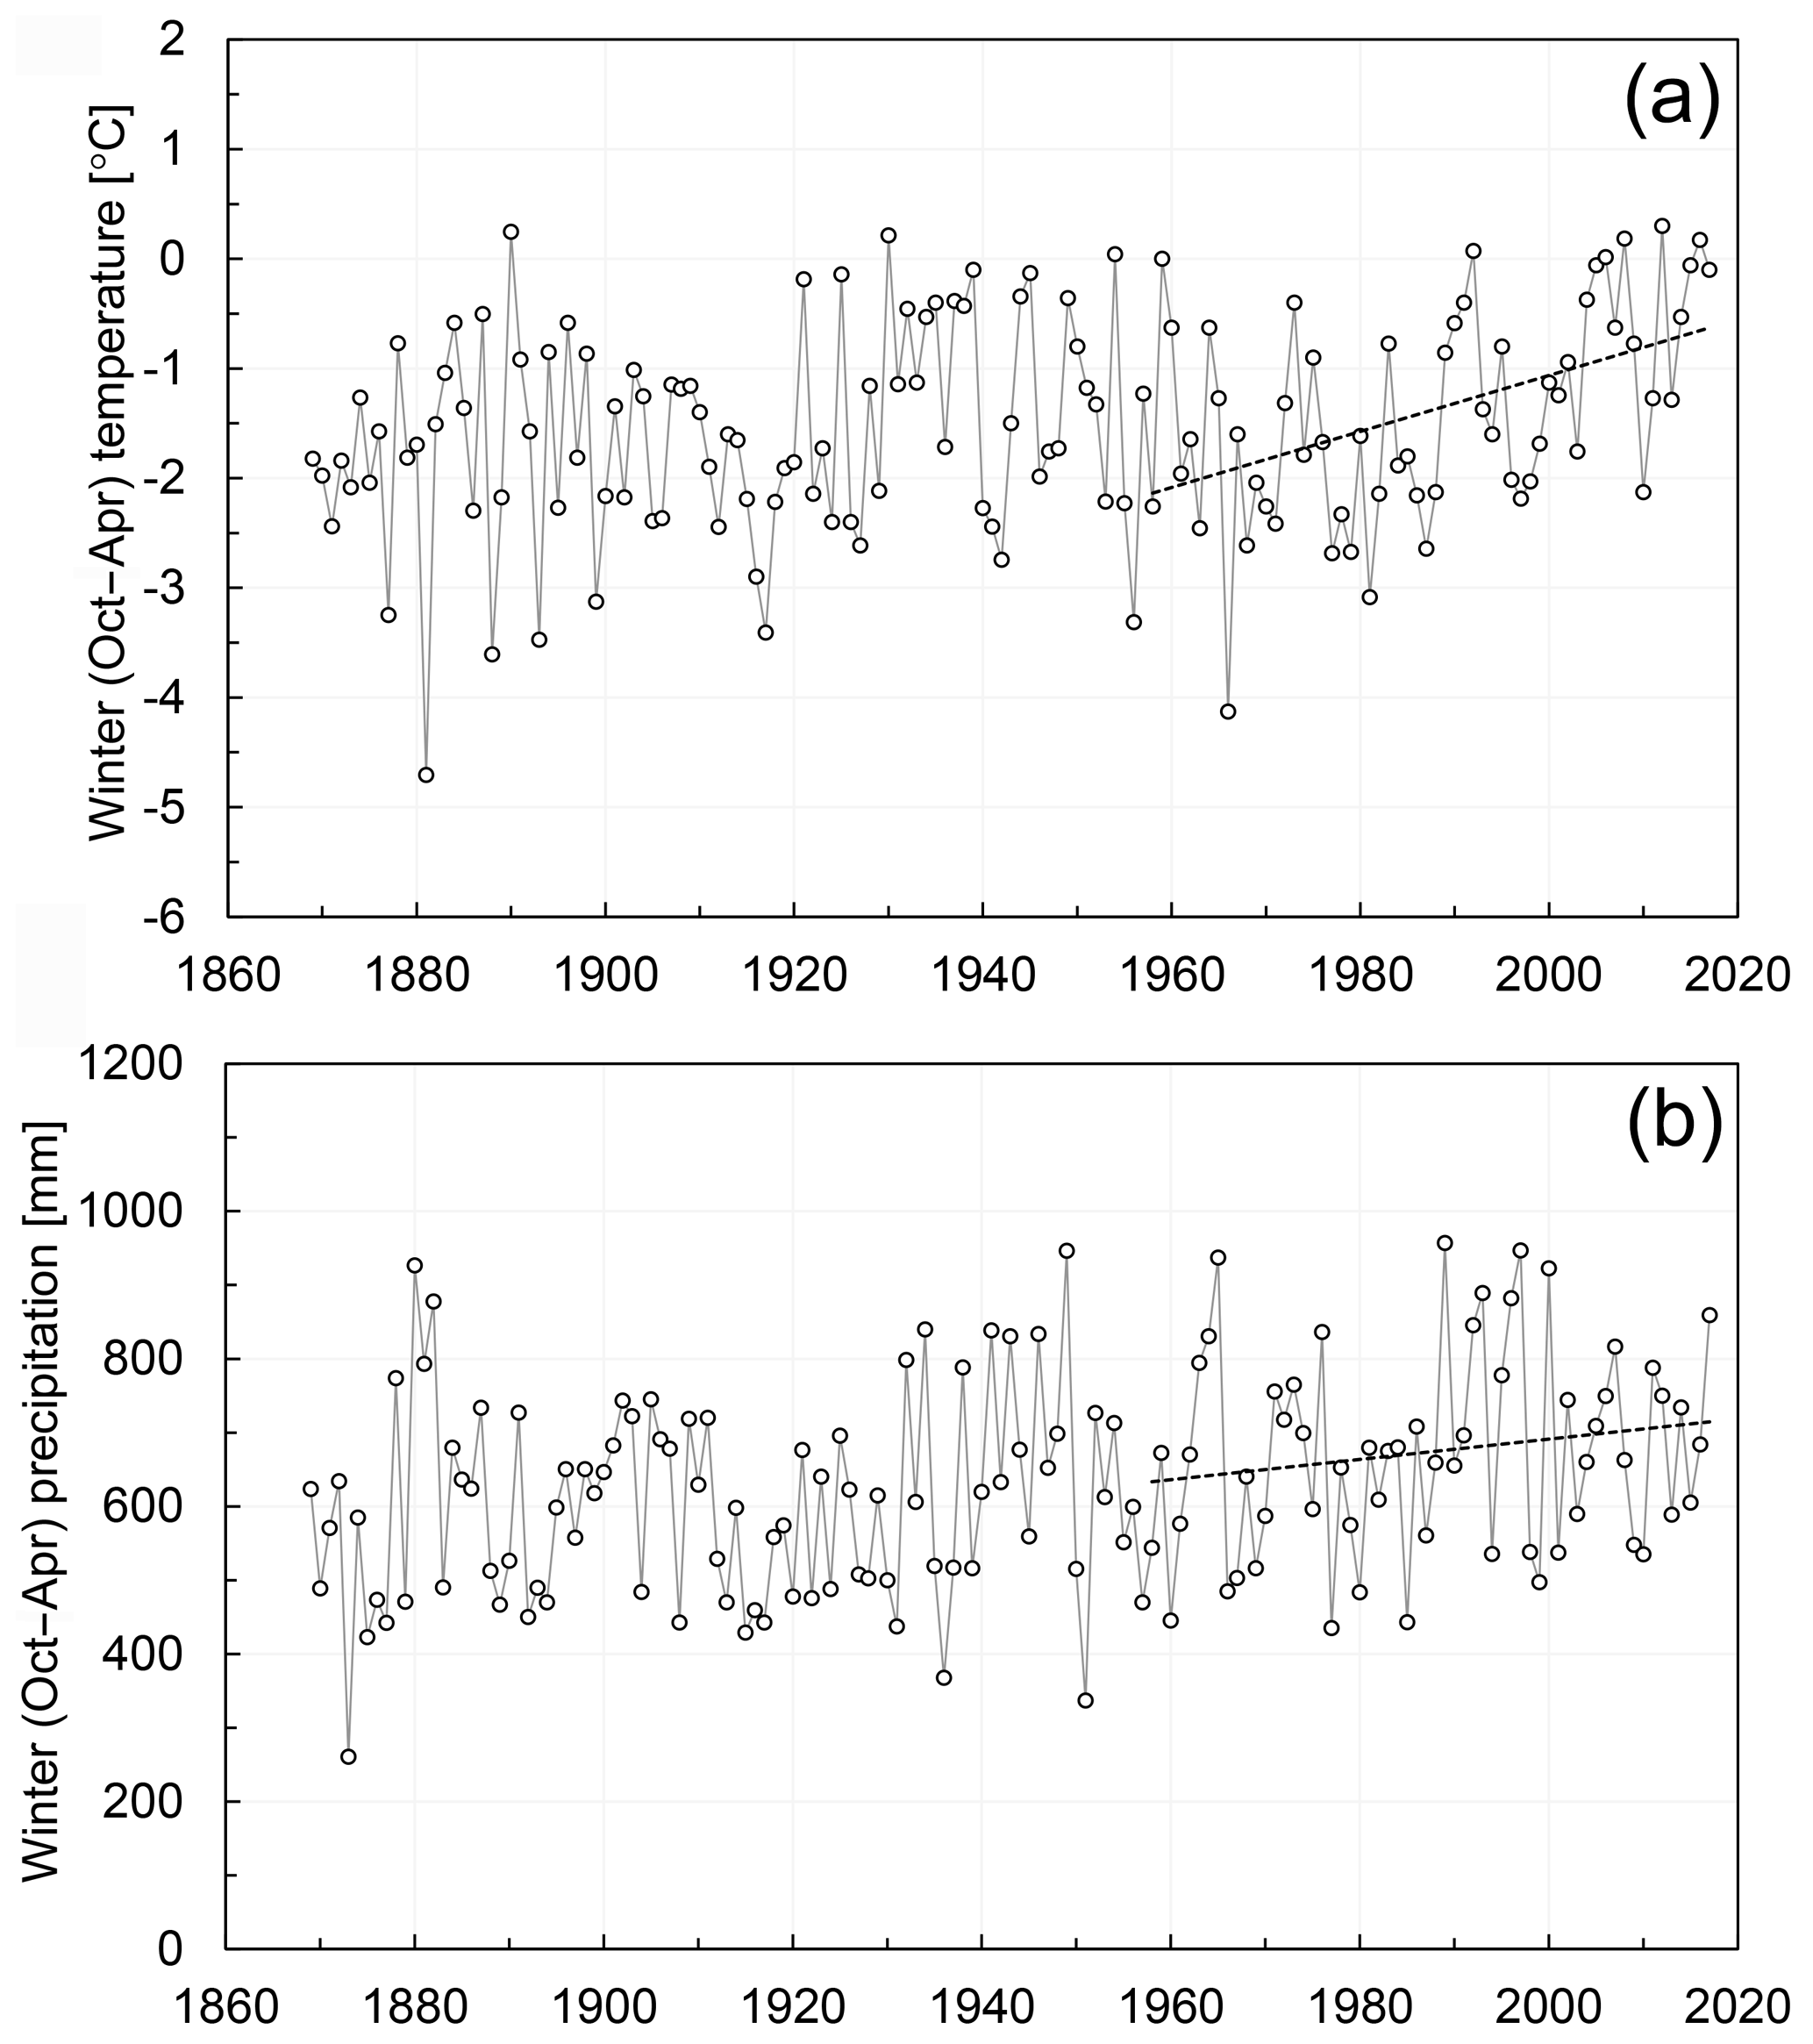
Figure 3Mean winter temperature (a) and total winter precipitation (b) measured at the Tromsø meteorological station in the period 1867–2017. The stippled line indicates the trend in the period 1958–2017.
Table 2Estimated changes in climate indices between two 30-year periods in the two focus areas, based on spatial mean values. In parentheses we present the change in the lower and higher elevation bands, respectively. Values for snow drift are only based on selected grid cells in high and wind-exposed elevations. All values are in percent (%), except absolute values on the second line in each cell. Past change refers to the change between the first and the last 30-year period during 1958–2017 (for wind: 1958–2015), and a reference value for the period 1981–2010 is given below. Change in the near (far) future refers to change between 1981–2010 and 2041–2070 (2071–2100).
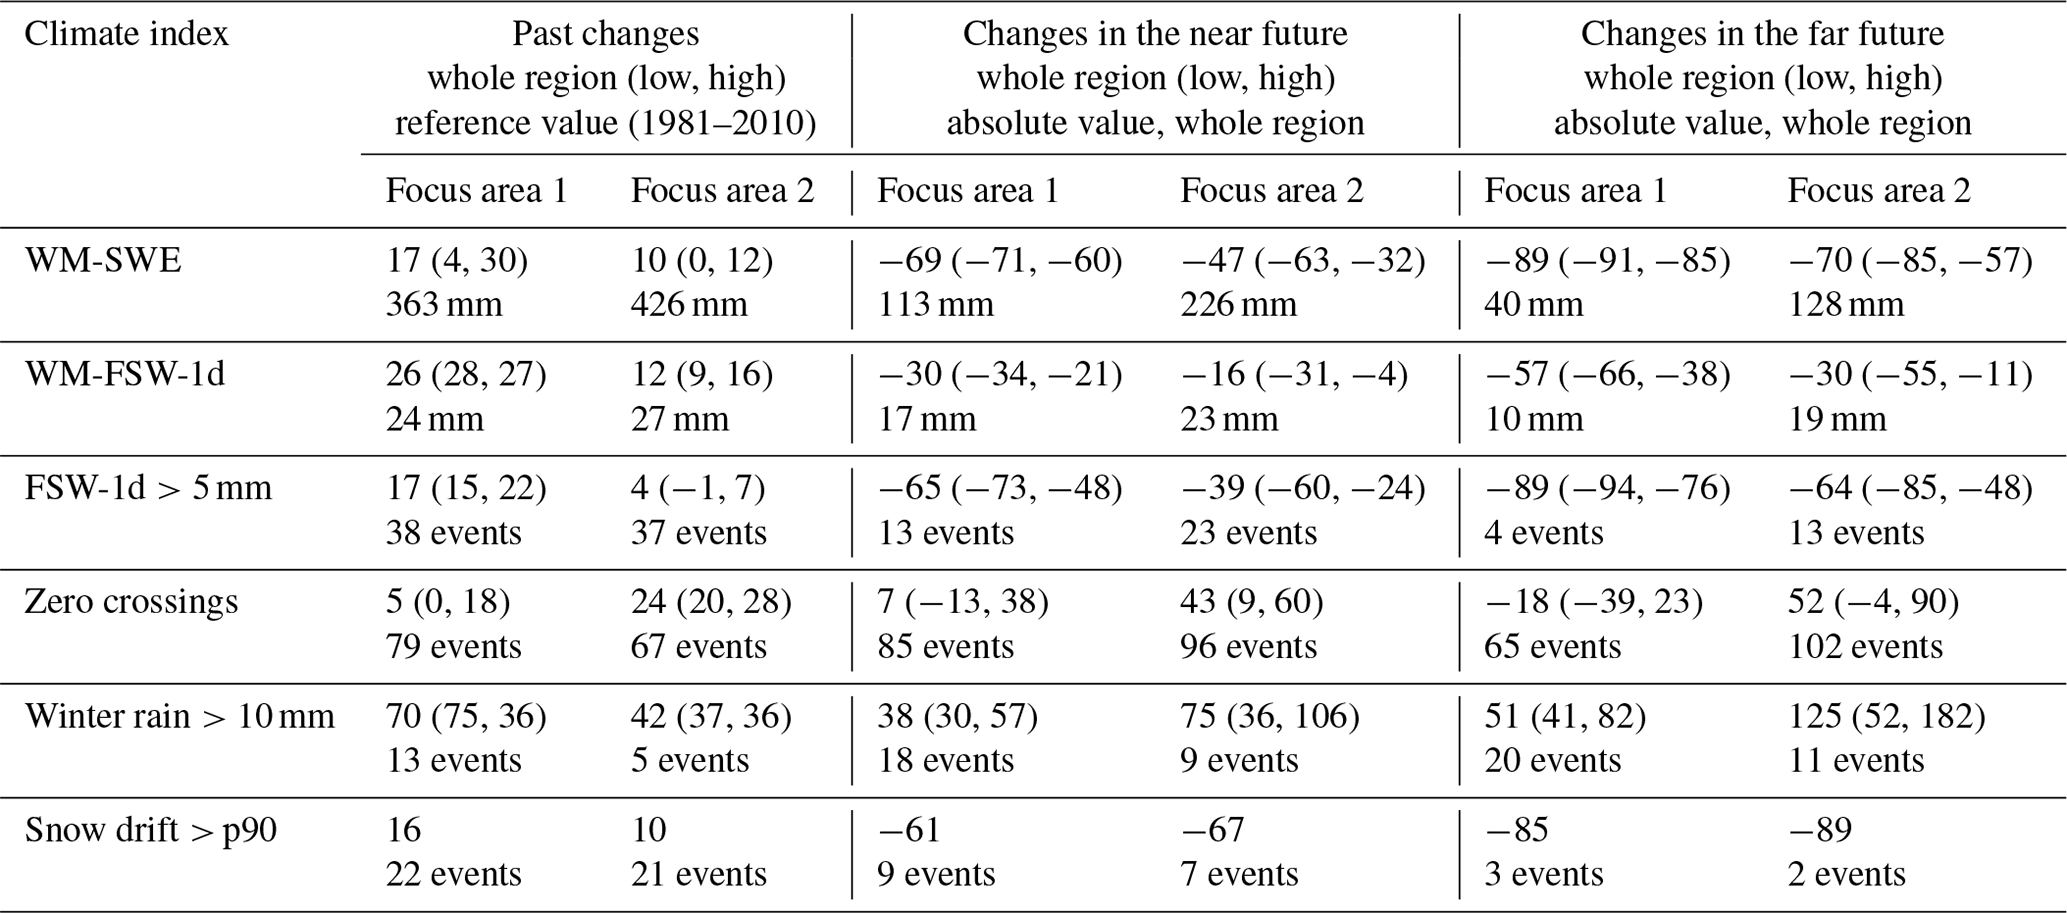
Further, we present results for each climate index separately, starting with historical and future changes in the whole of Troms. We proceed with results from the two focus areas as presented in Table 2, including changes in the different elevation bands relevant for avalanche release (high elevations) and avalanche run-out zones (low elevations), for the historical period and the two future periods. In Table 2 we also report on the mean values for the period 1981–2010, as reference, and the projected absolute change compared to this reference value.
4.1 Changes in maximum snow amount
Figure 4 shows mean winter maximum snow water equivalent (WM-SWE) and the spatial trends and changes during the study period 1958–2017. The largest values of WM-SWE are found in higher elevations (see map in Fig. 1) near the coast and along the fjords, while they decrease towards the Swedish border to the east (Fig. 4a). In Fig. 4b, significant positive trends are seen inland and in the north-eastern part of Troms, with an increase of 20 %–60 % from the first to the last 30-year period (Fig. 4c). Some coastal regions, especially in the southern and north-western outermost areas, are dominated by significant negative trends in WM-SWE. These areas show a decrease of 20 %–40 % between the first 30-year period (1958–1987) and the last 30-year period (1988–2017).
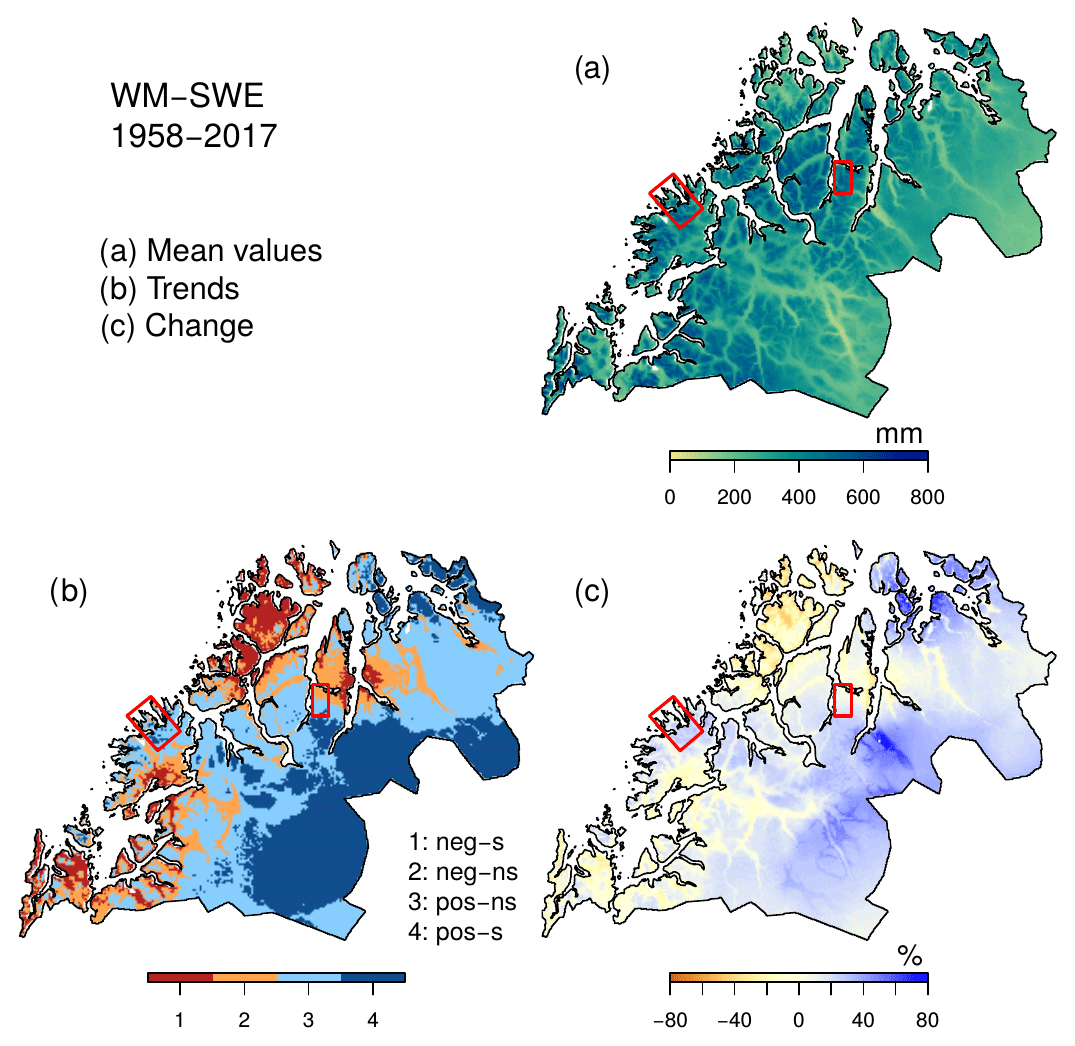
Figure 4Mean values (a), trends (b) and changes (c) in winter (October–April) maximum snow water equivalent (SWE) for the period 1958–2017. In panel (b), positive trends are illustrated in blue and negative trends in red; dark red and blue colours represent statistically negative and positive significant (s) trends, respectively. Light colours represent statistically not-significant (ns) trends. In panel (c), percentage changes between the two 30-year periods 1958–1987 and 1988–2017 are shown.
Figure 5 presents projected percentage changes in WM-SWE for the near (2041–2070) and far (2071–2100) future, as given by EUR11-Nor1-SWE. Changes are mainly negative, with strong gradients from coast (largest decrease) to inland (weakest decrease). As expected, the changes become larger with time. The largest projected decrease, in the islands along the coast, is in the order of 60 %–80 % for the near future (Fig. 5a) and 80 %–100 % for the far future (Fig. 5b).
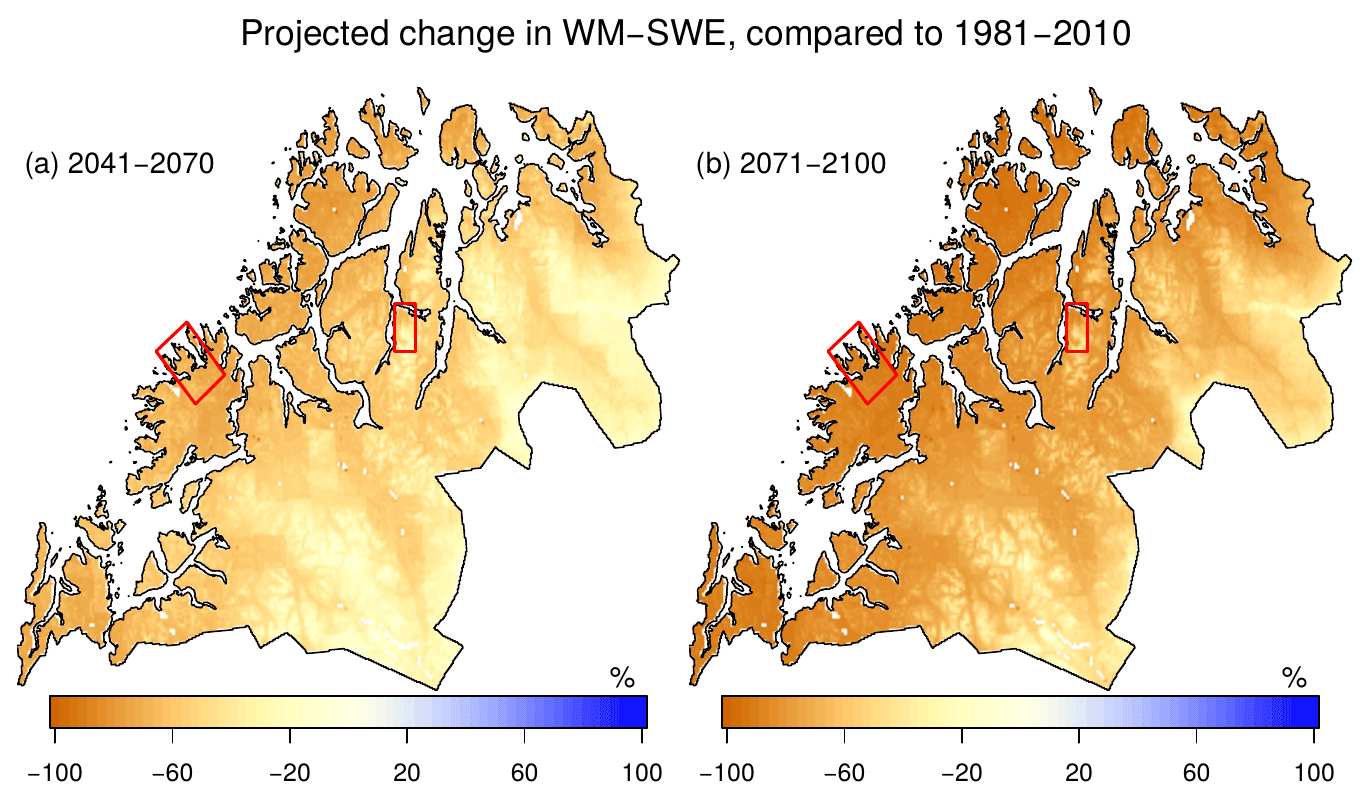
Figure 5Projected change in maximum snow water equivalent (SWE) during winter (October–April) between 1981–2010 and (a) the near future (2041–2070) and between 1981–2010 and (b) the far future (2071–2100).
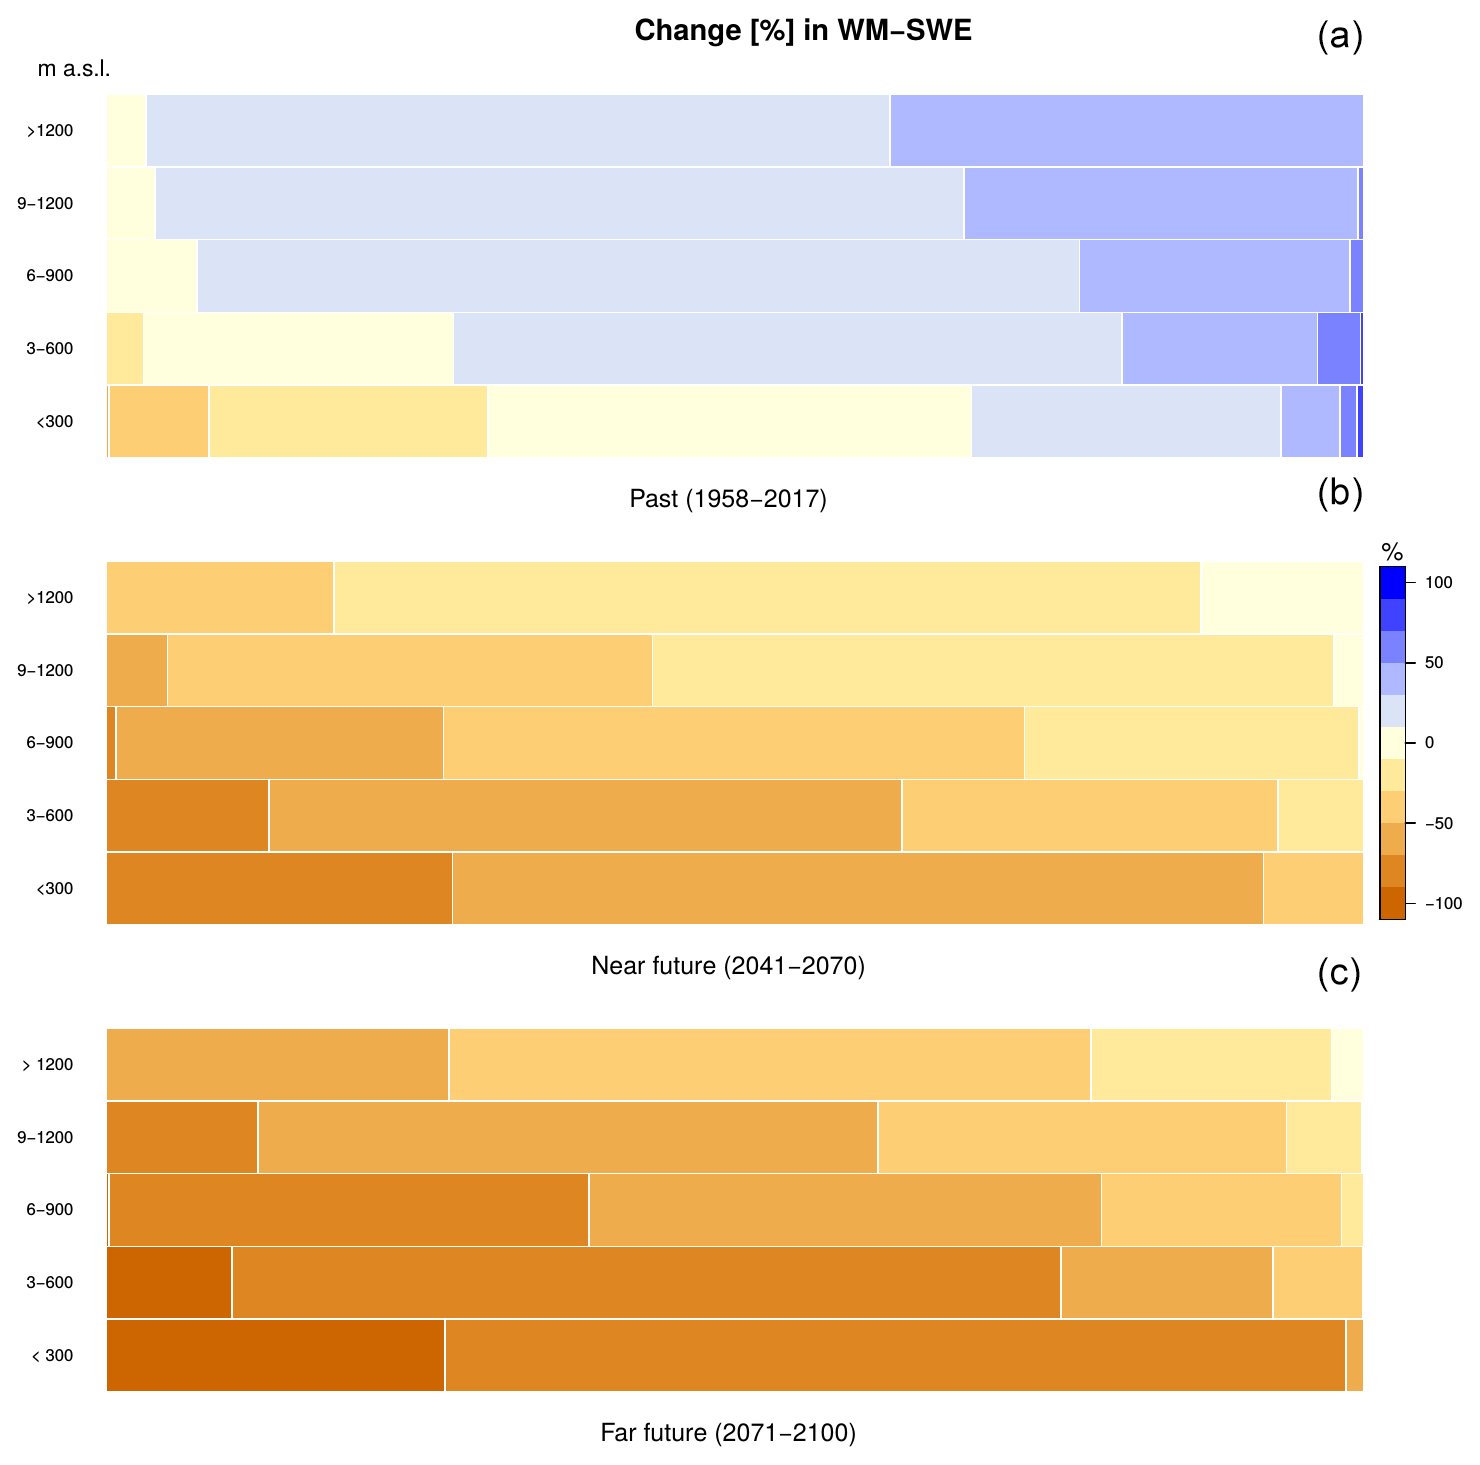
Figure 6Percentage change in winter maximum SWE in different elevation levels for the historical period (change between 1958–1987 and 1988–2017; a), the near future (change between 1981–2010 and 2041–2070; b) and the far future (change between 1981–2010 and 2071–2100; c). The length of the coloured bars represent the fraction of grid cells within the different intervals of change given by the legend.
Figure 6 shows the same change in WM-SWE for past and future climate but for different elevation levels, separated into classes according to the degree of percentage change. For instance, more than one-third of grid cells in the highest elevations (>1200 m a.s.l.) have had an almost 50 % increase in WM-SWE in the past. Again, we see that changes in WM-SWE are mainly positive in the past but become negative in the future. The higher-elevation areas show the largest increase in the past and the smallest decrease in the future, explained by the lower temperature in these regions. At some point between the present and the near future, the temperature in these region will, however, reach levels that also give declining snow amounts here. This is further investigated in Fig. 7, showing the median elevation where maximum snow amounts stay below certain thresholds (100, 200, 400 and 600 mm). Due to the strong gradients in Troms, we analysed projected changes in WM-SWE for coastal regions (Fig. 7a) and inland regions (Fig. 7b) separately (see map in Fig. 1); thus elevation on the y axis differs. Median elevation in both regions increases towards the end of the century, more so in the coastal region and particularly for WM-SWE <100 mm, meaning that we need to go to higher and higher elevations to find snow in the future. Since the elevations are strictly increasing as of 2040, it is likely that the turning point from increasing to decreasing snow amounts occurs prior to 2040, at least in terms of WM-SWE. This is supported by the 1981–2010 mean values (indicated as triangles in Fig. 7) being lower than values in 2040, except in lower elevations inland where 1981–2010 values are higher. As shown in Fig. 4, WM-SWE increased in the inland region during 1957–2017, and this trend has likely continued longer and/or been stronger in lower elevations. The narrowing range between smaller and larger snow amounts indicates a stronger elevation gradient for WM-SWE as winter precipitation increases, particularly in low elevations and coastal regions where winters are comparatively mild. This might be explained by the fraction of rain and degree of snowmelt in lower versus higher elevations differing more in the future, giving a stronger decrease in the low to medium elevations.
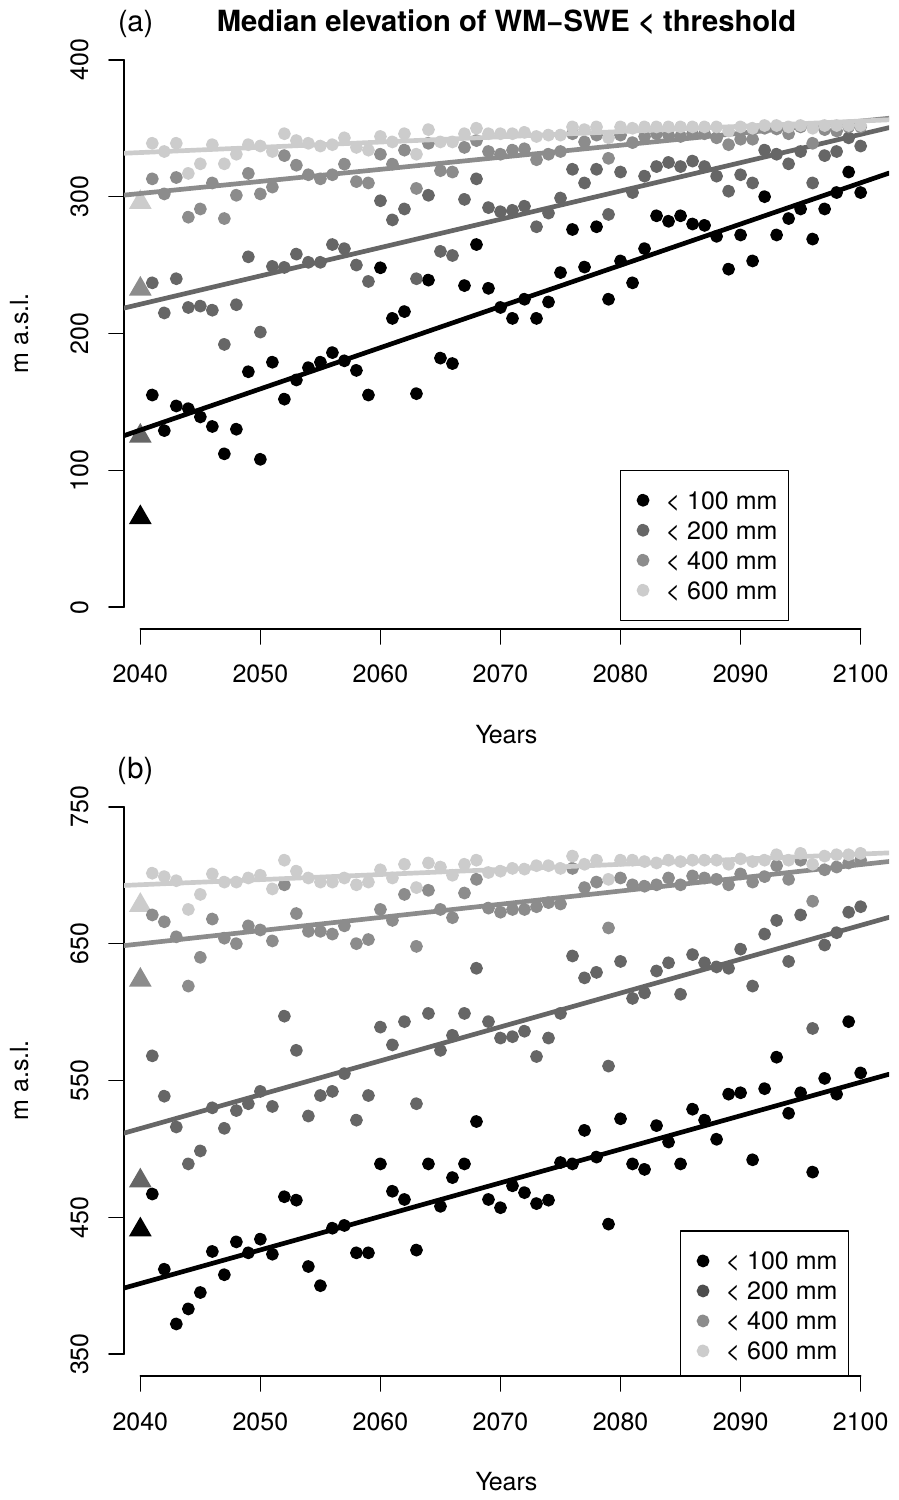
Figure 7Projected future development in median elevation where winter maximum SWE is below 100 mm (black), 200 mm (dark grey), 400 mm (medium grey) or 600 mm (light grey). (a) Coast and (b) inland (see map in Fig. 1). Mean values for the period 1981–2010 are indicated as triangles.
In focus area 1 we compute a 17 % increase in WM-SWE (Table 2), with significantly higher values (30 %) in the high-elevation band and lower values (4 %) in the low-elevation band. This is similar in focus area 2, but with a mean increase of only 10 %. In the future, focus area 1 is expected to have much fewer snow-related challenges, with nearly 70 % (90 %) decrease in the maximum snow amount in the near (far) future. This will reduce maximum snow amounts from about 363 mm in the current climate (1981–2010) to only 36 mm by the end of the century. Focus area 2 shows a decrease of 47 % (70 %) in the near (far) future. While decreases are similar for high and low elevations in focus area 1, a decrease of 85 % is expected in low elevations of focus area 2 towards the end of the century, versus only 57 % in high elevations.
4.2 Changes in maximum snowfall
The mean, trends and changes in winter maximum fresh snow water equivalent (WM-FSW-1d) for the historical period 1958–2017 are shown in Fig. 8, where FSW is the change in SWE from one day to the next. There are no large areas of significant negative trends in this variable, but decreases of about 10 % in WM-FSW-1d are evident inland and in some coastal areas in the south and the north-west (Fig. 8c). Positive trends, some of them significant, dominate the middle regions and the coastal areas north-east and far south. Increases of 20 %–40 % (Fig. 8c) are seen, except in a small area with even stronger increase in the far north-east.
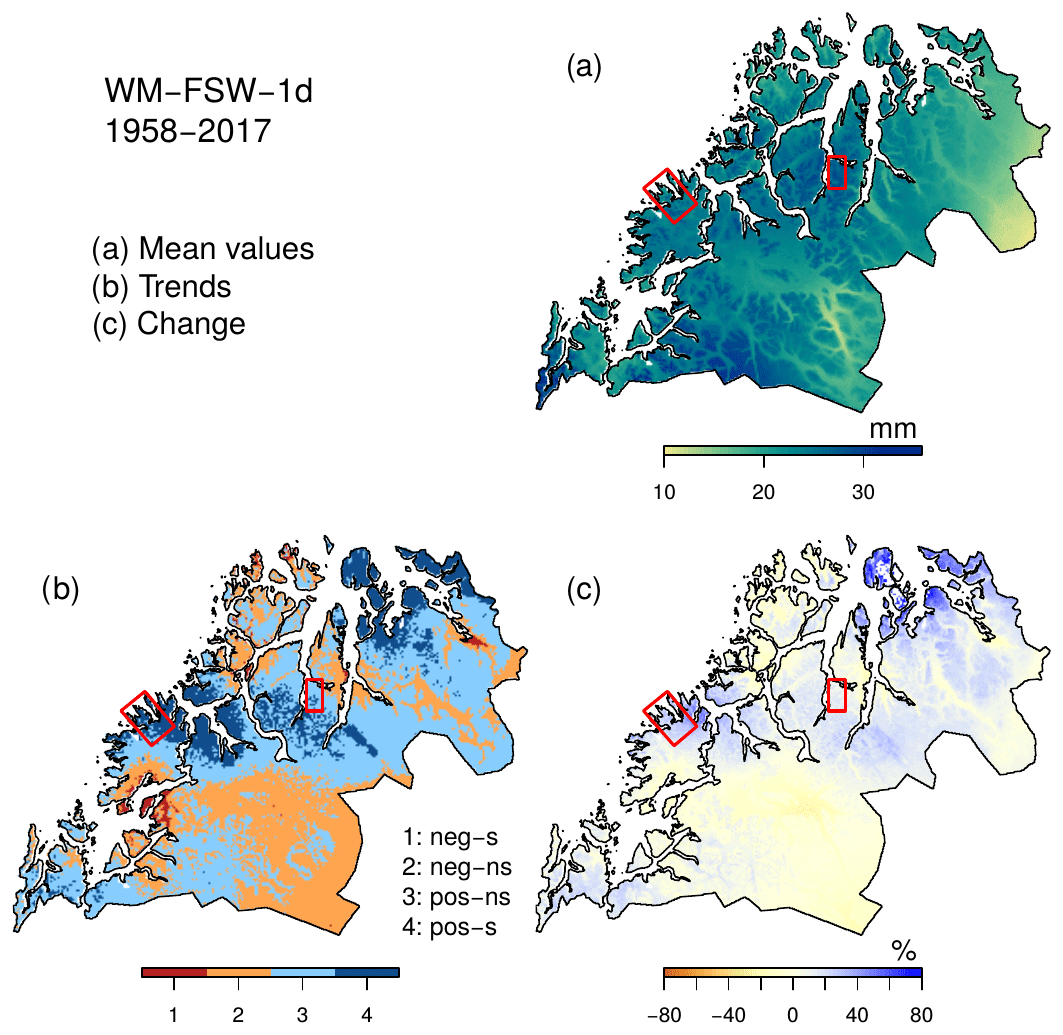
Figure 8Maximum 1 d snowfall during winter (October–April) for the period 1958–2017, based on maximum fresh snow water equivalent for 1 d duration (WM-FSW-1d). Mean values (a), trends (b) and changes are shown in the same way as in Fig. 4.
WM-FSW-1d in the future periods (2041–2070 and 2071–2100) (Fig. 9) is projected to decrease with a similar spatial pattern as WM-SWE, i.e. mostly along the coast and more in the far future compared to the near future. Projected decreases along the coast in the far future range between 30 % and 60 %. By the end of the century focus area 1 can expect a decrease of 57 % for WM-FSW-1d, while study area 2 can expect a smaller decrease of 30 %.
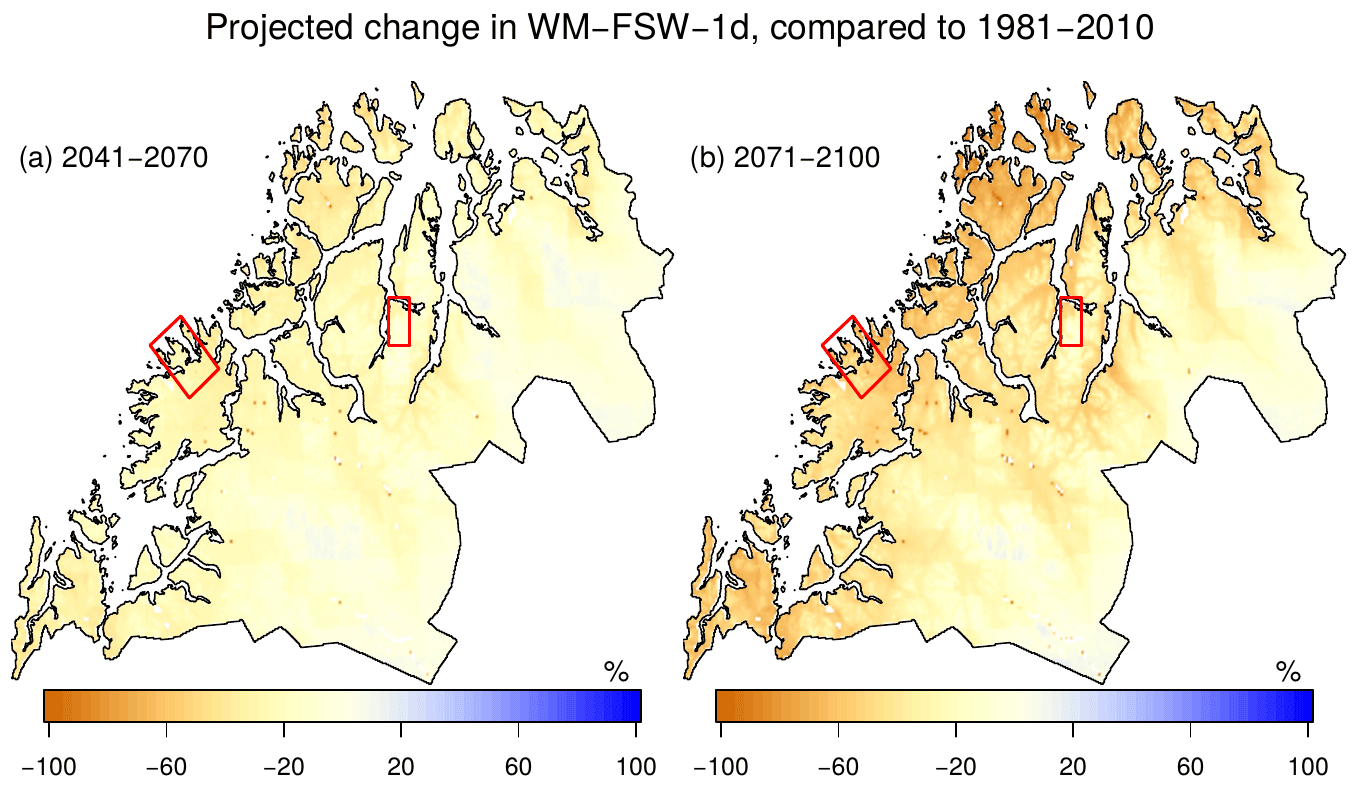
Figure 9Projected change in maximum 1 d snowfall during winter (October–April) between 1981–2010 and (a) the near future (2041–2070) and between 1981–2010 and (b) the far future (2071–2100), based on maximum fresh snow water equivalent for 1 d duration (WM-FSW-1d).
4.3 Changes in heavy snowfall events
The frequency of heavy snowfall events (FSW-1d >5 mm) for the historical period 1958–2017 is presented in Fig. 10, showing a similar spatial distribution of trends as WM-SWE but with smaller areas of significant trends. Mean values for the extended winter season (Fig. 10a) range from about 10 events (far inland) to about 50 events (at some high-elevation areas near the coast). Significant negative trends are found in and around Ringvassøya (Fig. 10b), an island encompassing Tromsø municipality, with decreases of around 20 % from the first 30-year period to the last (Fig. 10c). Southern areas inland and coastal areas in the north-east show significant positive trends, with 30 %–50 % more events in the last period compared to the first.
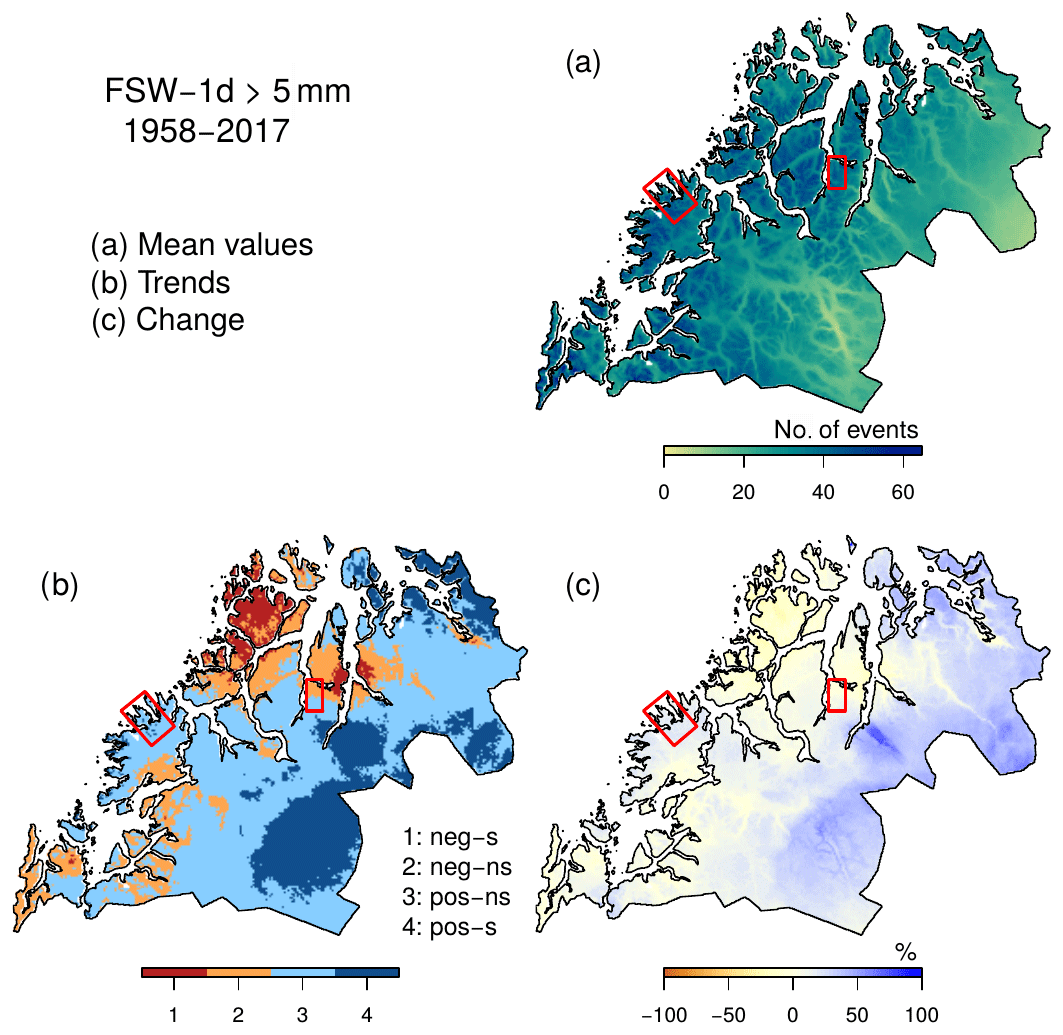
Figure 10Frequency of 1 d snowfall exceeding 5 mm during winter (October–April) for the period 1958–2017, based on fresh snow water equivalent for 1 d duration (FSW-1d >5 mm). Mean values (a), trends (b) and changes are shown in the same way as in Fig. 4.
The frequency of heavy snowfall events is expected to decrease in the whole region in the future (Fig. 11), similar to other snow indices, by up to 60 %–70 % in the near future and up to 100 % in the far future along the coast. This means that in these regions most heavy precipitation events will come as rain instead of snow when approaching the end of the century, as a consequence of milder winters.
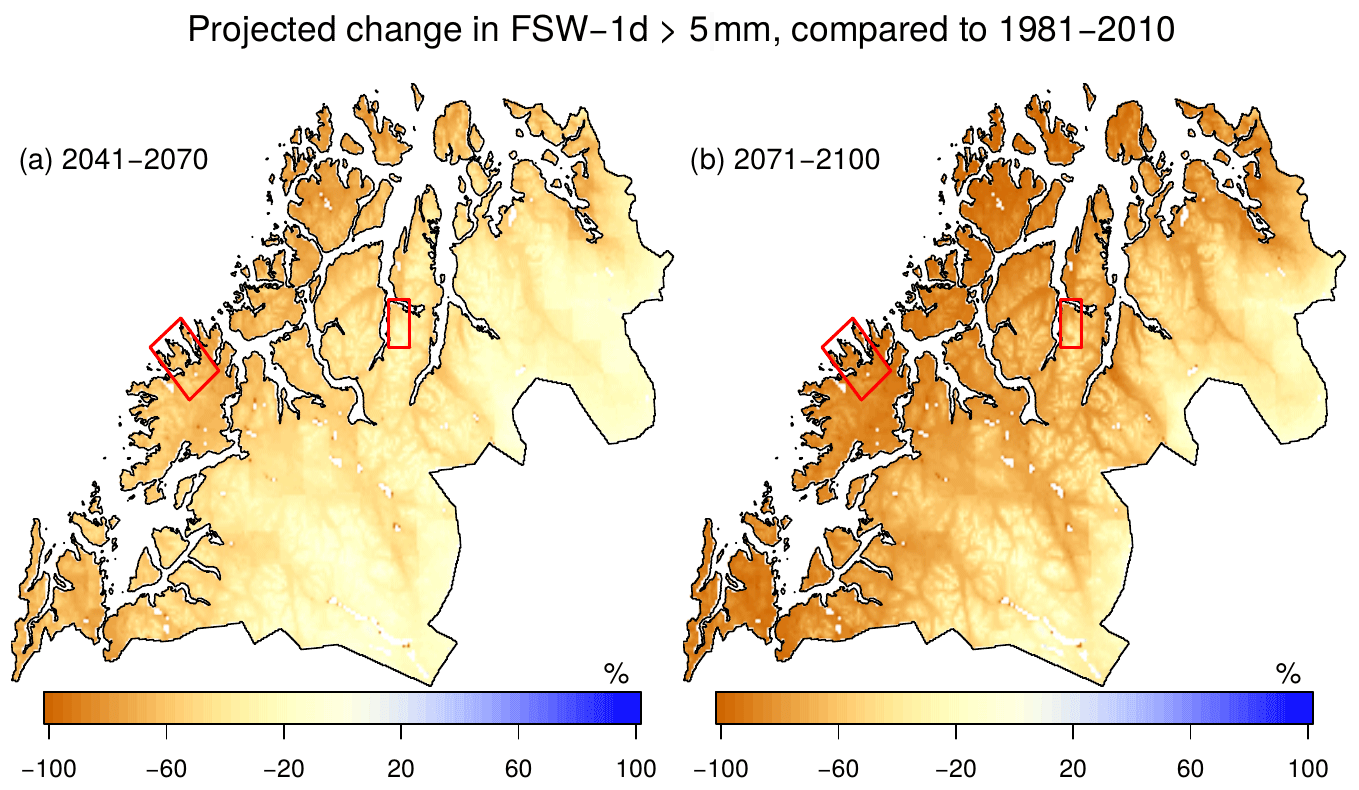
Figure 11Projected change in the frequency of 1 d snowfall exceeding 5 mm during winter (October–April) between 1981–2010 and (a) the near future (2041–2070) and between 1981–2010 and (b) the far future (2071–2100), based on fresh snow water equivalent for 1 d duration (FSW-1d >5 mm).
From Table 2 we find that a 17 % and a 4 % increase in FSW-1d >5 mm has occurred in 1958–2017 in focus area 1 and 2, respectively. However, in both the near future and the far future these events are expected to decrease by up to 89 % in focus area 1 towards the end of the century. Comparing to mean values for the reference period 1981–2100, this means a decrease from 38 to about 4 events on average. A smaller decrease of 64 % towards the end of the century is expected in focus area 2.
4.4 Changes in zero crossings
Figure 12 shows a clear increase in the number of zero crossings in all of Troms during 1958–2017, with large parts being dominated by significant positive trends (Fig. 12b), reflecting increasing temperatures over the period. The frequency of events for the extended winter season (212 d in total) increases westwards, with 10–50 events inland to 70–90 events along the coast and in valley bottoms (Fig. 12a). The percentage increase between the first and the last 30-year period ranges from about 10 % to 40 %, with no obvious spatial pattern (Fig. 12c), apart for a smaller change in valley bottoms.
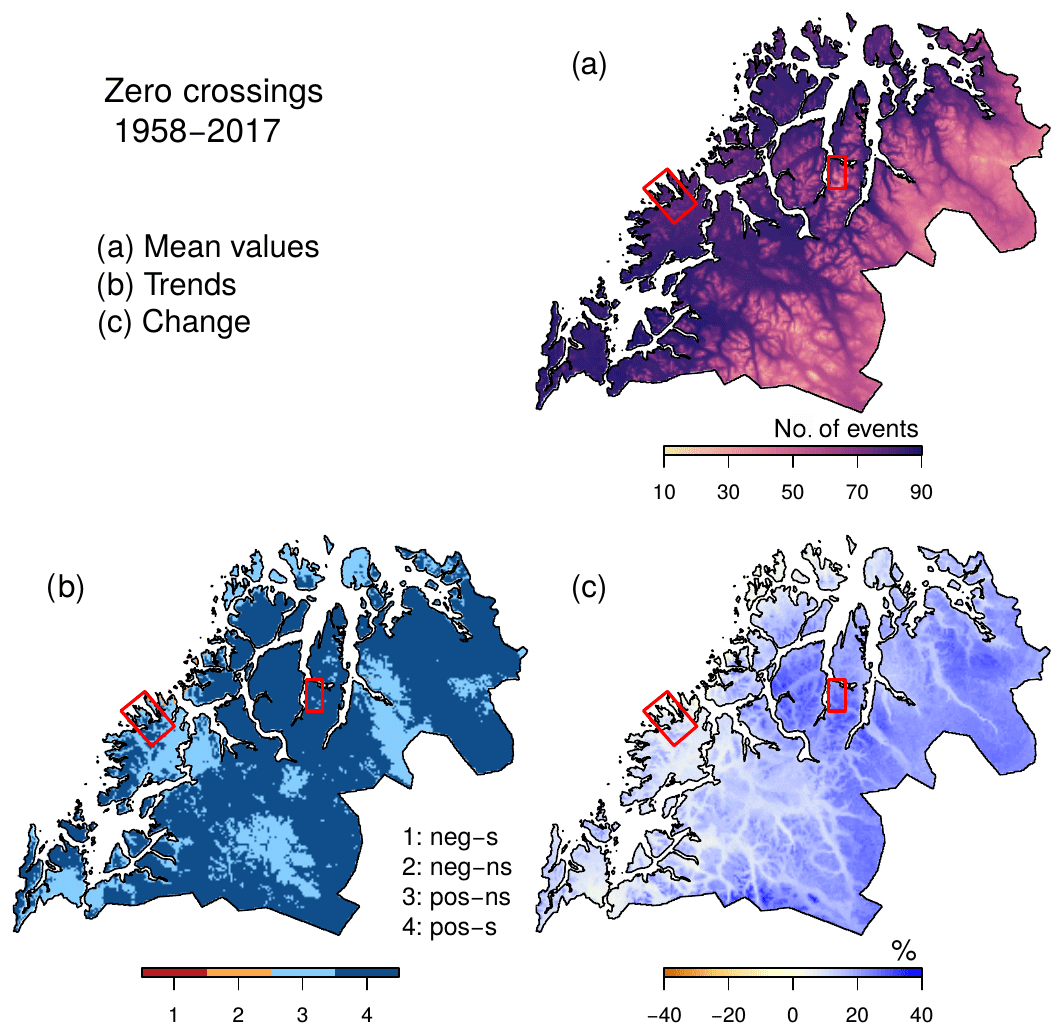
Figure 12Frequency of zero crossings during winter (October–April) for the period 1958–2017, based on minimum and maximum daily temperature. Mean values (a), trends (b) and changes are shown in the same way as in Fig. 4.
Similar to the frequency of zero crossings in the present climate, projected changes in zero crossings for the future periods (2041–2070 and 2071–2100) (Fig. 13) also show an increase in many areas, reflecting that temperatures will rise to the zero-degree threshold for a longer period. However, in the mildest areas along the coast, where mean winter temperatures are already close to zero in the present climate, these crossing events will become less frequent. Both increases and decreases are expected to become stronger towards the end of the century.

Figure 13Projected change in the frequency of zero crossings during winter (October–April) between 1981–2010 and (a) the near future (2041–2070) and between 1981–2010 and (b) the far future (2071–2100), based on minimum and maximum temperature.
In focus area 2, zero crossings have become more frequent, with an increase of 24 % as opposed to only 5 % in focus area 1. However, high elevations of focus area 1 have experienced an increase of 18 %. Zero crossings are expected to decrease in focus area 1 in the far future (−18 %), while an increase of 52 % is expected in focus area 2. Numbers for high and low elevations differ significantly in this area, with almost a doubling of events in higher elevations and a slight decrease in low elevation in the far future. A decrease of 39 % is expected in the lower elevations of focus area 1, meaning that slippery road conditions will become less frequent in these areas during winter.
4.5 Changes in winter rain events
Figure 14 shows changes between the first and the last 30-year period of 1958–2017 for a mean number of days per winter with rainfall exceeding 10 mm. Mean values of winter rain >10 mm range between 0 (far inland) to about 30 events on the southeast coast (Fig. 14a). There has been an increase of such events in the whole of Troms, with significant positive trends in many coastal regions (Fig. 14b).

Figure 14Frequency of rainfall events exceeding 10 mm during winter (October–April) for the period 1958–2017, based on minimum and maximum daily temperature. Mean values (a), trends (b) and changes are shown in the same way as in Fig. 4.
Winter rain events have been rare in Troms in the past, but Fig. 15 shows that the frequency of winter rain >10 mm is projected to increase everywhere in Troms in the near (2041–2070) and far (2071–2100) future. Increases of up to 400 % are expected in some inland regions (Fig. 15b), while coastal regions show increases of up to 100 % towards the end of the century.
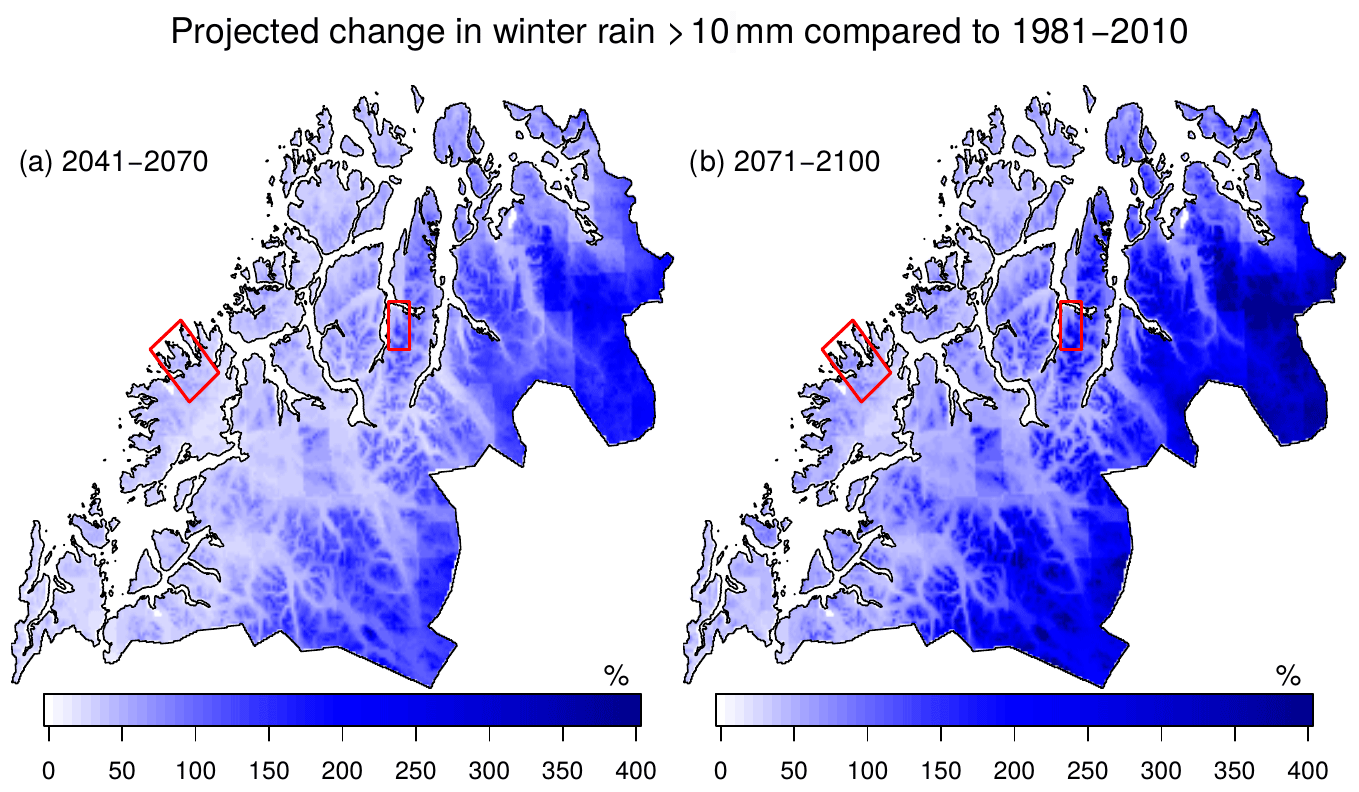
Figure 15Projected change in the frequency of rainfall events exceeding 10 mm during winter (October–April) between 1981–2010 and (a) the near future (2041–2070) and between 1981–2010 and (b) the far future (2071–2100). Note that the legend differs from other figures, going from 0 % to 400 %.
Focus area 1 (2) experiences about 70 % (42 %) more heavy winter rain events today compared to the first 30-year period (Table 2). Approaching the end of the century the largest change is expected in focus area 2, with a 182 % increase in high elevations. However, as focus are 2 on average only had five events of winter rain >10 mm d−1 in the period 1981–2010, an increase of 125 % for the whole region would result in about 11 events by the end of the century.
4.6 Changes in snow drift
For changes in the snow drift factor we only have numbers for the two focus areas as means over selected grid cells particularly exposed to wind. Events of snow drift > p90 have increased by 16 % and 10 % in focus area 1 and 2, respectively. Focus area 2 can expect slightly larger changes in the future compared to focus area 1, with a decrease of 89 % towards the end of the century. With a mean number of strong snow drift events of 21 in the current climate, an average of only about two events each year is expected in 2071–2100.
5.1 Snow
Our analyses of past development point to areas in Troms where snow amounts and heavy snowfall events have increased, thus increasing the potential for dry-snow avalanches. These areas are characterized by relatively low temperatures, typically at high elevations and in some inland regions, and our results correspond well with those of Dyrrdal et al. (2012). Ensemble mean projections of snow conditions in the future period 2040–2100, however, show a decrease in maximum snow amounts and heavy snowfall intensity and frequency in all of Troms, particularly in low-altitude regions, indicating that the transition from increasing to decreasing dry-snow avalanche likelihood takes place before 2040 even in the highest and coldest areas. This is in line with observed changes in the European Alps (Naaim et al., 2016), as well as for predicted changes in the Nordic Arctic region (Hanssen-Bauer et al., 2019).
5.2 Winter rain
Events of winter rain >10 mm occur relatively seldom in the present climate; still, they have already become more frequent in Troms in the last decades. This is in line with findings by Pall et al. (2019), who showed that rain-on-snow events were more frequent during winter months in 1981–2010 compared to 1961–1990. Over the next few decades, our results indicate that heavy winter rain events are likely to increase in all regions, although high percentage increases are partly explained by low relative numbers; thus absolute changes are restrained to 6–7 more events by the end of 2100. A likely explanation of more frequent winter rain events is obviously milder winters, and the amount of water vapour available will likely be higher in a warmer atmosphere (e.g. Ivancic and Shaw, 2016). More rain during winter, along with a likely increase in snowmelt in the next few decades, may point to increased likelihood of wet-snow avalanches and slushflows. However, Hisdal et al. (2017) stated that slushflows will occur earlier in the spring and become less frequent towards the end of this century due to less snow available. In addition, other studies show that an increase in the liquid water content of snow in motion will tend to reduce friction, increasing avalanche run-out distances (Naaim et al., 2013), while conserving high-impact pressures even close to the point of rest (Sovilla et al., 2010) and, thus, having high damage potential (Ballesteros-Cánovas et al., 2018). The contradicting arguments pointed out here underline the complexity of avalanche release and the large uncertainties associated with the future development of such hazards under climate change. In this regard, we would like to urge further studies on expected future avalanche activity covering different avalanche types.
5.3 Zero crossings
Changes in zero crossings indicate shifts in slippery road conditions. Anderson and Chapman (2011) argue that most traffic accidents happen when road temperatures are close to zero degrees. Fewer accidents happen on cold days, partly because drivers adapt to more careful driving and partly because the roads are less slippery when the temperatures are well below zero. Thus, a decrease in zero crossings at low elevations in Troms indicates that slippery road conditions will become less frequent in these areas during winter, but the opposite is expected for inland regions.
We have calculated zero crossings based on air temperature measured at 2 m. While leaving out detailed physics, we believe this proxy sufficiently captures the direction of change for slippery road conditions. There are situations leading to slippery conditions that our proxy does not capture; however, surface data would not necessarily capture those situations either. Hoar frost forms when the road temperature is lower than the dew point temperature and the road temperature is below freezing (NPRA, 2011). The dew point temperature varies locally and on short temporal time scales and is thus difficult to represent accurately. In addition, road temperature does not exist as gridded fields, and although point observations exist, this is not the case for the future period. A calculation of slipperiness based on these data would probably be highly sensitive to the input data. Although road temperatures and humidity might represent processes on the road better than air temperature, we argue that zero crossings based on available gridded projections of air temperature are more robust than projections of road temperature and humidity. In summary, having a robust index outweighs the disadvantage of using temperature measurements at 2 m.
Trends for the past period showed an increase in zero crossings for all of Troms, in line with Dyrrdal et al. (2012), who detected positive trends in near-zero events in the entire region (1957–2010), although their trends were statistically significant in small regions along the border between Norway and Sweden. Trends are, however, sensitive to the choice of period. This is shown by Kerguillec (2015), who studied zero crossings in Norway using daily thermal data from 20 meteorological stations for the period 1950–2013, including two stations in Troms. For these two stations, the frequency of zero crossings increased during the periods 1970–1979 and 1990–1999 but decreased in the 1980s. Kerguillec (2015) claims that a strong negative NAO (North Atlantic Oscillation) index generally increases zero crossings in seaside regions, particularly those in Troms.
Projections show fewer zero crossings for seaside areas and an increase in zero crossings in inland areas and mountains in the future compared to the present climate. More winter maintenance might therefore be necessary for the inland roads, whereas highways at low elevations may expect fewer slippery conditions in winter.
5.4 Changes in the focus areas
Our two focus areas, Senjahopen and Mefjordvær as well as Jøvik and Olderbakken, have and will experience many of the same changes in climate indices relevant for access disruptions. However, as focus area 1 is more exposed towards the ocean and any incoming weather, we find that changes in snow amount and frequency of snowfall events are larger here compared to focus area 2. In both areas an increase in all studied snow-related variables has occurred in the last decades, more so in higher elevations, while a decrease is expected towards the end of this century and particularly in low elevations. This means a potential for fewer dry-snow-related access disruptions in the future, while wet-snow avalanches and slushflows may increase. In the far future, we have shown that zero crossings and events of winter rain >10 mm are projected to increase, and more so in focus area 2. In areas where there is still a significant amount of snow in 2071–2100, weather described by the studied indices might become a larger threat as potential triggers of snow avalanches and landslides and challenging road conditions. Our findings support to a large degree the Troms climate fact sheet of Hisdal et al. (2017), which stated that slushflows will become an increased threat in Troms in the future, while reduced snow amounts will decrease the risk for dry-snow avalanches in the long run.
We have shown that strong snow drift, computed from snowfall and wind speed, has slightly increased in the two focus areas but that a strong decrease is expected in the future. There is no evidence for large changes in wind activity in our regions, and wind projections are associated with a high degree of uncertainty, a large part of which is related to their positioning of storm tracks (e.g. Zappa et al., 2013). Storm track activity in the Northern Hemisphere is well correlated with NAO and the North Pacific Oscillation (PNA) (e.g. Lee et al., 2012). Positive anomalies of the NAO index are associated with a strengthening of the mid-latitude westerly flow over the North Atlantic, which manifests itself as an intensification and poleward deflection of the North Atlantic mid-latitudinal storm track (e.g. Sorteberg et al., 2013). Thus, an increase in the winter NAO index, as suggested by Gillett et al. (2013), might result in more frequent storms at our latitudes. However, an obvious reason for fewer strong snow drift events is the lack of snow when approaching 2100, as discussed above.
5.5 Uncertainty
Although observation-based datasets are associated with uncertainty, especially due to relatively sparse measurements in a complex terrain, future projections have a number of uncertainty aspects. As table A1 reveals, the ensemble is somewhat biased towards a few GCMs (particularly EC-Earth) and RCMs (particularly RCA), representing a weakness along with the relatively limited number of simulations. Other sources of uncertainty associated with future climate projections of temperature and precipitation include the emission scenario; natural climate variability; shortcomings in our understanding of the climate system, which results in climate models reproducing certain processes incorrectly; and limited capacity of supercomputers (Hanssen-Bauer et al., 2017). Kotlarski et al. (2014) report that for instance the RCA model seems to have a cool and wet bias over the Scandinavian region during the winter (DJF) season, meaning that future projections in the current study could be biased towards larger snow amounts. Projections for Norway are bias adjusted (see Sect. 3.1); thus systematic biases are removed. Still, only one method of bias adjustment is used. Further, uncertainties in the hydrological modelling, mostly related to parameterization and the fact that only one hydrological model is used, influence snow parameters.
5.6 Climate adaptation
Seaside communities with access highways exposed to natural hazards, such as focus area 1 and focus area 2, require specific measures for climate adaptation that sustain the safety of local citizens and businesses. According to Kalsnes et al. (2016) there is a lack of technical competence and capacity in several municipalities that, by Norwegian law, are responsible for preventive measures and risk management associated with weather-induced hazards. Literature on weather vulnerabilities and climate adaptation recommends increased public sector coordination (Leiren and Jacobsen, 2018), but the different mandates of responsible public authorities are sometimes incompatible. With a higher likelihood of water and rainfall-induced hazards and more frequent freeze–thaw conditions in certain inland areas, better coordinated climate adaptation, cooperation between different sectors, and guidance and training of local authorities will be crucial.
We have studied past and future changes in winter weather relevant for access disruptions in Troms country, Norway, with a special focus on two vulnerable areas along the coast. A gridded observation-based dataset is used to analyse changes in the present climate (1958–2017), while an ensemble of 10 EURO-CORDEX climate model simulations is used to assess expected future changes for the same indices, towards the end of the 21st century. Our results show that there are large climate gradients in Troms and also in detected changes. In our two focus areas, Senjahopen and Mefjordvær in Berg municipality and Jøvik and Olderbakken in Tromsø municipality, we find that the studied snow indices have become more frequent in the present climate, while they expect to become less frequent in the near and far future, particularly at low elevations where snow cover during winter might become a rarity by 2100. Events of heavy rain during winter are rather infrequent in the present winter climate of Troms, but we show that these events are likely to occur much more often in all regions in the future. Although the likelihood of dry-snow-related access disruptions might decrease, wet-snow avalanches and slushflows may become more frequent in a warmer and wetter climate. However, there are contradicting arguments associated with the development of snow avalanches in a changing climate due to the complexity of avalanche release. We find more zero crossings in most parts of Troms during the last few decades, and this trend is expected to continue for inland regions and high elevations in the future, while coastal and low-lying regions can expect fewer zero crossings. Strong snow drift, as a combination of snowfall and wind speed, has slightly increased in the two focus areas, but a strong decrease is expected in the future due to less snow.
In a changing climate it is particularly important to identify areas of increased vulnerability and risk of weather-induced hazards. The higher likelihood of water and rainfall-induced hazards and more frequent freeze–thaw conditions calls for careful coordination of climate adaptation. At the same time, research into the complex relationship between weather and different types of hazards, especially wet-snow avalanches and slushflows, is needed. As we, in the current study, have focused on only a few selected climate indices, future studies might include other relevant indices. We note that reported avalanche activity has become more detailed during the last years, and new avalanche monitoring stations are in operation closer to typical run-out zones. This will provide new insight into triggering weather conditions, which can be used to study the links between weather and avalanche release.
Table A1GCM–RCM combinations in the EURO-CORDEX ensemble, where the first column indicates the name of the GCM and the first row indicates the name of the RCM.
Gridded observation-based data, described in Sect. 3.1, are available upon request to the Norwegian Meteorological Institute or the corresponding author. Future projections downscaled to a 1 km×1 km grid over Norway, as described in Sect. 3.2, are available for download at https://nedlasting.nve.no/klimadata/kss (NCCS, 2020).
AVD designed the experiments in close collaboration with KI and carried out most of the analyses. IBN provided data and code for analysing zero crossings. JKSJ supervised the process and provided the social scientific perspectives. AVD prepared the manuscript with contributions from all authors.
The authors declare that they have no conflict of interest.
This study was funded by the Research Council of Norway through the Climate Research Programme KLIMAFORSK (ACHILLES, project no. 235574). ACHILLES is a part of CIENS (Oslo Centre for Interdisciplinary Environmental and Social Research), a strategic research collaboration of seven independent research institutes and the University of Oslo.
We thank Graziella Devoli for analysing casualties in the mass movement database, as well as Jess Andersen and Tuomo Saloranta for providing gridded snow data.
This research has been supported by the Research council of Norway (ACHILLES, project no. 235574).
This paper was edited by Paolo Tarolli and reviewed by Markus Eckerstorfer and Frank Techel.
AMAP: Snow, Water, Ice and Permafrost in the Arctic (SWIPA) (2017), Arctic Monitoring and Assessment Programme (AMAP), Oslo, Norway, xiv + 269 pp., 2017.
Anderson, A. and Chapman, L.: The use of a temporal analogue to predict future traffic accidents and winter road conditions in Sweden, Meteorol. Appl., 18, 125–136, https://doi.org/10.1002/met.186, 2011.
Arvidsson, A. K., Blomqvist, G., and Öberg, G.: The impact of climate change on the use of anti- and de-icing salt in Sweden, in: Transportation Research Circular: Winter Maintenance and Surface Transportation Weather, available at: http://onlinepubs.trb.org/onlinepubs/circulars/ec162.pdf (last access: 24 June 2020), 2012.
Ballesteros-Cánovas, J. A., Trappmann, D., Madrigal-González, J., Eckert, N., and Stoffel, M.: Climate warming enhances snow avalanche risk in the Western Himalayas, P. Natl. Acad. Sci. USA, 115, 3410–3415, https://doi.org/10.1073/pnas.1716913115, 2018.
Bengtsson, L., Hodges, K. I., and Roeckner, E.: Storm tracks and climate change, J. Climate, 19, 3518–3543, 2006.
Bergström, S.: The development of a snow routine for theHBV-2 model, Nordic Hydrol., 2, 73–92, 1975.
Bremnes, J. B.: Probabilistic wind power forecasts using local quantile regression, Wind Energy, 7, 47–54, https://doi.org/10.1002/we.107, 2004.
Cannon, A. J., Sobie, S. R., and Murdock, T. Q.: Bias Correction of GCM Precipitation by Quantile Mapping: How Well Do Methods Preserve Changes in Quantiles and Extremes?, J. Climate, 28, 6938–6959, https://doi.org/10.1175/JCLI-D-14-00754.1, 2015.
Castebrunet, H., Eckert, N., Giraud, G., Durand, Y., and Morin, S.: Projected changes of snow conditions and avalanche activity in a warming climate: the French Alps over the 2020–2050 and 2070–2100 periods, The Cryosphere, 8, 1673–1697, https://doi.org/10.5194/tc-8-1673-2014, 2014.
Cohen, J., Screen, J. A., Furtado, J. C., Barlow, M., Whittleston, D., Coumou, D., Francis, J., Dethloff, K., Entekhabi, D., Overland, J., and Jones, J.: Recent Arctic amplification and extremem mid-latitude weather, Nat. Geosci., 7, 627–637, https://doi.org/10.1038/ngeo2234, 2014.
Davis, R. E. D., Elder, K., Howlett, D., and Bouzaglou, E.: Relating storm and weather factors to dry slab avalanche activity at Alta, Utah, and Mammoth Mountain, California, using classification and regression trees, Cold Reg. Sci. Technol., 30, 79–89, https://doi.org/10.1016/S0165-232X(99)00032-4, 1999.
Dyrrdal, A. V., Isaksen, K., Hygen, H. O., and Meyer, N. K.: Changes in meteorological variables that can trigger natural hazards in Norway, Clim. Res., 55, 153–165, 2012.
Eckerstorfer, M., Malnes, E., and Müller, K.: A complete snow avalanche activity record from a Norwegian forecasting region using Sentinel-1 satellite-radar data, Cold Reg. Sci. Technol., 144, 39–51, https://doi.org/10.1016/j.coldregions.2017.08.004, 2017.
Eckert, N., Keylock, C. J., Castebrunet, H., Lavigne, A., and Naaim, M.: Temporal trends in avalanche activity in the French Alps and subregions: from occurrences and runout altitudes to unsteady return periods, J. Glaciol., 59, 93–114, https://doi.org/10.3189/2013JoG12J091, 2013.
Engeset, R. V., Tveito, O. E., Alfnes, E., Mengistu, Z., Udnæs, H. C., Isaksen, K., and Førland, E. J.: Snow map system for Norway, in: Proc . XXIII Nord Hydrol Conf, 8–12 August 2004, Tallinn, Estonia, NHP Report, 48, 112–121, 2004.
Frauenfelder, R., Solheim, A., Isaksen, K., Romstad, B., Dyrrdal, A. V., Ekseth, K. H. H., Gangstø, R., Harbitz, A., Harbitz, C. B., Haugen, J. E., Hygen, H. O., Haakenstad, H., Jaedicke, C., Jónsson, Á., Klæboe, R., Ludvigsen, J., Meyer, N. M., Rauken, T., Sverdrup-Thygeson, K., and Aaheim, A.: Impacts of Extreme Weather Events on Infrastructure in Norway, Report 20091808-01-R, Norwegian Geotechnical Institute, Oslo, Norway, 2013.
Geiger, R., Aron, R. H., and Todhunter, P.: The Climate Near the Ground, Springer Science and Business Media, Rowman & Littlefield Publishers, 2007.
Gillett, N. P., Graf, H. F., and Osborn, T. J.: Climate Change and the North Atlantic Oscillation, in: The North Atlantic Oscillation: Climatic Significance and Environmental Impact, edited by: Hurrell, J. W., Kushnir, Y., Ottersen, G., and Visbeck, M., https://doi.org/10.1029/134GM09, 2013.
Hanssen-Bauer, I., Førland, E. J., Haddeland, I., Hisdal, H., Lawrence, D., Mayer, S., Nesje, A., Nilsen, J. E. Ø., Sandven, S., Sandø, A. B., Sorteberg, A., and Ådlandsvik, B.: Climate in Norway 2100 – a knowledge base for climate adaptation, Norwegian Centre for Climate Services, Oslo, Report 1/2017, 2017.
Hanssen-Bauer, I., Førland, E. J., Hisdal, H., Mayer, S., Sandø, A. B., and Sorteberg, A.: Climate in Svalbard 2100 – a knowledge base for climate adaptation, Norwegian Centre for Climate Services, Oslo, Report 1/2019, 207 pp., 2019.
Hendrikx, J., Owens, I., Carran, W., and Carran, A.: Avalanche activity in an extreme maritime climate: The application of classification trees for forecasting, Cold Reg. Sci. Technol., 43, 104–116, https://doi.org/10.1016/j.coldregions.2005.05.006, 2005.
Hisdal, H., Vikhamar Schuler, D., Førland, E. J., and Nilsen, I. B.: Klimaprofiler for fylker (Climate fact sheets for counties), NCCS report no. 3/2017, available at: https://cms.met.no/site/2/klimaservicesenteret/rapporter-og-publikasjoner/_attachment/12110?_ts=15ddfbccf32 (last access: 24 June 2020), 2017.
Hock, R., Rasul, G., Adler, C., Cáceres, B., Gruber, S., Hirabayashi, Y., Jackson, M., Kääb, A., Kang, S., Kutuzov, S., Milner, A. I., Molau, U., Morin, S., Orlove, B., and Steltzer, H.: High Mountain Areas, in: IPCC Special Report on the Ocean and Cryosphere in a Changing Climate, edited by: Pörtner, H. O., Roberts, D. C., Masson-Delmotte, V., Zhai, P., Tignor, M., Poloczanska, E., Mintenbeck, K., Alegría, A., Nicolai, M., Okem, A., Petzold, J., Rama, B., Weyer, N. M., in press., 2020.
Holand, I. S. and Rød, J. K.: Kartlegging av infrastruktursårbarhet, in: Mot en Farligere Fremtid? Om Klimaendringer, Sårbarhet og Tilpasning i Norge, edited by: Bye, L. M, Lein, H., and Rød, J. K., Akademika, Trondheim, Norway, 157–174, 2013.
Hovelsrud, G. K., Karlsson, M., and Olsen, J.: Prepared and flexible: Local adaptation strategies for avalanche risk, Cogent Social Sciences, 4, 1460899, https://doi.org/10.1080/23311886.2018.1460899, 2018.
Ivancic, T. J. and Shaw, S. B.: A U.S.-based analysis of the ability of the Clausius-Claperon relationship to explain changes in extreme rainfall with changing temperature, J. Geophys. Res.-Atmos., 121, 3066–3078, https://doi.org/10.1002/2015JD024288, 2016.
Jacob, D., Petersen, J., Eggert, B., Alias, A., Christensen, O. B., Bouwer, L. M., Braun, A., Colette, A., Déqué, M., Georgievski, G., Georgopoulou, E., Gobiet, A., Menut, L., Nikulin, G., Haensler, A., Hempelmann, N., Jones, C., Keuler, K., Kovats, S., Kröner, N., Kotlarski, S., Kriegsmann, A., Martin, E., van Meijgaard, E., Moseley, C., Pfeifer, S., Preuschmann, S., Radermacher, C., Radtke, K., Rechid, D., Rounsevell, M., Samuelsson, P., Somot, S., Soussana, J.-F., Teichmann, C., Valentini, R., Vautard, R., Weber, B., and Yiou, P.: EURO-CORDEX: New high-resolution climate change projections for European impact research, Reg. Environ. Change, 14, 563–578, 2014.
Jacobsen, J. K. S.: Fornemmelser for snø (Sense of snow), Ottar 329 – 2020, 33–34, 2020.
Jacobsen, J. K. S., Leiren, M. D., and Saarinen, J.: Natural hazard experiences and adaptations, Norsk Geogr. Tidsskr., 70, 292–305, https://doi.org/10.1080/00291951.2016.1238847, 2016.
Jaedicke, C., Solheim, A., Blikra, L. H., Stalsberg, K., Sorteberg, A., Aaheim, A., Kronholm, K., Vikhamar-Schuler, D., Isaksen, K., Sletten, K., Kristensen, K., Barstad, I., Melchiorre, C., Høydal, Ø. A., and Mestl, H.: Spatial and temporal variations of Norwegian geohazards in a changing climate, the GeoExtreme Project, Nat. Hazards Earth Syst. Sci., 8, 893–904, https://doi.org/10.5194/nhess-8-893-2008, 2008.
Jaedicke, C., Lied, K., and Kronholm, K.: Integrated database for rapid mass movements in Norway, Nat. Hazards Earth Syst. Sci., 9, 469–479, https://doi.org/10.5194/nhess-9-469-2009, 2009.
Jamieson, B., Bellaire, S., and Sinickas, A.: Climate change and planning for snow avalanches in transportation corridors in western Canada, in: GEO Ottawa 2017, available at: https://schulich.ucalgary.ca/asarc/files/asarc/snowavalanchetrendstransporationcorridors_geoottawa2017_jamiesonetal_1july2017.pdf (last access: 24 June 2020), 2017.
Kalsnes, B., Nadim, F., Hermanns, R., Hygen, H., Petkovic, G., Dolva, B., and Høgvold, D.: Landslide risk management in Norway, edited by: Lacasse, K. H. S. and Picarelli, L., Slope safety preparedness for impact of climate change, CRC Press, Boca Raton, FL, USA, 215–252, 2016.
Kerguillec, R.: Seasonal distribution and variability of atmospheric freeze/thaw cycles in Norway over the last six decades (1950–2013),Boreas, 44, 526–542, https://doi.org/10.1111/bor.12113, 2015.
Kristensen, L. L., Jensen, O. A., Devoli, G., Rustad, B. K., Verhage, A., Viklund, M., and Larsen, J. O.: Terminologi for naturfare (in English: Terminology for natural hazards), NVE, Oslo, NVE report 90/2015, 2015.
Kronholm, K., Vikhamar-Schuler, D., Jaedicke, C., Isaksen, K., Sorteberg, A., and Kristensen, K: Forecasting snow avalanche days from meteorological data using classification trees; Grasdalen, western Norway, Proceedings, International snow science workshop, Telluride, Colorado, 2006.
Kotlarski, S., Keuler, K., Christensen, O. B., Colette, A., Déqué, M., Gobiet, A., Goergen, K., Jacob, D., Lüthi, D., van Meijgaard, E., Nikulin, G., Schär, C., Teichmann, C., Vautard, R., Warrach-Sagi, K., and Wulfmeyer, V.: Regional climate modeling on European scales: a joint standard evaluation of the EURO-CORDEX RCM ensemble, Geosci. Model Dev., 7, 1297–1333, https://doi.org/10.5194/gmd-7-1297-2014, 2014. Lee, S.-S., Lee, J.-Y., Wang, B., Ha, K.-J., Heo, K.-Y., Jin, F.-F., Straus, D., and Shukla, J.: Interdecadal changes in the storm track activity over the North Pacific and North Atlantic, Clim. Dynam., 39, 313–327, https://doi.org/10.1007/s00382-011-1188-9, 2012.
Leiren, M. D. and Jacobsen, J. K. S.: Silos as barriers to public sector climate adaptation and preparedness: Insights from road closures in Norway. Local Gov. Stud., 44, 492–511, https://doi.org/10.1080/03003930.2018.1465933, 2018.
Lussana, C., Tveito, O.-E., and Uboldi, F.: Three-dimensional spatial interpolation of two-meter temperature over Norway: Temperature spatial interpolation over Norway, Q. J. Roy. Meteor. Soc., 144, 1–18, https://doi.org/10.1002/qj.3208, 2018a.
Lussana, C., Saloranta, T., Skaugen, T., Magnusson, J., Tveito, O. E., and Andersen, J.: seNorge2 daily precipitation, an observational gridded dataset over Norway from 1957 to the present day, Earth Syst. Sci. Data, 10, 235–249, https://doi.org/10.5194/essd-10-235-2018, 2018b.
Müller, M., Homleid, M., Ivarsson, K.-I., Kølzow, M.A.Ø., Lindskog, M., Midtbø, K.H., Andrae, U., Aspelien, T., Berggren, L., Bjørge, D., Dahlgren, P., Kristiansen, J., Randriamampianina, R., Ridal, M., and Vignes, O.: AROME-MetCoOp: A Nordic convective-scale operational weather prediction model, Weather Forecast., 32, 609627, https://doi.org/10.1175/WAF-D-16-0099.1, 2017.
Naaim, M., Durand, Y., Eckert N., and Chambon G.: Dense avalanche friction coefficients: Influence of physical properties of snow, J. Glaciol., 59, 771–782, 2013.
Naaim, M., Eckert, N., Giraud, G., Faug, T., Chambon, G., Naaim-Bouvet, F., and Richard, D.: Impact of climate warming on avalanche activity in French Alps and increase of proportion of wet snow avalanches, La Houille Blanche, 6, 12–20, https://doi.org/10.1051/lhb/2016055, 2016.
Norwegian Centre for Climate Services (NCCS): Climate projection downloading tool, available at: https://nedlasting.nve.no/klimadata/kss, last access: 15 January 2020 (in Norwegian).
Norwegian Geotechnical Institute (NGI): Impacts of extreme weather events on infrastructure in Norway (InfraRisk) – Final report to NFR-prosjekt 200689, edited by: Frauenfelder, R., Solheim, A., Isaksen, K., Romstad, B., Dyrrdal, A. V., Gangstø, R., Harbitz, A., Harbitz, C. B., Haugen, J. E., Hygen, H. O., Haakenstad, H., Jaedicke, C., Jónsson, Á., Klæboe, R., Ludvigsen, J., Meyer, N. M., Rauken, R., Sverdrup-Thygeson, K., and Aaheim, A., NGI rapport no. 20091808-01-R, Oslo, 94 pp. + Appendix, 2013.
Norwegian Ministry of Climate and Environment: Klimatilpasning i Norge (White paper 33 (2012–2013) on climate adaptation in Norway), Norwegian Ministry of Climate and Environment, Oslo, Norway, available at: https://www.regjeringen.no/contentassets/e5e7872303544ae38bdbdc82aa0446d8/no/pdfs/stm201220130033000dddpdfs.pdf (last access: 24 June 2020), 2013.
NPRA: Lærebok Drift og vedlikehold av veger (in English: Textbook. Maintenance and operations of roads), Norwegian Public Roads Administration (NPRA) Reports, Oslo, 365, 2011.
NPRA: Veger og snøskred (in English: Roads and snow avalanches), Norwegian Public Roads Administration (NPRA) Håndbok V138, Oslo, 2014.
NVE: Sikkerhet mot skred i bratt terreng (in English: Avalanche safety in steep terrain), Veileder no, 8 2014. Norwegian water resources and Energy Directorate (NVE), available at: http://publikasjoner.nve.no/veileder/2014/veileder2014_08.pdf (last access: 24 June 2020), 2014.
Pall, P., Tallaksen, L. M., and Stordal, F.: A climatology of rain-on-snow events for Norway, J. Climate, 32, 6995–7016, https://doi.org/10.1175/JCLI-D-18-0529.1, 2019.
Parding, K. and Benestad, R.: Storm activity and climate change in northern Europe, MET Norway, Oslo, MET report 10/16, 2016.
Polyakov, I. V., Bekryaev, R. V., Alekseev, G. V., Bhatt, U. S., Colony, R. L., Johnson, M. A., Maskshtas, A. P., and Walsh, D.: Variability and Trends of Air Temperature and Pressure in the Maritime Arctic, 1875–2000, J. Climate, 16, 2067–2077, https://doi.org/10.1175/1520-0442(2003)016<2067:VATOAT>2.0.CO;2, 2003.
Pomeroy, J. W. and Gray, D.M.: Snow accumulation, relocation and management, NHRI Science Report No.7, National Hydrology Research Institute, Saskatoon, 1995.
Reistad, M., Breivik, Ø., Haakenstad, H., Aarnes, O. J., Furevik, B. R., and Bidlot, J.-R.: A high-resolution hindcast of wind and waves for the North Sea, the Norwegian Sea, and the Barents Sea, J. Geophys. Res., 116, C05019, https://doi.org/10.1029/2010JC006402, 2011.
Saloranta, T.: New version (v.1.1.1) of the seNorge snow model and snow maps for Norway, NVE report 6-2014, NVE, Oslo, 2014.
Sandersen, F., Bakkehøi, S., Hestnes, E., and Lied, K.: The influence of meteorological factors on the initiation of debris flows, rockfalls, rockslides and rock mass stability, in: Proc 7th Symp. Landslides, Trondheim, Norway, 17–21 June 1996, edited by: Senneset, K., 97–114, 1996.
Schweizer, J., Jamieson, J. B., and Schneebeli, M.: Snow avalanche formation, Rev. Geophys., 41, 1016, https://doi.org/10.1029/2002RG000123, 2003.
Sinickas, A., Jamieson, B., and Maes, M. A.: Snow avalanches in western Canada: investigating change in occurrence rates and implications for risk assessment and mitigation, Struct. Infrastruct. E., 12, 490–498, https://doi.org/10.1080/15732479.2015.1020495, 2016.
Sjømatklyngen Senja: Godstransport i sjømatregion Senja (in English: Freight transportation in Senja seafood region), Sjømatklyngen Senja, Finnsnes, Norway, 2017.
Sorteberg, A., Kvamstø, N. G., and Byrkjedal, Ø.: Wintertime Nordic Seas Cyclone Variability and its Impact on Oceanic Volume Transports into the Nordic Seas, in: The Nordic Seas: An Integrated Perspective, AGU Monograph 158, American geophysical union, Washington DC, edited by: Drange, H., Dokken, T., Furevik, T., Gerdes, R., and Berger, W., https://doi.org/10.1029/158GM10, 2013.
Sovilla, B., Kern, M., and Schaer, M.: Slow drag in wet-snow avalanche flow, J. Glaciol., 56, 587–592, 2010.
Teick, M., Marty, C., Gollut, C., Grêt-Regamey, A., and Bebi, P.: Snow and weather conditions associated with avalanche releases in forests: Rare situations with decreasing trends during the last 41 years, Cold Reg. Sci. Technol., 83–84, 77–88, https://doi.org/10.1016/j.coldregions.2012.06.007, 2012.
Tveito, O. E., Udnæs, H. C., Mengistu, Z., Engeset, R., and Førland, E. J.: New snow maps for Norway, in: Proc XXII Nord Hydrol Conf., 4–7 August 2002, Røros, Norway, NHP Report 47, 527–532, 2002.
Vikhamar-Schuler, D., Isaksen, K., Haugen, J. E., Tømmervik, H., Luks, B., Schuler, T., and Bjerke J.: Changes in winter warming events in the Nordic Arctic Region, J. Climate, 29, 6223–6244, https://doi.org/10.1175/JCLI-D-15-0763.1, 2016.
Vincent, L. A. and Mekis, É.: Changes in daily and extreme temperature and precipitation indices for Canada over the twentieth century, Atmos.-Ocean, 44, 177–193, 2006.
Wong, W. K. and Nilsen, I. B.: Bias-adjustment of maximum and minimum temperatures for Norway, NVE, Oslo, NVE report No. 51 – 2019, 2019.
Wong, W. K., Haddeland, I., Lawrence, D., and Beldring, S.: Gridded 1×1 km climate and hydrological projections for Norway, NVE, Oslo, NVE report No. 59 – 2016, 2016.
Yue, S. and Pilon, P.: A comparison of the power of the t test, Mann-Kendall and bootstrap tests for trend detection, Hydrolog. Sci. J., 49, 21–37, 2004.
Zappa, G., Shaffre, L. C., and Hodges, K. I.: The ability of CMIP5 models to simulate North Atlantic extratropical cyclones, J. Climate, 26, 5379–5396, 2013.