the Creative Commons Attribution 4.0 License.
the Creative Commons Attribution 4.0 License.
 | 17 Jan 2020
Multi-coverage optimal location model for emergency medical service (EMS) facilities under various disaster scenarios: a case study of urban fluvial floods in the Minhang district of Shanghai, China
Yuhan Yang
Jie Yin
Mingwu Ye
Dunxian She
Jia Yu
Emergency medical service (EMS) response is extremely critical for pre-hospital lifesaving when disaster events occur. However, disasters increase the difficulty of rescue and may significantly increase the total travel time between dispatch and arrival, thereby increasing the pressure on emergency facilities. Hence, facility location decisions play a crucial role in improving the efficiency of rescue and service capacity. In order to avoid the failure of EMS facilities during disasters and meet the multiple requirements of demand points, we propose a multi-coverage optimal location model for EMS facilities based on the results of disaster impact simulation and prediction. To verify this model, we explicitly simulated the impacts of fluvial flooding events using the 1-D–2-D coupled flood inundation model FloodMap. The simulation results suggested that even low-magnitude fluvial flood events resulted in a decrease in the EMS response area. The integration of the model results with a geographical-information-system (GIS) analysis indicated that the optimization of the EMS locations reduced the delay in emergency responses caused by disasters and significantly increased the number of rescued people and the coverage of demand points.
- Article
(12745 KB) - Full-text XML
- BibTeX
- EndNote


Urban disasters represent a serious and growing challenge. Against the backdrop of urbanization, demographic growth, and climate change, the causes of disasters are changing and their impacts are increasing. Both natural hazards such as flash flooding and human-caused accidents such as fires threaten and induce panic in people and cause casualties and property loss (Kates et al., 2001). In order to deal with emergencies effectively, a large number of emergency service facilities may be called upon simultaneously. The demands being placed upon emergency services often exceed the resources made available by governments (Liu et al., 2017). Furthermore, disasters always require a longer response time than regular incidents due to high traffic flows. A crash on the rescue route may block one or several lanes, resulting in congestion, significant delays of the emergency vehicles, and potential additional casualties (Dulebenets et al., 2019). Therefore, the maintenance of the efficiency and quality of emergency services during disasters is the key to emergency management. A scientific and pragmatic approach to the choice of locations and allocations of emergency service facilities reduces traffic congestion and the risk of secondary incidents during an emergency, which, in turn, reduces transport costs and greatly improves the efficiency of rescue services.
Over the last few decades, research into traditional location theory has resulted in a number of models to determine the optimal location of emergency services; the most commonly used models are the P-center model (Hakimi, 1964), the P-median model (Hakimi, 1965), and the covering model (Brandeau and Chiu, 1989). Among these models, the covering model is the most widely investigated and applied model; the objective of the model is to improve the coverage of facilities within a limited time or distance to meet the service requirements (Ge et al., 2011). The most common covering models are the location set covering model (LSCM; Toregas and ReVelle, 1972) and the maximum covering location problem (MCLP) model (Church and ReVelle, 1974). The focus of the LSCM is to minimize the number of facilities needed to cover all demand points, but it has been shown to lead to an unequal allocation of facilities or a large increase in costs. Due to these limitations, the MCLP model was developed to ensure that existing emergency facilities were used to obtain the maximum coverage of the demand points. Drawing upon the LSCM and MCLP model, a number of researchers have optimized the associated algorithms in terms of facility workload limits (Pirkul and Schilling, 1991), cost (Su et al., 2015), and the level of coverage (Gendreau et al., 1997) to solve various practical problems or achieve rescue objectives. Other types of models are suitable for location decision problems that do not include time or distance restrictions, such as the P-center model and the P-median model, where P refers to the number of facilities that need to be built. The P-center model mainly considers equitable service; it selects P facilities by minimizing the maximum distance between the demand points and the facilities. The P-median model not only takes into account the efficiency of the emergency facilities but also minimizes the sum of the weighted distance between the demand points and the P facilities (Chen and You, 2006).
All of the above models are static in the sense that they do not consider uncertainties in the emergency service process. For example, large-scale emergencies are likely to require high levels of healthcare to the extent that emergency service facilities would need to provide transportation to other facilities that are beyond the immediate area. Furthermore, the limited ambulance resources at any one emergency station would restrict the capacity of the emergency medical service (EMS) when multiple demand points make simultaneous requests. Any further demands placed upon the emergency services would cause them to fail, resulting in potential loss of life. To minimize these fluctuations in an EMS system, approaches have been proposed that involve multi-coverage models (Moeini at al., 2015). In 1981, Daskin and Stern (1981) put forward their hierarchical objective set covering model (HOSC), in which they introduced the concept of “multiple coverage of zones”; the objective was to minimize the number of necessary facilities such that the demand was still met and to maximize the coverage of the demand points. However, HOSC had one major shortcoming: it potentially led to the congestion of emergency vehicles. To solve these problems, Hogan and Revelle (1986) proposed an alternative approach to coverage in their maximal backup coverage models BACOP1 and BACOP2. These models cover each demand point at least once, but the multiple coverage of different demand points with the same coverage level resulted in a waste of vehicles resources (Ge et al., 2011). Considering that there is usually a limited financial budget for the provision of emergency services, it is not feasible to cover all demand points multiple times.
The aforementioned traditional location models ignored the impacts of specific disasters, but we suggest that these impacts must be part of any decision regarding the location of emergency services. Apart from causing casualties, a disaster may also damage emergency facilities; furthermore, damage to buildings and roads will lead to traffic congestion and render emergency rescue more difficult than usual. To avoid these problems, research has been conducted on choosing the location of emergency service facilities in response to large-scale emergencies. Jia et al. (2007) defined the main characteristics of ideal locations of emergency service facilities as “timeliness”, “fairness”, and “resistance to failure”. Chen and You (2006) established a multi-objective decision model for the location of emergency rescue facilities by integrating the MCLP model, the P-median model, and the P-center model. In this integrated model (which focused on large-scale disasters), emergency facilities were allocated using different strategies. Jia et al. (2007) investigated models for EMS facility location in response to disasters and compared three heuristic algorithms (genetic algorithm, location-allocation algorithm, and Lagrange relaxation algorithm) applicable to emergency scenarios and location models.
After taking the results of previous studies into account, here we describe a novel approach for the optimization of EMS efficiency under various disaster scenarios. We propose a multi-coverage optimal location model, whose output depends on the impact of a disaster and the levels of demand made on the EMSs. We use a scenario-based method and geographical-information-system-based (GIS-based) network analysis to quantify the impacts of a disaster on the urban EMS response. The coverage level of the demand points is determined by the population, the EMS calls for help, and other factors that reflect the demand level of the demand points; these factors determine how often the demand point needs to be covered by emergency facilities within a predefined time. The higher the demand coverage level, the more often a demand point needs to be covered by the service area of the emergency facilities in a given time period. The main purpose of our location model is to reduce the probability of delays in the emergency response caused by insufficient emergency facilities and resources. The proposed model represents a point of reference for the planning and location of urban emergency facilities. In the following sections, we provide descriptions of the problems and the design of the optimal location model. We also conduct a case study of urban fluvial floods in the Minhang district of Shanghai, China, to validate this model.
2.1 Problem description
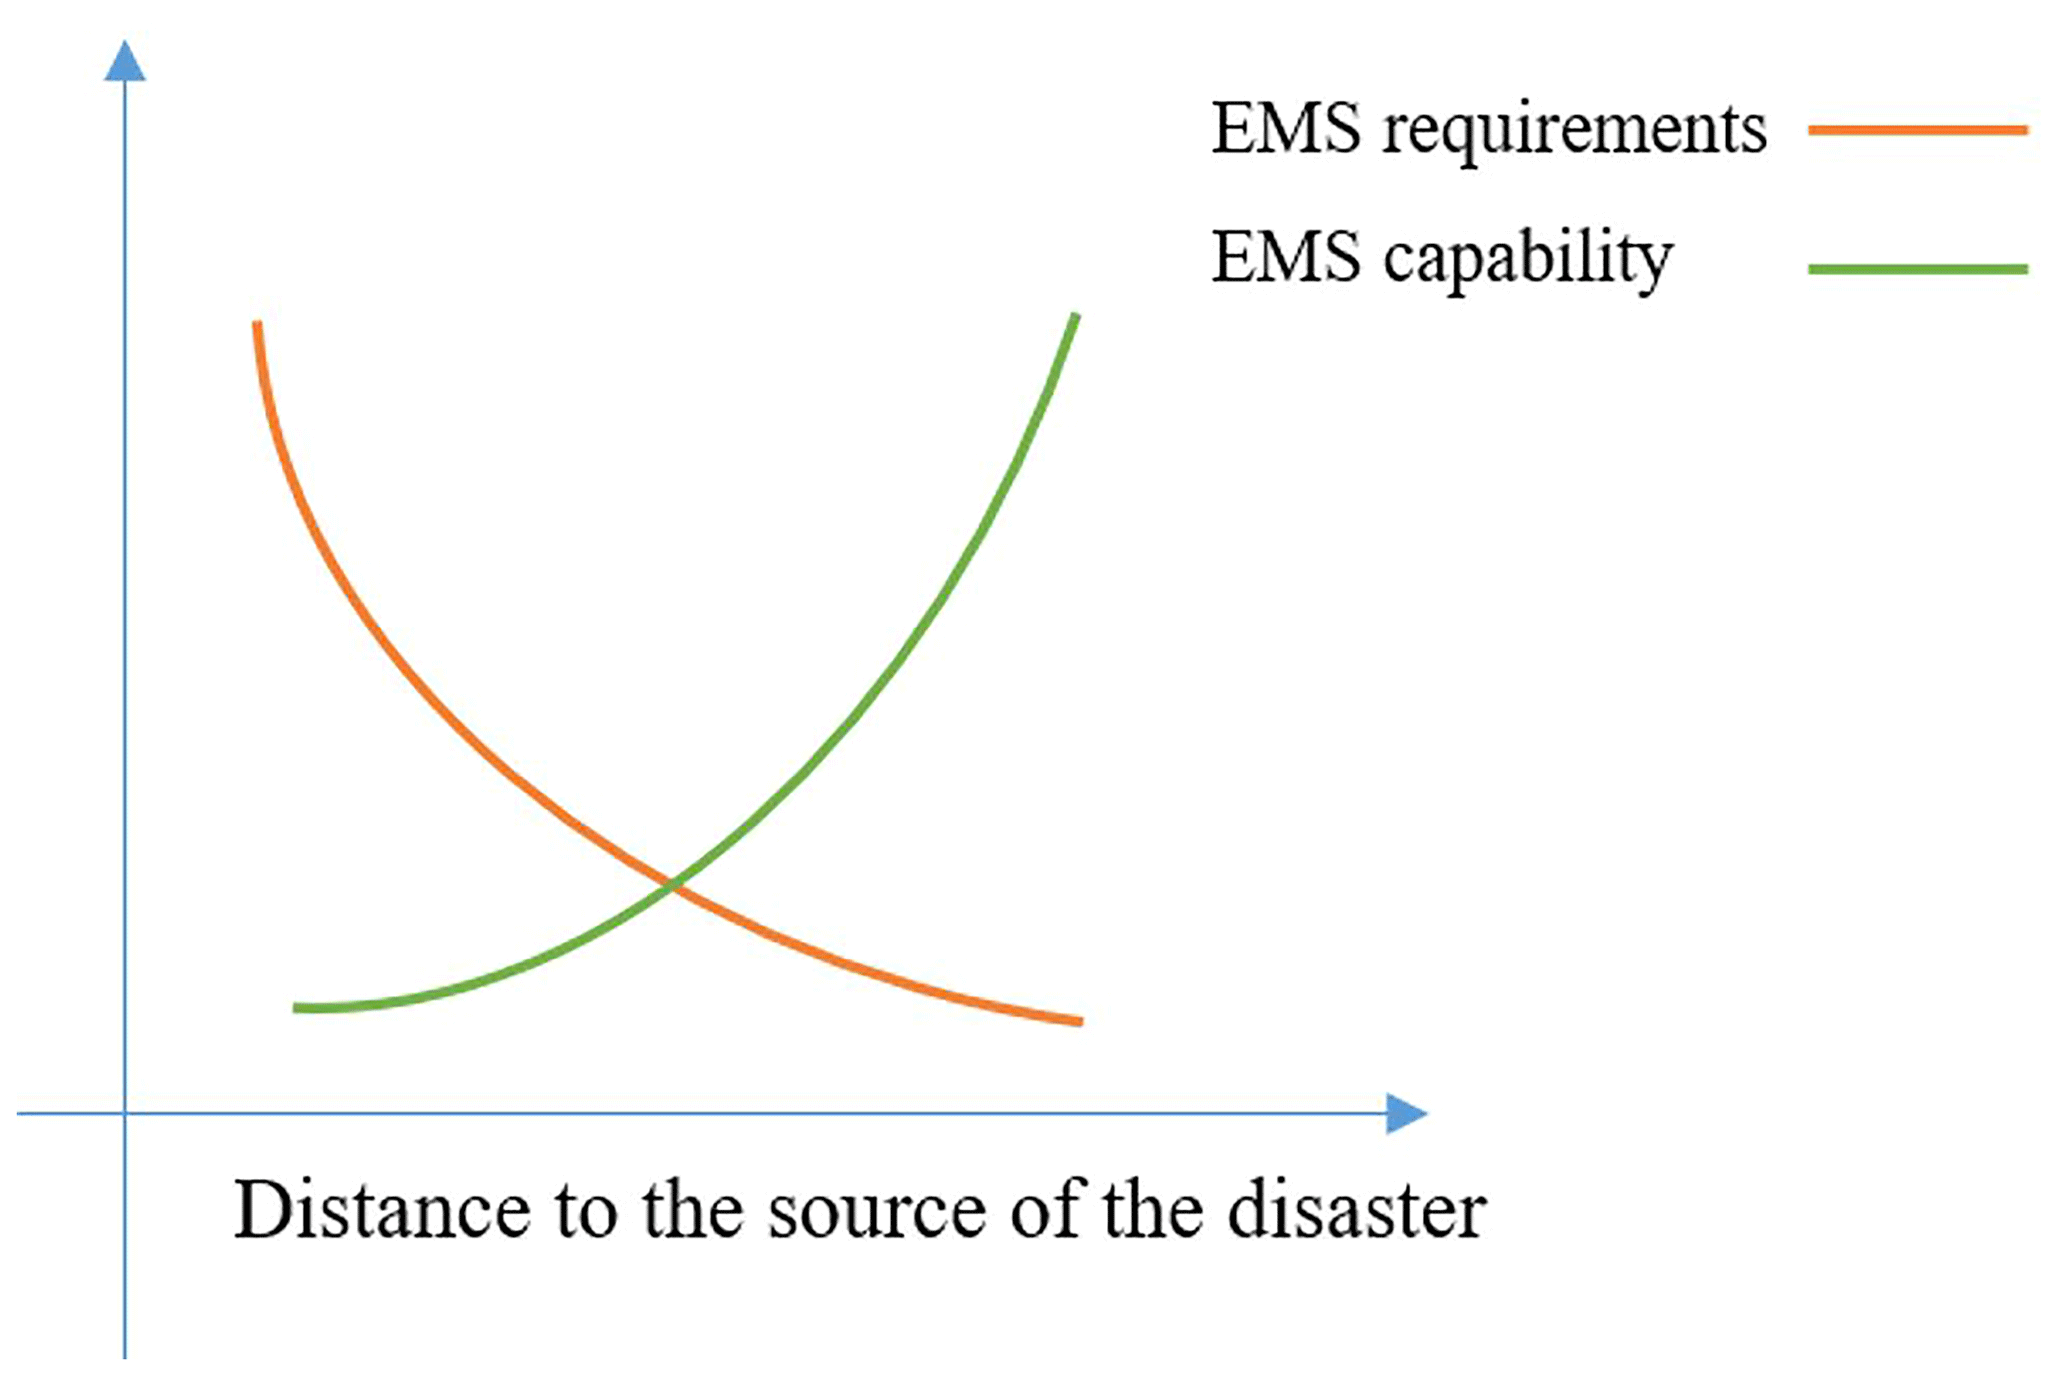
Limited EMS resources face increasing demands as the risk of wide-scale and complex urban disasters increases. Previous models have not considered the probability of failure of EMS facilities, in particular those housing ambulances, nor have they taken into account possible limited access by EMS to vulnerable demand points. Hence, two problems need to be addressed: (1) the need for quick response times suggests that EMSs should be located close to potential disaster points so that a high-risk area can be served simultaneously by many EMSs, and (2) the closer to the potential disaster points, the higher the possibility of EMSs being affected by the disaster, and the lower the service capacity, the greater the distance should be (Fig. 1). Based on these problems, in this study, we propose and formulate a disaster-scenario-based planning and optimal location model that considers the multi-coverage of zones. The coverage is dependent on the demand level of the demand points (high demand with high coverage requires more ambulances at the same time). In our work, we specifically consider flooding; the location plan should result in improvements in the efficiency of the response and reduce the risk to EMS of flash-flood disasters.
We present the objective of the proposed model and describe the problems encountered during the development of the model. The objective of the model is to serve the largest number of people in a region with EMSs. Let J be the set of potential emergency facilities, let I be the set of the demand points in the study area, and let F () be the number of optimal facilities. We consider the risk of a disaster at the potential emergency points and the demand points separately and arrange the station locations according to the coverage level and disaster risk level of each demand point i. In simple terms, the model solves the following problems.
-
Q1. How do we calculate the coverage level Qi at each demand point i?
-
Q2. How do we evaluate the risk of disasters for each potential point j and demand point i?
-
Q3. What are the objectives and constraints for developing an optimized location model based on Q1 and Q2?
-
Q4. How do we evaluate the applicability of the model?
2.2 Assumptions
To solve the above problems and simplify the model, we use the following assumptions.
-
A1. All potential points have the same probability of accepting EMS calls, and their ability to serve all the demand points throughout the study area is not time-limited.
-
A2. During a disaster, each emergency facility has the same service capacity and the same number of ambulances.
-
A3. During a disaster, the closer the EMS is to the source of the disaster, the higher the probability is that the facility will be unable to respond.
-
A4. During a disaster, the closer the EMS is to the source of the disaster, the greater the requirements placed upon it from any demand point.
2.3 Mathematical model
In accordance with the aforementioned description and assumptions, a multi-coverage optimal location model is developed. In the disaster scenario used for the model, it is assumed that each emergency facility has the same number of ambulances and quality of service, and we must maximize the number of people it can serve within the specified time. In order to simplify the model and optimize the algorithm, we use the 0–1 integer programming method.
The model index sets are as follows:
-
I is set of demand points indexed by 1, …, i, …, m}.
-
J is the set of potential emergency medical facilities indexed by 1, …, i, …, n}.
-
tij is the time needed for an ambulance to travel from emergency medical facilities j to demand point i.
-
X is the number of demand points that can be covered by the service area of the emergency facilities within a specified time.
-
T is the limit of the emergency response time.
-
F is number of EMS facilities that need to be built.
-
Qi is the coverage level of demand point i, meaning that point i should be covered by emergency facilities at least Qi times within a specified time.
-
wi is the number of people represented by demand point i.
-
mi is the disaster risk level of demand point i.
-
pj is the resistance level to the disaster of potential point j.
-
xi is binary value, which is equal to 1 if demand point i is covered; otherwise, it is 0.
-
yj is binary value, which is equal to 1 if an emergency medical facility is available; otherwise, it is 0.
-
zij is binary value, which equal to 1 if demand point i is covered by an eligible facility j; otherwise, it is 0.
The overall objective of the model is to rescue the maximum number of people in a specified time (Question Q3), as shown by the following equation:
To keep construction costs under control, the number of emergency facilities should be limited. Emergency facilities cannot be built in areas at risk of inundation, and the coverage rate should be ensured within a specified time. Therefore, the following constraints are added to the multi-objective function:
Equation (2) indicates that F emergency facilities should be selected from the potential facilities for emergency services:
Equation (3) ensures that the multiple coverage requirements of the demand points must be met under different disaster scenarios and the resistance level pj to a disaster of potential point j cannot be 0:
Equation (4) ensures that the emergency response time of each ambulance cannot exceed T minutes:
Equation (5) guarantees that X demand points will be covered within at least T minutes:
Equation (6) means that the service point can be serviced only when this facility is selected:
Equation (7) defines the domains of the decision variables.
2.4 Coverage level analysis
The model design indicates that the proposed model is based on a goal programming algorithm to optimize the location of the EMS facilities based on the existing data and actual situation, the coverage level Qi of each demand point and the disaster risk level of the demand points (mi) and potential facilities (pj). In this section, we propose a new method to estimate the coverage level that depends on the demand level of the demand point i. Under normal conditions, the demand for EMS in one region is mainly related to population attributes such as age distribution and population densities, and areas of high population densities have a high probability of medical emergencies. The surrounding conditions also affect demand, for example, traffic conditions and the presence of regular medical services (such as hospitals). Therefore, in this study, we analyze the demand level based on these related factors (labeled as evaluation indicators (A)) and evaluate the probability of the demand point calling for help within a predefined time. We then calculate the demand level of every point that is affected by these factors considering the results in terms of the coverage level, i.e., how many times point i should be covered by the service area of the emergency facilities. Let A(A={A1, A2, …, An) be the set of indicators that may affect the coverage level. In order to eliminate the influence of dimension and magnitude and improve the accuracy of the model, the range normalization method is used to convert the original data into the range [0, 1]:
where represents the normalized index of the indicator set A.
These indicators determine the coverage level of demand, and they have a certain weight:
where αβ⋯ε represent the weights of thee different indicators, i.e., their relative contributions to the estimated demand. The coverage level Qi is then determined by increasing the integers; the results represent the number of times this point needs to be covered by the emergency facilities.
2.5 Disaster risk level analysis
Events such as floods, earthquakes, and mudslides can adversely affect surrounding buildings and traffic and have serious impacts on EMS. Not only is there is a high probability of casualties in the disaster source area, which creates high demand for EMS, but the disasters may cause road damage and traffic congestion, making rescue more difficult than usual and delaying the emergency response. In order to achieve the model goal, we analyze the disaster risk level of the demand points and potential emergency points and classify the disaster level according to the distance of the emergency services from the source of the disaster. For a disaster risk level mi of demand point i, the closer the point is to the location of the disaster, the higher the risk level and the probability of emergency calls for rescue are. For the disaster risk level of the potential facility j, the closer the facility is to the disaster source, the more serious the impact on the facility is, making its location unsuitable for an emergency facility. We express this indicator of the alternative point as the disaster resistance capacity level pj; therefore, the disaster resistance of the potential facilities increases with their distance from the disaster source.
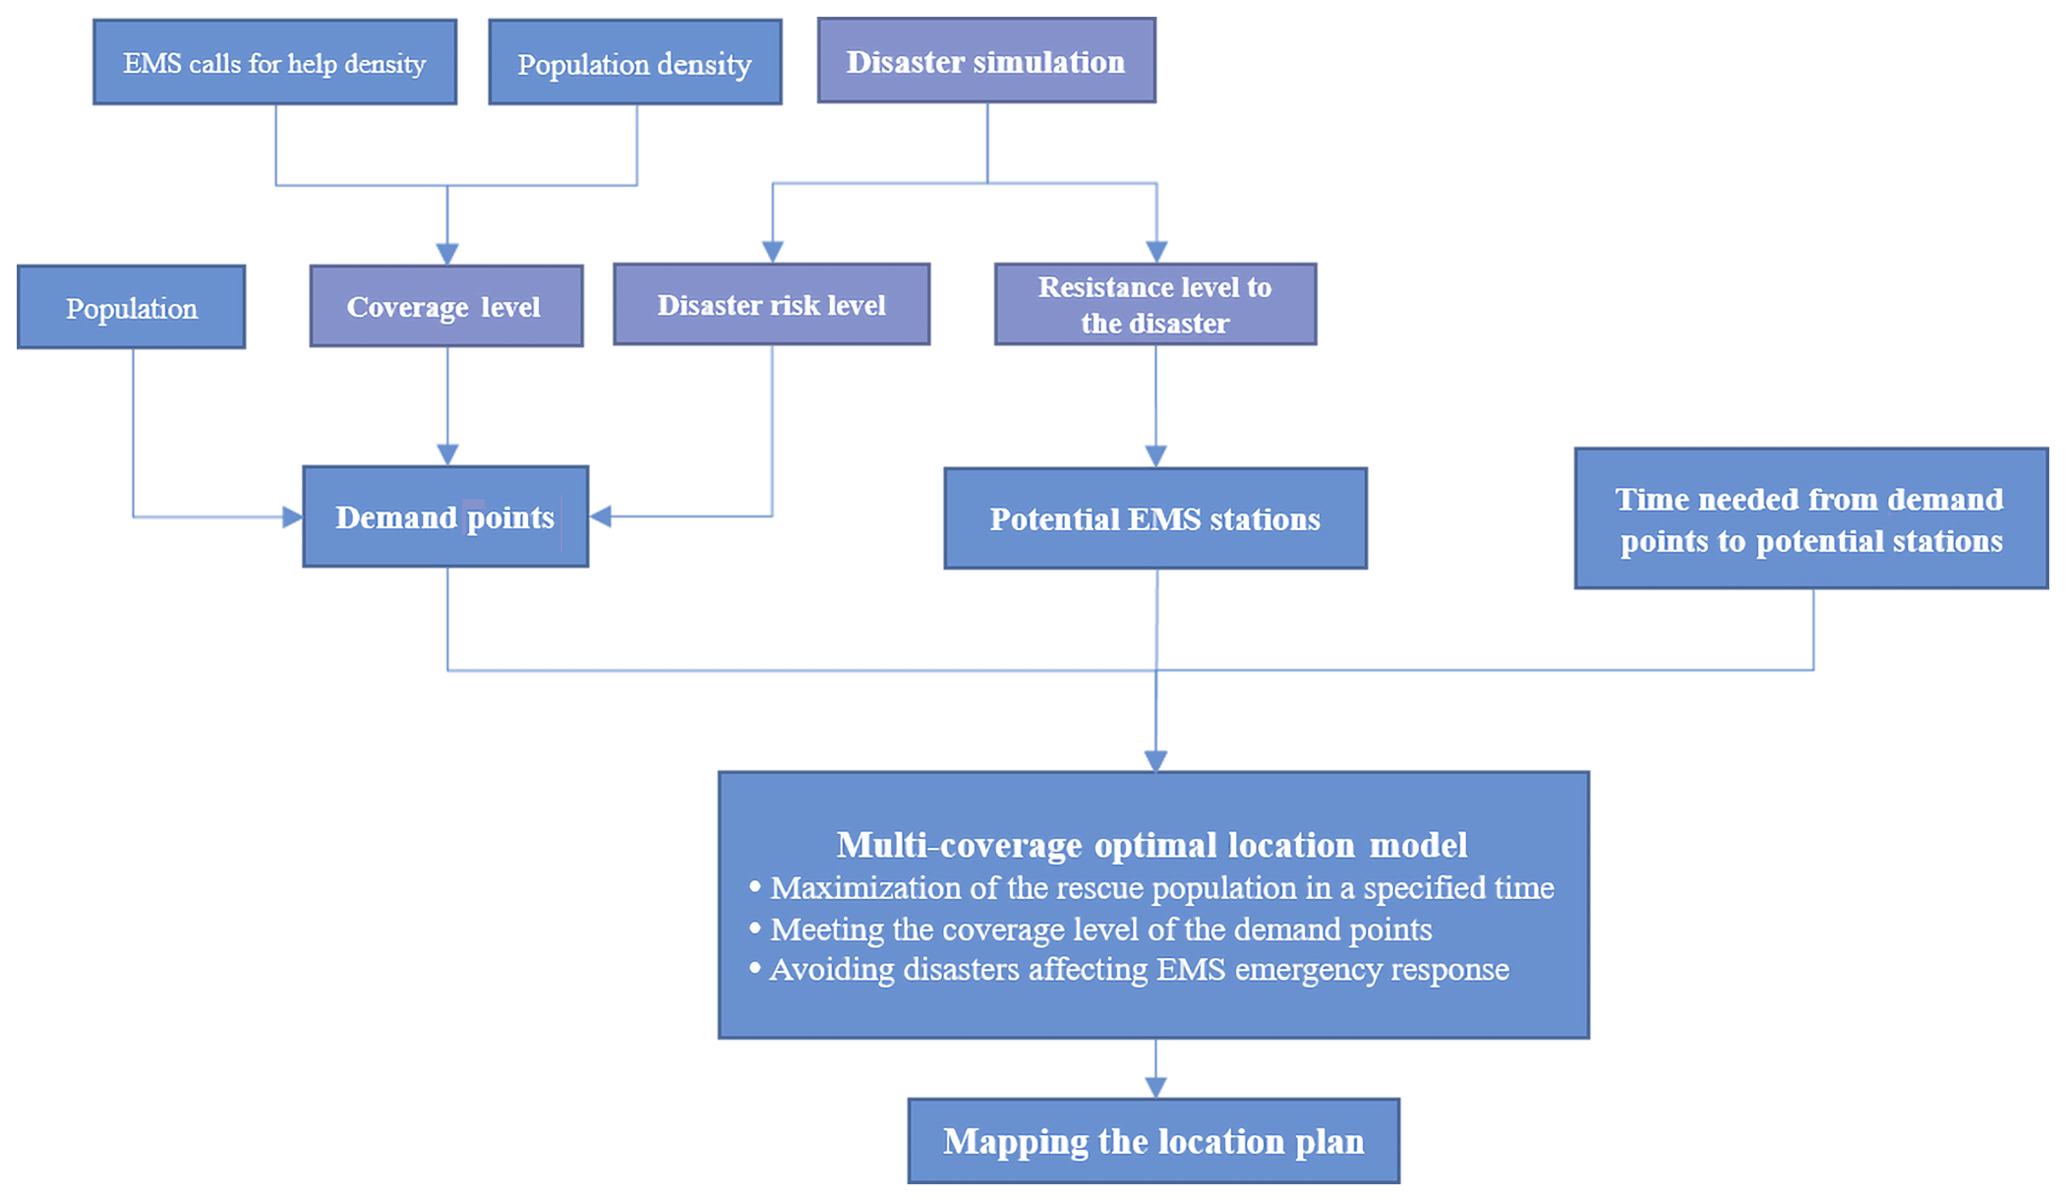
For the case study, we choose Minhang district, Shanghai, China, as the study area and apply the proposed location model to the optimization of the EMS station distribution during the fluvial flooding hazards of Huangpu River based on the data of the Shanghai Emergency Center. The logi-gram related of the methodology is shown in Fig. 2.
3.1 Study area
Minhang district is located in Shanghai in China, covers an area of approximately 372.56 km2, and is located near the Huangpu River. There are nine towns and 514 communities with about 253.4 million residents in the district. The Huangpu River runs through the entire area, and its river network consists of more than 200 rivers, making the study area a high-risk area for fluvial flooding. In recent years, due to sea level rise and urban land subsidence, the risk of storm surges and floods in the area surrounding to Huangpu River has increased (Yin et al., 2013a). Part of the Minhang district is in the center of Shanghai and has a complex road network and dense population; long-term human activities have caused the natural river flow to decrease and the impervious surface areas in the urban areas to increase, making the location highly vulnerable to pluvial floods and fluvial floods. In addition to causing casualties and damaging emergency facilities, flood inundation causes damage to buildings and roads, results in traffic congestion, and complicates emergency rescue by delaying the emergency response. Flooding causes additional disruption to emergency responders in the city because the water may spread quickly and cover large areas (Green et al., 2017). There are currently 12 emergency stations in different blocks of this district, and most stations are located downtown in the densely populated areas (Fig. 3). Statistical data of the 2017 Shanghai Emergency Center indicate that the number of EMS calls in 2017 exceeded 40 000 and the average emergency response time was about 15 min. When large-scale flooding occurs, the emergency response efficiency is greatly affected due to the inundation of the road network. Therefore, we considered a fluvial flood to be a disaster scenario for applying the EMS location model.
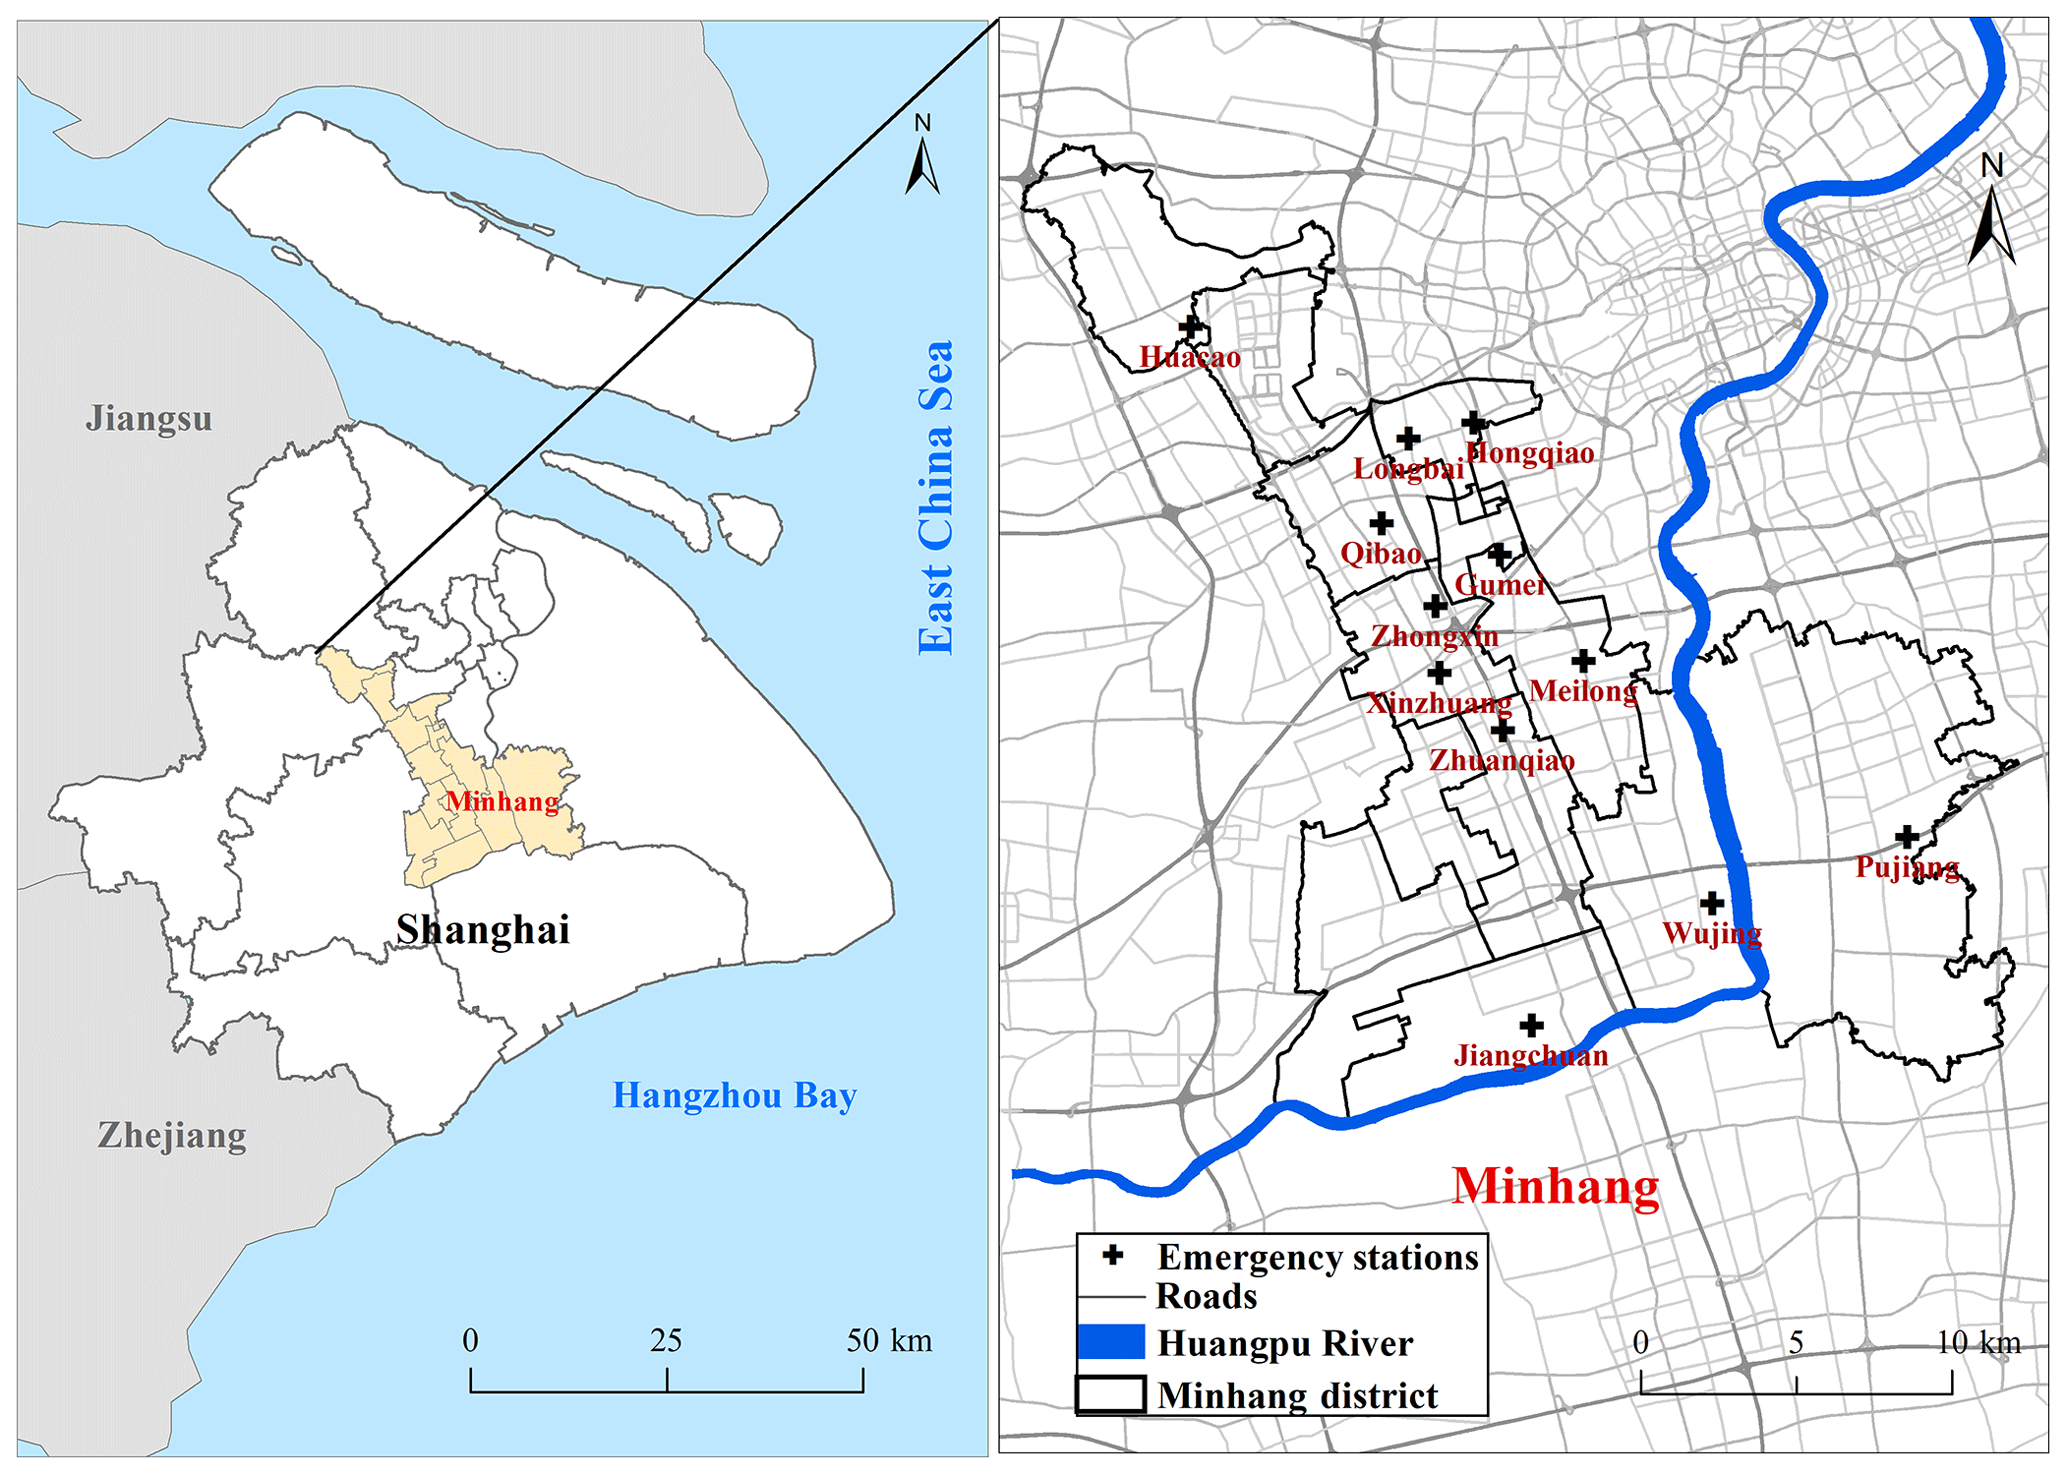
Figure 3Location of the study area.
3.2 Flood impact analysis
In order to assess the inundation area and depth following fluvial flooding disasters in the study area, we used a 1-D–2-D coupled flood inundation model named FloodMap (Yu and Lane, 2006a, b) to simulate the inundation scenarios of fluvial flooding in various return periods; this model combines the 1-D solution of the Saint-Venant equations of river flow with a 2-D flood inundation model based on raster data to solve the inertial form of the 2-D shallow water equations. The model is tightly coupled by considering the mass and momentum exchange between the river flow and floodplain inundation, and it is used to simulate the flood process and extract flood potential maps. FloodMap has been applied in several different environments and is the mainstream numerical simulation model used for flood scenarios (Yin et al., 2013b, 2015). We used the FloodMap model to simulate the inundation area and depth following fluvial flooding for various return periods (100-year and 1000-year periods) in the Huangpu River basin in the 2010s, 2030s, and 2050s (Fig. 4). The research data sources include the Shanghai 2013 Transportation (Gaode) navigation GIS dataset, Shanghai public service facility data, a Shanghai 50 m resolution digital elevation model (DEM), and basic GIS data.

Figure 4Emergency station service areas in the Minhang district under different flood scenario simulations.
After obtaining the flood scenario simulation results, we used various (GIS) tools (e.g., the Spatial Analysis function in combination with the Network Analysis function) to assess the impacts of flooding on the EMS response of the existing emergency stations. We used the Shanghai Gaode GIS road network data and the 2017 EMS calls for help data in the Minhang district obtained from the Shanghai Emergency Center. We used five levels for the road speed limit based on the People's Republic of China Technical Standard of Highway Engineering (JTG B01-2003) (China Construction Standard Highway Committee, 2004). Our assessment includes a network-based spatial analysis method using the road network data to derive areas that can be reached from an EMS station within a certain timeframe. This method is widely used in route planning (e.g., via Google Maps navigation) and considers speed limits, road hierarchy, one-way traffic, and other restrictions in the road networks; this method is used by network analysis function in the ArcGIS 10.2 software (New Service Area). Given that the response time is the usual standard by which the efficiency of emergency rescue is assessed, we divided the service area by using the ambulance travel time. In terms of the response time limit for ambulances, 8 min is usually regarded as the standard for a medical emergency (Pons and Markovchick, 2002). However, the EMS calls and rescue data from the Minhang district in Shanghai in 2017 indicated that the average medical emergency response time was about 15 min, although the goal is to reduce this to 12 min by 2020. We have therefore used response times of 8, 12, and 15 min to divide the EMS service area (Yin et al., 2019). In terms of emergency management, when fluvial flood disasters occur, roads near rivers become inundated, leading to traffic congestion and road closures, which affect ambulance response times. The failure part of the transport infrastructure would have the most significant effects on access to specific locations and the EMS system performance (Albano et al., 2014). Studies have shown that when road inundation reaches a depth of 30 cm, the roads become impassable to vehicles (Yin et al., 2016; Green et al., 2017). We have, therefore, used an inundation depth of 30 cm as the road closure restriction for vehicles; we used the same depth to define the area that cannot be accessed by vehicles (the “barrier area”) in our GIS service area analysis. We used FloodMap to simulate flood scenarios in 2010, 2030, and 2050 for two return periods (100-year and 1000-year periods). We then used the ArcGIS 10.2 network analysis toolbar to simulate the emergency facility service areas for the different scenarios (Fig. 4).
Figure 4 shows that during a 100-year flood, one emergency station (Wujing Station) will lose capacity due to inundation, whereas a 1000-year flood will affect two stations (Wujing Station and Jiangchuan Station), both of which are located near the middle and lower drainage basin of the Huangpu River and serve a large population. If these two stations are incapacitated, it will greatly affect the efficiency of medical emergency rescue in the surrounding areas. Figure 5 shows the impact on the area serviced by each station for the different flood scenarios. The y axis is the ratio of the service area before and after the disaster: the lower the ratio, the greater the decrease in the service area due to fluvial flooding. About half of the stations are affected by the disaster, and their service areas have decreased by more than 10 %. The starting point for our simulations is the distribution of the existing Minhang district emergency stations. We find that the existing EMS distribution is inadequate for any of the flood scenarios used in our model. We, therefore, seek to optimize the location of the emergency stations in conjunction with the flood scenarios to ensure that the emergency service facilities can handle the disasters.
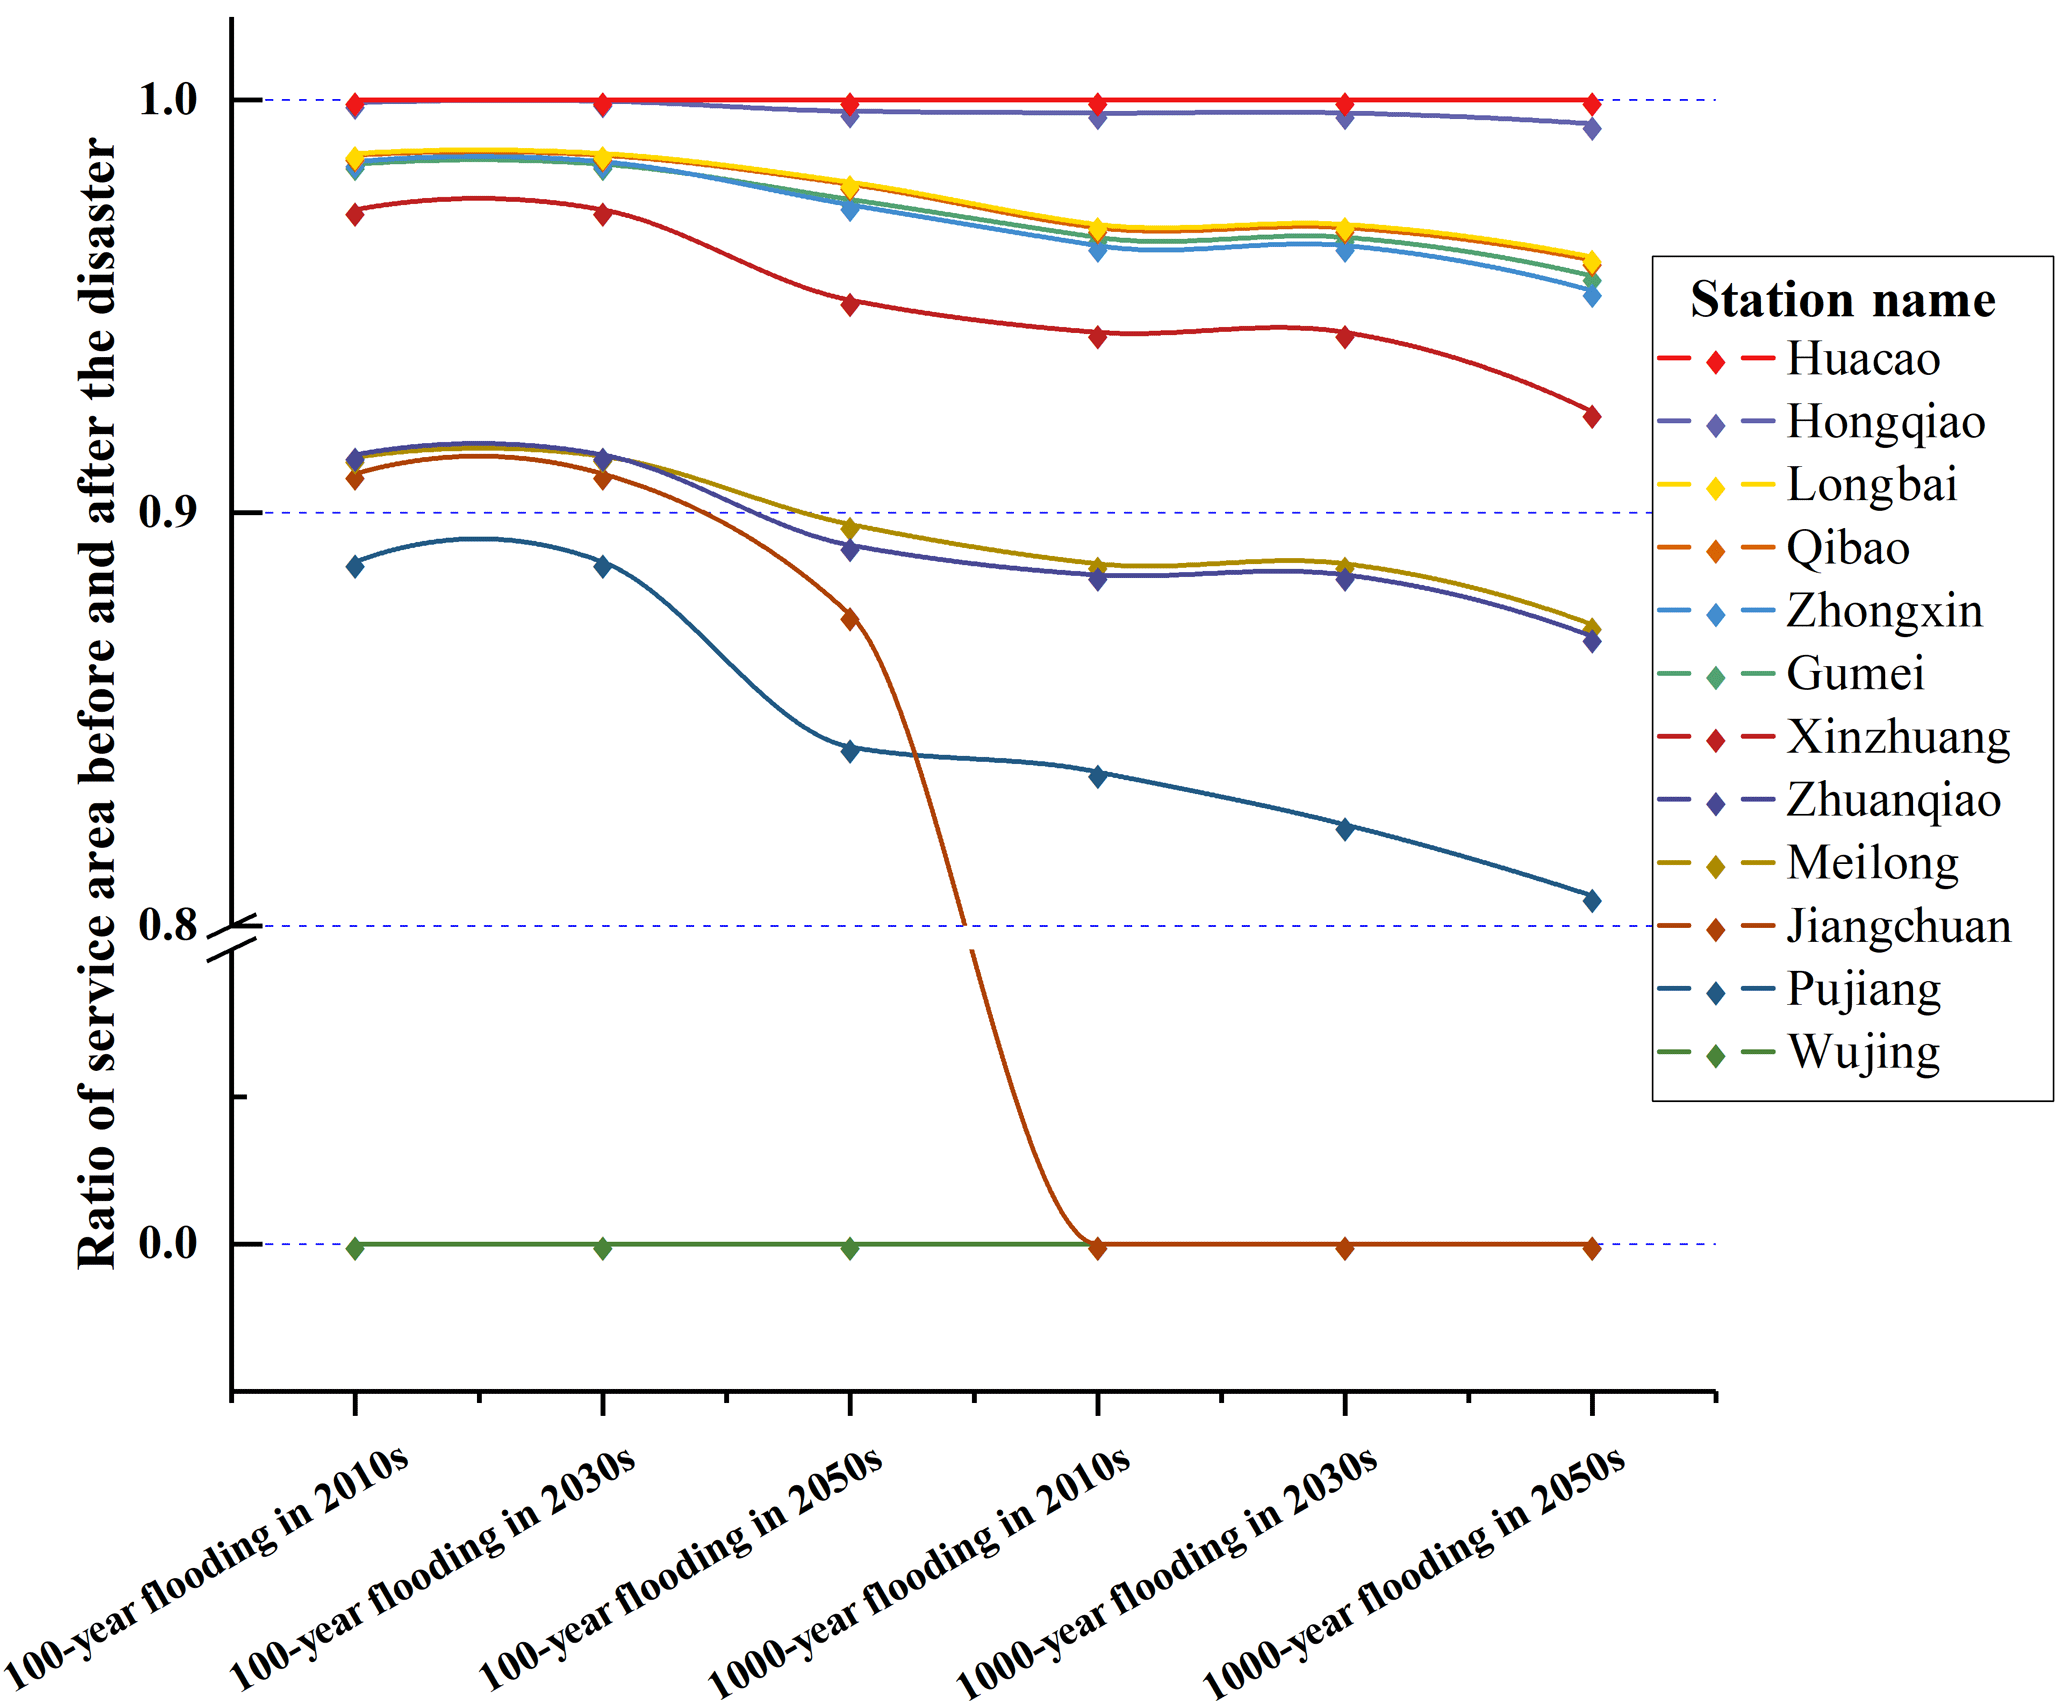
Figure 5Ratio of the service area of emergency stations before and after the disaster under different flood scenarios.
3.3 Model parameter calculation
We calculated the two major model parameters (coverage level and disaster risk level) as proposed in Sect. 2 based on the flooding scenario results described in Sect. 3.2 and used actual data for population, EMS calls for help, etc. We first determined the demand points and number of potential emergency stations by dividing the study area into units of representative blocks or grids. We used data on the location of the communities in the Minhang district to determine the smallest block unit suitable for modeling demand (each community represents a demand unit). We used the ArcGIS 10.2 software Calculate Geometry function to calculate the geometric center of each community demand unit as a model demand point. To determine the location of potential EMS stations, we covered the entire study area. We divided the area into grids of a certain length and assumed that every grid center point was a potential emergency station. Considering the actual conditions in the research area, we divided the area into a grid with a cell size of 2 km × 2 km using the ArcGIS 10.2 fishnet analysis tool (create fishnet). In addition, we added the original 12 emergency stations in the Minhang district to these potential stations for comparison. There were 514 demand points and 106 potential stations in the study area (Fig. 6).
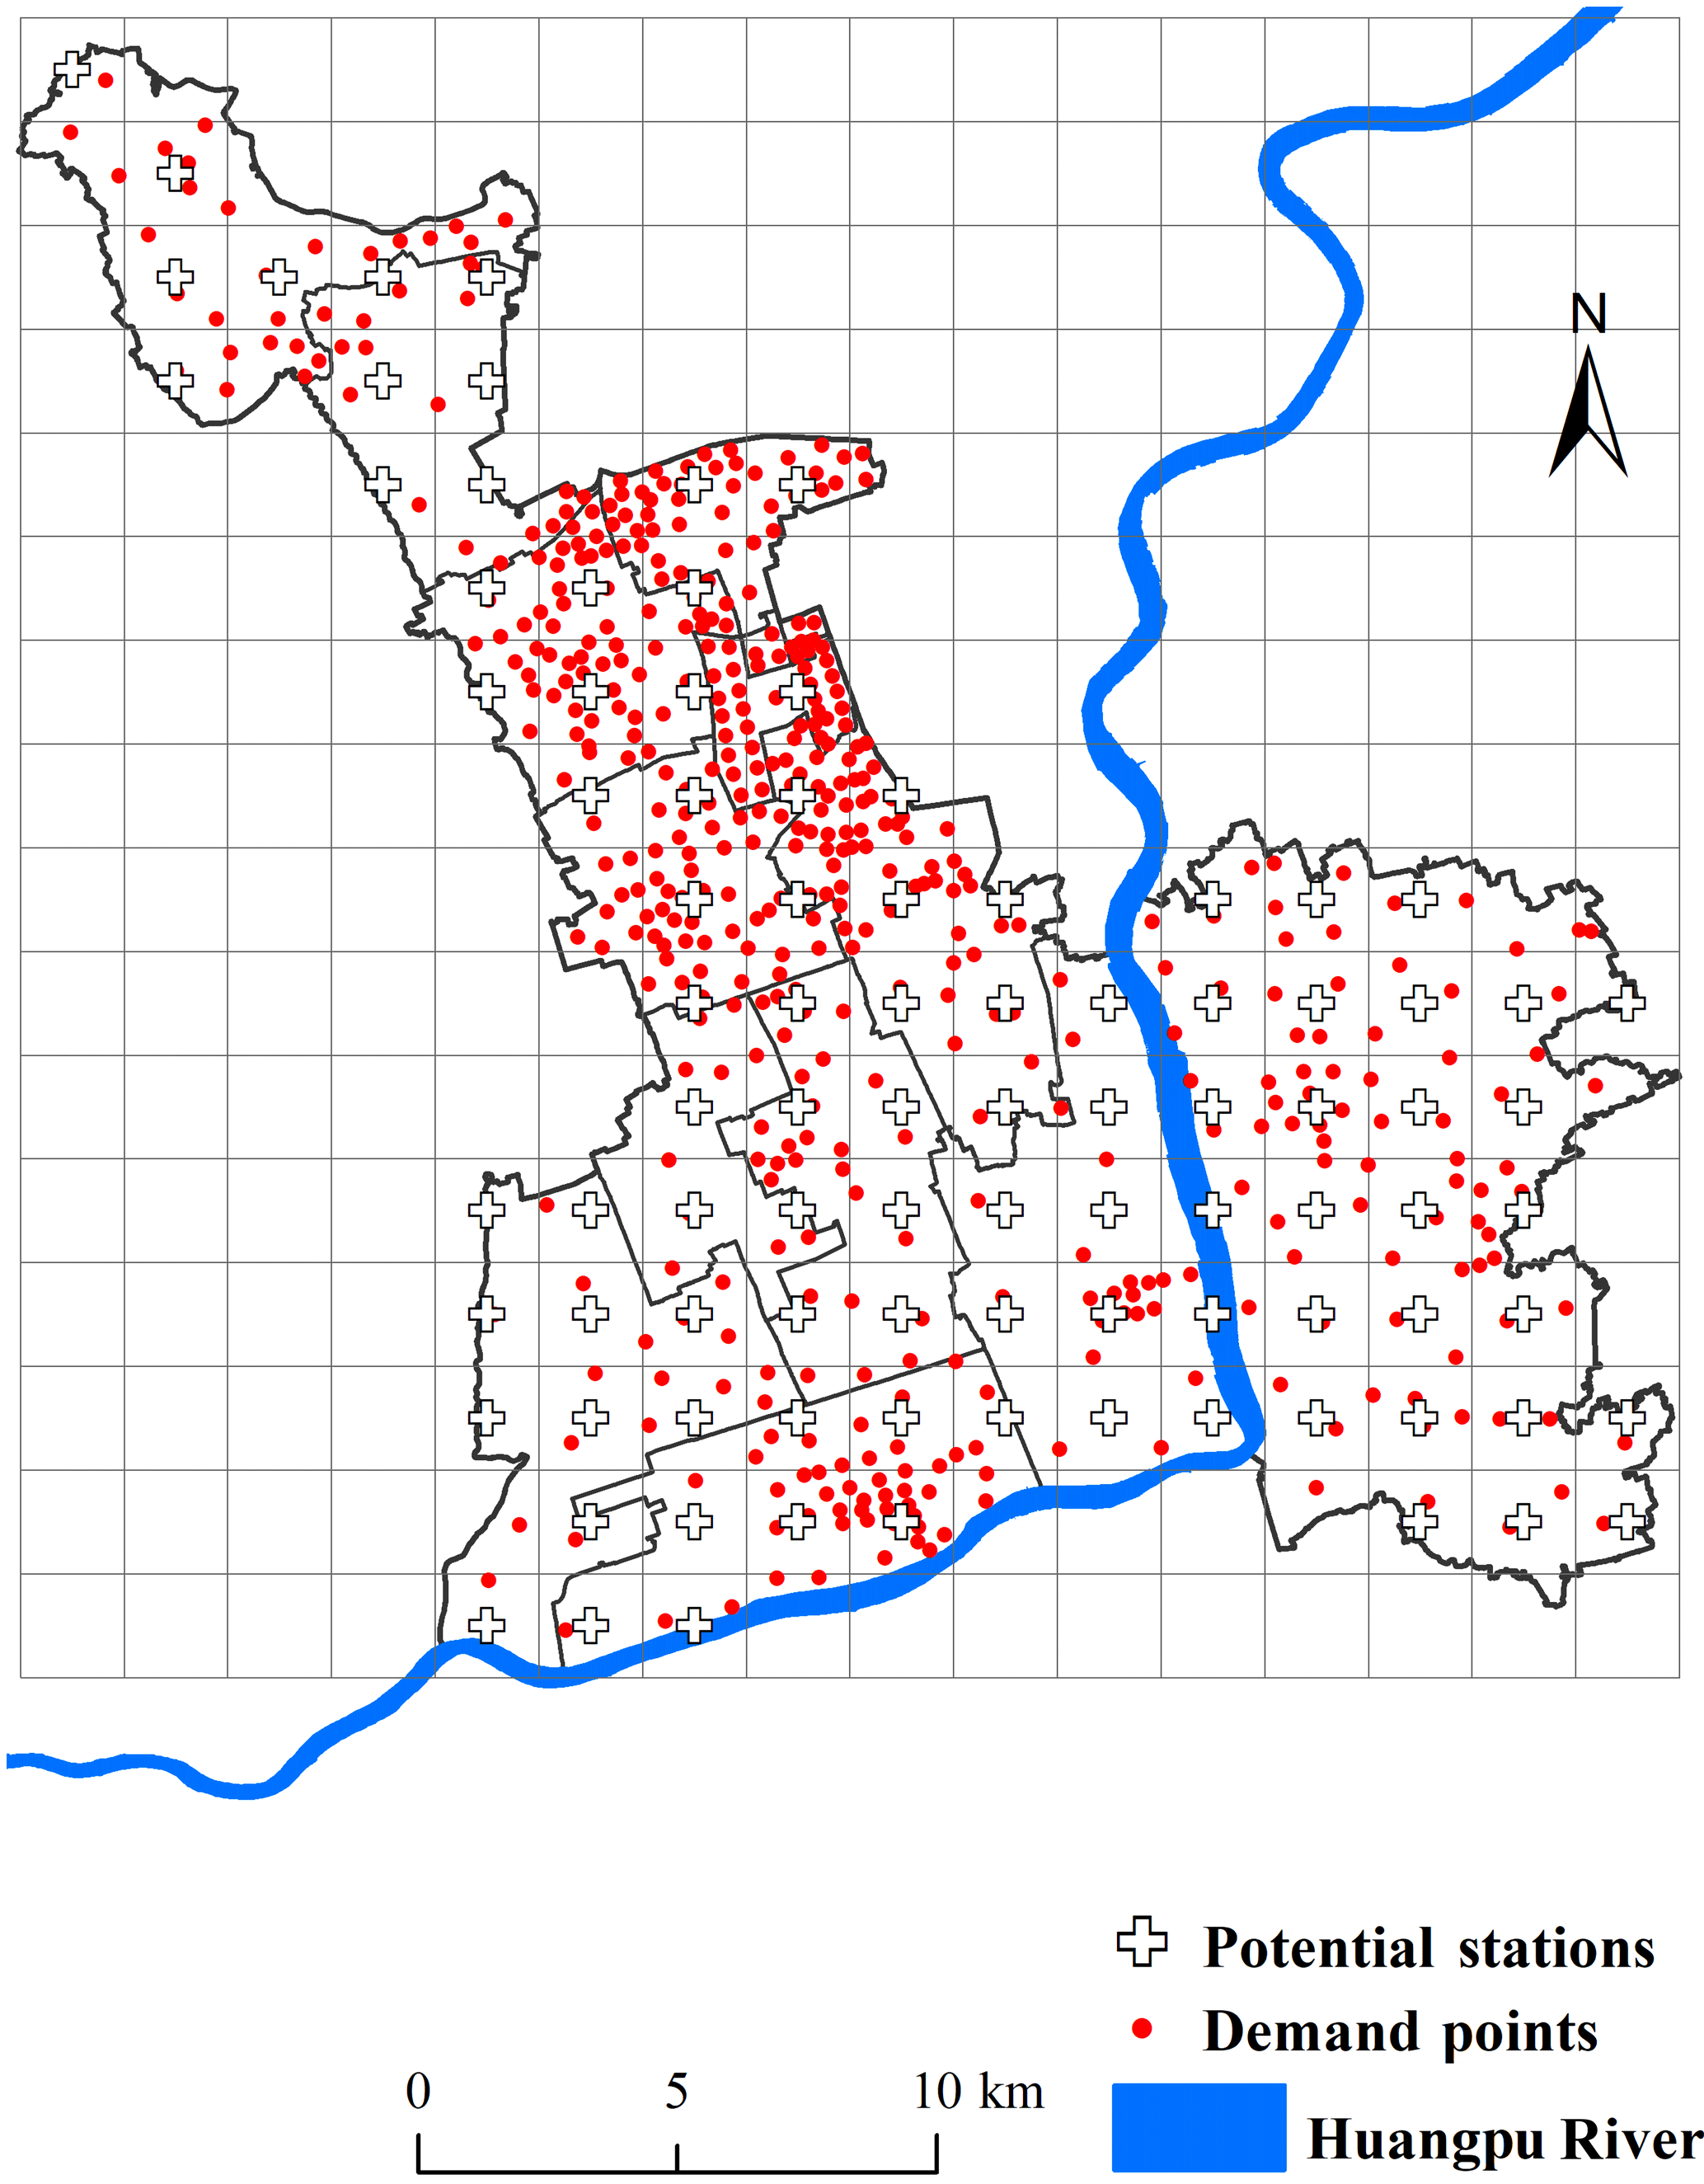
Figure 6Demand points and locations of potential stations.
3.3.1 Coverage level calculation
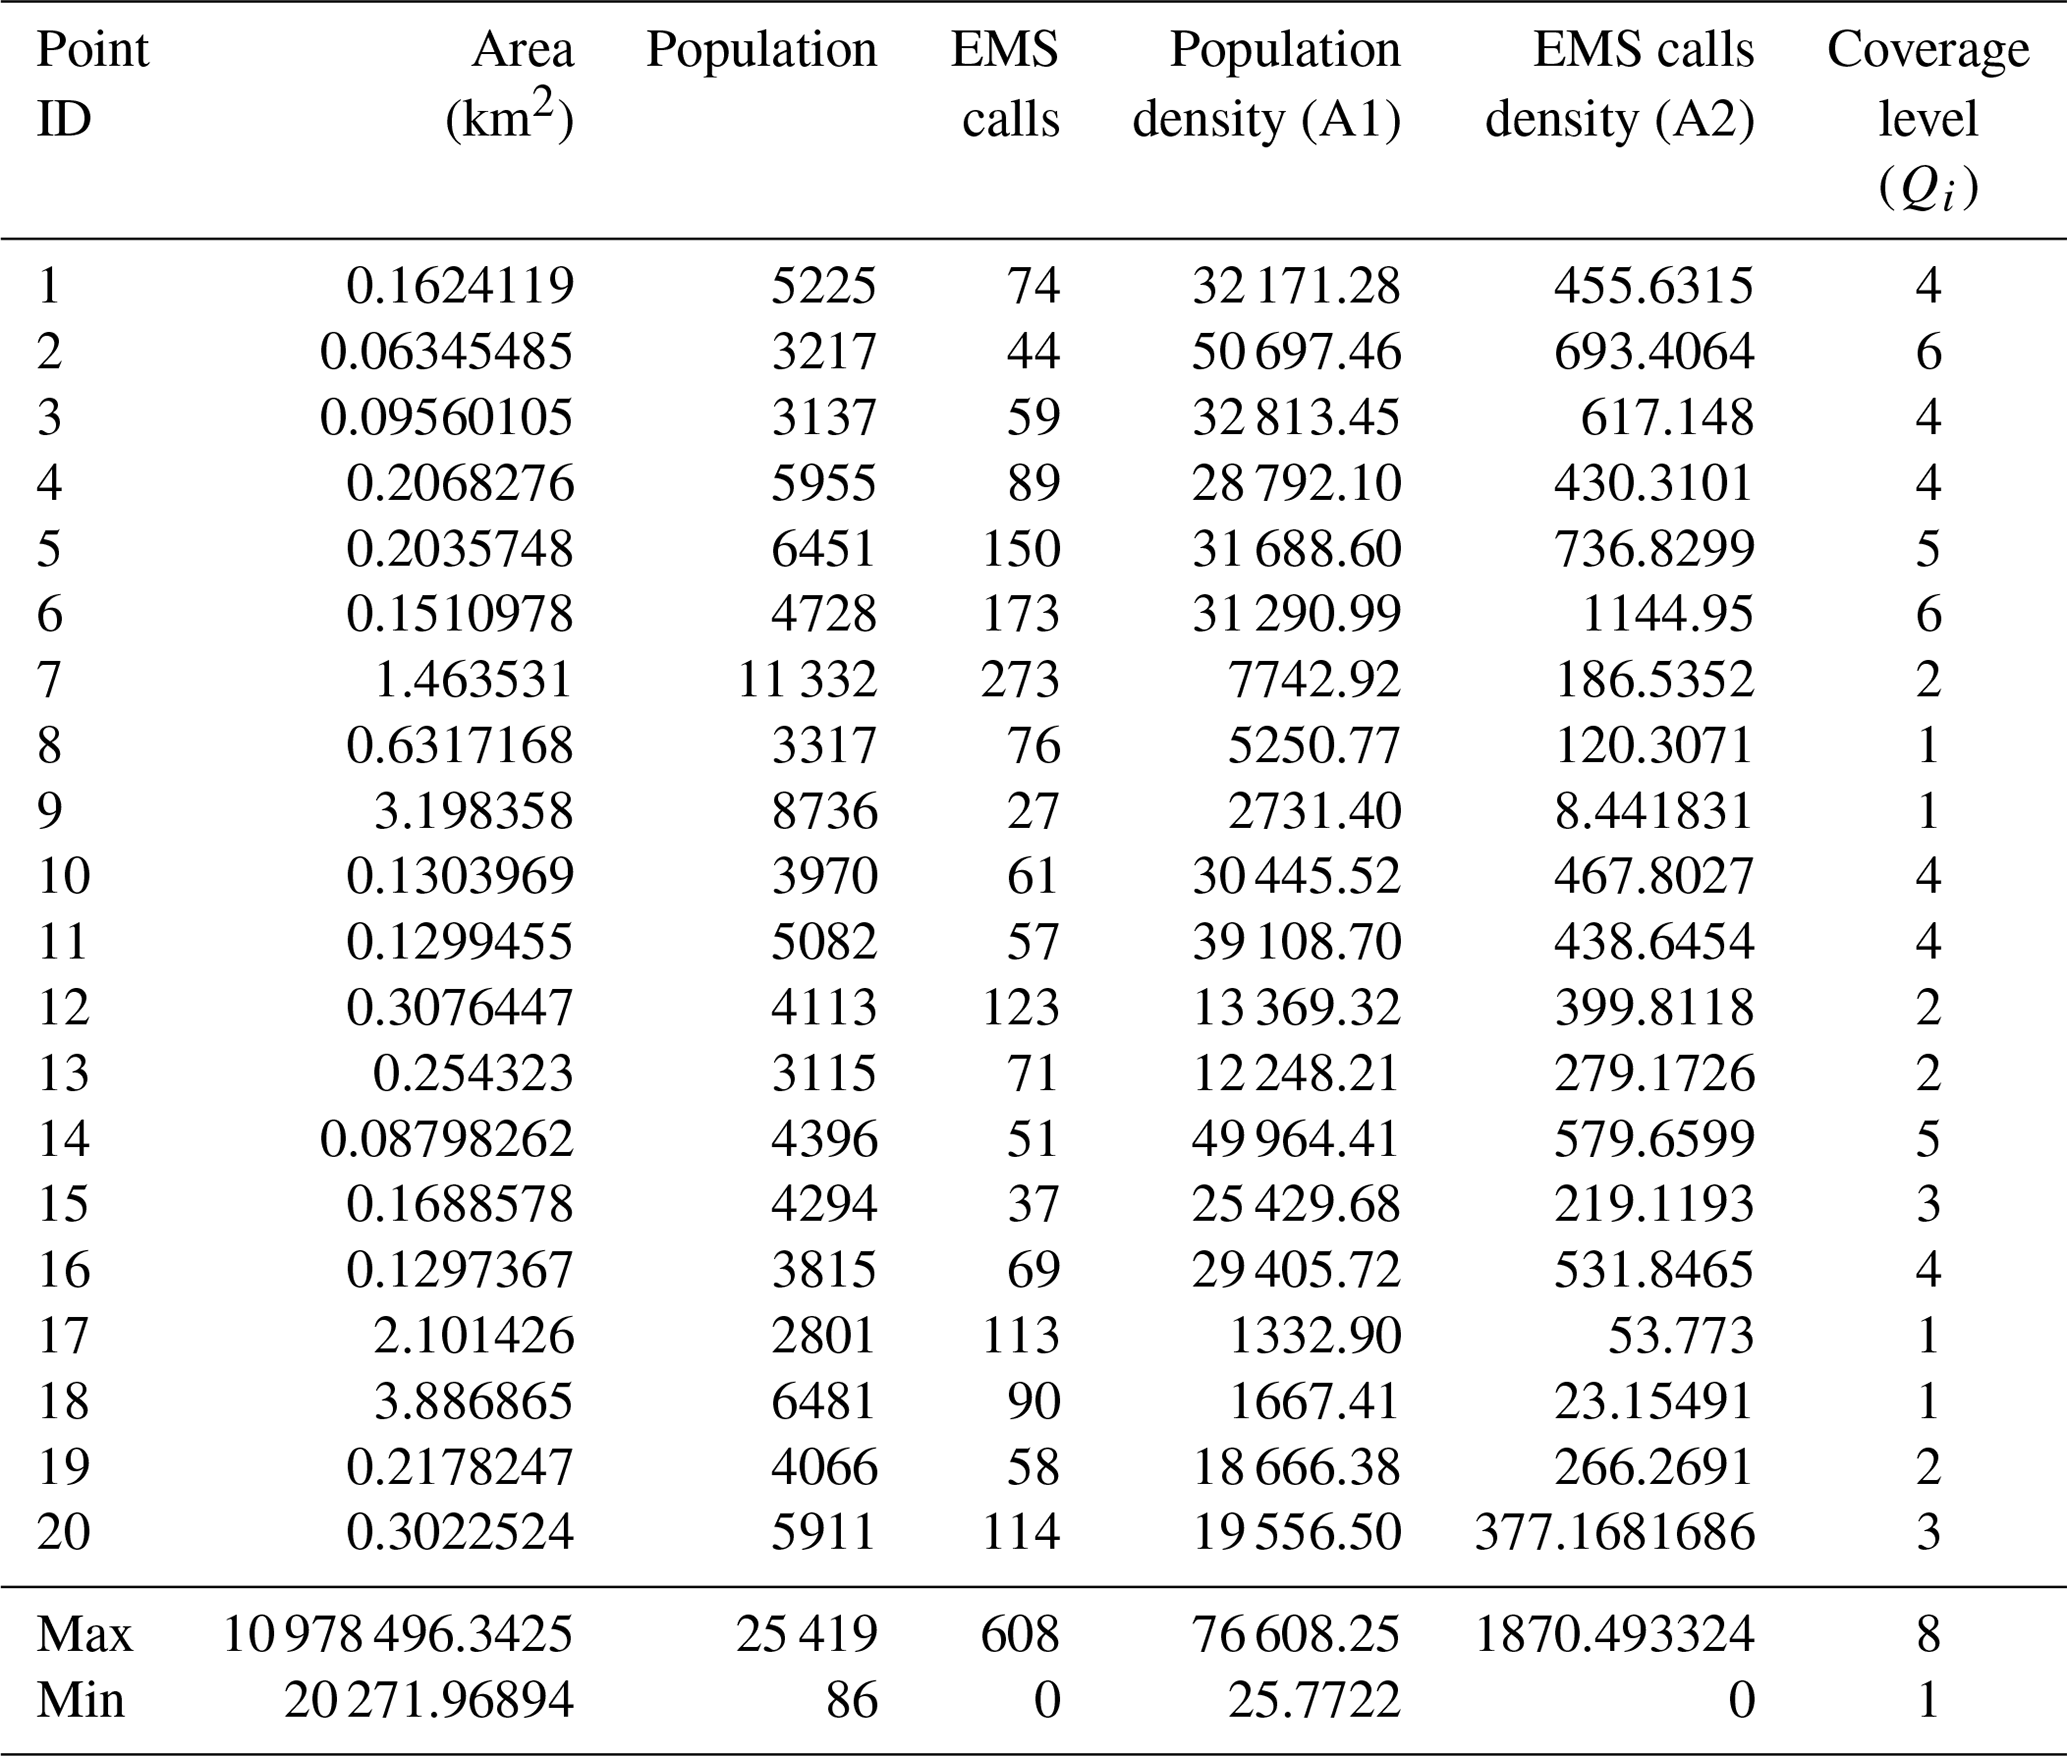
The coverage level Qi of the demand points (Question Q1) depends on the properties of each point. For example, the larger the population, the more EMS stations are required, and these should be located nearby. By considering the existing data and the general conditions in the study area, we regarded the population density and the historical EMS calls for help at each demand point as the influencing factors A1 and A2, respectively, of the demand coverage level (using Eq. 9) and used the same weights for the two factors as for a special case (). The resulting Qi is the coverage level, i.e., the number of times that each demand point i should be covered by the emergency stations in the service area within a specified time. The optimization objectives are to prevent delays in the emergency response caused by busy emergency stations during a disaster, and we constrained these objectives using Qi. The results of the demand level calculation are shown in Table 1.
3.3.2 Disaster risk level
The results of the disaster-scenario analysis indicate that some existing emergency stations are themselves highly vulnerable to fluvial flooding, which would delay or even prevent their EMS response. At this stage, we must assess the disaster risk at all points before optimizing the locations of the emergency stations. We considered both the disaster risk level of the demand points and potential stations (Question Q2); a high risk level not only means that this location is unsuitable for the location of EMS but also indicates a high need for EMS.
We used the disaster risk analysis method proposed in Sect. 2.5. For the demand point risk level mi, the disaster risk level assessment of the potential stations and the demand points are classified by inundation depth. Point i in the inundation area (depth of more than 30 cm) is regarded as completely inundated at the highest flooding risk level; therefore, we use the area with the inundation depth greater than 30 cm as the center and create three 1 km wide buffer zones (mi∈{1, 2, 3}). The closer a point is to the inundation center, the higher the risk level of the demand points (Fig. 7). In contrast, the risk level of the potential stations pj can be regarded as the resistance capacity to a disaster; it increases with the distance to the inundated area. Therefore, we use the center of the inundation area with a depth of greater than 30 cm and divide the disaster resistance level into four 1 km wide buffer zones (pj∈{0, 1, 2, 3}). Hence pj=0 means that the potential station j is completely inundated and cannot be used as an emergency station.
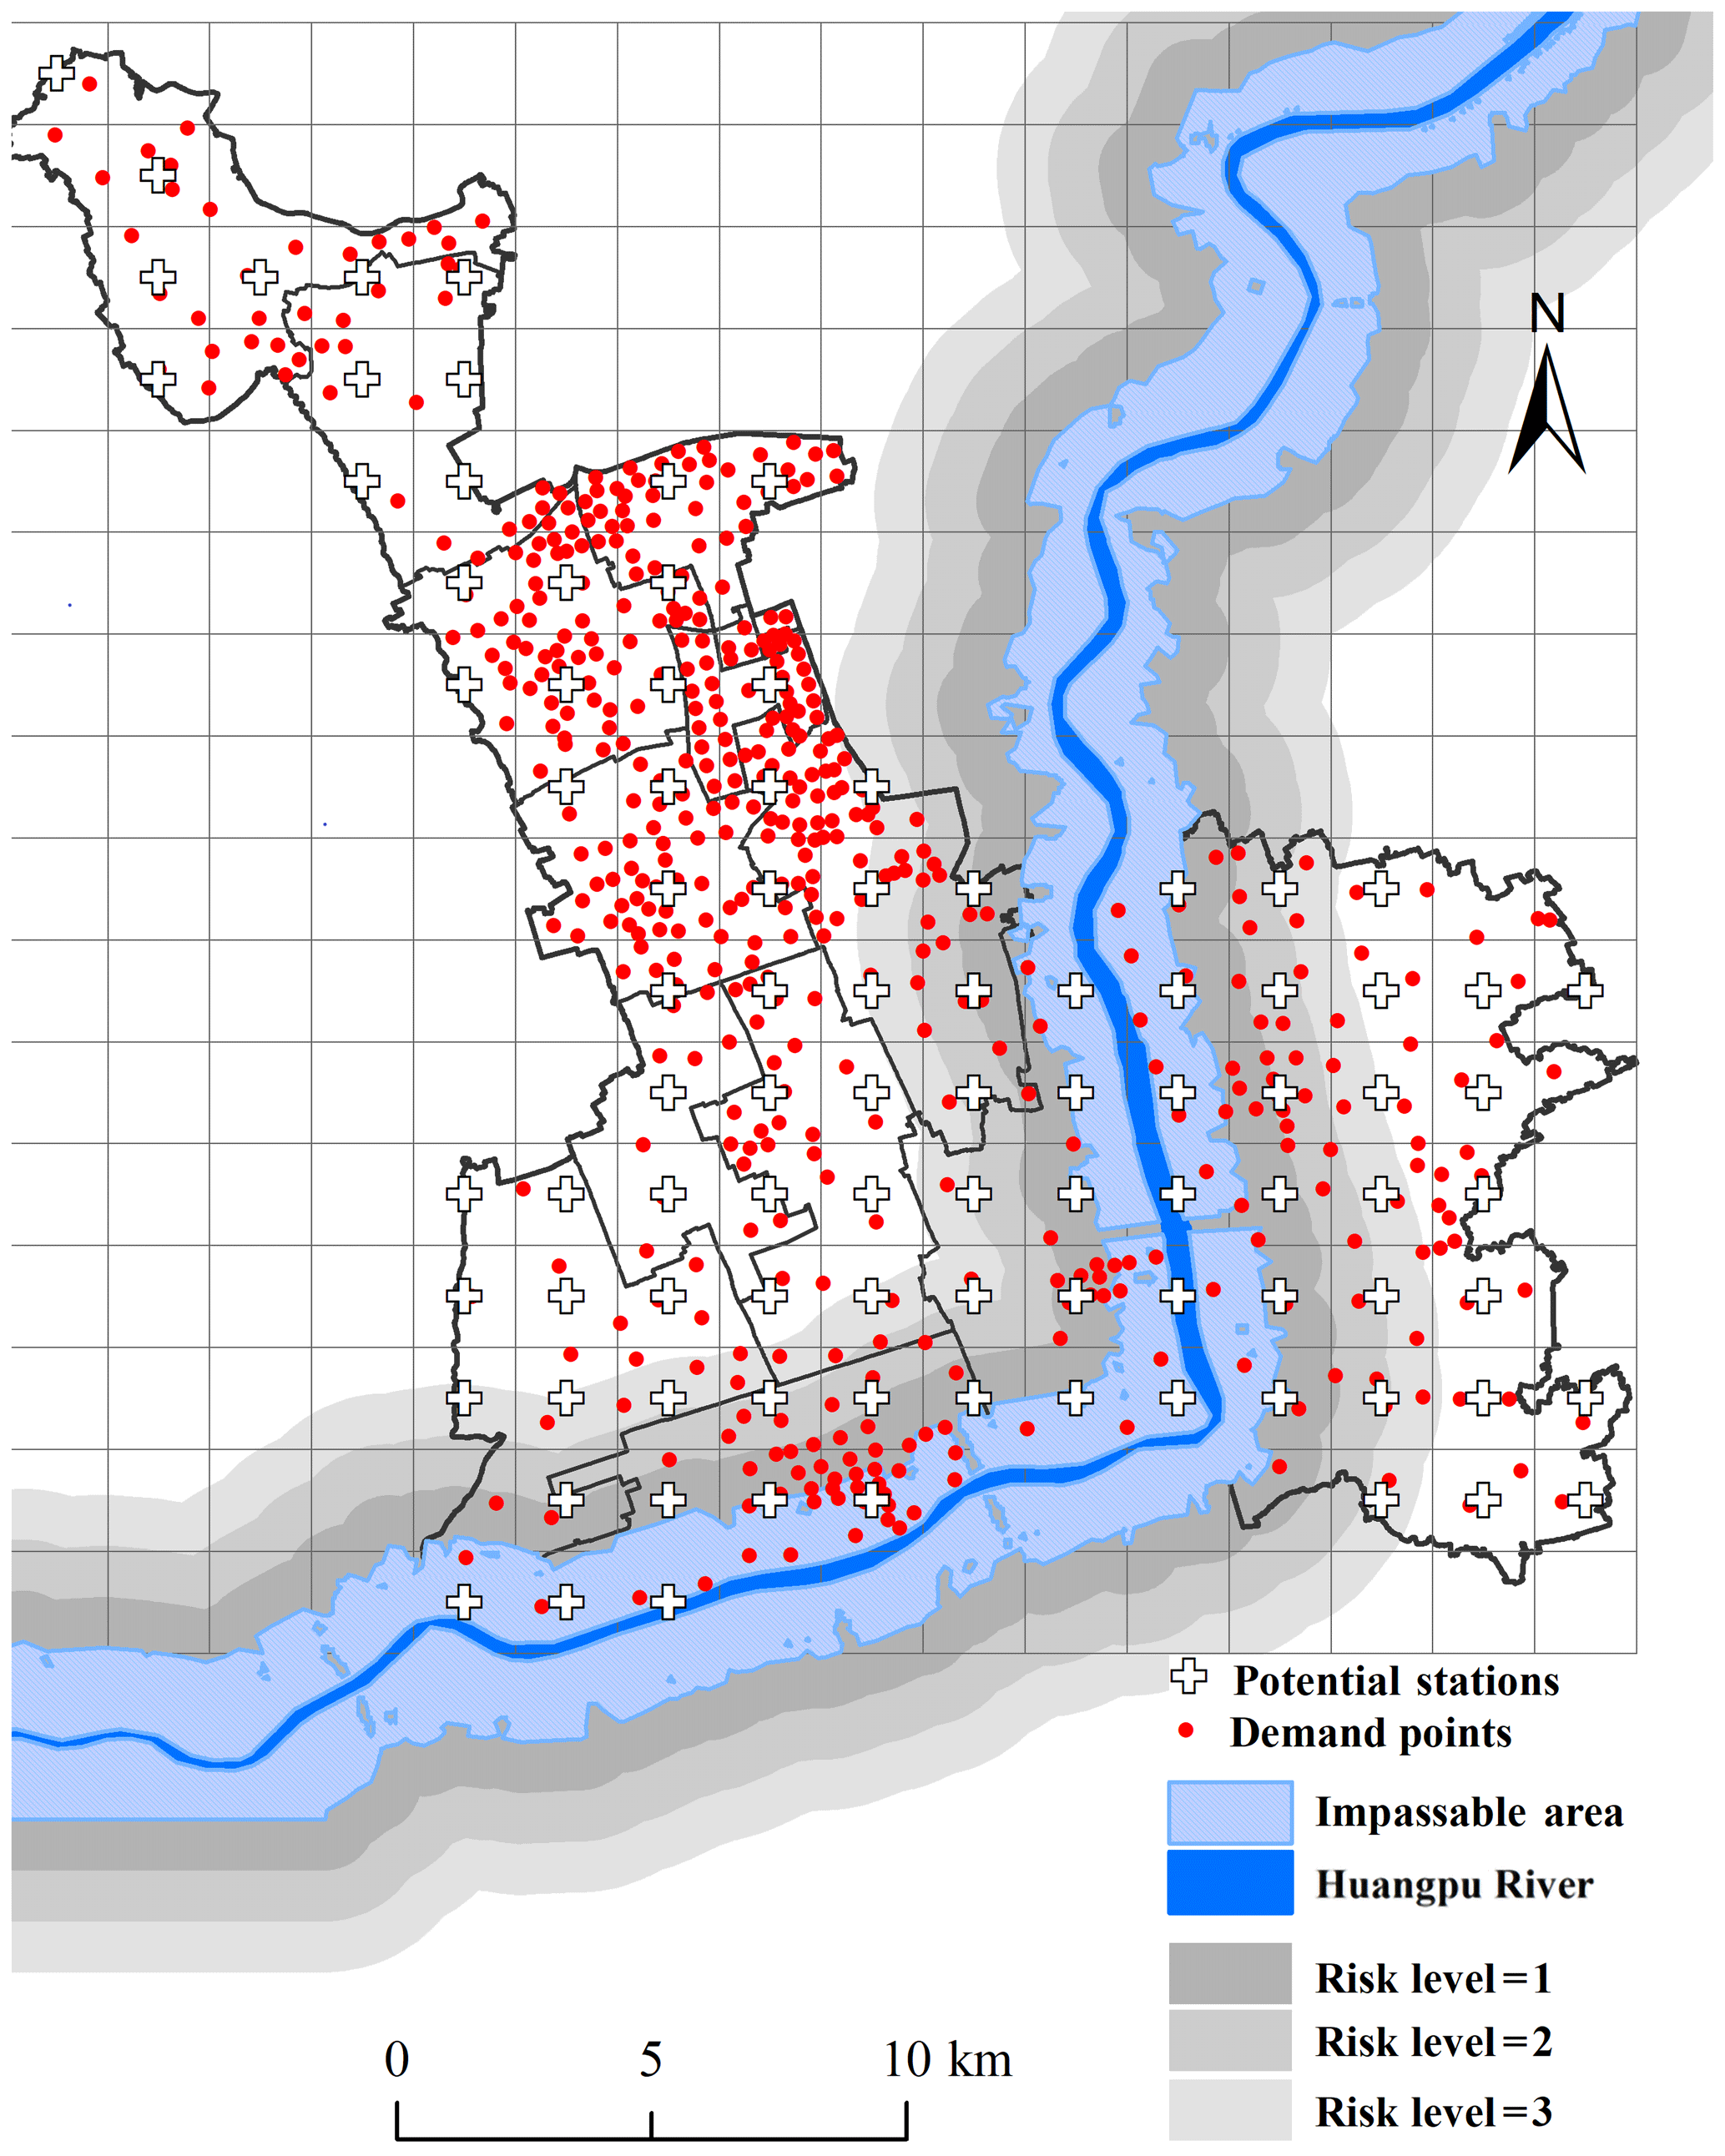
Figure 7Risk level for demand points and potential stations.
Table 1Demand point coverage level (sub-sample of the demand point data).
3.4 Results
Here we present the results of the proposed multi-coverage optimal location model for the assignment of the Minhang district emergency stations during fluvial flooding and discuss the performance of the optimization of the EMS services and coverage level. In order to test our model, we run this model based on the worst-case scenario (1000-year flood in the 2050s). We have assumed that vehicles cannot travel through areas with inundation depths greater than 30 cm. We utilized the origin–destination (OD) matrix in the Network Analysis function of ArcGIS to calculate the ambulance driving time tij from each potential station j to each demand point i during the disaster scenario. The model also included the parameters for the construction of 12 stations (F=12) to ensure that their service area could cover at least 95 % of the demand points within 8 min (, tij≤8). In simple terms, the objective of this model was to determine the locations of emergency stations to rescue the largest number of people in 8 min. We used the demand coverage level parameters and disaster risk level parameters obtained from the above-mentioned analysis as inputs for the model and used Lingo10.0 software to solve the model. The computational results are given in Fig. 8. The central urban area of the Minhang district is less affected by flooding than other areas; therefore, the location of the EMS stations did not change significantly. However, in the region near the Huangpu River, the optimized emergency stations are located farther away from the inundation area than the current stations, indicating that the station at the optimized location will be less liable to flooding and more likely to remain operational than the current stations.
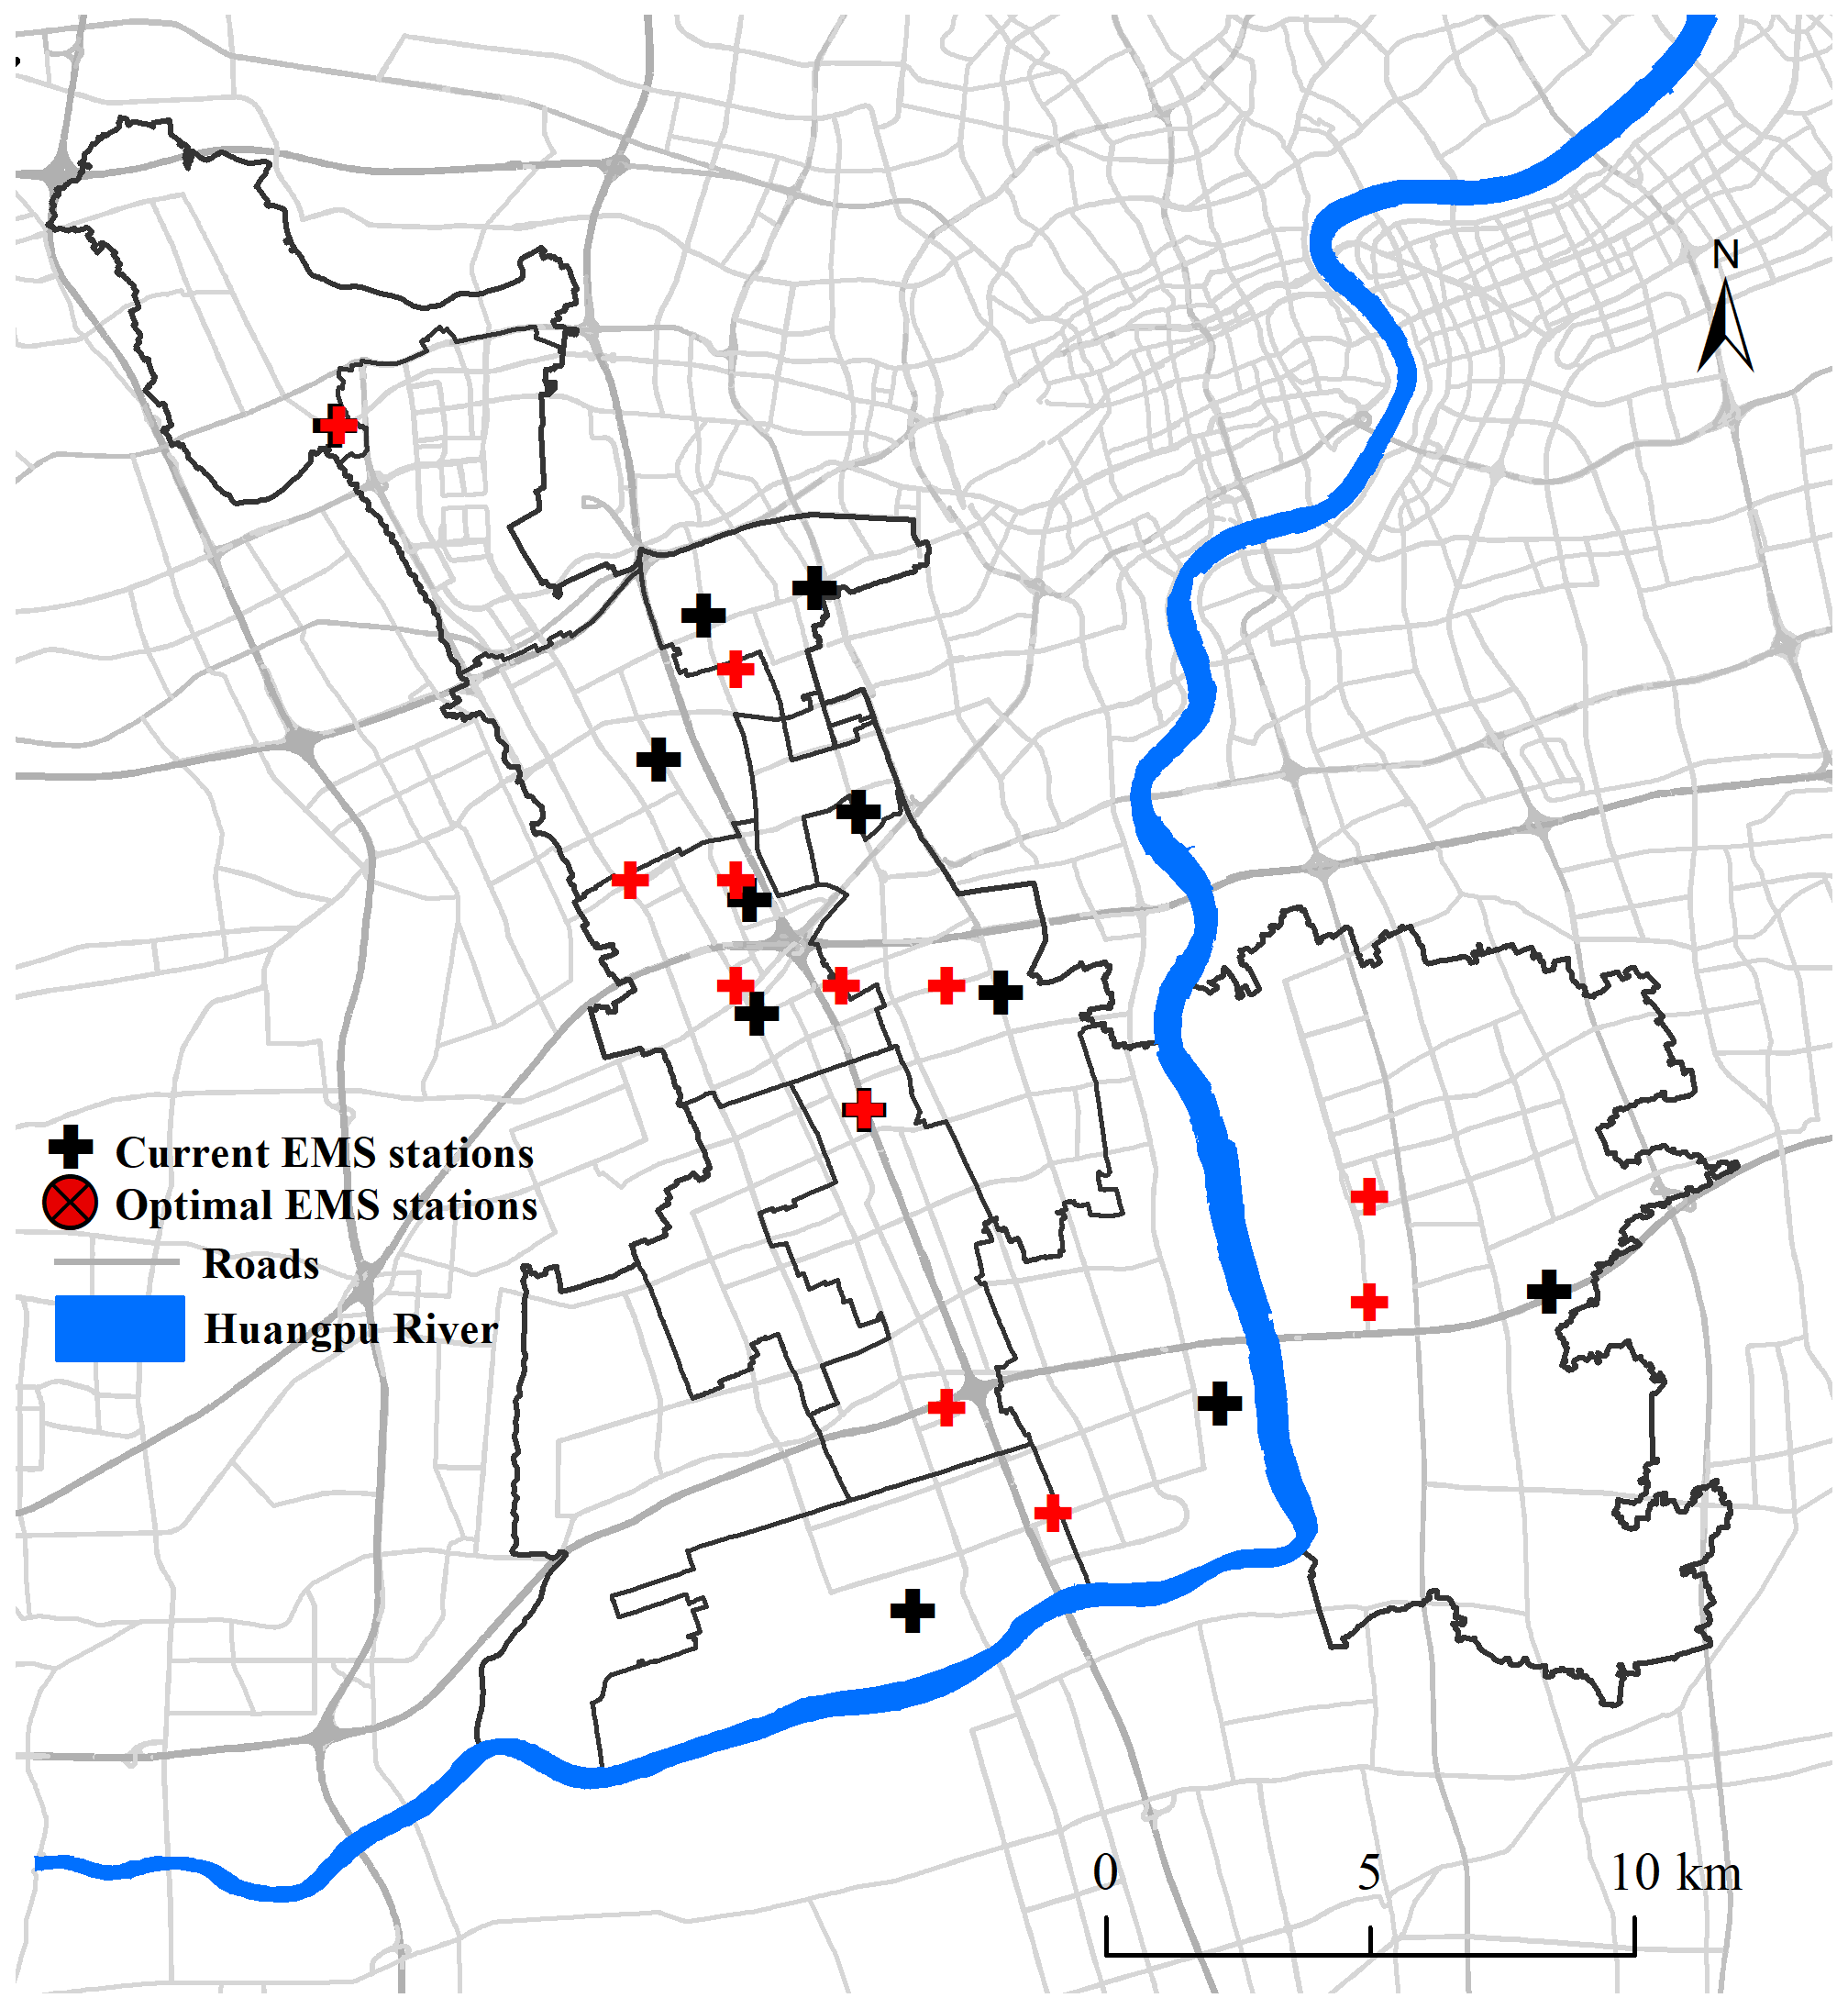
Figure 8Computational results of the optimal location model.
3.4.1 Service capacity comparison
In terms of emergency management, a service area is an intuitive measure for determining the service quality of emergency service facilities and usually reflects accessibility, i.e., the larger the service area, the larger the number of people who can be served by this station. In general, service areas and population are directly related to the transport infrastructure conditions around the emergency facilities, including road speed restrictions and road network density. During flooding, the transport infrastructure near the flooded area will be affected, which will change the travel time of the emergency vehicles, thus reducing the area of emergency service and accessibility of rescue. Therefore, in this context, we used the service area and population as parameters to evaluate the optimization performance of the model (Question Q4). Using the ArcGIS 10.2 Service Area Analysis tool, we divided the simulated emergency station service area into three response zones (8, 12, and 15 min journeys) under different scenarios; we then used the Spatial Join function to calculate the number of people in the service area. The total service area of the emergency stations for the different response times was calculated, and the comparisons of the service capacity for the current stations and optimal stations are shown in Figs. 9 and 10 using the worst-case flooding scenario (1000-year fluvial flood of the Huangpu River in the 2050s) and the no-flooding scenario.

Figure 9Performance comparison of service areas in different scenarios.
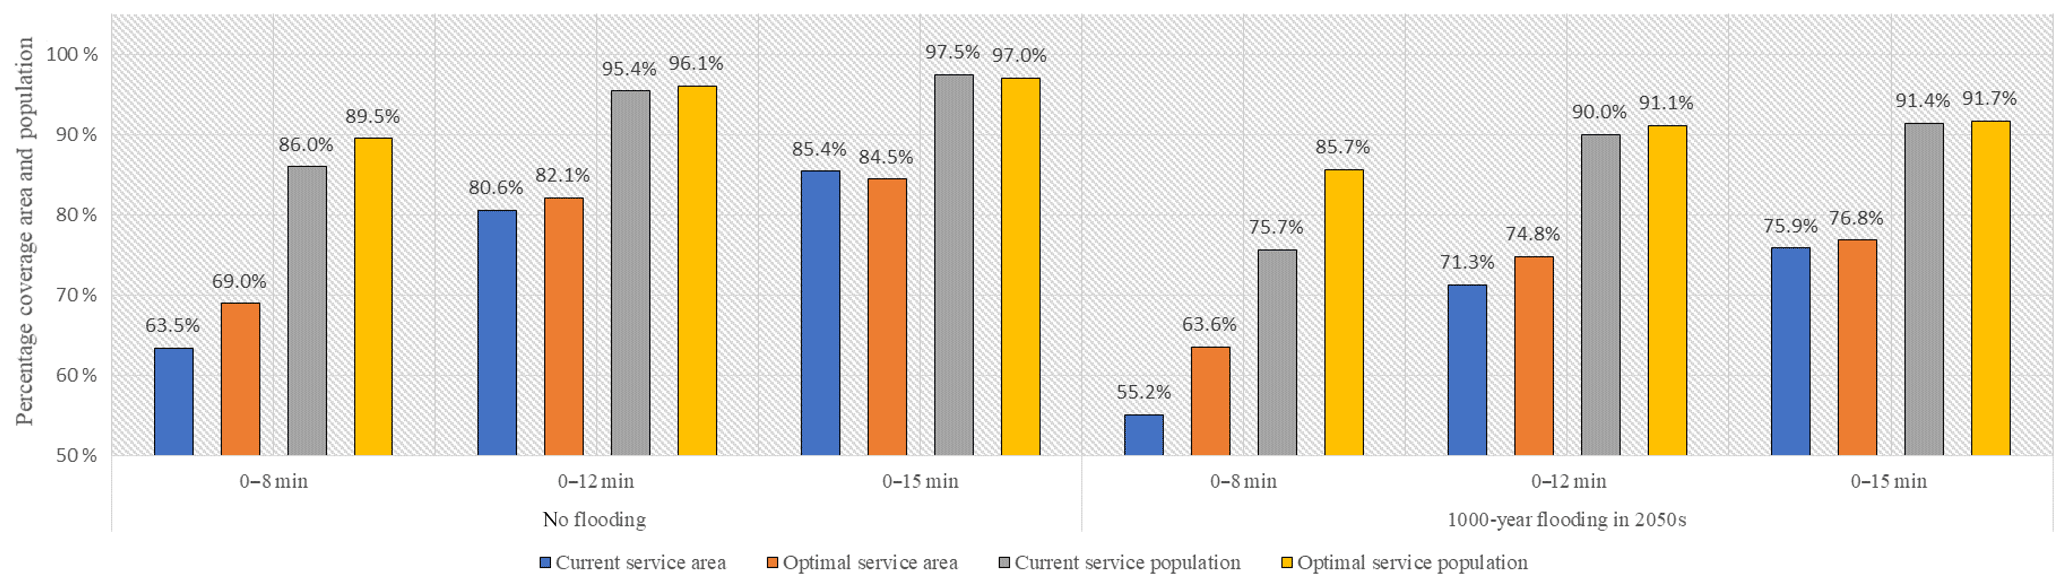

The percent coverage is expressed as a percentage of the total area and the total population; the results suggest that the optimized locations of the emergency stations obtained by the model provided improvements in the service capacity over that of the original stations in both the no-flooding and extreme flooding scenario based on the 8 min emergency response time. In the no-flooding scenario, the coverage of the service area increased by about 5.5 %, and for the worst-case flooding scenario, the increase was 8.4 %. (Fig. 10); the number of people with access to emergency services increased by almost 250 000 (10 % increase). These results indicate that the optimization model increased the service capacity for almost all response times and that the performance is best for the 8 min response time.
3.4.2 Coverage level performance
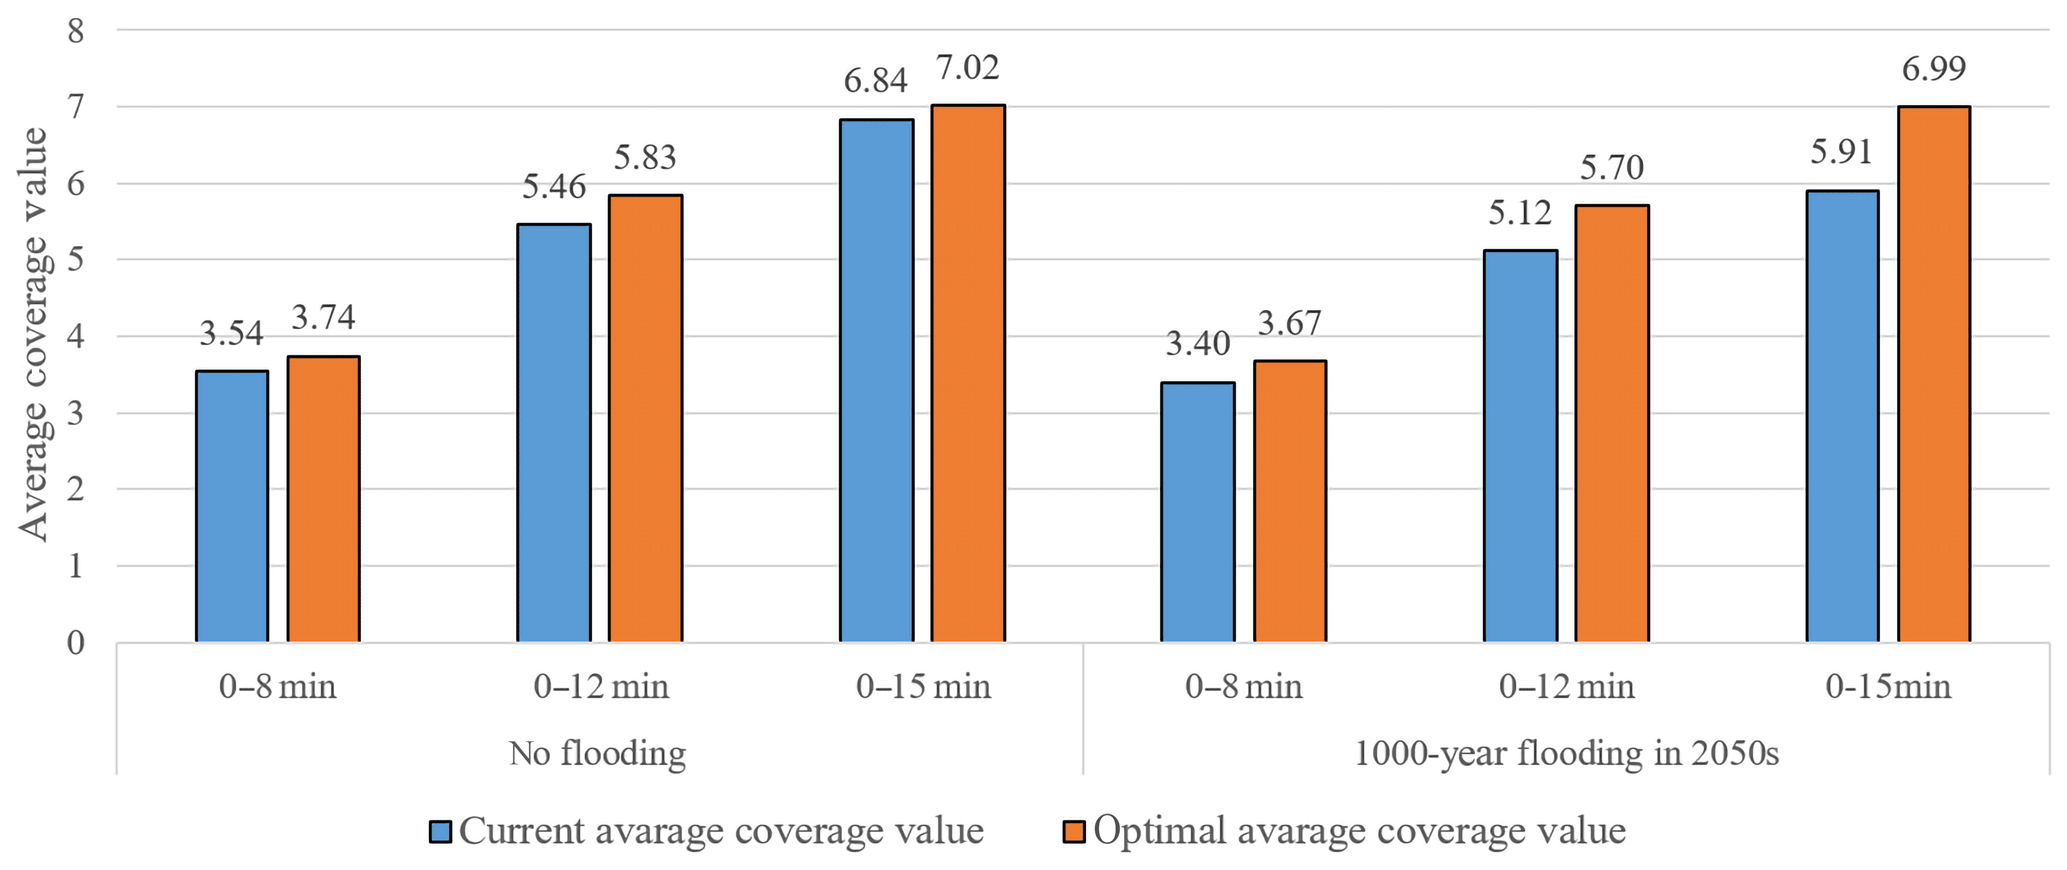
A combination of limited vehicle resources, vulnerable transport infrastructure, and high requirements of the demand points during a disaster inevitably place emergency services under great pressure. If one demand point is covered by only one emergency station, the limited number of ambulances would soon affect the provision of services for a large number of demand points, thereby causing delays in rescue. Therefore, a region with high demand should be covered by multiple emergency service areas that can operate simultaneously, especially for high-need demand points. The proposed model focuses on multiple coverage levels of demand points, and we used the real average coverage value for each demand point in a specific time as an important indicator to validate our model results (Question Q4). We combined the service areas of all emergency stations and used the Spatial Join tool in ArcGIS 10.2 to calculate how many times every demand point would be covered in 8, 12, and 15 min during the no-flooding and the worst-case flooding scenarios. We then compared the average values (Fig. 11).
Figure 11 shows that the average coverage value improved after optimization in both scenarios. Specifically, the average coverage value for the no-flooding scenario is slightly higher (about 10 %). The improvement in the average coverage value for the no-flooding scenario was greatest for the 12 min response time, i.e., an increase of 6.8 %. For the worst-case flooding scenario (1000-year fluvial flood of the Huangpu River in the 2050s), the improvements were more significant: the coverage of the 15 min response time increased by more than 1 (18.4 %), indicating that, on the average, each demand point can be served by one additional EMS stations within 15 min. These results indicate that using model optimization for locating emergency stations greatly improved the response time of emergency services at the demand points, even in an extreme flood disaster scenario, thereby providing strong disaster resistance. We also compared the percentage of coverage in 8, 12, and 15 min during the no-flooding and the worst-case flooding scenarios (Fig. 12). The percent coverage is expressed as a percentage of the demand points in different coverage levels. Figure 12 shows that the coverage level of interval 5–8 is significantly greater for the 8 min response time and 12 min response time, while that of interval 0–3 was significantly decreased; these results indicate that the model can improve the demand points which have a low coverage level for a short response time. In addition, we also found that the optimized coverage level is almost the same for the 8 min response during the no-flooding or the worst-case flooding scenarios, indicating that extreme fluvial flooding has little impact on EMS emergency response.
From these results, we can see that stations whose locations are determined using the proposed method will have a greater capacity to meet the requirements of the demand points. This reduces the occurrence of “failures” and “insufficiency” of emergency stations during disasters, thereby shortening emergency response times and reducing the loss of life and property.
This study focused on the optimization of the EMS station locations to ensure efficient emergency medical response in fluvial flood disaster scenarios and the prevention of accidents due to emergency response delays and failure of stations. After analyzing the existing location models, we discussed the reasons for using multi-coverage plans to improve disaster emergency resistance instead of traditional location models. In addition, since there are various disaster scenarios, we also considered the different damage levels in various areas using disaster-scenario simulations. The proposed model is an objective programming model with the goal of serving the largest number of people in a specified time during a disaster. For the case study, we investigated the Minhang district in Shanghai, China, and conducted computational experiments based on real-world data from the Shanghai Emergency Center. We used the service area and the average coverage level as parameters to evaluate the model performance. The model results showed that the optimized EMS locations had a wider service range for 8 min response time and a larger number of people were served; the coverage level was also improved. The coverage level of some of the existing stations changed greatly after the disaster, whereas the optimized location results showed that the service level before and after the disaster was almost the same. Both parameters indicated that the proposed multi-coverage location optimization model is well suited to model the emergency response to flood disasters and to conduct site selection of urban emergency facilities.
Some aspects of the model could be improved to obtain a more robust solution. First, in the case study, we did not conduct a quantitative assessment of the effect of the disaster risk level on the emergency response, but we evaluated the disaster risk level by using the buffer distance to the source of the disaster, which is a subjective approach. Second, since this was a theoretical analysis, our model did not consider whether the terrain or other basic conditions were suitable for the EMS facilities. In future studies, we will consider disaster risk factors such as the vulnerability of buildings to evaluate the level of disaster risk quantitatively, and we will take into account the terrain and construction cost of the potential locations.
Lastly, the location of urban emergency service facilities has always been an important focus in urban planning. Location selection should consider a variety of factors, and the ability to respond to disasters should also be considered. In this study, we divided the area into grids with a cell size of 2 km × 2 km and assumed that every grid center point was a potential emergency station; the grid division will affect the efficiency of the model and the accuracy of the results. The finer the scale, the higher the accuracy but the greater the computational complexity. Therefore, in future research, we will consider a multi-scale division that takes into account the population density.
In this study, we used a fluvial flooding disaster as an example to analyze the impact of disasters and to evaluate the model. However, the risks faced by cities are not only fluvial floods but also other major events such as earthquakes, mudslides, and pluvial floods. In addition, the evacuation plan of the population exposed to these hazards should be considered (Alaeddine et al., 2015). Future research should comprehensively consider a variety of these hazards, conduct risk assessments of the study area quantitatively, and select the location of urban emergency facilities according to different geographical conditions to improve the efficiency of emergency response.
The raw and processed data from the co-authors' research findings cannot be shared at this time, as these data are also part of the ongoing research.
YY and JY initiated and led this research. YY designed the model, analyzed the performance of this model, and wrote the paper. JY provided EMS history records and flooding inundation simulation. MY dealt with the road data. DS and JY helped in analyzing emergency data.
The authors declare that they have no conflict of interest.
This work was supported by the National Key Research and Development Program of China (grant no. 2018YFC1508803), the Major Project of the National Social Science Fund of China (grant no. 18ZDA105), the National Natural Science Foundation of China (grant nos. 41871164, 41601568, and 51761135024), the Humanities and Social Sciences Project of the Ministry of Education of China (grant no. 17YJAZH111), the Key Project of Soft Science Research of Shanghai (grant no. 19692108100), the Fundamental Research Funds for the Central Universities (grant nos. 2018ECNU-QKT001 and 2017ECNU-KXK013), and the Hubei Provincial Key Laboratory of Water System Science for Sponge City Construction (grant no. 2019-02).
This research has been supported by the National Key Research and Development Program of China (grant no. 2017YFE0100700), the National Natural Science Foundation of China (grant no. 41871164), the Humanities and Social Sciences Project of the Ministry of Education of China (grant no. 17YJAZH111), and the Hubei Provincial Key Laboratory of Water System Science for Sponge City Construction (grant no. 2019-02).
This paper was edited by Sven Fuchs and reviewed by Kamal Serrhini and one anonymous referee.
Alaeddine, H., Serrhini, K., Maizia, M., and Néron, E.: A spatiotemporal optimization model for the evacuation of the population exposed to flood hazard, Nat. Hazards Earth Syst. Sci., 15, 687–701, https://doi.org/10.5194/nhess-15-687-2015, 2015.
Albano, R., Sole, A., Adamowski, J., and Mancusi, L.: A GIS-based model to estimate flood consequences and the degree of accessibility and operability of strategic emergency response structures in urban areas, Nat. Hazards Earth Syst. Sci., 14, 2847–2865, https://doi.org/10.5194/nhess-14-2847-2014, 2014.
Brandeau, M. L. and Chiu, S. S.: An Overview of Representative Problems in Location Research, Manage. Sci., 35, 645–674, 1989.
Chen, Z. Z. and You, J, X.: A Multi-objective Decision Model of Emergency Rescue Facility Location for Large-scale Emergency Incidents, Manage. Sci. China, 19, 10–14, 2006.
China Construction Standard Highway Committee: JTG B01-2003, People's Republic of China industry standard: highway engineering technical standards, People's Communications Publishing House, Beijing, 2004.
Church, R. and ReVelle, C.: The maximal covering location problem, Pap. Reg. Sci. Assoc., 32, 101–118, https://doi.org/10.1007/bf01942293, 1974.
Daskin, M. S. and Stern, E. H. J. T. S.: A Hierarchical Objective Set Covering Model for Emergency Medical Service Vehicle Deployment, Transport Sci., 15, 137–152, https://doi.org/10.1287/trsc.15.2.137, 1981.
Dulebenets, M. A., Abioye, O. F., Ozguven, E. E., Moses, R., Boot, W. R., and Sando, T.: Development of statistical models for improving efficiency of emergency evacuation in areas with vulnerable population, Reliabil. Eng. Syst. Safe., 182, 233–249, https://doi.org/10.1016/j.ress.2018.09.021, 2019.
Ge, C, J., Wang, X., and Guan, X. J.: A Multi-Covering Model and Its Algorithm for Facility Location Response for Large-Scale Emergencies, Oper. Res. Manage. Sci., 20, 50–56, https://doi.org/10.1007/s11424-010-8015-y, 2011.
Gendreau, M., Laporte, G., and Semet, F.: Solving an ambulance location model by tabu search, Locat. Sci., 5, 75–88, https://doi.org/10.1016/S0966-8349(97)00015-6, 1997.
Green, D., Yu, D., Pattison, I., Wilby, R., Bosher, L., Patel, R., Thompson, P., Trowell, K., Draycon, J., Halse, M., Yang, L., and Ryley, T.: City-scale accessibility of emergency responders operating during flood events, Nat. Hazards Earth Syst. Sci., 17, 1–16, https://doi.org/10.5194/nhess-17-1-2017, 2017.
Hakimi, S. L. J. O. R.: Optimum Locations of Switching Centers and the Absolute Centers and Medians of a Graph, Oper. Res. Manage. Sci., 12, 450–459, https://doi.org/10.1287/opre.12.3.450, 1964.
Hakimi, S. L. J. O. R.: Optimum distribution of switching centers in a communication network and some related graph theoretic problems, Oper. Res., 13, 462–475, https://doi.org/10.1287/opre.13.3.462, 1965.
Hogan, K. and Revelle, C.: Concepts and Applications of Backup Coverage, Manage. Sci., 32, 1434–1444, 1986.
Jia, H. Z., Ordonez, F., and Dessouky, M.: A modeling framework for facility location of medical services for large-scale emergencies, IIE Trans., 39, 41–55, https://doi.org/10.1080/07408170500539113, 2007.
Kates, R. W., Clark, W. C., Corell, R., Hall, J. M., Jaeger, C. C., Lowe, I., McCarthy, J. J., Schellnhuber, H. J., Bolin, B., Dickson, N. M., Faucheux, S., Gallopin, G. C., Grubler, A., Huntley, B., Jager, J., Jodha, N. S., Kasperson, R. E., Mabogunje, A., Matson, P., Mooney, H., Moore, B., O'Riordan, T., and Svedin, U.: Environment and development – Sustainability science, Science, 292, 641–642, 2001.
Liu, M., Yang, D. P., and Hao, F. X.: Optimization for the Locations 70 of Ambulances under Two-Stage Life Rescue in the Emergency Medical Service: A Case Study in Shanghai, China, Math. Probl. Eng., 2017, 1830480, 2017, https://doi.org/10.1155/2017/1830480, 2017.
Moeini, M., Jemai, Z., and Sahin, E.: Location and relocation problems in the context of the emergency medical service systems: a case study, Central Eur. J. Oper. Res., 23, 641–658, https://doi.org/10.1007/s10100-014-0374-3, 2015.
Pirkul, H. and Schilling, D. A.: The Maximal Covering Location Problem with Capacities on Total Workload, Manage. Sci., 37, 233–248, https://doi.org/10.1287/mnsc.37.2.233, 1991.
Pons, P. T. and Markovchick, V. J.: Eight minutes or less: Does the ambulance response time guideline impact trauma patient outcome?, J. Emerg. Med., 23, 43–48, 2002.
Su, Q., Luo, Q. Y., and Huang, S. H.: Cost-effective analyses for emergency medical services deployment: A case study in Shanghai, Int. J. Prod. Econ., 163, 112–123, 2015.
Toregas, C. and ReVelle, C.: Optimal location under time or distance constraints, Pap. Reg. Sci. Assoc., 28, 131–143, https://doi.org/10.1007/BF01961457, 1972.
Yin, J., Yu, D. P., Yin, Z. N., Wang, J., and Xu, S. Y.: Modelling the combined impacts of sea-level rise and land subsidence on storm tides induced flooding of the Huangpu River in Shanghai, China, Climatic Change, 119, 919–932, 2013a.
Yin, J., Yu, D. P., Yin, Z. N., Wang, J., and Xu, S. Y.: Multiple scenario analyses of Huangpu River flooding using a 1D/2D coupled flood inundation model, Nat. Hazards, 66, 577–589, 2013b.
Yin, J., Yu, D. P., Yin, Z. N., Wang, J., and Xu, S. Y.: Modelling the anthropogenic impacts on fluvial flood risks in a coastal mega-city: A scenario-based case study in Shanghai, China, Landsc. Urban Plan., 136, 144–155, 2015.
Yin, J., Yu, D. P., Yin, Z., Liu, M., and He, Q.: Evaluating the impact and risk of pluvial flash flood on intra-urban road network: A case study in the city center of Shanghai, China, J. Hydrol., 537, 138–145, 2016.
Yin, J., Jing, Y. M., Yu, D. P., Ye, M. W., Yang, Y. H., and Liao, B. G.: A Vulnerability Assessment of Urban Emergency in Schools of Shanghai, Sustainability-Basel, 11, 1–12, https://doi.org/10.3390/su11020349, 2019.
Yu, D. and Lane, S. N.: Urban fluvial flood modelling using a two-dimensional diffusion-wave treatment, part 1: mesh resolution effects, Hydrol. Process., 20, 1541–1565, 2006a.
Yu, D. and Lane, S. N.: Urban fluvial flood modelling using a two-dimensional diffusion-wave treatment, part 2: development of a sub-grid-scale treatment, Hydrol. Process., 20, 1567–1583, 2006b.