the Creative Commons Attribution 4.0 License.
the Creative Commons Attribution 4.0 License.
 | 18 Apr 2019
Evaluating earthquake-induced rockfall hazard near the Dead Sea Transform
Oded Katz
Ram Weinberger
Naomi Porat
Shmuel Marco
We address an approach for rockfall hazard evaluation where the study area resides below a cliff in an a priori exposure to rockfall hazard, but no historical documentation of rockfall events is available and hence important rockfall hazard parameters like triggering mechanism and recurrence interval are unknown.
We study the rockfall hazard for the town of Qiryat Shemona, northern Israel, situated alongside the Dead Sea Transform, at the foot of the Ramim escarpment. Numerous boulders are scattered on the slopes above the town, while pre-town historical aerial photos reveal that boulders had reached the location that is now within town limits. We use field observations and optically stimulated luminescence dating of past rockfall events combined with computer modeling to evaluate the rockfall hazard. For the analysis, we first mapped the rockfall source and final downslope stop sites and compiled the boulder size distribution. We then simulated the possible rockfall trajectories using the field observed data to calibrate the simulation software by comparing simulated and mapped boulder stop sites along selected slopes, while adjusting model input parameters for best fit. The analysis reveals areas of high rockfall hazard at the southwestern quarters of the town and also indicates that in the studied slopes falling blocks would stop where the slope angle decreases below 5–10∘. Age determination suggests that the rockfalls were triggered by large (M>6) historical earthquakes. Nevertheless, not all large historical earthquakes triggered rockfalls. Considering the size distribution of the past rockfalls in the study area and the recurrence time of large earthquakes in the region, we estimate a probability of less than 5 % to be affected by a destructive rockfall within a 50-year time window.
Here we suggest a comprehensive method to evaluate rockfall hazard where only past rockfall evidence exists in the field. We show the importance of integrating spatial and temporal field observations to assess the extent of rockfall hazard, the potential block size distribution and the rockfall recurrence interval.
- Article
(9022 KB) - Full-text XML
- BibTeX
- EndNote


Rockfalls are a type of fast mass movement process common in mountainous areas worldwide (Dorren, 2003; Flageollet and Weber, 1996; Mackey and Quigley, 2014; Pellicani et al., 2016; Strunden et al., 2015; Whalley, 1984). In this process, a fragment of rock detaches from a rocky mass along a pre-existing discontinuity (e.g., bedding, fractures), slides, topples or falls along a vertical or nearly vertical cliff. Individual fragments travel downslope by bouncing and flying or by rolling on talus or debris slopes (Crosta and Agliardi, 2004; Cruden and Varnes, 1996; Varnes, 1978; Whalley, 1984; Wei et al., 2014). The rock fragments travel at speeds of a few to tens of meters per second, and range in volume up to thousands of cubic meters. Different mechanisms are known to trigger rockfalls: earthquakes (Kobayashi et al., 1990; Vidrih et al., 2001), rainfall, and freeze-and-thaw cycles (Wieczorek and Jäger, 1996; D'amato et al., 2016). Due to their high mobility, and despite their sometimes small size, rockfalls are particularly destructive mass movements, and in several areas they represent a primary cause of landslide fatalities (Evans and Hungr, 1993; Evans, 1997; Guzzetti, 2000; Keefer, 2002; Guzzetti et al., 2003, 2005; Badoux et al., 2016). In mountainous areas human life and property are subject to rockfall hazard (Crosta and Agliardi, 2004) and efforts are made to mitigate the hazard. Mitigation measures for rockfall damage are primarily based on hazard assessment, which integrates all available data to map and scale the hazard (e.g., Guzzetti et al., 2003). The spatial extent of the hazard in many cases can be resolved using field observations of documented historical rockfalls (Wieczorek and Jäger, 1996) and computer modeled trajectories (Dorren, 2003, and references therein). The temporal aspect of hazard and the triggering mechanism usually rely on historical reports, but rarely on direct dating of past rockfall events (e.g., De Biagi et al., 2017; Kanari, 2008; Rinat et al., 2014). However, hazard estimation where no historical documentation of past rockfalls exists (hence no documentation of either the spatial or temporal extents), nor any knowledge of the triggering mechanism, such as the case presented here, is rare or missing in literature.
The current study evaluates the rockfall hazard for the town of Qiryat Shemona (northern Israel), by (a) studying the extent and nature of past rockfall events using field observation and (b) constraining the date of the rockfall events and their reoccurrence interval using optically stimulated luminescence (OSL) dating (Wintle, 2008). The possible temporal relation to known historical earthquakes, which might serve as a trigger, is also studied, by (c) computer modeling the most probable downslope rockfall trajectories which outline the hazard-prone area. Particular attention is given to the calibration of the computer modeling using mapping of past rockfall events and extracting geometrical and mechanical parameters needed for the simulations from the field observations. This study presents a methodology for rockfall hazard estimation where field evidence for past rockfalls is observed in the town vicinity, but the triggering mechanism, the timing of past rockfall events and recurrence intervals are entirely unknown.

Figure 1(a) Location map of the study area detailing the major fault segments of the DST (Ro: Roum; Y: Yammuneh; H: Hatsbaya; Ra: Rashaya; S: Serghaya). Inset shows the plate tectonic setting of the DST. (b) Orthophoto map of the study area (black rectangle). The rockfall source, the Ein El Assad Formation (EEA), is marked by a blue line and the town border by a red dashed line. The yellow rectangle marks the location of block 016 shown in Fig. 2.
The town of Qiryat Shemona (population 25 000) is located in the northern Hula Valley (Fig. 1), one of a series of extensional basins developed along the active left lateral fault system of the Dead Sea Transform (DST) (Freund, 1965; Garfunkel, 1981; Quennell, 1958). The town is built at the foot of the fault-controlled Ramim escarpment, which rises 800 m above the west part of the town. New quarters of the town are being planned and built below the escarpment and up the slopes above the town. These slopes are dotted with cliff-derived boulders with measured volumes of more than 100 m3, which have apparently traveled down the slope to their current locations (Fig. 2). Aerial photos predating the town establishment (dated ∼1945) reveal additional rock blocks with similarly estimated volume range within the now built town premises. Thus, the field observations and aerial photo interpretation suggest that the western neighborhoods of Qiryat Shemona, located at the escarpment base, are subjected to rockfall hazard.
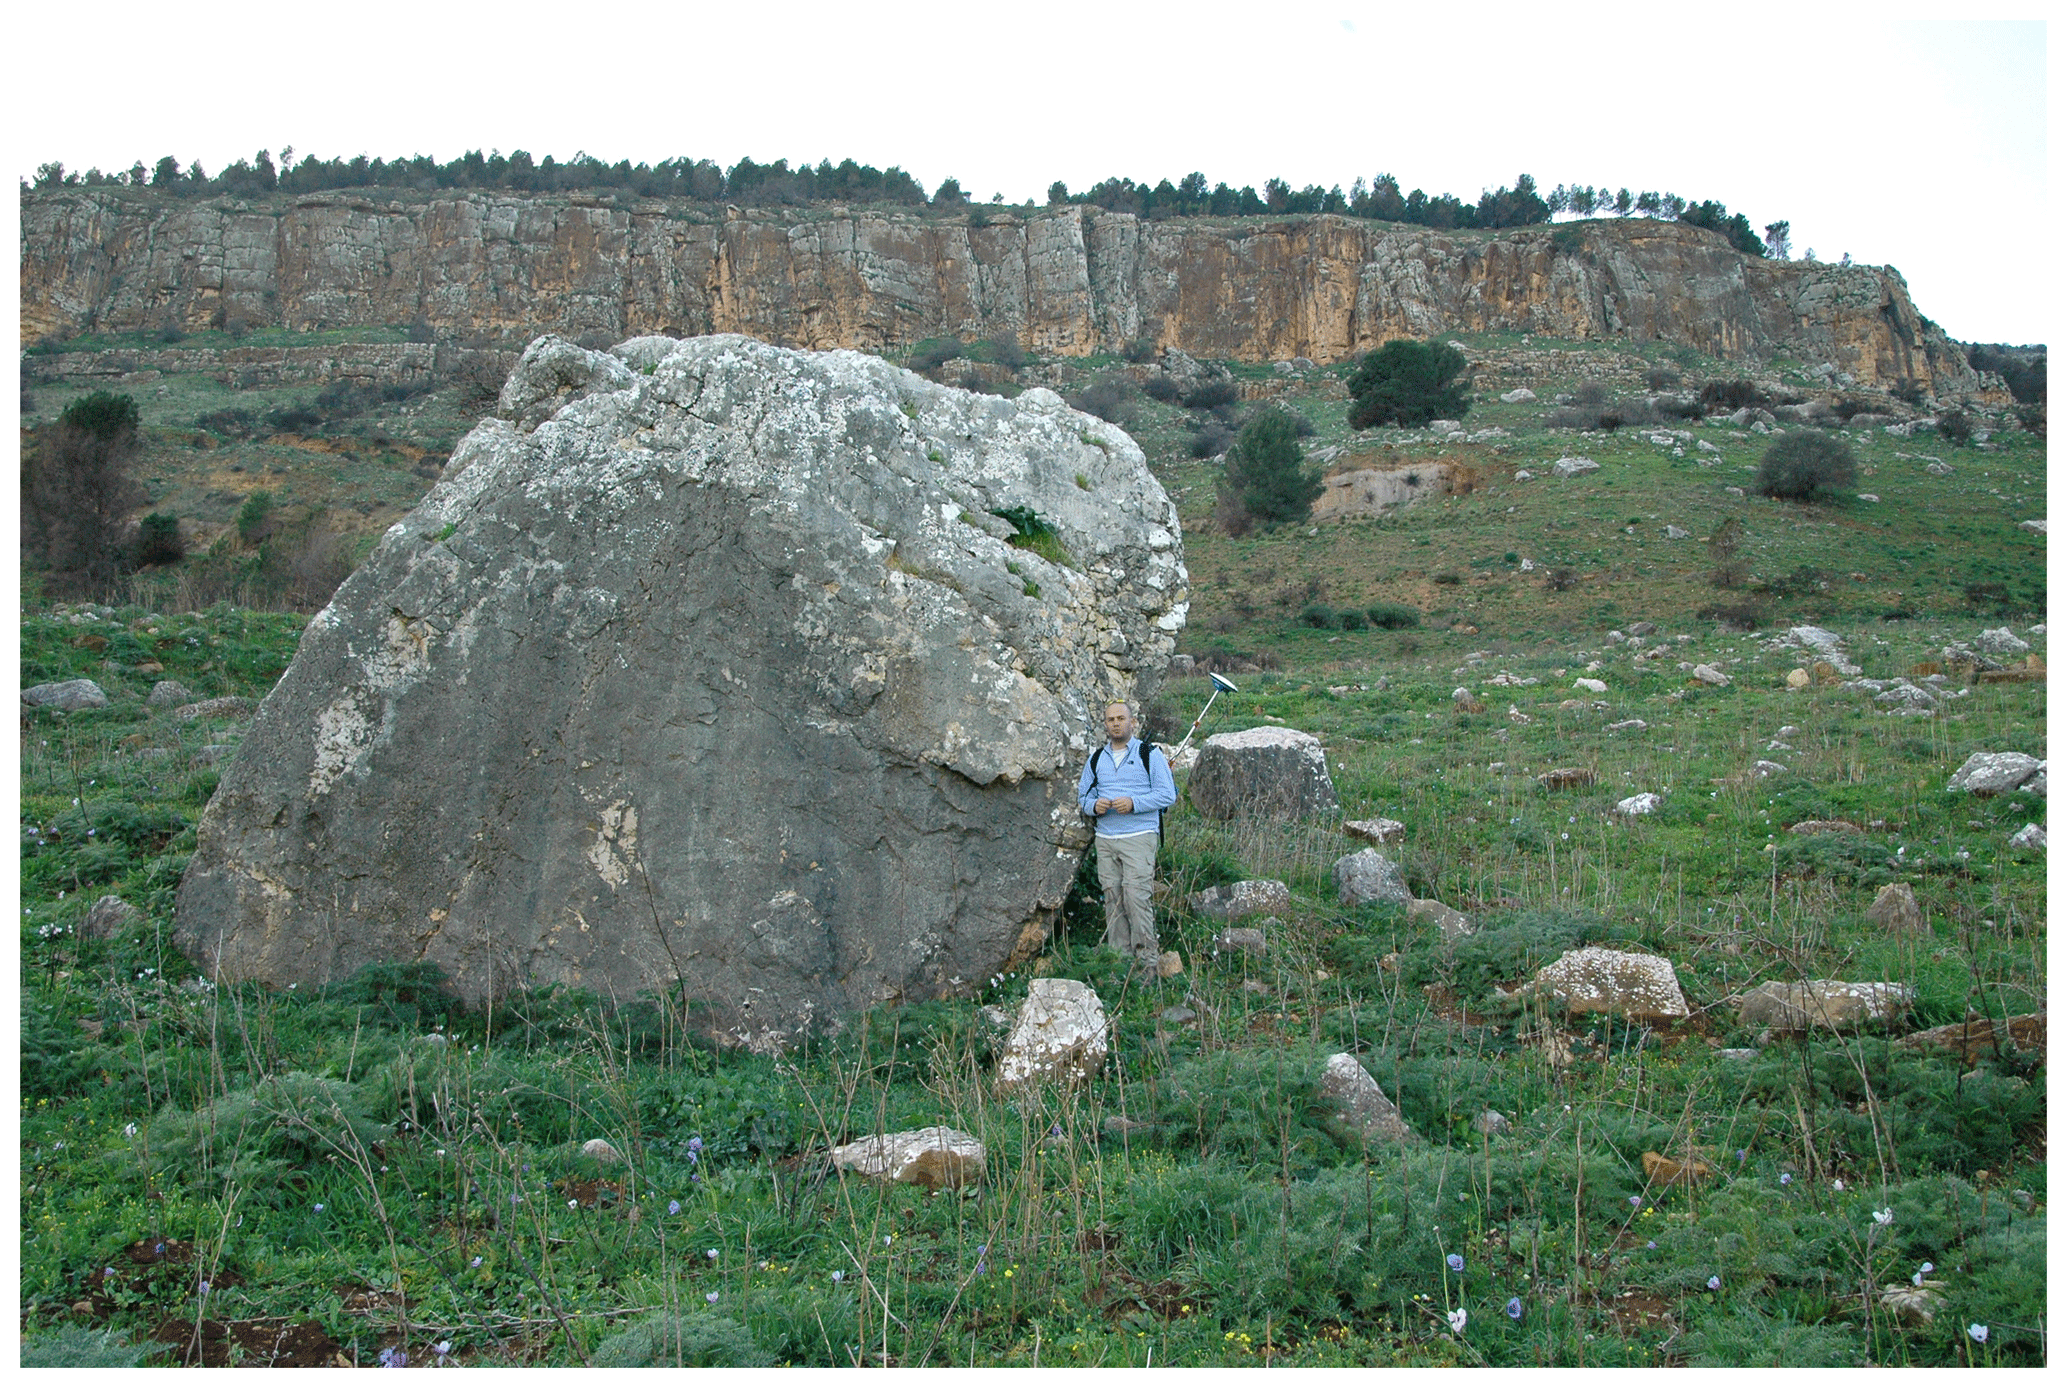
Figure 2The source for rockfalls, the cliff of the Ein El Assad Formation, at the back and a rock block at its stop site. This large boulder, ∼41 m3, is block no. 016 (Table 3), under which sample QS-11 for OSL age determination was excavated. Photo taken from east to west showing the source of rockfall in the background. The location of the block in the photo is plotted as a yellow rectangle in Fig. 1.
The rock sequence outcrops in the lower part of the slopes, west of the town (hereafter “the study area”; Fig. 1b), consist of Lower Cretaceous rocks (Glikson, 1966; Kafri, 1991). The sandstone of the Hatira Formation outcrops at the base of the slope, overlain by limestone and marl of the Nabi Said Formation. Further upslope, about 350 m above the town, outcrops the biomicritic limestone of the Ein El Assad Formation, creating a 40 m high subvertical cliff (Fig. 2). This cliff is the source for rockfalls in the study area (see below). The Ein El Assad Formation is overlaid by ∼700 m of Lower to Upper Cretaceous carbonate rocks (Sneh and Weinberger, 2003a, b). Colluvium and rock mass movement deposits were mapped on the slopes near Qiryat Shemona (Shtober-Zisu, 2006; Sneh and Weinberger, 2003a), identifying the blocks on the slope as originating from the Ein El Assad Formation. The slopes are generally covered with up to a few meters of soil. The studied area is located along a primary fault zone of the DST (Weinberger et al., 2009).
Large historic and prehistoric earthquakes (M>6.5) along the DST are well documented: Ben-Menahem (1991), Amiran et al. (1994), Guidoboni et al. (1994), Guidoboni and Comastri (2005), Marco et al. (2003, 2005, 1996), Katz et al. (2010) and Wechsler et al. (2014). Recurrence intervals for Mw=6.5 and Mw=7.0 earthquakes were calculated to 800 and 3000 years (Begin, 2005), while another study suggests that the average recurrence interval for a large earthquake (M≥6.5) in this segment of the DST is ∼1500 years (Hamiel et al., 2009). Some of the significant historical earthquakes induced slope failures (Katz and Crouvi, 2007; Wechsler et al., 2009; Yagoda-Biran et al., 2010).

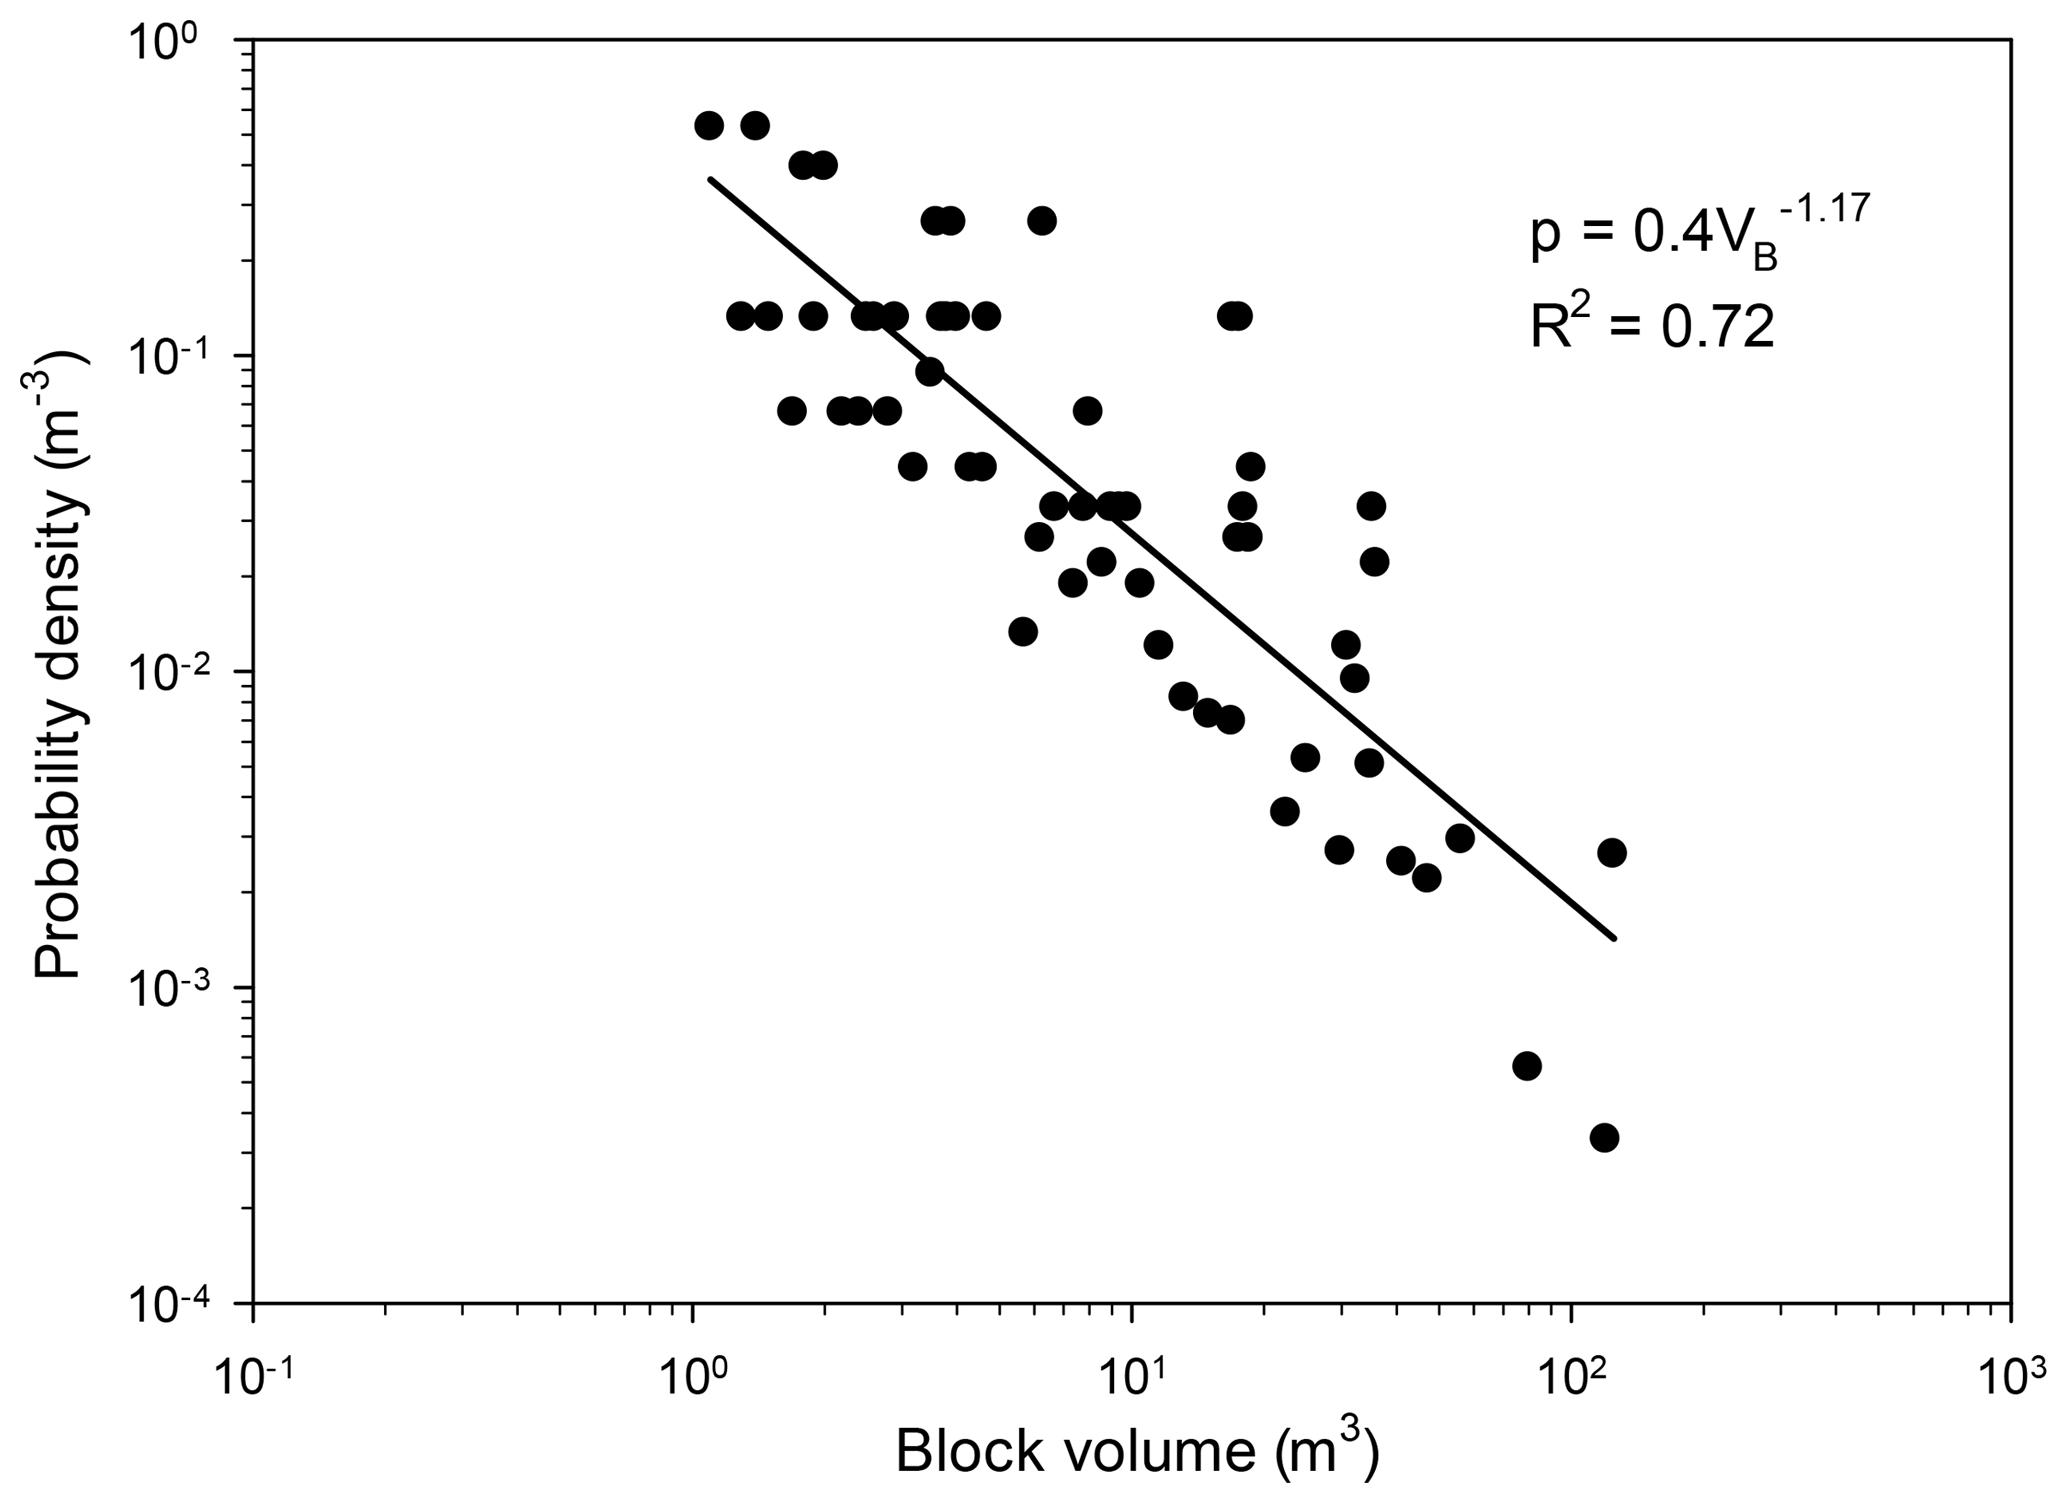
Figure 3(a) Map of fallen rock blocks in the studied area. Green rectangles are the 76 blocks mapped in the field within the area marked by the green outline; these blocks were used to calculate the block volume distribution (probability density function, PDF) detailed in Fig. 6; yellow rectangles are 200 blocks mapped using aerial photos within the area marked by the black rectangle; blocks sampled for OSL age determination are marked as red circles. Size of rectangles denotes block diameter bins; see legend. Pink lines represent slope profiles used for CRSP calibration simulations. (b) Histogram of the block volumes for the 76 boulders measured in the field (marked as green rectangles in the map).
3.1 Rock-block inventory
In a given site, the size distribution of boulders resulting from past local rockfalls (recent or historical) is the best database for assessing predicted rockfall block size. Thus mapping the blocks is crucial for hazard analysis, as suggested by previous studies that required estimations or measurements of the number of blocks and their volumes (Brunetti et al., 2009; Dussauge-Peisser et al., 2002; Dussauge et al., 2003; Guzzetti et al., 2003; Malamud et al., 2004; Katz and Aharonov, 2006; Katz et al., 2011). In this study, a catalog of the past-rockfall-derived boulders was constructed from two data sources: 76 blocks were mapped and measured in the field with volumes varying between 1 and 125 m3 (green rectangles in Fig. 3a; their volume–frequency histogram is in Fig. 3b). An additional 200 blocks were mapped using pre-town aerial photos (dating to 1946 and 1951; yellow rectangles in Fig. 3a). A total of 58 out of the 200 blocks mapped using the aerial photos were identified and measured in the field as well. These blocks were used to fit a correlation curve between field-measured and aerial-photo-estimated block volumes. The correlation was used for volume estimation of the blocks that were removed from the area during the construction of the town but were mapped on the aerial photos predating the establishment (142 blocks out of 200). In summary, the catalog hosts a total of 218 boulders, which were mapped and their volumes were measured or estimated from aerial photos. This rock-block inventory is the basis for the prediction of probabilities for different block sizes for the calculation of rockfall hazard and its mitigation.
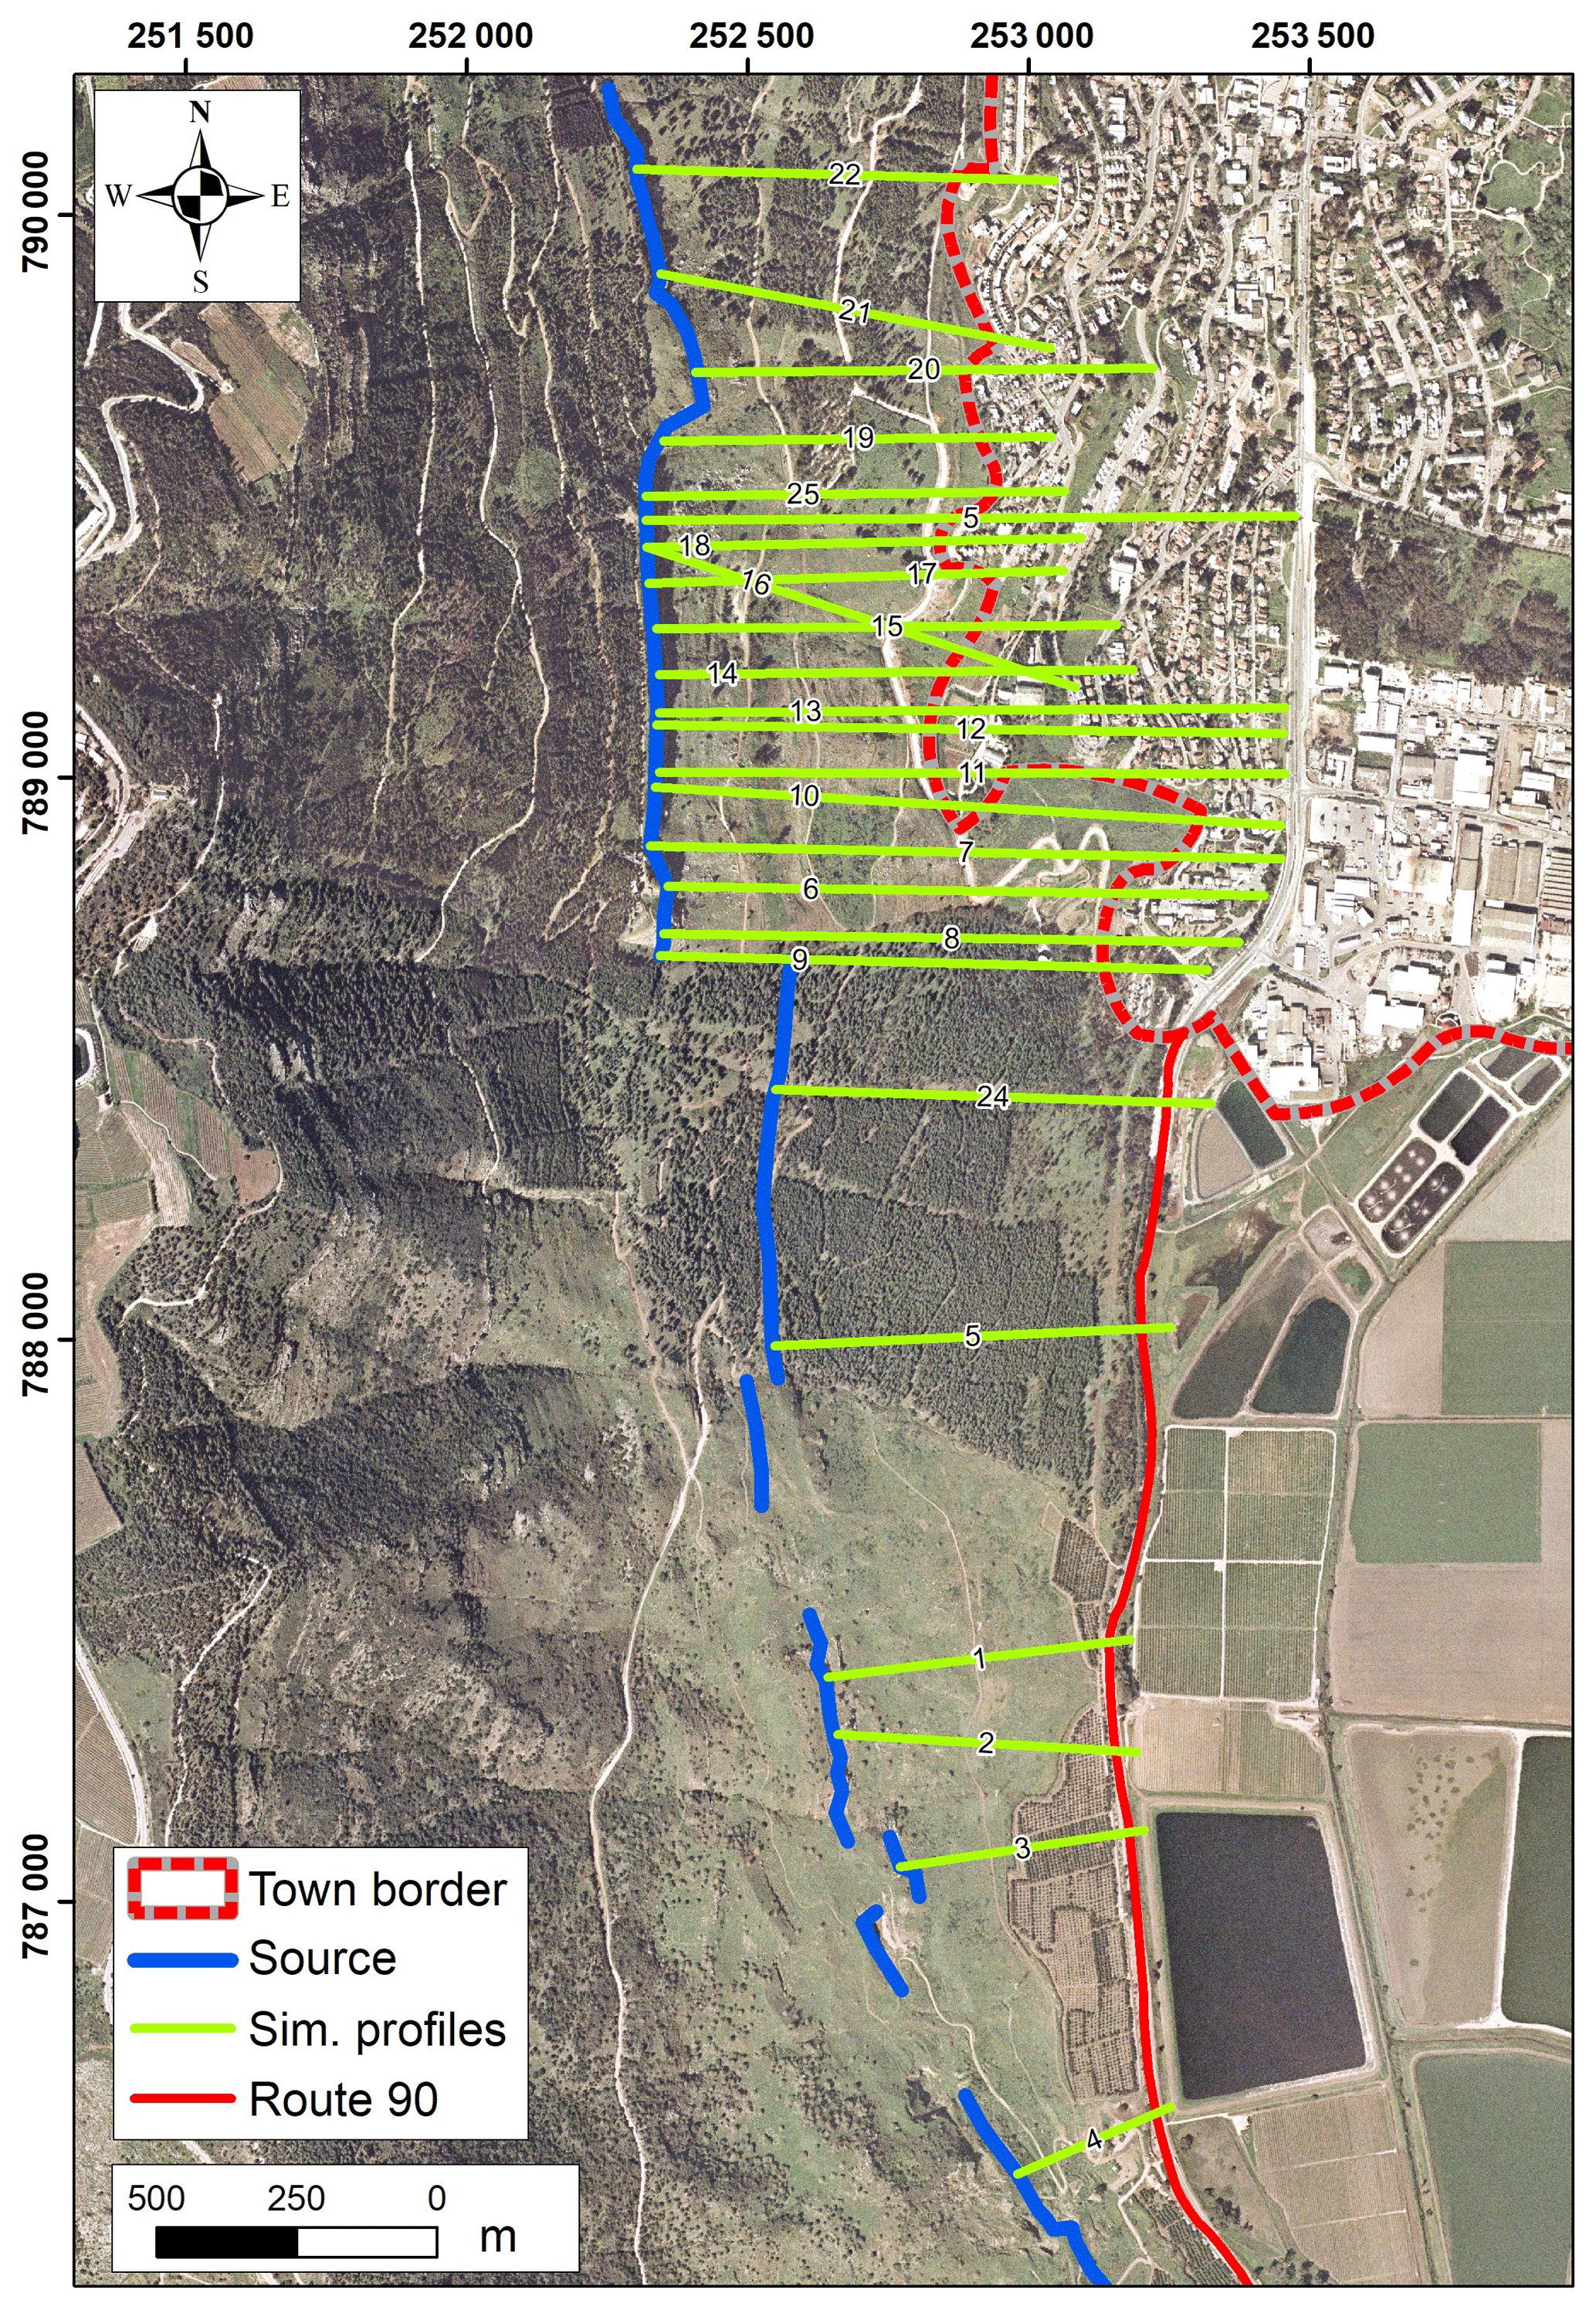
Figure 4Location of 25 simulation profiles of rockfall trajectories. Fault traces are from Sneh and Weinberger (2003a). The source for the rockfalls (Ein El Assad Formation) is marked with the blue line.
3.2 Rockfall simulations
The downslope trajectory of a rock block (or the energy dissipated as it travels) is affected by the geometry and physical properties of the slope and the detached blocks (Agliardi and Crosta, 2003; Guzzetti et al., 2002, 2004, 2003; Jones et al., 2000; Pfeiffer and Bowen, 1989; Ritchie, 1963). Parameters that quantify these measures are used as input for computer simulation of rockfall trajectories. Several computer programs have been developed and tested to simulate rockfall trajectories (Guzzetti et al., 2002; Dorren, 2003 and references therein; Giani et al., 2004). The current study uses the 2-D Colorado Rockfall Simulation Program, CRSP, v4 (Jones et al., 2000) to analyze two significant aspects of rockfall hazard in the studied area. First, the expected travel distance of rock blocks along the studied slopes, which signifies the urban area prone to rockfall hazard is analyzed. Second, the statistical distributions of block travel velocities and kinetic energy, which serve as an input for engineering hazard reduction measures, is analyzed. For the current analysis the model input parameters are the topographic profile of the slope (extracted from 5 m elevation contour GIS database and verified in the field), surface roughness (S), slope rebound and friction characteristics (Rn: normal coefficient of restitution; Rt: tangential coefficient of frictional resistance), and block morphology. S was measured in the field according to Jones et al. (2000) and Pfeiffer and Bowen (1989), where Rn and Rt were estimated via a calibration process (see below).
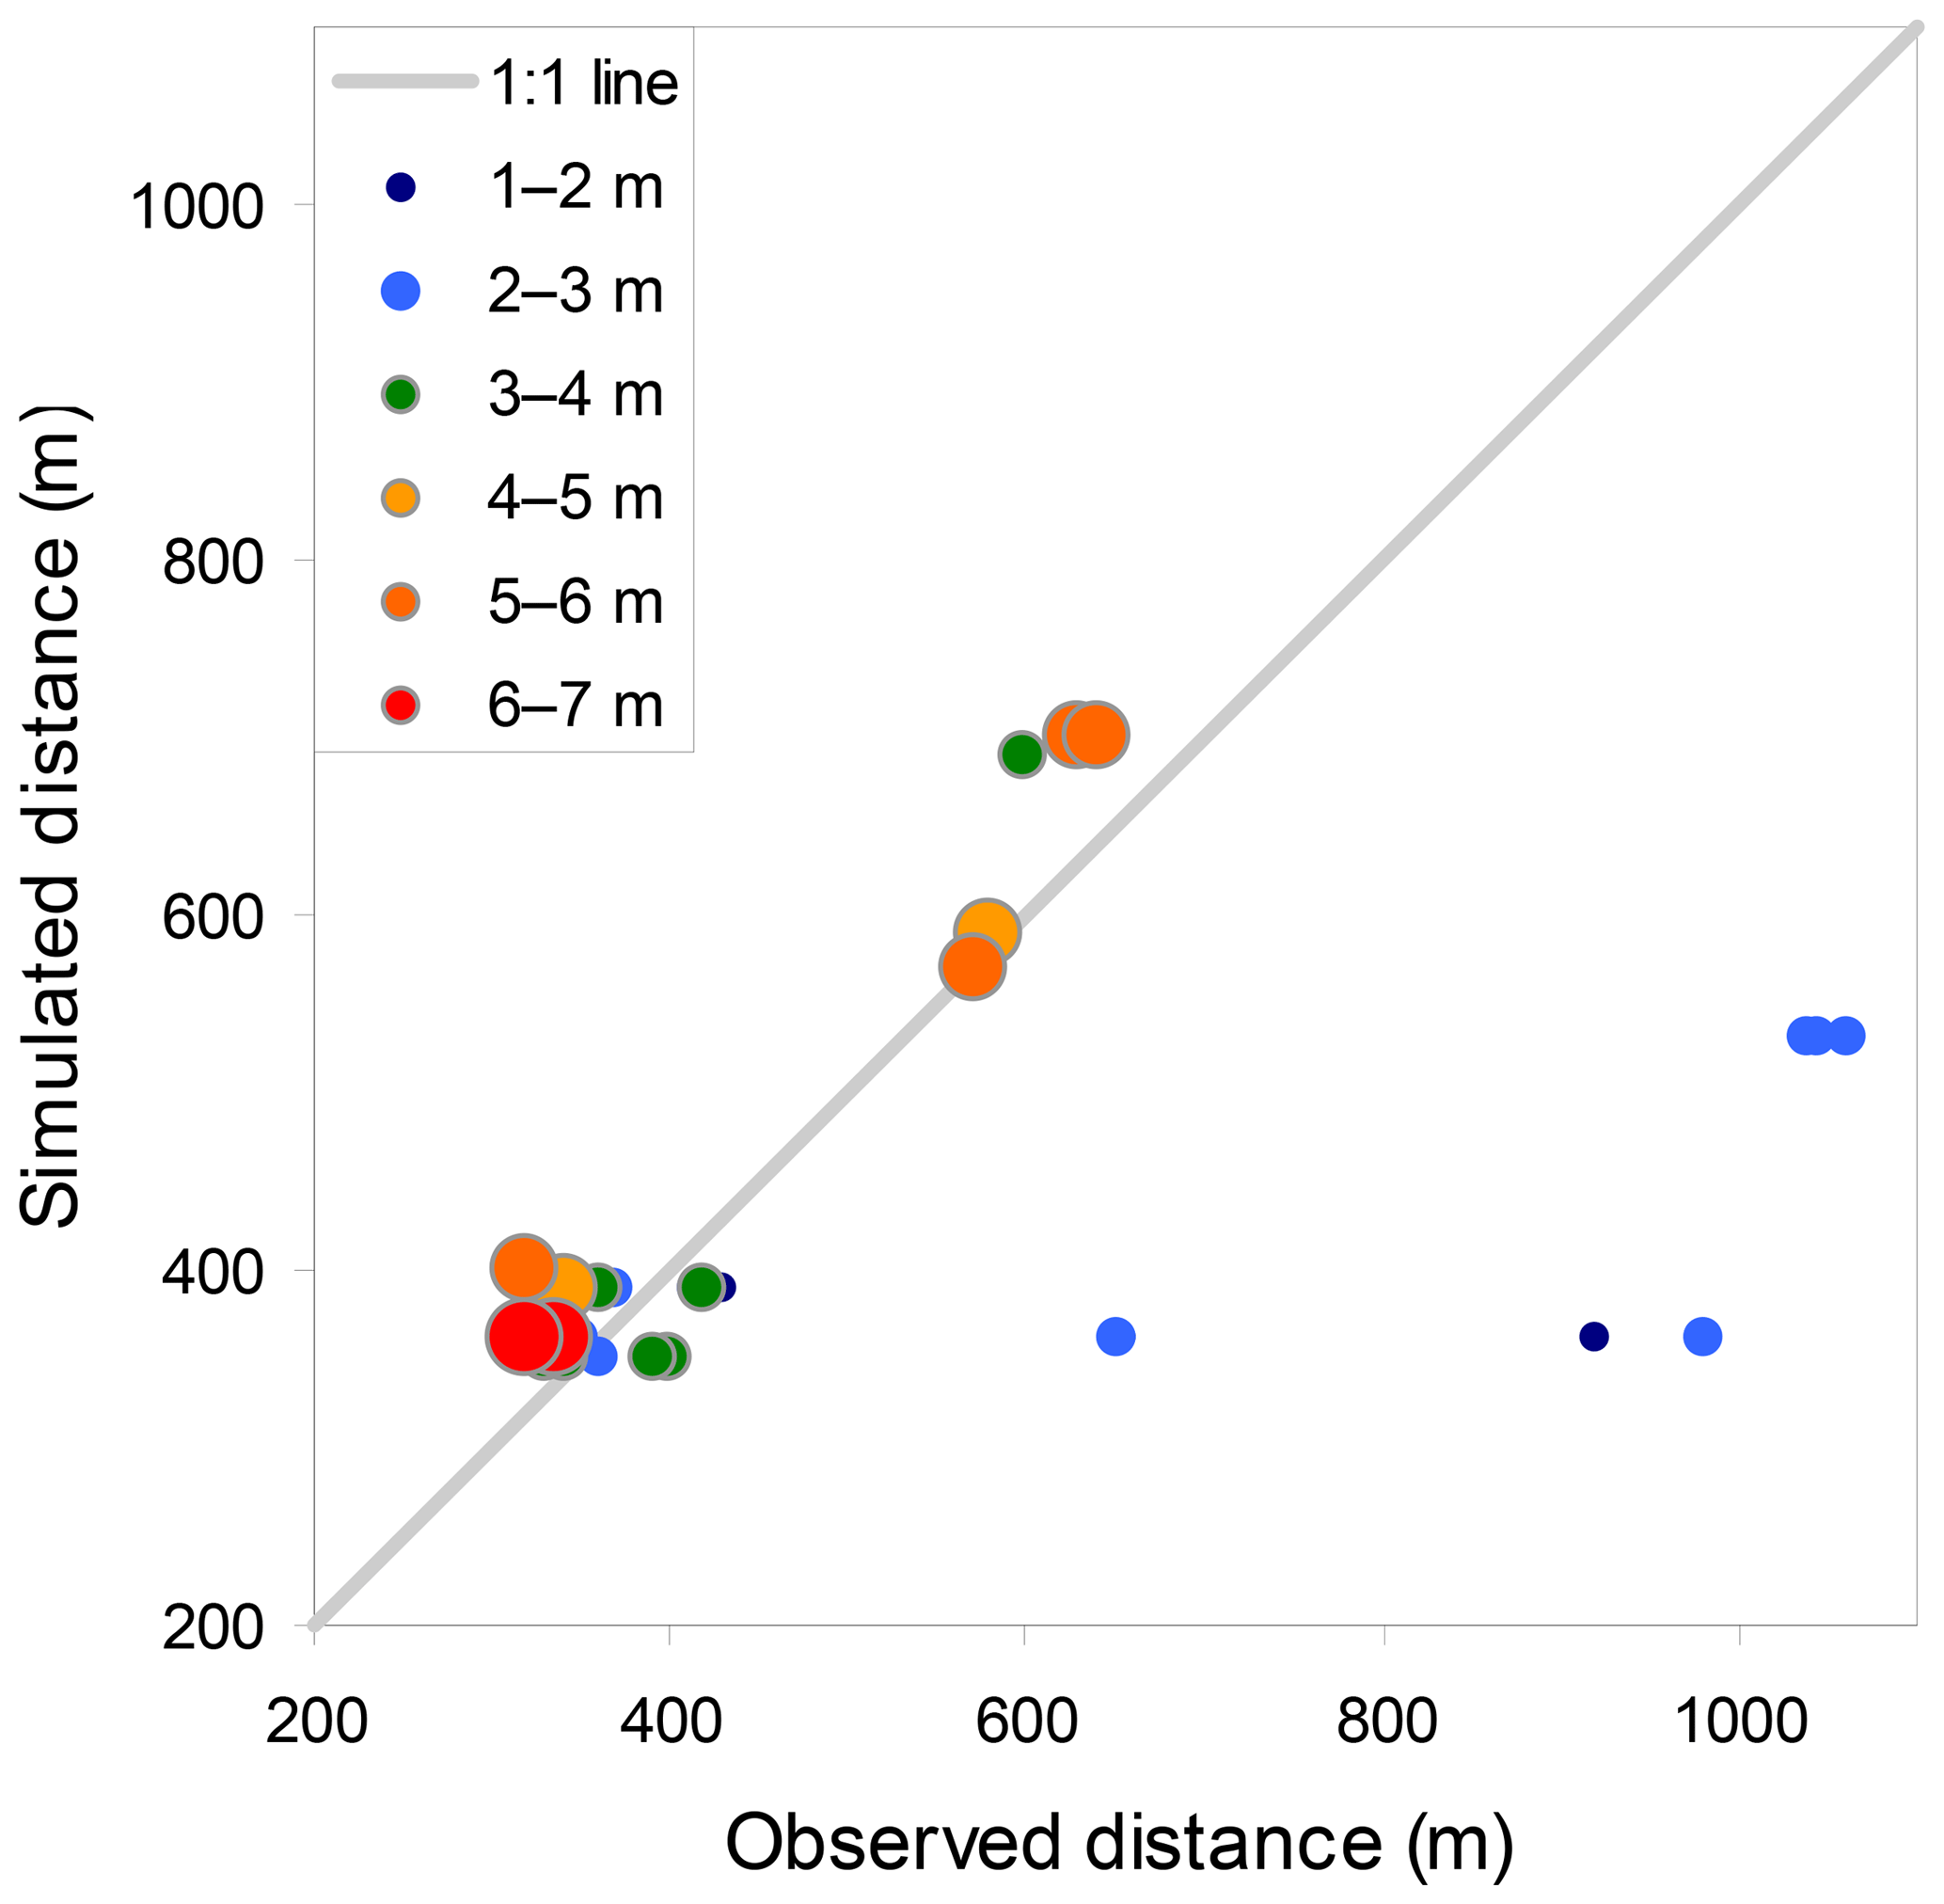
Figure 5Field-observed distance from the source and maximal simulated travel distances of rock blocks. Block diameters are both size- and color-coded. The 1:1 line (x=y) is plotted in gray.
The CRSP algorithm simulates rockfall as a series of rock-block bounces, and calculates the changes in the block velocity after each impact with the slope surface, taking into consideration the rock and slope geometric and mechanical properties. Model output is a statistical distribution of velocity, kinetic energy and bounce height along the downslope trajectory, including stopping distances of the blocks (Jones et al., 2000). The slope surface in CRSP is divided into slope cells, whose boundaries are defined where the slope angle changes, or where the slope roughness changes (Jones et al., 2000).
For the current study, we simulated the rockfall characteristics along topographic profiles extending from the Ein El Assad Formation, identified as the source for the rockfalls, downslope towards the town. A total of 25 topographic profiles covering the study area were extracted for the rockfall hazard analysis (Fig. 4), with high spatial density (30–100 m intervals) where the source for rock blocks is exposed above the town and lower spatial density (150–500 m intervals) further southwards. A single simulation run (along each profile) modeled 100 rock blocks, thus allowing the statistical analysis (Jones et al., 2000). CRSP results for each profile were later integrated spatially to compile rockfall hazard maps and other hazard properties as detailed below. The simulated block volumes were binned into size scales of 1, 10, 50, 100 and 125 m3, with corresponding block diameters of 1.3, 2.7, 4.6, 5.8 and 6.2 m, respectively (assuming spherical block geometry).
3.3 CRSP calibration
The first step in hazard analysis using a computerized model is calibration of the model input parameter. Following Katz et al. (2011), calibration was performed by comparing calculated traveling distance of rock blocks of a given size to field-observed ones, while adjusting the assigned model parameters until the best fit was obtained, i.e., back analysis.
In the current work, CRSP calibration using back analysis was performed along four slopes (pink lines in Fig. 3) located at the north and south parts of the prominent Ein El Assad source outcrop, where a relatively high number of field-mapped (50 blocks out of 76) and aerial-photo-mapped rock blocks (65 blocks out of 200) were observed. As an index for calibration quality, we used the difference between the field-observed downslope maximal travel distance along a selected slope and the simulated maximal travel distance along this slope (hereafter ΔMD in meters), for a given block size bin. We considered the model parameters as calibrated when ΔMD = ±60 m (about 10 % of average profile length). A total of 80 simulation runs, modeling the largest blocks with diameters (D) of 5.8 and 6.2 m along the four profiles, were used for calibration (determined S value is 0.5 for D=5.8 and 6.2 m). These simulations resulted in the following coefficient value ranges: Rn=0.2–0.25; Rt=0.7–0.8, which are in agreement with suggested values for bedrock or firm soil slopes according to Jones et al. (2000). These values were further revised and refined following the initial velocity sensitivity analysis (detailed in the following).
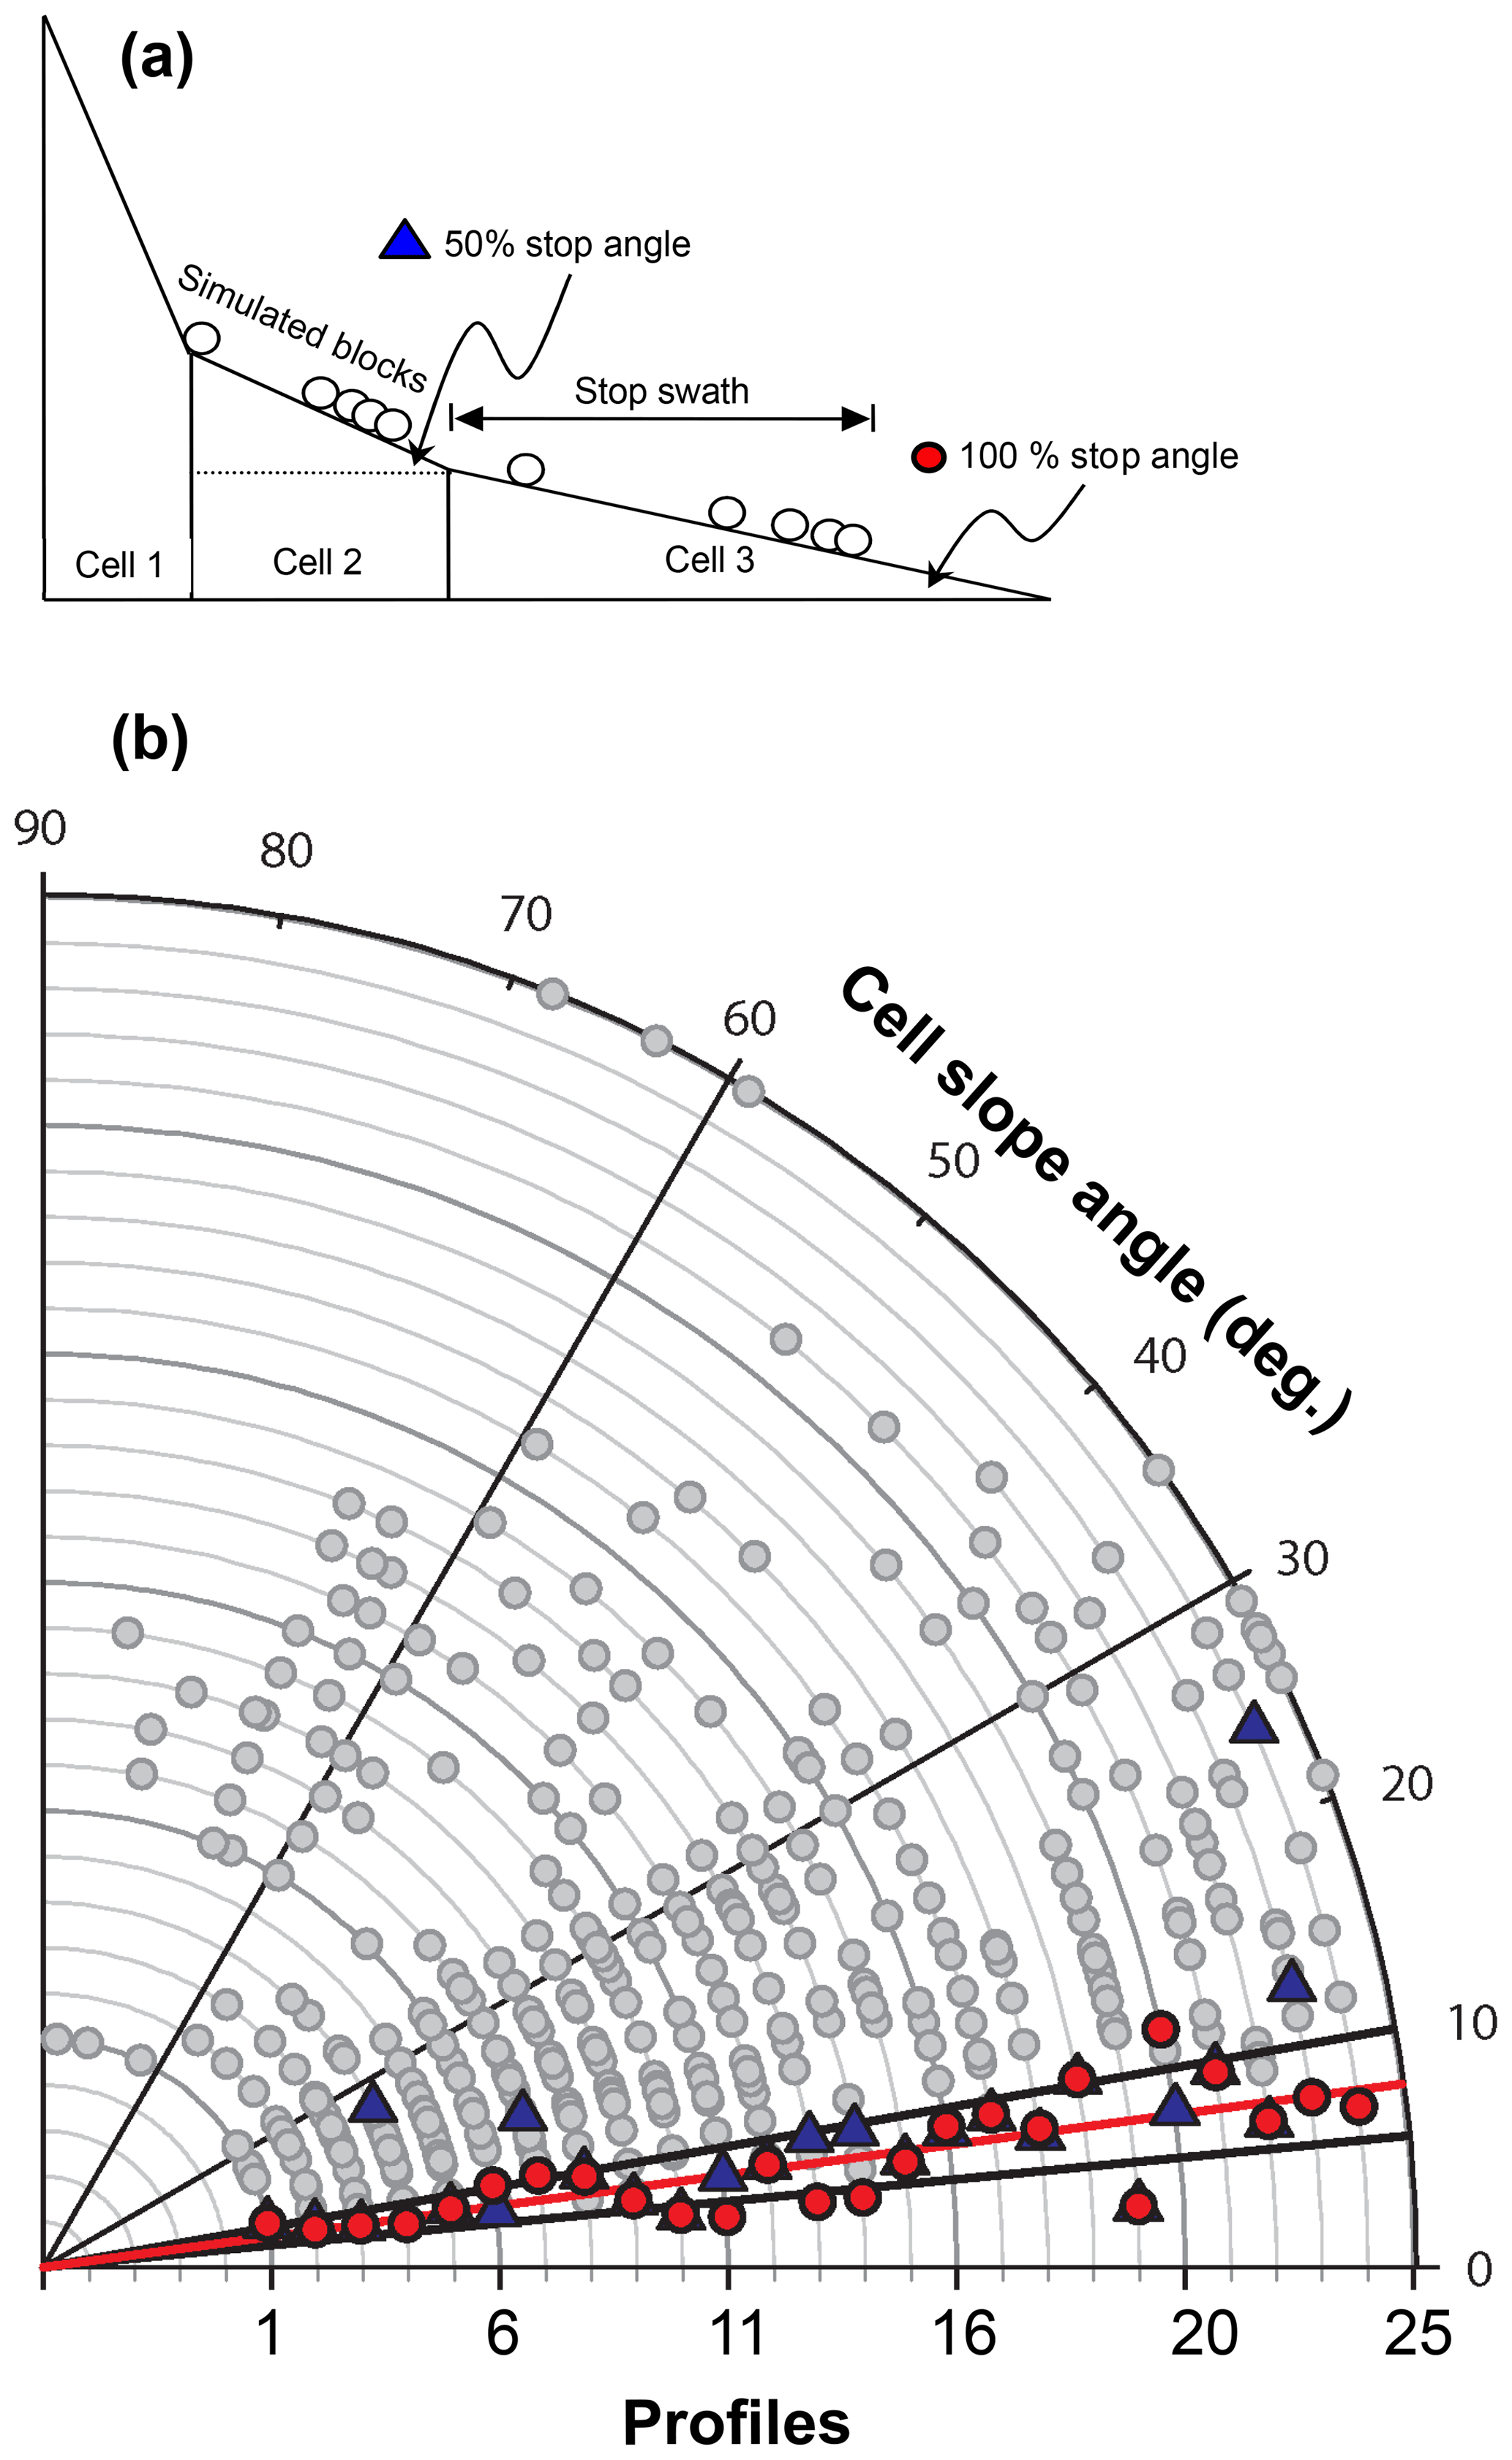
Figure 7(a) Schematic illustration of the CRSP-modeled slope cells and explanation of the terms “x % stop angle” (e.g., 50 % stop angle is the angle of the slope cell where 50 % of the blocks stop) and “stop swath” (the farthest distance along the slope where 100 % of the blocks stop). (b) Slope gradients of slope cells and gradients at stop angles. Tangential axes (x and y axes) denote simulated profile numbers 1 to 25. Radial axis denotes the slope angles. Gradients for all cells per profile are plotted on an arc between 0 and 90 degrees: red circles are 100 % stop angles (slope angle of the profile cell at which cumulated 100 % of simulated blocks stop); blue triangles are 50 % stop angles; gray circles are all other cells in the profile. For example, the cells along profile 16 have slope angles that vary between 8 and 36∘; the 100 % stop angle is 11∘ (red circle) and the 50 % stop angle is 8∘ (blue triangle). The red line represents the mean of all 100 % stop angles for all profiles at 7.7∘ and the thick black lines represent its SD of 2.3∘.
The predicted seismic peak ground acceleration (PGA) for the studied area is 0.26 g (Shapira, 2002). Assuming a PGA of 0.3 g with a frequency (f) of 1 Hz (Scholz, 2002), the calculated initial horizontal velocity (Ux) of the rock block is 3 m s−1 . Sensitivity analysis was performed for two end members of Ux=0 m s−1 (simulating aseismic triggering of a rockfall) and Ux=3 m s−1 (simulating seismic triggering), where Rn=0.12 yielded ΔMD and −80 m for Ux=0 and Ux=3 m s−1, respectively, and Rn=0.25 yielded ΔMD and +150 m for Ux=0 and Ux=3 m s−1, respectively. Thus, we infer that initial velocity has no significant effect on travel distance. An exponential regression curve was fitted for the above Rn values (0.12, 0.2, 0.25) vs. their corresponding ΔMD values (−90, −30, +160 m), which yielded ΔMD =0 m (minimum difference between observed and simulated maximum travel distance) at Rn=0.22. Thus, calibration was determined optimal for Rn=0.22. We estimate that 0.01 change in Rn will yield 15–30 m of change in maximum travel distance. Calibration profiles are 450–750 m, yielding 2 %–3 % variability for 0.01 change in Rn. CRSP output is less sensitive to changes in the tangential coefficient Rt in comparison to changes in the normal coefficient Rn. Hence the Rt value was determined to be 0.70 following our initial calibration value, which is also recommended by Jones et al. (2000) for firm soil slopes.
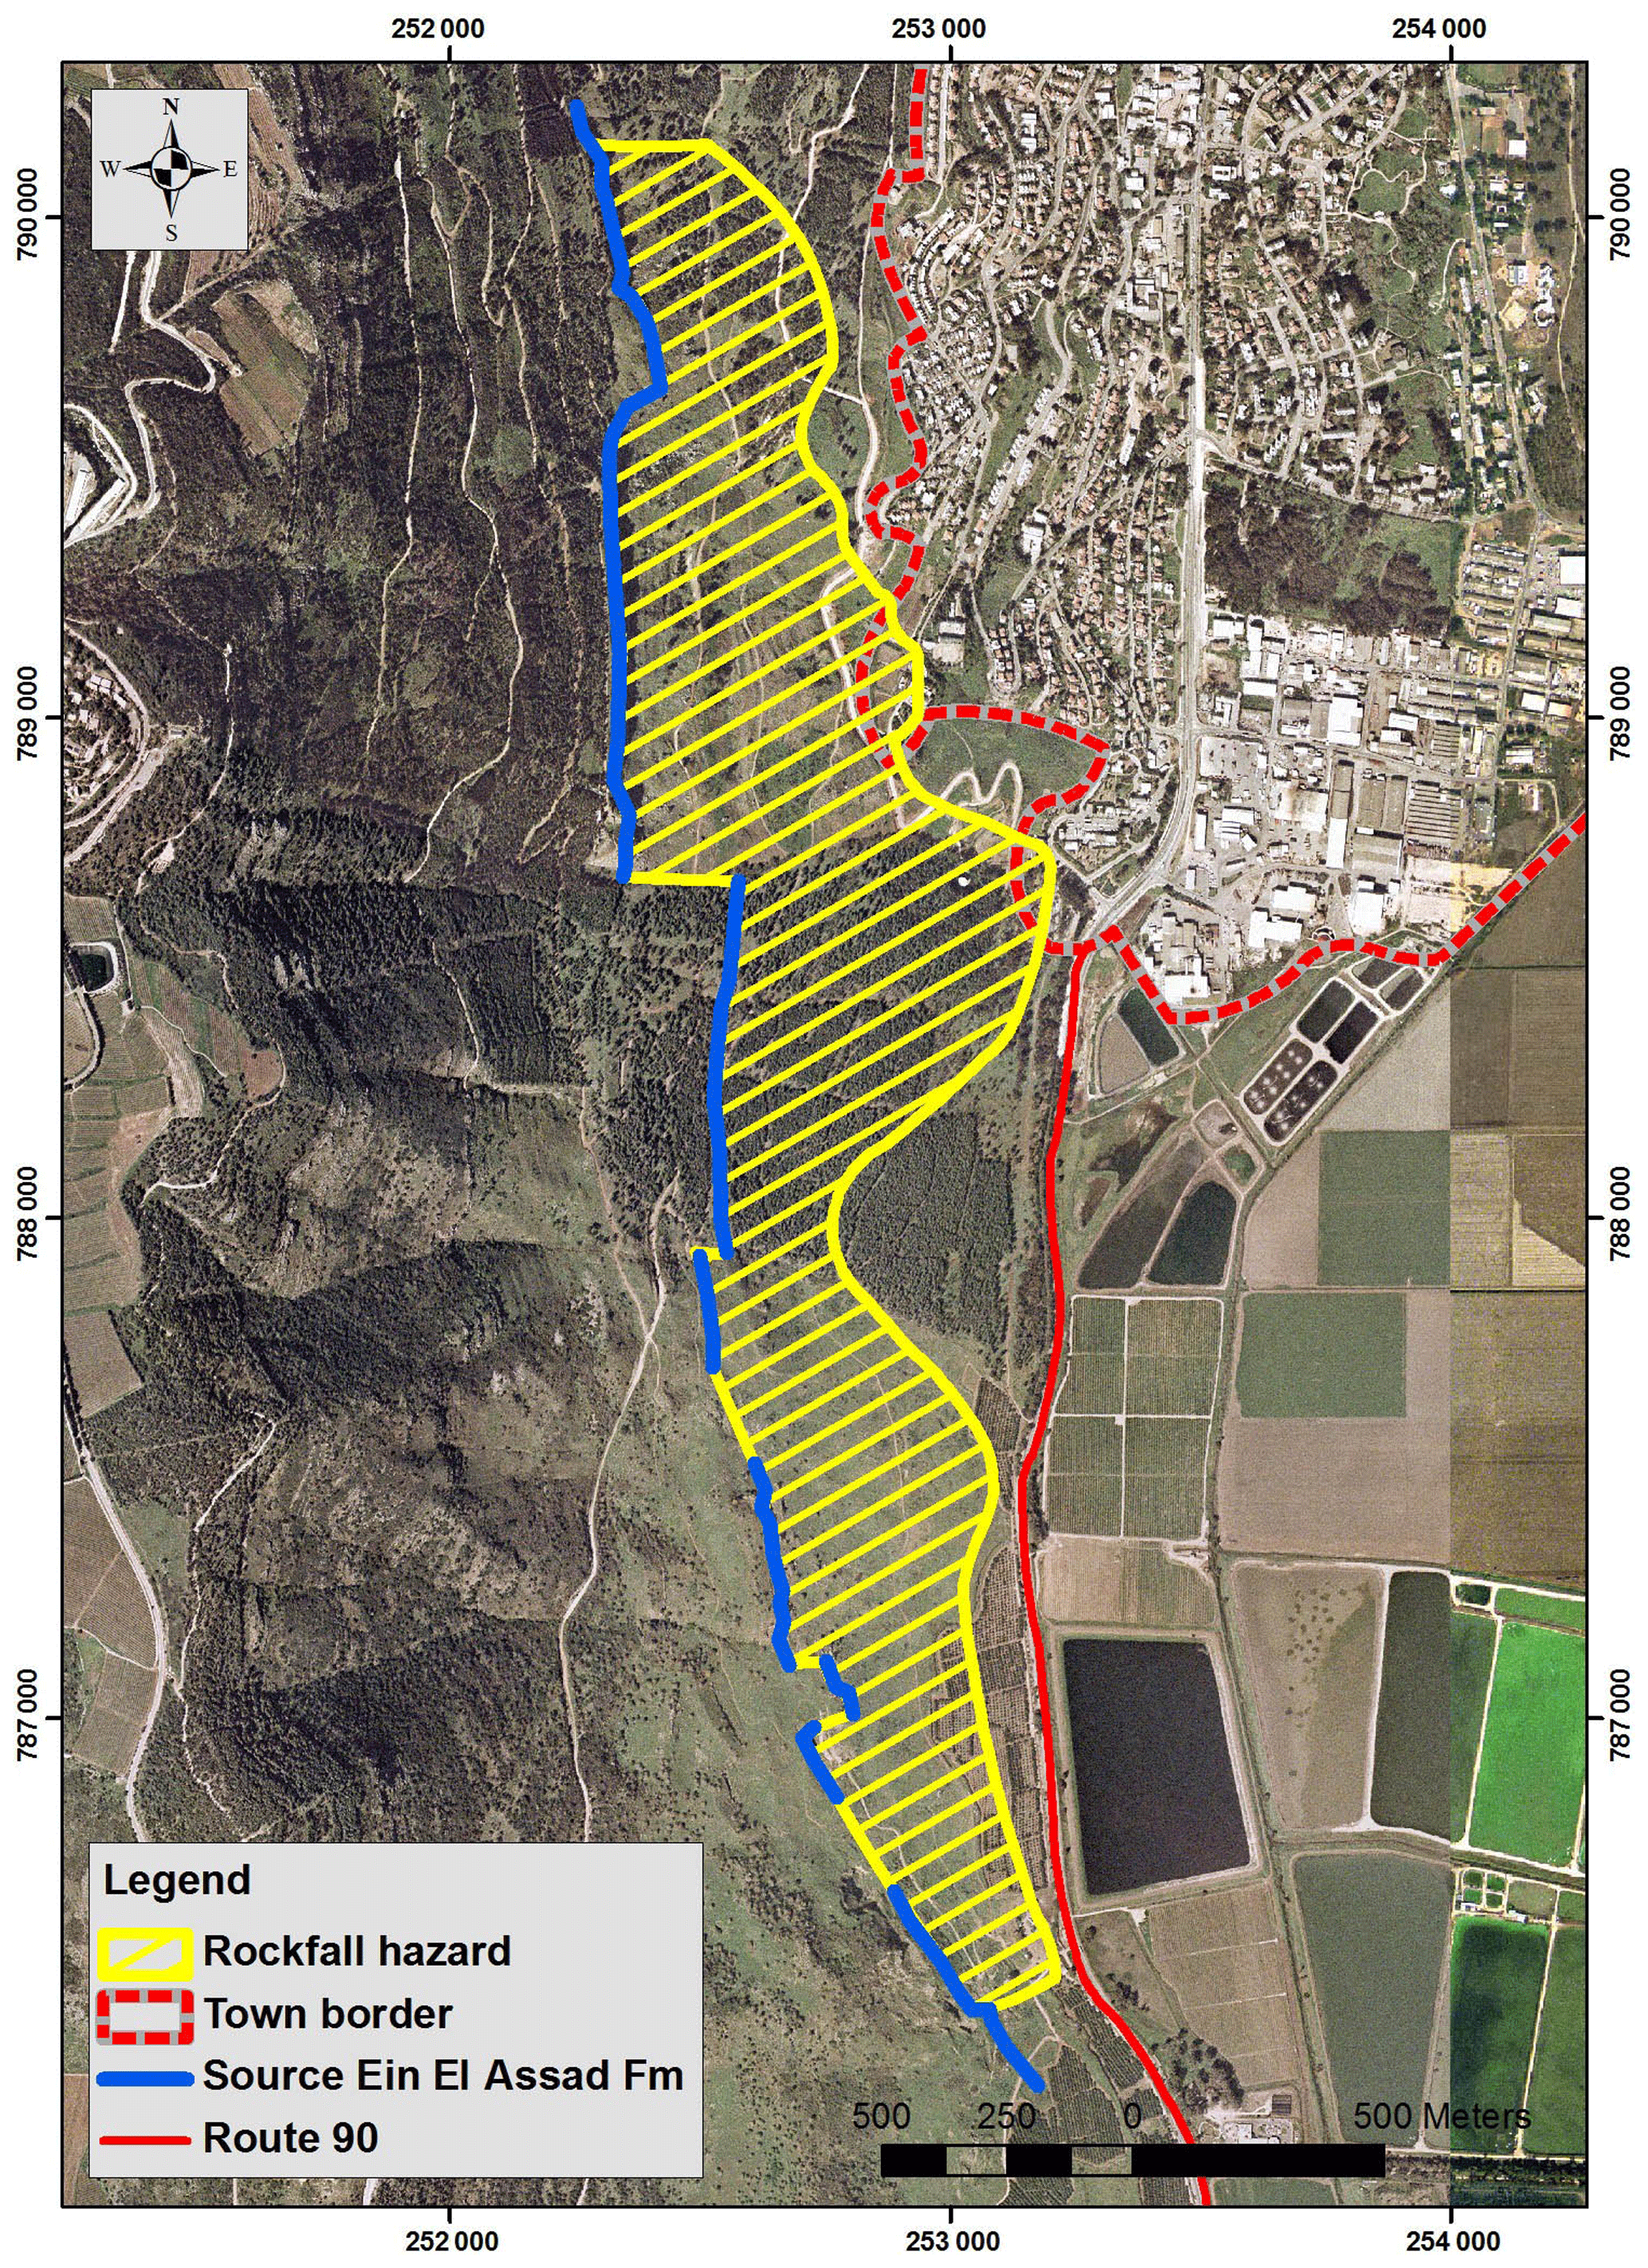
Figure 8Rockfall hazard map of the study area. The area subject to rockfall hazard is defined from the source escarpment to 100 % stop line. Map compiled from maximal travel distance of 25 rockfall simulation profiles performed using CRSP (green lines in Fig. 4).
To validate these coefficients, further simulation runs along the four calibration profiles were performed for all block sizes (D=1.3–6.2 m), using the above-detailed best-fit values Rn=0.22 and Rt=0.70 and the field-measured surface roughness S values S=0.1, 0.3 and 0.4 m for block diameters D=1.3, 2.7 and 4.6 m, respectively, and S=0.5 m for D=5.8 and 6.2 m (all S values were measured in the field per block diameter according to CRSP software manual). All slope cells were given the same values to maintain model simplicity. The travel distances of simulation results were compared with the observed travel distances (from field mapping and aerial photo mapping). The fit between observation and simulation is plotted in Fig. 5. These results can be divided into two behavior patterns: (a) midsize and large blocks (D≥3 m; green, orange and red circles): the observed and simulated results are close to the 1:1 ratio; for large blocks (D≥4 m), simulated travel distance is a little longer, which yields a more conservative result. (b) For small blocks (D<3 m), some blocks are close to the 1:1 ratio, while others demonstrate significantly longer observed travel distances. This longer observed than simulated travel distance of smaller blocks may be explained in a few ways. First, smaller blocks may be more subject to creep, being more affected by water runoff and slope material movement due to their lower weight. Therefore they may travel further down after the rockfall event took place. Another possible interpretation is that the construction of the town has created a different topographical setting than the slope at the time of rockfall events in the past. To circumvent this discrepancy for the hazard analysis, we use only the larger blocks.
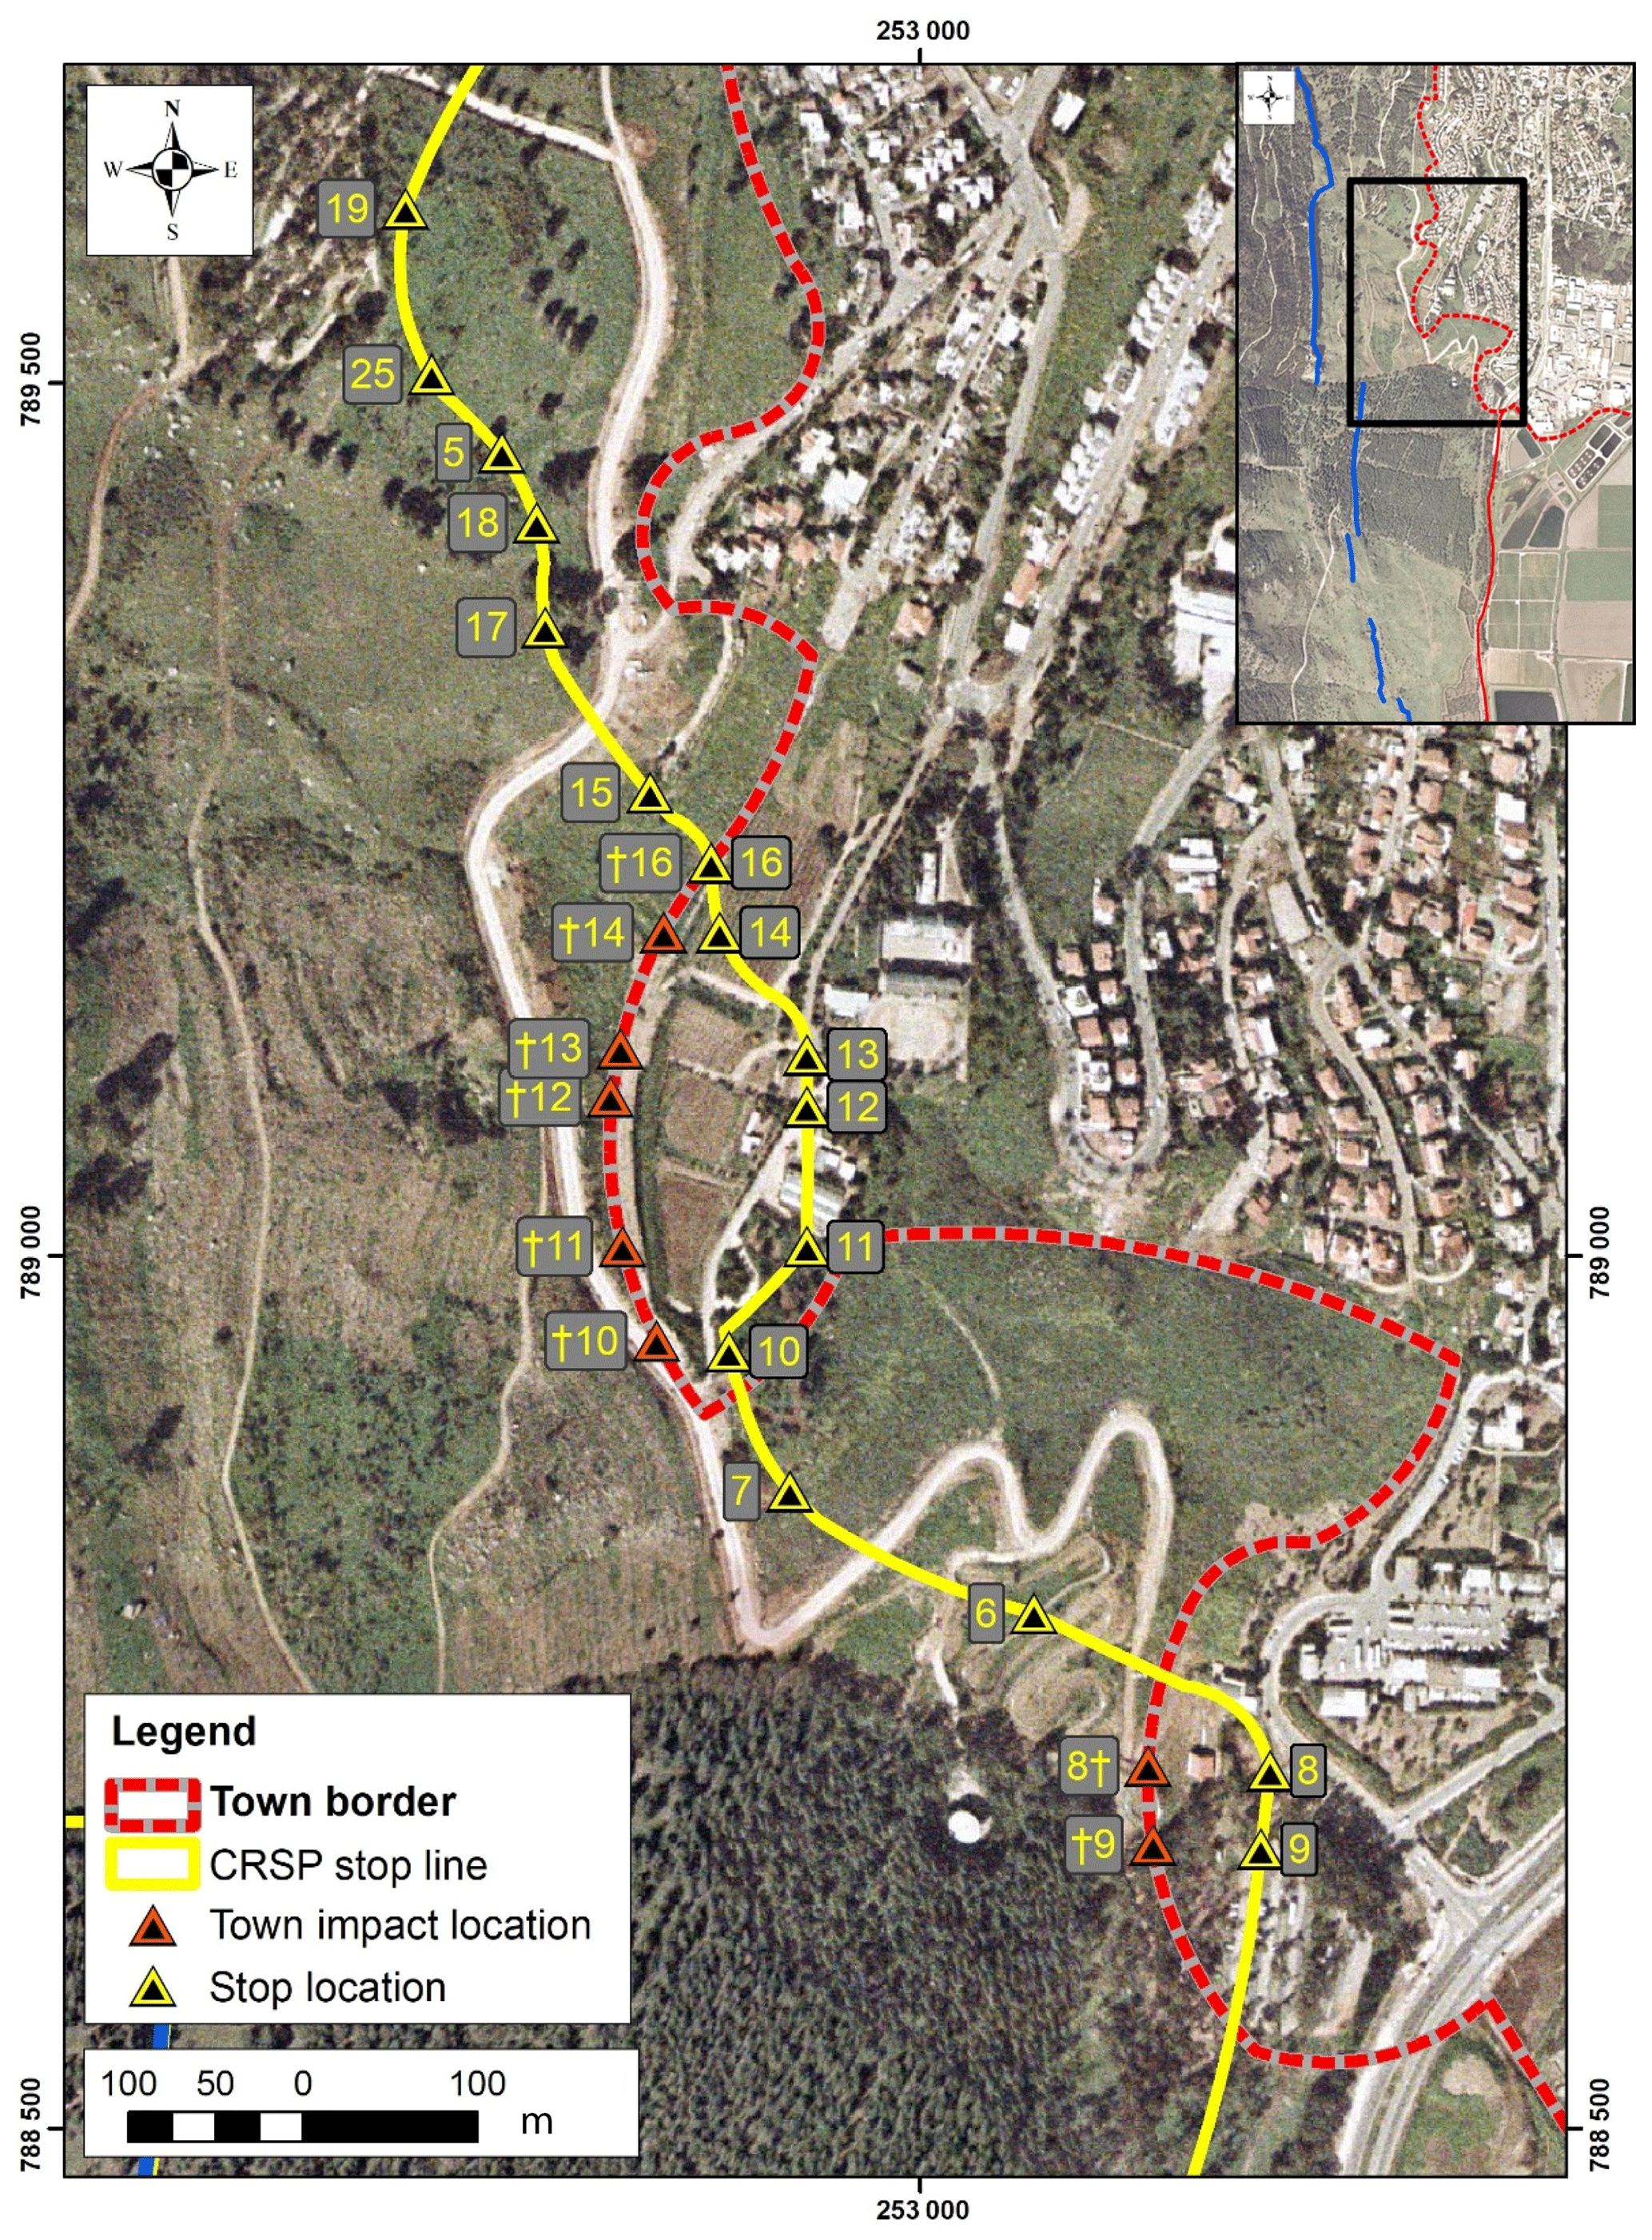
Figure 9Rockfall hazard map for the town of Qiryat Shemona. The yellow line represents the CRSP 100 % stop line calculated for large blocks (D is 5.8 and 6.2 m). Yellow–black hazard triangles mark the simulated stop line and location for each profile. Orange–black hazard triangles mark the simulated town border impact location for each profile; profile numbers in yellow refer to simulated profile numbers; indices with the sword label “†” mark locations of rockfall impact at the town border. Map location is shown in the inset.
Sensitivity analysis for block shape resulted in an insignificant difference between simulations performed with sphere, disc or cylinder rock-block shapes. Accordingly, we used sphere-shaped rock blocks in the prediction simulations because they yield maximum volume for a given radius and thus tend toward a worst-case scenario analysis (Giani et al., 2004; Jones et al., 2000).
3.4 OSL age determinations
For OSL age determinations of rockfall events, colluvium or soil material from immediately underneath the rock blocks was sampled. This approach constrains the time since last exposure to sunlight before burial under the blocks (following Becker and Davenport, 2003). For sampling we excavated a ditch alongside the rock block to reach the contact with the underlying soil using a backhoe, then manually excavated horizontally under the block and sampled the soil below its center. The sampling of soil was performed under a cover to prevent sunlight exposure of the soil samples. A complementary sediment sample was taken from each OSL sample location for dose rate measurements. Locations of sampled blocks are marked in Fig. 3. Rockfall OSL age determination was based on the assumption that the sampled blocks did not creep or move from their initial falling location. Thus, only very large blocks between 8 and 80 m3, weighing tens to hundreds of metric tons, were sampled. OSL equivalent dose (De) was obtained using the single aliquot regeneration (SAR) dose protocol, with preheats of 10 s at 220–260 ∘C and a cut heat temperature 20∘ below preheat temperatures (Murray and Wintle, 2006).
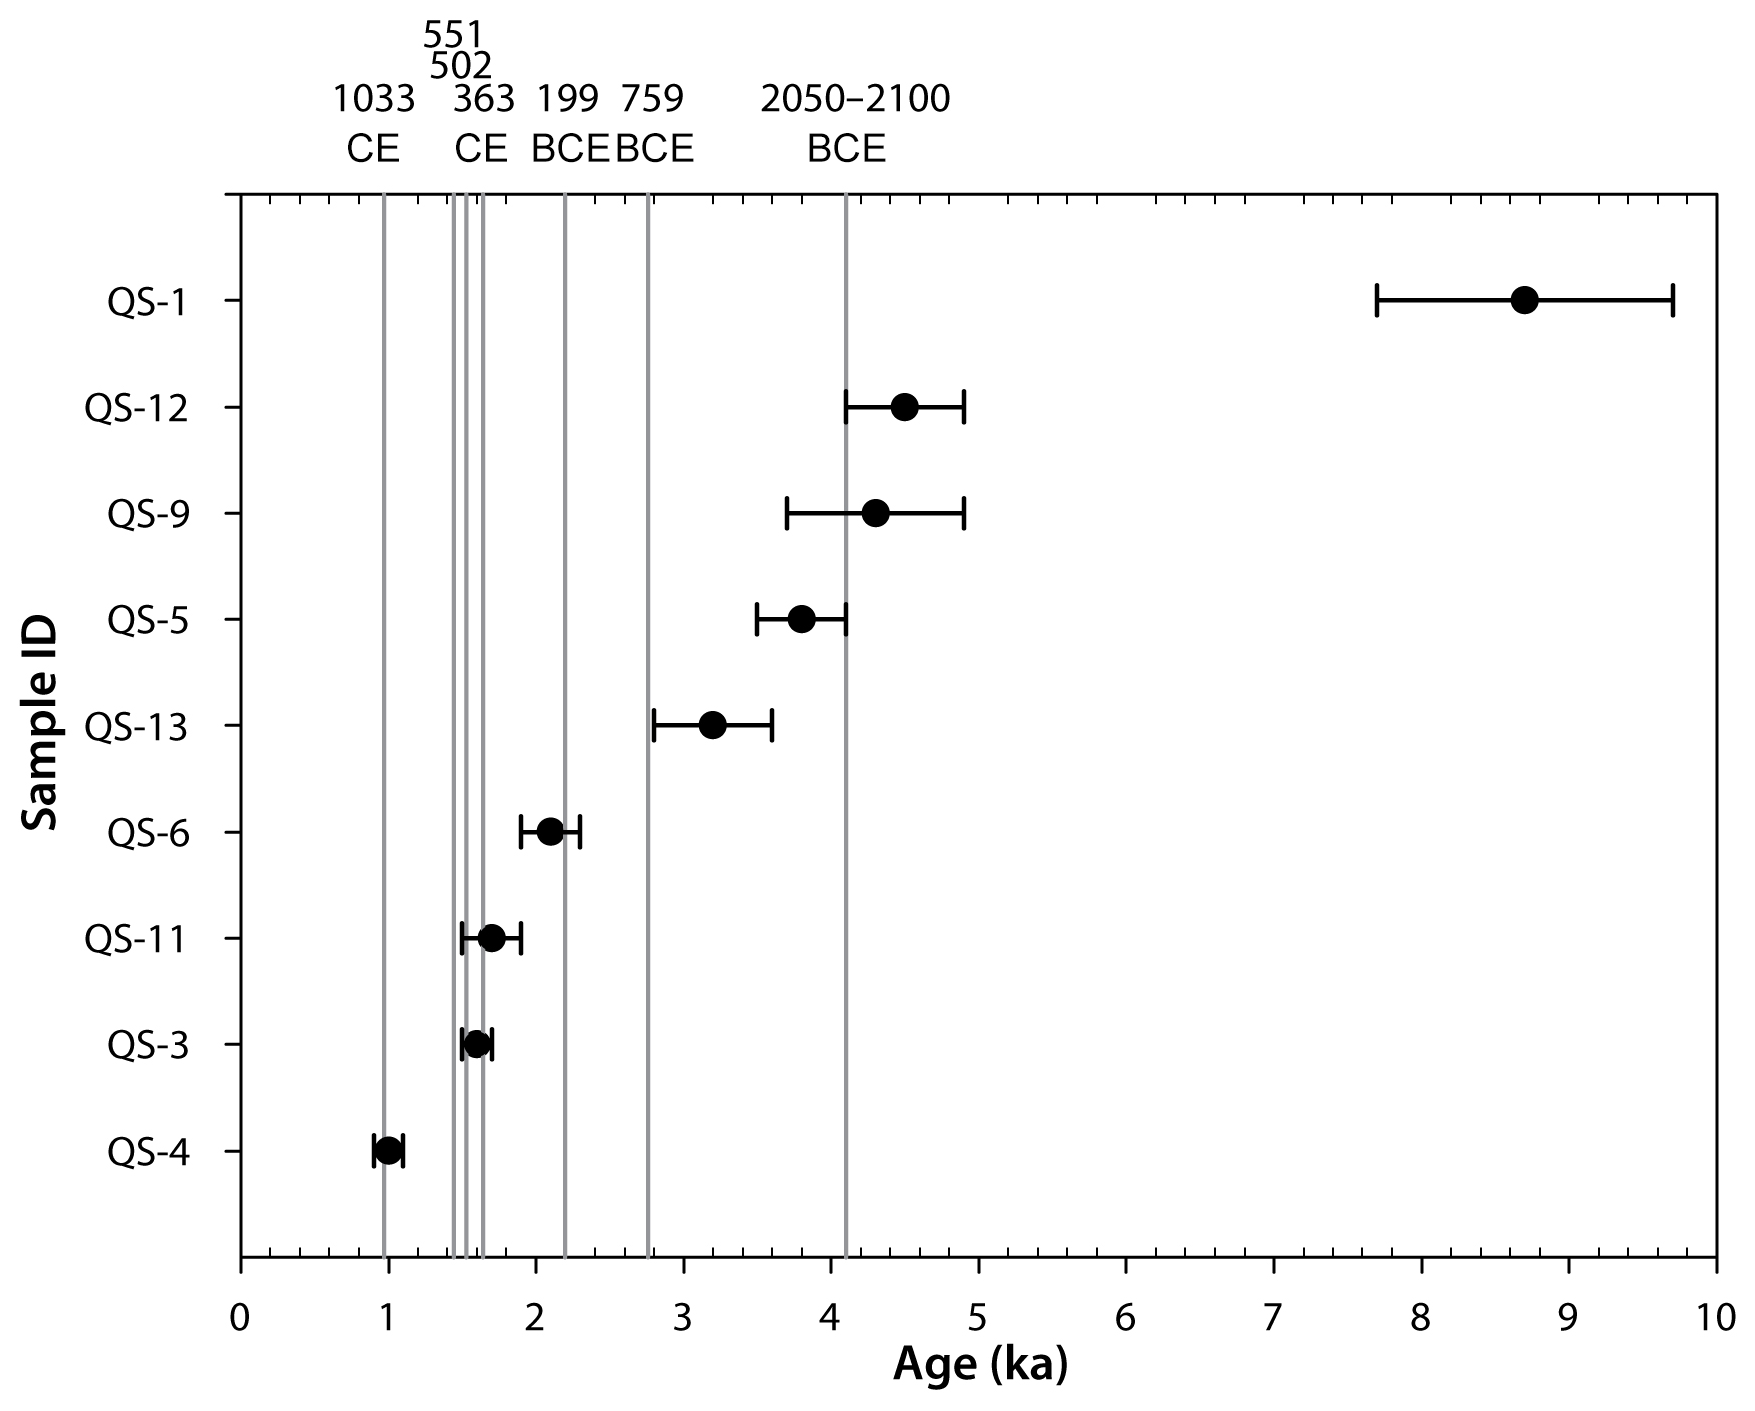
Figure 10Summary of OSL ages (black circles with error bars) plotted in chronological order and selected historical earthquakes suggested as rockfall triggers (shown as vertical gray lines, chronologically labeled at the top axis); see text for details.
4.1 Size distribution of rockfalls
Rock blocks, a result of rockfall events, are commonly observed along the slope west of Qiryat Shemona, at the foot of the Ein El Assad Formation. Their volume varies, from the smallest pebbles to boulders tens of cubic meters in volume. In places the blocks form grain-supported piles, revealing impact deformations on their common faces such as chipped corners and imbricated blocks separated along previous fracturing surfaces. To determine rockfall hazard and risk, information on the frequency and volume statistics of individual rockfalls is necessary (Guzzetti et al., 2004, 2003).
Table 1Size distribution of the mapped rock blocks (N=76).
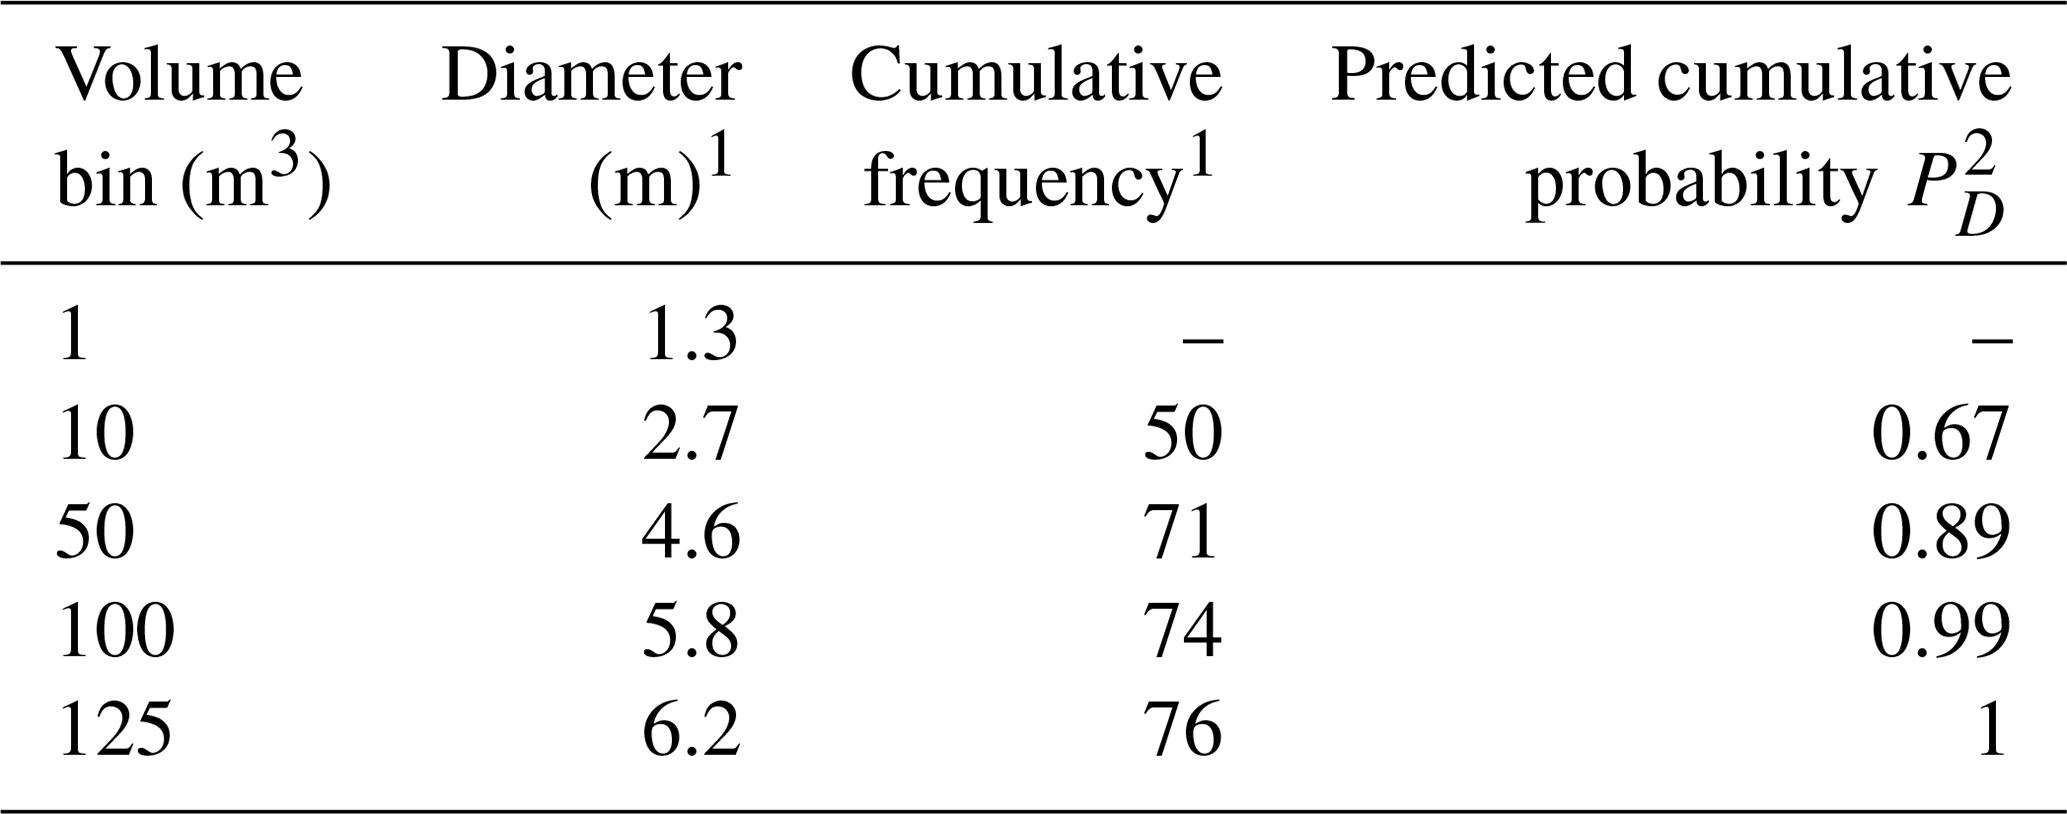
1 No data collected for blocks smaller than 1 m3 (cumulative frequency is zero). 2 PD is calculated using Eq. (3) for a given block diameter or smaller.
We used the field mapped blocks to determine their volume distribution. In total, we consider this field catalog complete for block sizes >1 m3 and consists of 76 blocks ranging in volume up to 125 m3 (mode = 56 m3). Following Malamud et al. (2004), the volume distribution of the mapped blocks is determined using the probability density, p, of a given block volume Eq. (1):
where N is the total number of blocks, dN is the number of blocks with a volume between V and V+dV, and α is the scaling exponent. Our results show that the volume of the individual rock blocks from the studied area exhibits a distinct negative power-law behavior, with a scaling exponent of the right tail of (R2=0.72; Fig. 6). This conforms to what was found by others who examined natural rockfalls with observed α ranging from −1.07 to −1.4, e.g., Guzzetti et al. (2003), Malamud et al. (2004) and Brunetti et al. (2009). The scaling exponent is also similar to the value obtained experimentally by Katz and Aharonov (2006), while Katz et al. (2011) found a larger scaling exponent, . Since our data yield a moderate inner consistency, R2=0.72, we round the power to −1.2 (instead of −1.17). In accordance, the probability density function (PDF) for rockfall volume (p) may be presented as a power law of the form (Dussauge-Peisser et al., 2002, 2003; Guzzetti et al., 2003; Malamud et al., 2004) in Eq. (2), where V is the given block volume in cubic meters:
To simplify the hazard evaluation and relate to the more prominent hazard which larger block sizes impose (thus removing the 1 m3 smaller blocks from the simulation runs), the block volumes were binned into size scales of 10, 50, 100 and 125 m3, with corresponding block diameters of 2.7, 4.6, 5.8 and 6.2 m, respectively (assuming spherical block geometry). Field-mapped cumulative frequencies were used to derive cumulative probabilities for each block size (Table 1). The probability values per block diameter (Table 1) were fitted to a regression curve in Excel (R2=0.97), yielding the probability (pD) for a block of a given diameter (D) or smaller following Eq. (3):
The cumulative probability calculated from Eq. (3) per block diameter differs from the cumulative probability calculated in Eq. (2) per its matching block volume because of the differences in data sets and usage of the two equations: Eq. (2) power-law details our full field-observed data of block sizes and is used to characterize the data set and compare it to other block catalogs in other studies. Equation (3) yields a simulation-specific empirical prediction for probability of occurrence for the larger block diameters (D≥2.7 m; V≥10 m3), which were actually used later in the CRSP simulations for hazard analysis.
4.2 Simulations of block trajectories
For the hazard analysis, we ran computer simulations along 25 profiles including the four profiles used for the calibration (Fig. 3), using the calibrated parameters and the measured topographic profiles as the model input. A total of 100 computer runs were performed (four runs on each of the 25 profiles, using block diameters of 2.7, 4.6, 5.8 and 6.2 m separately), each run simulating the fall of 100 individual blocks (totaling 10 000 simulated single-block trajectories). These results were used to analyze the hazard in the study area.
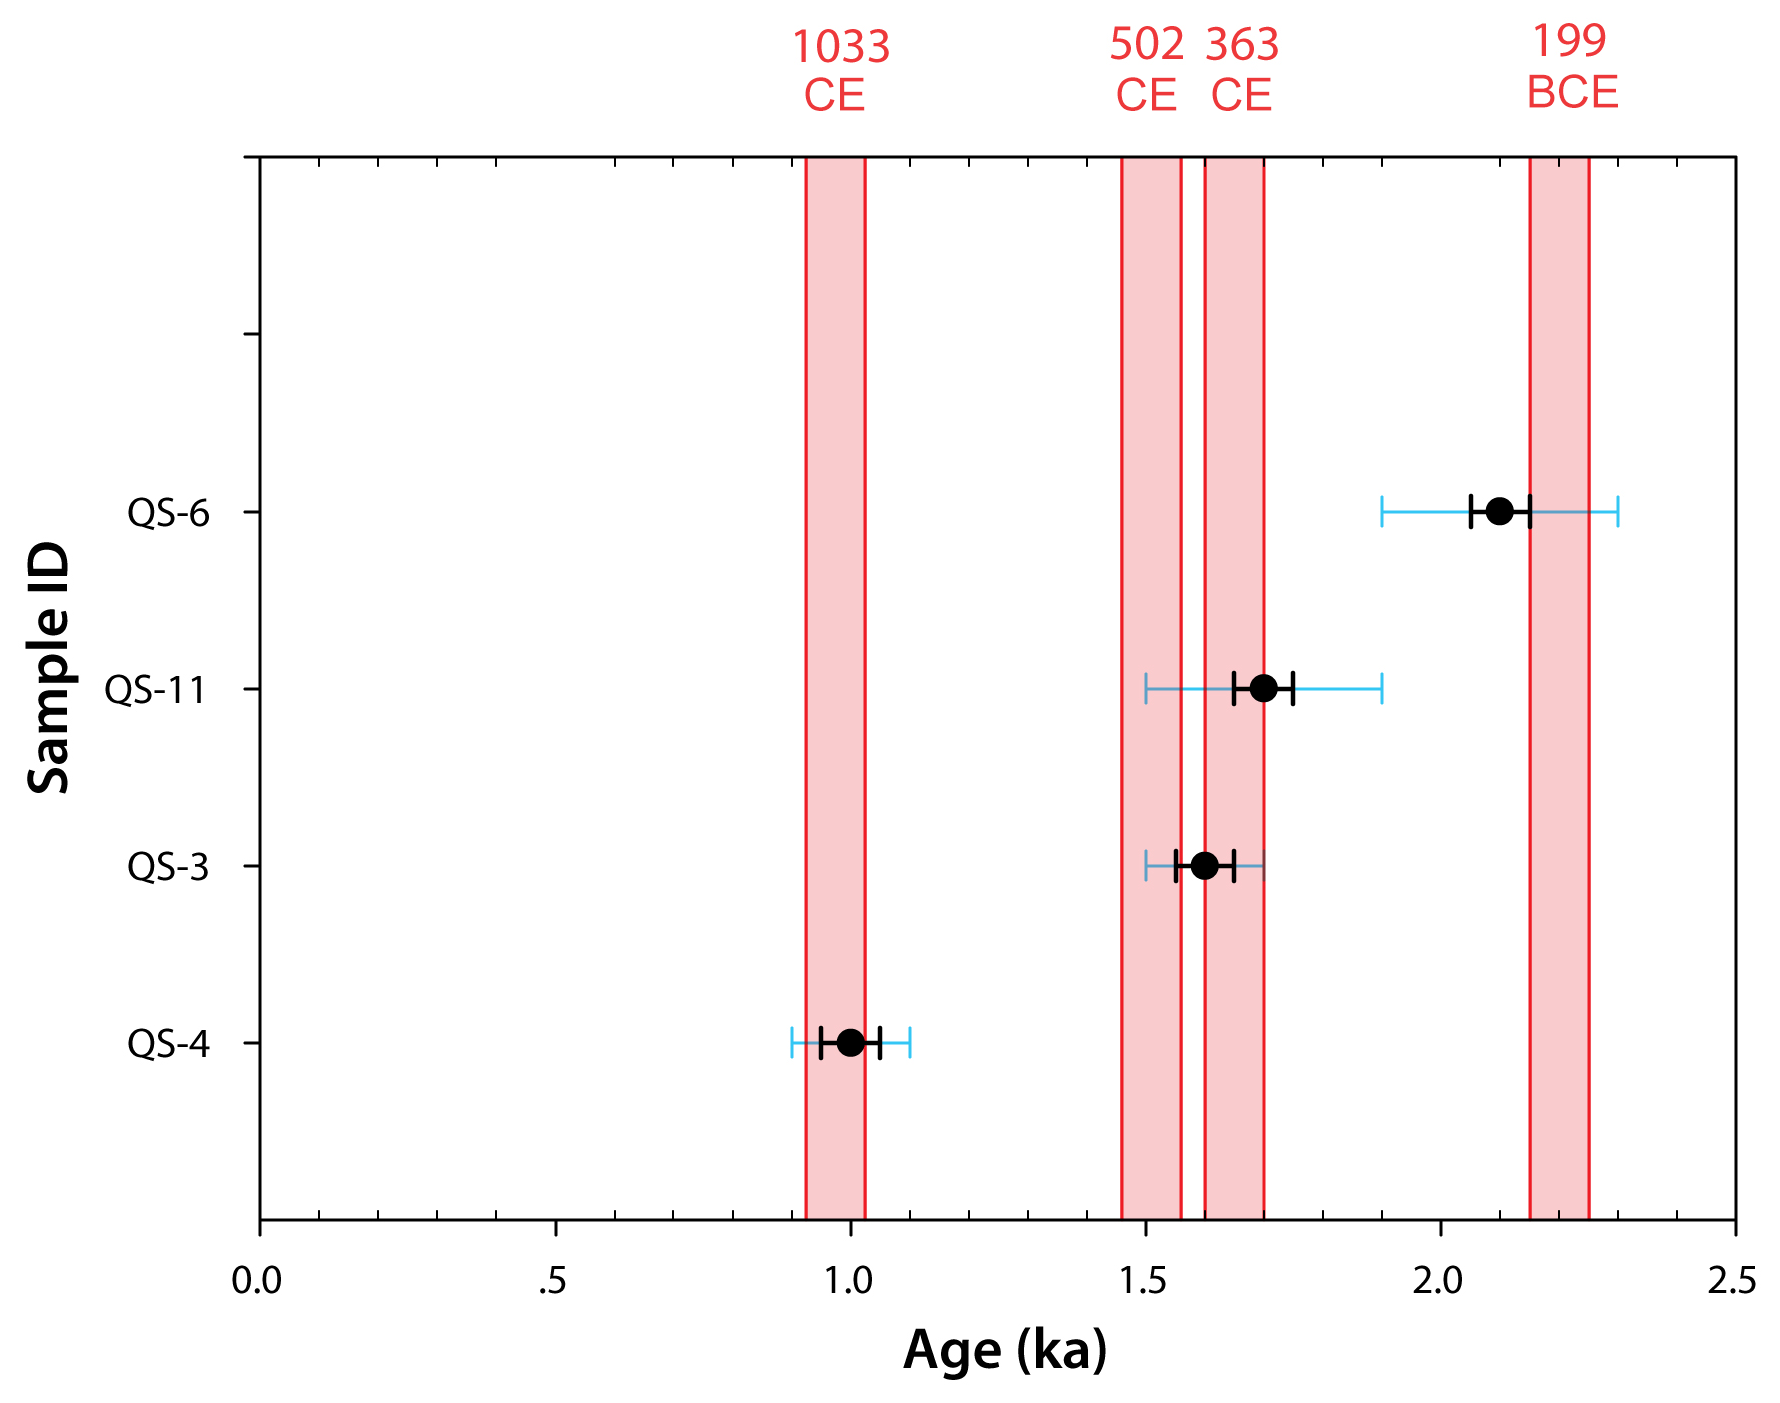
Figure 11Clustering of rockfall events using binomial nonrandom temporal distribution using a ±50-year time window. Dated OSL rockfall ages marked in black circles by their central OSL ages with ±50-year black error bars and their lab-reported error ranges as light-blue bars. Historical earthquake dates are marked on the top axis and plotted with a ±50-year time window (red stripes bounded by red solid lines represent time windows). See text for details about binomial distribution results and usage.
4.2.1 Stop angle and stop swath
The “x % stop angle” is defined as the slope angle of the profile cell at which cumulated x % of simulated blocks stop and, in accordance, the “stop swath” is defined as the distance (m) that the simulated blocks covered until all of them (100 %) stopped. For example, if the total 100 % of the simulated blocks stopped within a profile cell that has a 5∘ slope and the last one of them stopped after covering 65 m along that cell, the 100 % stop angle is 5∘ and the stop swath is 65 m. The 50 % and 100 % stop angle and stop swath data were extracted from the CRSP simulation analysis (Fig. 7). The 100 % stop angles for all profiles (red circles in Fig. 7) vary between 3 and 12∘ with a mean of 7.7∘ and SD = 2.3∘ (1σ=5.4–10.0∘); The 50 % stop angles (blue triangles) vary between 3.2 and 25.8∘ with a mean of 10∘ and SD = 5.3∘ (1σ=4.7–15.3∘). All other cell slope angles in all profiles (gray circles) vary widely between 7 and 88∘ with a mean of 29.4∘ with SD = 17∘ (1σ=12.4–46.4∘). Among them very few are less than 10∘. Stop swath distances range between 8 and 105 m, with a mean of 38 m and SD = 24 m (1σ=14–62 m). Only in two profiles (out of 25) did the stop swath distance exceed 65 m. In both these cases, the 100 % stop angle is steeper than in most other profiles (10–11∘). Further details and illustration for slope cells and stop angles are given in Fig. 7. No significant correlation was found between a 100 % stop angle and stop swath distance.
Table 2Predicted velocity (m s−1) and kinetic energy (kJ) of falling blocks at town border∗.
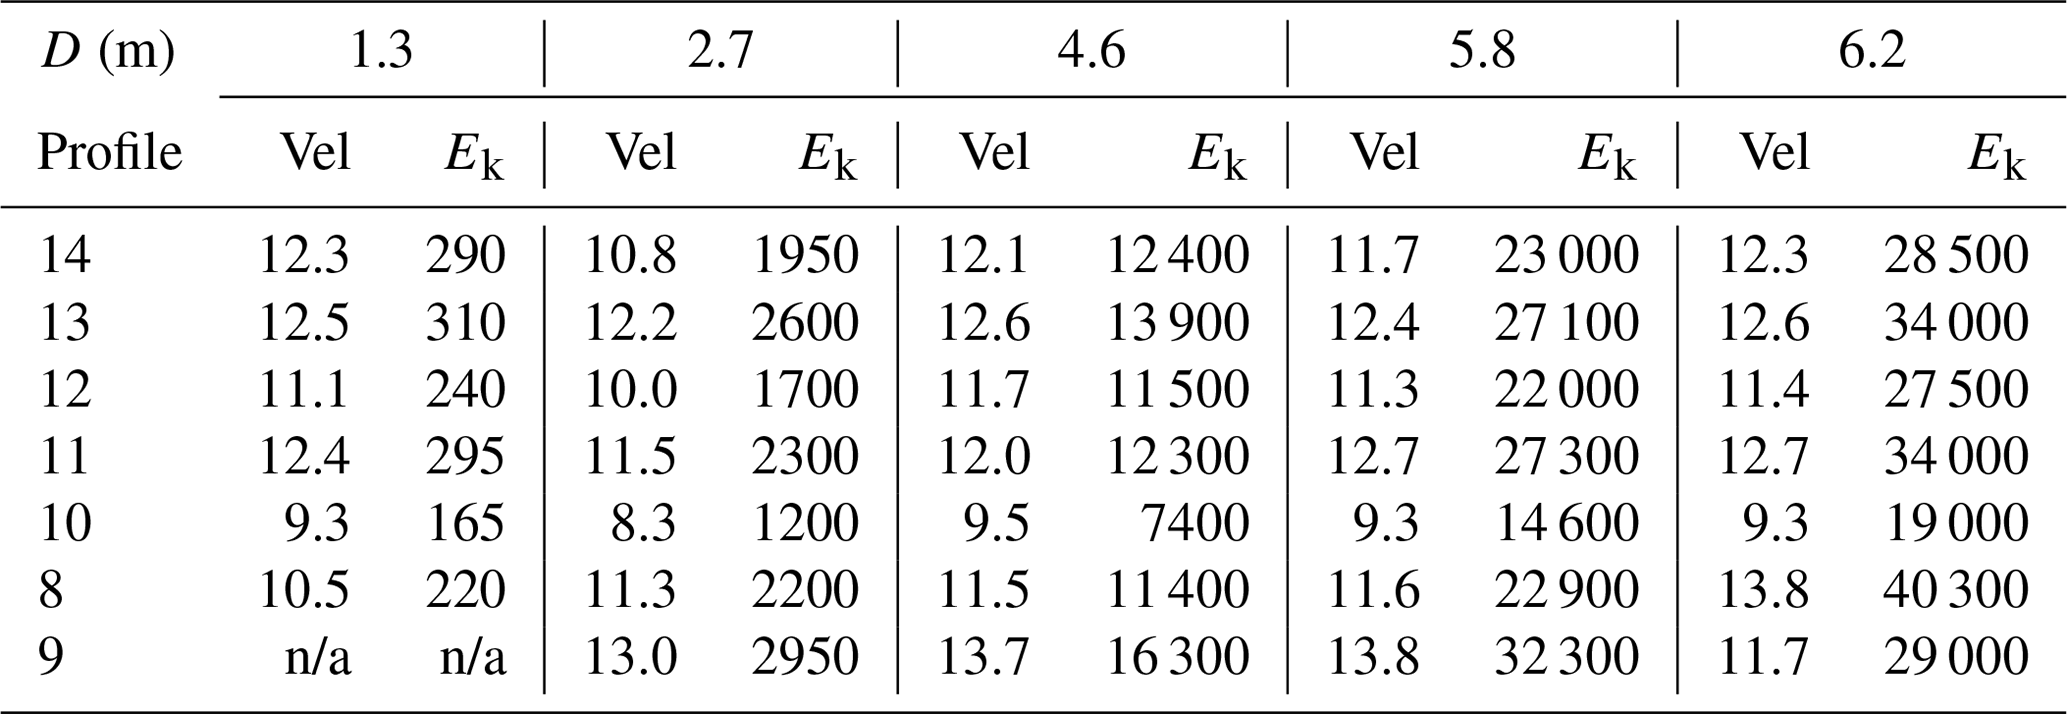
∗ Values presented are maximal simulated velocity (Vel) and kinetic energy (Ek) per rock diameter (D). Profiles listed (7 out of total 25 simulated profiles) are only those which are predicted to impact town border. Analysis points located at distances along slope which are equal or up to 50 m shorter than the town border. See text for detail. n/a = No simulated blocks of this size have reached the town border impact point – hence no kinetic data is available.
4.2.2 Rockfall hazard
A rockfall hazard map for Qiryat Shemona is presented in Fig. 8. The hazard map was compiled from the simulated maximal travel distance (where 100 % of blocks stop) of the largest blocks (D>4.6 m, V>50 m3) with the probability of occurrence, pD=11 % (Eq. 3). The calculated block trajectories cross the town border and mark the town premises that are subject to rockfall hazard along 8 out of 25 simulated profiles (nos. 8–14 and no. 16, marked by “†” in Fig. 9). The area subjected to rockfall hazard is about 1.55 km2, currently including several houses (according to the last updated Google Earth image from November 2014). For D=4.6 m, block impact velocity varies between 9.5 and 13.7 m s−1 and kinetic energy between 7400 and 16 300 kJ (Table 2). CRSP-simulated maximal travel distance and CRSP velocity and kinetic energy analysis points at town border impact locations are plotted in Fig. 9. The yellow line represents the CRSP 100 % stop line calculated for large blocks (D is 5.8 and 6.2 m). Yellow–black triangles mark simulated stop points; orange–black triangles mark simulated town border impact points (those labeled with a sword “†” mark locations of rockfall impact at town border) where kinetic energy was calculated. For details of the kinetic analysis at these locations refer to Table 2.
Table 3OSL age field and laboratory data, with age determination results.
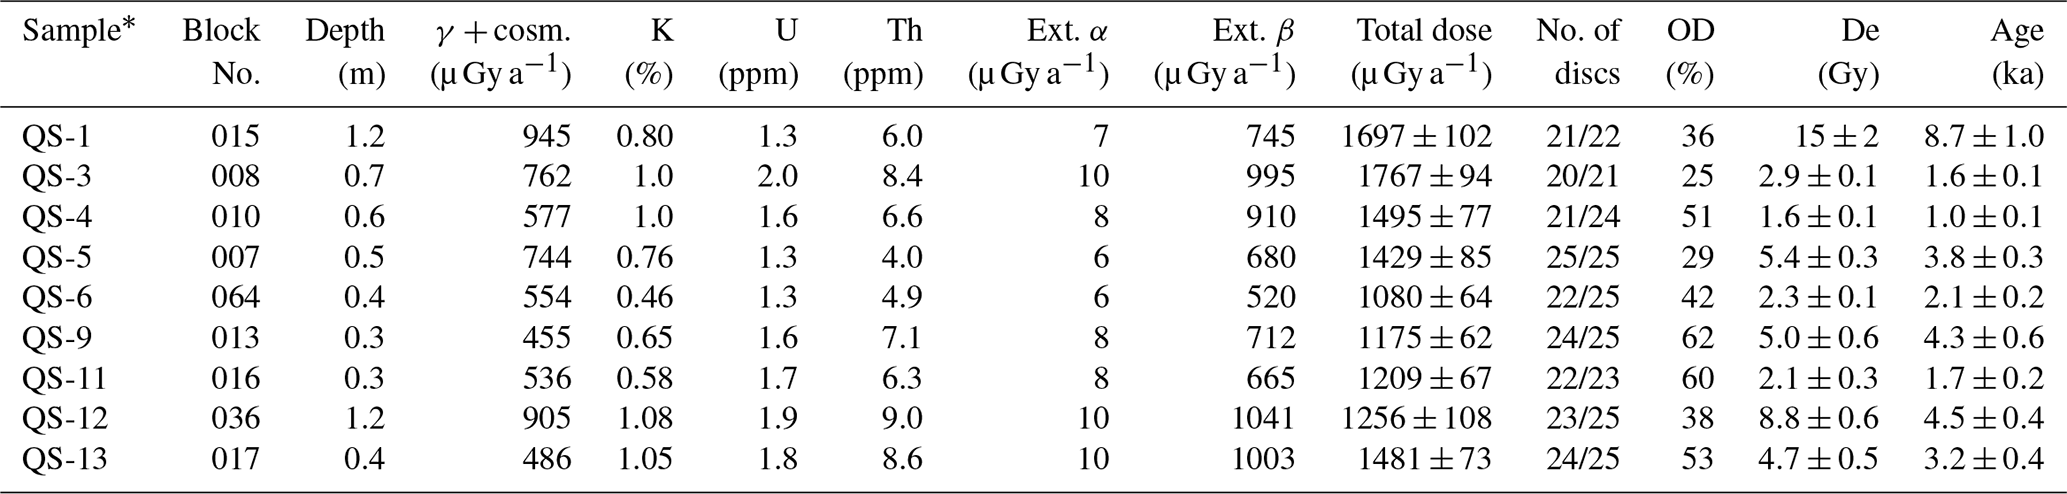
∗ Grain size for all samples is 74–125 µm, except for samples QS-1 and QS-2, for which grain size 88–125 µm was used. Water moisture estimated at 15±5 %. The quartz was etched by concentrated HF for 40 min. De was obtained using the single aliquot regeneration (SAR) dose protocol with preheats of 10 s at 220–260 ∘C and a cutheat 20∘ below preheat. “No. of discs” is the number from those measured that were used for calculating the De. Overdispersion (OD) is an indication of the scatter within the sample beyond that which would be expected from experimental uncertainties. Ages were calculated using the central age model after rejection of outliers. Gamma dose rates measured in the field using the gamma counter are lower than gamma dose rates calculated from the concentrations of K, U and Th (with the cosmic dose calculated from burial depth).
4.3 OSL age determination of rockfalls
OSL ages were determined for nine rock blocks with a volume range of 8–80 m3. The location of these blocks is marked in red circles in Fig. 3. These ages range from 0.9 to 9.7 ka, with uncertainties of 6 %–14 % (Table 3).
5.1 Triggering conditions for rockfalls in the studied area
We interpret the field-observed grain-supported structure of aggregations of blocks of various sizes, with impact deformations (e.g., chipping) on their common faces as evidence for catastrophic events, involving numerous blocks. Long-term erosion which results in single sporadic block failures would have resulted in matrix-supported blocks and not in the evidence observed here. We conclude that the rockfalls were mainly triggered by discrete catastrophic events such as earthquakes or extreme precipitation events. The question of a triggering mechanism in the case of a catastrophic rockfall event is an important one when attempting to evaluate the temporal aspect of rockfall hazard. The recurrence time of an extreme winter storm or a large earthquake may give some constraints on the expected recurrence time of rain-induced or an earthquake-induced rockfall, respectively. Furthermore, it might suggest a periodical probability for the next rockfall to occur when hazard is calculated. The correlation of rockfall events to historical extreme rainstorm events is limited due to the lack of a long-enough historical rainstorm record. However, in the 74 years of documented climatic history for the studied area (measurements at the Kfar Blum station 5 km away since 1944; IMS, 2007) no significant rock mass movements and rockfalls were reported in the study area. This period includes the extremely rainy winters of 1968/69 and 1991/92, in which annual precipitation in northern Israel was double than the mean annual precipitation (IMS, 2007). Furthermore, the winter of 2018–2019 (during which the current study is being prepared for publication) breaks a 5-year drought that was the worst Israel has experienced in decades (Times of Israel, 2019), with massive floods, snowfall, overnight freeze and rainstorms in northern Israel, including in the study area. The authors of this study received firsthand personal correspondence (photos, videos and descriptions) from hikers on the studied slope, which observed some dismantling of rock blocks in their location during one of the large rainstorms in January 2019. Yet no rockfall events were documented in the study area during this extreme winter season. Contrastingly, Wieczorek and Jäger (1996) reported that out of 395 documented rockfall events in the Yosemite Valley which occurred between 1851 and 1992, the most dominant recognized trigger for slope movement was precipitation (27 % of reported cases), and they point out the influence of climatic triggering of rockfall. Based on this significant difference of observations for rockfall-triggering mechanisms, we suggest that rainstorms may not provide a major triggering mechanism for rockfalls in our study area. A possible correlation between the dated rockfall events and historical earthquakes is analyzed below.
Table 4Selected historic earthquakes, candidates as possible rockfall triggers in the study area1
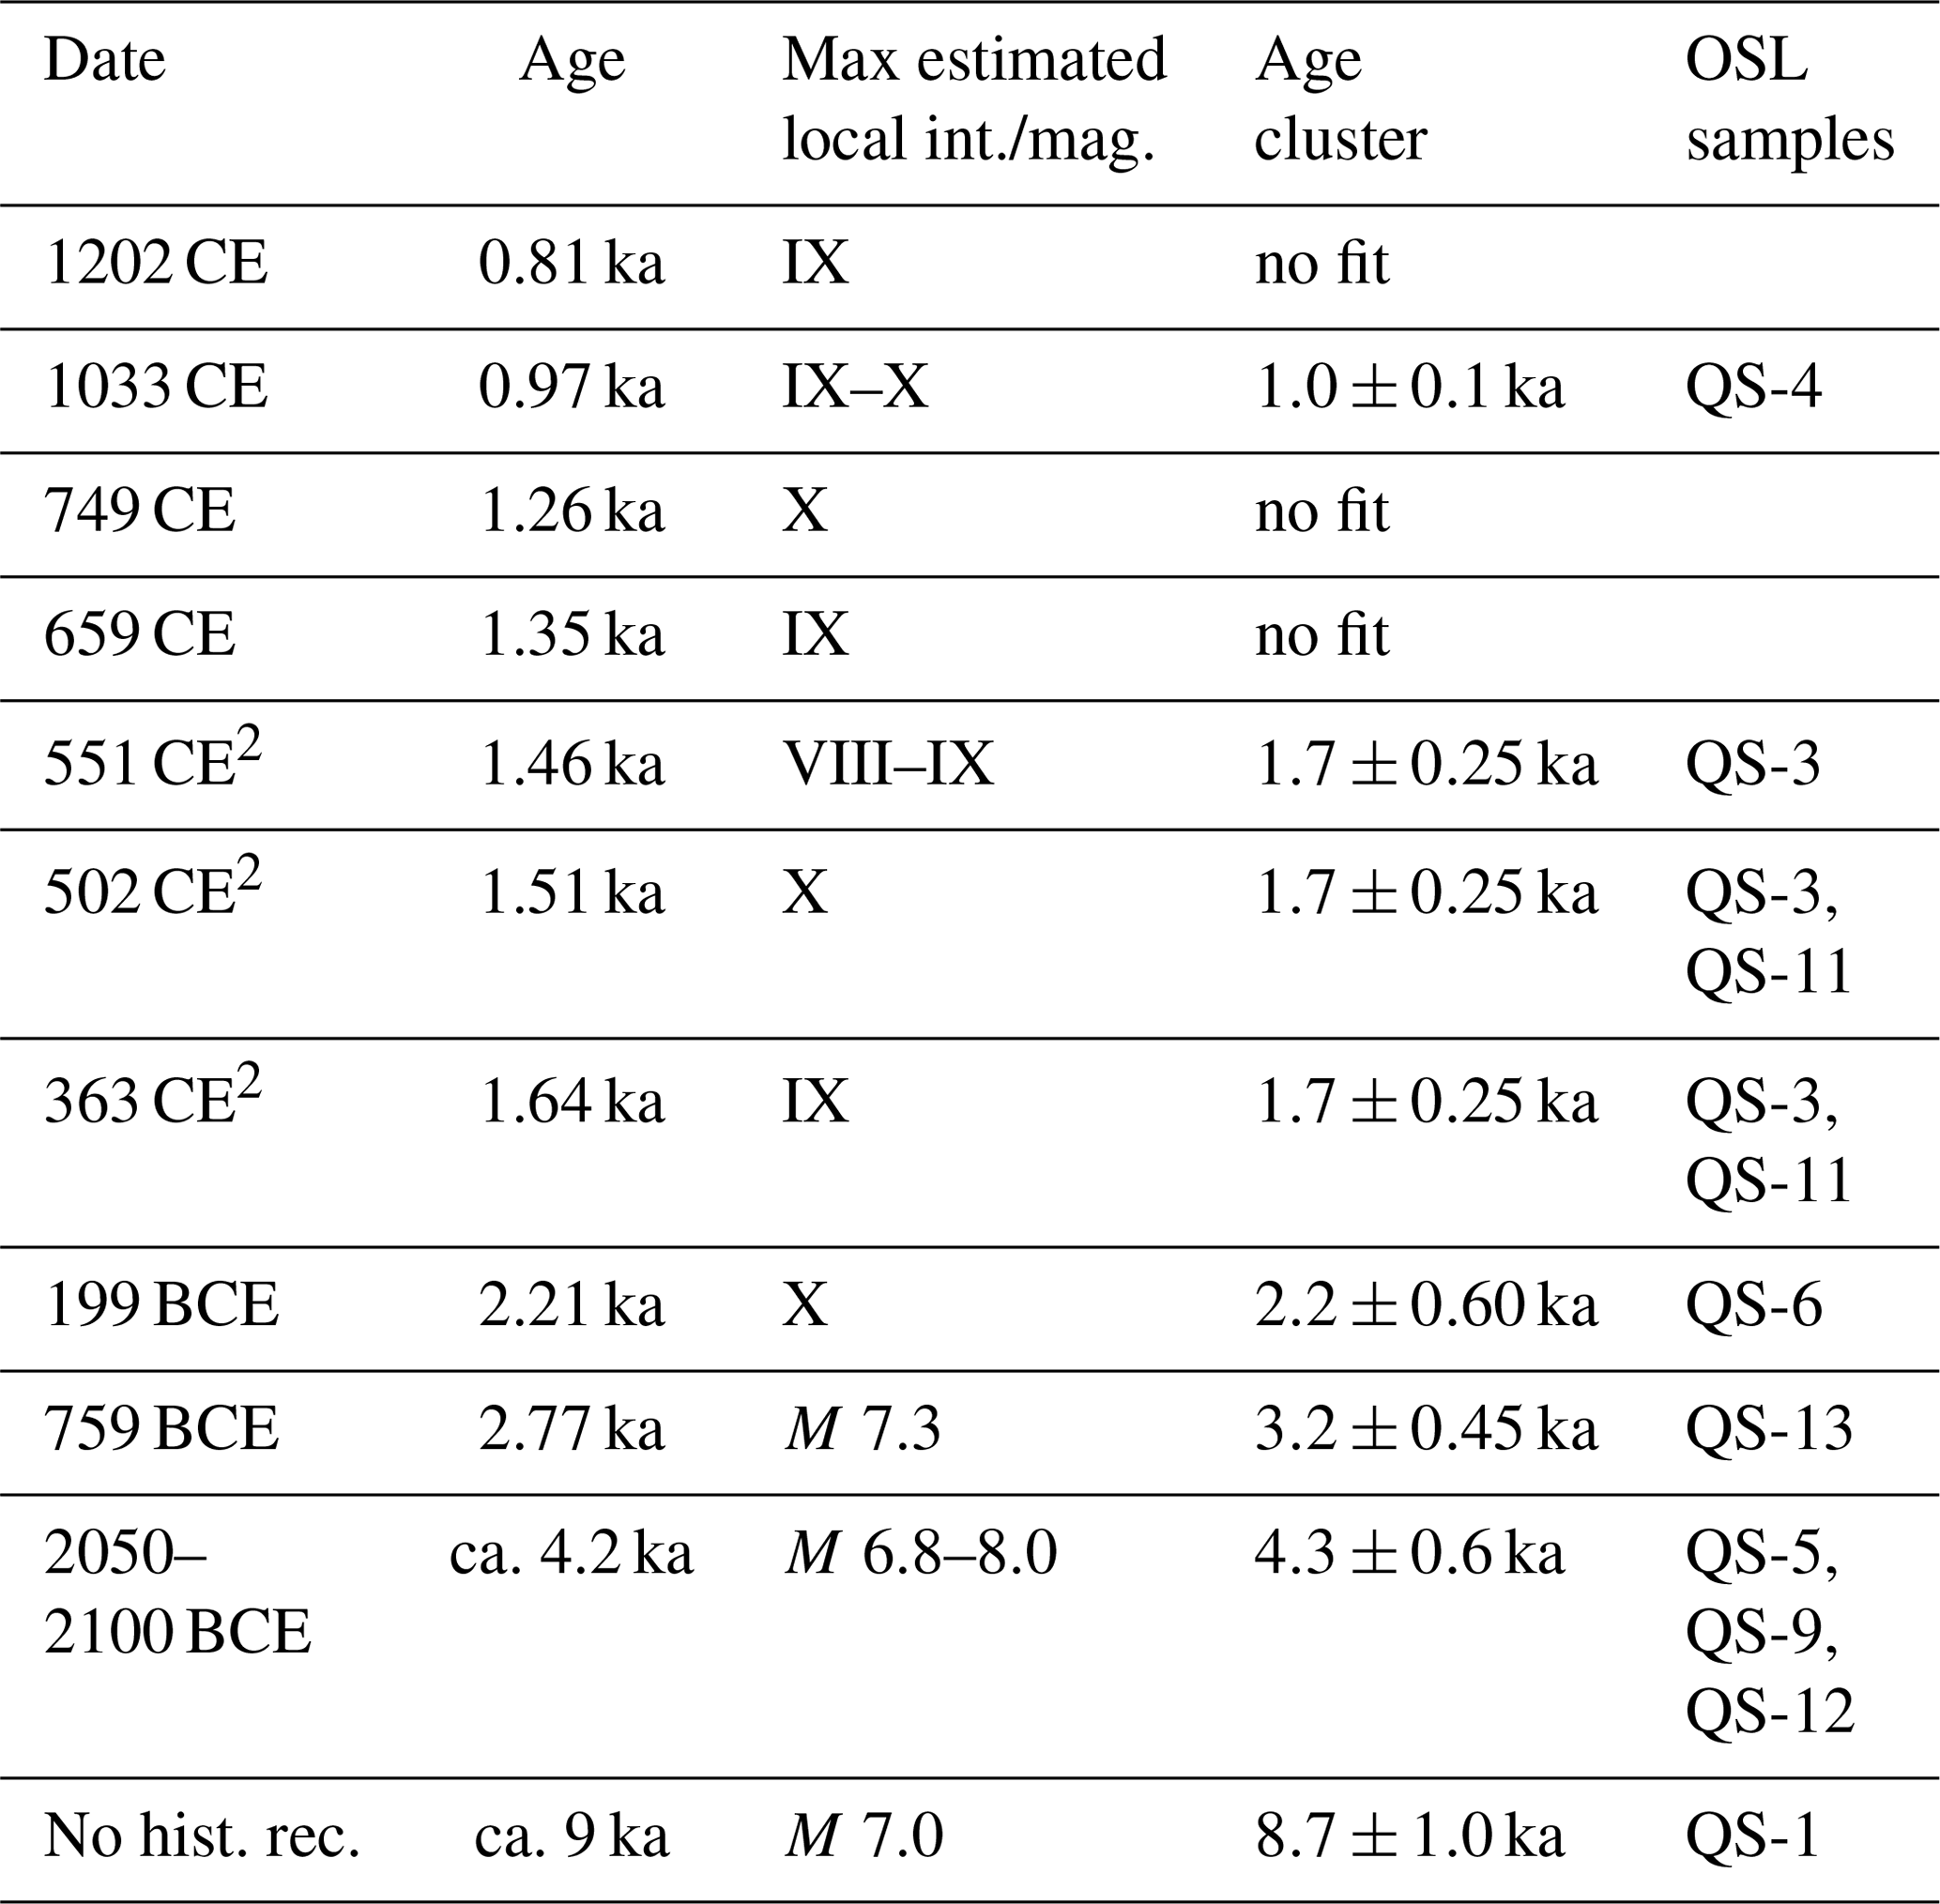
1 A list of candidate rockfall-triggering earthquakes, which contains historical earthquakes that (a) occurred within the time spans of the OSL ages; (b) maximum estimated intensity is at least “IX” on an EMS macroseismic local intensity scale and/or their estimated moment magnitude from previous paleoseismic studies is 6 or larger; (c) the distance between the study area and affected localities reported does not exceed 100 km (following Keefer, 1984). “No hist. rec.” indicates that no historical record is available for this event. 2 Three historic earthquakes for which OSL dates of rockfall events cluster in time, either around a single rockfall in 363 CE or two separate events in 363 CE and 502/551 CE.
5.2 Nonrandom temporal distribution of rockfalls and correlation to earthquakes
The following discussion relates to blocks of sizes equal to or larger than 8 m3 (D>2.5 m) as the OSL dated blocks were of sizes of 8–80 m3. These volumes fit the CRSP simulation analyses of all blocks in the study, as the smallest simulated block for the hazard estimation was 10 m3 (D=2.7 m).
The wide range of OSL ages, between 0.9 and 9.7 ka (Fig. 10 and Table 3), rules out the possibility of a single rockfall event. Given the rich historical earthquake record in the vicinity of the studied area, the positive correlation between rockfall events and historical earthquakes may shed light on the triggering mechanism of the rockfalls. A similar approach was used by Matmon et al. (2005), Rinat et al. (2014) and Siman-Tov (2009). The latter dated rockfall events ∼30 km SW of the studied area, where he found a positive correlation between rockfall events and historical earthquakes, dated 749 and 1202 CE. To analyze this possible correlation, we overlaid the nine OSL ages with a set of nine large historic earthquakes (Table 4, Fig. 10), which comply with these cumulative terms: (a) they occurred within the time spans of the OSL ages; (b) their maximum estimated intensity is at least “IX” on the EMS (European macroseismic scale) and/or their estimated moment magnitude is 6 or larger; (c) the distance between our study area and affected localities does not exceed 100 km (following Keefer, 1984).
The nine OSL ages (Table 3; Fig. 10) span over the past 9700 years with a mean of one occurrence per 1000 years. The validation of OSL age clustering was obtained performing a binomial distribution test, which gives the discrete probability distribution of obtaining exactly k successes out of n trials. The result of each trial is true (success) or false (failure), given the probability for success (p) or failure (1−p) in a single trial. The binomial distribution is therefore given by Eq. (4):
where
A “success” was defined when the date of a given earthquake (out of the nine candidates in Table 4) with a ±50-year time window coincides in time with one of the OSL ages with the same error range (±50 years). Since the selected limited time window is ±50 years (±0.05 ka), the test was performed only for OSL ages that correspond to relatively accurate historically recorded earthquakes (last 2800 years): 759 and 199 BCE, 363, 502, 551, 659, 749, 1033 and 1202 CE. The OSL ages within this range are of QS-3 (1.6±0.1 ka), QS-4 (1.0±0.1 ka), QS-6 (2.1±0.2 ka) and QS-11 (1.7±0.2 ka). The selected nine historical earthquakes, each with a ±50-year time window, span over 900 years out of the given 2800-year period (for each event, a ±50-year time window spans 100 years). Therefore, the probability p for a single random earthquake to occur within this period is . The number of trials n is the number of earthquakes n=9. In five cases (the earthquakes of 199 BCE, 363, 502, 1033 CE), a success (match between an earthquake and an OSL age) is obtained (363 CE matches two OSL ages QS-3 and QS-11); therefore the number of successes is k=5. This fit between OSL ages and earthquakes is detailed in Fig. 11. Accordingly, the binomial distribution is ; i.e., there is a 9 % probability of randomly obtaining such a distribution of events in time. Hence, we suggest that the OSL age distribution is significantly clustered around dates of the discussed historical earthquakes, with a 91 % confidence level, thus suggesting a likelihood of seismic triggering for the rockfalls in the studied area. Assuming that a M≥6 earthquake needed for rockfall triggering (following Keefer, 1984) and based on the recurrence time of 550 years given for these earthquakes (Hamiel et al., 2009), we predicted a ∼550-year recurrence time for rockfalls in the studied area.
Not all historic earthquakes are represented in our OSL data set, such as the 1759 CE (Ambraseys and Barazangi, 1989; Marco et al., 2005) and 1837 CE (Ambraseys, 1997; Nemer and Meghraoui, 2006) earthquakes, which both induced extensive damage to cities not far from the study area (Katz and Crouvi, 2007). This lack of evidence could be explained by OSL under-sampling or because earthquakes only trigger rockfalls that were on their verge of instability (Siman-Tov et al., 2017).
Based on the above analysis we correlate the past rockfalls to historic earthquakes as follows:
- a.
QS-4 (1.0±0.1 ka) fits the historical earthquake of 1033 CE.
- b.
QS-3 (1.6±0.1 ka) and QS-11 (1.7±0.2 ka) fit the historical earthquakes of 363 and 502 CE, and only lack ∼40 years in error margin to fit the one of 551 CE. Since the 502 CE earthquake was reported on shoreline localities only in the DST area, we find the 363 CE earthquake to be a better rockfall-triggering candidate. We suggest that the two ages are clustered around one of these earthquakes, hence suggesting they represent one rockfall event in the 363 CE earthquake. However, we cannot completely rule out the possibility that these were two separate rockfall events, both triggered by large earthquakes in 363 and 502/551 CE.
- c.
QS-6 (2.1±0.2 ka) fits the 199 BCE earthquake.
- d.
QS-13 (3.2±0.4 ka) lacks ∼30 years in error margin to fit the 759 BCE earthquake.
- e.
QS-5 (4.0±0.7 ka), QS-9 (4.3±0.6 ka) and QS-12 (4.5±0.4 ka) fit the 2050/2100 BCE earthquake (or two separate events) suggested by Migowski et al. (2004). This also fits the findings of Katz et al. (2011) and Yagoda-Biran et al. (2010), who found evidence for earthquake and earthquake-induced slope failure east of the Sea of Galilee (ca. 50 km south from the study area, along the DST) with OSL ages of 5.0±0.3 and 5.2±0.4 ka, respectively, suggesting the area had experienced one or more strong earthquakes. We therefore suggest that these OSL ages cluster around a single rockfall event triggered by a large earthquake within the period of 3.7–4.9 ka.
- f.
QS-1 (8.7±1.0 ka) may correlate with an earthquake event suggested by Daëron et al. (2007) on the Yammunneh fault in Lebanon dated to 8.4–9.0 ka (identified in a paleoseismic trench 50 km north of the study area).
5.3 Area subject to rockfall hazard
The nature of the analyzed past rockfall events in the studied area can be used to constrain the possible characteristics of the expected future rockfall events and direct hazard mitigation. The predicted probabilities PD for specific rockfall with a given block diameter or smaller, derived from the regression curve (Eq. 3), are presented in Table 1. PD(2.7), the cumulative probability for a block of D=2.7 m (V=10 m3) or smaller, is 0.67. Consequently, the probability for traveling blocks of m ( m3) is or 33 %. The occurrence of larger, more destructive blocks amongst these (D=4.6–6.2 m or V=50–125 m3) is PD=11 %. Despite their lower probability, these blocks would reach the farthest distances, and hence pose the largest hazard to the town.
About 50 000 m2 (0.05 km2) of the westernmost inhabited and built urban area is mapped under direct rockfall hazard (considering the large blocks: D=4.6–6.2 m), as well as the slopes above this part of the town (Fig. 8). This hazard mapping may be used to plan mitigation actions and also as a basis for future urban planning.
We note that the main road connecting the town southwards, which can serve as an evacuation route, is marginally beyond the rockfall hazard mapped zone (Fig. 8). We also note that some smaller blocks (D≤3 m) were mapped from the historical aerial photos predating town establishment further downslope below the simulated 100 % blocks stop (Fig. 3; blue circles in Fig. 5). As suggested above these might be blocks that traveled farther downslope by creeping after the rockfall event. Another possible explanation is that these now inhabited parts of the slope were altered and even leveled by the construction works. Hence the simulated profile extracted from current topography is different from the slope topography on which these smaller blocks traveled before the construction of the town. No detailed topography maps predating town establishment are available to verify this.
The stop angle results (Fig. 7) indicate that most blocks (>50 %) keep traveling downslope until the slope angle decreases to 10–15∘. All blocks stop where the slope angle decreases to values between 5.5 and 10.0∘. Combined with the stop swath distance results (Sect. 4.2.1 above), considering the means and SDs, CRSP results indicate that falling blocks would stop after covering a distance of 14–62 m from the source on a slope angle of 5–10∘ at the point of stopping. This conclusion may help when considering rockfall mitigation design.
5.4 Rockfall hazard probability
We discuss the hazard probability by addressing three terms: time dependency, size dependency and susceptibility.
-
Time dependency. We derive the recurrence time for rockfalls in the study area by correlating OSL dating of rockfall events to past earthquakes, as detailed above. Thus, we can calculate the probability of a rockfall occurrence PEQ in the next 50 years, assuming an earthquake magnitude Mw=6 as the threshold for rockfall: or 9 %. We do not present a time-dependent earthquake recurrence interval calculation because the time passed since the last large earthquake is not well constrained.
-
Size dependency. Based on the field mapping of block sizes and the expected block sizes which correspond to both the sizes of OSL-dated blocks and the CRSP simulation block diameters (Table 1; Fig. 3), the probability of a given block size or smaller is predicted by Eq. (3). Considering the time-dependent probability and the probabilities for given block sizes detailed above, the probability for rockfall hazard per specific block size (HR) may be predicted as Eq. (5):
where PD is the cumulative probability per block diameter D (Table 1) and PEQ is the rockfall occurrence probability calculated above to be 9 %. Accordingly, predicted HR for the next 50 years for block diameters D between 2.7 and 6.2 m is ∼3 % and for larger blocks D between 4.6 and 6.2 m is ∼1 %.
-
Susceptibility. As presented in Figs. 8–9, the urban area and the area of open slopes above it subjected to rockfall hazard extends to about 1.55 km2. We conclude that this area has a probability HR of ∼1 %–3 % for impact by rockfall in the next 50 years.
In this work, we studied rockfall hazard for the town of Qiryat Shemona (northern Israel) to demonstrate computer-simulation-based hazard evaluation in cases where the study area is a priori exposed to rockfall hazard, but no documentation of past rockfall events is available. To overcome this lack of observations, we derived the needed geometrical and mechanical parameters for the computer hazard modeling from a field study of downslope blocks. In particular, we analyzed the spatial distribution of individual rock blocks which are the result of the past rockfalls and used this analysis for calibration of the model parameters.
OSL age determination of several past rockfall events in the study area suggests that these rockfalls were triggered by large (M>6) historical earthquakes, and in accordance, the estimated rockfall recurrence interval is hundreds of years. Nevertheless, we conclude that not all historical large earthquakes triggered rockfalls in the studied area. Additionally, we infer that the downslope travel distance of the blocks is not significantly affected by the magnitude of seismic accelerations. However, earthquakes appear to play a significant role as the triggering mechanism of the rockfall. We found that falling blocks would come to a stop once the slope angle decreases to around 5–10∘.
The field-calibrated simulation results indicated rockfall hazard at the southwestern quarters of town as well as at the slopes above the town. Considering the size distribution of the past rockfalls in the study area and the recurrence time of large earthquakes in the area, the probability of being affected by a destructive rockfall within a 50-year time window is less than 5 %.
The catalog of the mapped blocks is available from the corresponding author. Please contact via email for details.
All authors participated in field work. NP and MK performed the lab work during OSL dating. This study was carried out in the framework of the MSc thesis by MK.
The authors declare that they have no conflict of interest.
This work was funded by the National Steering Committee for Earthquake Preparedness in Israel. We wish to thank the Israel Nature and Parks Authority, allowing field work at the Qiryat Shemona National Park. Mor Kanari wishes to thank Gal Hartman, Gaby Yelin, Shalev Siman-Tov and Yariv Nofech for their great help in field work. We thank the two anonymous reviewers for their valuable comments and suggestions that significantly improved the paper.
This paper was edited by Andreas Günther and reviewed by two anonymous referees.
Agliardi, F. and Crosta, G. B.: High resolution three-dimensional numerical modelling of rockfalls, Int. J. Rock Mech. Min. Sci., 40, 455–471 2003.
Ambraseys, N. N.: The earthquake of 1 January 1837 in Southern Lebanon and Northern Israel, Ann. Geofis., 4, 923–935, 1997.
Ambraseys, N. N. and Barazangi, M.: The 1759 Earthquake in the Bekaa Valley: Implications for Earthquake Hazard Assessment in the Eastern Mediterranean Region, J. Geophys. Res., 94, 4007–4013, doi:10.1029/JB094iB04p04007, 1989.
Amiran, D. H. K., Arieh, E., and Turcotte, T.: Earthquakes in Israel and Adjacent Areas – Macroseismic Observations since 100 Bce, Isr. Explor. J., 44, 260–305, 1994.
Badoux, A., Andres, N., Techel, F., and Hegg, C.: Natural hazard fatalities in Switzerland from 1946 to 2015, Nat. Hazards Earth Syst. Sci., 16, 2747–2768, https://doi.org/10.5194/nhess-16-2747-2016, 2016.
Becker, A. and Davenport, C. A.: Rockfalls triggered by the AD 1356 Basle Earthquake, Terra Nov., 15, 258–264, 2003.
Begin, Z. B.: Destructive earthquakes in the Jordan Valley and the Dead Sea – their reoccurrence interval and the probability of their occurrence, Geol. Surv. Israel, Report GSI/12/2005, 2005.
Ben-Menahem, A.: Four Thousand Years of Seismicity Along the Dead Sea Rift, J. Geophys. Res., 96, 20195–20216, doi:10.1029/91jb01936, 1991.
Brunetti, M. T., Guzzetti, F., and Rossi, M.: Probability distributions of landslide volumes, Nonlin. Processes Geophys., 16, 179–188, https://doi.org/10.5194/npg-16-179-2009, 2009.
Crosta, G. B. and Agliardi, F.: Parametric evaluation of 3D dispersion of rockfall trajectories, Nat. Hazards Earth Syst. Sci., 4, 583–598, https://doi.org/10.5194/nhess-4-583-2004, 2004.
Cruden, D. M. and Varnes, D. J.: Landslide Types and Processes, in: Landslides-Investigation and Mitigation, Transportation Research Board Special Report 247, edited by: Turner, A. K. and Schuster, R. L., National Research Council, USA, 247, 36–75, 1996.
Daëron, M., Klinger, Y., Tapponnier, P., Elias, A., Jacques, E. and Sursock, A.: 12 000-year-long record of 10 to 13 paleoearthquakes on the Yammoûneh fault, levant fault system, Lebanon, B. Seismol. Soc. Am., 97, 749–771, https://doi.org/10.1785/0120060106, 2007.
De Biagi, V., Napoli, M. L., Barbero, M., and Peila, D.: Estimation of the return period of rockfall blocks according to their size, Nat. Hazards Earth Syst. Sci., 17, 103–113, https://doi.org/10.5194/nhess-17-103-2017, 2017.
D'Amato, J., Hantz, D., Guerin, A., Jaboyedoff, M., Baillet, L., and Mariscal, A.: Influence of meteorological factors on rockfall occurrence in a middle mountain limestone cliff, Nat. Hazards Earth Syst. Sci., 16, 719–735, https://doi.org/10.5194/nhess-16-719-2016, 2016.
Dorren, L. K. A.: A review of rockfall mechanics and modelling approaches, Prog. Phys. Geogr., 27, 69–87, doi:10.1191/0309133303pp359ra, 2003.
Dussauge-Peisser, C., Helmstetter, A., Grasso, J.-R., Hantz, D., Desvarreux, P., Jeannin, M., and Giraud, A.: Probabilistic approach to rock fall hazard assessment: potential of historical data analysis, Nat. Hazards Earth Syst. Sci., 2, 15–26, https://doi.org/10.5194/nhess-2-15-2002, 2002.
Dussauge, C., Grasso, J. R., and Helmstetter, A. S.: Statistical analysis of rockfall volume distributions: Implications for rockfall dynamics, J. Geophys. Res.-Sol-Ea. 108, 2286, https://doi.org/10.1029/2001JB0006502003, 2003.
Elias, A., Tapponnier, P., Singh, S. C., King, G. C. P., Briais, A., Daëron, M., Carton, H., Sursock, A., Jacques, E., Jomaa, R., and Klinger, Y.: Active thrusting offshore Mount Lebanon: Source of the tsunamigenic A.D. 551 Beirut-Tripoli earthquake, Geology, 35, 755–758, doi:10.1130/g23631a.1, 2007.
Evans, S. G.: Fatal landslides and landslide risk in Canada, in: Inter. Workshop on Landslide Risk Assessment, edited by: Cruden, D. M. and Fell, R., Honolulu, 185–196, 1997.
Evans, S. G. and Hungr, O.: The assessment of rockfall hazard at the base of talus slopes, Can. Geotech. J., 30, 620–636, 1993.
Flageollet, J. C. and Weber, D.: Fall, in: Landslide recognition, identification, movement and causes, edited by: Dikau, R., Brundsen, D., and Schrott, L., Wiley, New York, 13–28, 1996.
Freund, R.: A model of the structural development of Israel and adjacent areas since upper Cretaceous times, Geol. Mag., 102, 189–205, 1965.
Garfunkel, Z.: Internal structure of the dead-sea leaky transform (rift) in relation to plate kinematics, Tectonophysics, 80, 81–108, 1981.
Giani, G. P., Giacomini, A., Migliazza, M., and Segalini, A.: Experimental and Theoretical Studies to Improve Rock Fall Analysis and Protection Work Design, Rock Mech. Rock Eng., 37, 369–389, doi:10.1007/s00603-004-0027-2, 2004.
Glikson, Y. A.: Geology of southern Naftali Mountains (northeastern Galilee, Israel), Isr. J. Earth Sci., 15, 135–154, 1966.
Guidoboni, E. and Comastri, A.: Catalogue of earthquakes and tsunamis in the Mediterranean area from the 11th to the 15th century, Istituto Nazionale di Geofisica e Vulcanologia, Rome, 2005.
Guidoboni, E., Comastri, A., and Traina, G.: Catalogues of Ancient Earthquakes in the Mediterranean Area up to the 10th Century, Instituto Nazionale di Geofisica, Roma, 1994.
Guzzetti, F.: Landslide fatalities and the evaluation of landslide risk in Italy, Eng. Geol., 58, 89–107, 2000.
Guzzetti, F., Crosta, G., Detti, R., and Agliardi, F.: STONE: a computer program for the three-dimensional simulation of rock-falls, Comput. Geosci., 28, 1079–1093, 2002.
Guzzetti, F., Reichenbach, P., and Wieczorek, G. F.: Rockfall hazard and risk assessment in the Yosemite Valley, California, USA, Nat. Hazards Earth Syst. Sci., 3, 491–503, https://doi.org/10.5194/nhess-3-491-2003, 2003.
Guzzetti, F., Reichenbach, P., and Ghigi, S.: Rockfall Hazard and Risk Assessment Along a Transportation Corridor in the Nera Valley, Central Italy, Environ. Manage., 34, 191–208, 2004.
Guzzetti, F., Reichenbach, P., Cardinali, M., Galli, M., and Ardizzone, F.: Probabilistic landslide hazard assessment at the basin scale, Geomorphology, 72, 272–299, doi:10.1016/j.geomorph.2005.06.002, 2005.
Hamiel, Y., Amit, R., Begin, Z. B., Marco, S., Katz, O., Salamon, A., Zilberman, E., and Porat, N.: The Seismicity along the Dead Sea Fault during the Last 60 000 Years, B. Seismol. Soc. Am., 99, 2020–2026, doi:10.1785/0120080218, 2009.
IMS: IMS website, Climate information – long term info, available at: http://www.ims.gov.il/IMSEng/CLIMATE/LongTermInfo/, (last access: 3 March 2019), 2007.
Jones, C. L., Higgins, J. D., and Andrew, R. D.: Colorado Rockfall Simulation Program Version 4.0 Manual, Colorado Department of Transportation, Denver, Co, 80222, 2000.
Kafri, U.: Lithostratigraphy of Judea Group in eastern Galilee, emphasizing the Naftali mountains, Geol. Surv. Isr., Jerusalem, https://doi.org/10.13140/RG.2.1.1473.0327, 47 pp., 1991.
Kagan, E. J., Agnon, A., Bar-Matthews, M., and Ayalon, A.: Dating large infrequent earthquakes by damaged cave deposits, Geology, 33, 261–264, 2005.
Kanari, M.: Evaluation of rockfall hazard to Qiryat-Shemona – possible correlation to earthquakes, Geol. Surv. Isr., Jerusalem, GSI/24/2008, 105 pp., 2008.
Kanari, M., Katz, O., Porat, N., Weinberger, R., and Marco, S.: Evaluation of rockfall hazard and risk to a town within the Dead Sea fault zone (Qiryat-Shemona, northern Israel), Geophysical Research Abstracts, Vol. 10, EGU2008-A-05592, EGU General Assembly, At Vienna, Austria, 2008.
Katz, O. and Aharonov, E.: Landslides in vibrating sand box: What controls types of slope failure and frequency magnitude relations?, Earth Planet. Sc. Lett., 247, 280–294, 2006.
Katz, O. and Crouvi, O.: The geotechnical effects of long human habitation (2000 < years): Earthquake induced landslide hazard in the city of Zefat, northern Israel, Eng. Geol., 95, 57–78, 2007.
Katz, O., Reichenbach, P., and Guzzetti, F.: Rock fall hazard along the railway corridor to Jerusalem, Israel, in the Soreq and Refaim valleys, Nat. Hazards, 56, 649–665, doi:10.1007/s11069-010-9580-z, 2011.
Katz, O., Amit, R., Yagoda-Biran, G., Hatzor, Y. H., Porat, N., and Medvedev, B.: Quaternary earthquakes and landslides in the Sea of Galilee area, the Dead Sea Transform: Paleoseismic analysis and implication to the current hazard, Isr. J. Earth Sci., 58, 275–294, doi:10.1560/ijes.58.3-4.275, 2009.
Keefer, D. K.: Landslides caused by earthquakes, available at: http://bulletin.geoscienceworld.org/cgi/content/abstract/95/4/406 (last access: 9 December 2015), Geol. Soc. Am. Bull., 95, 406–421, 1984.
Keefer, D. K.: Investigating Landslides Caused by Earthquakes – A Historical Review, Surv. Geophys., 23, 473–510, doi:10.1023/A:1021274710840, 2002.
Kobayashi, Y., Harp, E. L., and Kagawa, T.: Simulation of rockfalls triggered by earthquakes, Rock Mech. Rock Eng., 23, 1–20, doi:10.1007/BF01020418, 1990.
Lian, O. B. and Roberts, R. G.: Dating the Quaternary: progress in luminescence dating of sediments, Quaternary Sci. Rev., 25, 2449–2468, doi:10.1016/j.quascirev.2005.11.013, 2006.
Mackey, B. H. and Quigley, M. C.: Strong proximal earthquakes revealed by cosmogenic 3He dating of prehistoric rockfalls, Christchurch, New Zealand, Geology, 42, 975–978, doi:10.1130/G36149.1, 2014.
Malamud, B. D., Turcotte, D. L., Guzzetti, F., and Reichenbach, P.: Landslide inventories and their statistical properties, Earth Surf. Proc. Land., 29, 687–711, 2004.
Marco, S., Stein, M., Agnon, A., and Ron, H.: Long-term earthquake clustering: A 50 000-year paleoseismic record in the Dead Sea Graben, J. Geophys. Res.-Earth, 101, 6179–6191, 1996.
Marco, S., Agnon, A., Ellenblum, R., Eidelman, A., Basson, U., and Boas, A.: 817-year-old walls offset sinistrally 2.1 m by the Dead Sea Transform, Israel, J. Geodyn., 24, 11–20, 1997.
Marco, S., Hartal, M., Hazan, N., Lev, L., and Stein, M.: Archaeology, history, and geology of the A.D. 749 earthquake, Dead Sea transform, Geology, 31, 665–668, doi:10.1130/G19516.1, 2003.
Marco, S., Rockwell, T. K., Heimann, A., Frieslander, U., and Agnon, A.: Late Holocene activity of the Dead Sea Transform revealed in 3D palaeoseismic trenches on the Jordan Gorge segment, Earth Planet. Sc. Lett., 234, 189–205, 2005.
Matmon, A., Shaked, Y., Porat, N., Enzel, Y., Finkel, R., Lifton, N., Boaretto, E., and Agnon, A.: Landscape development in an hyperarid sandstone environment along the margins of the Dead Sea fault: Implications from dated rock falls, Earth Planet. Sc. Lett., 240, 803–817, https://doi.org/10.1016/j.epsl.2005.06.059, 2005.
Migowski, C., Agnon, A., Bookman, R., Negendank, J. F. W., and Stein, M.: Recurrence pattern of Holocene earthquakes along the Dead Sea transform revealed by varve-counting and radiocarbon dating of lacustrine sediments, Earth Planet. Sc. Lett., 222, 301–314, 2004.
Nemer, T. and Meghraoui, M.: Evidence of coseismic ruptures along the Roum fault (Lebanon): a possible source for the AD 1837 earthquake, J. Struct. Geol., 28, 1483–1495, doi:10.1016/j.jsg.2006.03.038, 2006.
Pellicani, R., Spilotro, G., and Van Westen, C. J.: Rockfall trajectory modeling combined with heuristic analysis for assessing the rockfall hazard along the Maratea SS18 coastal road (Basilicata, Southern Italy), Landslides, 13, 985–1003, doi:10.1007/s10346-015-0665-3, 2016.
Pfeiffer, T. J. and Bowen, T.: Computer simulation of rockfalls, Bull. Assoc. Eng. Geol., 26, 135–146, 1989.
Quennell, A. M.: The Structural and geomorphic evolution of the Dead Sea Rift, J. Geol. Soc. London, 114, 1–24, doi:10.1144/gsjgs.114.1.0001, 1958.
Rinat, Y., Matmon, A., Arnold, M., Aumaître, G., Bourlès, D., Keddadouche, K., Porat, N., Morin, E., and Finkel, R. C.: Holocene rockfalls in the southern Negev Desert, Israel and their relation to Dead Sea fault earthquakes, Quaternary Res., 81, 260–273, doi:10.1016/j.yqres.2013.12.008, 2014.
Ritchie, A. M.: The evaluation of rock fall and its control, Highw. Res. Rec., 17, 13–28, 1963.
Scholz, C. H.: The Mechanics of Earthquakes and Faulting, Cambridge Univ. Press, New York, 2002.
Shapira, A.: An updated map of peak ground accelerations for Israeli Standard 413, available at: http://www.gii.co.il/heb/Teken/report_413.htm, 2002.
Shtober-Zisu, N.: Quaternary tectonic geomorphology along the Naftali Mountain front, PhD dissertation, Tel Aviv University, Tel Aviv, 159 pp., 2006.
Siman-Tov, S.: The Geomorphic and Mechanical Conditions for Rock-Falls: Rama Cliff, Zurim Escarpment, M.Sc thesis, The Hebrew University, Jerusalem, 88 pp., 2009.
Siman-Tov, S., Katz, O., and Matmon, A.: Examining the effects of ground motion and rock strength on the size of boulders falling from an overhanging cliff, Eng. Geol., 220, 164–174, https://doi.org/10.1016/j.enggeo.2017.02.008, 2017.
Sneh, A. and Weinberger, R.: Geology of the Metulla quadrangle 1:50 000: Implications for the stratigraphic division and the fault system around the Hula Valley, Geol. Surv. Isr., Jerusalem, 2003a.
Sneh, A. and Weinberger, R.: Geology of the Metulla quadrangle, northern Israel: Implications for the offset along the Dead Sea Rift, Isr. J. Earth Sci., 52, 123–138, doi:10.1560/1G3J-NX0H-KBL3-RUY9, 2003b.
Strunden, J., Ehlers, T. A., Brehm, D., and Nettesheim, M.: Spatial and temporal variations in rockfall determined from TLS measurements in a deglaciated valley, Switzerland, J. Geophys. Res.-Earth, 120, 1251–1273, doi:10.1002/2014JF003274, 2015.
TOI, Staff: Towns flood in north as forecasts see cold snap; snow in Jerusalem, The Times of Israel, availabe at: https://www.timesofisrael.com/towns-flood-in-north-as-forecasts-see-cold-snap-snows-later-this-week, last access: 14 January 2019.
Varnes, D. J.: Slope movement types and processes, in: Landslides, analysis and control, Special Re, edited by: Schuster, R. L. and Krizek, R. J., Transportation Research Board, National Research Council, Washington, DC, 11–33, 1978.
Vidrih, R., Ribicic, M., and Suhadolc, P.: Seismogeological effects on rocks during the 12 April 1998 upper Soca Territory earthquake (NW Slovenia), Tectonophysics, 330, 153–175, 2001.
Wechsler, N., Katz, O., Dray, Y., Gonen, I., and Marco, S.: Estimating location and size of historical earthquake by combining archaeology and geology in Umm-El-Qanatir, Dead Sea Transform, Nat. Hazards, 50, 27–43, doi:10.1007/s11069-008-9315-6, 2009.
Wechsler, N., Rockwell, T. K., Klinger, Y., Štěpančíková, P., Kanari, M., Marco, S., and Agnon, A.: A paleoseismic record of earthquakes for the dead sea transform fault between the first and seventh centuries C.E., Nonperiodic behavior of a plate boundary fault, B. Seismol. Soc. Am., 104, 1329, doi:10.1785/0120130304, 2014.
Wei, L.-W., Chen, H., Lee, C.-F., Huang, W.-K., Lin, M.-L., Chi, C.-C., and Lin, H.-H.: The mechanism of rockfall disaster: A case study from Badouzih, Keelung, in northern Taiwan, Eng. Geol., 183, 116–126, https://doi.org/10.1016/j.enggeo.2014.10.008, 2014.
Weinberger, R., Gross, M. R., and Sneh, A.: Evolving deformation along a transform plate boundary: Example from the Dead Sea Fault in northern Israel, Tectonics, 28, TC5005, doi:10.1029/2008TC002316, 2009.
Whalley, W. B.: Rockfalls, in Slope Stability, edited by: Brunsden, D. and Prior, D. B., Wiley, New York, 217–256, 1984.
Wieczorek, G. F. and Jäger, S.: Triggering mechanisms and depositional rates of postglacial slope-movement processes in the Yosemite Valley, California, Geomorphology, 15, 17–31, 1996.
Wintle, A. G.: Fifty years of luminescence dating, Archaeom., 50, 276–312, 2008.
Wintle, A. G. and Murray, A. S.: A review of quartz optically stimulated luminescence characteristics and their relevance in single-aliquot regeneration dating protocols, Radiat. Meas., 41, 369–391, doi:10.1016/j.radmeas.2005.11.001, 2006.
Yagoda-Biran, G., Hatzor, Y. H., Amit, R., and Katz, O.: Constraining regional paleo peak ground acceleration from back analysis of prehistoric landslides: Example from Sea of Galilee, Dead Sea transform, Tectonophysics, 490, 81–92, doi:10.1016/j.tecto.2010.04.029, 2010.