the Creative Commons Attribution 4.0 License.
the Creative Commons Attribution 4.0 License.
A statistical analysis of TIR anomalies extracted by RSTs in relation to an earthquake in the Sichuan area using MODIS LST data
Ying Zhang
Qingyan Meng
Research in the field of earthquake prediction has a long history, but the inadequacies of traditional approaches to the study of seismic threats have become increasingly evident. Remote sensing and Earth observation technology, an emerging method that can rapidly capture information concerning anomalies associated with seismic activity across a wide geographic area, has for some time been believed to be the key to overcoming the bottleneck in earthquake prediction studies. However, a multi-parametric method appears to be the most promising approach for increasing the reliability and precision of short-term seismic hazard forecasting, and thermal infrared (TIR) anomalies are important earthquake precursors. While several studies have investigated the correlation among TIR anomalies identified by the robust satellite techniques (RSTs) methodology and single earthquakes, few studies have extracted TIR anomalies over a long period within a large study area. Moreover, statistical analyses are required to determine whether TIR anomalies are precursors to earthquakes. In this paper, RST data analysis and the Robust Estimator of TIR Anomalies (RETIRA) index were used to extract the TIR anomalies from 2002 to 2018 in the Sichuan region using Moderate Resolution Imaging Spectroradiometer (MODIS) land surface temperature (LST) data, while the earthquake catalog was used to ascertain the correlation between TIR anomalies and earthquake occurrences. Most TIR anomalies corresponded to earthquakes, and statistical methods were used to verify the correlation between the extracted TIR anomalies and earthquakes. This is the first time that the ability to predict earthquakes has been evaluated based on the positive predictive value (PPV), false discovery rate (FDR), true-positive rate (TPR), and false-negative rate (FNR). The statistical results indicate that the prediction potential of RSTs with use of MODIS is limited with regard to the Sichuan region.
- Article
(5095 KB) - Full-text XML
- BibTeX
- EndNote
Changes in the surface temperature of the Earth's crust prior to the occurrence of earthquakes have been attested to by numerous observations (Tronin et al., 2002). Thermal infrared (TIR) remote sensing has recently emerged as a promising technique for detecting seismic precursors. Anomalous TIR emissions have been detected by satellite sensors prior to the occurrence of major earthquakes (Piroddi et al., 2014). Several studies have detected space–time anomalies in TIR satellite imagery, ranging from weeks to days both before and after earthquakes (Wang, 1984; Gorny et al., 1988; Qiang et al., 1991; Tronin, 1996; Tramutoli et al., 2001, 2015a, b; Ouzounov and Freund, 2004). The investigation of TIR signals as seismic precursors has gained traction worldwide, particularly in Russia, China, India, the United States, and Italy, while Saraf et al. (2009) observed similar short-term anomalies in the epicentral regions of earthquakes in India, Algeria, Iran, China, Pakistan, and Indonesia using National Oceanic and Atmospheric Administration Advanced Very High Resolution Radiometer (NOAA-AVHRR), Terra/Aqua-Moderate Resolution Imaging Spectroradiometer (MODIS) and passive microwave Defense Meteorological Satellite Program Special Sensor Microwave/Imager (DMSP-SSM/I) satellite data, applying the term “transient TIR anomalies” (Saraf et al., 2009).
There are few analytical techniques that can isolate residual TIR variations potentially associated with earthquake occurrence from TIR signals of normal variability attributable to other causes (Tramutoli et al., 2005). However, in over 10 years (since 2001) of applying the general robust satellite techniques (RSTs) (Tramutoli, 1998, 2005, 2007) methodology to the investigation of this issue, the potential of this approach for discriminating anomalous TIR signals potentially associated with seismic activity from normal fluctuations in the Earth's thermal emissions related to other causes (e.g., meteorological), independent of seismic activity, has been verified (Eleftheriou et al., 2016). RSTs are based on the robust AVHRR technique (RAT), which was developed for environmental monitoring using NOAA-AVHRR observations (Tramutoli, 1998). Since that time, most reported applications of RAT have demonstrated the technique's reliability and exportability for different satellite sensors and geographic areas, and the RAT has evolved into an RST (Tramutoli, 2007). The RST comprises two main steps: the first is the characterization of behavior under normal conditions; and the second is the establishment of the change-detection criteria that should be specified for each class of phenomenon considered, and for the selected technology and the time and place of the observation (Tramutoli, 2007).
Several studies have used RSTs to extract and analyze the space–time distribution of TIR anomalies (henceforth, all TIR anomalies mentioned were extracted using RSTs) relating to different earthquakes. Using MODIS land surface temperature (LST) data, Pergola et al. (2010) studied the 6 April 2009 Abruzzo earthquake and found that spatially extended and time-persistent TIR anomalies (Robust Estimator of TIR Anomalies, RETIRA > 3) occurred with some degree of space–time correlation with earthquakes of various magnitudes that occurred in Italy during the period under consideration (15 March–15 April) and from 7 days prior to the main shock in Abruzzo (Pergola et al., 2010). Meanwhile, Bellaoui et al. (2017) studied the 21 May 2003 Boumerdes earthquake and detected a TIR anomaly that had persisted for 1 week during the preceding month (Bellaoui et al., 2017). Several studies have also used data from other satellites: Aliano et al. (2007) used 8 years' worth of Meteosat TIR observations to analyze the 21 May 2003 Thenia, Boumerdes (Algeria) earthquake and found that the area of interest was affected by significant positive thermal anomalies (S∕N > 2.5–3) around 1 month before the main shock (Aliano et al., 2007), while Lisi et al. (2010) studied the 6 April 2009 Abruzzo earthquake using NOAA-AVHRR TIR observations and identified TIR anomalies that had some degree of space–time correlation with the Abruzzo earthquake's epicenter between 30 March and 1 April (Lisi et al., 2010). Genzano et al. (2010) also studied the 2009 Abruzzo event using different satellite data (5 years of Meteosat Second Generation's Spinning Enhanced Visible and Infrared Instrument (MSG SEVIRI) observations, 15 years of NOAA-AVHRR observations, and 8 years of Earth Observation System (EOS) MODIS observations), but no similar results have been observed (Genzano et al., 2010). In addition to analyzing the TIR anomalies for a single earthquake, Tramutoli et al. (2013) studied the causes of TIR anomalies – a test over an area affected by variable gas emissions – to determine the correlation between TIR anomalies and seismicity and found that general gas dispersion models and spatial features lend support to the hypothesis of a robust relationship between greenhouse gas emissions and TIR anomalies related to seismic activity (Tramutoli et al., 2013).
Several researchers have conducted long-term statistical analyses to determine the correlation between TIR anomalies and earthquakes. Genzano et al. (2015) used GMS-5/VISSR TIR measurements to investigate earthquakes with M>4 that occurred in a wide area surrounding Taiwan, during the month of September from 1995 to 2002; the false-positive rate (FPR) remained at zero when earthquakes with M>4 or 4.5 were considered, and the FPR remained under 6 % when a threshold of M>5 was applied (Genzano et al., 2015). Tramutoli et al. (2015a) studied earthquakes with M>4 in the southern Apennines in Italy's Po Plain from July 2012 to June 2013 and found that the FPR was less than 33 %, while the missing rate was as high as 67 % (Tramutoli et al., 2015a). Eleftheriou et al. (2016) studied earthquakes that occurred in Greece between 2004 and 2013 using TIR images acquired with MSG SEVIRI and found that more than 93 % of all identified TIR anomalies occurred in the prefixed space–time window around the time and location of earthquakes with M>4, with an overall FPR < 7 % (Eleftheriou et al., 2016). It seems that RSTs are an effective means of extracting TIR anomalies that occur as precursors to earthquakes, but no such study has hitherto been conducted on the Chinese mainland.
Several studies, however, have proven that some individual earthquake results are unreliable. Some TIR anomalies are caused by meteorological anomalies that are unrelated to earthquakes. For example, Matthew et al. studied the Gujarat (India) earthquake of 2001 and found that previous studies, which had indicated the presence of TIR anomalies prior to the earthquake, were unreliable. They concluded that there was no robust evidence for the existence of LST anomalies prior to the 2001 Gujarat earthquake and that cloud cover was a possible cause of the anomalies (Blackett et al., 2011). As such, rigorous statistical analyses of TIR anomalies over long periods are necessary.
In this paper, an RST is applied to a mountainous area in China. A long-term analysis (from September 2002 to March 2018) is used to verify the correlation between TIR anomalies and earthquakes. Based on the statistical results, the earthquake prediction potential of RSTs will be evaluated.
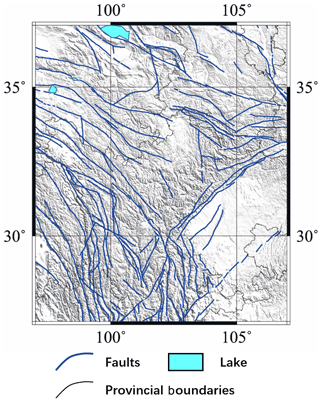
The southeastern Gansu province and its neighboring regions were selected as the study area and used to assess the correlation between TIR anomalies and earthquakes from September 2002 to March 2018. As shown in Fig. 1, the range of the study area is 27 to 37∘ N, 97 to 107∘ E. The study region is located at the intersection of the Gansu, Qinghai, and Sichuan provinces; it also includes the intersection of the northern section of the north–south seismic belt and the Kuma seismic belt. Structures in this area are complex and strong earthquakes are frequent (Yang et al., 2002). The area is on the eastern edge of the Tibetan Plateau and belongs to the upper part of the rhombic block in the southeastern Gansu province. The Xian River fault, the Longmen Shan fault, and the Anning River fault intersect here, and the structure is Y shaped. This type of geomorphology is widely encountered in plate tectonics, and the Longmen Shan fault in the north–northeast direction becomes a steep slope in the southeastern Sichuan Basin and an erosion plateau northwest of the study area.
3.1 Data introduction
MODIS data are used to calculate the TIR anomalies, and the earthquake information used for statistical analysis was provided by the China Earthquake Data Center (http://data.earthquake.cn, last access: 7 March 2019).
The MODIS instrument is used on both the Terra and Aqua spacecrafts. It has a swath width of 2330 km and views the Earth's entire surface every 1 to 2 days. Its detectors measure 36 spectral bands between 0.405 and 14.385 µm, and it can acquire data at three spatial resolutions: 250, 500, and 1000 m. In this study, nighttime MODIS LST daily data (MYD11C1) are used to extract TIR anomalies. Because LST data are susceptible to solar radiation during the daytime, nighttime data are selected for use. The LST data were retrieved at 5600 m using the generalized split-window algorithm. In the day–night algorithm, daytime and nighttime LSTs are retrieved from pairs of day and night MODIS observations in seven TIR bands. Moreover, the daily nighttime cloud mask data (MYD35L2) are used to exclude the LST data covered by the cloud. The resolutions of the cloud mask data are 250 and 1000 m, so the resolution must be downscaled to correspond with the LST data.
Earthquakes caused by block movement and crust compression represent an extreme type of geological movement; earthquakes are instantaneous bursts of accumulated energy, and they may result in the presence of TIR anomalies across a large area. Earthquake occurrences within the study area will also cause TIR anomalies close to its boundaries; therefore, for the earthquakes that occurred within the area 25 to 40∘ N, 95 to 110∘ E will also be analyzed to examine the TIR anomalies at 27 to 37∘ N, 97 to 107∘ E. However, earthquakes attributed to ground subsidence and anthropogenic factors are not associated with TIR anomalies, and therefore earthquakes with depth = 0 are excluded from analysis. Tronin et al. (2002) observed that anomalies were sensitive to crustal earthquakes with magnitudes of more than 4.7 and over distances of up to 1000 km (Tronin et al., 2002). Therefore, we selected earthquakes of M≥3.5 and depth > 0 that occurred within the area of 25 to 40∘ N, 95 to 110∘ E for analysis, and after screening, a total of 3615 earthquakes satisfied these conditions.
3.2 RST methodology
The RST approach is based on multi-temporal analyses of historical satellite observational data sets acquired under similar observational conditions (Eleftheriou et al., 2016). Since the surface environment is relatively constant, high- and low-temperature locations are also relatively consistent. Over time, the infrared brightness temperature will change, albeit very gradually, and in small increments with obvious seasonal characteristics. Aside from the influences of meteorological factors and earthquake TIR anomalies, the brightness temperature within the same area and during the same time period exhibits robust stability and regularity. Therefore, the basic principle that guides RSTs is that the background field is constructed to extract the thermal anomalies, and the mean and variance of the LST are used to evaluate the degree of TIR anomaly.
This method consists of three main steps, as follows.
Pre-processing
-
An RST is used to construct a reference, which is considered to be in a normal state under no influence from other factors, and to measure and extract the anomalies at the corresponding time. V(r,t) are LST data in location r at time t. Therefore, the first step is to eliminate the data affected by clouds and to remove outliers.
-
To eliminate the effect of day-to-day climatological changes or seasonal time drifts, pre-processing is applied to the daily LST data:
where ΔV(r,t) is the difference between the value of LST acquired at time t in location r and its spatial average, V(t) computed in the investigated area considering only those pixels belonging to the same class; in this study area, all pixels belong to the land class.
-
The cloud mask is constructed using cloud mask data (MYD35L2). To ensure that only cloud-free radiances contribute to the computation of the reference fields (RFs), not only those pixels but also the 24 pixels in the surrounding 5×5 area (frequently belonging to cloud edges) are excluded from the following RF computations (Eleftheriou et al., 2016).
-
An outlier mask is constructed.
This step is to determine the outliers, and these values should be excluded from the construction of the background field and the extraction of TIR anomalies.
As it is shown in Eq. (3), are three kinds of data that should be excluded from the construction of backfields. As demonstrated by Aliano et al. (2008) and Genzano et al. (2009), the spatial distribution of clouds over a thermal heterogeneous scene can significantly change the value of ΔV in the cloud-free pixels (Aliano et al., 2008; Genzano et al., 2009). The large cloud cover area will introduce a cold spatial average effect to the computation of the RFs, so that when (here, μV is the temporal average and the σV is its standard – these pixel values will be excluded; Eleftheriou et al., 2016).
Moreover, even where no cold spatial average effect is produced, extended cloud coverage can determine the V(t) values and the values of the considered signal ΔV(r,t), scarcely representative of the actual conditions of cloud-free pixels, so that, when the cloudy fraction of the land portion of the scene is >80 %, all pixels must be excluded from the computation of the RFs (Eleftheriou et al., 2016).
δ3 is used to remove the outliers (where k≥2), and its expression is as follows:
was computed using an iterative kσ-clipping technique, which begins by computing δ(rtτ) based on the first determination of and and continues by updating their values using only space–time locations with , as follows:
. The process should be iterated until no further exclusions are determined, using the latest determination of δ (Tramutoli, 1998). The final result of δ is the A2 that we want.
-
Computing reference fields
-
The μΔV(rτ,ΔT) is the mean of location r for time series T. The variance is applied at time τ using homogeneous historical records collected under the temporal constraint , and the VREF(rτ,ΔT) is the background field.
Change detection
-
The RETIRA (Filizzola, 2004) must be computed, and the bigger the absolute value is, the more evident the anomaly is. is the RETIRA of location r at time τ, which belongs to the time series T.
-
Whether is affected by cloud should be determined. From the results, it may easily be concluded that some areas will lack data at certain times, and for these scenarios a special value must be implemented to indicate that these data are affected by clouds and should be excluded from the ensuing analyses.
3.3 Identification of TIR anomalies
After the calculation of , the next step is to identify the TIR anomalies and correlate them with earthquake occurrences. In this paper, a that exceeds the threshold indicates the presence of a TIR anomaly; further conditions will be applied to confirm the correlation. For and eq(r,t), only in those cases where the following conditions are satisfied can it be concluded that the TIR anomaly is related to eq(r,t):
-
The RETIRA > 2. In Eleftheriou's study, the threshold was set to 4 (Eleftheriou et al., 2016); however, from a statistical perspective, when the value is greater than 2 times the standard deviation, it already falls within the abnormal category. In this study, therefore, the threshold is set to 2.
-
The V(r,t) is not blocked by clouds or affected by other factors.
-
Spatial persistence: the TIR anomalies cluster together and are not isolated, being part of a group covering at least 150 km2 within an area of 1∘ × 1∘ (400 pixels in the images).
-
Temporal persistence: at least one more TIR anomaly appears within 7 days after the first TIR anomaly.
-
The TIR anomalies appear 30 days before or 15 days after the eq(r,t) (Eleftheriou et al., 2016) .
-
The shortest distance from a given point in the TIR anomalies group to the epicenter of eq(r,t) is less than RD=100.43M.
The TIR anomalies satisfy conditions 1, 2, 3, and 4, but do not satisfy at least either 5 or 6, TIR anomalies are present with no corresponding earthquake. There are also cases wherein no TIR anomalies occur.
A comprehensive statistical analysis and the TIR extraction results are detailed in this section. In Sect. 4.1, a statistical analysis is conducted to ascertain the basic seismological conditions in the study area, while the statistical results for the correlation between earthquakes and TIR anomalies are presented and analyzed in Sect. 4.2. Finally, an analysis of the earthquake prediction potential of RSTs is presented in Sect. 4.3.
4.1 Statistical analysis of earthquake activity in the study area
Prior to investigating the correlation between TIR anomalies and earthquakes, a simple analysis of the temporal and spatial characteristics of the earthquakes is required.
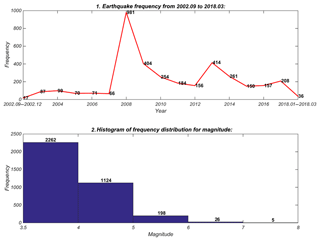
First, the temporal distribution shows that the seismicity from 2002 to 2018 was most active in 2008 and that it increased in frequency and violence from that time. The bottom of Fig. 2 indicates that there were 3615 earthquakes in the study area (, 2262; , 1124; , 198; , 26; and , 5). Therefore, the study area is characterized by severe seismic activity. As may be seen from the upper part of Fig. 2, the average earthquake frequency during period A (from September 2002 to December 2007) was around 78. However, the total number of earthquakes in 2008 increased to 981 including the 12 May 2008 Ms 8.0 Wenchuan earthquake, the most serious earthquake in China in recent years. Although the frequency decreased substantially after 2008 (the average frequency during this period was 243), it remained much higher than it had been during period A. The temporal distribution indicates that seismic activity prior to 2008 had been relatively weak, but in 2008, the seismic activity was extremely intense and reached its peak. After 2008, seismicity in this area continued to maintain this intensity.
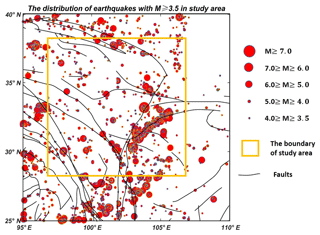
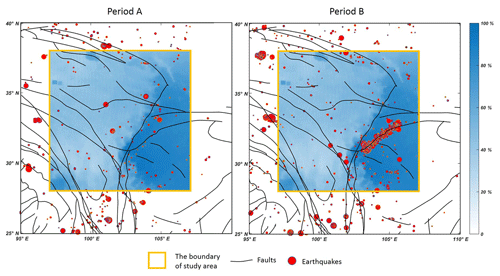
Figure 3The spatial distribution of earthquakes in the study area. The orange rectangle represents the study area (27 to 37∘ N, 97 to 107∘ E). Earthquakes beyond the parameters of the study area are shown because earthquakes close to the study area may also cause TIR anomalies within the study area.
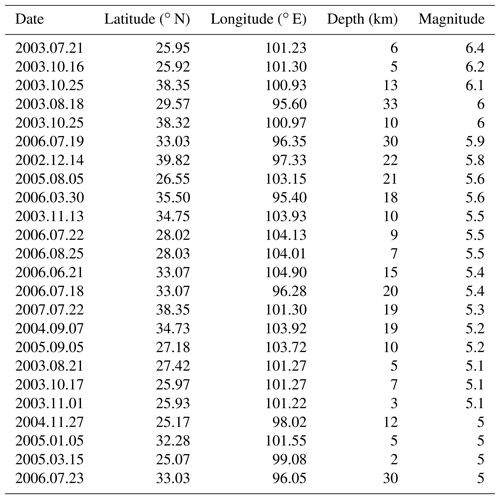
Further evidence is presented in Table 1, where earthquakes of M≥5.0 that occurred during period A (from September 2002 to December 2007) are detailed. There were 229 earthquakes of M≥5.0, while the total number during period A was 24, which accounted for 10.48 % overall; the duration of period A accounted for 33.87 % of the total time frame (i.e., period A plus period B). Moreover, there were no earthquakes of M≥6.5 during period A, but there were 14 earthquakes of M≥6.5 during period B (from January to March 2018). All of this evidence indicates that seismic activity during period B was significantly more violent and frequent.
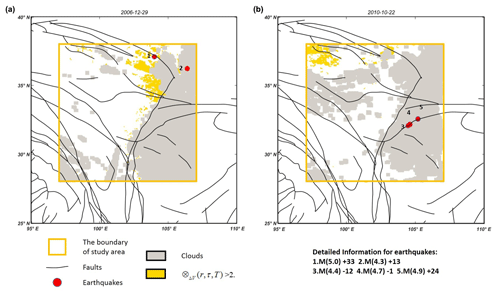
Figure 4Two examples of the correlation between TIR anomalies and earthquakes: (a) is the TIR anomaly recorded on 29 December 2006 that corresponded to two earthquakes, and (b) is the TIR anomaly recorded on 22 October 2010 that did not correspond to earthquakes.
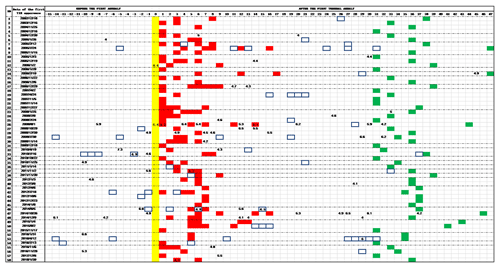
Figure 5Correlation analysis among TIR anomalies and earthquakes with magnitude bigger than 4.0 in the Sichuan area from September 2002 to March 2018. All 61 TIR anomalies are identified, and each row corresponds to one TIR anomaly. The first day of the TIR anomaly is shown in yellow, while the red cells denote the ensuing persistence. The cells in the blue rectangle indicate that this day is affected by a large area of cloud cover, and the green cell is the final limitation for each anomaly. Cells with numbers indicate days of occurrence and magnitude of seismic events. The rows in the dotted box mean that there is no earthquake corresponding to this TIR anomaly.
Figure 3 shows the spatial distribution of earthquakes within the study area. The results indicate that seismic events are clustered primarily in the west and center of the study area (25 to 40∘ N, 95 to 110∘ E), which are mountainous regions. The earthquakes are mainly aggregated along faults, with a much sparser spatial distribution in the east and in the Sichuan Basin. There is a clustering phenomenon centered on earthquakes of M≥6, since earthquakes usually occur along the fault lines of active geological movements.
The purpose of investigating the temporal and spatial characteristics of earthquakes is to acquire a general understanding of the seismic activities within the study area. There is another important reason, however, which is to avoid significant accumulation of earthquakes within a short time frame, and concentrated within a small area, with the result that the same TIR anomaly corresponds to numerous earthquakes: this phenomenon excessively distorts the statistical results presented above. Around 233 earthquakes were observed to occur after the 12 May 2008 Ms 8.0 Wenchuan earthquake, in locations close to the epicenter of the Wenchuan event. In Sect. 4.2, the statistical analysis will be divided into two sections: one dealing with the earthquakes that occurred during period C (from April to July 2008) and the other dealing with those that occurred outside of period C.
4.2 Statistical analysis of the correlation between TIR anomalies and earthquakes
In this section, TIR anomalies are extracted and a statistical analysis of the correlation between TIR anomalies and earthquakes of M≥4 is conducted. Evaluation of the TIR anomalies conforms strictly to the guidelines detailed in Sect. 3.3.
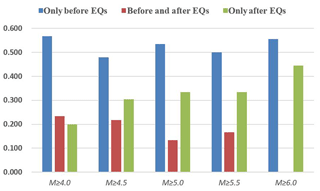
Figure 6Distribution of TIR anomalies with respect to earthquake occurrences for different classes of magnitude.
As shown in Fig. 4, the TIR anomalies are extracted using an RST and the identification rules are applied to determine the correlation between TIR anomalies and earthquakes. After extraction, the total number of TIR anomalies is 58 and the correlation results are presented in Fig. 5. Considering the examples reported in Fig. 4, which are summarized in rows 17 and 34, the cells in yellow corresponding to the first day of TIR anomaly are 29 December 2006 and 22 October 2010. It may be concluded based on Fig. 5 that 30 TIR anomalies correspond to earthquakes, while the other 28 do not (rows 1, 2, 3, 4, 7, 8, 9, 13, 15, 16, 18, 19, 20, 21, 22, 31, 34, 36, 38, 41, 42, 43, 44, 45, 49, 50, 51, and 54). The correlation rate is 51.7 %. It may be seen from Fig. 6 that most TIR anomalies appear as precursors to earthquakes.
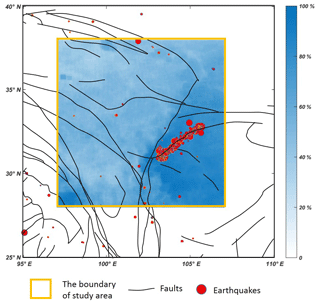
Figure 7The distribution of earthquakes and the frequency of each pixel blocked by cloud cover in period C; higher values indicate that the pixels are more frequently blocked by clouds.
However, as mentioned in Sect. 4.1, period C may be associated with a significant increase in the total number of TIR anomalies and the correlation rate. As such, the experiment was also performed without period C. The number of TIR anomalies is still 58 and the correlation rate is 51.7 %, both of which are the same as the former result. Theoretically, the high earthquake frequency and magnitudes of period C should generate numerous TIR anomalies and correlate strongly with earthquakes. However, only a single TIR anomaly corresponding to five earthquakes was observed. Figure 7 may indicate the reason for this: earthquakes cluster along several faults, but the spatial locations of these faults are always blocked by cloud cover with a percentage in excess of 90 %. With the lengthy persistence of cloud coverage over a large area, the TIR anomalies caused by earthquakes during period C cannot be extracted using an RST.
A comprehensive analysis of Fig. 5 reveals that there are 22 TIR anomalies in period A, 15 of which do not correspond to earthquakes, while of the 36 TIR anomalies in period B, 13 do not correspond to earthquakes and the correlation rate reaches 63.9 %, which is significantly higher than 51.7 %. Figures 2 and 8 illustrate this phenomenon: in period A, the earthquake intensity magnitudes are small, the frequency is low, and almost half of all earthquakes occur in the cloudy region or are adjacent to it; therefore, it is difficult to determine any correspondence between the earthquakes and the extracted anomalies, and some anomalies may have not been extracted owing to the cloud cover. Regarding the results from period B, the frequency and magnitudes of earthquakes in sparsely clouded areas are significantly increased, so that TIR anomalies are more likely to be extracted and more likely to correspond to earthquakes.
4.3 Evaluation of the earthquake prediction potential of RSTs using MODIS LST data in Sichuan area
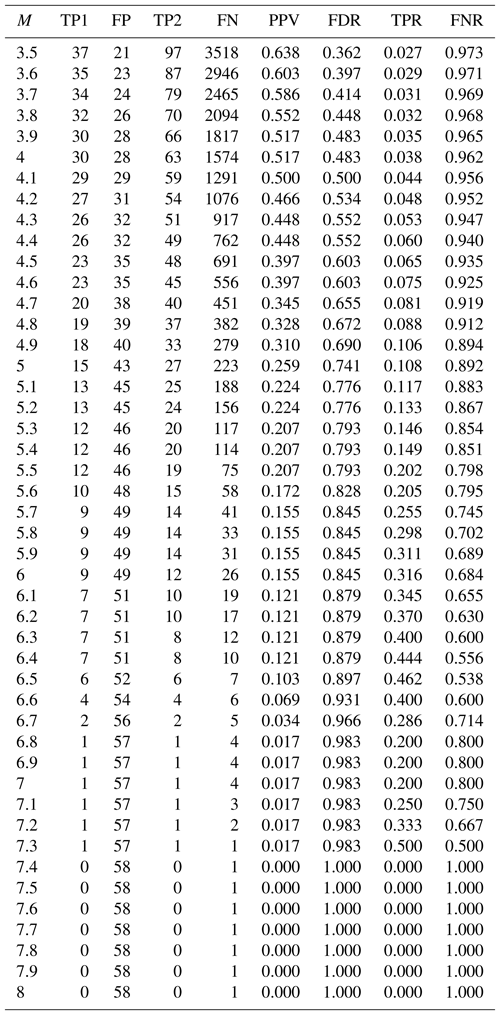
With the aim of evaluating the earthquake prediction potential of RSTs using MODIS LST data for the Sichuan area, the true-positive rate (TPR) of correspondence between TIR anomalies and earthquakes with M≥4.0 alone is insufficient. Therefore, four types of data are incorporated, with four types of ratio calculated as follows:
-
True positive 1 (TP1) is the total number of TIR anomalies that correspond to earthquakes.
-
False positive (FP) is the total number of TIR anomalies that do not correspond to any earthquakes.
-
True positive 2 (TP2) is the total number of earthquakes that correspond to TIR anomalies.
-
False negative (FN) is the total number of earthquakes that do not correspond to any TIR anomalies.
-
Positive predictive value (PPV) is the ratio of TIR anomalies that correspond to earthquakes to the total number of TIR anomalies.
-
False discovery rate (FDR) is the ratio of TIR anomalies that do not correspond to any earthquakes to the total number of TIR anomalies.
-
TPR is the ratio of earthquakes that correspond to TIR anomalies to the total number of earthquakes.
-
FNR is the ratio of earthquakes that do not correspond to any TIR anomalies to the total number of earthquakes.
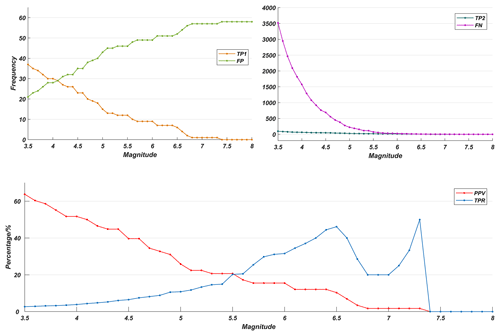
Figure 9The statistical results of earthquakes including period C (from April to July 2008) and the curves TP1, FP, TP2, FN, PPV, and TPR, which correspond to the examples presented in Table 2.
For a more accurate understanding of the eight parameters, an example is presented in Table 2. The example considered the earthquakes of M≥5.0, and the results indicate that 58 (TP1 plus FP) TIR anomalies appeared over the duration of the study period, and 15 (TP1) of these correspond to earthquakes, while the other 43 (FP) do not; as such, the probability of exact correspondence between TIR anomalies and earthquakes is 25.9 % (PPV), while the probability of no correspondence is 74.1 % (FDR). Moreover, 250 (TP2 plus FN) earthquakes of M≥5.0 were recorded in the study area: 27 (TP2) of these correspond to TIR anomalies, while the other 223 (FN) do not; as such, the probability of an exact correspondence between the earthquakes and TIR anomalies is 10.8 % (TPR), while the probability of no correspondence is 89.2 % (FNR). We have calculated the earthquakes with M≥m , and the experiments are conducted both with and without period C. The results show that these do not differ significantly, so in this section only the results including period C are discussed.
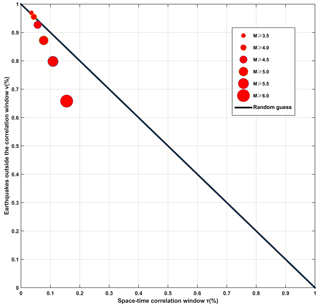
Figure 10Molchan error diagram analysis computed for different classes of magnitude and TIR anomalies during the study period (from September 2002 to March 2018); the red circles refer to earthquakes that occurred before and after the appearance of TIR anomalies.
Table 4A general summary of research on the statistical correlation between TIR anomalies and earthquakes.

As may be seen from Fig. 9, PPV declines as the magnitude increases, while FP is also clearly seen to increase. This phenomenon indicates that, with increased magnitude, the number of TIR anomalies that correspond to the earthquakes decreases. TPR and FN can be seen to decrease steadily as the total number of earthquake samples decrease.
The ratios (PPV and TPR) demand closer attention, however. First, a general perceptual analysis reveals that PPV decreases steadily as M increases, while TPR increases when M≤6.5 and M=6.8–7.3≤6.6 and ; the maximum TPR is 50 % when M=7.3, and TPR decreases when M=6.7–7.1=6.5–6.8=6.7–7.1. When M is 3.5 and 4.0, PPV is 63.8 % and 51.7 %, respectively, indicating that, when a TIR anomaly is evident, there is a 63.8 % (51.7 %) possibility that earthquakes of M≥3.5(4.0) will occur. When M is 5, 6, or 7, PPV is 25.9 %, 15.5 %, 1.7 %, and these are much lower than the PPV of M=3.5 and 4.0. It may be concluded from the change in the PPV curve that, where a TIR anomaly is present, there will be a more than 50 % possibility of an earthquake with M≥3.5(4.0) in the study area. It does not necessarily follow, however, that when there is a TIR anomaly there will be strong earthquakes with M≥5.0 in the study area. On the contrary, the probability that earthquakes of high magnitude will occur remains low.
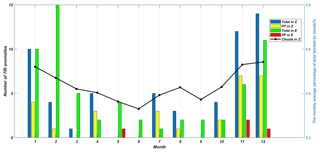
Figure 11The monthly average percentage of the area not blocked by clouds in Zhang's study region, i.e., that of this study. The bar chart presents the numbers of various types of TIR anomaly. “Total in Z” is the total number of TIR anomalies in this study; “FP in Z” is the number of TIR anomalies that do not correspond to any earthquakes in this study; “Total in E” is the total number of TIR anomalies in Eleftheriou's study; “FP in E” is the number of TIR anomalies that do not correspond to any earthquakes in Eleftheriou's study.
The TPR curve indicates the probability that an associated TIR anomaly will be present when earthquakes occur. When M=3.5 the TPR is 2.7 %, and as M increases, TPR increases steadily, although it remains low when and the TPR is lower than 20 %. The results show that lower-magnitude earthquakes are relatively less likely (less than 20 %) to correspond to TIR anomalies, while earthquakes of M≥6.0, which are very destructive, have a relatively high likelihood of corresponding. High correspondence is particularly significant with regard to earthquake prediction: it indicates that destructive earthquakes are considerably more likely to be predictable in this case.
According to both sets of results, we may conclude that, when a TIR anomaly is present, there is a 51.7 % possibility that an earthquake of M≥4.0 will occur, and in the case that earthquakes of M≥6.0 occur, more than one-third correspond to TIR anomalies. Most TIR anomalies correspond to earthquakes of M≥4.0. However, when M≥6.0, the PPV is relatively low, resulting in a higher false-alarm rate for strong earthquakes. TPR increases with magnitude, and when M=7.3, it is 50 %. It may be concluded based on the TPR curve that the greater an earthquake's magnitude, the more effective this method is likely to be in predicting it. However, the PPV and TPR are low, or the FDR and FNR, which are negative with regard to the predictive potential of RSTs, are high. Overall, the false-alarm rate for M≥4.0 is 48.3 %, and as M increases so too does FDR. The missing rate for M≥4.0 is 96.2 %, and it seems that, when M<5.5, there is no obvious correlation between TIR anomalies and earthquakes; nevertheless, TPR tends to increase when M increases, though its maximum remains at 50 %, which is also an unsatisfactory value. As such, the prediction potential of RSTs using MODIS LST data in the Sichuan area is limited. However, it does not indicate that the RST is not effective for earthquake prediction. On the contrary, many other cases prove that this method is very effective for extracting TIR anomalies. The low PPV and TPR may be caused by the limitation of the RST, nature of MODIS LST data, special topographic and weather background of study area, or something else.
To compare these results with those from previous similar studies, a summary of four such studies are presented in Table 3. It is evident that PPV is relatively lower in this study than in the others, so it is important to verify its actual added value in comparison with a random alarm function (see, for example, Eleftheriou et al., 2016). The detailed method is available in chapter 3.4 of Eleftheriou et al. (2016), and the result is presented in Fig. 10. When M≥3.5, the point is at the upper extreme of the random guess, with the result that there is no obvious correlation between TIR anomalies and earthquakes with M≥3.5; rather, the correlation appears to be casual. When M≥4.0 and M≥4.5, both of these points are still very close to the line, though at the lower part, meaning that a noncasual correlation is actually present among the extracted TIR anomalies and earthquakes (M≥4.0 and ≥4.5). However, the correlation is not strong. The result in this study is different from that achieved by Eleftheriou: in her study, the strong correlation between the TIR anomalies and earthquakes is much more evident. This may be attributable to the fact that, as shown in Fig. 8, the eastern and southeastern corners of the study area are consistently blocked by clouds, i.e., over 90 % of the time. Several earthquakes also occur in this area, but insufficient data prevent a correlation between the earthquakes and TIR anomalies, and they are inevitably classified into FNR, which is v in Molchan error analysis, making the correlation weaker. For M≥5.0, 5.5, and 6.0, the points are clear under the random guess, and as M increases, the noncausal correlation is strengthened.
Tronin indicated that the anomaly was sensitive to crustal earthquakes that were of a magnitude greater than 4.7 over a distance of up to 1000 km (Tronin et al., 2002). In this study, however, when M=4.7, the TPR is 9.6 % and the FNR is 90.4 %, and at the point in Fig. 10 at which M≥4.5 is very close to the random guess, the statistical result does not support the theory that the TIR anomaly is sensitive to the earthquakes of M≥4.7. When M≥5.9, earthquakes appear to be sensitive to TIR anomalies, as may be seen from Table 3. This failure to conform to previous conclusions may be attributable to the regional structure and geological movement, cloud cover, and effectiveness of the method for extracting TIR anomalies, among other factors. Further study is required, however.
We calculated the total number of TIR anomalies and numbers of FP for each month in both studies and found that in Eleftheriou's study TIR anomalies clustered in November, September, January, and February, while in the present study they cluster in November, September, and January. A line indicating the percentage of area not blocked by clouds in the Sichuan region is also illustrated in Fig. 11. In this paper, there is a significant positive proportional correlation between the number of TIR anomalies and the area not blocked by clouds. When the percentage is high, the number of TIR anomalies is also high, and when the percentage is low, the number of TIR anomalies is low. Therefore, while several TIR anomalies related to earthquakes may be present, they are blocked by cloud cover and cannot be extracted. However, the question of what the true cause is, i.e., cloud clover, seasonal weather, or some other factor, remains to be answered satisfactorily. Moreover, another interesting phenomenon is that several TIR anomalies that do not correspond to any earthquakes cluster in November and September, both of which are cold months that do not tend to be cloudy. Therefore, the clustering of numerous FPs during these 2 months also remains to be fully investigated.
Statistical analyses of 18 years' worth of data on the correlation between earthquakes and TIR anomalies indicate that 51.7 % of TIR anomalies correspond to earthquakes of M≥4.0 in the Sichuan region, and the higher the M, the more likely it is that the earthquakes will correspond to TIR anomalies. The low PPV and TPR may be attributable to the large portions of the study region that are covered by clouds throughout the year.
The low PPV and TPR suggest that the earthquake prediction potential of RSTs using MODIS LST data with regard to the Sichuan region is limited. For stronger earthquakes, with M≥6.0, although the false-alarm rate is high, the missing rate is relatively low. An RST was applied to the study area and was found to have significant predictive potential with regard to strong earthquakes.
There is no obvious correlation between earthquakes of M<5.0 and the TIR anomalies extracted using RSTs and MODIS LST data in the Sichuan region. However, the underlying causes of this situation merit further investigation.
The RST proposed in this study and in Eleftheriou's study is still considerably affected by cloud cover and seasonal influences. It is necessary to improve and optimize algorithms and statistical methods that facilitate the exclusion of cloud and seasonal influences.
The earthquake information is provided by the China Earthquake Data Center, and it can be downloaded from http://data.earthquake.cn (last access: 7 March 2019). The MODIS LST daily data and daily nighttime cloud mask data are provided by MODIS https://doi.org/10.5067/MODIS/MOD09GA.006 (Vermote and Wolfe, 2015).
YZ was responsible for research concept and design, data collection, analysis, and interpretation, writing of the article, and critical revision of the article. QM was responsible for research concept and design, revision of the article, and final approval of the article.
The authors declare that they have no conflict of interest.
This work was supported by the National Key R & D plan, Intergovernmental
International Scientific and Technological Innovation Cooperation under
grant 2016YFE0122200 and financed by the science and technology
project of Hainan Province under grant ZDYF2018231, the science and technology
cooperation project of Sanya Municipal People's Government under grant 2018YD10, and the National Natural Science Foundation of
China under grant no. 41602223.
Edited by:
Filippos Vallianatos
Reviewed by: Xian Lu and two anonymous referees
Aliano, C., Corrado, R., Filizzola, C., and Pergola, N.: Robust Satellite Techniques (RST) for Seismically Active Areas Monitoring: the Case of 21st May, 2003 Boumerdes/Thenia (Algeria) Earthquake, Analysis of Multi-temporal Remote Sensing Images, 2007, MultiTemp 2007, International Workshop, 18–20 July, Leuven, Belgium, 2007.
Aliano, C., Corrado, R., Filizzola, C., Genzano, N., Pergola, N., and Tramutoli, V.: Robust TIR satellite techniques for monitoring earthquake active regions: limits, main achievements and perspectives, Ann. Geophys.-Italy, 51, 303–317, 2008.
Bellaoui, M., Hassini, A., and Kada, B.: Pre-seismic Anomalies in Remotely Sensed Land Surface Temperature measurements: the Case Study of 2003 Boumerdes Earthquake, Adv. Space Res., 59, 2645–2657, https://doi.org/10.1016/j.asr.2017.03.004, 2017.
Blackett, M., Wooster, M. J., and Malamud, B. D.: Correction to “Exploring land surface temperature earthquake precursors: A focus on the Gujarat (India) earthquake of 2001”, Geophys. Res. Lett., 38, L15303, https://doi.org/10.1029/2011GL049428, 2011.
Eleftheriou, A., Filizzola, C., Genzano, N., Lacava, T., Lisi, M., Paciello, R., Pergola, N., Vallianatos, F., and Tramutoli, V.: Long-Term RST Analysis of Anomalous TIR Sequences in Relation with Earthquakes Occurred in Greece in the Period 2004–2013, Pure Appl. Geophys., 173, 285–303, 2016.
Filizzola, C., Pergola, N., Pietrapertosa, C., and Tramutoli, V.: Robust satellite tecniques for seismically active areas monitoring: a sensitvity analysis on September 7, 1999 Athens's earthquake, Phys. Chem. Earth, 29, 517–527, 2004.
Genzano, N., Aliano, C., Corrado, R., Filizzola, C., Lisi, M., Mazzeo, G., Paciello, R., Pergola, N., and Tramutoli, V.: RST analysis of MSG-SEVIRI TIR radiances at the time of the Abruzzo 6 April 2009 earthquake, Nat. Hazards Earth Syst. Sci., 9, 2073–2084, https://doi.org/10.5194/nhess-9-2073-2009, 2009.
Genzano, N., Corrado, R., Coviello, I., Grimaldi, C. S. L., Filizzola, C., Lacava, T., Lisi, M., Marchese, F., Mazzeo, G., and Paciello, R. A: multi-sensors analysis of RST-based thermal anomalies in the case of the Abruzzo earthquake, Geosci. Remote Symposium, IGARSS 2010, 25–30 July, Honolulu, Hawaii, 2010.
Genzano, N., Filizzola, C., Paciello, R., Pergola, N., and Tramutoli, V.: Robust Satellite Techniques (RST) for monitoring earthquake prone areas by satellite TIR observations: The case of 1999 Chi-Chi earthquake (Taiwan), J. Asian Earth Sci., 114, 289–298, 2015.
Gorny, V. I., Salman A. G., and Tronin, A. A.: Terrestrial outgoing infrared radiation as an indicator of seismic activity, P. Acad. Sci. USSR, 301, 67–69, 1988.
Lisi, M., Filizzola, C., Genzano, N., Grimaldi, C. S. L., Lacava, T., Marchese, F., Mazzeo, G., Pergola, N., and Tramutoli, V.: A study on the Abruzzo 6 April 2009 earthquake by applying the RST approach to 15 years of AVHRR TIR observations, Nat. Hazards Earth Syst. Sci., 10, 395–406, https://doi.org/10.5194/nhess-10-395-2010, 2010.
Ouzounov, D. and Freund, F.: Mid-infrared emission prior to strong earthquakes analyzed by remote sensing data, Adv. Space Res., 33, 268–273, 2004.
Pergola, N., Aliano, C., Coviello, I., Filizzola, C., Genzano, N., Lacava, T., Lisi, M., Mazzeo, G., and Tramutoli, V.: Using RST approach and EOS-MODIS radiances for monitoring seismically active regions: a study on the 6 April 2009 Abruzzo earthquake, Nat. Hazards Earth Syst. Sci., 10, 239–249, https://doi.org/10.5194/nhess-10-239-2010, 2010.
Piroddi, L., Ranieri, G., Freund, F., and Trogu, A.: Geology, tectonics and topography underlined by L'Aquila earthquake TIR precursors, Geophys. J. Int., 197, 1532–1536, 2014.
Qiang, Z. J., Xu, X. D., and Dian, C. G.: Case 27 thermal infrared anomaly precursor of impending earthquakes, Chinese Sci. Bull., 149, 159–171, 1991.
Saraf, A. K., Rawat, V., Choudhury, S., Dasgupta, S., and Das, J.: Advances in understanding of the mechanism for generation of earthquake thermal precursors detected by satellites, Int. J. Appl. Earth Obs., 11, 373–379, 2009.
Tramutoli, V.: Robust AVHRR techniques (RAT) for environmental monitoring: theory and applications, Proc. Spie, 3496, 101–113, 1998.
Tramutoli, V.: Robust Satellite Techniques (RST) for natural and environmental hazards monitoring and mitigation: ten year of successful applications, International Symposium on Physical Measurements and Signatures, 2005.
Tramutoli, V.: Robust Satellite Techniques (RST) for Natural and Environmental Hazards Monitoring and Mitigation: Theory and Applications, Analysis of Multi-temporal Remote Sensing Images, 2007, MultiTemp 2007, International Workshop, 18–20 July, Leuven, Belgium, 2007.
Tramutoli, V., Bello, G. D., Pergola, N., and Piscitelli, S.: Robust satellite techniques for remote sensing of seismically active areas, Ann. Geophys.-Italy, 44, 295–312, 2001.
Tramutoli, V., Cuomo, V., Filizzola, C., Pergola, N., and Pietrapertosa, C.: Assessing the potential of thermal infrared satellite surveys for monitoring seismically active areas: The case of Kocaell (Izmit) earthquake, August 17, 1999, Remote Sens. Environ., 96, 409–426, 2005.
Tramutoli, V., Aliano, C., Corrado, R., Filizzola, C., Genzano, N., Lisi, M., Martinelli, G., and Pergola, N.: On the possible origin of thermal infrared radiation (TIR) anomalies in earthquake-prone areas observed using robust satellite techniques (RST), Chem. Geol., 339, 157–168, 2013.
Tramutoli, V., Corrado, R., Filizzola, C., Genzano, N., Lisi, M., Paciello, R., and Pergola, N.: One year of RST based satellite thermal monitoring over two Italian seismic areas, B. Geofis. Teor. Appl., 56, 275–294, 2015a.
Tramutoli, V., Corrado, R., Filizzola, C., Genzano, N., Lisi, M., and Pergola, N.: From visual comparison to Robust Satellite Techniques: 30 years of thermal infrared satellite data analyses for the study of earthquake preparation phases, B. Geofis. Teor. Appl., 56, 167–202, 2015b.
Tronin, A. A.: Satellite thermal survey, a new tool for the study of seismoactive regions, Int. J. Remote Sens., 17, 1439–1455, 1996.
Tronin, A. A., Hayakawa, M., and Molchanov, O. A.: Thermal IR satellite data application for earthquake research in Japan and China, J. Geodynam., 33, 519–534, 2002.
Vermote, E. and Wolfe, R.: MOD09GA MODIS/Terra Surface Reflectance Daily L2G Global 1 km and 500 m SIN Grid V006, Data set, NASA EOSDIS LP DAAC, https://doi.org/10.5067/MODIS/MOD09GA.006, 2015.
Wang, L.: Anomalous variations of ground temperature before the tangshan and haicheng earthquakes, J. Seismol. Res., 7, 649–656, 1984.
Yang, L. M., Zhang, Y., and Zhang, F. F.: Study on mutual features of middle earthquakes activities before middle-strong earthquakes in east-southern gansu province and its neighbor regions, Plat. Earthq. Res., 14, 1–8, 2002.


