the Creative Commons Attribution 4.0 License.
the Creative Commons Attribution 4.0 License.
 | 13 Dec 2019
Infrasound and seismoacoustic signatures of the 28 September 2018 Sulawesi super-shear earthquake
Peter Gaebler
Lars Ceranna
Alexis Le Pichon
Julien Vergoz
Anna Perttu
Dorianne Tailpied
Benoit Taisne
A magnitude 7.5 earthquake occurred on 28 September 2018 at 10:02:43 UTC near the city of Palu on the Indonesian island of Sulawesi. It was a shallow, strike-slip earthquake with a rupture extending to a length of about 150 km and reaching the surface. Moreover, this earthquake was identified as one of very few events having a super-shear rupture speed.
Clear and long-lasting infrasound signatures related to this event were observed by four infrasound arrays of the International Monitoring System of the Comprehensive Nuclear-Test-Ban Treaty Organization as well as by one national infrasound station in Singapore. Although these infrasound stations SING (Singapore), I39PW (Palau), I07AU (Australia), I40PG (Papua New Guinea) and I30JP (Japan) are located at large distances of between 1800 and 4500 km from the earthquake's epicentral region, the observed infrasound signals associated with this event were intense, including both seismic and acoustic arrivals.
A detailed study of the event-related infrasound observations and the potential infrasound generation mechanisms is presented, covering range-dependent infrasound transmission loss and propagation modeling and characterization of the atmospheric background conditions, as well as identification of the regions of seismoacoustic activity by applying a back-projection method from the infrasound receivers to potential source regions. This back projection of infrasonic arrivals allows one to estimate that the main infrasound source region for the Sulawesi earthquake is related to the extended rupture zone and the nearby topography. This estimation and a comparison to other super-shear as well as large regional earthquakes identify no clear connection between the earthquake's super-shear nature and the strong infrasound emission.
- Article
(8706 KB) - Full-text XML
-
Supplement
(1585 KB) - BibTeX
- EndNote


Indonesia is located in a region with a very high rate of natural seismicity above a complex setting of plate tectonics. Subduction zones of convergent plate boundaries in this region define the largest faults of the earth's crust and the subregion of highest and most intense earthquake activity. In fact, some of the strongest and most destructive earthquakes recorded during the last decades have occurred in Indonesia, like the 2004 moment magnitude (Mw) 9.3 Sumatra–Andaman earthquake and various other events with Mw larger than 8 (Pailoplee, 2017). These strong offshore events can often generate large and devastating tsunamis. Additional crustal-scale faults are also located on the Indonesian island of Sulawesi, including the Palu–Koro fault transecting the northern part of the island (Katili, 1978). The frequent seismic activity associated with this fault was quantified using the United States Geological Survey (USGS) nearby seismicity data link (USGS, 2018), resulting in at least 60 earthquakes larger than body-wave magnitude (mb) 5 within the last 20 years and four events larger than mb 6 prior to the event discussed in this study.
The 28 September 2018 Sulawesi earthquake occurred at 10:02:43 UTC near the Indonesian city of Palu on the island of Sulawesi. It was estimated as a Mw 7.5 strike-slip earthquake (USGS, 2018) along the Palu–Koro fault with a hypocenter location of 0.256∘ S and 119.846∘ E and a depth of about 20 km. Modeling indicates that the majority of the slip occurred shallowly on the fault (above 10 km) with an offset of up to 7 m horizontal slip and a dip slip of up to only 2 m (Socquet et al., 2019). The rupture zone of the event extended north to south over roughly 150 km along the fault and through the city of Palu, with a high rupture velocity of 4.1 km s−1 on average. This indicates it to be a so-called super-shear event, having rupture velocities higher than the corresponding shear velocities (see Bao et al., 2019; Socquet et al., 2019). The phenomenon is comparable to the acoustic sonic boom, an effect where the source travels faster than its emitted waves. Analogous to acoustics, the super-shear rupture generates a shear-wave Mach cone, which may cause enhanced ground motion and result in increased damage potential (Bernard and Baumont, 2005; Doan and Gary, 2009). The Sulawesi earthquake resulted not only in intense ground shaking corresponding to intensity IX on the modified Mercalli intensity scale, but also in liquefaction, landslides, and local tsunamis within Palu Bay (see Heidarzadeh et al., 2019; Omira et al., 2019; Jamelot et al., 2019). A large number of precursory earthquakes as well as aftershocks occurred surrounding this event.
The intense ground shaking of both the epicentral region and the topography nearby the Sulawesi earthquake resulted in strong and clearly observed infrasound signatures, which are the focus of this study. Infrasound, which is the subaudible part of acoustic waves below 20 Hz, is generated by a large number of natural and anthropogenic sources (e.g., see Le Pichon et al., 2010, 2019) and can propagate over distances of thousands of kilometers with little attenuation recorded at highly sensitive infrasound arrays. Many sources of either an explosive or an eruptive characteristic, or those associated with large mass movements, can generate infrasound (e.g., Gibbons et al., 2015a; Pilger et al., 2018), including earthquakes.
Reports on infrasound from earthquakes in the USA (Mutschlecner and Whitaker, 2005) as well as in Peru, China, and Chile (Le Pichon et al., 2002, 2003, 2006) indicate that the epicentral ground movement generates infrasonic pressure waves. Further studies on the Mw 9.3 Sumatra–Andaman earthquake (Le Pichon et al., 2005), on the Mw 9.0 Tohoku earthquake (Walker et al., 2013), and on Italian earthquakes (Marchetti et al., 2016; Shani-Kadmiel et al., 2017; Hernandez et al., 2018) also highlight infrasound generated from tsunami waves hitting the coastline and from secondary phenomena like remote ground motion of mountain chains or of extended basin areas. This secondary infrasound by remote ground motion is often called seismoacoustic waves, since the seismic waves (longitudinal, shear, or surface) generated by an earthquake propagate to distant terrain features where the wave energy is partly converted to atmospheric acoustic waves in the infrasound frequency range (e.g., see Arrowsmith et al., 2010; Hedlin et al., 2012).
Although there are many studies about infrasound generated by earthquakes, only a small number of earthquakes with a super-shear rupture speed have been identified within the last 20 years (for Izmit, Turkey, in 1999, see Bouchon et al., 2000; for Kunlunshan, Tibet, in 2001, see Bouchon and Vallee, 2003; for Denali, Alaska, in 2002, see Dunham and Archuleta, 2004; for Qinghai, China, in 2010, see Wang and Mori, 2012; and for Craig, Alaska, in 2013, see Yue et al., 2013), and only one publication known to the authors identifies and investigates infrasound observations related to a super-shear earthquake, namely the 2002 Denali earthquake (Olson et al., 2003). Therefore, a main objective of this paper is to investigate the potential of a connection between super-shear earthquakes and infrasound recordings of large amplitude.
This paper is structured as follows: Sect. 2 describes the data and methods applied within this study, Sect. 3 highlights the observations of epicentral infrasound and seismoacoustic signatures at remote infrasound arrays, Sect. 4 describes the modeling of infrasound transmission loss as well as propagation and compares it to the observations, and Sect. 5 provides a back-projection approach to identify the acoustic source regions of the observed signals and discusses the event in comparison with similar earthquakes.
This study mainly considers data recorded at infrasound arrays of the International Monitoring System (IMS, e.g., described in Le Pichon et al., 2010, 2019) established under the Comprehensive Nuclear-Test-Ban Treaty (CTBT). The earthquake epicenter and the nearest infrasound stations at distances of between 1800 and 4500 km around the event are shown in Fig. 1.

Figure 1(a) Map of the Sulawesi earthquake epicenter (star) and the locations of the nearest surrounding infrasound stations (the circle corresponds to a single-sensor station and the triangles to multisensor IMS arrays; white-labeled stations registered the event, black-labeled ones did not). (b) Enlarged map of the epicentral source region showing in larger detail the rupture zone passing through the city of Palu. Map background was created using basemap data from the ESRI ArcGIS® Map Service.
The two IMS infrasound stations closest to the earthquake epicenter clearly registered the event (I39PW in Palau and I07AU in northern Australia; see Sect. 3). Two further IMS stations at larger distances found clear indications of signals related to the earthquake (I40PG in Papua New Guinea and I30JP in Japan, also see Sect. 3). However, two other Australian stations (I04AU and I06AU) as well as all of the more distant IMS infrasound arrays recorded no signals related to the earthquake source.
Additional data from a single infrasound sensor in Singapore (SING) were investigated and also showed signatures related to the earthquake (see Fig. S1 of the Supplement). However, due to a lack of array calculations and directional information by only a single sensor, no further use has been made of these data.
The PMCC method (progressive multichannel correlation; see Cansi, 1995) used in this study is available from the DTK-GPMCC application in the National Data Center (NDC)-in-a-Box package. The main objective of the NDC-in-a-Box project is to offer the capability to process and analyze seismic, infrasound, and hydroacoustic data to all NDCs of CTBT member states, enabling them to become active contributors to the verification regime of the CTBT. Technically, the NDC-in-a-Box project consists of a number of automatic and interactive software tools which are packaged in a virtual machine distributed by the CTBT International Data Center (IDC). Among this set of software, DTK-GPMCC is the interactive array processing tool. It allows users to configure and run the PMCC detector from waveforms of any technology and to display and analyze the results. PMCC is applied to the raw differential pressure recordings at each of the IMS infrasound arrays' microbarometers to derive advanced data parameters like back azimuth, apparent velocity, and frequency content of coherent signals associated with different events (see Fig. 2). Back azimuth reflects the horizontal direction of signal origin, while apparent velocity indicates the arrival inclination, where higher values correspond to propagation from higher-altitude ducts. Signals are identified as pixel information in distinct time steps and frequency bands, and they are clustered to signal families related to the same event. The 1∕3 octave band configurations with an inverse-frequency-distributed window length are implemented between 0.01 and 4.4 Hz (Garcés, 2013). Signals can be associated with a certain source by, e.g., applying cross-bearing techniques on the back-azimuth directions of two or more arrays (Matoza et al., 2017). The seismic or acoustic origin as well as the propagation path of signals, e.g., ducting via the stratosphere or thermosphere (Drob et al., 2003), can be inferred from the apparent velocity and frequency content of the recordings.
In order to further investigate and understand the infrasound detection pattern in the region following the Sulawesi earthquake, various simulations were performed to compute acoustic transmission loss and to simulate infrasound propagation between the source and the stations. Infrasound transmission loss at the surface level (see Fig. 3) was calculated using a frequency-dependent, semiempirical modeling technique coupled with realistic atmospheric specifications along the infrasound propagation path (Le Pichon et al., 2012; Tailpied et al., 2017) in order to draw a range- and frequency-dependent attenuation map estimating the acoustic pressure loss between source and receivers in decibels (dB). The transmission loss of the signal at each station is associated with a confidence index that integrates uncertainties from the propagation modeling and the atmospheric specifications. Infrasound propagation (see Fig. 4) was modeled using a two-dimensional parabolic-equation method (NCPA PAPE; see Waxler et al., 2017) to quantify and visualize the ducting as well as amplitude decrease between source and receivers.
In both the semiempirical and the parabolic-equation-based transmission loss estimates, data from the European Centre for Medium-Range Weather Forecasts (ECMWF) meteorological model are used to derive the effective sound speed as the most important background parameter for infrasound propagation. Indeed, this parameter, defined as adiabatic sound speed modified by horizontal winds in the propagation direction of the modeled sound, is used to provide the atmospheric background conditions along the propagation path between the source and the stations (Wilson, 2003). Ducting along tropospheric, stratospheric, or thermospheric waveguides (Drob et al., 2003) can be estimated in the same manner as the total amplitude loss from geometric spreading as well as atmospheric attenuation (Sutherland and Bass, 2004). ECMWF values are used from 0 to 60 km altitude and merged with temperature and wind climatologies above (MSISE00 and HWM07; see Picone et al., 2002; Drob et al., 2008) to provide seamless effective sound speed profiles from 0 to 140 km altitude.
Back projection of the coherent earthquake-related signals observed at infrasound arrays to their source region is performed within this study using a seismoacoustic method similar to that of Marchetti et al. (2016) or Shani-Kadmiel et al. (2017), which is also part of the built-in capabilities of PMCC (see Fig. 5). Assumed is a conversion of the initial seismic wave with crustal propagation velocities of, e.g., 4 km s−1 to acoustic waves with an average speed of, e.g., 0.3 km s−1 at certain terrain features, like steep or flat topography such as mountain chains, islands, cliffs, or extended plains. This method identifies the seismoacoustic conversion areas and thus infrasonic source regions for the signals observed, taking into account the arrival time and back-azimuth direction relative to a point source in space and time, here the Mw 7.5 earthquake epicenter, for each PMCC pixel. The cumulative sum and frequency of occurrence of the back-projected origin locations therefore allows for the identification of infrasonic source regions, either of epicentral or seismoacoustic origin.
The 28 September 2018 Sulawesi earthquake was identified in the recordings of four IMS infrasound arrays: I39PW, I07AU, I40PG, and I30JP. Differential pressure recordings from these stations for 4 to 6 h following the earthquake origin time (10:02:43 UTC) are analyzed using the PMCC method described in Sect. 2. Signal parameters related to the earthquake are extracted from the PMCC results in terms of arrival time and duration as well as direction of origin (back azimuth) and apparent signal velocity.
Table 1Findings from the observations of five infrasound stations and from theoretical distance–azimuth calculations to the Sulawesi epicenter. Main signal groups are labeled with “IS” (infrasound) and “SA” (seismoacoustic).
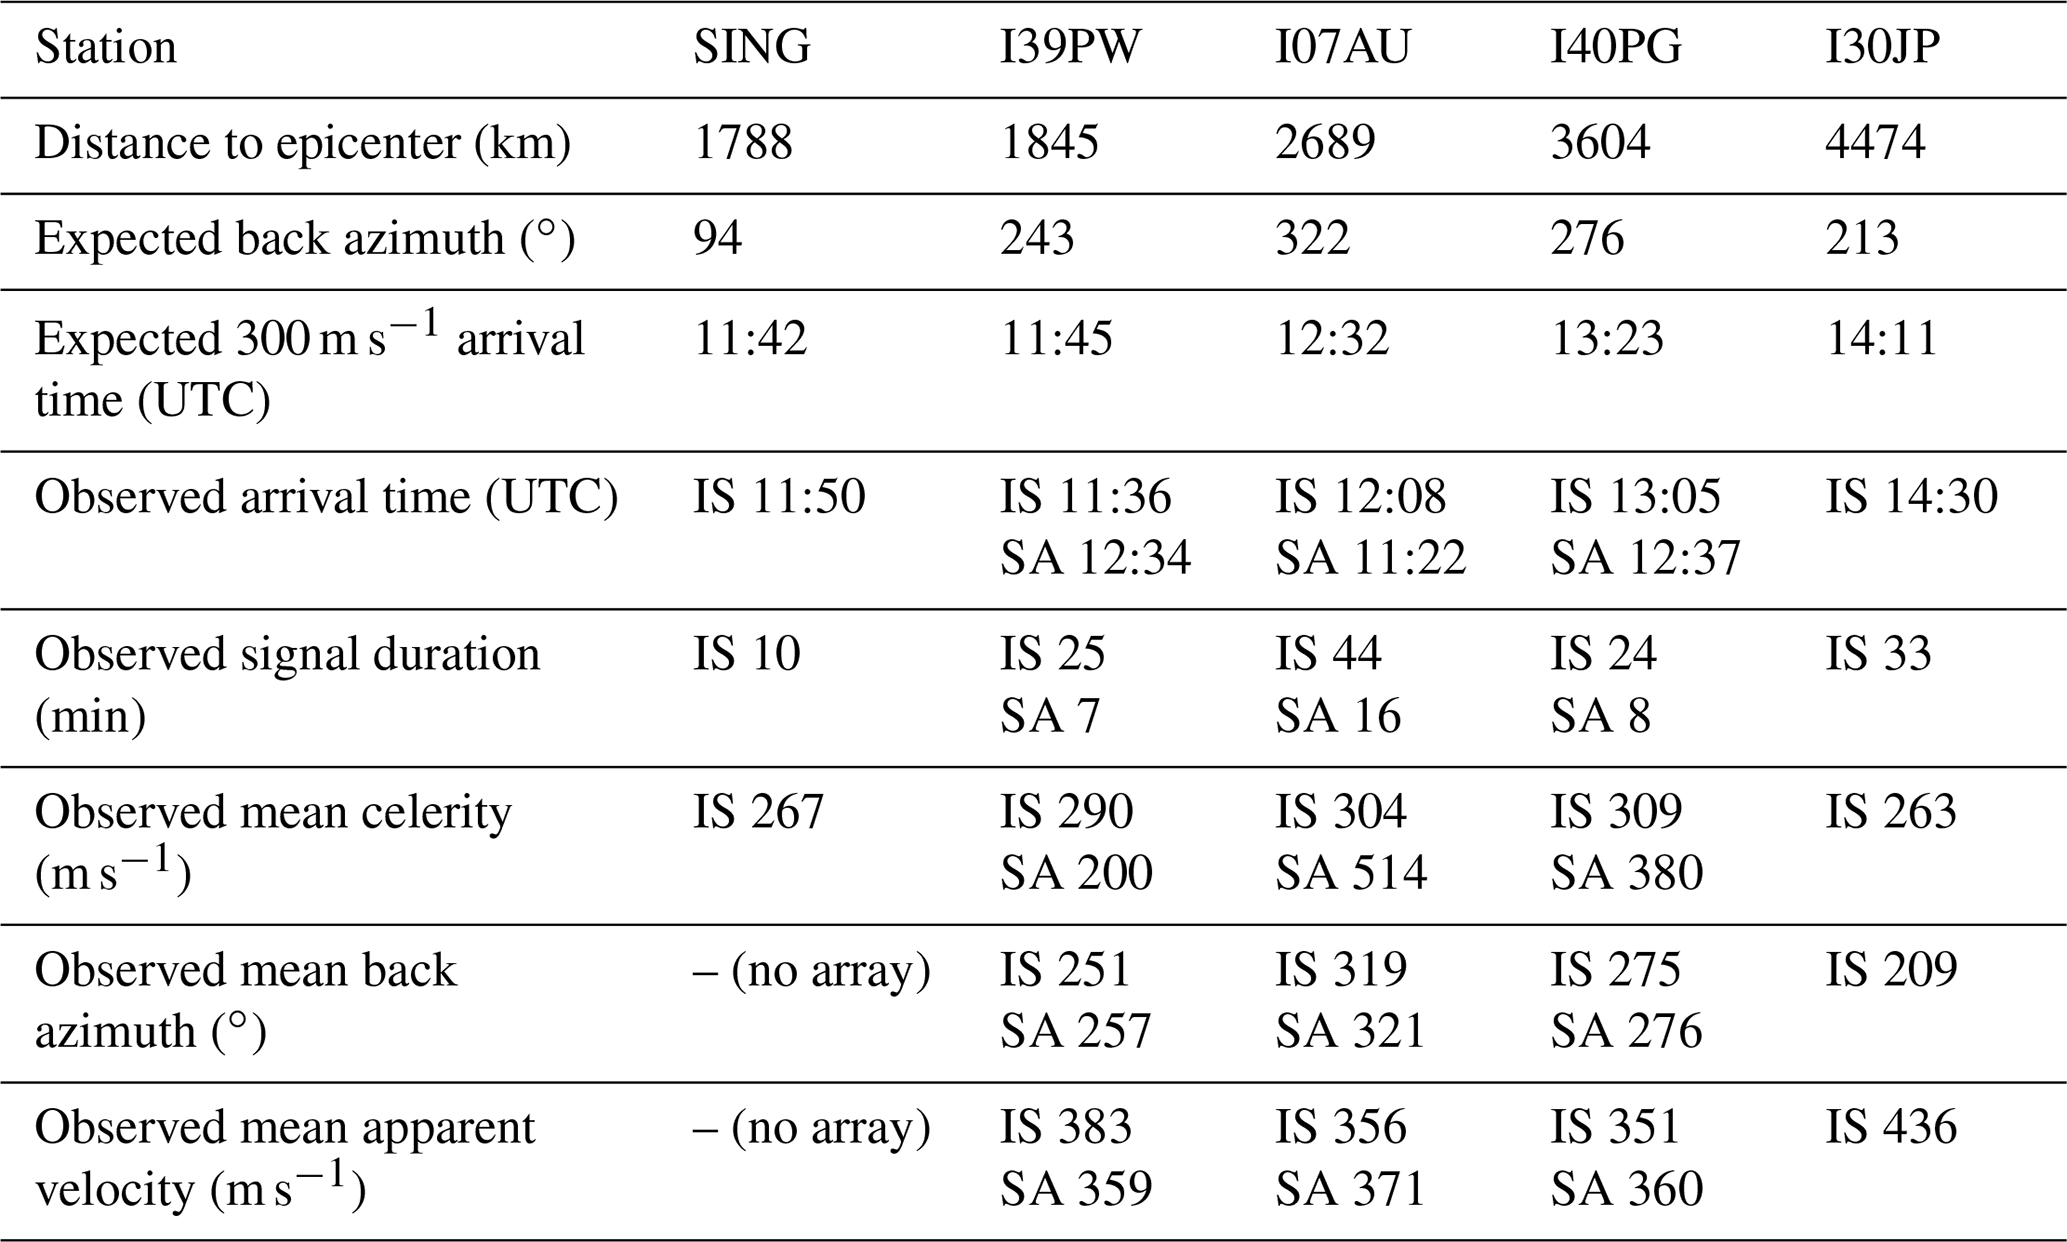
These observation parameters for the four IMS infrasound arrays and for the earthquake-related signal also identified in SING station data are summarized in Table 1. Furthermore, source-to-station distances as well as expected back-azimuth directions and arrival times using a celerity (epicentral distance divided by the travel time) of 300 m s−1 are presented for comparison. A graphical representation of the waveform beams (bandpass-filtered between 0.6 and 4 Hz, except for I30JP, where it is between 0.02 and 0.1 Hz) and the main PMCC findings for the four IMS stations are provided in Fig. 2, highlighting not only epicentral infrasound arrivals and their acoustic characteristics in the observations but also seismoacoustic and seismic signatures related to the event.
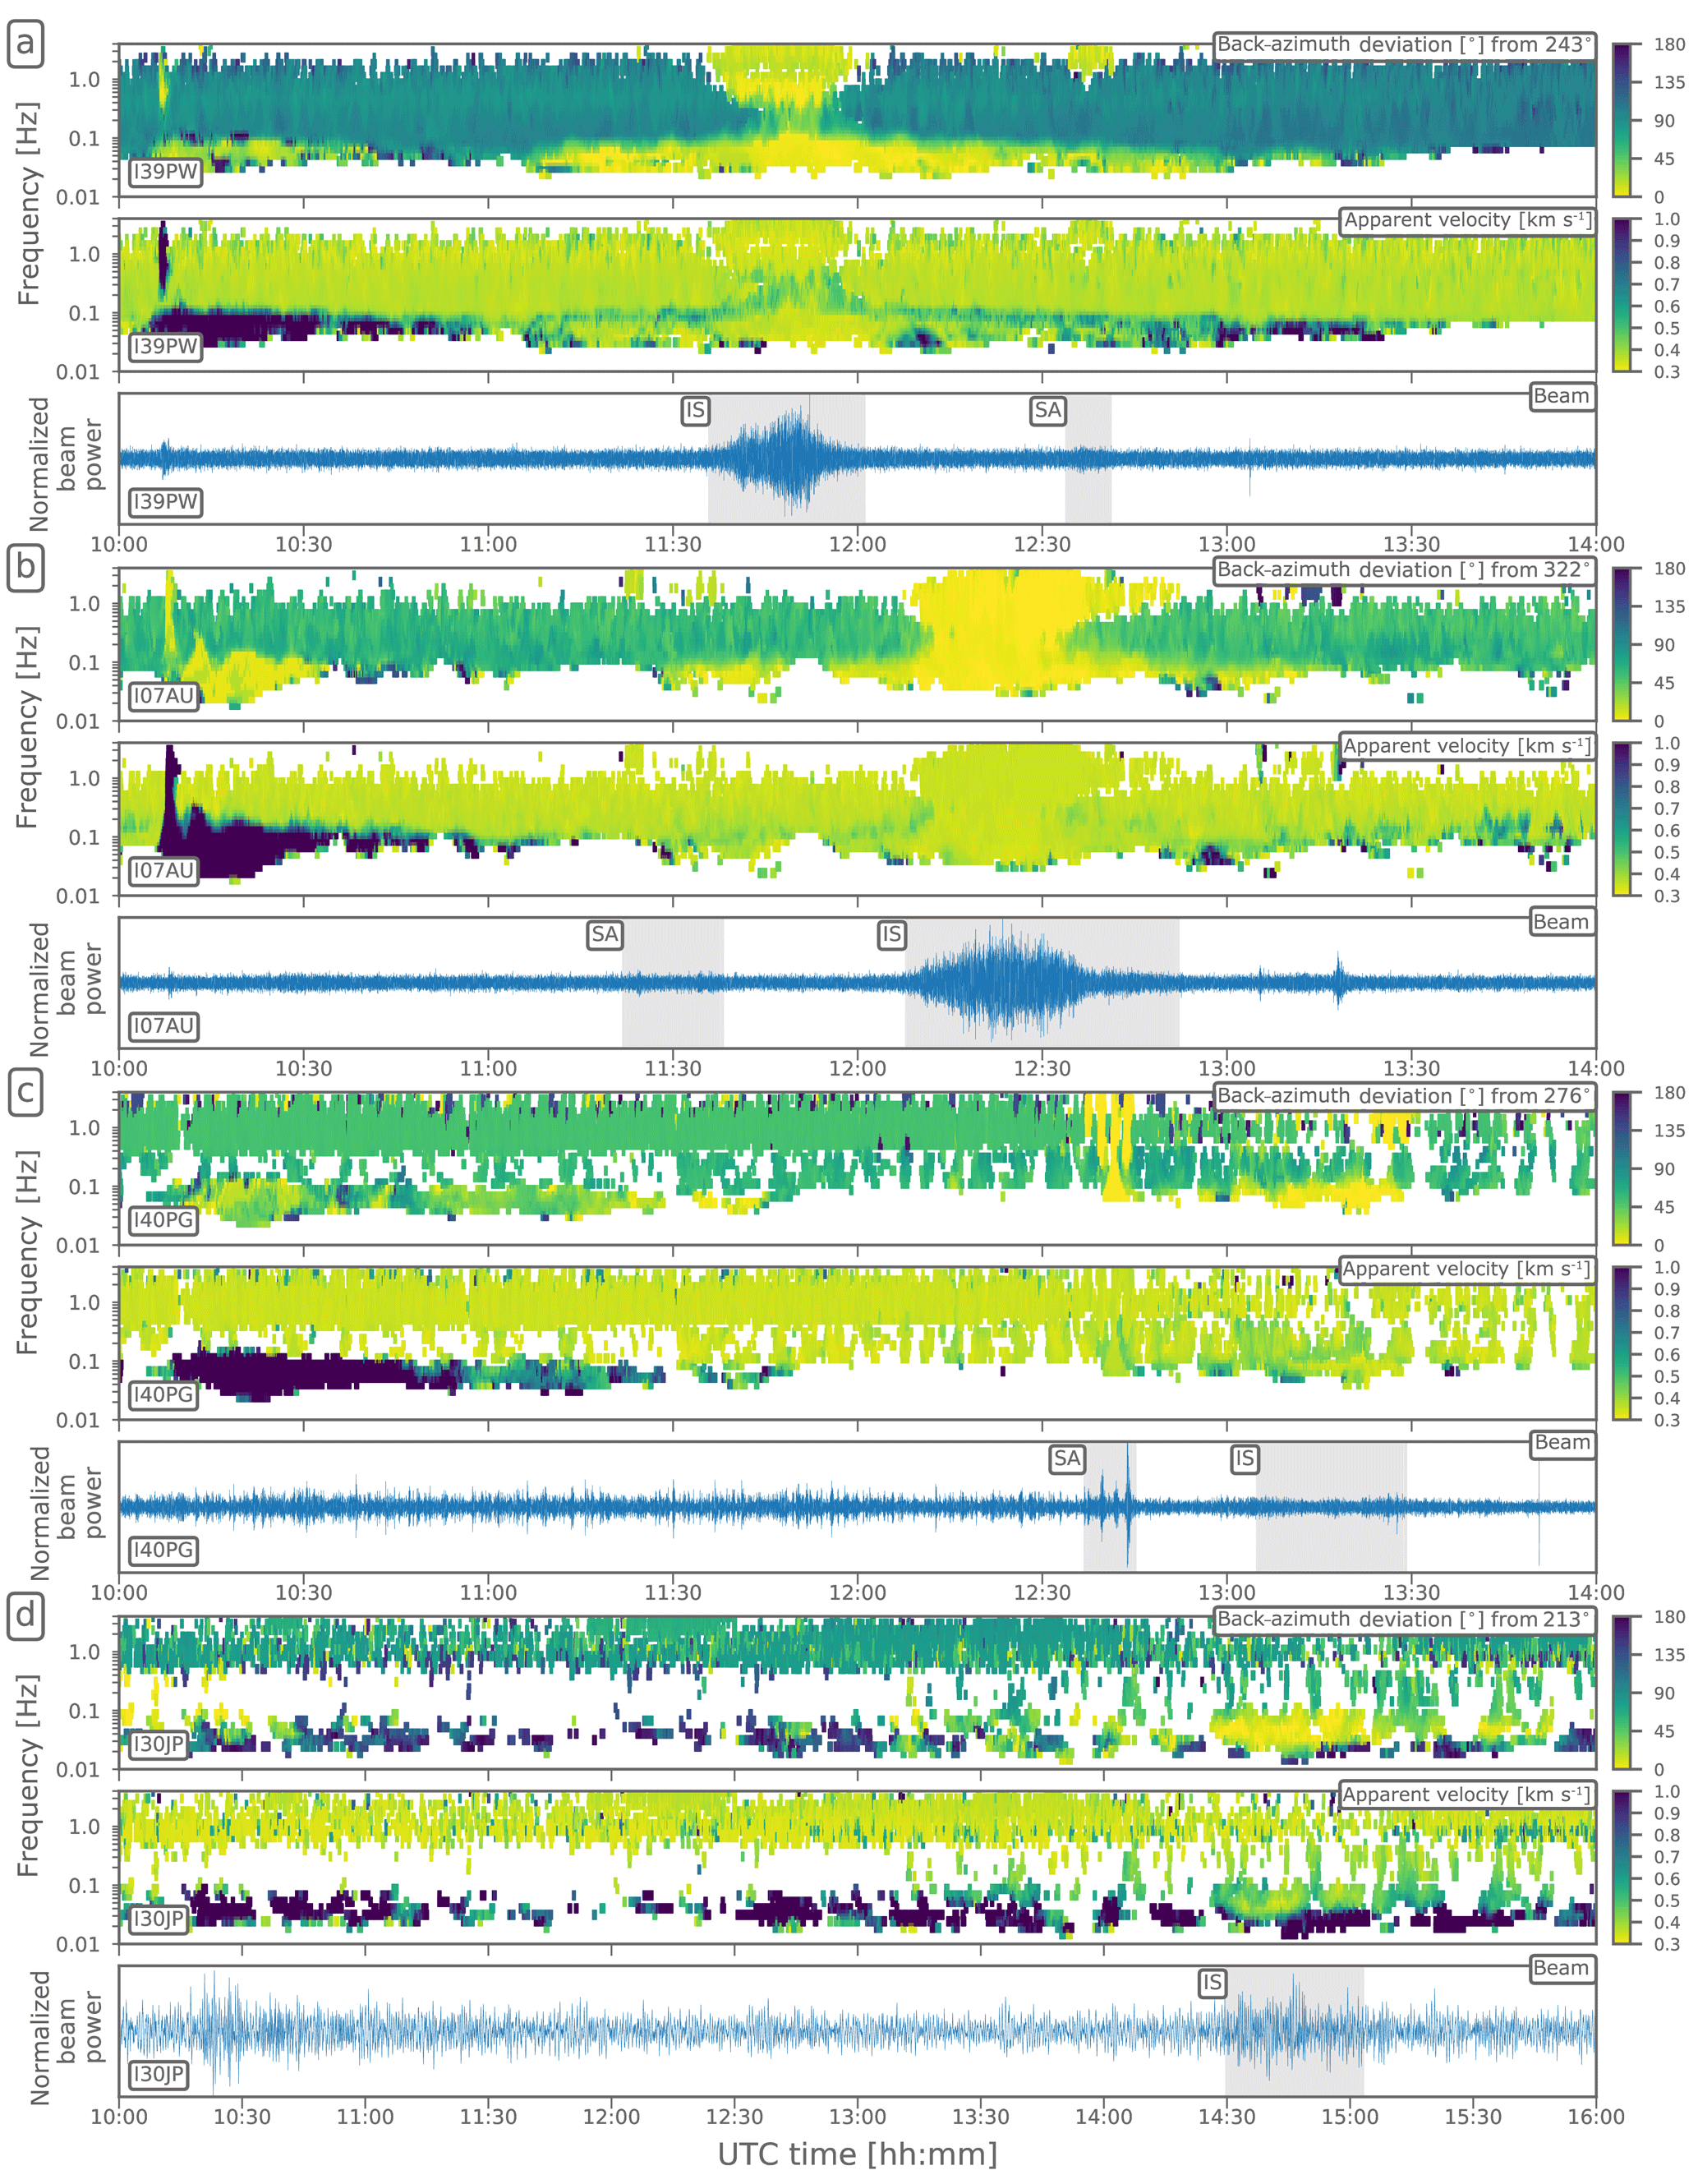
Figure 2Waveform beams and PMCC-derived results for the four infrasound arrays I39PW (a), I07AU (b), I40PG (c), and I30JP (d; stations are ordered by epicentral distance with three frames per station and station labels in the lower left corners). Shown in the corresponding stations' top frames are the observed back-azimuth deviations from the direction to the earthquake epicenter (see labels in the upper right corners), in the middle frames are the observed apparent velocities, and in the bottom frames are the waveform beams. The whole 360∘ back-azimuth observations are converted to the given deviation plotting of ±180∘. Apparent velocities are saturated above 1 km s−1. Beams are bandpass-filtered between 0.6 and 4 Hz, and 4 h of data is shown, with the exception of I30JP, where the beam is bandpass-filtered between 0.02 and 0.1 Hz, and 6 h of data is shown. Main infrasound (IS) and seismoacoustic (SA) signal groups (see Table 1) are highlighted in grey.
Initial seismic waves with high-frequency components (0.3–3 Hz) are found in I39PW and I07AU data arriving 4 to 6 min after the origin time, indicating apparent P-wave velocities of 4–10 km s−1, lasting about 2 min. These are followed by low-frequency (0.05–0.5 Hz), quasi-continuous seismic waves observed in I39PW, I07AU, I40PG, and possibly I30JP, likely related to seismic shear and surface waves, with velocities of 1–3 km s−1. Aftershock activity as well as seismic signals from other regional earthquakes is also present in Fig. 2 for the hours after the main earthquake; aftershocks include 12 events of mb 5 or greater and 40 events of mb 4 or greater within 6 h following the event (USGS, 2018). Values for the arrival of seismic waves are not integrated in Table 1, since the local microbarometer output generated from ground shaking of the sensors is not the focus of this study. Nevertheless, the infrasound sensors do work fairly well as seismic arrays for this event (e.g., see Gibbons et al., 2015b) and the earthquake-related seismic arrivals can clearly be identified in Fig. 2, having back azimuths towards the epicenter and apparent velocities exceeding 1 km s−1 (drawn with dark blue colors in the middle frame plot of each station, indicating seismic and not acoustic signal speeds).
Epicentral infrasound is clearly observed and produces the main signal with the largest waveform amplitudes in I39PW and I07AU (beams are plotted in Fig. 2 in the bottom frame plots of the respective stations, and signals are highlighted by grey rectangles and “IS” labels). The analysis shows a broadband frequency content (0.05 to 4.4 Hz) and long signal durations of 25 and 44 min (derived from the width of the high-frequency part signals originating from epicentral directions in the PMCC analyses). These signals are emphasized in Fig. 2, since the back-azimuth calculations as well as the array beams are focused towards the earthquake epicenter (yellow colors in the azimuth frame of each station indicate low to zero back-azimuth deviations from this direction). The low deviations from the theoretical back-azimuth directions (3 and 8∘; see Table 1 for the corresponding values) confirm the signals to be associated with either the epicenter, the rupture process at the surface, or the ground shaking of topographic features on the island of Sulawesi. Crosswinds, as shown in Fig. S2 of the Supplement, lead to certain back-azimuth deviations. An azimuthal sweep is observed in the I07AU data from south to north (directions of 316 to 323∘), consistent with the north-to-south rupture over 150 km. Deviations from the expected back-azimuth direction are largest in I39PW data (about ±10∘). The other stations only show weak or no such variations. See Fig. S3 of the Supplement for a detailed representation of these findings using absolute back-azimuth values.
For the more distant stations I40PG and I30JP, the epicentral infrasound is consistent with the theoretical back azimuths (1 and 4∘ deviation) but mostly allocated with frequencies below 0.1 Hz, indicating larger absorption of the high frequencies along the long-distance propagation (see Sect. 4 for the corresponding propagation modeling). The high-frequency pulses in the I40PG recordings around 12:40 UTC are associated with a seismoacoustic signal, which is discussed at the end of this section.
In general, the observed back azimuths fit very well to the theoretical ones calculated for the epicenter for all four stations, allowing the application of a cumulative back-projection method to locate the source regions of the observed infrasonic signals in Sect. 5. The epicentral signals' mean apparent velocities are all in the acoustic range valid for stratospheric propagation (350 to 380 m s−1; see Table 1), with the exception of I30JP having higher mean apparent velocities of 436 m s−1. This, together with low celerity values of 263 m s−1 and the appearance of only low-frequency signals at this station, strongly indicates thermospheric propagation for I30JP instead of stratospheric. Thermospheric arrivals are expected to also be present in the other stations' observations apart from the dominant stratospheric ones; their later arrival time and lack of high-frequency content correspond to the long-lasting signal families following the main signal peak for many minutes in the low frequencies. These signal families can be observed together with low-frequency seismic wave activity and low-frequency acoustic components from the stratospheric ducting in frequency bands around 0.1 Hz. They are discernible only to a certain degree by their apparent velocities and arrival times, being the slowest and latest arrivals from the epicenter. The celerities observed at I39PW, I07AU, and I40PG as well as the observed arrival times and signal durations correspond well to the expected arrival times calculated using a 300 m s−1 celerity of average stratospheric propagation (see Table 1). The expected arrival times for these stations are clearly within the main signals' observed time window and are only 2 to 6 min shifted from the respective midpoint of the observed arrivals' time window (arrival time plus half of the signal duration).
Microbaroms, which are infrasonic signals from interacting ocean surface waves (Donn and Naini, 1973; Ardhuin and Herbers, 2013), are also present in the recordings of I39PW and I07AU at around 0.2 Hz and dominant before and after the earthquake signals. There is also surf or potentially anthropogenic noise in I40PG and I30JP data at around 1 Hz during the complete observation. These background (noise) signals can clearly be separated from the epicentral signal by back azimuths (greenish colors in the top frame plots).
Seismoacoustic signals are identified in I07AU, I39PW, and I40PG data, coming from nearly epicentral directions and having acoustic apparent velocities. They have high-frequency content (above 1 Hz) and celerities below 200 or above 380 m s−1, thus excluding purely acoustic waves propagating from the epicenter at the time of the rupture and also those traveling through the thermosphere or troposphere. These signals could be seismoacoustic arrivals related to the earthquake (their signal parameters are provided in Table 1 and highlighted in Fig. 2 with the label “SA”). A conversion of seismic to acoustic waves at certain distinct terrain features might be responsible for these kind of signals. Islands between Java and Timor-Leste (south of Sulawesi) could be the rough source region of the I07AU and I39PW signals, while islands of North Maluku (east of Sulawesi) may be the source of the seismoacoustic signals in I40PG. Further details on back-projecting and thus identifying acoustic source regions are provided in Sect. 5. Nevertheless, from the given observations it is not possible to certainly confirm these signal locations as seismoacoustic source regions. None of the signatures are observed at more than one station and smaller groups of signals come from all regions around Sulawesi, including neighboring islands like Borneo. These signals are not necessarily associated with the earthquake; they could also originate from other local infrasound or ambient noise sources and are just coincidental to the earthquake in direction and timing. Alternatively, they could be due to uncertainties in the array processing or back-projection methods.
Transmission loss calculations using firstly a semiempirical method for a horizontal representation (map view, Fig. 3) and secondly a parabolic-equation-based propagation model for a vertical representation (cross section, Fig. 4) are performed in this section to confirm and interpret the observed epicentral infrasound signatures as described above. The semiempirical method is used to estimate the frequency-dependent transmission loss of a signal reaching the different infrasound stations, thereby characterizing its detectability. Propagation modeling is necessary to identify observed and expected signal arrivals, and to associate them with the prevailing atmospheric conditions between source and receivers, and the corresponding ducting behavior.
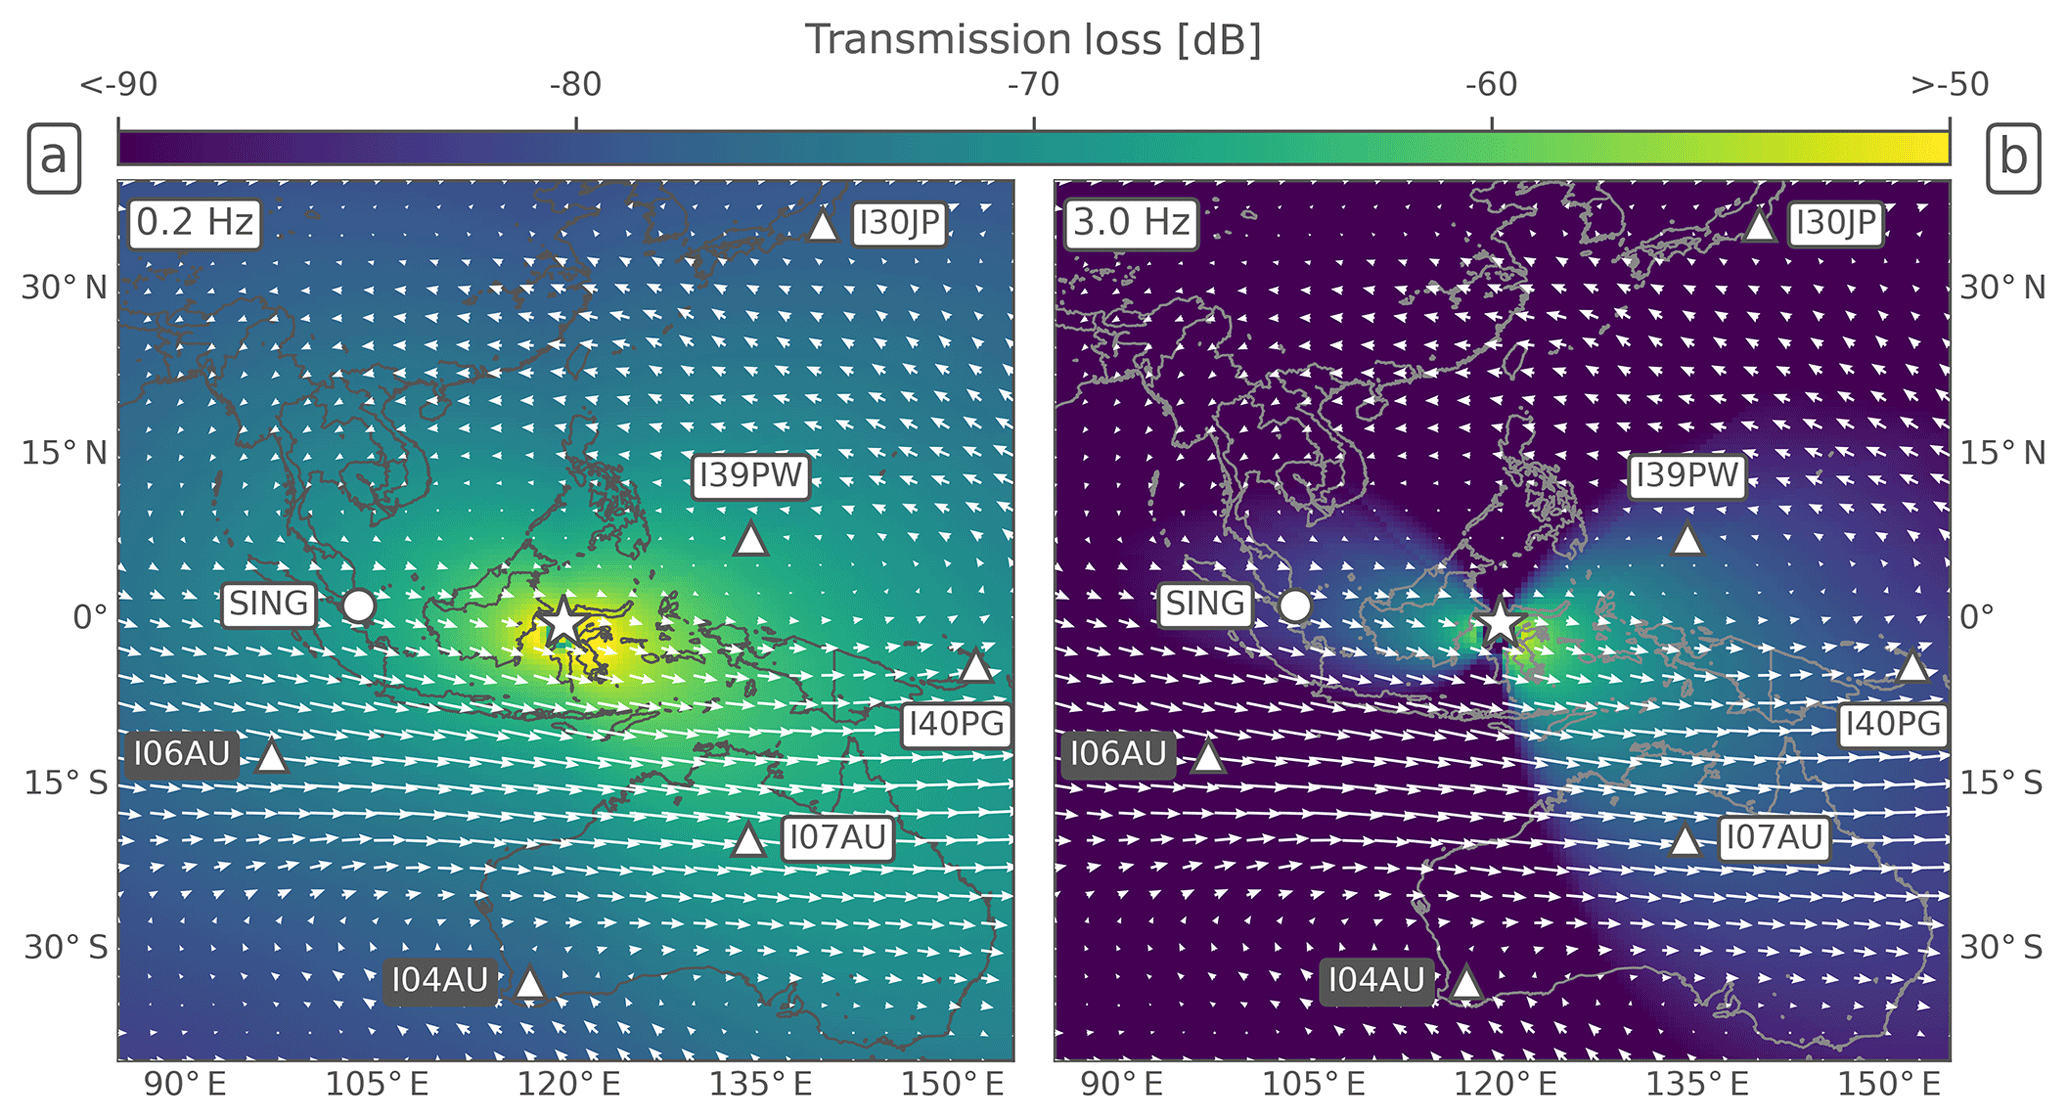
Figure 3Map quantifying the acoustic transmission loss in dB (color-coded), calculated for (a) 0.2 Hz and (a) 3 Hz source frequencies on a grid. Arrows show direction and intensity of the stratospheric wind field averaged between 30 and 60 km altitude for 28 September 2018. The largest arrows represent a value of 25 m s−1. For figure symbols and station labels see Fig. 1. Country outlines are provided within the Matplotlib Basemap Toolkit (https://matplotlib.org/basemap/, last access: 2 December 2019).
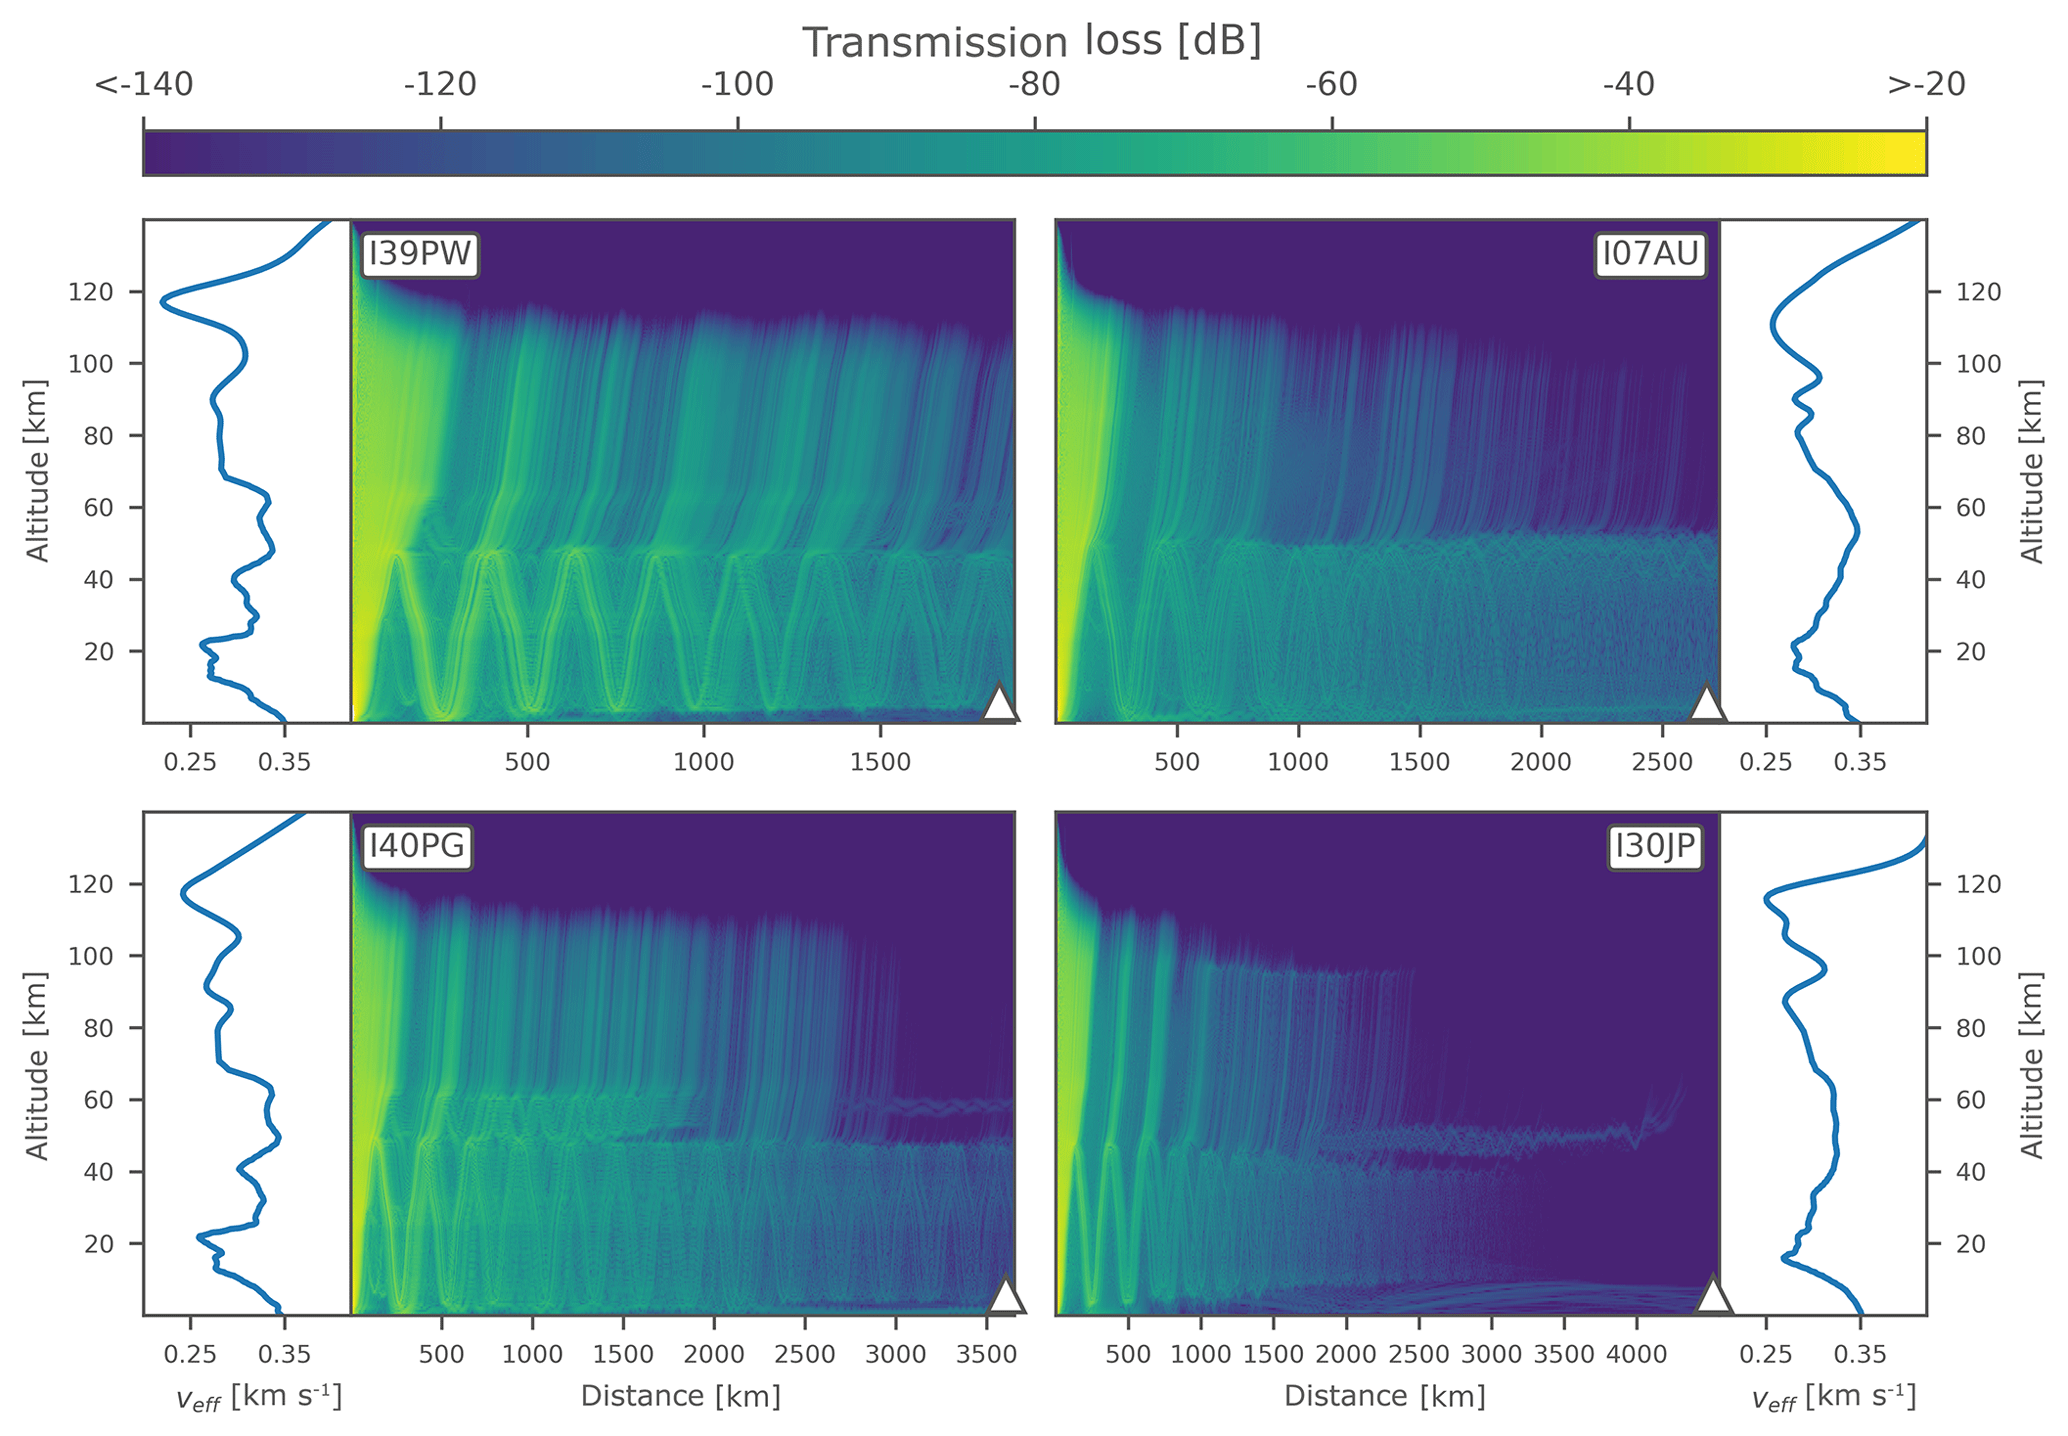
Figure 4Propagation modeling between the Sulawesi earthquake epicenter (plot origins at 0 km distance) and the infrasound arrays I39PW, I07AU, I40PG, and I30JP (respective triangles) using a range-dependent parabolic-equation method, quantifying the transmission loss in dB relative to 1 km for a frequency of 1 Hz. An averaged effective sound speed profile (veff) is shown for each station.
Table 2Summary of transmission loss values and uncertainties (in dB) derived for all stations within this study from the frequency-dependent, semiempirical method, as shown in Fig. 3.
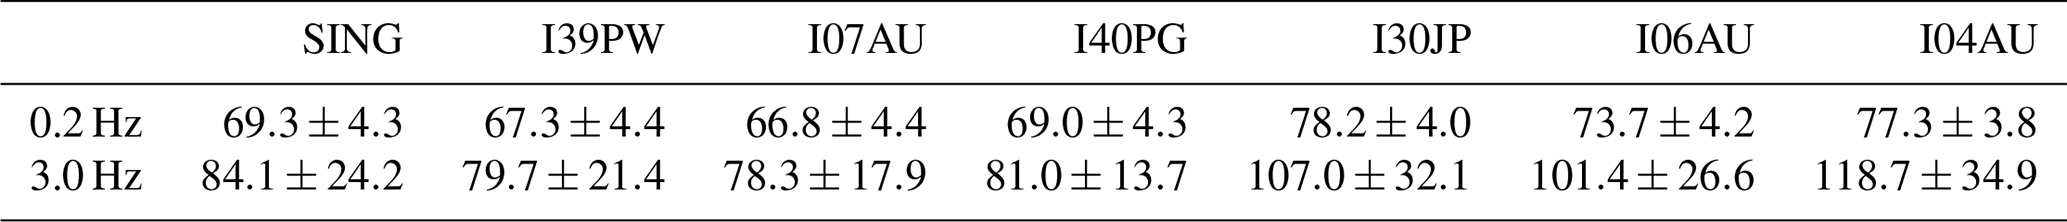
The quantification of infrasonic transmission loss is shown in Fig. 3 using the semiempirical method (see Tailpied et al., 2017) as well as quantifying of the stratospheric wind field in terms of intensity and directionality. Simulations are performed within an area using spatial resolution around the earthquake epicenter for source frequencies of 0.2 and 3 Hz. Most of the acoustic energy is concentrated at the low-frequency band of 0.2 Hz. This was calculated applying the Infrasonic Energy, Nth Octave (INFERNO) algorithm (see Garcés, 2013) to the station data. It calculates acoustic energy with frequency bands based on the American National Standards Institute (ANSI) and International Organization for Standardization (ISO) standards for noise characterization for the acoustic range extended into the infrasound range, and it is based on fractional octave bands. An example is shown in Fig. S1 of the Supplement. Within this band the transmission loss calculated is similar for the closer stations SING, I39PW, I07AU, and I40PG (see Fig. 3a), and their values are between 66 and 70 dB with uncertainties of about 4 dB (see Table 2). While values at these four stations indicate a northwest-to-southeast corridor of signal amplitudes in the same order of magnitude, the other stations in northeastern and southwestern directions have slightly higher transmission loss values of between 73 and 79 dB (see Table 2), indicating less favorable ducting conditions and detection probabilities at these stations.
The similarity of the transmission loss values is consistent with the fact that low-frequency signals are less affected by propagation effects along the path. Drawing the same picture with a source frequency of 3 Hz (Fig. 3b) indicates a different situation: station values for SING, I39PW, I07AU, and I40PG are now between 78 and 85 dB with uncertainties of 13 to 25 dB (see Table 2). These values are still quite similar to the ones estimated for 0.2 Hz, although the uncertainties for the calculation are increased. The transmission loss calculated from the epicentral source into all directions visualizes for the high frequencies a focal effect in eastern and western directions with better observation conditions, while leaving regions with increased transmission loss and thus more unfavorable detection conditions in northern and southern directions. The stations' values in the northern and southern directions are between 101 and 119 dB with uncertainties of 26 to 35 dB, indicating remarkably higher transmission loss for these three stations due to propagation effects and atmospheric conditions and explaining why no high-frequency signals (or signals at all) are observed at the respective stations.
Stratospheric wind conditions affect the propagation, especially for the higher frequencies, and point out the general possibility and effectiveness of a stratospheric duct. This is consistent with the fact that high-frequency signals are more sensitive to the atmospheric conditions along the propagation path, also explaining the higher uncertainties in the calculation of these values. The stratospheric wind fields shown in Fig. 3 support this sensitivity by estimating the direction of the dominant stratospheric wind regime, which is eastward at the Southern Hemisphere's low latitudes, and the intensity of this 30 to 60 km average, which is up to values of 25 m s−1. Strong tailwinds thus support the stratospheric propagation to I07AU, while strong head- and crosswinds hamper it towards I04AU and I06AU. Winds are weaker from the source towards the other stations, mostly due to the equatorial wind situation of zonal stratospheric winds changing their direction here, rendering possible the simultaneous propagation in western (SING), eastern (I39PW and I40PG), and to a certain degree probably even northeastern directions (I30JP).
The given transmission loss modeling provides a map-based estimation at the surface level where stratospheric conditions are favorable or unfavorable for infrasound ducting. Complementary to this, range-dependent propagation modeling is conducted between the epicenter and the four signal-detecting IMS arrays to estimate the loss of signal amplitude due to atmospheric attenuation as well as geometric spreading over the considerably large propagation distances of 1800 to 4500 km. This is performed to estimate if stratospheric propagation is possible, even under weak ducting conditions or conditions changing with distance.
The atmospheric ducting conditions and corresponding infrasound propagation for the four stations are shown in Fig. 4. For I39PW, I07AU, and I40PG, stratospheric ducting is modeled in good agreement with the observed mean celerities of 290, 304, and 309 m s−1 (see Table 1). Following Negraru et al. (2010), celerities for stratospheric ducting are expected to be in the order of 280 to 320 m s−1. Corresponding ray-tracing calculations (not shown here) estimate the celerities of those stratospheric ducts to be between 287 and 293 m s−1.
For I30JP, stratospheric ducting ceases along the 4500 km propagation path due to more unstable ducting conditions and higher transmission loss (about 150 dB). This is also in good agreement with the observations, since only a low-frequency signal is recorded at I30JP with a low celerity value of 263 m s−1 (ray tracing suggesting 244 m s−1), indicative not of a stratospheric but of a thermospheric arrival.
Thermospheric ducts do not show up in Fig. 4, since this figure represents a 1 Hz modeling case highlighting the medium- and high-frequency stratospheric ducting and resulting in stronger absorption of thermospheric effects. For lower frequencies on the order of 0.01 to 0.1 Hz, thermospheric attenuation is considerably small (Sutherland and Bass, 2004), and acoustic signal energy can propagate in the thermospheric duct over large distances with limited transmission loss.
The availability of atmospheric ducts can be quantified using the effective sound speed (veff) ratio between the stratospheric maximum (at 40–60 km) and the ground along the propagation path. This parameter indicates favorable ducting conditions, when being equal to or larger than 1, and unfavorable conditions otherwise. Nevertheless, Le Pichon et al. (2012) and Landès et al. (2014) point out that veff ratios above 0.9 along the complete propagation path may also lead to at least partially refracted energy in the stratosphere, whereas this ducting becomes highly likely for values above 0.95. While classical ray-trace modeling makes a strict separation between ratios larger or smaller than 1 (leading to existing or nonexisting stratospheric ducts), the parabolic-equation modeling used here also takes into account partial refractions of acoustic energy at effective sound speed ratios near but below 1. These partial refractions correspond to small-scale structures like atmospheric gravity waves, which vary the atmospheric temperature and winds and thus also influence infrasound propagation (Kulichkov et al., 2010; Green et al., 2011).
The veff ratios of the average profiles depicted in Fig. 4 are 0.96 (I39PW), 1.00 (I07AU), 0.99 (I40PG), and 0.93 (I30JP), fully supporting the reasoning above. The propagation cases to I06AU and I04AU are not shown in Fig. 4, having no observations of the event and accordingly low veff ratios of 0.92 and 0.93, while the propagation to the single element station SING is indicative of stratospheric ducting with a higher veff ratio of 0.98.
The main focus of the discussion of observed and modeled signals from the 28 September 2018 Sulawesi earthquake is on the source regions and source mechanisms responsible for them. To support this discussion, a back-projection procedure (comparable to the one applied in Shani-Kadmiel et al., 2017, and in the Supplement to Gaebler et al., 2019) is applied using the observed PMCC pixels and back-projecting them using their temporal and directional information.
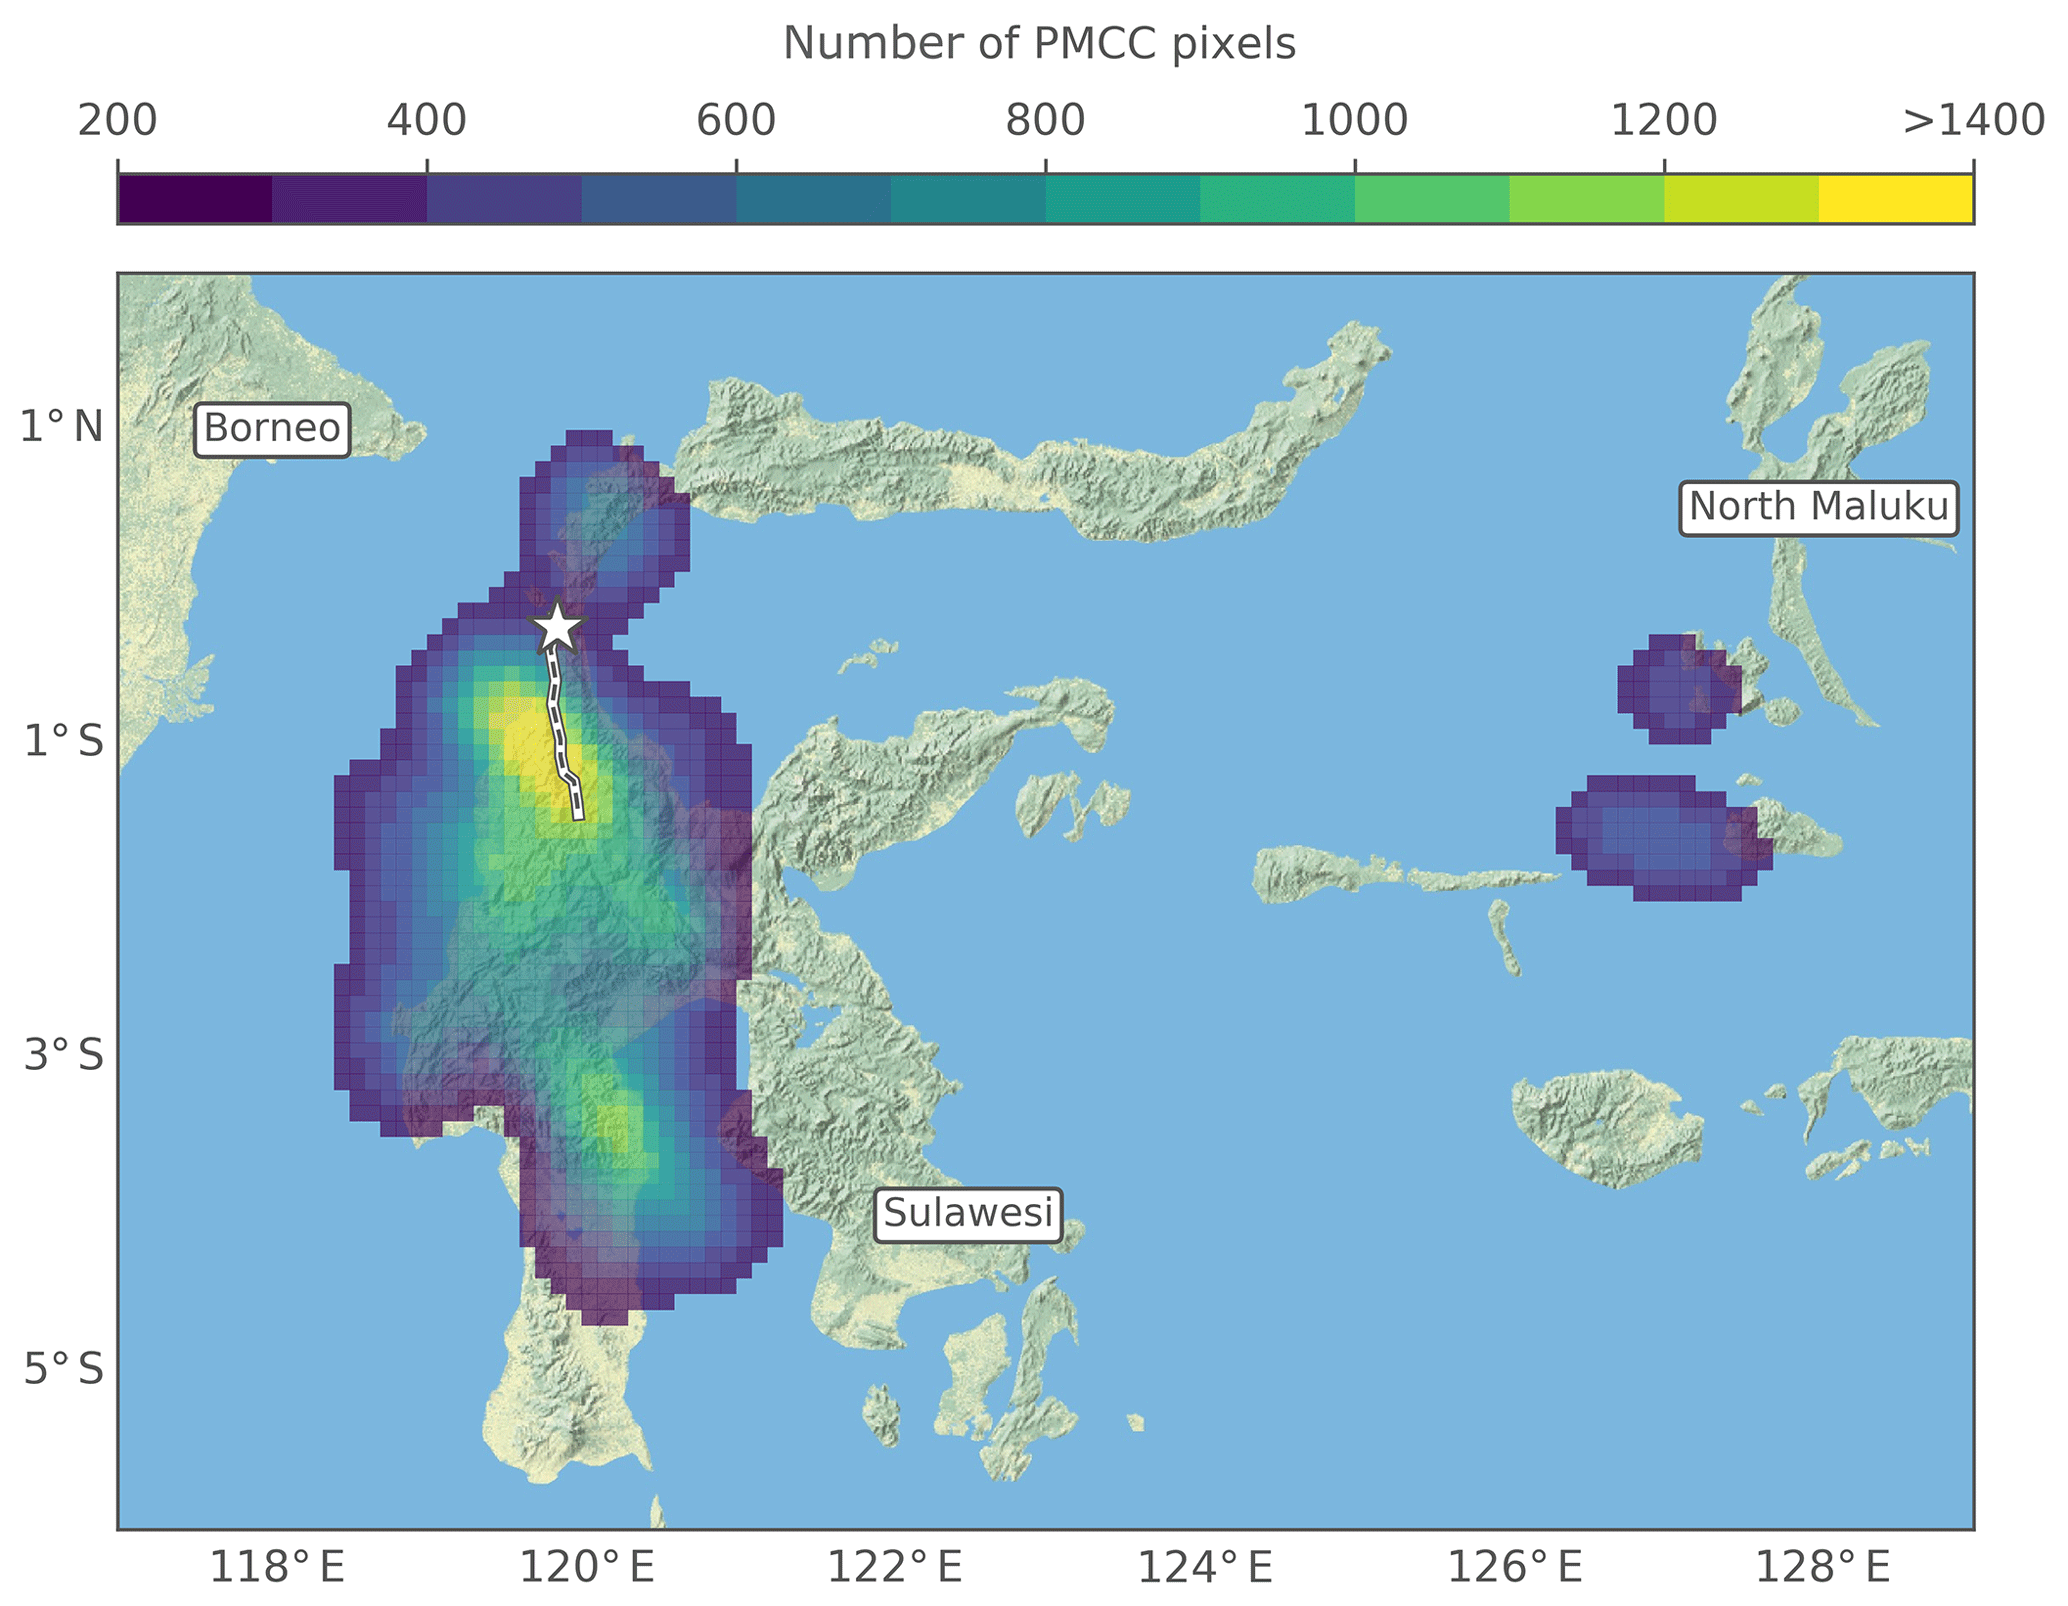
Figure 5Back projection of the combined PMCC detections from I39PW, I07AU, I40PG, and I30JP. Considered is each PMCC pixel's back azimuth as well as a combination of 4 km s−1 seismic and 0.3 km s−1 acoustic celerities, resulting in seismic-to-acoustic conversion locations. Color-coded event density for these locations is shown on a grid, highlighting regions with more than 200 back-projected pixels per grid node. The epicenter is marked by a star, and the rupture zone is traced by a dashed line. The map background was created using basemap data from the ESRI ArcGIS® Map Service.
The back-projection results towards the island of Sulawesi are presented in Fig. 5 in terms of an event density map of the pixel-by-pixel information on their most likely origin locations. A total number of about 107 000 pixels is used to derive the picture, combining the back projections of all four stations' PMCC recordings towards the epicenter ±40∘ maximum deviation. Single station back projections can be found in Fig. S4. Seismic speeds of 4 km s−1, resembling the primary propagation of crustal seismic waves, are combined with 0.3 km s−1 acoustic celerities representing an average value of the station observations. Uncertainties regarding the back-projected locations as seen by extended contour regions in Fig. 5 are due to a number of potential influencing factors. The choice of a fixed seismic speed and fixed acoustic celerity for all pixels instead of individual values is supposed to introduce location deviations. Measurement and analyses of back-azimuth directions may contain uncertainties due to array configurations and due to crosswind influences on the infrasound propagation. The method does not account for atmospheric variability (as the forward-propagation approach of Fig. 4 does), introducing certain location biases. The velocity-averaged back projection nevertheless sufficiently emphasizes the major source regions and infrasound generation mechanisms.
A region to the south of the epicenter is highlighted (yellow colors representing the highest event density), well corresponding with the earthquake rupture zone along the Palu–Koro fault line. Up to a certain degree, this method also serves as a cross-bearing location procedure although stations contributing to it are not equally weighted but weighted by the number of pixels used from the respective stations (in this picture, I07AU dominates the back projection, since it has the longest and largest record of the event; also see Fig. S4). The location of the highest event density is at 119.6∘ E, 1.0∘ S, approximately 80 km south of the epicenter and thus halfway along the rupture.
Figure 5 highlights that infrasound is radiated not only from a distinct, epicentral point source alone, but from a region extended in north–south directions following the rupture (in fact the event density values at the epicenter itself are lower than those in the surrounding regions). Secondary peaks away from the basin region around the rupture are identified north of the epicenter and in the southern part of Sulawesi. The pixels of this southern secondary color peak are mostly related to the early parts of the main signal recorded at I07AU, while the central and northern color peaks in the figure are related to signals arriving some minutes later. This corresponds to the 316 to 323∘ sweep in I07AU data from south to north, as described in Sect. 3. The two side maxima separated from the main signal's colored region are related to the seismoacoustic signatures described in Sect. 3. They are derived from a number of I40PG PMCC pixels and point to a region near the North Maluku islands east of Sulawesi (also see Fig. S4). Other side maxima, e.g., the ones between Java and Timor-Leste, also mentioned in Sect. 3, are beyond the map borders and not shown here but can be found in Fig. S4.
In general, the results observed and visualized by Fig. 5 point out that an enlarged region, closely following the rupture and thus also the topography along the fault, generates the acoustic signals recorded at the remote infrasound sensors. This includes the rupture region itself suffering most from the earthquake-related ground motion (offsets of up to 7 m horizontal and 2 m dip slip) as well as an extended basin area around the rupture, enclosed by mountain chains in mostly north-to-south directions. Mountainous areas are a well-known source of seismoacoustic signatures (e.g., Arrowsmith et al., 2010) and correspond to the event density maxima in Fig. 5; the mountain chains west and east of the Palu–Koro fault as well as the mountain area in the south of the island with Sulawesi's highest mountains (Mt. Rantemario and Mt. Rantekombola, both about 3500 m elevation) generate large portions of the recorded signals. The less prominent but recognizable regions north of the epicenter (Mt. Fuyul Sojol, 3000 m elevation) and on the Maluku islands (e.g., Mt. Buku Sibela, 2000 m elevation) are also related to topographic peaks. The most likely source mechanism for the generation of large parts of the seismoacoustic signals is therefore estimated to be the shaking of elevated or exposed topography, stimulated by crustal seismic or surface waves reaching these areas and turning them into motion.
Table 3List of events similar to the 28 September 2018 Sulawesi earthquake, either in their super-shear nature or in their regional origin. The separation between “event detection” and “no event detection” is an estimation following data analyses performed by the authors of this study.

To qualitatively assess if the super-shear nature of the given earthquake or the regional prerequisites (or both) are responsible for the intense and long-lasting infrasound signals observed, the 28 September 2018 Sulawesi earthquake is compared to three other super-shear earthquakes as well as three other normal shear earthquakes from the same region (Indonesia and Papua New Guinea). Shallow events between 5 and 30 km depth were chosen with comparably strong magnitudes of Mw>6.5 so that infrasound generation and detection can be expected. Table 3 chronologically lists these six events and provides an estimation of the emitted and observed infrasound for all of them.
The three super-shear earthquakes named after the Denali fault, the Qinghai province, and the city of Craig, occurring in 2002, 2010, and 2013, are the earthquakes most recent, most intense, and most similar in their super-shear characteristics to the 28 September 2018 Sulawesi earthquake, also having super-shear rupture velocities of 4 to 6 km s−1 (see Dunham and Archuleta, 2004; Wang and Mori, 2012; Yue et al., 2013). Although the IMS infrasound network is not fully established yet (at the time of the Sulawesi earthquake, 80 % of the stations were certified and operational, while only 8 % were at the time of the Denali earthquake and about 70 % during the time of the other two earthquakes), at least one infrasound array was able to unambiguously detect and characterize each of the mentioned earthquakes.
The infrasound signals for the Denali earthquake indicate a high signal-to-noise ratio at the nearby I53US station as well as a much weaker signal at I10CA much further away. This event was a good opportunity to track the infrasound back to its generation region in the Alaska Range mountains along the Denali fault where the rupture occurred (observed in I53US data, Olsen et al., 2003) and to the Rocky Mountains southeast of it (observed in I10CA data), where similar observations were made for the 1964 Alaskan earthquake (see Young and Greene, 1982). The strong movement of local and remote topography generated the infrasound in good agreement with the Sulawesi case. However, no indication is given that the super-shear characteristics of the Denali earthquake specially favor the generation of infrasound. For the Qinghai and Craig earthquakes, also reported to be super shear, much weaker and shorter-duration infrasound is observed at stations at distances of 1400 (I53US to Craig) to 1800 km (I34MN to Qinghai), compared to Sulawesi where stronger and much longer infrasound signals were observed between 1800 and 4500 km. Again, these do not indicate any connection between those previous super-shear earthquakes and extraordinary infrasound generation.
The Sulawesi earthquake is also compared to three strong earthquakes within the same region, most prominently two nearby Papua New Guinea earthquakes (near the Porgera mine, 2018, and Kokopo city, 2019) of the same magnitude occurring half a year before and after the Sulawesi one, showing clearly observed infrasound signals with high signal-to-noise ratios at multiple IMS stations as well. These infrasound signals are observed up to distances similar to the Sulawesi case and also provide long-duration, strong-amplitude wave energy associated with infrasonic and seismoacoustic arrivals coming from the two earthquakes. Clear seismic signals are also present in the recordings (as in most cases described before, apart from Qinghai), and an association with topographic features such as infrasound source regions is possible (the mountain chain in central Papua New Guinea for Porgera and the mountain areas in New Britain and New Ireland for Kokopo). For the Sumatra–Andaman earthquake of 2004, strong infrasound with long signal durations was observed and could be back-projected to topographic features of islands and shorelines, especially where the follow-up tsunami reached the shoreline of the Bay of Bengal (see Le Pichon et al., 2005). None of the presented earthquakes were super-shear earthquakes, but all of them, especially the two very similar Papua New Guinea earthquakes, generated strong infrasonic signals comparable to the signals of the Sulawesi event.
It can be concluded from comparison with the other events mentioned above that strong infrasound generated by an earthquake is not mainly or exclusively linked to the earthquake's super-shear characteristic but most likely to the nearby existence of mountainous topography. This topography serves as a large-area resonating membrane in terms of large masses brought into motion by a triggering earthquake. These mass movements produce large amounts of acoustic energy, which can be recorded at nearby or remote infrasound stations given conducive propagation conditions.
The given super-shear event represents one of only a few large-magnitude, shallow earthquakes generating pronounced infrasound. It therefore provides a unique opportunity to study earthquake-generated infrasound in terms of the source mechanisms, signal characteristics, propagation conditions, and ducting behavior. It also supports the improved understanding of the process of infrasound radiation by mountain shaking from large earthquakes and the conversion of seismic to acoustic energy.
Measurement uncertainties within this study are due to the instrumentation and methods applied; modeling uncertainties are due to assumptions applied within the models and to multiscale atmospheric variations between source and receivers, leading to uncertainties in the transmission loss and propagation calculations. Taking into account these uncertainties allows for the improvement of methods and models to cope with such issues in the future. This will help develop novel and enhanced insights about infrasound observations and modeling in general and earthquake-generated infrasound in particular. This will also help to optimize seismoacoustic observation networks in terms of better understanding instrumental needs and better evaluating the signatures observable by them. Finally it will support seismoacoustic studies of natural as well as anthropogenic infrasound sources in the future and thereby support the infrasound monitoring for treaty verification purposes of the CTBT, as have other CTBT-related studies about infrasound observation, propagation, and signal characterization (Assink et al., 2016; Bowman, 2019; Gaebler et al., 2019).
Information about earthquake magnitude, location, and frequency of occurrence in the region of interest is retrieved from the online-accessible archive of the USGS; see https://earthquake.usgs.gov/earthquakes/ (last access: 2 September 2019; USGS, 2018).
Atmospheric wind and temperature profiles are derived from operational high-resolution atmospheric model analysis, defined by the Integrated Forecast System of the ECMWF, available at https://www.ecmwf.int/ (last access: 2 September 2019; ECMWF, 2018).
Waveform data for the infrasound arrays of the CTBTO IMS (https://www.ctbto.org/, last access: 2 September 2019) used in this study are available to the authors, being members of National Data Centers for the CTBTO. Waveform data for the SING infrasound station are available to the authors, being members of the Earth Observatory of Singapore.
The supplement related to this article is available online at: https://doi.org/10.5194/nhess-19-2811-2019-supplement.
CP analyzed the waveform data, performed the propagation modeling, wrote the manuscript text, and coordinated the coauthor contributions; PG compiled the data, generated the figures, and helped with finalizing the manuscript layout; LC provided first ideas and initiated the collaborative study; ALP provided expertise in earthquake infrasound, comparison to other events, and initiated the collaborative study; JV analyzed the waveform data and performed propagation modeling; AP analyzed the waveform data and provided manuscript text; DT performed the attenuation modeling and provided manuscript text; BT provided first ideas and initiated the collaborative study; all authors supported and improved the draft by proofreading, commenting on, or correcting the manuscript.
The authors declare that they have no conflict of interest.
This research has been supported by the National Research Foundation Singapore and the Singapore Ministry of Education under the Research Centres of Excellence initiative (EOS contribution no. 249).
This paper was edited by Maria Ana Baptista and reviewed by Sven Peter Näsholm and Alex Iezzi.
Ardhuin, F. and Herbers, T. H. C.: Noise generation in the solid Earth, oceans and atmosphere, from nonlinear interacting surface gravity waves in finite depth, J. Fluid Mech., 716, 316–348, https://doi.org/10.1017/jfm.2012.548, 2013.
Arrowsmith, S. J., Johnson, J. B., Drob, D. P., and Hedlin, M. A. H.: The seismoacoustic wavefield: A new paradigm in studying geophysical phenomena, Rev. Geophys., 48, RG4003, https://doi.org/10.1029/2010RG000335, 2010.
Assink, J. D., Averbuch, G., Smets, P. S. M., and Evers, L. G.: On the infrasound detected from the 2013 and 2016 dprk's underground nuclear tests, Geophys. Res. Lett., 43, 3526–3533, https://doi.org/10.1002/2016GL068497, 2016.
Bao, H., Ampuero, J.-P., Meng, L., Fielding, E. J., Liang, C., Milliner, C. W. D., Feng, T., and Huang, H.: Early and persistent supershear rupture of the 2018 magnitude 7.5 Palu earthquake, Nat. Geosci., 12, 200–205, https://doi.org/10.1038/s41561-018-0297-z, 2019.
Bernard, P. and Baumont, D.: Shear Mach wave characterization for kinematic fault rupture models with constant supershear rupture velocity, Geophys. J. Int., 162, 431–447, https://doi.org/10.1111/j.1365-246X.2005.02611.x, 2005.
Bouchon, M. and Vallée, M.: Observation of Long Supershear Rupture during the Magnitude 8.1 Kunlunshan Earthquake, Science, 301, 824–826, https://doi.org/10.1126/science.1086832, 2003.
Bouchon, M., Toksöz, N., Karabulut, H., Bouin, M.-P., Dietrich, M., Aktar, M., and Edie, M.: Seismic imaging of the 1999 Izmit (Turkey) Rupture inferred from the near-fault recordings, Geophys. Res. Lett., 27, 3013–3016, https://doi.org/10.1029/2000GL011761, 2000.
Bowman, D. C.: Yield and emplacement depth effects on acoustic signals from buried explosions in hard rock, B. Seismol. Soc. Am., 109, 944–958, https://doi.org/10.1785/0120180285, 2019.
Cansi, Y.: An automatic seismic event processing for detection and location: the PMCC method, Geophys. Res. Lett., 22, 1021–1024, https://doi.org/10.1029/95GL00468, 1995.
Doan, M.-L. and Gary, G.: Rock pulverization at high strain rate near the San Andreas fault, Nat. Geosci., 2, 709–712, https://doi.org/10.1038/NGEO640, 2009.
Donn, W. L. and Naini, B.: Sea wave origin of microbaroms and microseisms, J. Geophys. Res., 78, 4482–4488, https://doi.org/10.1029/JC078i021p04482, 1973.
Drob, D. P., Picone, J. M., and Garcés, M. A.: Global morphology of infrasound propagation, J. Geophys. Res., 108, 4680, https://doi.org/10.1029/2002JD003307, 2003.
Drob, D. P., Emmert, J. T., Crowley, G., Picone, J. M., Shepherd, G. G., Skinner, W., Hays, P., Niciejewski, R. J., Larsen, M., She, C. Y., Meriwether, J. W., Hernandez, G., Jarvis, M. J., Sipler, D. P., Tepley, C. A., O'Brien, M. S., Bowman, J. R., Wu, Q., Murayama, Y., Kawamura, S., Reid, I. M., and Vincent R. A.: An Empirical Model of the Earth's Horizontal Wind Fields: HWM07, J. Geophys. Res., 113, A12304, https://doi.org/10.1029/2008JA013668, 2008.
Dunham, E. M. and Archuleta, R. J.: Evidence for a Supershear Transient during the 2002 Denali Fault Earthquake, B. Seismol. Soc. Am., 94, S256, https://doi.org/10.1785/0120040616, 2004.
ECMWF: European Centre for Medium-Range Weather Forecasts, Integrated Forecast System analysis data, available at: https://www.ecmwf.int (last access: 2 September 2019), 2018.
Gaebler, P., Ceranna, L., Nooshiri, N., Barth, A., Cesca, S., Frei, M., Grünberg, I., Hartmann, G., Koch, K., Pilger, C., Ross, J. O., and Dahm, T.: A multi-technology analysis of the 2017 North Korean nuclear test, Solid Earth, 10, 59–78, https://doi.org/10.5194/se-10-59-2019, 2019.
Garcés, M. A.: On Infrasound Standards, Part 1: Time, Frequency, and Energy Scaling, InfraMatics, 2, 13–35, https://doi.org/10.4236/inframatics.2013.22002, 2013.
Gibbons, S. J., Asming, V., Eliasson, L., Fedorov, A., Fyen, J., Kero, J., Kozlovskaya, E., Kvaerna, T., Liszka, L., Näsholm, S. P., Raita, T., Roth, M., Tiira, T., and Vinogradov, Y.: The European Arctic: A Laboratory for Seismoacoustic Studies, Seismol. Res. Lett., 86, 917–928, https://doi.org/10.1785/0220140230, 2015a.
Gibbons, S. J., Kværna, T., and Mykkeltveit, S.: Could the IMS Infrasound Stations Support a Global Network of Small Aperture Seismic Arrays?, Seismol. Res. Lett., 86, 1148–1159, https://doi.org/10.1785/0220150068, 2015b.
Green, D. N., Vergoz, J., Gibson, R., Le Pichon A., and Ceranna, L.: Infrasound radiated by the Gerdec and Chelopechene explosions: propagation along unexpected paths, Geophys. J. Int., 185, 890–910, https://doi.org/10.1111/j.1365-246X.2011.04975.x, 2011.
Hedlin, M. A. H., Walker, K. T., Drob, D. P., and de Groot-Hedlin, C. D.: Infrasound: Connecting the Solid Earth, Oceans, and Atmosphere, Annu. Rev. Earth Pl. Sc., 40, 327–354, https://doi.org/10.1146/annurev-earth-042711-105508, 2012.
Heidarzadeh, M., Muhari, A., and Wijanarto, A. B.: Insights on the Source of the 28 September 2018 Sulawesi Tsunami, Indonesia Based on Spectral Analyses and Numerical Simulations, Pure Appl. Geophys., 176, 25–43, https://doi.org/10.1007/s00024-018-2065-9, 2019.
Hernandez, B., Le Pichon, A., Vergoz, J., Herry, P., Ceranna, L., Pilger, C., Marchetti, E., Ripepe, M., and Bossu, R.: Estimating the Ground-Motion Distribution of the 2016 Mw 6.2 Amatrice, Italy, Earthquake Using Remote Infrasound Observations, Seismol. Res. Lett., 89, 2227–2236, https://doi.org/10.1785/0220180103, 2018.
Jamelot, A., Gailler, A., Heinrich, P., Vallage, A., and Champenois, J.: Tsunami Simulations of the Sulawesi Mw 7.5 Event: Comparison of Seismic Sources Issued from a Tsunami Warning Context Versus Post-Event Finite Source, Pure Appl. Geophys., 176, 3351–3376, https://doi.org/10.1007/s00024-019-02274-5, 2019.
Katili, J. A.: Past and Present Geotectonic Position of Sulawesi, Indonesia, Tectonophysics, 45, 289–322, https://doi.org/10.1016/0040-1951(78)90166-X, 1978.
Kulichkov, S. N., Chunchuzov, I. P., and Popov, O. I.: Simulating the Influence of an Atmospheric Fine Inhomogeneous Structure on Long Range Propagation of Pulsed Acoustic Signals, Izv. Atmos. Ocean. Phys.+, 46, 60–68, https://doi.org/10.1134/S0001433810010093, 2010.
Landès, M., Le Pichon, A., Shapiro, N. M., Hillers, G., and Campillo, M.: Explaining global patterns of microbarom observations with wave action models, Geophys. J. Int., 199, 1328–1337, https://doi.org/10.1093/gji/ggu324, 2014.
Le Pichon, A., Guilbert, J., Vega, A., Garcés, M. A., and Brachet, N.: Ground-coupled air waves and diffracted infrasound from the Arequipa earthquake of June 23, 2001, Geophys. Res. Lett., 29, 1886–1889, https://doi.org/10.1029/2002GL015052, 2002.
Le Pichon, A., Guilbert, J., Vallée, M., Dessa, J. X., and Ulziibat, M.: Infrasonic imaging of the Kunlun Mountains for the great 2001 China earthquake, Geophys. Res. Lett., 30, 1814–1817, https://doi.org/10.1029/2003GL017581, 2003.
Le Pichon, A., Herry, P., Mialle, P., Vergoz, J., Brachet, N., Garces, M. A., Drob, D., and Ceranna, L.: Infrasound associated with 2004–2005 large Sumatra earthquakes and tsunami, Geophys. Res. Lett., 32, L19802, https://doi.org/10.1029/2005GL023893, 2005.
Le Pichon, A., Mialle, P., Guilbert, J., and Vergoz, J.: Multistation infrasonic observations of the Chilean earthquake of 2005 June 13, Geophys. J. Int., 167, 838–844, https://doi.org/10.1111/j.1365-246X.2006.03190.x, 2006.
Le Pichon, A., Blanc, E., and Hauchecorne, A. (Eds.): Infrasound Monitoring for Atmospheric Studies, Springer, Heidelberg, Germany, ISBN 978-1-4020-9507-8, 2010.
Le Pichon, A., Ceranna, L., and Vergoz, J.: Incorporating numerical modeling into estimates of the detection capability of the IMS infrasound network, J. Geophys. Res., 117, D05121, https://doi.org/10.1029/2011JD016670, 2012.
Le Pichon, A., Blanc, E., and Hauchecorne, A. (Eds.): Infrasound for Atmospheric Studies – Challenges in Middle Atmosphere Dynamics and Societal Benefits, Springer, Heidelberg, Germany, ISBN 978-3-319-75138-2, 2019.
Marchetti, E., Lacanna, G., Le Pichon, A., Piccinini, D., and Ripepe, M.: Evidence of large infrasonic radiation induced by earthquake interaction with alluvial sediments, Seismol. Res. Lett., 87, 678–684, https://doi.org/10.1785/0220150223, 2016.
Matoza, R., Green, D. N., Le Pichon, A., Shearer, P. M., Fee, D., Mialle, P., and Ceranna, L.: Automated detection and cataloging of global explosive volcanism using the International Monitoring System infrasound network, J. Geophys. Res.-Sol. Ea., 122, 2946–2971, https://doi.org/10.1002/2016JB013356, 2017.
Mutschlecner, J. P. and Whitaker, R. W.: Infrasound from earthquakes, J. Geophys. Res., 110, D01108, https://doi.org/10.1029/2004JD005067, 2005.
Negraru, P. T., Golden, P., and Herrin, E. T.: Infrasound Propagation in the “Zone of Silence”, Seismol. Res. Lett., 81, 614–624, https://doi.org/10.1785/gssrl.81.4.614, 2010.
Olson, J. V., Wilson, C. R., and Hansen, R. A.: Infrasound associated with the 2002 Denali fault earthquake, Alaska, Geophys. Res. Lett., 30, 2195–2198, https://doi.org/10.1029/2003GL018568, 2003.
Omira, R., Dogan, G. G., Hidayat, R., Husrin, S., Prasetya, G., Annunziato, A., Proietti, C., Probst, P., Paparo, M. A., Wronna, M., Zaytsev, A., Pronin, P., Giniyatullin, A., Putra, P. S., Hartanto, D., Ginanjar, G., Kongko, W., Pelinovsky, E., and Yalciner, A. C.: The September 28th, 2018, Tsunami In Palu-Sulawesi, Indonesia: A Post-Event Field Survey, Pure Appl. Geophys., 176, 1379–1395, https://doi.org/10.1007/s00024-019-02145-z, 2019.
Pailoplee, S.: Probabilities of Earthquake Occurrences along the Sumatra-Andaman Subduction Zone, Open Geosci., 9, 53–60, https://doi.org/10.1515/geo-2017-0004, 2017.
Picone, J. M., Hedin, A. E., Drob, D. P., and Aikin, A. C.: NRLMSISE-00 Empirical Model of the Atmosphere: Statistical Comparisons and Scientific Issues, J. Geophys. Res., 107, 1468–1483, https://doi.org/10.1029/2002JA009430, 2002.
Pilger, C., Ceranna, L., Ross, J. O., Vergoz, J., Le Pichon, A., Brachet, N., Blanc, E., Kero, J., Liszka, L., Gibbons, S., Kvaerna, T., Näsholm, S. P., Marchetti, E., Ripepe, M., Smets, P., Evers, L., Ghica, D., Ionescu, C., Sindelarova, T., Ben Horin, Y., and Mialle, P.: The European Infrasound Bulletin, Pure Appl. Geophys., 175, 3619–3638, https://doi.org/10.1007/s00024-018-1900-3, 2018.
Shani-Kadmiel, S., Assink, J. D., Smets, P. S. M., and Evers, L. G.: Seismoacoustic coupled signals from earthquakes in Central Italy: epicentral and secondary sources of infrasound, Geophys. Res. Lett., 45, 427–435, https://doi.org/10.1002/2017GL076125, 2017.
Socquet, A., Hollingsworth, J., Pathier, E., and Bouchon, M.: Evidence of supershear during the 2018 magnitude 7.5 Palu earthquake from space geodesy, Nat. Geosci., 12, 192–199, https://doi.org/10.1038/s41561-018-0296-0, 2019.
Sutherland, L. C. and Bass, H. E.: Atmospheric absorption in the atmosphere up to 160 km, J. Acoust. Soc. Am., 115, 1012–1032, https://doi.org/10.1121/1.1631937, 2004.
Tailpied, D., Le Pichon, A., Marchetti, E., Assink, J., and Vergniolle, S.: Assessing and optimizing the performance of infrasound networks infrasound networks to monitor volcanic eruptions, Geophys. J. Int., 208, 437–448, https://doi.org/10.1093/gji/ggw400, 2017.
USGS: U.S. Geological Survey, Sulawesi 2018 earthquake event page, available at: https://earthquake.usgs.gov/earthquakes/eventpage/us1000h3p4/ (last access: 2 September 2019), 2018.
Walker, K. T., Le Pichon, A., Kim, T. S., de Groot-Hedlin, C., Che, I.-Y., and Garcés, M.: An analysis of ground shaking and transmission loss from infrasound generated by the 2011 Tohoku earthquake, J. Geophys. Res., 118, 12831–12851, https://doi.org/10.1002/2013JD020187, 2013.
Wang, D. and Mori, J.: The 2010 Qinghai, China, Earthquake: A Moderate Earthquake with Supershear Rupture, B. Seismol. Soc. Am., 102, 301–308, https://doi.org/10.1785/0120110034, 2012.
Waxler, R., Assink, J., Hetzer, C., and Velea, D.: NCPAprop – A software package for infrasound propagation modeling, J. Acoust. Soc. Am., 141, 3627–3627, https://doi.org/10.1121/1.4987797, 2017.
Wilson, D. K.: The sound-speed gradient and refraction in the near-ground atmosphere, J. Acoust. Soc. Am., 113, 750–757, https://doi.org/10.1121/1.1532028, 2003.
Young, J. M. and Greene, G. E.: Anomalous infrasound generated by the Alaskan earthquake of 28 march 1964, J. Acoust. Soc. Am., 71, 334–339, https://doi.org/10.1121/1.387457, 1982.
Yue, H., Lay, T., Freymueller, J. T., Ding, K., Rivera, L., Ruppert, N. A., and Koper, K. D.: Supershear rupture of the 5 January 2013 Craig, Alaska (Mw 7.5) earthquake, J. Geophys. Res., 118, 5903–5919, https://doi.org/10.1002/2013JB010594, 2013.