the Creative Commons Attribution 4.0 License.
the Creative Commons Attribution 4.0 License.
 | 10 Oct 2019
The influence of land use and land cover change on landslide susceptibility: a case study in Zhushan Town, Xuan'en County (Hubei, China)
Zizheng Guo
Kunlong Yin
Dhruba Pikha Shrestha
Shikuan Jin
Land use and land cover change can increase or decrease landslide susceptibility (LS) in the mountainous areas. In the hilly and mountainous part of southwestern China, land use and land cover change (LUCC) has taken place in the last decades due to infrastructure development and rapid economic activities. This development and activities can worsen the slope susceptible to sliding due to mostly the cutting of slopes. This study, taking Zhushan Town, Xuan'en County, as the study area, aims to evaluate the influence of land use and land cover change on landslide susceptibility at a regional scale. Spatial distribution of landslides was determined in terms of visual interpretation of aerial photographs and remote sensing images, supported by field surveys. Two types of land use and land cover (LUC) maps, with a time interval covering 21 years (1992–2013), were prepared: the first was obtained by the neural net classification of images acquired in 1992 and the second by the object-oriented classification of images in 2002 and 2013. Landslide-susceptible areas were analyzed using the logistic regression model (LRM) in which six influencing factors were chosen as the landslide susceptibility indices. In addition, the hydrologic analysis method was applied to optimize the partitioning of the terrain. The results indicated that the LUCC in the region was mainly the transformation from the grassland and arable land to the forest land, which is increased by 34.3 %. An increase of 1.9 % is shown in the area where human engineering activities concentrate. The comparison of landslide susceptibility maps among different periods revealed that human engineering activities were the most important factor in increasing LS in this region. Such results emphasize the requirement of a reasonable land use planning activity process.
- Article
(43158 KB) - Full-text XML
- BibTeX
- EndNote


Landslide constitutes one of the most hazardous geomorphic processes in the mountainous areas (Harris et al., 2001; Karsli et al., 2009), which can result in serious injuries, human casualties, and cause environmental and economic damages every year (Fell et al., 2008; García-Ruiz et al., 2010). It is, therefore, necessary to take landslide hazard into account for public safety and the realization of safe engineering projects (Fell et al., 2008; Gioia et al., 2015). Because landslides are the result of the complex spatial–temporal interaction of many factors (Pisano et al., 2017), numerous environmental factors (e.g., topography, lithology and hydrology) have been defined as the main criteria in the literature (Guzzetti et al., 2006a; Nandi and Shakoor, 2009; Pourghasemi and Rossi, 2017). Moreover, some studies have indicated that human-induced land use and land cover change (LUCC) contributes significantly to the initiation and reactivation of landslides (Guillard and Zêzere, 2012; Galve et al., 2015; Meneses et al., 2019), especially in populated regions, where landslides represent a major risk to infrastructure, human settlements and people (Pinyol et al., 2012; Abancó and Hürlimann, 2014). So this factor should not be ignored in the landslide risk reduction process, particularly against the background of adaptation to sustainable natural hazard risk management (Promper et al., 2015; Wang et al., 2018).
LUCC often implies modifications in both the natural and social systems (Promper et al., 2015; Lopez-Saez et al., 2016), in particular to changes in vegetation cover (Tasser et al., 2003; Schmaltz et al., 2017), undercutting of slopes (Scalenghe and Marsan, 2009), surface sealing or changes of drainage system (Ghestem et al., 2011, 2014), all of which can potentially influence landslide hazard processes – for example, the phenomenon that mountainous areas with forest cover typically appear to be less susceptible to shallow landslides than unforested mountain slopes as described in many studies such as Cruden and Miller (2001), Beguería (2006) and Galve et al. (2015). Similarly, deforestation as a result of human activities, e.g., road and/or railway construction, undercutting of slopes and development of settlement areas in steep mountainous areas increases the vulnerability to landslide hazards (Glade, 2003; Bruschi et al., 2013). All these modifications may lead to an increase in landslide events (Cervi et al., 2010; Piacentini et al., 2012; Reichenbach et al., 2014). Thus, it is of utmost importance to link land use planning activity with landslide risk assessment (Glade, 2003; Van Westen et al., 2006; Fell et al., 2008). For single slopes and at local scales, the impact of the plant root or the spatial distribution of LUC on landslides have been evaluated using various methods, including digital photogrammetric techniques (Karsli et al., 2009), microstructure analysis (Ghestem et al., 2011), laboratory shear tests (Ghestem et al., 2011), numerical modeling approaches (Mao et al., 2014) and so on. From the perspective of the regional scale, within an effective hazard mitigation planning, the landslide susceptibility (LS) is usually considered as the initial work (Chen et al., 2016; Zhou et al., 2018) which can be used to reflect the degree to which a terrain unit can be affected by future slope movements (Van Westen et al., 2008; Lombardo and Mai, 2018). The importance of the influence of LUCC in landslide susceptibility analysis at a regional scale has been noted by several authors (Reichenbach et al., 2014; Pisano et al., 2017; Meneses et al., 2019).
During the past decades, various techniques incorporating Geographic Information System (GIS) along with remote sensing (RS) technologies have been widely used to map slope stability, e.g., quantifying landslide hazards in relation to LUCC (Meneses et al., 2019), use of the spatial statistical analysis (Kayastha, 2015), aerial photogrammetry (Karsli et al., 2009; Bruschi et al., 2013), use of space-borne optical sensors data (Taubenböck et al., 2011; Li et al., 2019) and time-lapse photography for soil aggregate stability (Ymeti et al., 2017). For such studies, in general, the selection of meaningful mapping units is a basic step because it is of great importance for susceptibility zonation. A mapping unit refers to a portion of land surface with analogous geologic and/or geomorphic properties (Guzzetti et al., 2006b), which can broadly be summarized into four categories: grid cells, slope units (SU), terrain units (TU) and unique condition units, of which grid cells and SU are the most widely used (Van Den Eeckhaut et al., 2009; Rotigliano et al., 2012; Chen et al., 2016). Each category of mapping units presents advantages and disadvantages. Despite the long-term efforts by researchers, the adoption of the best mapping unit still remains a conceptual problem and an operational challenge (Guzzetti et al., 2000; Alvioli et al., 2016). In addition to the extensive discussions about this subject (Guzzetti et al., 1999; Aleotti and Chowdhury, 1999; Brenning, 2005), several authors have provided examples where different mapping units were tested for the same area (Van Den Eeckhaut et al., 2009; Rotigliano et al., 2012). We can see that mostly the current trend of using grid cells is unjustified (Schlögel et al., 2018), especially considering that single-cell values are less representative for phenomena involving a portion or whole slopes (Camilo et al., 2017); rather, slope unit considers the totality of the slopes where the landslides occurred, which can forecast the locations of future independent landslides.
In Zhushan Town, land use and land cover change have been taking place in the last decades due to infrastructure development and rapid economic activities. These processes have also caused changes in the geological environment, mainly in three aspects: (i) steepening of slopes by undercutting and backfilling during construction of infrastructures and residential structures on the hill slopes, (ii) destruction of cultivated and forest lands due to local mining activities, and (iii) construction of a hydropower facility near the urban area (the Shuanglong Lake Reservoir built in 1992). The change in the seepage conditions along the reservoir bank slopes' water level fluctuations has a great impact on the stability of the slopes on both sides of the reservoir. The aim of this study is thus to explore the relationship between LUCC and regional landslide susceptibility. It is of utmost importance to know the land cover and land use processes, which are responsible for landslide susceptibility so that preventive measures can be implemented from the beginning. Landslide inventory was carried out, and influencing factors were determined. Different LUC maps for three periods with a time interval covering 21 years (1992–2013) were prepared using remote sensing techniques. Finally, landslide susceptibility assessment was carried out in GIS and subsequently compared to evaluate the impact of the LUCC during this period.
2.1 Study area
2.1.1 General description
Xuan'en County in the southwest of Hubei Province (China) was selected as the study area, which is about 45 km away from the Enshi city (Fig. 1). The study area lies within longitude 109∘11′–109∘55′ E and latitude 29∘33′–30∘12′ N. Zhushan Town is located in northwestern Xuan'en County with an area covering approximately 49 km2. The region belongs to the extension of the Wuling and Qiyue mountains and is surrounded by middle and low mountains. The elevation ranges between 350 m and 2015 m a.s.l. (above sea level), which is characterized as higher in the northwest and lower in the southeast. The region is situated at the end of the syncline core, which extends along the NE–SW direction. The geological formation presents the sedimentary rocks from Cambrian to Cretaceous and the loose Quaternary deposits. The outcrop of the strata in Xuan'en County largely consists of the Badong formation of middle Triassic (T2b), sandstone, claystone and limestone, and the Quaternary deposits. At this geological structure, there is a joint system of NE and NW directions which affected the integrity of the rock mass.

Figure 1The location of the study area. (a) The location of Hubei Province in China. (b) The location of Xuan'en County in Hubei Province. (c) The digital elevation model (DEM) showing the basic terrain conditions.
The climate of the study area is a subtropical monsoon. Precipitation varies locally due to elevation differences. In the town with an elevation below 800 m, the average annual rainfall is about 1500 mm, which gradually increases with an increase in altitude. When the elevation is above 1200 m, the average annual rainfall exceeds 1800 mm. The Gongshui River is the mainstream which drains the area, with the Shuanglong Lake Reservoir built across the river.
2.1.2 Urbanization and human engineering activities
Before the 1980s, there were small numbers of settlements in Xuan'en County. With the rapid development of the economy in the last two decades, expansion of settlement areas took place very quickly, such as the construction of highways, and nearly doubled the number of industrial and civil structures. By the earlier 1990s, Zhushan Town had increased significantly, of which the urban area mainly concentrated on the northern side of the Gongshui River valley. Most parts of the area surrounding settlements were deforested, bare or cultivated. With the constructions of infrastructures, especially along the No. 209 national highway, the traffic condition has been significantly improved. Tourism has gradually become an important economy. Currently, Zhushan Town has become the political and economic center of the county, and the settlement area has expanded not only on both the sides of the river but also on the mountainous areas outside the valley. The urban area has grown from the initial 0.5 km2 to nearly 7 km2 with a recent estimate of 75 000 residents, making it the most densely populated center.
During the process of urbanization in recent decades, many engineering activities carried out in the area have changed the original topography. Although the urbanization process has improved the local economy, the LUCC caused by construction activities has also become one of the main factors influencing slope deformation and failure.
2.2 Data sources
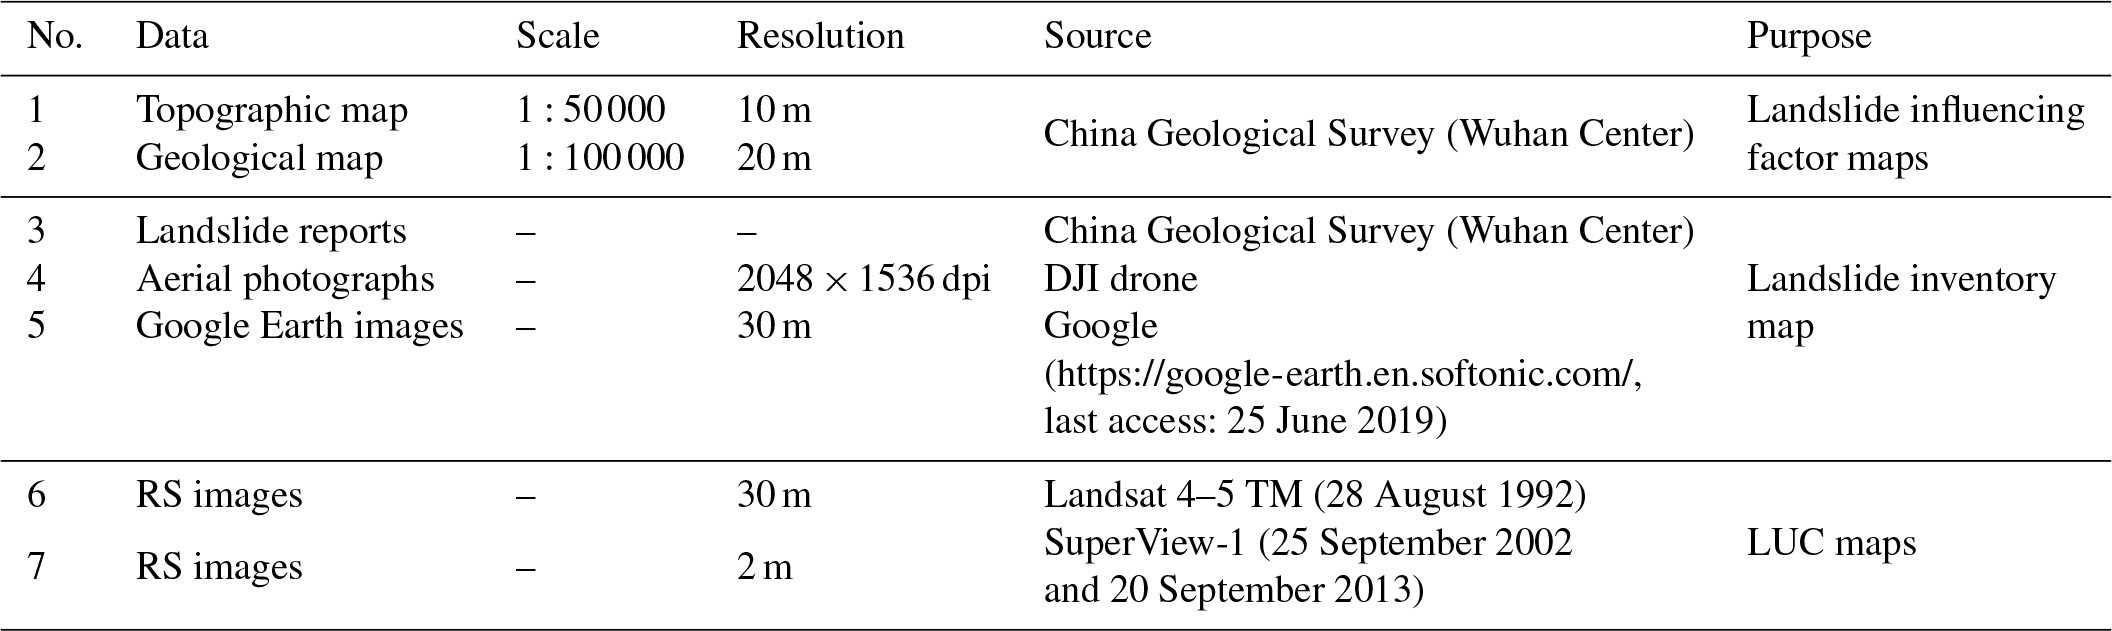
The data used in the study mainly include (i) a topographic map, (ii) a geological map, (iii) landslide reports, (iv) aerial photographs and (v) remote sensing images. Details of data sources are shown in Table 1.
Table 1The sources and characteristics of the data used in the paper.
3.1 Land use and land cover mapping
Satellite remote sensing techniques are generally used to obtain land use and land cover information. The key step in this process is image classification (Shrestha et al., 2019). For land cover change analysis, it is more logical to use the same analysis method for processing the images from different years. However, the quality of the RS data, which is mainly associated with the spatial resolution of the data, should also be taken into account to have better results. In the 1990s the highest spatial resolution of multispectral images was 30 m (Landsat TM), which allows optimal pixel-based classification. With the development of high-resolution RS images, object-oriented techniques, using a polygon entity as the basic unit, provide a widely used method for information processing (Blaschke, 2010; Bayramov et al., 2016; Ymeti et al., 2017). Therefore, for the present study, both the pixel-based and the object-oriented methods were chosen for the classifications of images obtained in 1992, 2002 and 2013.
Three sets of RS images were prepared to obtain the LUC maps of different years: Landsat 4–5 TM images from 1992, and SuperView-1 images from 2002 and 2013. For the Landsat 4–5 TM images, the normalized difference vegetation index (NDVI) (Huang et al., 2018) and normalized difference water index (NDWI) (Li et al., 2019) were obtained using ENVI software. After this, the first five spectral bands (wavelength ranges of 0.45–0.52, 0.52–0.60, 0.63–0.69, 0.76–0.90 and 1.55–1.75 µm, respectively), as well as the NDVI and NDWI, were used for neural net classification. For classification, the training samples were taken using the regions of interest determined by visual interpretation. The logistic function was determined as the activation. The number of hidden layers was set to 1, and the training rate was set to 0.5. The termination condition was set to 10−4, and the number of training iterations was set to 500. For the SuperView-1 images, the multiscale segmentation was performed based on eCognition software (http://www.ecognition.com/, last access: 3 July 2019). The parameters were set as follows: (i) scale parameter – 200; (ii) band weight – blue 1, green 1 and red 1; (iii) shape – 0.6; and (iv) compactness – 0.4. Then, considering the average brightness, length–width–height ratio, and shape index of the object as the features, the nearest-neighbor classification was carried out, where the way to obtain the region of interest (ROI) was similar to that used for the classification of Landsat images.
3.1.1 Pixel-based analysis: neural network (NN) classification
The neural network algorithm compares pixels to one another and those of known identity and then assigns groups of identical pixels into classes that match the informational categories of user interest (Abdul-Qadir, 2014). Among numerous NN models developed for pattern recognition (Berberoglu et al., 2000; Aitkenhead et al., 2008), BP neural network (BPNN) is the most commonly used. The basic element of a BPNN is the processing node and the interconnections between each node, which has an associated weight (Lee et al., 2004). These nodes are organized into layers, and each layer is fully interconnected to the following layer in general. Each BPNN consists of three or more interconnected layers: input layer (i.e., the first layer), output layer (i.e., the final processing layer) and hidden layer (between the input layer and output layer). The user defines the number of hidden layers as well as the nodes within each layer.
Each pixel in the image has its own specific LUC information. Although it is impossible to state the clear LUC characteristics of all pixels, we can still determine the LUC properties using statistics or fieldwork data which are used in defining the region of interest, and their LUC information are extracted directly from the image as the training dataset of the BPNN. This dataset is input into the nodes of the first layer, and each processing node sums the values of its weighted inputs. The summed input signals are then transformed and passed to the nodes in the next layer in a feed-forward manner. After each training process, the output results are compared with the actual LUC values, and the errors are returned to the input layer for correction. Therefore, with the constant iteration of the training process, the final classification accuracy is improved gradually.
3.1.2 Object-oriented analysis: multiscale segmentation and nearest-neighbor classification
The high-resolution satellite imagery has a higher spatial resolution, but with a lower spectrum number, so the phenomena “some objects with different spectra and different objects with same spectrum” exist (Zhang and Tang, 2019). In such images, pixels are smaller than the object, so the grouping of pixels is possible to obtain real-world homogeneous features (Blaschke, 2010; Ymeti et al., 2017). After the grouping, the smallest unit of the image in the classification process is not a pixel but the image object. It should be noted that spectral information, as well as the geometric and structural information, should be all considered for subsequent analysis and processing.
Multiscale segmentation is a bottom-up image segmentation method based on two–two region merging techniques. It can perform multiple and continuous merging of pixels and ensure good homogeneity of all pixels in the same object in the image. Three important parameters are influencing the segmentation results: scale, band weight and shape. The scale factor can determine the size of the object after the segmentation, as well as the final accuracy of the extracted information. The band weight can determine whether a specific band in the image is considered in the segmentation and the degree of the influence of this band. The shape factor can ensure the shape integrity of the object.
The eCognition software was selected as the tool for multiscale segmentation in this study, and the supervised classification based on the nearest-neighbor method was used. Similar to pixel-based analysis, this method allows selecting the region of interest for taking training samples. In addition, it allows the description of samples in terms of the shape and texture of the objects in the feature space. The classification of the test object is determined by the nearest neighbor. The distance between the test and sample objects can be calculated as follows:
where f is the order of the feature, represents the feature values of the test object, represents the feature values of the sample object, and σf is the standard deviation of the feature.
3.2 Logistic regression model
Numerous models have been developed to perform landslide susceptibility assessment, including heuristic, deterministic, statistical and machine learning models (Huang et al., 2017). Considering the objective of the study is to observe the impact of LUCC in terms of their propensity to landslide initiation, a single multivariate statistical classification model is suitable. Therefore, we prepared the logistic regression model (LRM) to link the dependent variable expressing landslide probability with the independent variables (landslide influencing factors).
For landslide susceptibility assessment, the logistic regression model is a commonly used statistical technique that involves one or more independent explanatory variables to extract the empirical relationships from observations (Zhou et al., 2018). In particular, through the addition of a suitable link function to the usual linear regression model, variables in the model may be either continuous or discrete, or any combination of both types, and they do not necessarily have normal distributions (Lee, 2005), which gives it an advantage over linear and log-linear regressions. Ozdemir and Altural (2013) and Lee (2005) have explained the detailed formula in the case of landslide susceptibility studies, which is denoted as follows:
where X1, X2, …, Xm are predictor variables, and Y is a linear combination function of these variables that represents a linear relationship. If Y is used as a binary variable (0 or 1), then the value 0 or 1 represents the absence or presence of a landslide, respectively. The parameters a, b1, b2, …, bm are the regression coefficients that must be estimated, among which is the intercept, and b1, b2, …, bm are the coefficients that measure the contribution of the independent variables (X1, X2, …, Xm) to the variations in Y; P is the probability that the target variable (Y) is 1; is the so-called odd or frequency ratio. Through this process, the model can establish a functional relationship between binary-coded landslide events and the different factors used for landslide susceptibility assessment (Yalcin et al., 2011).
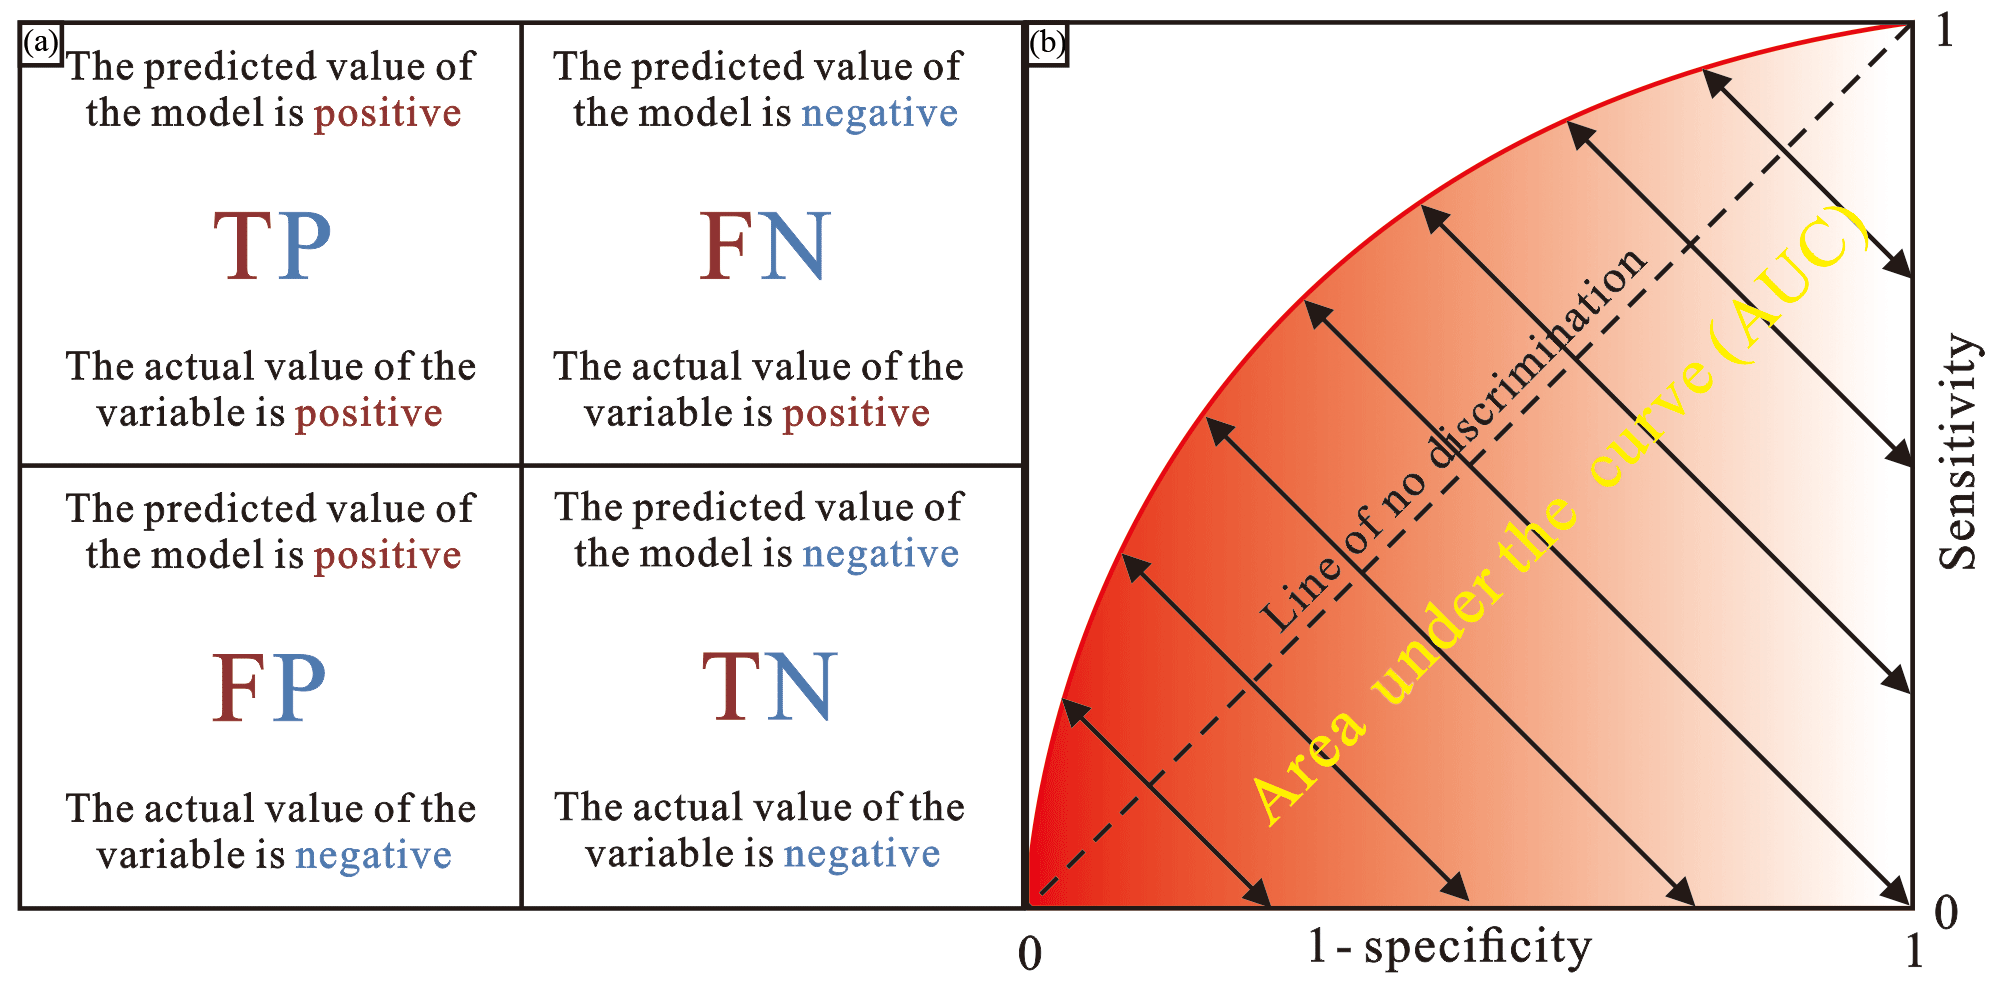
Figure 2(a) Some indices used to evaluate the landslide-susceptible area classification in the ROC method; (b) the example of ROC and AUC (source: Corsini and Mulas, 2017).
After the analysis of the relationship between the landslide and the predictor variables, the value of P can be considered as the landslide susceptibility index (LSI). In this study, the LSIs were divided into four classes, e.g., very high, high, moderate and low, according to the reasonable thresholds of LSI determined by the natural break method.
3.3 Receiver operating characteristic (ROC) curve
Although the statistical methods can evaluate the model performance effectively, such as the frequency ratio (FR) index, they require reclassification of landslide susceptibility index values, and the change in the different breakpoint values can result in different evaluation results. To remedy this, the receiver operating characteristic (ROC) curve is more commonly used to evaluate landslide susceptibility results due to the cutoff independence of it.
Several indices can be used to evaluate landslide-prone area classification in the ROC method, including the true positive (TP) rate, true negative (TN) rate, false positive (FP) rate, false negative (FN) rate, sensitivity and specificity (Fig. 2a). In simple terms, if a model predicts a positive value of a given variable (event forecast) and the value of the variable is actually positive (event), a false positive prediction is obtained. In contrast, if the value of the variable is actually negative (no event), a FP prediction is obtained (Corsini and Mulas, 2017). TN and FN predictions are classified following similar logical combinations. Based on this, the sensitivity (Sen), i.e., the percentage of correctly classified landslide cases, and the specificity (Spe) can be determined as follows:
The Sen is also considered the true positive rate, and the value (1 − Spe) is the rate of false positives (Melchiorre et al., 2008). Generally, high sensitivity indicates a high number of correct predictions, whereas high specificity (low 1 − Spe difference) indicates a low number of false positives (Mohammady et al., 2012). Hence, the Sen of the model is plotted against 1 − Spe to obtain the ROC curve, and in most cases the area under the curve (AUC) is utilized to evaluate the prediction ability of models. The model is considered better if the value of AUC is larger (Fig. 2b).
3.4 Slope unit
The slope unit is defined as one slope part, or the left/right part of a watershed, representing the region of space delimited between ridges and valleys under the constraint of homogeneous slope aspect and steepness distributions. It can avoid the shortcomings of low geomorphological representativeness of grid-based susceptibility mapping (Camilo et al., 2017). Hence, we adopted the slope unit as the mean of landslide susceptibility in this study.
The slope unit can be drawn manually from topographic maps or can be delineated automatically using specialized software (Alvioli et al., 2016). According to the prevalent methods provided by the literature (Xie et al., 2004; Reichenbach et al., 2014; Schlögel et al., 2018), the slope units of the study area were partitioned using a ArcGIS-based hydrologic analysis method. Slope units were generated in steps as follows: (i) preparing the reverse digital elevation model (DEM) by subtracting the original DEM from the highest elevation of the study area; (ii) filling the original and the reverse DEM, respectively; (iii) extracting the surface water flow direction to distinguish areas with extremely rapid changes in surface morphology; (iv) establishing the stream link for obtaining the valley lines and ridge lines; (v) delineating the slope units based on the valley and ridgelines. One of the advantages of adopting slope units is that the computational burden is reduced due to a lower number of units compared with the grid-based method (Camilo et al., 2017). Moreover, the slope units make it possible to maximize the internal homogeneity and the external heterogeneity of the slope aspect (Mashimbye et al., 2014; Schlögel et al., 2018).
3.5 Landslide mapping and analysis
3.5.1 Landslide mapping
In the simplest form, landslide inventory plays an essential role in its susceptibility mapping (Kayastha, 2015), especially in the initial phase because it provides its spatial distribution (Tian et al., 2019). It can be done in a region using different techniques such as field surveys, satellite image/air photo interpretation, and literature search for historical landslide records (Yalcin et al., 2011). The inventory was carried out from a combination of (i) detailed reports obtained from management institutes, (ii) visual interpretation of aerial photographs and remote sensing images, and (iii) field surveys carried out in the period during April and May 2013. To clarify their detailed information, we link the landslide property database to the map, which includes the descriptions of some data that cannot be digitized, e.g., the amount, area and occurrence time of landslides.
3.5.2 Factors influencing landslides
The spatial distribution of landslide hazards is the combined effect of different factors, including not only internal geological structures but also their external environmental settings. In this study, six influencing factors were determined, i.e., slope gradient, aspect, slope shape, lithology, distance to the reservoir and LUC. The thematic data were collected from different sources. For example, topographic factors were generated from elevation contour lines (1:50 000 scale), and lithology information was derived from the geological map (1:100 000 scale) obtained from the China Geological Survey. The urban planning map, which indicates the location of the Shuanglong Lake Reservoir, was collected from the administration department of Zhushan Town. The LUC maps were obtained from RS images.
The study of the relationship between landslide events and their triggering factors is a key step in landslide susceptibility assessment. In this study, this relationship was determined by calculating the ratio of the number of units with landslide occurrence to the total amount of units in each class, namely the distribution curve of the ratio. However, it should be noted that the continuous variables (slope, aspect, etc.) cannot be used directly as input data into the applied model in this study. It is necessary to classify the continuous variables into discrete classes to understand the effects of each variable on landslide occurrence. This was done according to the distribution curve of the frequency ratios (Huang et al., 2017). After the selection and preliminary analysis of these factors, their independence test was performed. The results showed that all the variables were highly uncorrelated to each other (correlation coefficient of less than 0.2), and thus they were considered very appropriate to take into account for landslide susceptibility assessment.
Topographic factors
A digital elevation model was prepared by interpolating contour lines at 10 m intervals from which topographic factors including slope gradient, aspect, and slope shape were obtained.
Slope angle (Fig. 3a), defined as the steepness of a surface, is the major parameter of slope stability analysis which can help us in understanding the characteristics of a basin for runoff and erosion processes (Vasu and Lee, 2016). The slope gradient of the study area varies in the range of 0–73.6∘ and an average value of 21.3∘. The slope gradients were divided into four categories: (i) flat to gentle (<15∘), (ii) moderate (15–25∘), (iii) steep (25–40∘), and (iv) very steep (>40∘). From the perspective of the spatial distribution, the flat-to-gentle slope class is mainly situated along the banks of the Gongshui River, while the surrounding mountainous areas have steep to very steep slopes (slope gradients of 20 to 45∘). Based on the statistical results of LRM, the locations where landslides generally occurred are in the moderate slope class. This can be explained by the fact that steeply sloping areas are generally in high elevation areas where human activities are minimal and nearly no landslide activities have been detected in the inventory (Cervi et al., 2010; Zhou et al., 2018).

Figure 3Influencing factors used in the landslide susceptibility modeling: (a) slope angle; (b) aspect; (c) profile curvature; (d) lithology; (e) distance to reservoir.
Aspect (Fig. 3b) is considered an important factor in landslide susceptibility assessment because of the role it plays in microclimate and hydrology due to differences in exposure to sunlight, winds, rainfall (degree of saturation) and discontinuities (Yalcin et al., 2011). The slope aspect was divided into eight categories. Statistical results using three years of data in the study area revealed that landslides generally occur on the slope aspect within the range of 40–100∘.
Defined along the line of maximum slope, profile curvature (Fig. 3c) affects the acceleration and deceleration of flow and, therefore, influences subsequent erosion and deposition (Regmi et al., 2010). However, the geological meaning of the profile curvature is not clear. To remedy this, this study classified the profile curvature map into three categories according to the values of the slope profile curvature: (i) convex, (ii) concave and (iii) straight (planar). These categories represent different slope shapes. In general, concave slopes are considered to be potentially landslide prone areas as they concentrate water at the lowest point that can generate adverse hydrostatic pressure, whereas convex slopes are more stable than concave slopes because they disperse the runoff more equally down the slope (Kayastha, 2015). This point can be confirmed by the model used in this study.
Lithology
The landslide event has a close relationship with lithological characteristics because different rock types have different mechanical and hydrological properties (Van Westen et al., 2008). The lithology map (Fig. 3d) of the study area was extracted from the geological map (1:100000 scale), which indicated that the main strata consist of the Jialingjiang formation (T1j) of the lower Triassic (northwest of the urban area), Badong formation (T2b) of the middle Triassic (most areas of the region) and the Quaternary deposits (banks of the Gongshui River). From the perspective of the material types, the T2b is a kind of clastic rock composed of marine-terrigenous interdepositional mudstone, siltstone and marl (Deng et al., 2017), and the T1j is a kind of carbonate rock composed of marine depositional dolomite, dolomitic limestone and microcrystalline limestone. Similarly, the Quaternary deposits also have several components, such as alluvium, proluvium and so on. According to the characteristics of engineering geological properties, these strata were differentiated into three lithological units: (i) the Quaternary deposits; (ii) layered clastic rocks and (iii) layered carbonate and clastic rocks. The layered clastic rock types show the strongest positive impact on the occurrence of landslides. More than 80 % of the total landslides occurred in the stratum of layered clastic rock, although the amount of units of this category only accounts for 38.3 % of the total units, which indicates that the Badong formation is a landslide-prone stratum.
Distance to reservoir
The large-scale engineering infrastructures can change the initial geological conditions, which can influence slope stability. In areas with abundant runoff, reservoir construction is the most common infrastructure development activity to utilize water resources, which significantly affects landslides (Iqbal et al., 2018), such as in the case of the Three Gorges Reservoir in China (Huang et al., 2017; Wang et al., 2018; Zhou et al., 2018). To see the effect of the Shuanglong Lake Reservoir construction on landslides, we prepared the distance to the reservoir (Fig. 3e), with a buffer distance of 200 m. The study area was divided into three categories of distances to the reservoir: (i) <200 m, (ii) 200–400 m and (iii) >400 m. Although the area belonging to the category of (i) and (ii) only accounts for about 5 % of the whole region, the ratio of the units with landslide occurrences is larger than the category of (iii).
Land use and land cover
Different LUC types may affect the stability of slopes because LUC can change the hydrological functioning of hillslopes, rainfall partitioning, infiltration characteristics, and runoff production, and furthermore the shear strength of the soil (García-Ruiz et al., 2010). Meanwhile, in contrast to several environmental factors such as geological structure and lithology, the LUC can change seasonally or in a short time because of the influence from nature and human activities (Reichenbach et al., 2014). Hence, for a region where the LUC types can change quickly over a short period, the correlation between LUC type and landslides should be defined to assess the effect of LUC on the occurrence of landslides. For the LUC maps, the evolution must be extracted through the comparison from at least two different periods (Pisano et al., 2017). In this study, a time interval covering 21 years (1992–2013) was considered, which were divided into two ranges: 1992–2002 and 2002–2013. It should be noted that the maps before 1992 were not provided because of the availability of the RS images needed for the mapping procedure and the undeveloped urbanization at that time.
4.1 Land use and land cover maps
Classification results show various LUC types, but some of the land cover types had to be combined for statistical analysis. For example, settlement areas, roads, and mining areas were combined and named human engineering activity land (HEAL). Since the land cover types, e.g., grassland and arable land (GAL) are covered by vegetation types with a shallow root system, they were grouped into the same LUC type. The area covered by trees was considered forest land. The remaining areas are classified as barren land. Hence, the final LUC map of the study area has four classes: (i) land with human engineering activities, (ii) forest land, (iii) grassland and arable land, and (iv) barren land (Fig. 4). The data were then integrated into an ArcGIS environment where 2870 slope units have been delineated according to the method described in Sect. 3.4. Finally, the characteristics of the spatial distribution of different LUC types were indicated based on slope units (Fig. 4d–f). The classification results show an overall accuracy of more than 89 % for the LUC classification in all the years (Table 2). The highest overall classification accuracy of 96 % was obtained for 1992 with the lowest (89 %) being in 2013. The LUC classification results provided a solid base for landslide susceptibility assessment.
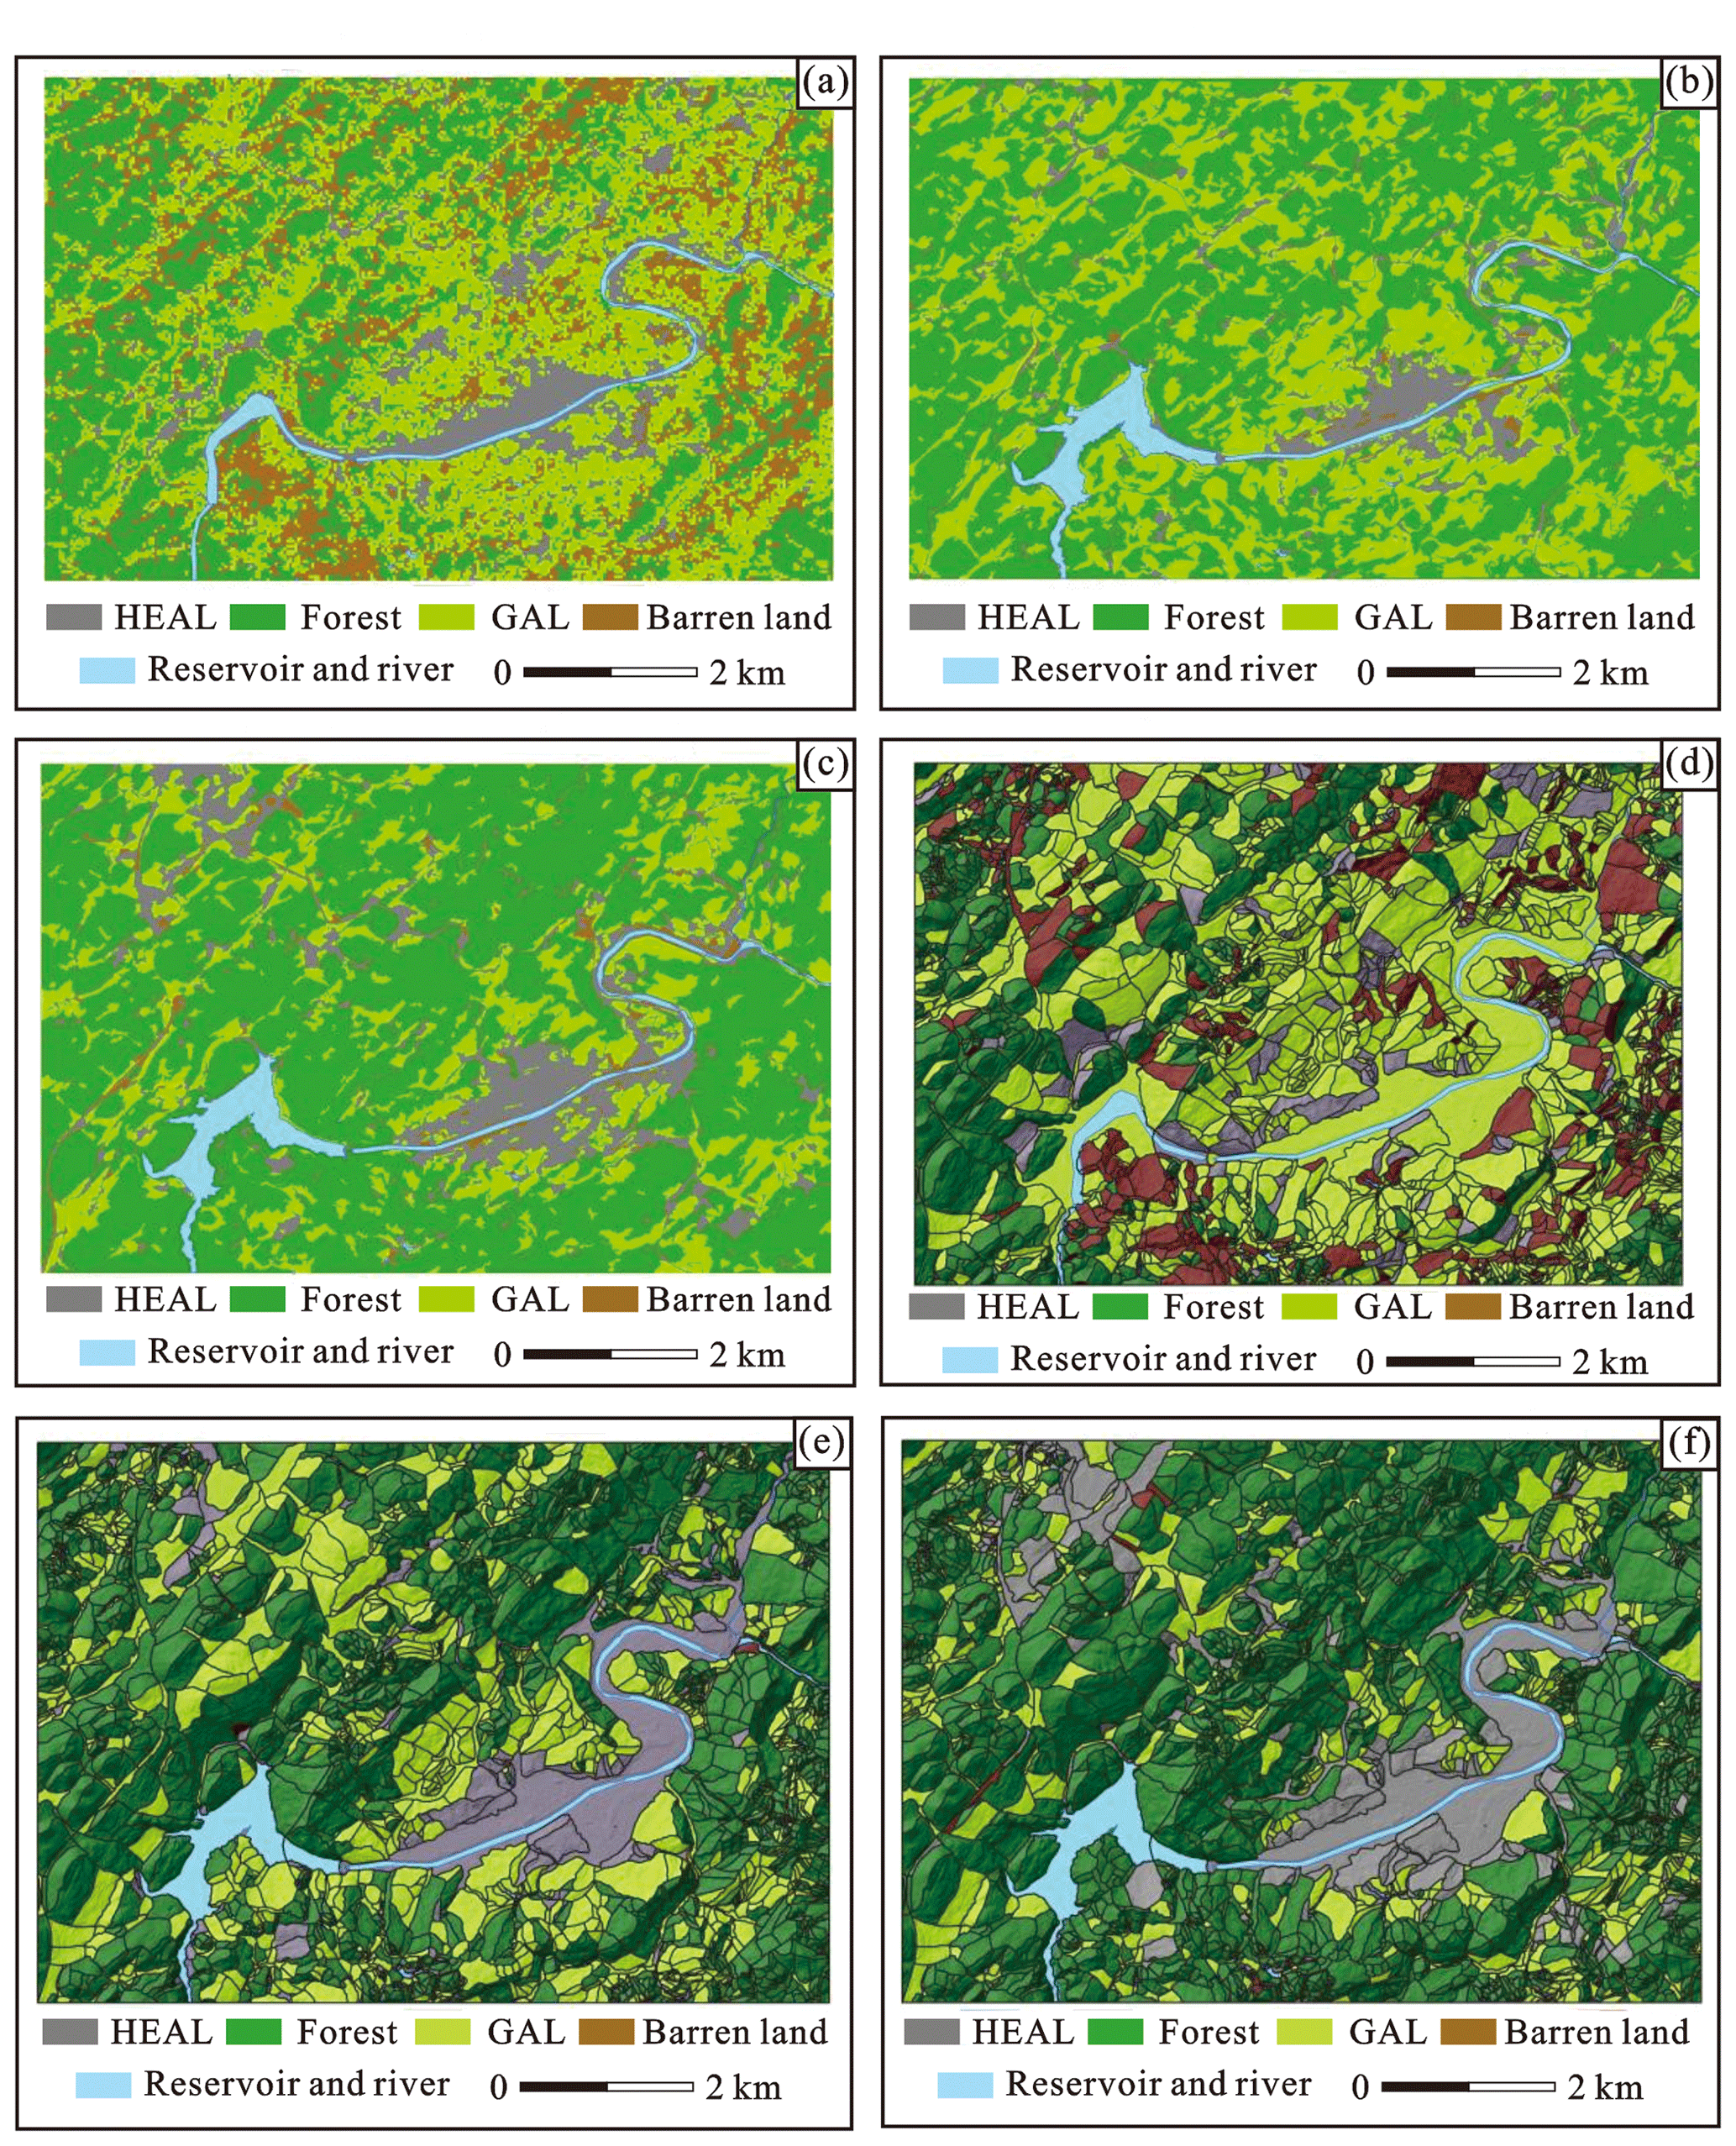
Figure 4(a) The LUC map of 1992; (b) the LUC map of 2002; (c) the LUC map of 2013; (d) the LUC map of 1992 based on SU; (e) the LUC map of 2002 based on SU; (f) the LUC map of 2013 based on SU.
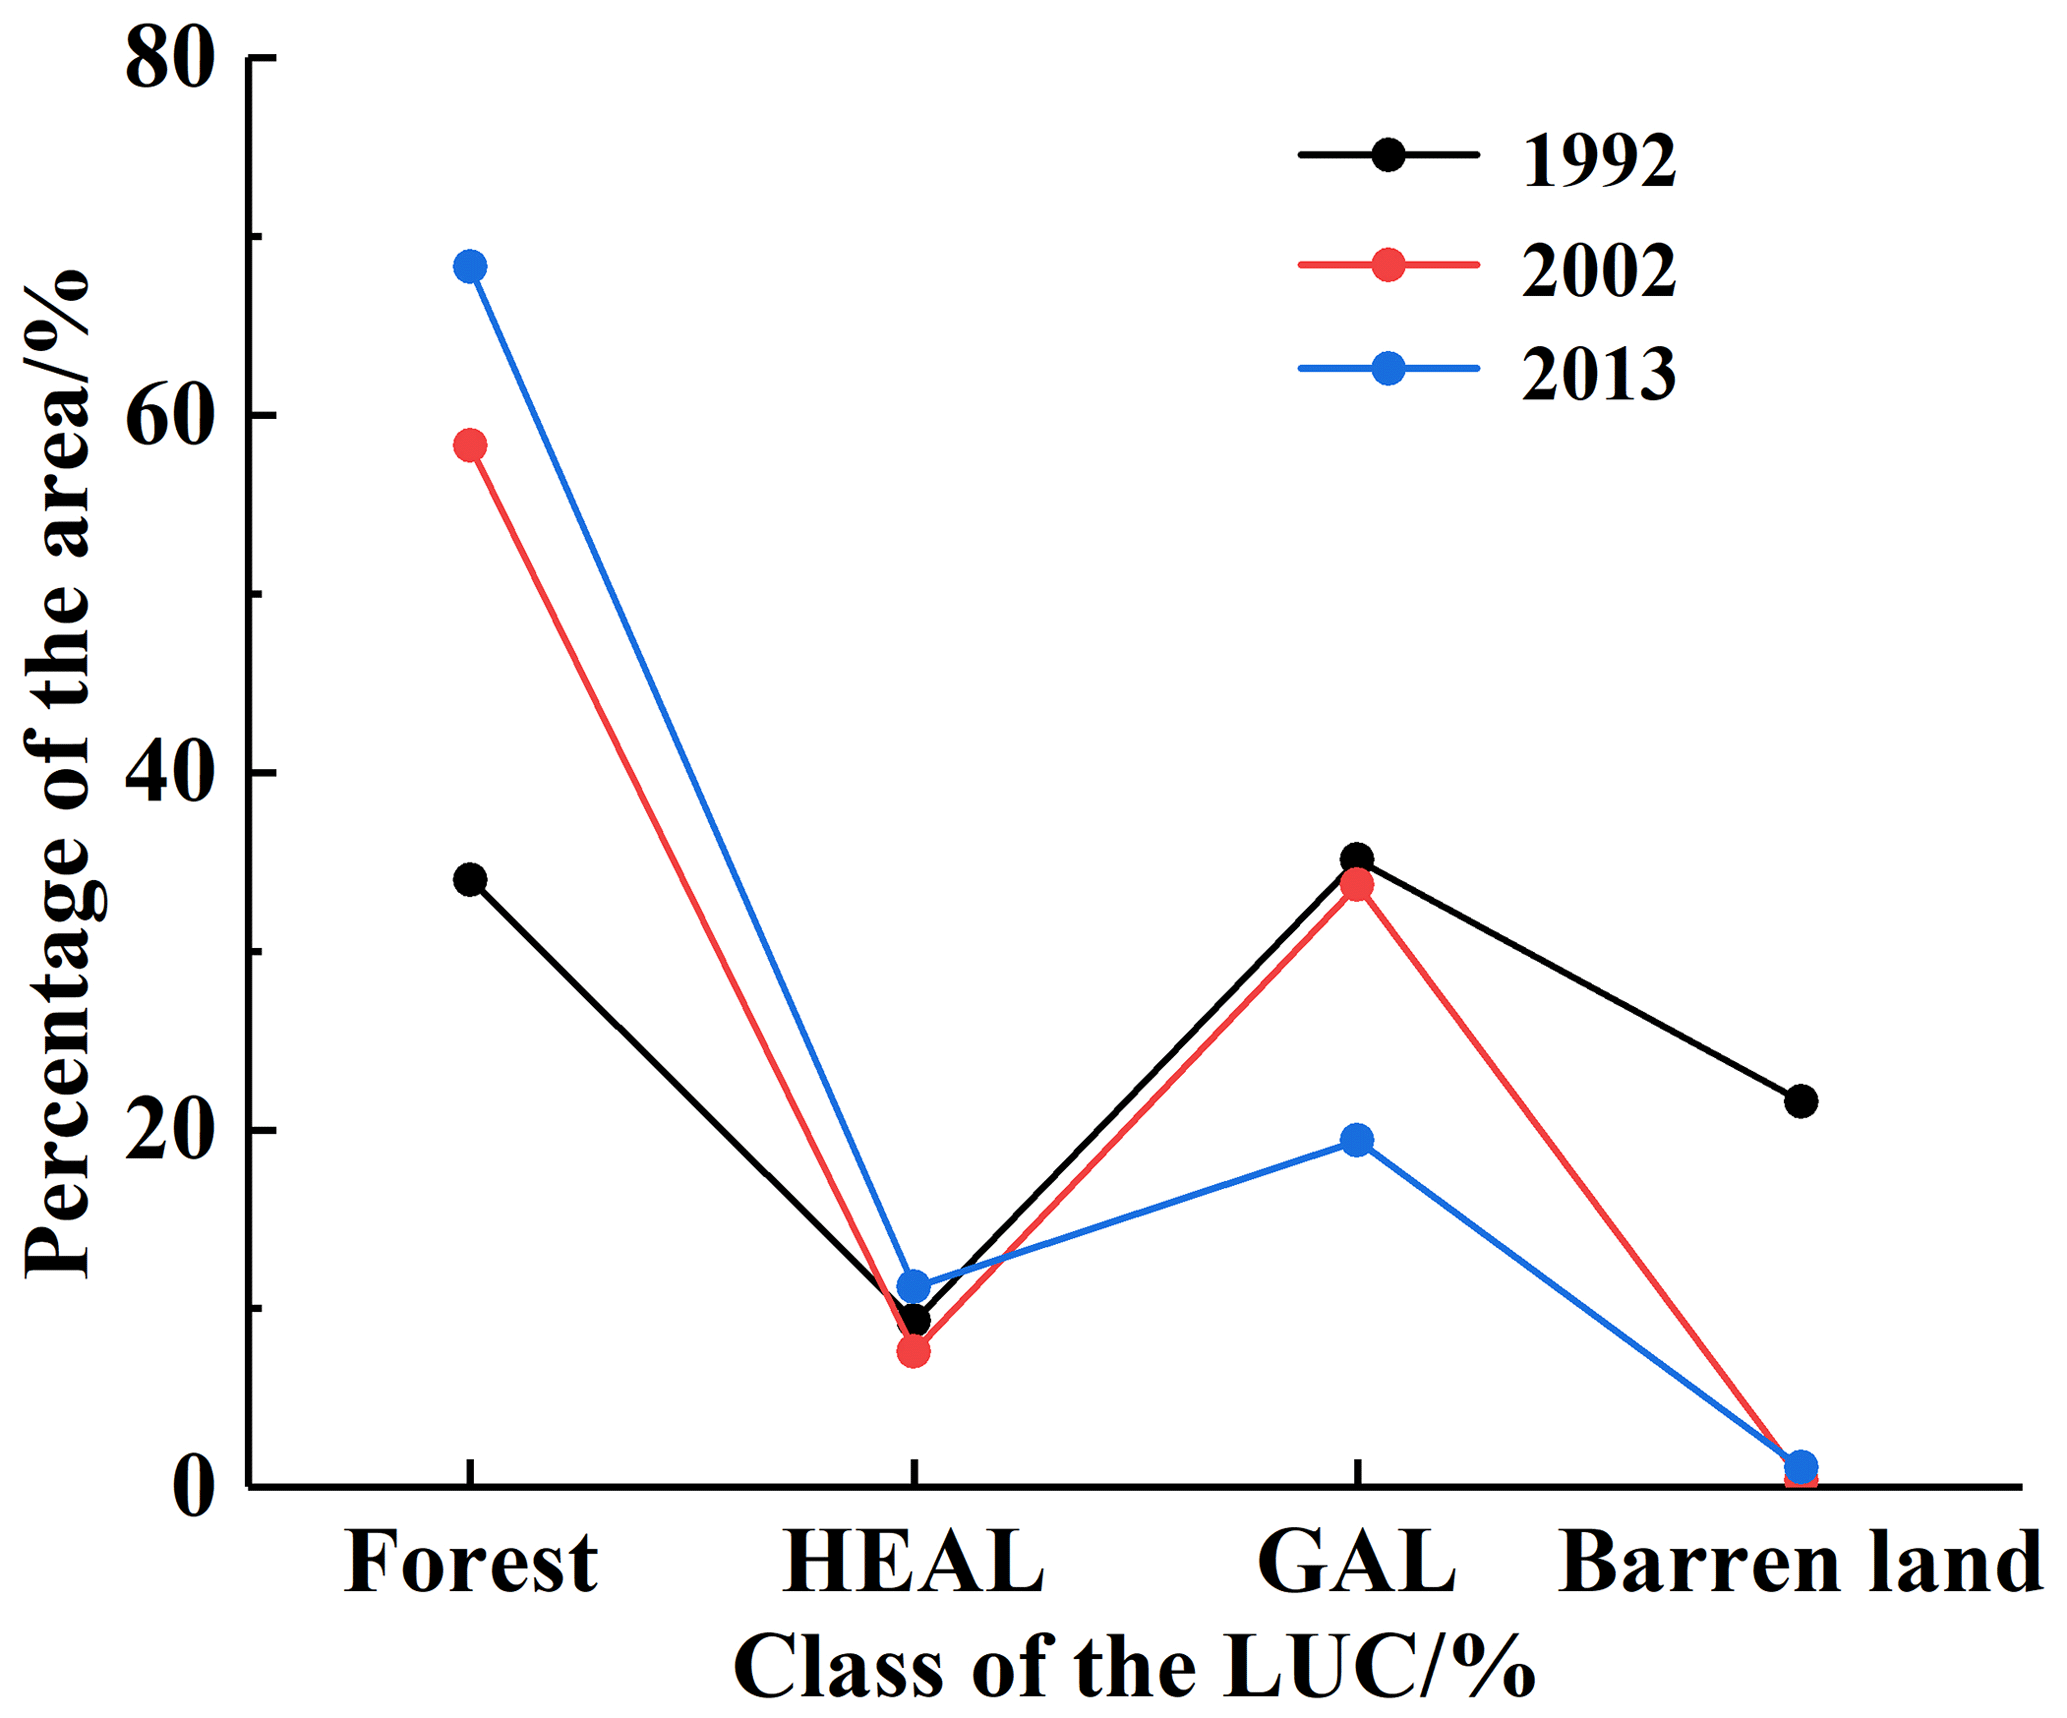
Table 2The classification accuracies of LUC maps corresponding to different years.

As shown in Fig. 5, barren land has decreased from 1992 to 2013, mainly because of the continued urbanization process, leading to the conversion of barren land into construction activities, e.g., buildings, roads and so on. Similarly, the area covered by grassland and arable land also shows a rapid reduction. On the contrary, the areas by the category of (i) and (ii) increased in this period, especially the forest land from 34 % in 1992 to 68.3 % in 2013. Even though most studies have revealed that regional forest degradation was more likely to occur in the past decades (Karsli et al., 2009; García-Ruiz et al., 2010; Galve et al., 2015), this was not the case in this area. However, some studies show the increase in forest land mainly due to migration of people and land abandonment (Beguería, 2006) or due to strict management (Pisano et al., 2017) and so on. Our study shows that deforestation was severe before 1992, causing the disappearance of a large number of natural forest lands. Because of the awareness of environmental protection in the area since 2000, the environmental problems have gradually been the focus point of the decision-makers in China. The national policy of “returning farmland to forest land”, which started in 1999, has resulted in very positive outcomes. Besides, the development of the tourism industry in the area also calls for better environmental management.
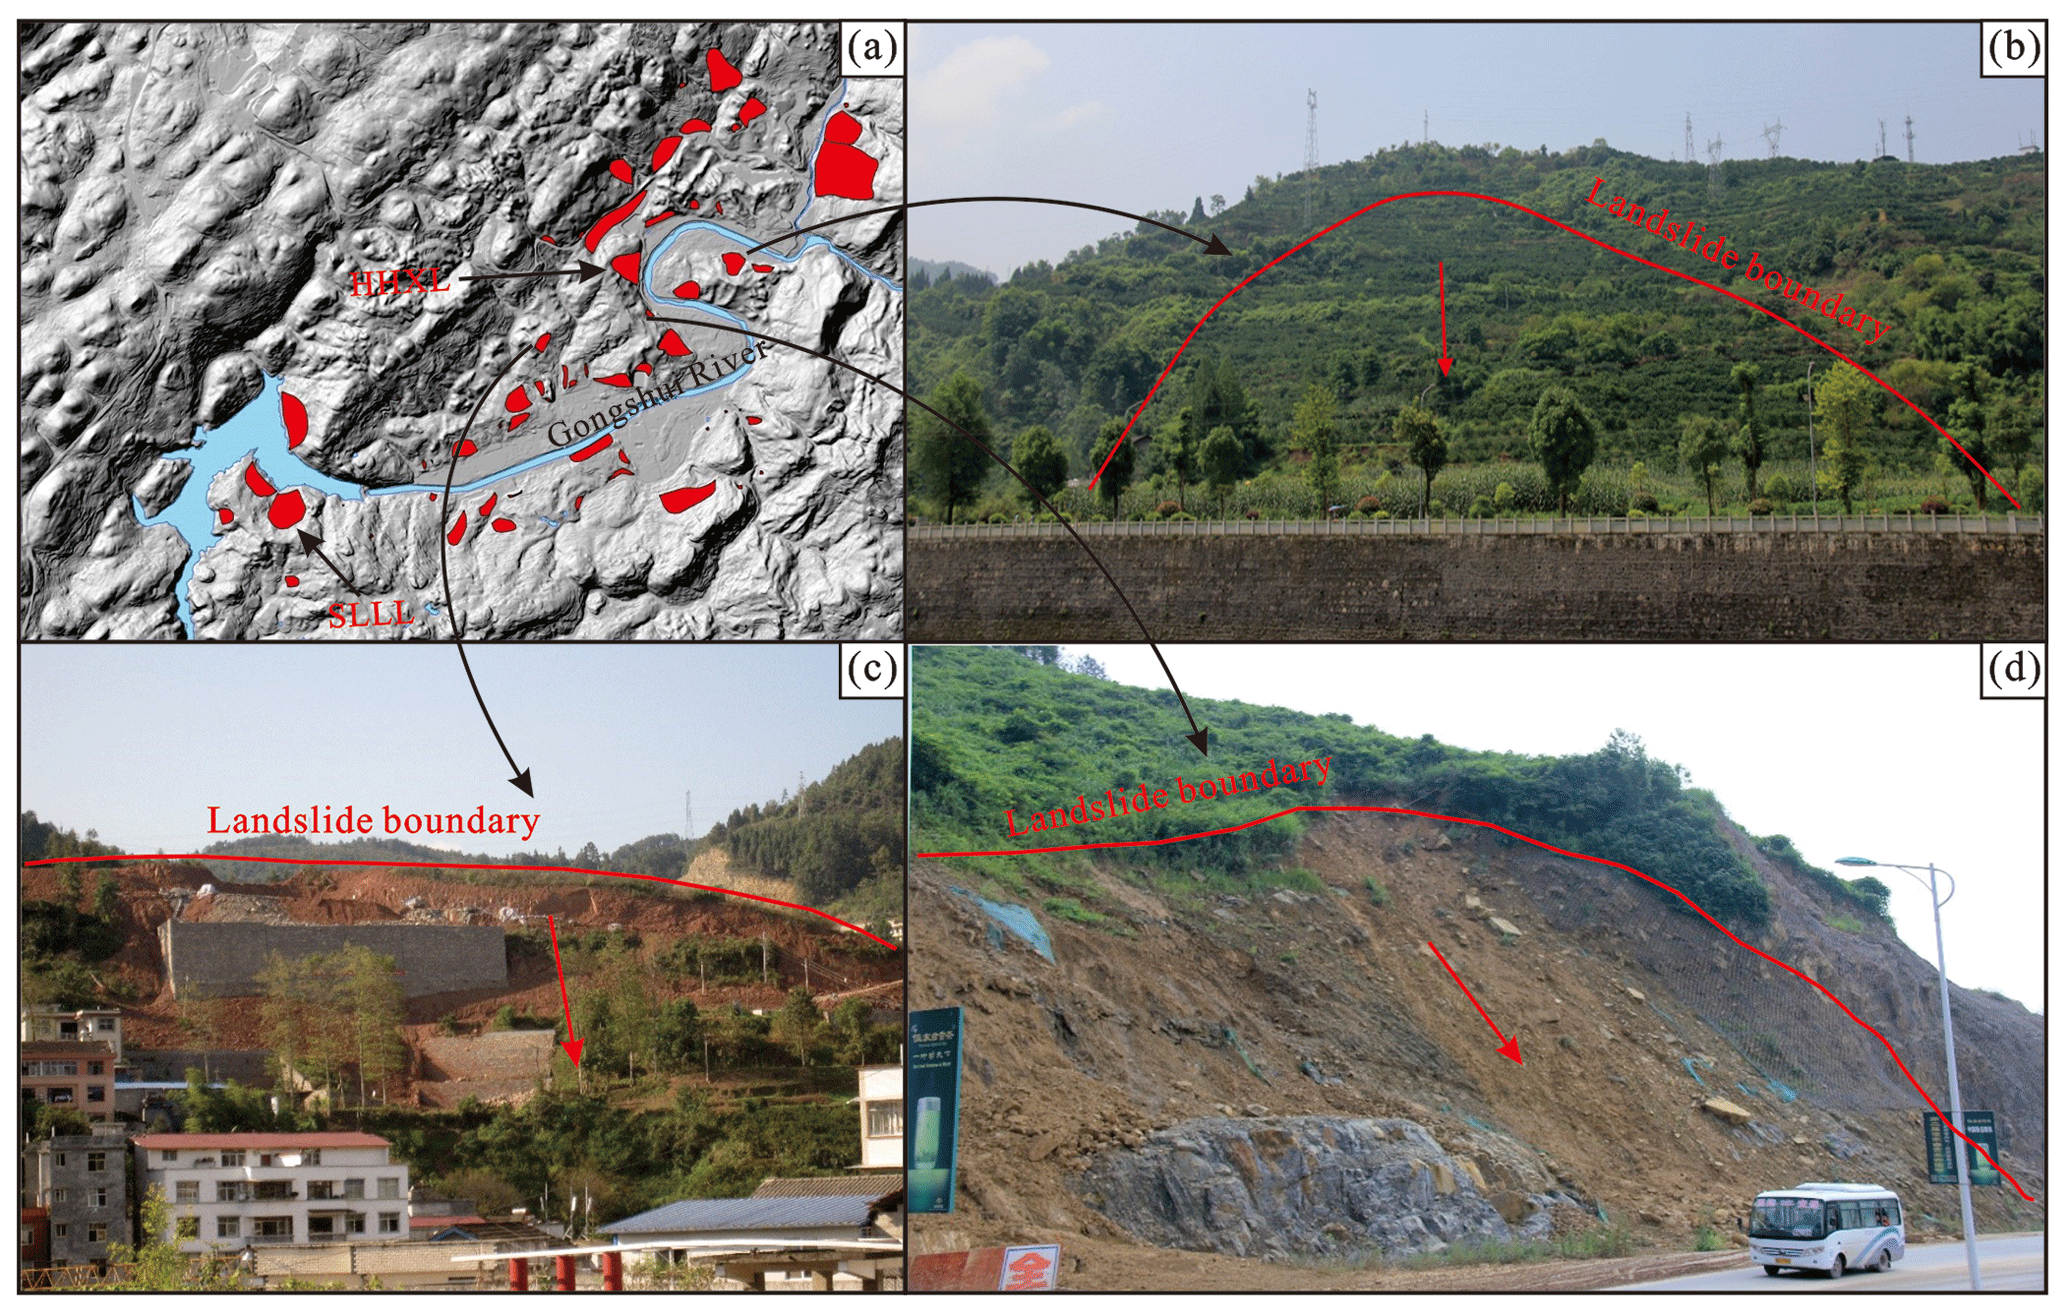
Figure 6The spatial locations of the landslides and the photos of different types of landslides in the study area. (a) The spatial locations of the landslides. (b) The photo of the rock slide. (c) The photo of the composite soil slide–debris flows. (d) The photo of the shallow earth slide.
4.2 Landslide inventory
The landslide inventory of the area (Fig. 6) revealed 53 landslides, among which 1 occurred in the period 1992–2002 and 10 occurred from 2002 to 2013. The total area occupied by these landslides is 201.6×10⁴ m2, with a volume of approximately 1000×104 m3. The depths of landslides range from 1 to 15 m, among which more than 30 landslides have a depth of less than 5 m and only 5 landslides have a depth of larger than 10 m. Hence, shallow landslides are the most important in the area. According to the type of movement, material and estimated depth, most of the landslides are shallow earth slides, as well as composite soil slides and debris flow (Cruden and Varnes, 1996). The deformation of many landslides is characterized by cracks (Fig. 7), including tensional ground cracks and bulging cracking. In the urban area, the front undercutting of slopes caused the small-scale sliding on the toe of landslides. For example, the Huanghexiang landslide (HHXL, Fig. 6a), located 500 m northwest of the Qingshui River, is a shallow earth slide, which occurred on the slide-prone strata of the Badong formation (Deng et al., 2017). Under the combined effects of strata and slope cutting, the landslide was partially reactivated, causing cracks and becoming a severe threat to residents.

Figure 7The deformation of the landslides in the study area. (a) The topography of the landslide (see Fig. 6a for location). (b) The cracks on the road. (c) The uplift of the ground. (d) The topography of the landslide (see Fig. 6a for location). (e) The tension cranks on the ground. (f) The cracks on the building.
4.3 Landslide susceptibility zonation
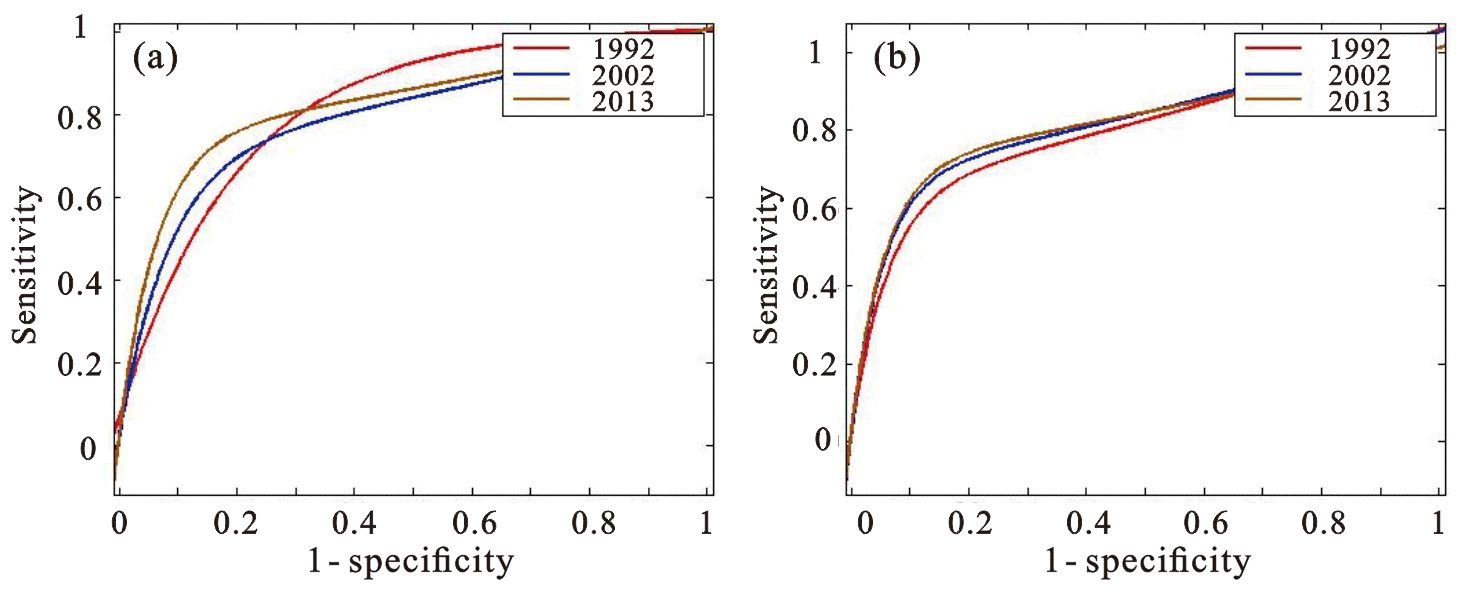
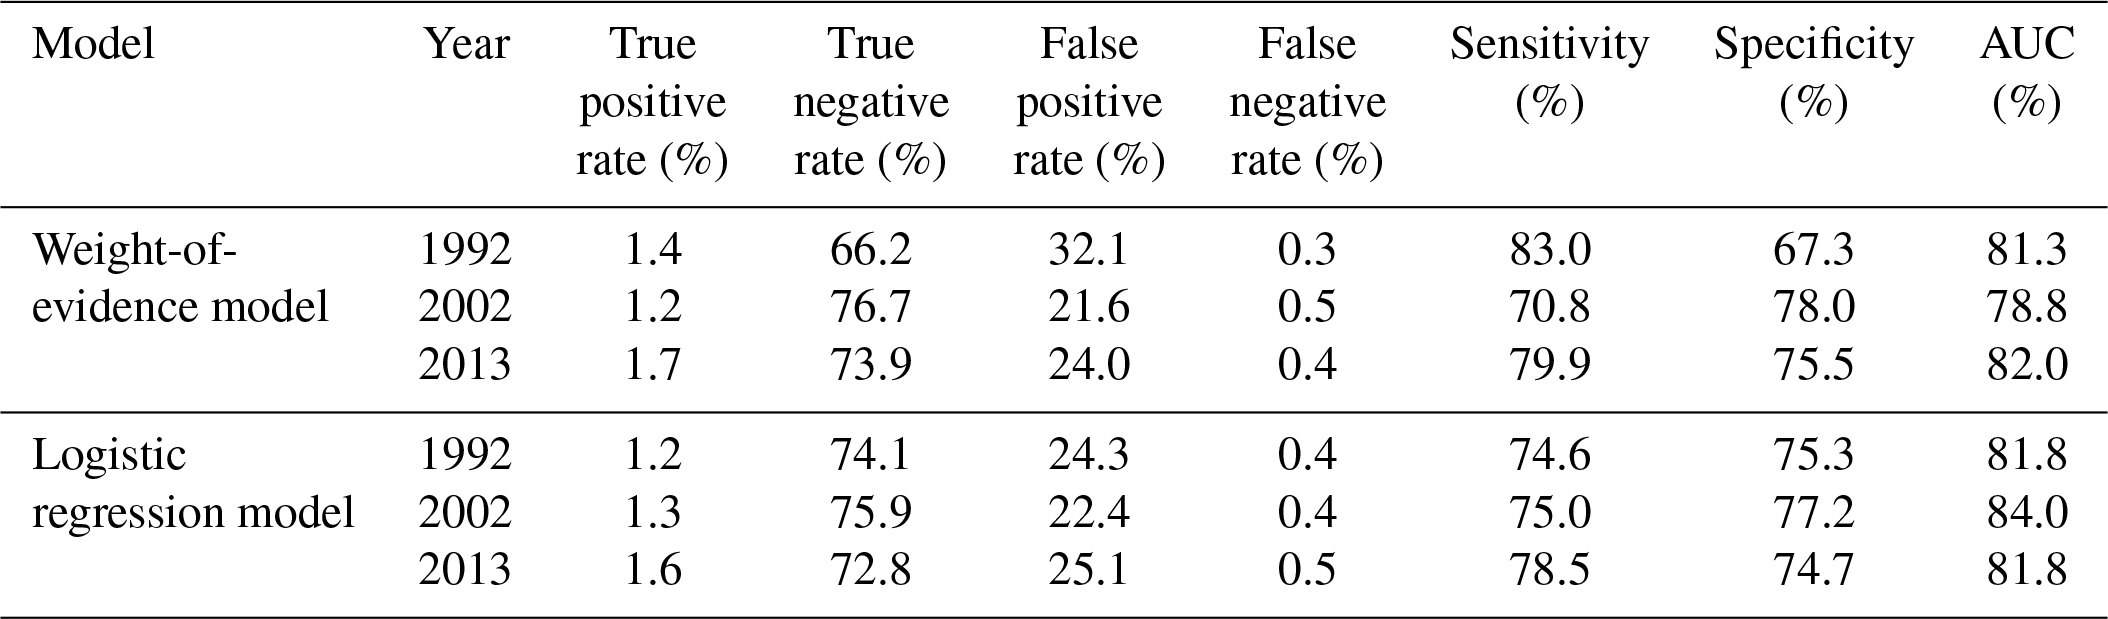
Results of the landslide susceptibility assessment are shown in Fig. 8. The maps obtained by the logistic regression model are shown in Fig. 8a, c and e, and the results of the weight-of-evidence model (WEM; Regmi et al., 2014; Razavizadeh et al., 2017) utilized as the comparative model are shown in Fig. 8b, d and f. The ROC curves were applied to show the accuracies of different models quantitatively, by plotting the cumulative percentage of observed landslide occurrence against the cumulative percentage from very high to low susceptibility with decreasing LSI values. As shown in Fig. 9 and Table 3, in all six cases, the AUC values are larger than 80 % (except for the result of 2002), showing high accuracies of the landslide susceptibility assessment. By comparing the results of different models in the same year, the logistic regression model is better than the weight-of-evidence model in our study. In particular, the change in the ROC curves, sensitivity and specificity values of the weight-of-evidence model in different periods is significant – e.g., the sensitivity values are 83.0 %, 70.8 % and 79.9 % for the years 1992, 2002 and 2013 respectively, while for the logistic regression model the sensitivity values are 74.6 %, 75.0 % and 78.4 % – which indicates that the performance of the logistic regression model is more stable than that of the weight-of-evidence model.
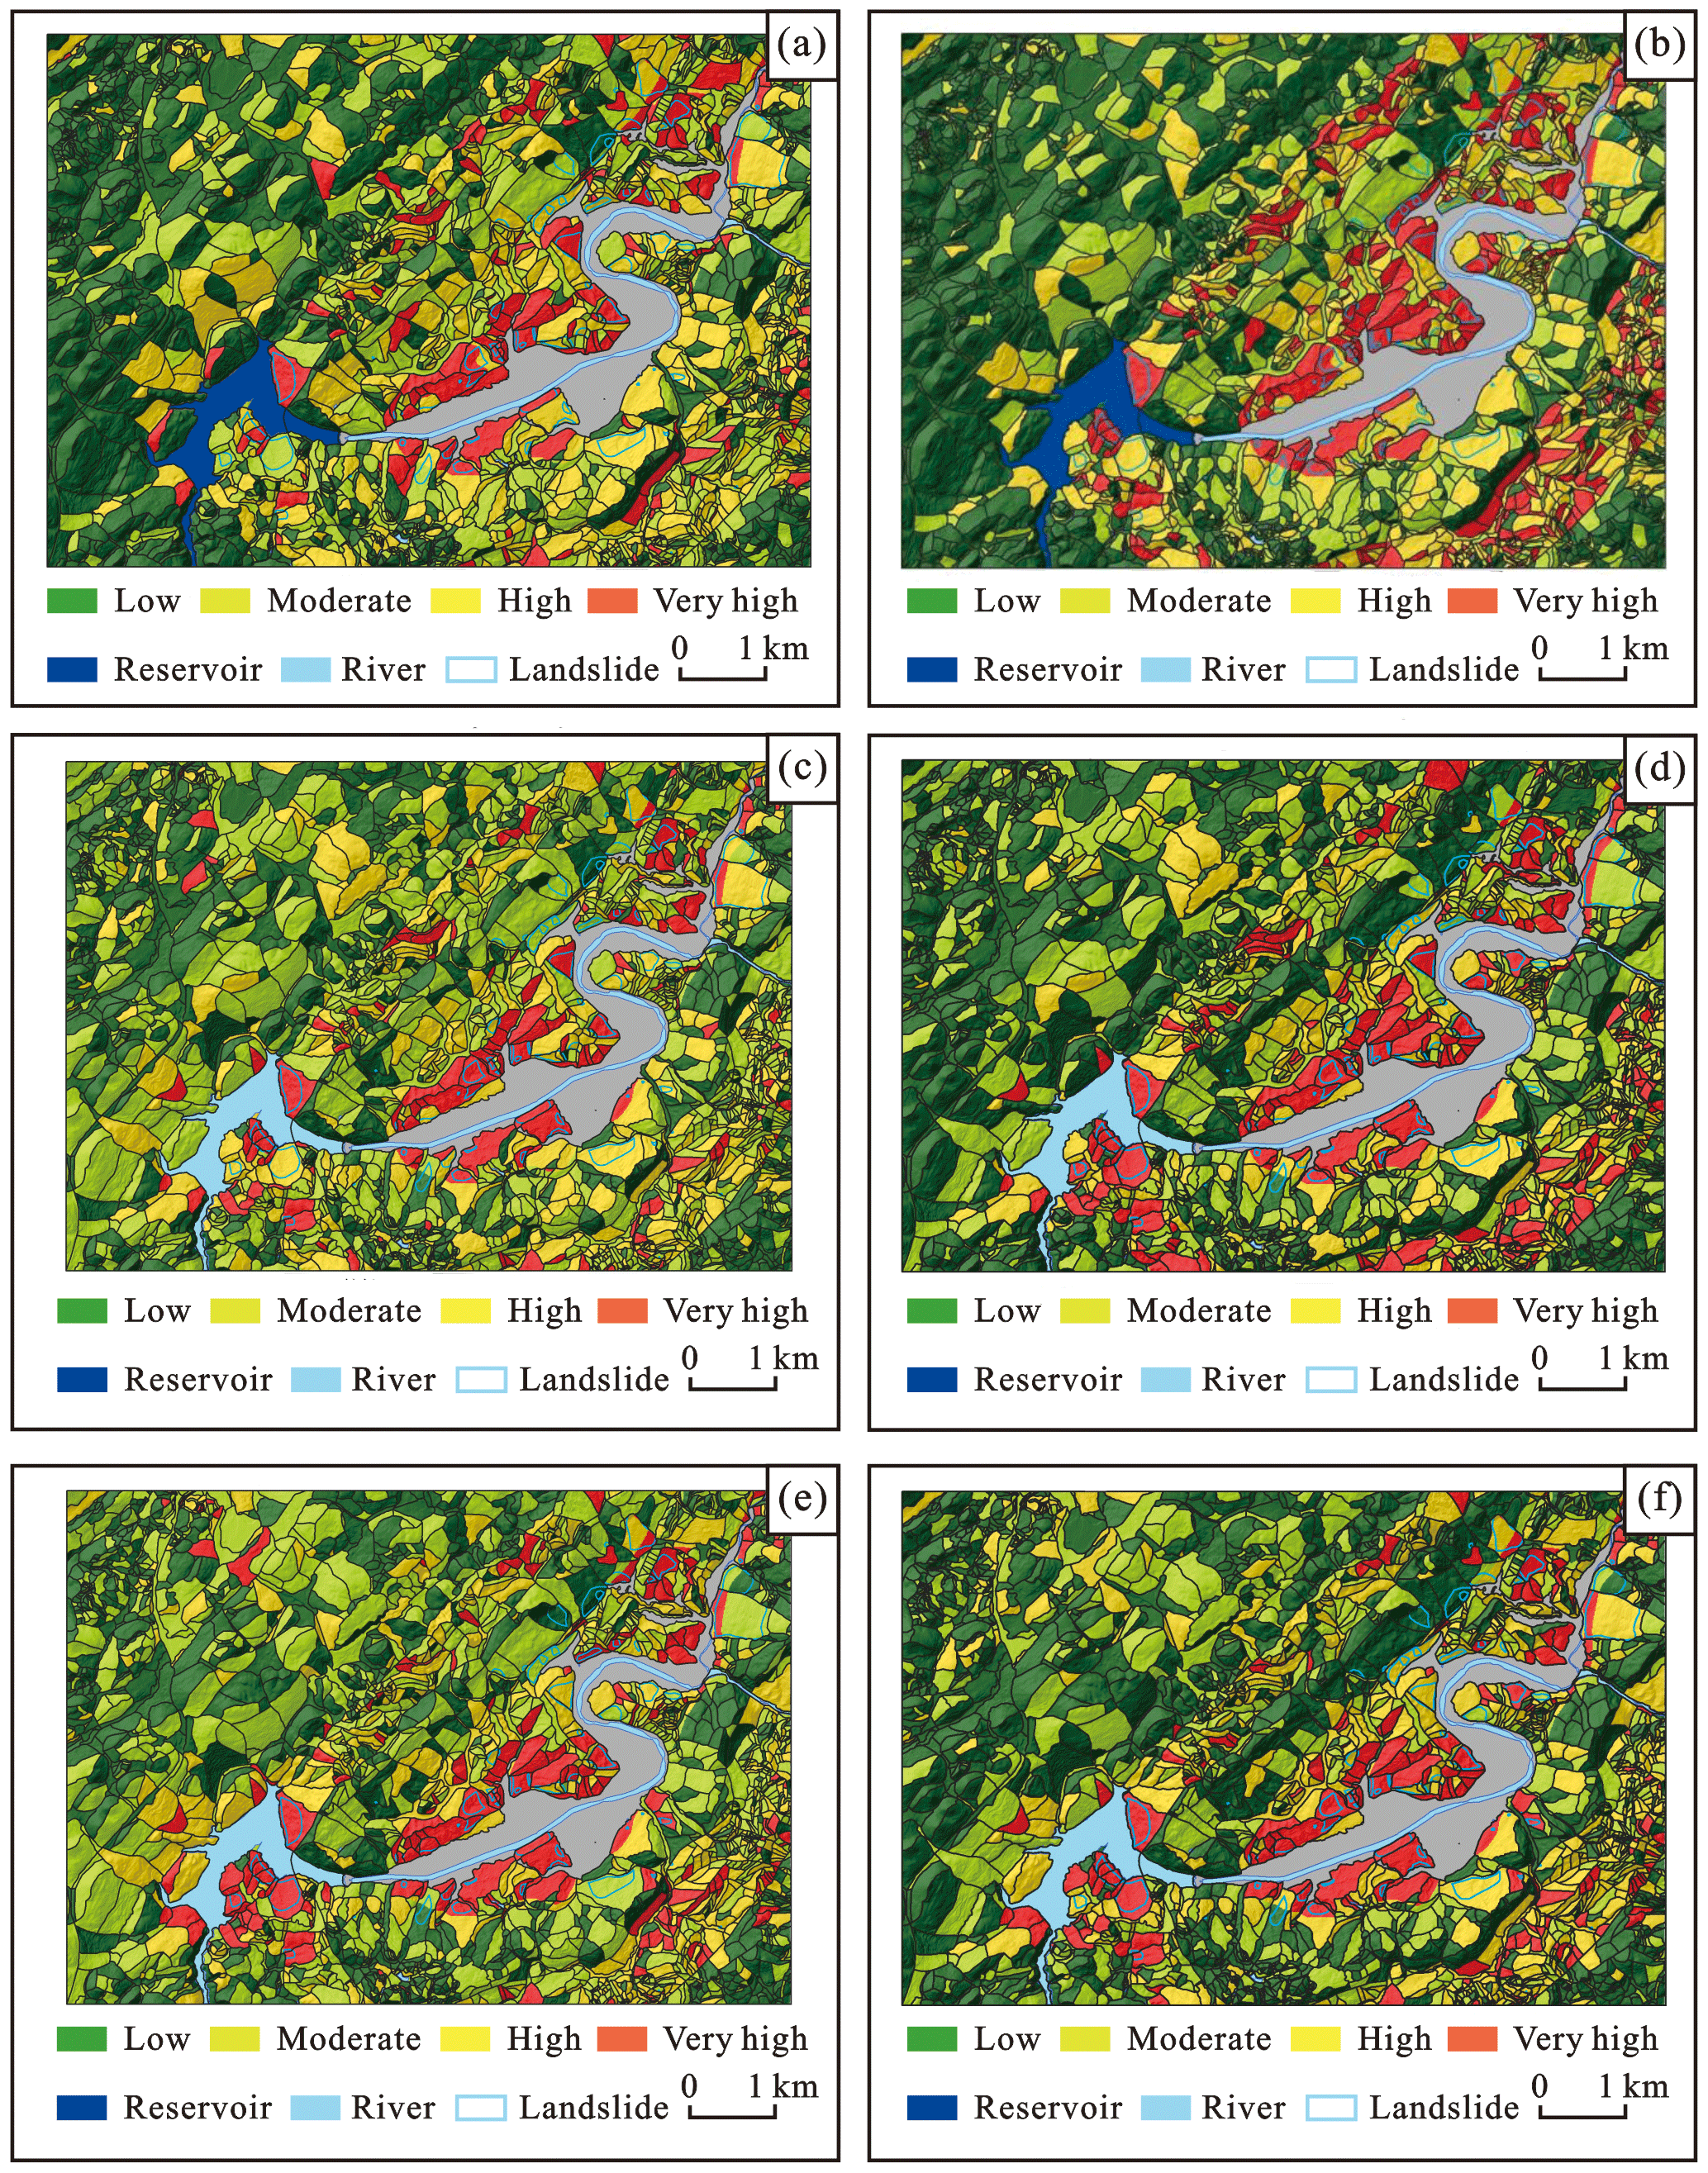
Figure 8The results of landslide susceptibility zonation: (a) LRM for 1992; (b) WEM for 1992; (c) LRM for 2002; (d) WEM for 2002; (e) LRM for 2013; (f) WEM for 2013.
4.4 Evolution of LUC and landslide susceptibility
Maps of the LUC and landslide susceptibility in different periods were placed together to compare and clarify the temporal evolution of LUC and LS during the 21 years. It should be noted that the logistic regression model shows a better performance for landslide susceptibility assessment in this study, so the subsequent analysis was carried out in the framework of this model.
As seen in Fig. 10, during the period 1992–2002, the main trend of LUCC is the arable land becoming forest land and the barren land becoming arable land and forest land; in particular, the area of barren land decreased, from 19.8 % in 1992 to 0.2 % in 2002. In contrast, forest land increased by 33.6 %. Except for the reasons stated in Sect. 5.1, data quality should also be considered: the low-resolution images of Landsat 4–5 TM result in poor classification between barren land and grassland covered by sparse vegetation. On the contrary, the land with human engineering activities did not change noticeably in terms of surface area and the number of units. This is mainly because the urbanization process during this period had concentrated mainly on the plain areas on the banks of the river, which always belonged to one slope unit class (flat terrain). Compared to 1992, the landslide susceptibility in 2002 did change – 632 units increased their susceptibility while 595 units decreased, accounting for 22.0 % and 20.7 %, respectively (Fig. 11). Further, if the magnitude of the landslide susceptibility changes are subdivided into five classes – visible increase (LS has increased by at least two levels, e.g., from low to high), increase, constant, decrease and obvious decrease (LS has decreased by at least two levels) – it is clear that the number of the units of obvious increase is also larger than that of obvious decrease, similar to the overall change in landslide susceptibility. Such characteristics of LS change indicate that the LUCC from 1992 to 2002 made Zhushan Town a more landslide-prone area. The LUCC with obvious increase condition can be grouped into three cases: (i) constant, (ii) areas with human engineering activities, and (iii) grassland and arable land. The corresponding number of units are 24, 36 and 40, respectively. Two important LUC types for increasing LS in this period would be the increase in human engineering activities and the transformation from forest land to grassland and arable land. Moreover, it should be mentioned that among these units with an obvious increase in LS, no unit transfers from the human engineering activities to other types. This indicates that the impact of human engineering activities on the LS is essential.
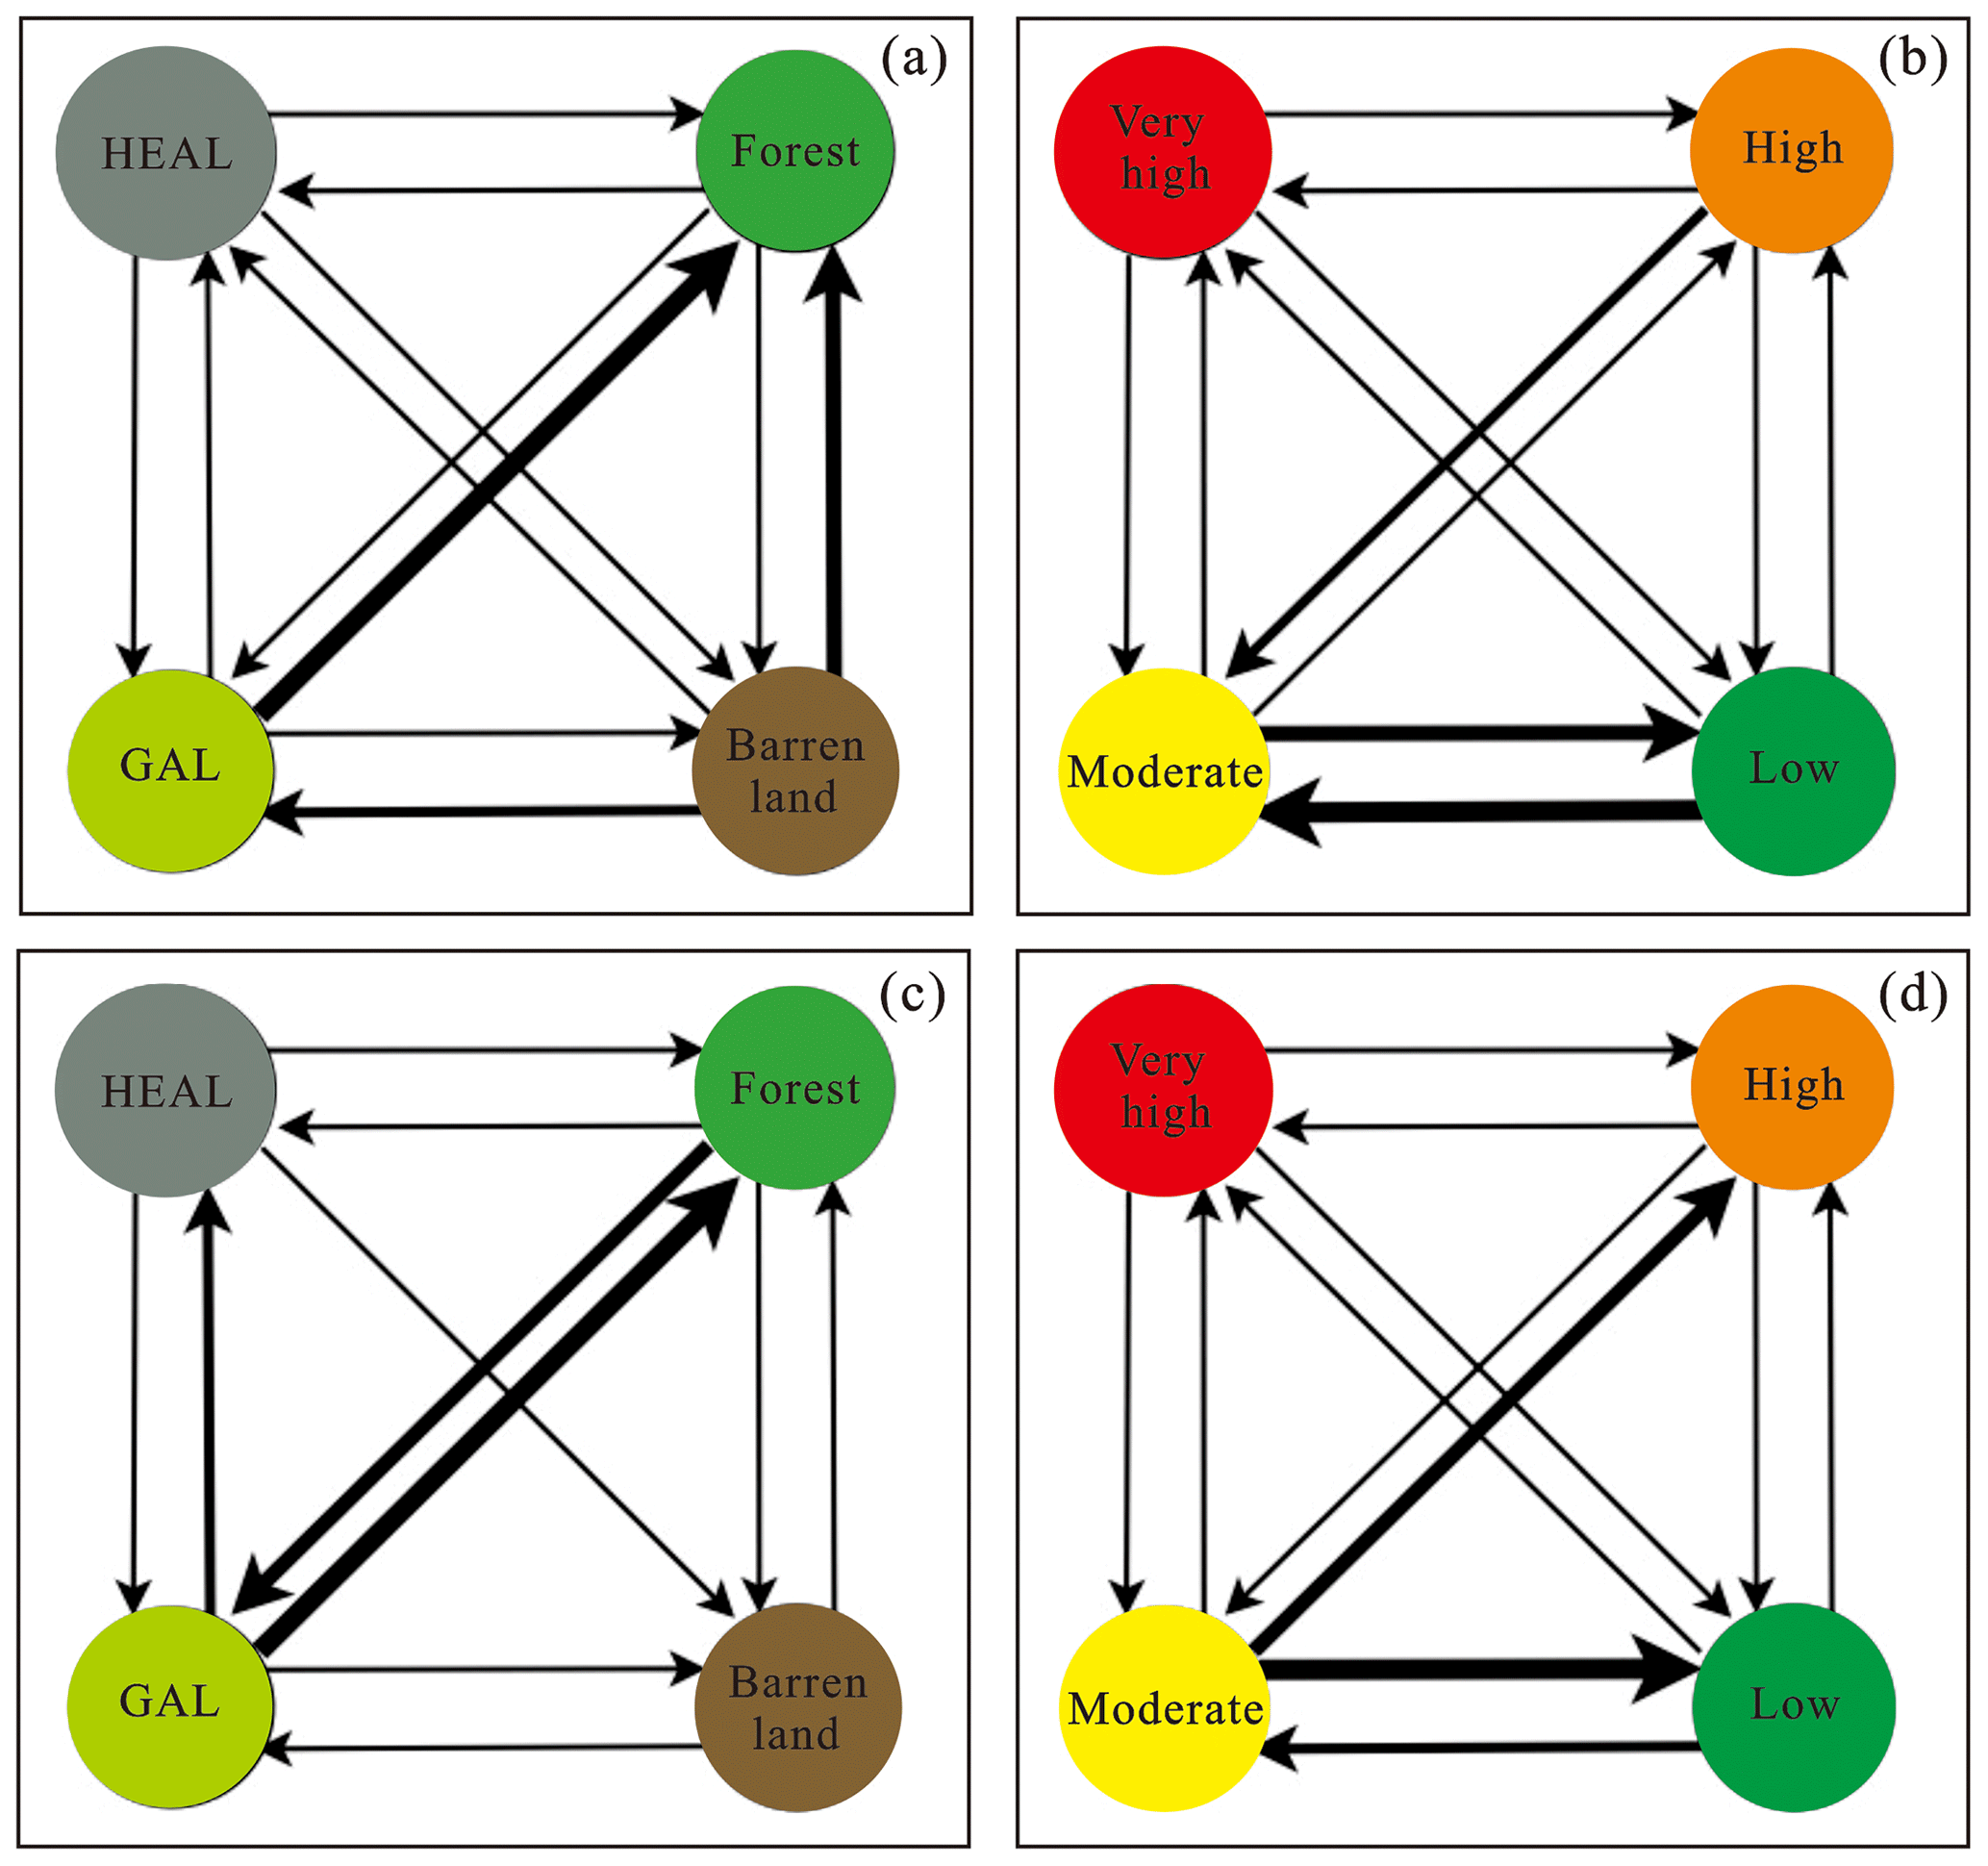
Figure 10(a) The transformation of LUC from 1992 to 2002; (b) the transformation of LS from 1992 to 2002; (c) the transformation of LUC from 2002 to 2013; (d) the transformation of LS from 2002 to 2013.
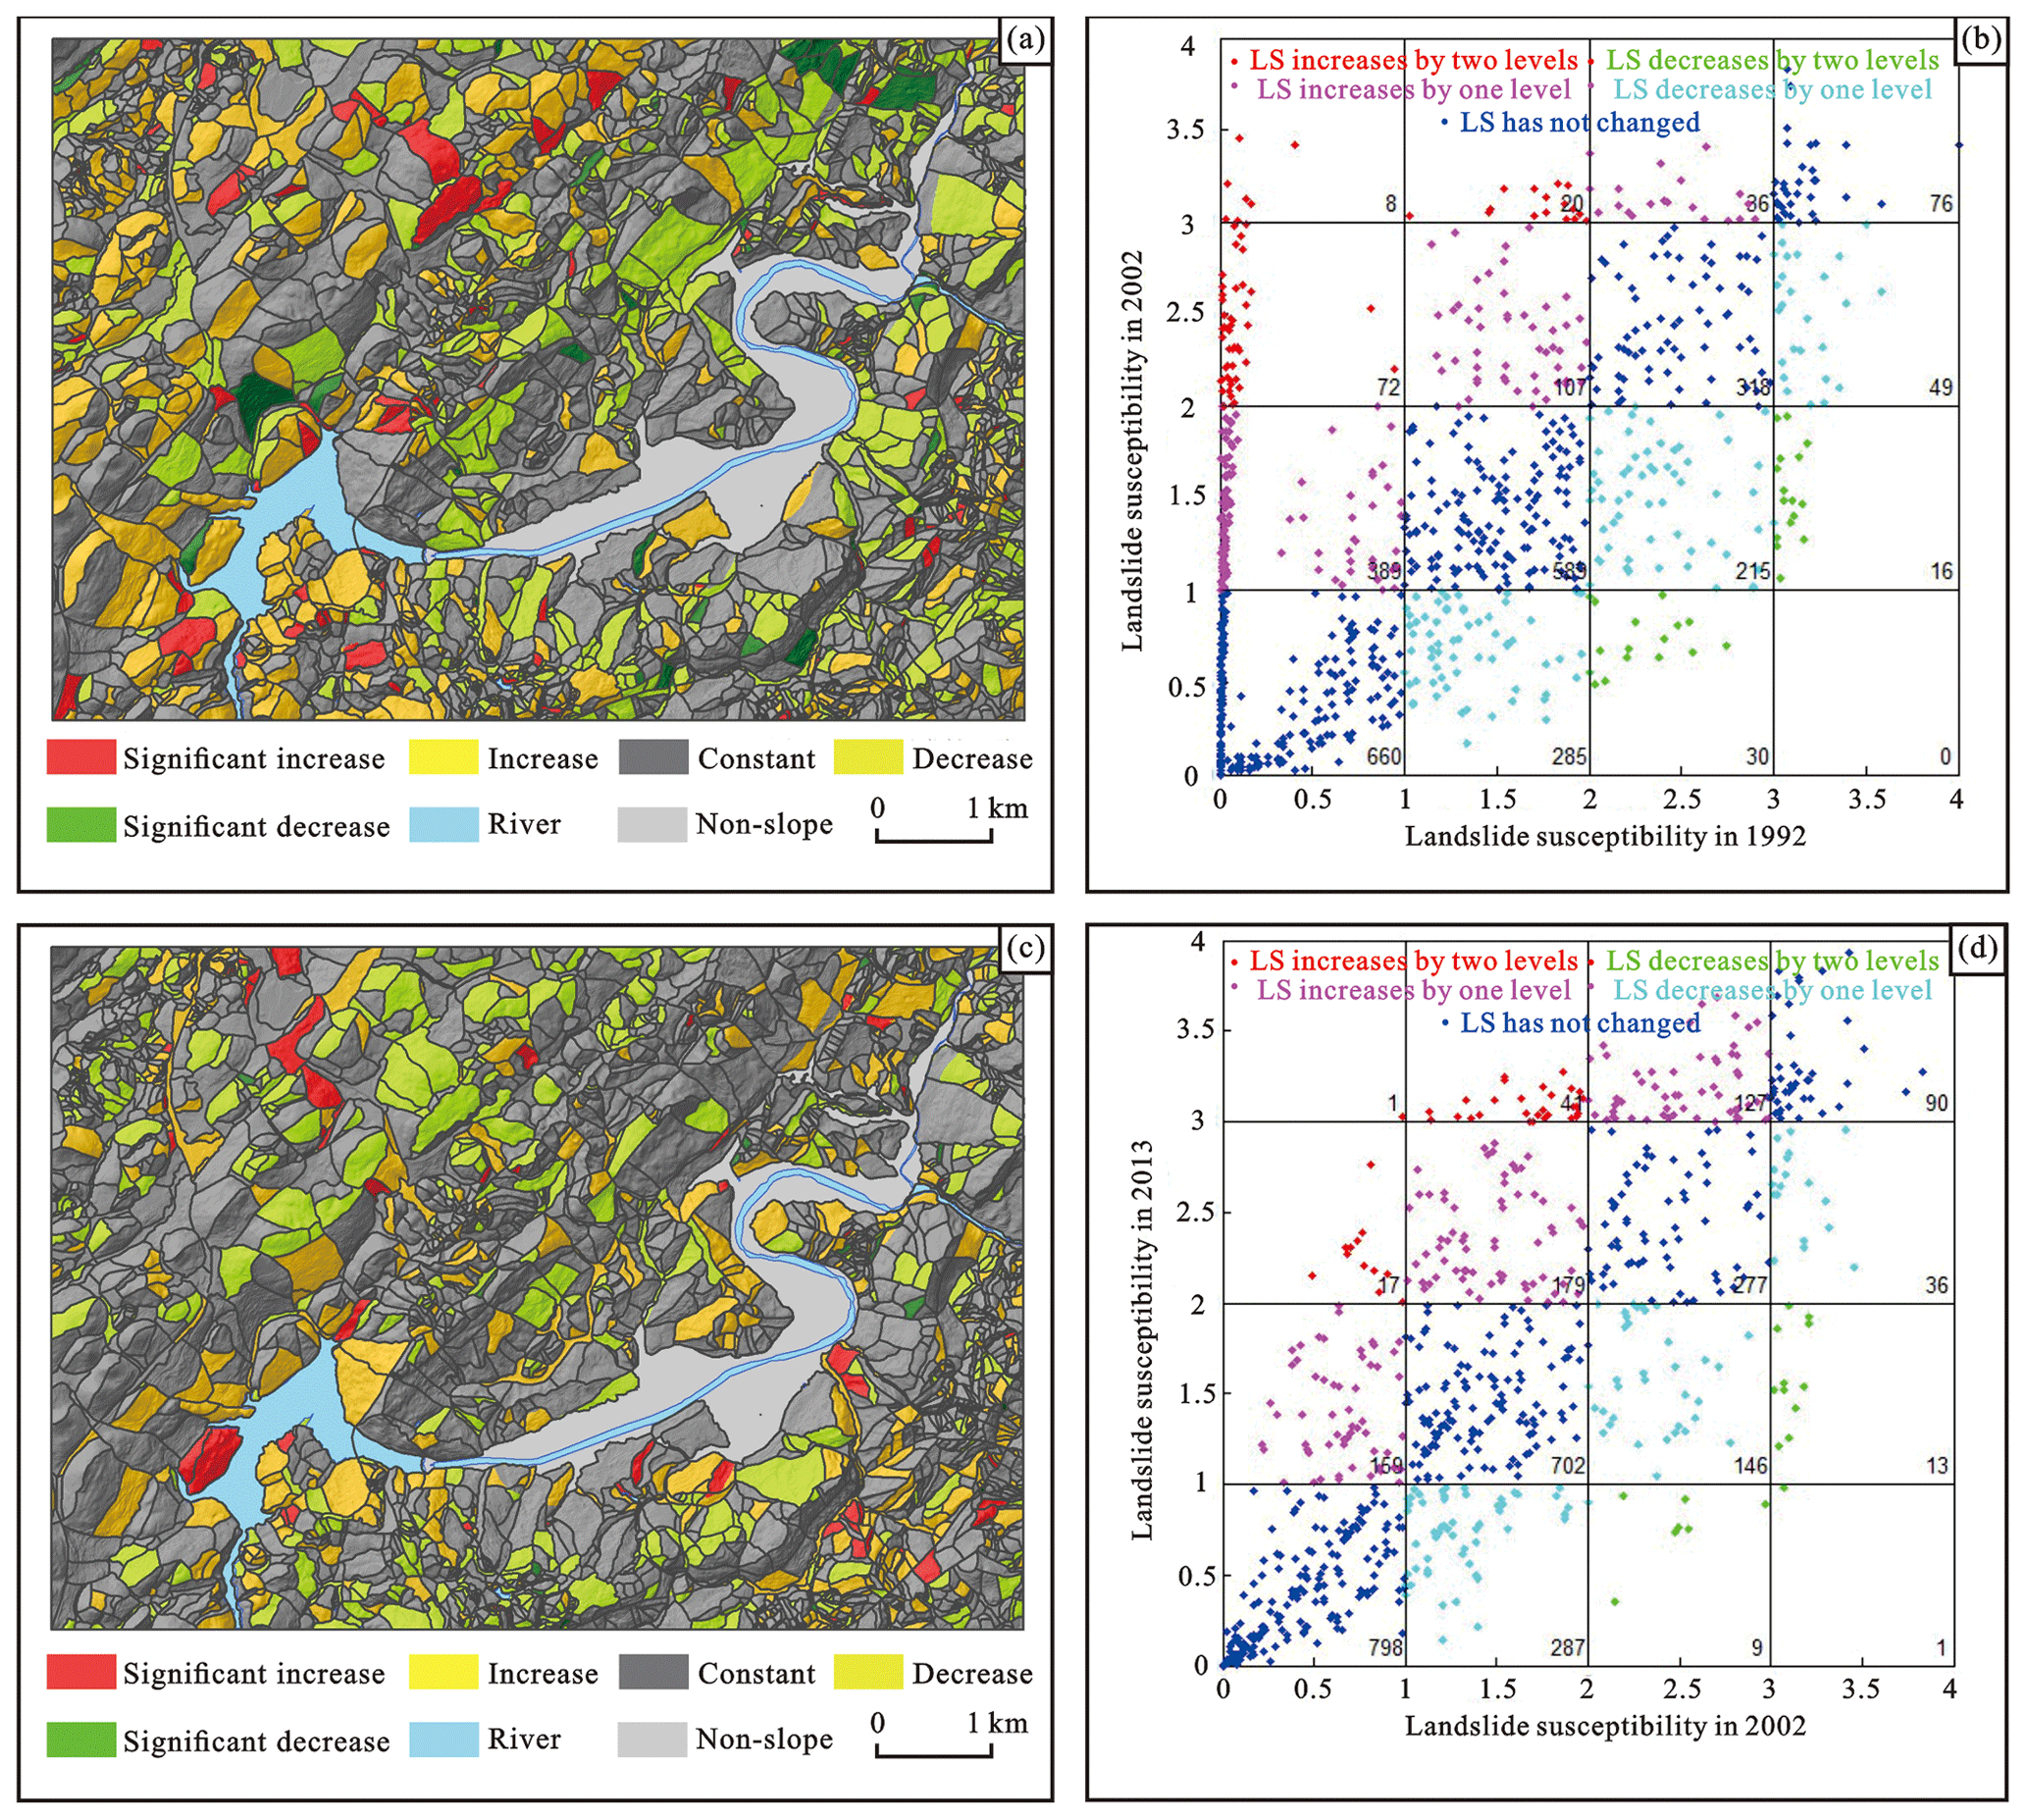
Figure 11(a) The change in the landslide susceptibility of each slope unit between 1992 and 2002; (b) the scatter plot showing the change in the landslide susceptibility between 1992 and 2002; (c) the change in the landslide susceptibility of each slope unit between 2002 and 2013; (d) the scatter plot showing the change in the landslide susceptibility between 2002 and 2013.
During the period from 2002 to 2013, the trend of LUCC may be concluded as two aspects (Fig. 10): the first is the slight increase in human engineering activities, mainly from the transformation of grassland and arable land. Different from the previous period, human engineering activities during this period were no longer confined to the plain areas but also to the other areas, e.g., the northwestern and southeast part of the county, which was mainly covered by forest land, or grassland or arable land before. The second is the increase in forest land. Interestingly, the mutual transformation between the category (ii) (forest land) and the category (iii) (grassland and arable land) can also be seen in the northeast of the region. This indicates that reasonable land use planning gradually developed in this region. In other words, the residents were not interested in the increase in forest land anymore but more in the location where reforestation should take place. This shows the increase in people's awareness of environmental protection. As a result, the increase in forest area can be seen around the town in 2013, unlike in 2002 when the area covered by arable land was larger. Such land use planning can effectively protect the town from harsh-environment problems (e.g., sandstorm, flood). As a result, the landslide susceptibility of 441 units increased (15.4 %) and that of 506 units decreased (17.6 %) in 2013. Compared with 2002, these numbers are smaller, indicating that the influence of the LUCC during this period was lower than that during 1992–2002. The units of obvious increase and obvious decrease for landslide susceptibility in 2013 were 59 and 23, respectively, also smaller than that in 2002. The LS of most units was constant during this period. This is mainly because of the increase in human engineering activities being smaller and because of the limited impact of forest land, grassland and arable land on the slope stability. Despite this, the change in landslide susceptibility influenced by human engineering activity land still existed. During that period, a total of 195 units were transformed from other types of LUCC to human engineering activity land, of which the landslide susceptibility of 161 units increased. Among the total 59 units with an obvious increase in LS, the LUCs of 46 units were transformed into human engineering activity land, accounting for 78.0 % of the total units. Therefore, the transformation to this type of LUCC played an important role in the increase in the landslide susceptibility in the region.
4.5 Typical landslide events influenced by LUCC
During the period of 2002–2013, nine landslide events occurred in the study area, among which two were located on the bank of the river, mainly triggered by the fluctuating reservoir water level. The remaining landslides were taken as examples to study the impact of the engineering activities. A 25 m buffer of each landslide was established, and the change in the engineering activities in the buffer zone was counted. The area of the engineering activities around all landslides has expanded since 2002. On average, the area of engineering activities around the landslides has increased by about 20 %, and the change mainly closed to the toe of the landslides resulting from undercutting of slopes for buildings.
4.5.1 The Qili Bridge landslide
The Qili Bridge landslide (QLQL) is located at Qili Bridge Village of Zhushan County, on the right slope of the No. 209 national highway (Fig. 12). The elevation of landslide ranges from 520 m to 762 m a.s.l., and it has a gulley with a strike direction of 340∘ along the front of the slope. The landslide occurred on the lower part of the slope, covering an area of 9000 m2 with a volume of 0.27×10⁴ m3. The landslide materials are mainly composed of cataclastic marl rock of Triassic and Quaternary deposits including silty clay and rubble soil.
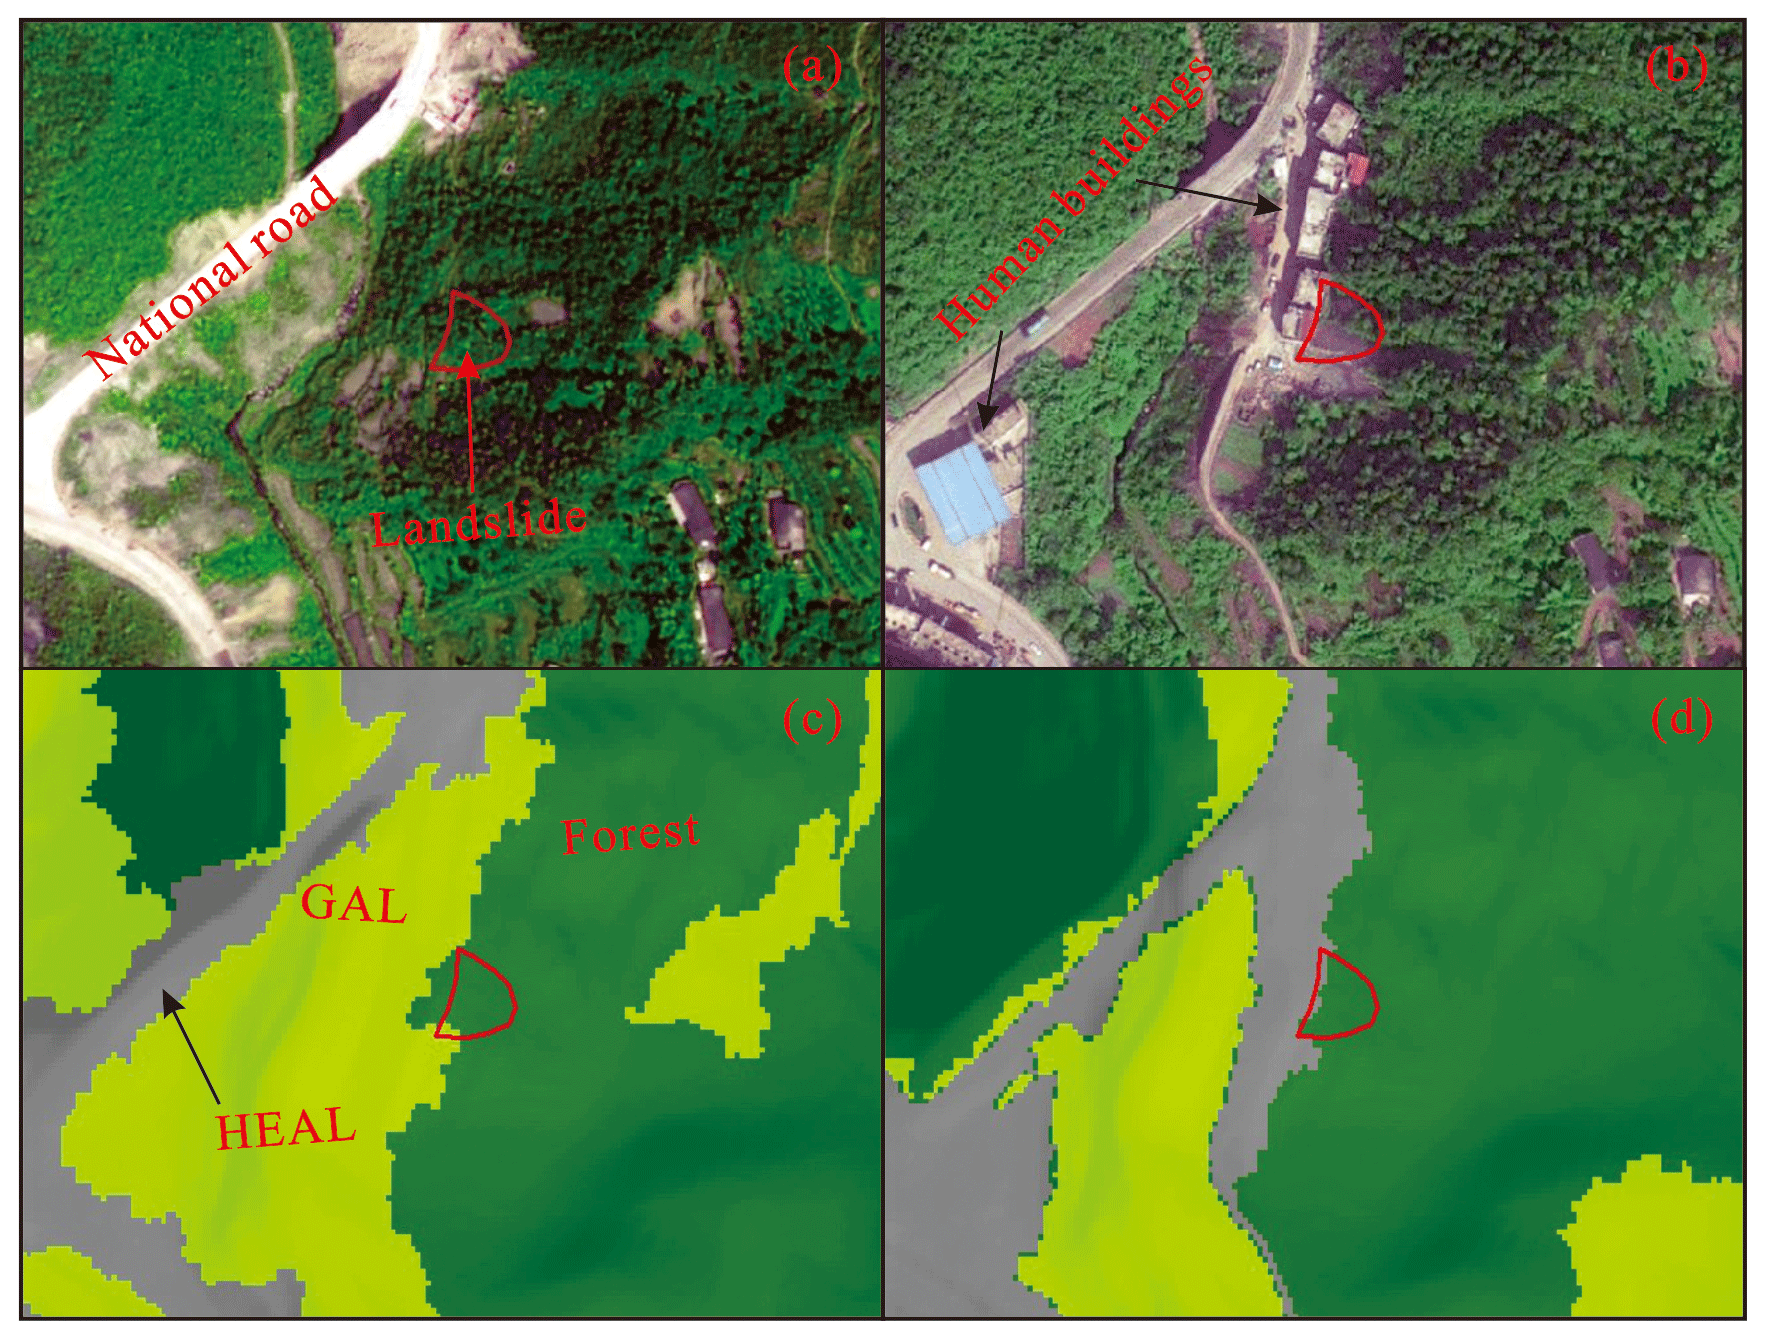
Figure 12The LUCC around the landslide. (a) The RS image of the landslide in 2002 (obtained from SuperView-1 RS data); (b) the RS image of the landslide in 2013 (obtained from DJI drone); (c) the LUC type of landslide in 2002; (d) the LUC type of landslide in 2013.
In 2007, at the lower part of the slope, where the elevation was approximately 520 m, a platform began to be constructed, and then six brick-and-concrete buildings with three to four stories were built on the platform without any protective measures. The slope was a consequent bedding rock slope steeper than a 30∘ dip angle. The 3 m high cut slope was artificially excavated, which worsened the stability of the slope. Rainfall infiltrated rapidly into the sliding body along many fissures, which softened the strength of the materials. In July 2011, a continuous heavy rain initiated the landslide. The back walls of the buildings were destroyed by the rock mass, causing some injuries to people and severe economic losses. As shown in Fig. 12, the natural slope was mainly covered by the forest land, grassland and arable land before the construction of the buildings. However, the subsequent engineering activities disrupted the original geological conditions, causing the instability of the slope. During the field visit, some sliding materials still remaining on the slope were noticed, being a big potential danger for the residents.
4.5.2 The Liangshuigou landslide
The Liangshuigou landslide (LSGL) is located at Lianhuaba Village, on the left bank of the Gongshui River (Fig. 13). The natural slope had a dip angle ranging from 25 to 35∘. The landslide initiated at the lower part of the slope, with an area of 6300 m2 and a volume of 0.1×10⁴ m3. The landslide materials are mainly composed of Quaternary deposits, including silty clay and rubble soil. The bedrock was argillaceous siltstone of the Badong formation in Triassic deposits. Joints and fissures cut the rock mass which formed the flow way for rainfall infiltration.
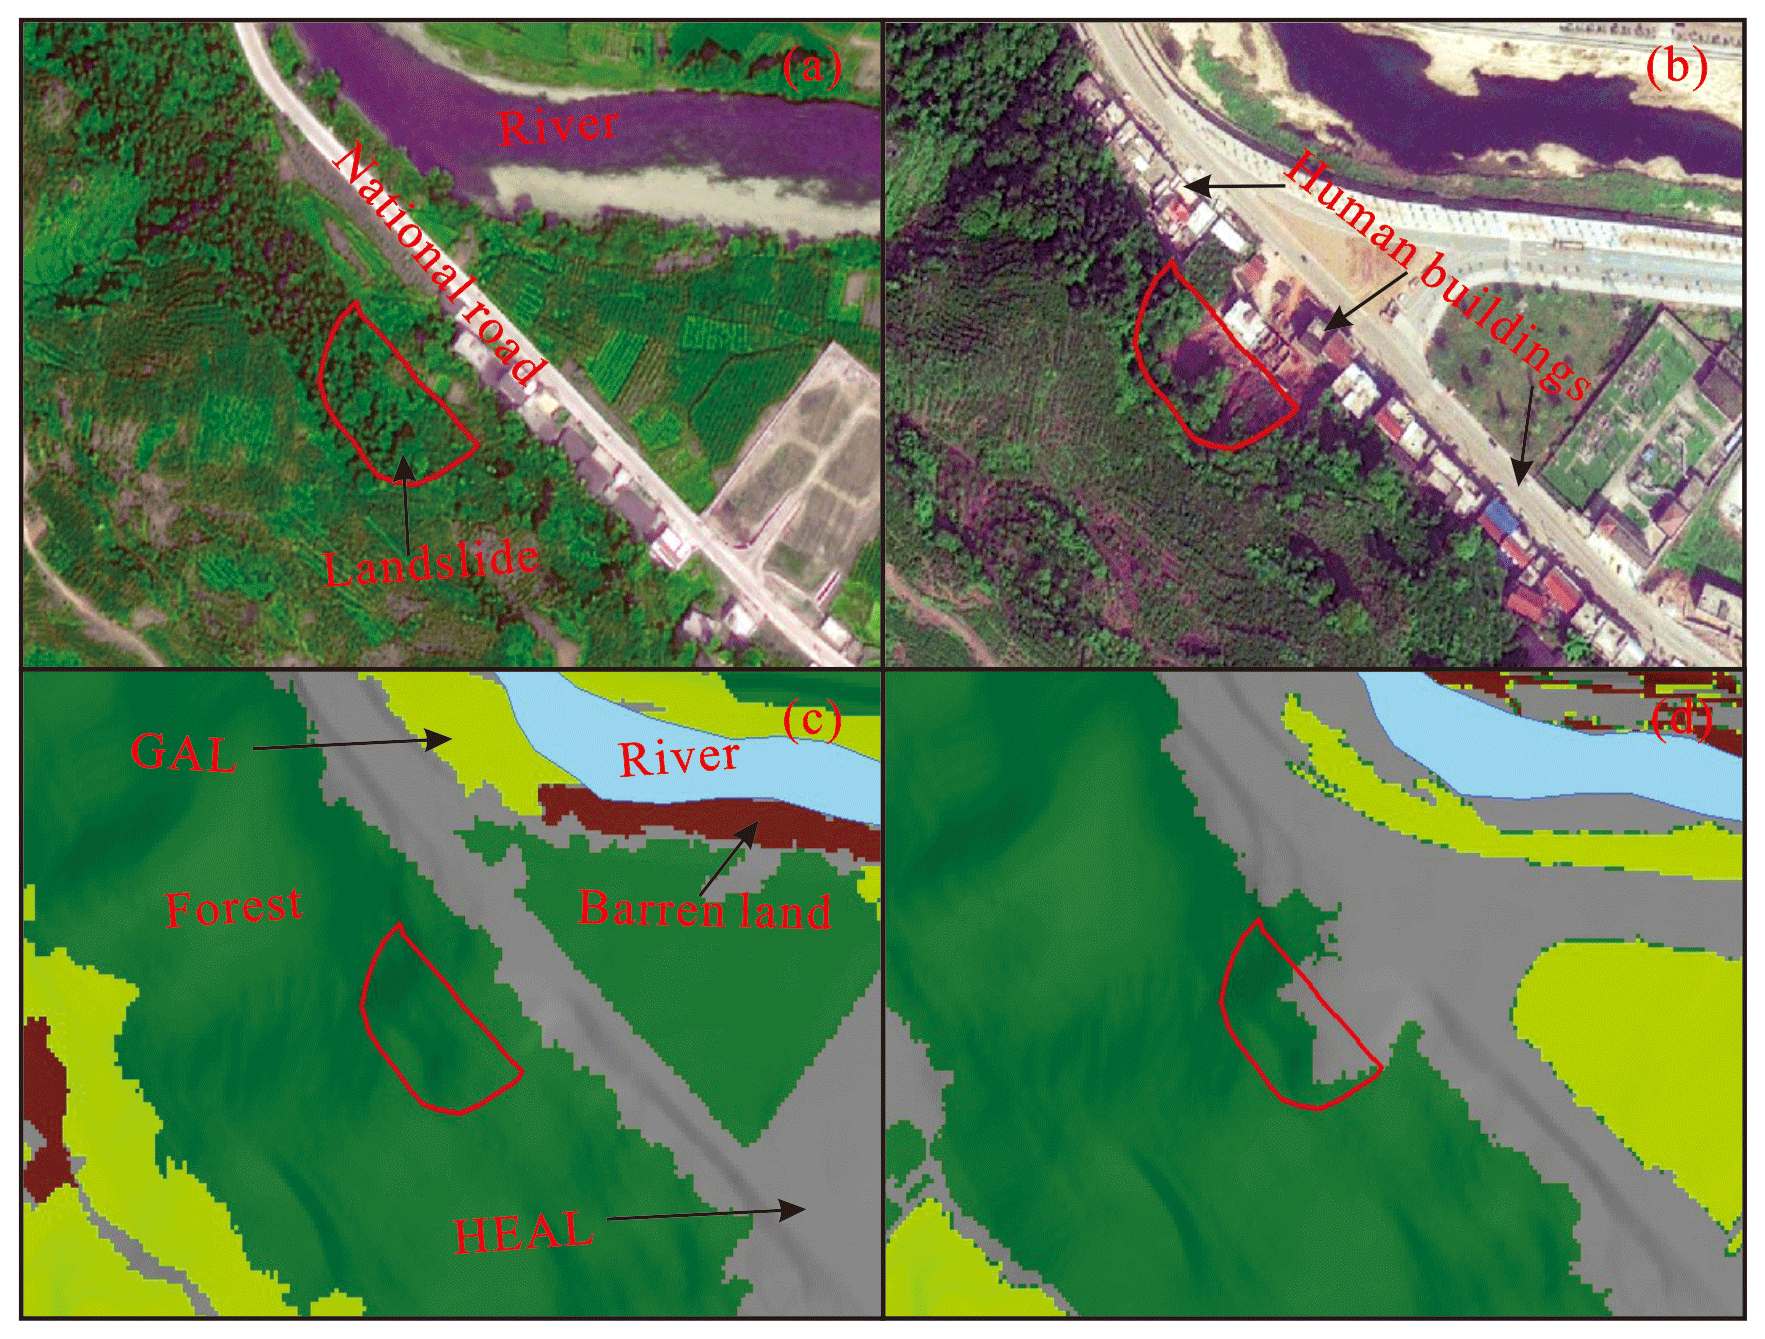
Figure 13The LUCC around the landslide. (a) The RS image of the landslide in 2002 (obtained from SuperView-1 RS data); (b) the RS image of the landslide in 2013 (obtained from DJI drone); (c) the LUC type of landslide in 2002; (d) the LUC type of landslide in 2013.
Before 2010, the slope was covered by field crops and citrus trees (arable land). However, the urbanization process led to many human engineering activities, including the construction of the building and the roads. The undercutting of slopes caused a free surface with a height of about 10 m. In June 2012, the landslide was triggered by heavy rainfall.
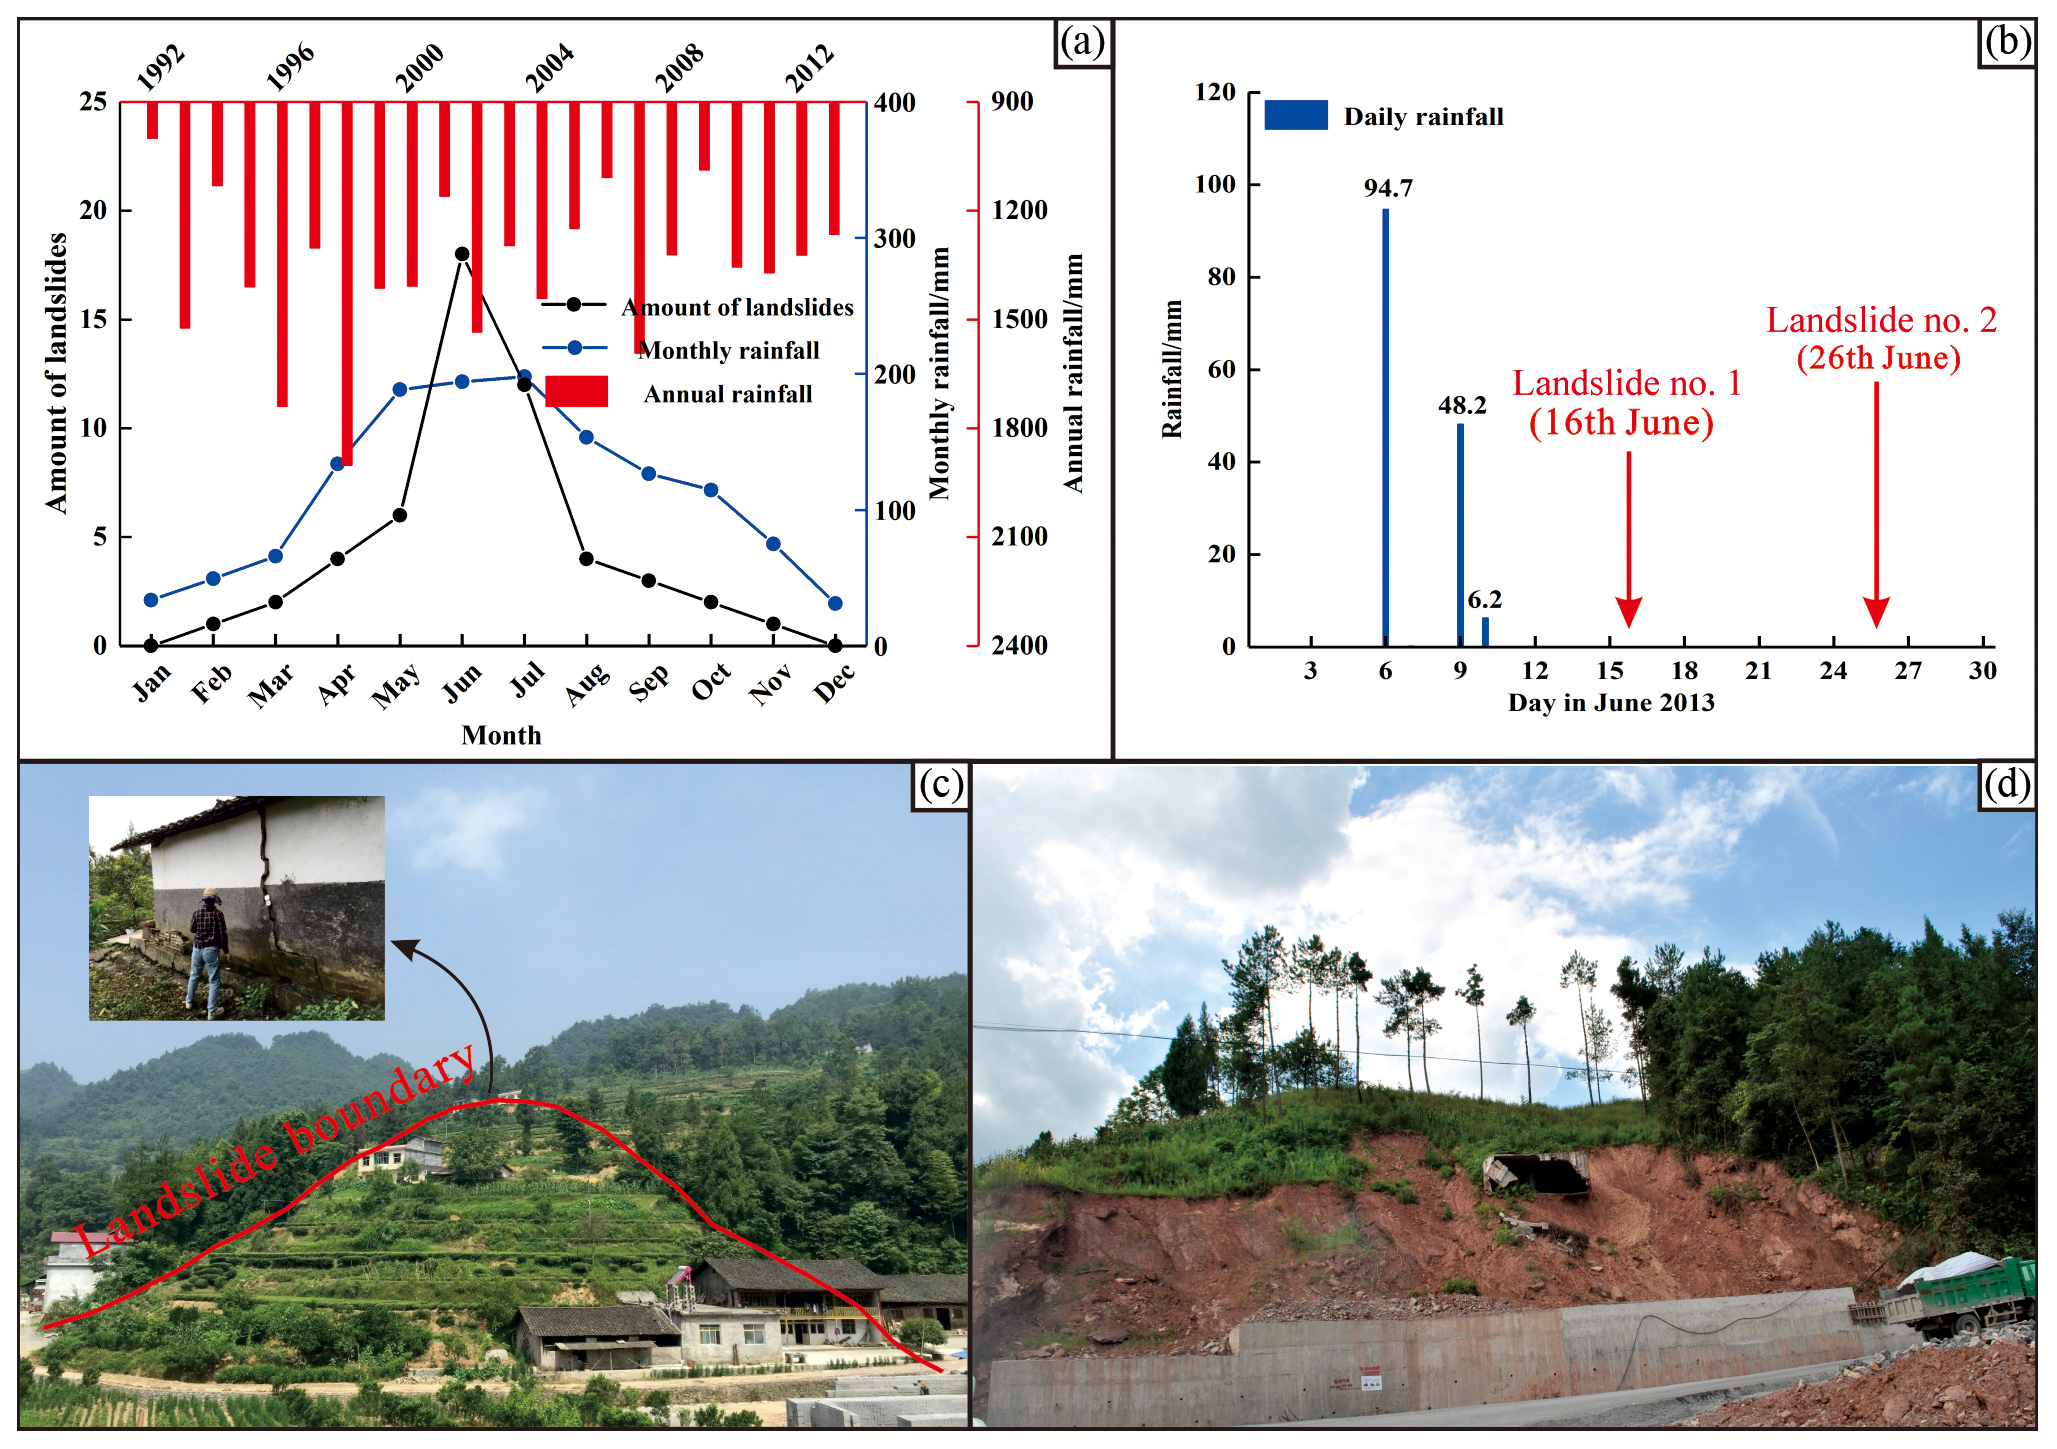
Figure 14The relationship between rainfall and shallow landslides in the area: (a) the curve showing the monthly rainfall and temporal distribution of landslides; (b) daily rainfall in June 2013; (c) the topography of landslide no. 1; (d) the topography of landslide no. 2.
Although the results highlight the significance of LUCC in the susceptibility assessment of shallow landslides, it is obvious that LUCC is not the only factor that can influence the landslide occurrence in the region. In most cases, the impact of LUC on landslides is about the internal geological conditions, such as topography features and drainage conditions. Such impacts can worsen or improve the stability of natural slopes, resulting in the increasing or decreasing frequency of landslide events (Schmaltz et al., 2017; Galve et al., 2015). For instance, Beguería (2006) reported in a case study in the Spanish Pyrenees that the former arable fields on the valley slopes facilitated landsliding, even after the land was abandoned and revegetated by shrubs or trees. This is due to water redistribution in the slopes after prolonged rainfall periods. However, it should be noted that the shallow landslides are directly triggered by the LUC, except for some landslides which are induced by undercutting of slopes. The statistical results of the temporal distribution of landslides in this study area also support this assumption: the positive correlation between the number of landslides and monthly average rainfall (a statistical result of daily rainfall data between 1992 and 2013) is rather strong. The number of landslides occurring during the months of June and July are 18 and 12, respectively, accounting for 56.6 % of the total landslides, whereas only 10 landslides were initiated or reactivated in the dry season, accounting for 18.9 % of the total landslides. Analysis of 21-year data shows that the change in the landslide susceptibility at a regional scale is associated with rainfall conditions. As shown in Fig. 14, annual rainfall seems to be increasing from 1992 to 1998 and then decreasing from 1999 to 2013, although the magnitude of the change is relatively small. Similar patterns are also shown in the number of heavy rainfall events during this period. It should be noted that this regulation is roughly the same as the change in the high-susceptibility area. Thus, more exactly, it is not that the LUCC can change the susceptibility directly but that the natural slope conditions are influenced by various LUC types and subsequently by different environmental factors for initiating landslide. In general, most landslides in the area, especially the shallow ones, were triggered not by a single factor but by the combined results of external environmental factors. For example, during the period from 6 to 26 June in 2013, the area received 149 mm of rain although the number of rainy days was only three (6, 9 and 10 June). Two landslides (i.e., landslide no. 1 and 2) were triggered by this heavy rainfall event, which occurred on the 16th and 26th of June.
In addition, reservoir operation is another important triggering factor, as shown in Fig. 7. Before the construction of the reservoir (1992), the slope unit where the landslide is located had moderate susceptibility, whereas the susceptibility increased to a very high level in 2002 and 2013. Although the reservoir is also a kind of human engineering activity, the landslide was triggered by the reservoir impoundment. The seasonal and periodic fluctuation of the reservoir water level has changed the seepage and softened the geotechnical properties, both of which can gradually destabilize the landslide. During field survey, the appearance of a large number of cracks was noticed on the ground of the Shuanglong Lake landslide (SLLL, Fig. 6a) after the construction of the reservoir. Monitoring nearly a decade of deformation also indicated the slow but continuous movement of the landslide, with a velocity of approximately 1.6 m yr−1. In particular, the landslide movement shows an obvious intermittent characteristic: the movement accelerates in the rainy season in which period the reservoir water level generally drops down, while the movement often stops in other periods. Obviously, the landslide is undergoing the creep deformation influenced by the reservoir water level combined with rainfall. In the final analysis, however, this kind of impact was not highlighted because the reservoir area was considered a kind of HEAL. The change in the susceptibility of this slope unit was incorporated into the results of LUCC.
In order to study the impact of LUCC on landslide occurrence, the temporally and spatially differentiated information for both the landslide inventory and LUC maps is particularly important, while the other influencing factors were considered to be static. However, they have proven to be dynamic because they changed significantly in a few decades. Especially, in populated areas, the topographic factors (i.e., slope angle, aspect and profile curvature) can be altered by frequent earth movement processes (landslides, soil erosion, undercutting of slopes, etc.) in a short time. Therefore, a more accurate susceptibility result depends on good DEM data and influencing factor maps. Moreover, in landslide susceptibility evaluation, the LUC data integrates the controlling factors group and are generally directed by another factor input to the evaluation model. In some cases, LUC data are used as a landslide conditioning factor (Meneses et al., 2019). For instance, the CORINE Land Cover (CLC) data are widely used for landslide susceptibility assessment in many regions in Europe because they are the only LUC data available (Feranec et al., 2007). A similar situation happens in the analysis of 1992 in this study. The RS data with low resolution caused the inherent uncertainties of the obtained LUC maps, which was subsequently taken into the landslide susceptibility model. Even though it has tried to reduce such uncertainties by decreasing the amount of LUC categories and using the classification method of images with better accuracy, the final LS zonation results still have to deal with a considerable amount of uncertainties. As a consequence, the comparison between LRM and WEM does not seem to be important for improving the accuracy of the landslide susceptibility evaluation in this study. For example, Schmaltz et al. (2017) have recommended applying an easily interpretable multivariable model or generalized additive models, which is in accordance with the model used in this study.
Land use and land cover change can alter the geological conditions and affect the occurrence of the landslides. This study revealed the evolution of LUC and how LUC change affected landslide susceptibility at a regional scale. Through the analysis of different LUC maps with a 21-year time interval obtained from remote sensing images, it documented the rapid growth of the afforestation as well as the intense urbanization process in the region since the 1990s: the areas of forest land and human engineering activities between 1992 and 2013 increased by 34.3 % and 1.9 %, whereas the areas of the grassland and arable land decreased by 15.7 % and those of the barren land decreased by 20.5 %. Combined with the other five factors (slope angle, aspect, profile curvature, lithology and distance to the reservoir), the LUC was subsequently utilized for landslide susceptibility analysis in different years based on the logistic regression model and slope unit. The zonation results have shown that the urban area on both sides of the river valley is always the area with the largest landslide susceptibility. Along with the increase in engineering construction activities, the susceptibility of many areas increases. Even some small shallow landslides were directly triggered by the transformation of the LUC type (i.e., from forest land and GAL to HEAL).
In conclusion, the availability of high-resolution RS images and the selection of a suitable model for assessing landslide susceptibility are the keys to evaluate the impact of land use and land cover change on landslide susceptibility. In addition, the study concluded that human activities play an important role in the change in landslide susceptibility. Engineering activities on slopes could destabilize landslide hazard if risk assessment and mitigation measures do not take place in advance. Consequently, the method used in the study is beneficial for landslide hazard mitigation due to the combined use of GIS and RS techniques. Such results not only call for a more reasonable land use planning in the urbanization process in the future but also suggest a more systematic inclusion of LUC change in hazard assessment.
The study relied on three sets of data: (i) the data collected by the field work, (ii) remote sensing data and (iii) the detailed landslide investigation reports provided by the China Geological Survey (Wuhan Center). The categories (i) and (ii) are included in Table 1 in this paper. The detailed processing workflow for these datasets can be seen in the methodology section of this paper.
LC and KY guided the field work and data collection. SJ prepared the remote sensing data and processed the RS images. LC and ZG discussed the research plan and prepared the paper together. ZG carried out the statistical analysis and prepared the figures of the paper. LC supervised the project and DPS helped in the paper development and English writing.
The authors declare that they have no conflict of interest.
This article is part of the special issue “Natural hazard impacts on technological systems and infrastructures”. It is a result of the EGU General Assembly 2018, Vienna, Austria, 8–13 April 2018.
We want to thank the editor and two anonymous reviewers for their constructive comments, which helped us improve the quality of the manuscript.
This research has been supported by the National Natural Science Foundation of China (grant no. 41877525).
This paper was edited by Maria Bostenaru Dan and reviewed by two anonymous referees.
Abancó, C. and Hürlimann, M.: Estimate of the debris-flow entrainment using field and topographical data, Nat. Hazards, 71, 363–383, https://doi.org/10.1007/s11069-013-0930-5, 2014.
Abdul-Qadir, A. M.: Supervised classification for lithologic discrimination in Shaikh Ibrahim area, NW Iraq using Landsat images, Arab. J. Sci. Eng., 39, 437–451, https://doi.org/10.1007/s13369-013-0911-8, 2014.
Aitkenhead, M. J., Flaherty, S., and Cutler, M. E. J.: Evaluating neural networks and evidence pooling for land cover mapping, Photogram. Eng. Remote Sens., 8, 1019–1032, https://doi.org/10.14358/PERS.74.8.1019, 2008.
Aleotti, P. and Chowdhury, R. N.: Landslide hazard assessment: summary review and new perspectives, Bull. Eng. Geol. Environ., 58, 21–44, https://doi.org/10.1007/s100640050066, 1999.
Alvioli, M., Marchesini, I, Reichenbach, P., Rossi, M., Ardizzone, F., Fiorucci, F., and Guzzetti, F.: Automatic delineation of geomorphological slope units with r. slope units v1.0 and their optimization for landslide susceptibility modeling, Geosci. Model Dev., 9, 3975–3991, https://doi.org/10.5194/gmd-9-3975-2016, 2016.
Bayramov, E., Buchroithner, M., and Bayramov, R.: Quantitative assessment of 2014–2015 land-cover changes in Azerbaijan using object-based classification of LANDSAT-8 timeseries, Model. Earth Syst. Environ., 2, 35–47, https://doi.org/10.1007/s40808-016-0088-8, 2016.
Beguería, S.: Changes in land cover and shallow landslide activity: a case study in the Spanish Pyrenees, Geomorphology, 74, 196–206, https://doi.org/10.1016/j.geomorph.2005.07.018, 2006.
Berberoglu, S., Lloyd, C. D., Atkinson, P. M., and Curran, P. J.: The integration of spectral and textural information using neural networks for land cover mapping in the Mediterranean, Comput. Geosci., 26, 385–396, https://doi.org/10.1016/S0098-3004(99)00119-3, 2000.
Blaschke, T.: Object based image analysis for remote sensing, ISPRS. J. Photogram. Remote Sens., 65, 2–16, https://doi.org/10.1016/j.isprsjprs.2009.06.004, 2010.
Brenning, A.: Spatial prediction models for landslide hazards: review, comparison and evaluation, Nat. Hazards Earth Syst. Sci., 5, 853–862, https://doi.org/10.5194/nhess-5-853-2005, 2005.
Bruschi, V. M., Bonachea, J., Remondo, J., Gómez-Arozamena, J., Rivas, V., Barbieri, M., Capocchi, S., Soldati, M., and Cendrero, A.: Land management versus natural factors in land instability: some examples in northern Spain, Environ. Manage., 52, 398–416, https://doi.org/10.1007/s00267-013-0108-7, 2013.
Camilo, D. C., Lombardo, L., Mai, P. M., Dou, J., and Huser, R.: Handling high predictor dimensionality in slope-unit-based landslide susceptibility models through LASSO-penalized Generalized Linear Model, Environ. Model Softw., 97, 145–156, https://doi.org/10.1016/j.envsoft.2017.08.003, 2017.
Cervi, F., Berti, M., Borgatti, L., Ronchetti, F., Manenti, F., and Corsini, A: Comparing predictive capability of statistical and deterministic methods for landslide susceptibility mapping: a case study in the northern Apennines (Reggio Emilia Province, Italy), Landslides, 7, 433–444, https://doi.org/10.1007/s10346-010-0207-y, 2010.
Chen, L., van Westen, C. J., Hussin, H., Ciurean, R. L., Turkington, T., Chavarro-Rincon, D., and Shrestha, D. P.: Integrating expert opinion with modelling for quantitative multi-hazard risk assessment in the Eastern Italian Alps, Geomorphology, 273, 150–167, https://doi.org/10.1016/j.geomorph.2016.07.041, 2016.
Corsini, A. and Mulas, M.: Use of ROC curves for early warning of landslide displacement rates in response to precipitation (Piagneto landslide, Northern Apennines, Italy), Landslides, 14, 1241–1252, https://doi.org/10.1007/s10346-016-0781-8, 2017.
Cruden, D. M. and Miller, B. G. N.: Landclearing and landslides along tributaries of the Peace River, Western Alberta, Canada, in: International Conference on Land-slides: Causes, Impacts and Countermeasures (Davos, June 2001), edited by: Kühne, M., et al., Verlag Glükauf Essen, Essen, Germany, 377–383, 2001.
Cruden, D. M. and Varnes, D. J.: Landslide types and processes, in: Landslides, investigation and mitigation, Transportation Research Board Special Report 247, edited by: Turner, A. K. and Schuster, R. L., Transportation Research Board, Washington, D.C., 36–75, 1996.
Deng, Q., Fu, M., Ren, X., Liu, F., and Tang, H.: Precedent long-term gravitational deformation of large scale landslides in the Three Gorges reservoir area, China, Eng. Geol., 221, 170–183, https://doi.org/10.1016/j.enggeo.2017.02.017, 2017.
Fell, R., Corominas, J., Bonnard, C., Cascini, L., Leroi, E., and Savage, W. Z.: Guidelines for landslide susceptibility, hazard and risk zoning for land use planning, Eng. Geol., 102, 85–98, https://doi.org/10.1016/j.enggeo.2008.03.022, 2008.
Feranec, J., Hazeu, G., Christensen, S., and Jaffrain, G.: Corine land cover change detection in Europe (case studies of the Netherlands and Slovakia), Land Use Policy, 24, 234–247, https://doi.org/10.1016/j.landusepol.2006.02.002, 2007.
Galve, J. P., Cevasco, A., Brandolini, P., and Soldati, M.: Assessment of shallow landslide risk mitigation measures based on land use planning through probabilistic modelling, Landslides, 12, 101–114, https://doi.org/10.1007/s10346-014-0478-9, 2015.
García-Ruiz, J. M., Beguería, S., Alatorre, L. C., and Puigdefábregas, J.: Land cover changes and shallow landsliding in the flysch sector of the Spanish Pyrenees, Geomorphology, 124, 250–259, https://doi.org/10.1016/j.geomorph.2010.03.036, 2010.
Ghestem, M., Sidle, R. C., and Stokes, A.: The influence of plant root system on subsurface flow: implications for slope stability, Bioscience, 61, 869–879, https://doi.org/10.1525/bio.2011.61.11.6, 2011.
Ghestem, M., Veylon, G., Bernard, A., Vanel, Q., and Stokes, A.: Influence of plant root system morphology and architectural traits on soil shear resistance, Plant Soil., 377, 43–61, https://doi.org/10.1007/s11104-012-1572-1, 2014.
Gioia, E., Carone, T., and Marincioni, F.: Rainfall and land use empirically coupled to forecast landslides in the Esino river basin, central Italy, Nat. Hazards Earth Syst. Sci., 15, 1289–1295, https://doi.org/10.5194/nhess-15-1289-2015, 2015.
Glade, T.: Landslide occurrence as a response to land use change : a review of evidence from New Zealand, Catena, 51, 297–314, https://doi.org/10.1016/S0341-8162(02)00170-4, 2003.
Guillard, C. and Zêzere, J.: Landslide susceptibility assessment and validation in the framework of municipal planning in Portugal: the case of Loures Municipality, Environ. Manage., 50, 721–735, https://doi.org/10.1007/s00267-012-9921-7, 2012.
Guzzetti, F., Carrara, A., Cardinali, M., and Reichenbach, P.: Landslide hazard evaluation: a review of current techniques and their application in a multi-scale study, Central Italy, Geomorphology, 31, 181–216, https://doi.org/10.1016/S0169-555X(99)00078-1, 1999.
Guzzetti, F., Cardinali, M., Reichenbach, P., and Carrara, A.: Comparing landslide maps: a case study in the upper Tiber River Basin, central Italy, Environ. Manage., 25, 247–263, https://doi.org/10.1007/s002679910020, 2000.
Guzzetti, F., Galli, M., Reichenbach, P., Ardizzone, F., and Cardinali, M.: Landslide hazard assessment in the Collazzone area, Umbria, Central Italy, Nat. Hazards Earth Syst. Sci., 6, 115–131, https://doi.org/10.5194/nhess-6-115-2006, 2006a.
Guzzetti, F., Reichenbach, P., Ardizzone, F., Cardinali, M., and Galli, M.: Estimating the quality of landslide susceptibility models, Geomorphology, 81, 166–184, https://doi.org/10.1016/j.geomorph.2006.04.007, 2006b.
Harris, C., Davies, M. C. R., and Etzelmüller, B.: The assessment of potential geotechnical hazards associated with mountain permafrost in a warming global climate, Permafrost Periglac., 12, 145–156, https://doi.org/10.1002/ppp.376, 2001.
Huang, F., Yin, K., Huang, J., Gui, L., and Wang, P.: Landslide susceptibility mapping based on self-organizing-map network and extreme learning machine, Eng. Geol., 223, 11–22, https://doi.org/10.1016/j.enggeo.2017.04.013, 2017.
Huang, F., Chen, L., Yin, K., Huang, J., and Gui, L.: Object-oriented change detection and damage assessment using high-resolution remote sensing images, Tangjiao Landslide, Three Gorges Reservoir, China, Environ. Earth Sci., 77, 183–201, https://doi.org/10.1007/s12665-018-7334-5, 2018.
Iqbal, J., Dai, F., Hong, M., Tu, X., and Xie, Q.: Failure Mechanism and Stability Analysis of an Active Landslide in the Xiangjiaba Reservoir Area, Southwest China, J. Earth Sci., 29, 646–661, https://doi.org/10.1007/s12583-017-0753-5, 2018.
Karsli, F., Atasoy, M., Yalcin, A., Reis, S., Demir, O., and Gokceoglu, C: Effects of land-use changes on landslides in a landslide-prone area (Ardesen, Rize, NE Turkey), Environ. Monit. Assess., 156, 241–255, https://doi.org/10.1007/s10661-008-0481-5, 2009.
Kayastha, P.: Landslide susceptibility mapping and factor effect analysis using frequency ratio in a catchment scale: a case study from Garuwa sub-basin, East Nepal, Arab, J. Geosci., 8, 8601–8613, https://doi.org/10.1007/s12517-015-1831-6, 2015.
Lee, S.: Application of logistic regression model and its validation for landslide susceptibility mapping using GIS and remote sensing data, Int. J. Remote Sens., 26, 1477–1491, https://doi.org/10.1080/01431160412331331012, 2005.
Lee, S., Ryu, J. H., Won, J. S., and Park, H. J.: Determination and application of the weights for landslide susceptibility mapping using an artificial neural network, Eng. Geol., 71, 289–302, https://doi.org/10.1016/S0013-7952(03)00142-X, 2004.
Li, Z., Feng, Y., Dessay, N., Delaitre, E., Gurgel, H., and Gong, P.: Continuous monitoring of the spatio-temporal patterns of surface water in response to land use and land cover types in a Mediterranean lagoon complex, Remote Sens., 11, 1425–1443, https://doi.org/10.3390/rs11121425, 2019.
Lombardo, L. and Mai, P. M.: Presenting logistic regression-based landslide susceptibility results, Eng. Geol., 244, 14–24, https://doi.org/10.1016/j.enggeo.2018.07.019, 2018.
Lopez-Saez, J., Corona, C., Eckert, N., Stoffel, M., Bourrier, F., and Berger, F.: Impacts of land-use and land-cover changes on rockfall propagation: Insights from the Grenoble conurbation, Sci. Total Environ., 547, 345–355, https://doi.org/10.1016/j.scitotenv.2015.12.148, 2016.
Mao, Z., Yang, M., Bourrier, F., and Fourcaud, T.: Evaluation of root reinforcement models using numerical modelling approaches, Plant Soil, 382, 249–270, https://doi.org/10.1007/s11104-014-2116-7, 2014.
Mashimbye, Z. E., Clercq, W. P., and Niekerk, A. V.: An evaluation of digital elevation models (DEMs) for delineating land components, Geoderma, 213, 312–319, https://doi.org/10.1016/j.geoderma.2013.08.023, 2014.
Melchiorre, C., Matteucci, M., Azzoni, A., and Zanchi, A.: Artificial neural networks and cluster analysis in landslide susceptibility zonation, Geomorphology, 94, 379–400, https://doi.org/10.1016/j.geomorph.2006.10.035, 2008.
Meneses, B. M., Pereira, S., and Reis, E.: Effects of different land use and land cover data on the landslide susceptibility zonation of road networks, Nat. Hazards Earth Syst. Sci., 19, 471–487, https://doi.org/10.5194/nhess-19-471-2019, 2019.
Mohammady, M., Pourghasemi, H. R., and Pradhan, B.: Landslide susceptibility mapping at Golestan Province, Iran: A comparison between frequency ratio, Dempster–Shafer, and weights-of-evidence models, J. Asian Earth Sci., 61, 221–236, https://doi.org/10.1016/j.jseaes.2012.10.005, 2012.
Nandi, A. and Shakoor, A.: A GIS-based landslide susceptibility evaluation using bivariate and multivariate statistical analyses, Eng. Geol., 110, 11–20, https://doi.org/10.1016/j.enggeo.2009.10.001, 2009.
Ozdemir, A. and Altural, T.: A comparative study of frequency ratio, weights of evidence and logistic regression methods for landslide susceptibility mapping: Sultan Mountains, SW Turkey, J. Asian Earth Sci., 64, 180–197, https://doi.org/10.1016/j.jseaes.2012.12.014, 2013.
Piacentini, D., Troiani , F., Soldati, M., Notarnicola, C., Savelli, D., Schneiderbauer, S., and Strada, C.: Statistical analysis for assessing shallow-landslide susceptibility in South Tyrol (south-eastern Alps, Italy), Geomorphology, 151–152, 196–206, https://doi.org/10.1016/j.geomorph.2012.02.003, 2012.
Pinyol, N. M., Alonso, E. E., Corominas, J., and Moya, J.: Canelles landslide: modeling rapid drawdown and fast potential sliding, Landslides, 9, 33–51, https://doi.org/10.1007/s10346-011-0264-x, 2012.
Pisano, L., Zumpano, V., Malek, Ž., Rosskopf, C. M., and Parise, M.: Variations in the susceptibility to landslides, as a consequence of landcover changes: A look to the past, and another towards the future, Sci. Total Environ., 601–602, 1147–1159, https://doi.org/10.1016/j.scitotenv.2017.05.231, 2017.
Pourghasemi, H. R. and Rossi, M.: Landslide susceptibility modeling in a landslide prone area in Mazandarn Province, north of Iran: a comparison between GLM, GAM, MARS, and M-AHP methods, Theor. Appl. Climatol., 130, 609–633, https://doi.org/10.1007/s00704-016-1919-2, 2017.
Promper, C., Gassner, C. H., and Glade, T.: Spatiotemporal patterns of landslide exposure – a step within future landslide risk analysis on a regional scale applied in Waidhofen/YBBs Austria, Int. J. Disast. Risk Reduct., 12, 25–33, https://doi.org/10.1016/j.ijdrr.2014.11.003, 2015.
Razavizadeh, S., Solaimani, K., Massironi, M., and Kavian, A.: Mapping landslide susceptibility with frequency ratio, statistical index, and weights of evidence models: a case study in northern Iran, Environ. Earth Sci., 76, 499–514, https://doi.org/10.1007/s12665-017-6839-7, 2017.
Regmi, A. D., Devkota, K. C., Yoshida, K., Pradhan, B., Pourghasemi, H. R., Kumamoto, T., and Akgun, A.: Application of frequency ratio, statistical index, and weights-of-evidence models and their comparison in landslide susceptibility mapping in central Nepal Himalaya, Arab. J. Geosci., 7, 725–742, https://doi.org/10.1007/s12517-012-0807-z, 2014.
Regmi, N. R., Giardino, J. R., and Vitek, J. D.: Assessing susceptibility to landslides: Using models to understand observed changes in slopes, Geomorphology, 122, 25–38, https://doi.org/10.1016/j.geomorph.2010.05.009, 2010.
Reichenbach, P., Busca, C., Mondini, A. C., and Rossi, M.: The influence of land use change on landslide susceptibility zonation: the Briga Catchment test site (Messina, Italy), Environ. Manage., 54, 1372–1384, https://doi.org/10.1007/s00267-014-0357-0, 2014.
Rotigliano, E., Cappadonia, C., Conoscenti, C., Costanzo, D., and Agnesi, V.: Slope units-based flow susceptibility model: using validation tests to select controlling factors, Nat. Hazards, 61, 143–153, https://doi.org/10.1007/s11069-011-9846-0, 2012.
Scalenghe, R. and Marsan, F. A.: The anthropogenic sealing of soils in urban areas, Landscape Urban Plan., 90, 1–10, https://doi.org/10.1016/j.landurbplan.2008.10.011, 2009.
Schlögel, R., Marchesini, I., Alvioli, M., Reichenbach, P., Rossi, M., and Malet, J. P.: Optimizing landslide susceptibility zonation: Effects of DEM spatial resolution and slope unit delineation on logistic regression models, Geomorphology, 301, 10–20, https://doi.org/10.1016/j.geomorph.2017.10.018, 2018.
Schmaltz, E. M., Steger, S., and Glade, T.: The influence of forest cover on landslide occurrence explored with spatio-temporal information, Geomorphology, 290, 250–264, https://doi.org/10.1016/j.geomorph.2017.04.024, 2017.
Shrestha, D. P., Saepuloh, A., and Van Der Meer, F.: Land cover classification in the tropics, solving the problem of cloud covered areas using topographic parameters, Int. J. Appl. Earth Obs., 77, 84–93, https://doi.org/10.1016/j.jag.2018.12.010, 2019.
Tasser, E., Mader, M., and Tappeiner, U.: Basic and applied ecology effects of land use in alpine grasslands on the probability of landslides, Basic Appl. Ecol., 280, 271–280, https://doi.org/10.1078/1439-1791-00153, 2003.
Taubenböck, H., Wurm, M., Netzband, M., Zwenzner, H., Roth, A., Rahman, A., and Dech, S.: Flood risks in urbanized areas – multi-sensorial approaches using remotely sensed data for risk assessment, Nat. Hazards Earth Syst. Sci., 11, 431–444, https://doi.org/10.5194/nhess-11-431-2011, 2011.
Tian, Y., Xu, C., Ma, S., Wang, S., and Zhang, H.: Inventory and Spatial Distribution of Landslides Triggered by the 8th August 2017 MW 6.5 Jiuzhaigou Earthquake, China, J. Earth Sci., 30, 206–217, https://doi.org/10.1007/s12583-018-0869-2, 2019.
Van Den Eeckhaut, M., Reichenbach, P., Guzzetti, F., Rossi, M., and Poesen, J.: Combined landslide inventory and susceptibility assessment based on different mapping units: an example from the Flemish Ardennes, Belgium, Nat. Hazards Earth Syst. Sci., 9, 507–521, https://doi.org/10.5194/nhess-9-507-2009, 2009.
Van Westen, C. J., van Asch, T. W. J., and Soeters, R.: Landslide hazard and risk zonation – why is it still so difficult?, Bull. Eng. Geol. Environ., 65, 167–184, https://doi.org/10.1007/s10064-005-0023-0, 2006.
Van Westen, C. J., Castellanos, E., and Kuriakose, S. L.: Spatial data for landslide susceptibility, hazard, and vulnerability assessment: An overview, Eng. Geol., 102, 112–131, https://doi.org/10.1016/j.enggeo.2008.03.010, 2008.
Vasu, N. N. and Lee, S. R.: A hybrid feature selection algorithm integrating an extreme learning machine for landslide susceptibility modeling of Mt. Woomyeon, South Korea, Geomorphology, 263, 50–70, https://doi.org/10.1016/j.geomorph.2016.03.023, 2016.
Wang, F., Yin, K. Gui, L., and Chen, L.: Risk Analysis on Individual Reservoir Bank Landslide and Its Generated Wave, Earth Sci., 43, 899–909, https://doi.org/10.3799/dqkx.2018.910, 2018.
Xie, M., Esaki, T., and Zhou, G.: GIS-based probabilistic mapping of landslide hazard using a three-dimensional deterministic model, Nat. Hazards, 33, 265–282, https://doi.org/10.1023/B:NHAZ.0000037036.01850.0d, 2004.
Yalcin, A., Reis, S., Aydinoglu, A. C., and Yomralioglu, T. A.: GIS-based comparative study of frequency ratio, analytical hierarchy process, bivariate statistics and logistics regression methods for landslide susceptibility mapping in Trabzon, NE Turkey, Catena, 85, 274–287, https://doi.org/10.1016/j.catena.2011.01.014, 2011.
Ymeti, I., Van Der Werff, H., Shrestha, D. P., Jetten, V. G., Lievens, C., and Van Der Meer, F.: Using color, texture and objected-based image analysis of multi-temporal camera data to monitor soil aggregate breakdown, Sensors, 17, 1241–1261, https://doi.org/10.3390/s17061241, 2017.
Zhang, T. and Tang, H.: A Comprehensive Evaluation of Approaches for Built-Up Area Extraction from Landsat OLI Images Using Massive Samples, Sensors, 11, 2–13, https://doi.org/10.3390/rs11010002, 2019.
Zhou, C., Yin, K., Cao, Y., Ahmed, B., Li, Y., Catani, F., and Pourghasemi, H. R.: Landslide susceptibility modeling applying machine learning methods: A case study from Longju in the Three Gorges Reservoir area, China, Comput. Geosci., 112, 23–37, https://doi.org/10.1016/j.cageo.2017.11.019, 2018.