the Creative Commons Attribution 4.0 License.
the Creative Commons Attribution 4.0 License.
 | 05 Sep 2019
SMC-Flood database: a high-resolution press database on flood cases for the Spanish Mediterranean coast (1960–2015)
Salvador Gil-Guirado
Alfredo Pérez-Morales
Francisco Lopez-Martinez
Flood databases of high spatio-temporal resolution are a necessary tool for proper spatial planning, especially in areas with high levels of exposure and danger to floods. This study presents the preliminary results of the Spanish Mediterranean Coastal Flood (SMC-Flood) database covering the municipalities in this region. This database collects information on flood cases that occurred between 1960 and 2015 by systematically consulting the digital archives of the main newspapers in the study area. The search for flood information was conducted by means of using links between municipality names and seven keywords that correspond to the most common ways of referring to a situation that is likely to describe a flood in Spain. This methodology has enabled the reconstruction of 3008 flood cases at a municipal scale with daily resolution while gathering information on the types of damage, intensity, severity and area affected. The spatio-temporal analysis of the data reveals hotspots where flood cases are especially intense and damaging when compared to highly developed areas where the frequency of flood cases is very high. This situation is especially worrying insofar as we have detected a growing trend in the frequency and area affected by flood cases. However, one positive aspect is that the intensity and severity of flood cases follows a falling trend. The main novelty lies in the fact that the high-resolution spatial analysis has made it possible to detect a clear latitudinal gradient of growing intensity and severity in a north–south direction. This pattern calls for new actions by the coastal municipal authorities of southern Spain for adaptation to a more complex flood scenario.
- Article
(8038 KB) - Full-text XML
- BibTeX
- EndNote


On the Spanish Mediterranean coast, the relationship between water resources and society has been marked over time by the succession of periods of drought and catastrophic floods that have major socio-economic impacts. This extreme hydroclimatic behaviour has exposed society, which needs water resources for its agricultural and domestic demands, to large reports of damage from torrential rainfall (Gil-Guirado, 2013). In addition to the climatic conditions, it is also necessary to consider the social component. The economic growth experienced in the Spanish Mediterranean region over recent decades has increased exposure and vulnerability to the hazard (Pérez-Morales et al., 2018), with a significant rise in economic loss caused by floods (Barredo et al., 2012). This socio-economic growth process has occurred without having properly planned any strategies to reduce the impact of flooding (Olcina Cantos et al., 2010). One of the factors leading to a lack of strategic planning is the absence of a correct chronology of flood episodes (Hilker et al., 2009). As a result of this situation, land use plans are based on inadequate chronologies that do not report the real risk to the population in this area (Barriendos et al., 2014).
Several open and global flood databases have been developed over recent years (Brakenridge, 2010; WMO, UCL, 2014; Munich Re, 2018; ESSL, 2018; EM-DAT, 2018; European Environment Agency, 2018; NOOA, 2018; Swiss Re, 2018)1. Nevertheless, most of these databases have two limitations: (i) the level of spatial resolution is variable between the municipal and regional scales and (ii) the number of events is considerably underestimated due to the use of indirect sources (Llasat et al., 2013a). Despite this, these databases have been used in a great deal of research to analyse the trends and changes observed in the behaviour of floods on different scales (Barredo, 2007; Ashley and Ashley, 2008; Kundzewicz et al., 2013; Jongman et al., 2015; Terti et al., 2017). Other studies, such as that of Adhikari et al. (2010), have compiled information from the main global-scale databases to increase the spatial resolution and improve the spatio-temporal representativeness of the data. Taking into account the bias of the original databases, the results of these studies may present biases related to underestimating the number of episodes and the failure to consider local variations.
On the other hand, several other studies like this have developed their own databases using primary sources (newspapers, books, historical documents, reports and technical documents) for different regions of the planet2. In this respect, the studies developed in the Mediterranean region are very remarkable. Some works have made notable efforts to synthesize flood data from different European regions in order to offer a homogeneous database for the western Mediterranean. In this regard, the works by Llasat (2013a, b) show the results of the FLOODHYMEX database analysis (produced in the framework of the HYMEX project). Using newspaper sources with high spatial resolution, these works collect a large amount of data on flood events that occurred between 1981 and 2010. As for Spain, works of Llasat et al. (2009, 2013a, b, 2016), Llasat et al. (2013), and Barnolas and Llasat (2007) show remarkable improvements in flood databases through the INUNGAMA flood database. Also in Spain, Barriendos et al. (2014) analysed a historical database obtained from historical documents, newspapers, official reports and expert studies, covering the period 1035–2013. For Portugal, Zêzere et al. (2014) present a database for the period 1865 to 2010, which they obtained from 16 national, regional and local newspapers. Other Mediterranean countries present equally valid initiatives, such as Diakakis et al. (2012) for Greece, whose work covers the period 1880 to 2010 using journalistic sources and flood event databases from state civil protection agencies. Another important example in Greece is the NOA database (Papagiannaki et al., 2013), which is also based on press articles that are constantly updated with information on weather and impact intensity classification. Italy also has adopted a large number of initiatives to ascertain at a high level of spatio-temporal resolution the flood risk to its populations. In this respect, projects have been developed for specific regions of Italy. Specifically, for the region of Calabria, Polemio and Petrucci (2012) and Petrucci et al. (2018) analyse the variability of floods at the municipal level between 1880 and 2007, doing so by using newspaper and historical documents for their reconstruction. For the region of Campania, Vennari et al. (2016) reconstruct more than 500 flood events for the 1540 to 2015 period using historical documents. However, the project at the largest scale, the AVI project, was based on the studies of Guzzetti et al. (2005) and Salvati et al. (2013), whose results made it possible to establish a high-resolution flood and landslide database for the whole of Italy between 68 CE and 2010 CE. Basically, the AVI project uses primary documentation, but with detailed information on deaths and displaced people.
The aim of most of these works is related to analysing flood trends for the period of time reconstructed. However, the relationship between increases in exposure, losses and impacts of floods does not follow a growing linear function. In fact, climate variability, defence infrastructures, adaptation measures and the increase in exposure have changed both social perception and flood trends (Jongman et al., 2014). In this respect, it is necessary to stress the existence of a negative correlation between the duration and direction of the trends. Whilst negative trends appear in studies using data that cover several centuries, positive trends appear in studies that analyse data on the last half-century. These divergences are due to both capturing climatic oscillations in data with a long duration (Barriendos et al., 2014) and the heterogeneity of the sources used during recent years (Brázdil et al., 2014). Furthermore, the increase in exposure to flood risk has led to a rise in flood trends (Pérez-Morales et al., 2018).
Among the different sources used for flood databases, newspaper sources allow homogenization of the documentary volume of different countries over at least the last 150 years. In fact, most of the studies that reconstruct floods for more recent periods have used newspapers as their main source of data (e.g. FitzGerald et al., 2010; Zêzere et al., 2014). Despite the fact that journalistic sources describe the impacts of floods on societies in great detail, they are of a high spatio-temporal resolution and have a large quantity of information to deal with, thus making it necessary to reduce both the area of study and the period analysed. Although the compilation of information is obviously an arduous task involving detailed archive work, the results accurately reflect the impact of floods (Barriendos et al., 2014).
To reduce the knowledge deficit regarding the spatio-temporal variability of floods and to more efficiently zone the Mediterranean coast according to flood risk, we have developed a high-resolution flood database by means of a methodology based on exploring the digital archives of the main newspapers published in the area. This database, the Spanish Mediterranean Coastal database (or SMC-Flood database), includes all the flood cases recorded in newspapers for the different municipalities of the Spanish Mediterranean coast from 1960 until 2015. Here, we should clarify the difference between flood cases and flood events. We consider a flood case to be when a municipality has suffered some economic or social impact due to rain on a specific day. However, a flood event refers to an atmospheric situation on a specific day or in a time period that may have affected several municipalities at the same time (several flood cases). In this way, a flood case always corresponds to an affected municipality on a particular day, while an event may involve several municipalities and days. For example, during the flood event of October 1973, there were 27 flood cases along the coast in the provinces of Almeria and Murcia on the 18th and 19th of that month. Considering cases and not events implies a large number of records in comparison to databases that consider only flood events.
Therefore, the main objective of this paper is to present the preliminary results of the SMC-Flood database, thus providing an indicator of the potential of using this type of high-resolution database for research. Our objective is especially relevant to areas like the Spanish Mediterranean coast, where population growth in recent decades has led to an unbridled increase in exposure to flood risk. In this regard, this paper has secondary objectives of analysing the temporal spatial variability of flood cases in the study area and detecting hotspots with high flood risk.
In future research, this database will be used for various purposes, such as for evaluating flood prediction tools and validating risk thresholds according to exposure and vulnerability conditions. In general, the SMC-Flood database will contribute to improving the understanding of the flood processes in an area of special economic, climatic and social interest.
The study area includes all the coastal municipalities of the Spanish Mediterranean Sea on the Iberian Peninsula. In total, there are 179 municipalities integrated into 11 provinces and four autonomous communities (see Fig. 1). The total area is 13 381 km2 (2.64 % of Spain's total area), with a population of 8 413 290 inhabitants in the year 2016 (18 % of the Spanish population) (INE, 2018) and an average population density of 1200 inhabitants per square kilometre, a figure far higher than the average for the EU (119) and for Spain (92).
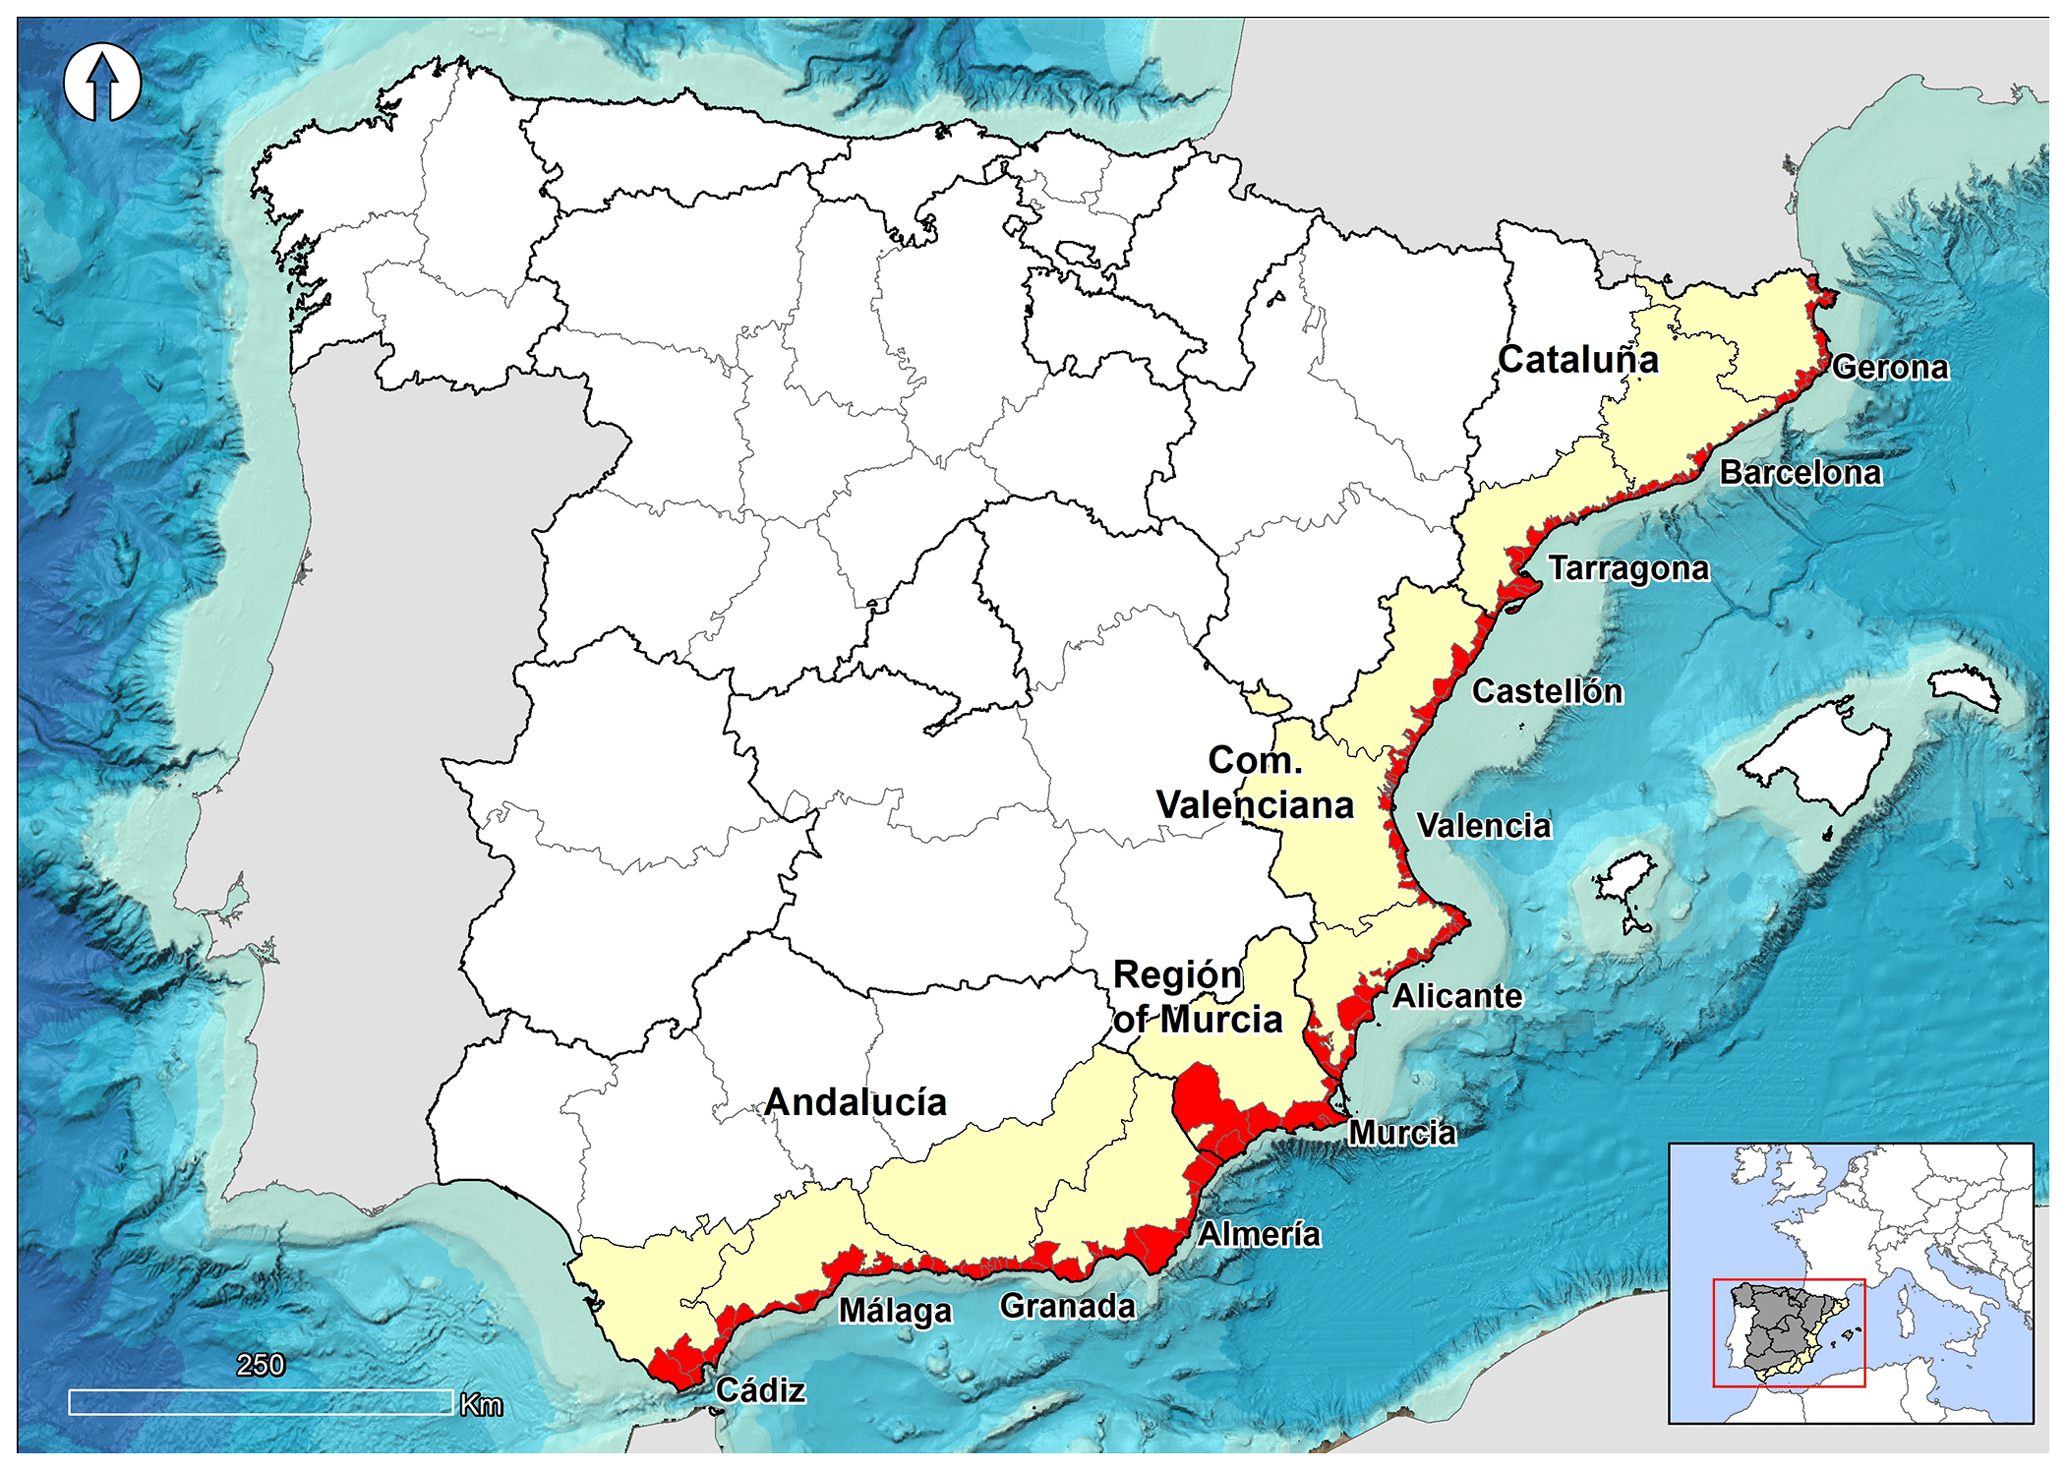
Figure 1Coastal municipalities of the Spanish Mediterranean Sea along the Iberian Peninsula.
Due to the climatic and hydrological conditions of the Spanish Mediterranean basins, as well as the intensive human intervention that has taken place, this space has become a “risk region” with a high level of vulnerability (Olcina Cantos et al., 2010). The rainfall climatology in the western Mediterranean is marked by high variability coefficients (above 35 %). Thus, 25 % of rain days concentrate more than 75 % of precipitation (Martín-Vide, 2004). The seasonality of torrential rains over the Spanish Mediterranean region is marked by a maximum at the end of summer and especially during the autumn (Llasat et al., 2013b). This maximum is due to warm, humid air coming in at low levels from the sea (Gilabert and Llasat, 2018). These atmospheric situations can be accentuated by the presence of a closed upper-level low (Sumner et al., 2003), which has become completely displaced (cutoff) from the westerly current and moves independently of that current (Pagán et al., 2016). However, convective precipitations are the trigger for a large number of torrential rain episodes that are of low spatial extent and especially related to flash floods (Gilabert and Llasat, 2018). Furthermore, these climate conditions can become more dramatic in the future. Sumner et al. (2003) highlighted a notable increase in most synoptic situations with an easterly flow on the Spanish Mediterranean coast. These situations are prone to generating torrential rains and thus increasing flood hazards.
Added to this climate condition is the effect of an abrupt relief, with sharp gradients (Gilabert and Llasat, 2018) and scarce vegetation, which increases the quantity of effective rainfall becoming run-off. Furthermore, the presence of pre-littoral reliefs exacerbates these precipitations and explains part of the great spatial variability of the precipitation during a single atmospheric event (Romero et al., 2000).
In addition, this extreme climate is complicated by the social component. Because of the intensive agriculture, industry in the major urban centres, trade and tourism, this region is the main centre of urban growth (Burriel, 2015). Thus, the resulting dynamic economy places it among the highest rates of population and economic growth in Europe over the last 50 years.
The SMC-Flood database contains information about flood cases at the municipal level that were published in printed newspapers and took place among the Spanish Mediterranean coastal municipalities (henceforth SMCM) between 1960 CE and 2015 CE. The newspapers used were selected according to the following criteria: (i) they have the highest circulation in one of each of the four autonomous communities studied and (ii) their head offices are located in that same autonomous community (see Table 1). This criterion ensures the reliability of the data since news coverage of floods is more extensive when the original source of the data is a newspaper whose office is in the same autonomous community.
Table 1Newspaper sources for the SMC-Flood database.
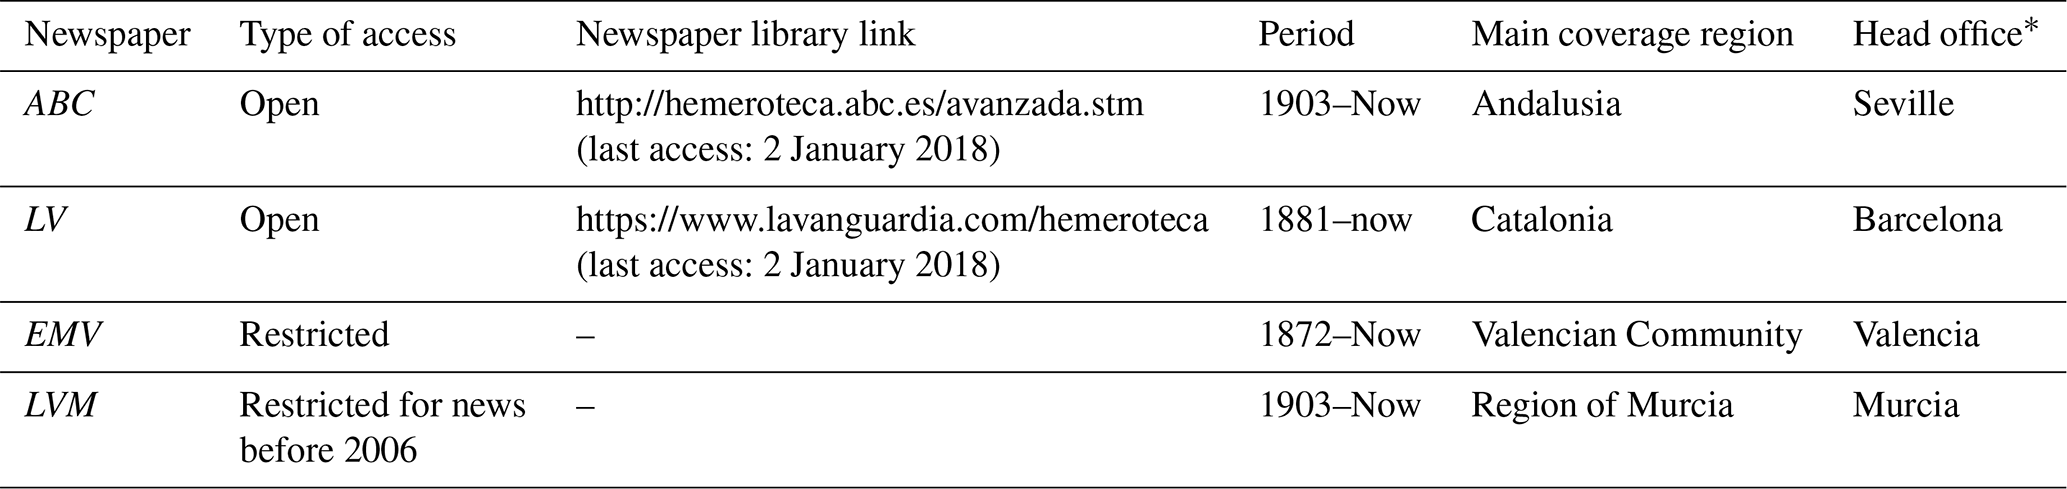
* The head office of the newspaper ABC is in the city of Seville (Andalusia), that of the newspaper La Vanguardia (LV) is in the city of Barcelona (Catalonia), that of the newspaper El Mercantil Valenciano (EMV) is in the city of Valencia (Valencian Community) and that of the newspaper La Verdad de Murcia (LVM) is in the city of Murcia (region of Murcia.
The information from these newspaper archives is available digitally through both open access (La Vanguardia, LV, and ABC) and restricted access (El Mercantil Valenciano, EMV, and La Verdad de Murcia, LVM). When access was restricted, we obtained an unrestricted password for the EMV free of charge within the framework of scientific cooperation. In the case of LVM, we carried out the search on the central computer of the newspaper's head office in the city of Murcia.
The digitized documents facilitated keyword searching for the information in the archive search engines of each newspaper. The first step consisted of relating each municipality (179) to its corresponding autonomous community's newspaper. However, in some cases, searching for information in some other newspaper completed the level of detail on specific cases and municipalities. Additionally, we consulted the specific bibliography to rule out any data gaps, for which the main source of information was the Catálogo Nacional de Inundaciones Históricas (Pascual and Bustamante, 2011). It is necessary to validate the results, especially when taking into account certain problems related to using newspaper sources, such as inhomogeneity, duplicity of information and contradictory information (widely discussed by Llasat et al., 2009 and 2013a). Furthermore, these newspaper-source problems become more evident going back in time (more than 50 years) since journalistic sources are relatively more consistent over recent decades. In light of the issues above, the authors conducted the query procedure manually in order to eliminate some of the indicated problems from this database. Secondly, we carried out the systematic search for news where the name of each municipality appears together with any of the seven keywords/phrases selected (see Fig. 2a). These keywords correspond to the most common ways of referring to a situation that is likely to describe a flood in Spain:
-
inundación (flood)
-
inundaciones (floods)
-
riada (flash flood)
-
lluvias torrenciales (torrential rains)
-
fuertes lluvias (heavy rains)
-
intensas lluvias (strong rains)
-
tromba de agua (severe downpour).
In addition, the search was duplicated for those municipalities in Catalonia and the Valencian Community that have language variations (e.g. Alicante/Alacant, La Escala/L'Escala, El Puerto de la Selva/El Port de la Selva, Sagunto/Sagunt). In this way, we ensured that the same search criteria were fulfilled within all cases.
This initial search produced more than 1 500 000 possible results (news pages). Obviously, several keywords may be present on one page of news. In many other cases, the name of a municipality may appear on the page of a news item on floods, but without having been affected by that flood. In relation to this last point, it is possible to limit searches to cases in which the keywords are connected directly to the name of the town (i.e. “torrential rains in Barcelona”). However, we found that this excessively restricted our search results, thus leading to many missing news items that had actually reported on specific flood cases. The reason for this is that keywords frequently appear in the headlines while the body of the news report describes the impacts and identifies the affected municipalities.
To filter the initial search results, each news item was saved in a digital file with the date of the news, followed by the initials of the newspaper (LV, ABC, LVM or EMV), and, finally, the page number of the newspaper where it was reported. On many occasions, news about a flood in a specific town appears on different pages within the same day, offering varied and complementary information. Fortunately, this system for the coding news enabled elimination of duplicate keywords as well as municipalities (the same piece of news describes floods in various municipalities). Thus, the file on possible flood cases was reduced to 23 580 pieces of news for the SMCM.
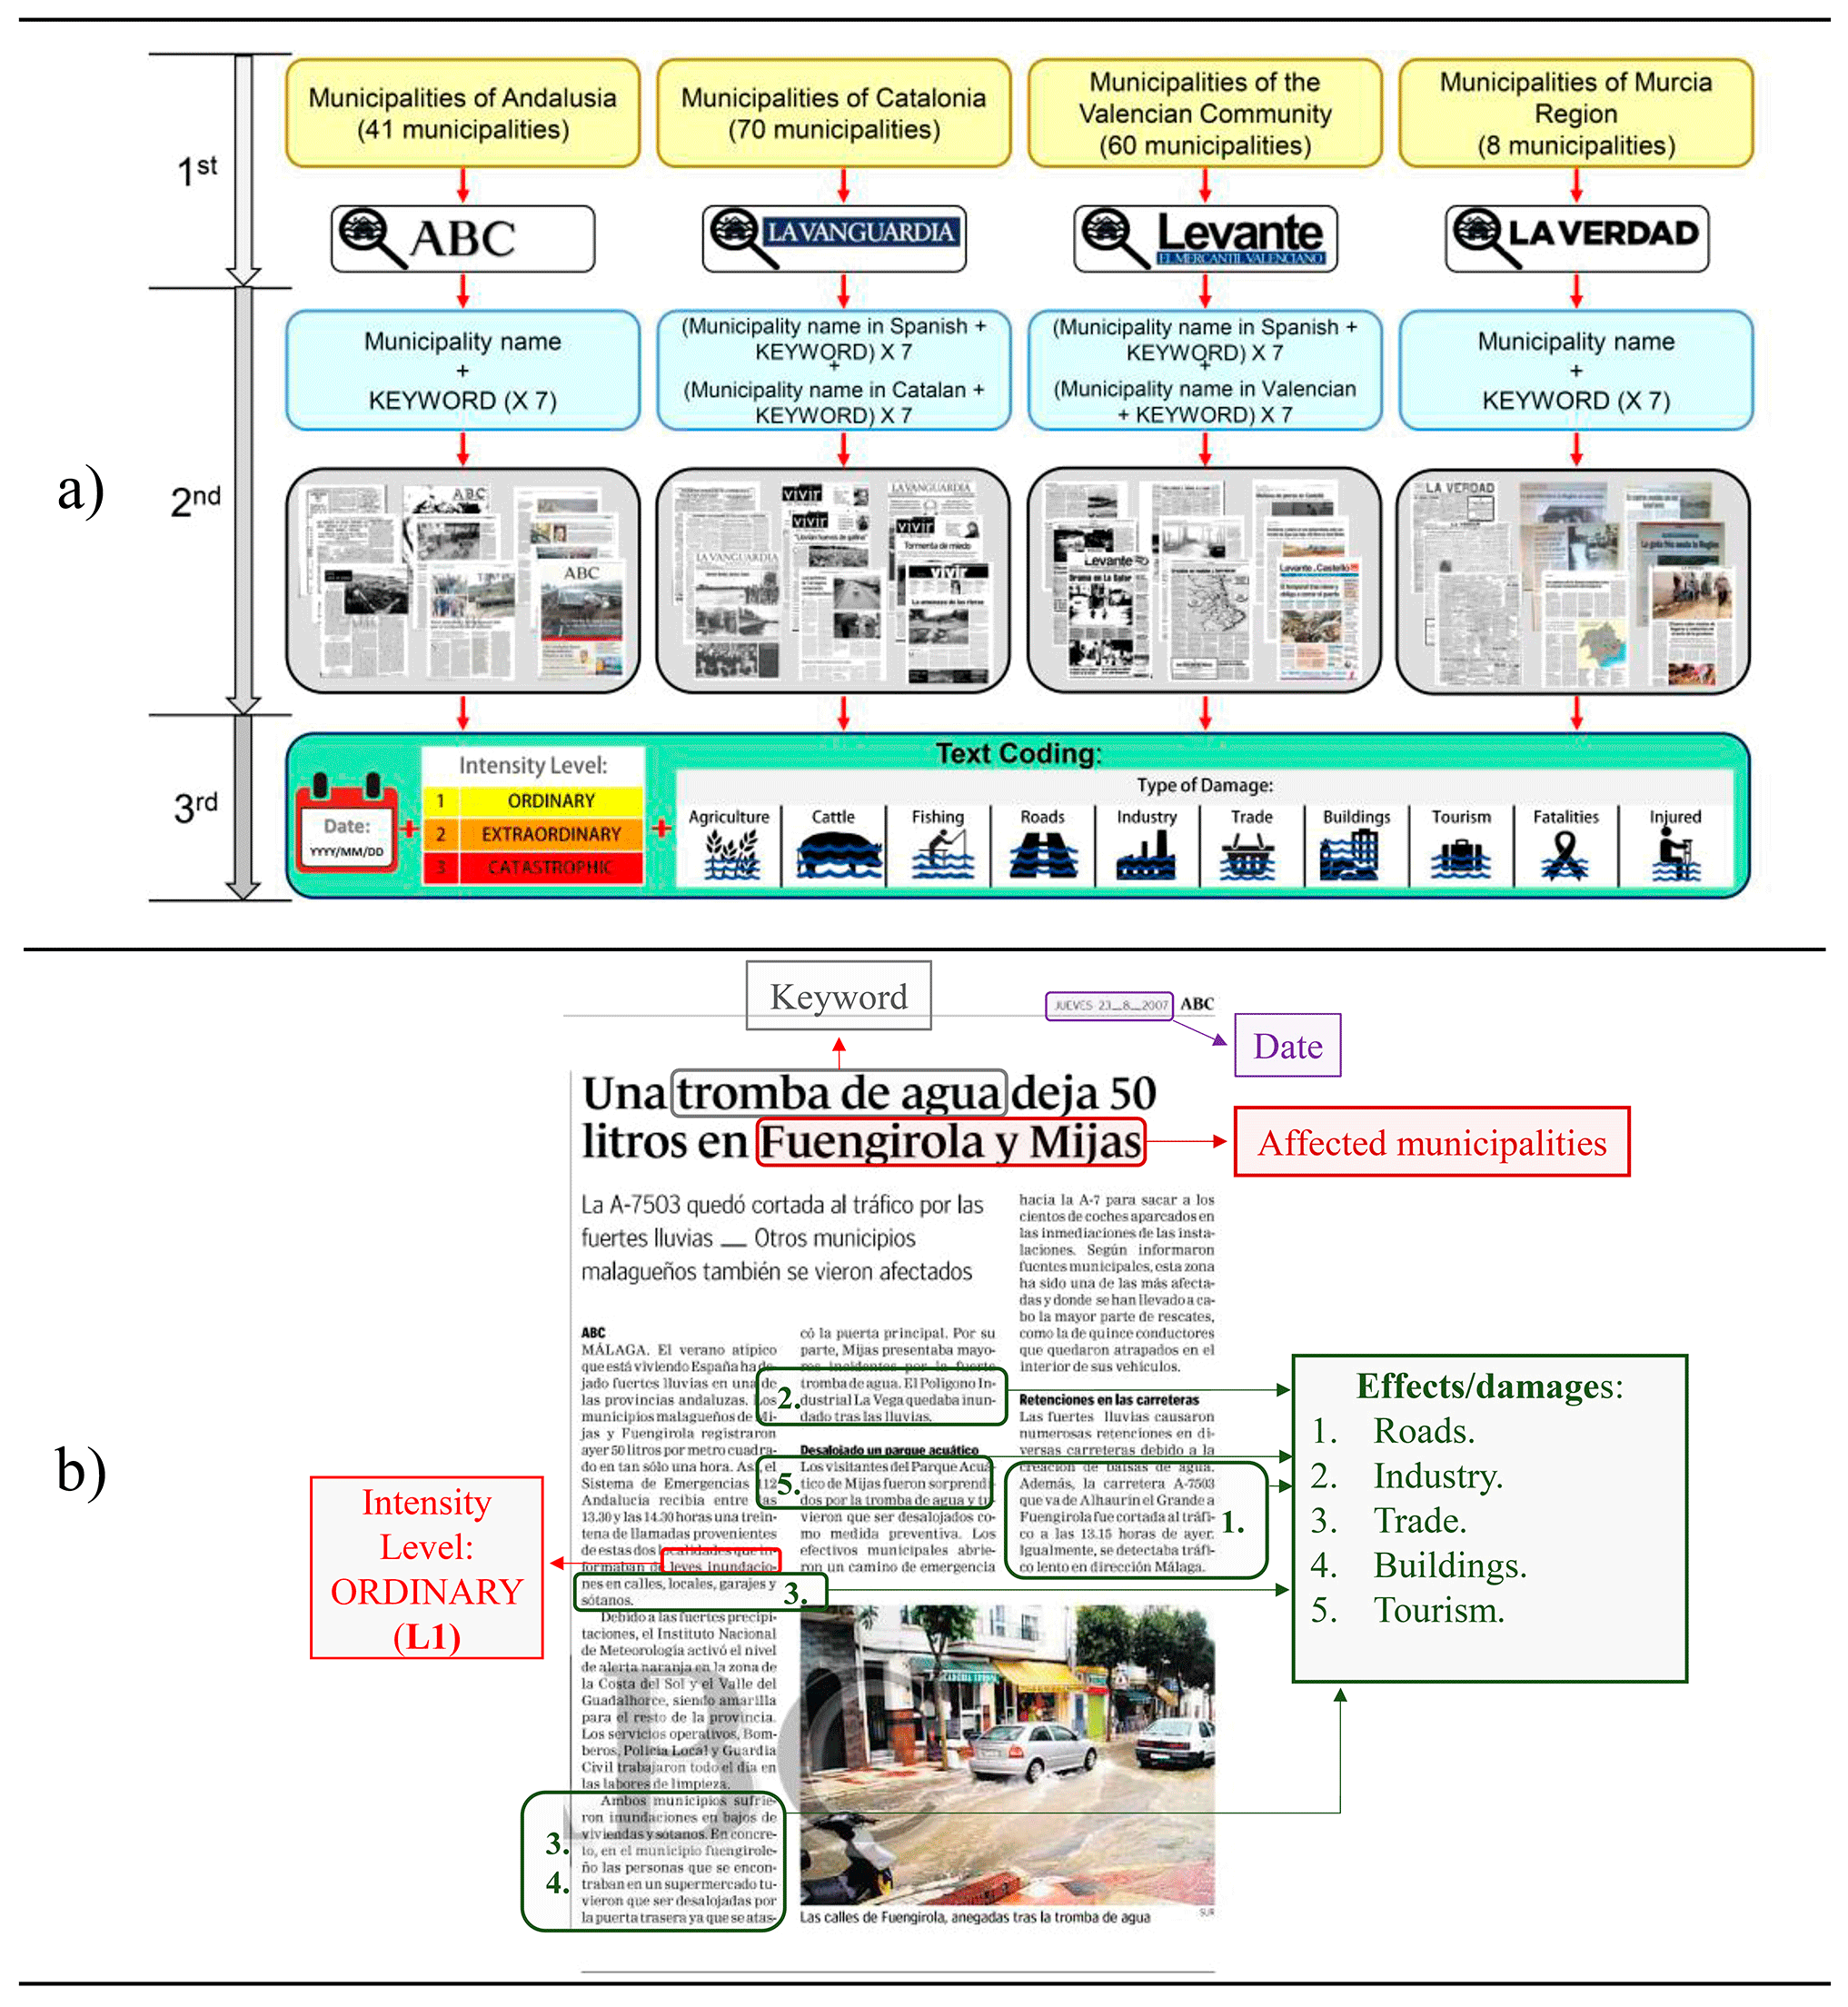
Figure 2Method of cataloguing news, step by step (a), and example of the coding system for the news (b). (b) Source: ABC newspaper, news of 23 August 2007.
The next step involved transforming qualitative information into quantitative information (see Fig. 2a). To this end, we consulted all the news filed and proceeded to code the news text onto spreadsheets. Digitizing the news pages by means of optical character recognition (OCR) substantially facilitated this arduous task. Furthermore, the coding complied with the following classification protocol (see Fig. 2b): every flood was assigned its exact date of occurrence (the date of the flood is at least 1 d before the date of the news). Next, the affected municipality or municipalities were defined. Finally, the intensity of each flood was determined according to three levels (Camuffo and Enzi, 1996; Barriendos et al., 2003, 2014; Llasat, et al., 2005):
-
Level 1 (L1) is ordinary flood, a flood without overflow and minor damage.
-
Level 2 (L2) is extraordinary flood, a flood with overflow and major damage.
-
Level 3 (L3) is catastrophic flood, a flood with overflow, general destruction and deaths.
Level 1 floods refer not only to cases of ordinary flooding in river flow, but also to flash floods and in situ floods outside the river's floodplain. For this reason, Level 1 floods are valid for reporting variability in climate (changes in rain patterns) and social factors (changes in exposure or vulnerability) (Llasat et al., 2016), though they are not valid for reporting the hydrological variability of rivers. Accordingly, some works that analyse the hydrological variability of the rivers exclude L1 floods from their analyses (Llasat et al., 2005). For this reason, we obtained 10 dichotomous variables for indicating the presence (1) or absence (0) of any effects/damage produced by a flood in each municipality. Thus, we categorized the information on the type of damage suffered in a simple manner, always aware of the difficulty inherent in consistently objectifying quantitative information in time and space (Gil-Guirado et al., 2016). These variables that we created give us a rough idea of the scope of damage caused by each flood. Specifically, the damage variables are the following: agriculture, cattle, fishing, roads, industry, trade, buildings, tourism, fatalities and number of people injured.
Furthermore, some ancillary indices and variables have been calculated to characterize flood cases in the SMCM (see Table 2b). The severity index is the sum of damage quantity multiplied by flood intensity for each case, and it provides additional information. As an example, a flood of intensity 2 could produce major damage, but with concentrated effects in agriculture (intensity =2, severity index =2), while a flood of intensity 1 could cause some weak damage but extend to a large number of sectors (for example, roads, tourism, commerce and agriculture) (intensity =1; severity index ). In other cases a flood could be very intense and also affect a large number of sectors, so its final impact is greater than if simply considering the intensity (for example, a flood of intensity 2 that affected roads, agriculture, tourism and trade would have a severity index of 8). Therefore, the severity index offers information that is complementary to the intensity level and the amount of damage.
With regard to the affected area, we have assigned to each flood the area of the municipality where it took place. While we are aware that a flood does not affect a whole administrative area, we consider it to be a good measure for performing comparative analyses at a spatio-temporal scale. Moreover, although a flood does not directly impact the whole municipality, the effects are felt indirectly throughout the administrative territory.
Finally, with the results of the SMC-Flood database, we have conducted a trend analysis to ascertain whether flood cases and their intensity have increased or decreased over time. The existence or absence of statistically significant trends was determined by the improved non-parametric test of Hirsch and Slack (1984), which is based on the Mann–Kendall range widely used in climatic and hydrological studies. This test gives information on two possible hypotheses: the null hypothesis (H0), indicating that the series does not present a significant trend; and the alternative hypothesis (Ha), indicating a statistically significant trend that may be negative or positive. The chosen level of significance is 95 %. In addition, we calculated Sen's slope, which indicates the bias and size of this trend. Multiplying this value by the total number of observations, we would obtain an approximate value of the mean loss or gain of the variable over the time period.
4.1 SMC-Flood record summary
According to the SMC-Flood database, the SMCM suffered 3608 flood cases between the years 1960 and 2015. Of these, 72 % were of an ordinary intensity (Level 1), less than 25 % were extraordinary (Level 2) and slightly more than 3 % were catastrophic (Level 3) (see Table 2a).
Table 2SMC-Flood database summary.
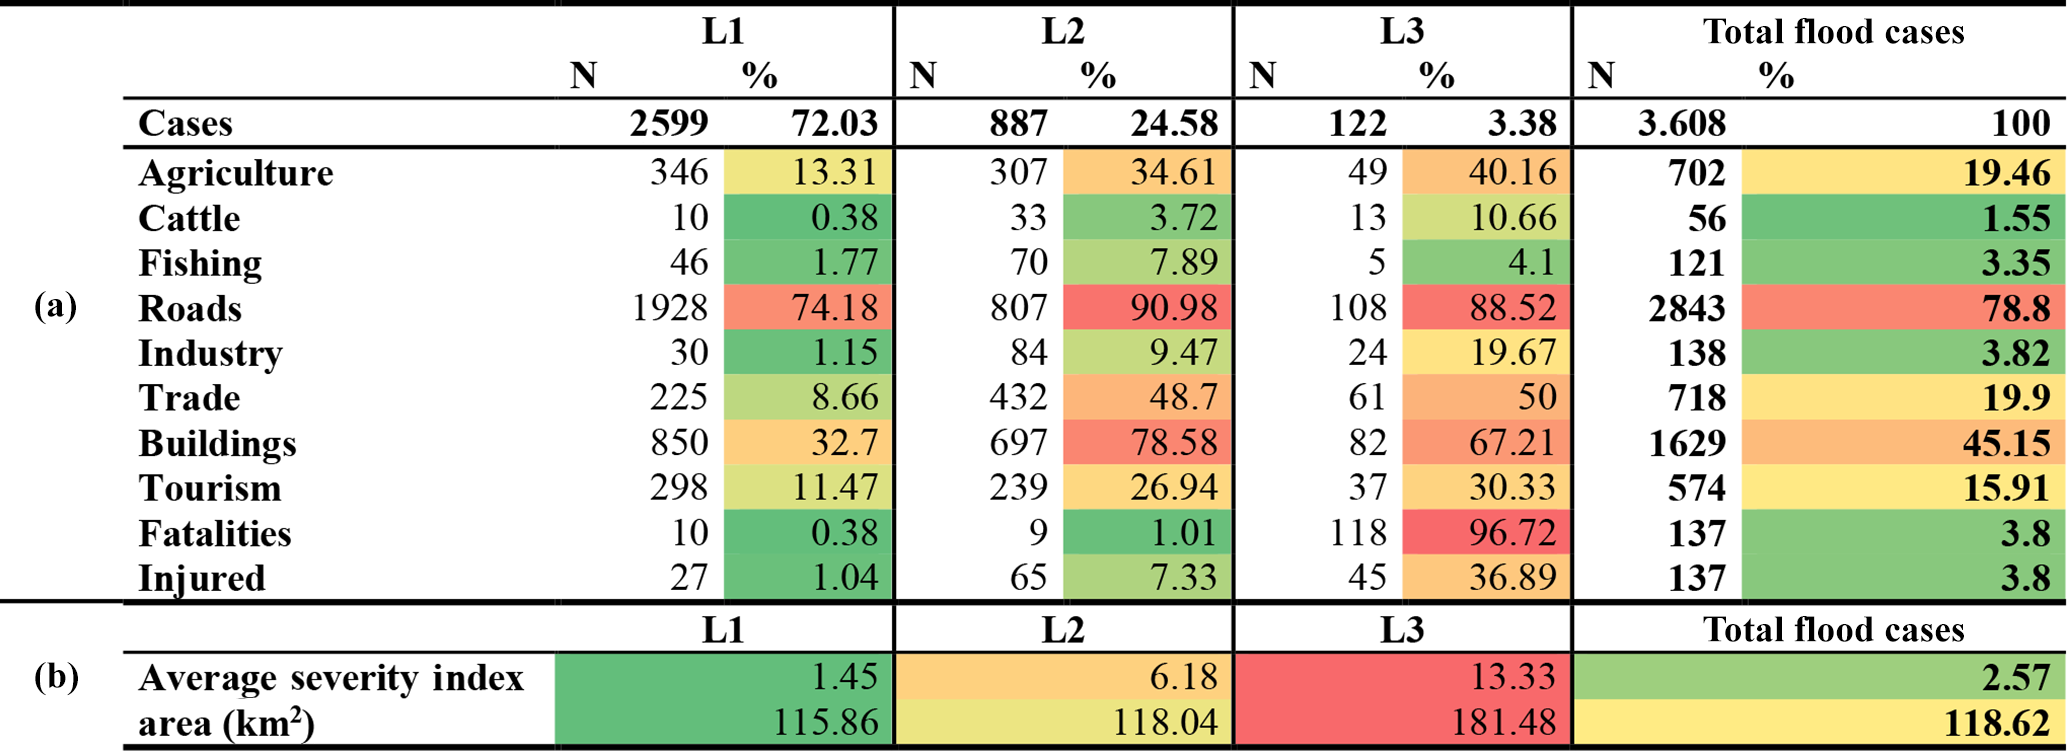
Note: the different colours represent how the values deviate either above (red) or below (green) the 50th percentile (yellow) of the mean type of damage (panel a) or the level of intensity (panel b). * The severity index is calculated as the intensity of a flood multiplied by the sum of the type of damage (sum of the dichotomous variables affected), divided by the number of flood cases (for each intensity level and for the total) such that (Eq. 1) is as follows: .
With regard to the types of damage (see Table 2a), roads (almost 80 %) and homes (45 %) were the variables most affected by flood. Trade and agriculture are also sectors that repeatedly suffer damage (in approximately 20 % of cases). Tourism is another sector that suffers the impact of flood cases (16 %). However, there are important differences in the types of damage, depending on the level of intensity. In general, the amount of damage increases with the level of intensity, meaning that the greater the intensity, the more assets and people that are affected. Between intensity Levels 1 and 2, the greatest increases occur among residential properties (almost 80 % of the Level 2 flood cases involve damage to homes) and trade (almost half of Level 2 flood cases involve impact on trade). These two types of damage are interrelated insofar as the overflow of the water body affecting residential properties also affects trading establishments, which are generally located in the lower part of the buildings. Also notable are the increases in impacts on agriculture and trade. Regarding the changes between the damage produced in Level 3 flood cases and those of other levels, the most notable is the increase in the direct effects on people's health (fatalities and injured). In fact, almost 100 % of Level 3 cases involve human victims, such that the main criteria of the classification method consider that a flood having caused victims is a fundamental factor for considering it Level 3. In general, catastrophic flood cases are characterized by the fact that they affect the whole economic and social fabric of a community.
Regarding the affected area, in the SMCM the mean municipal area affected by a flood case is 119 km2. However, this value rises alarmingly as the intensity level of flood cases increases.
4.2 Spatial variability of flood cases
A detailed view at the municipal level reveals the existence of hotspots in the number and intensity of flood cases (see Fig. 3). Areas of high average intensity are found along most of the coast of Andalusia and, occasionally, in some sectors of the provinces of Gerona and Tarragona (for each municipality or province, the average intensity is the result of dividing the sum of the intensity levels of total flood cases by the total flood cases in this municipality or province). In fact, of the 20 municipalities with the highest average intensity, 12 are in Andalusia and seven in Catalonia. Regarding the areas with the highest numbers of flood cases, it is necessary to differentiate between two types of areas: (i) large urban conurbations (Barcelona, Valencia, Málaga and Alicante) and (ii) coastal spaces that highly specialize in tourism (north of the province of Tarragona, in the province of Castellón, south of the province of Valencia and north of the province of Alicante). However, the most outstanding aspect is an opposing latitudinal gradient: whilst the average intensity of flood cases increases as we go further south, their number increases in the opposite direction. Thus, considering the combination of intensity and frequency, the metropolitan area of Málaga stands out as the most threatened area.
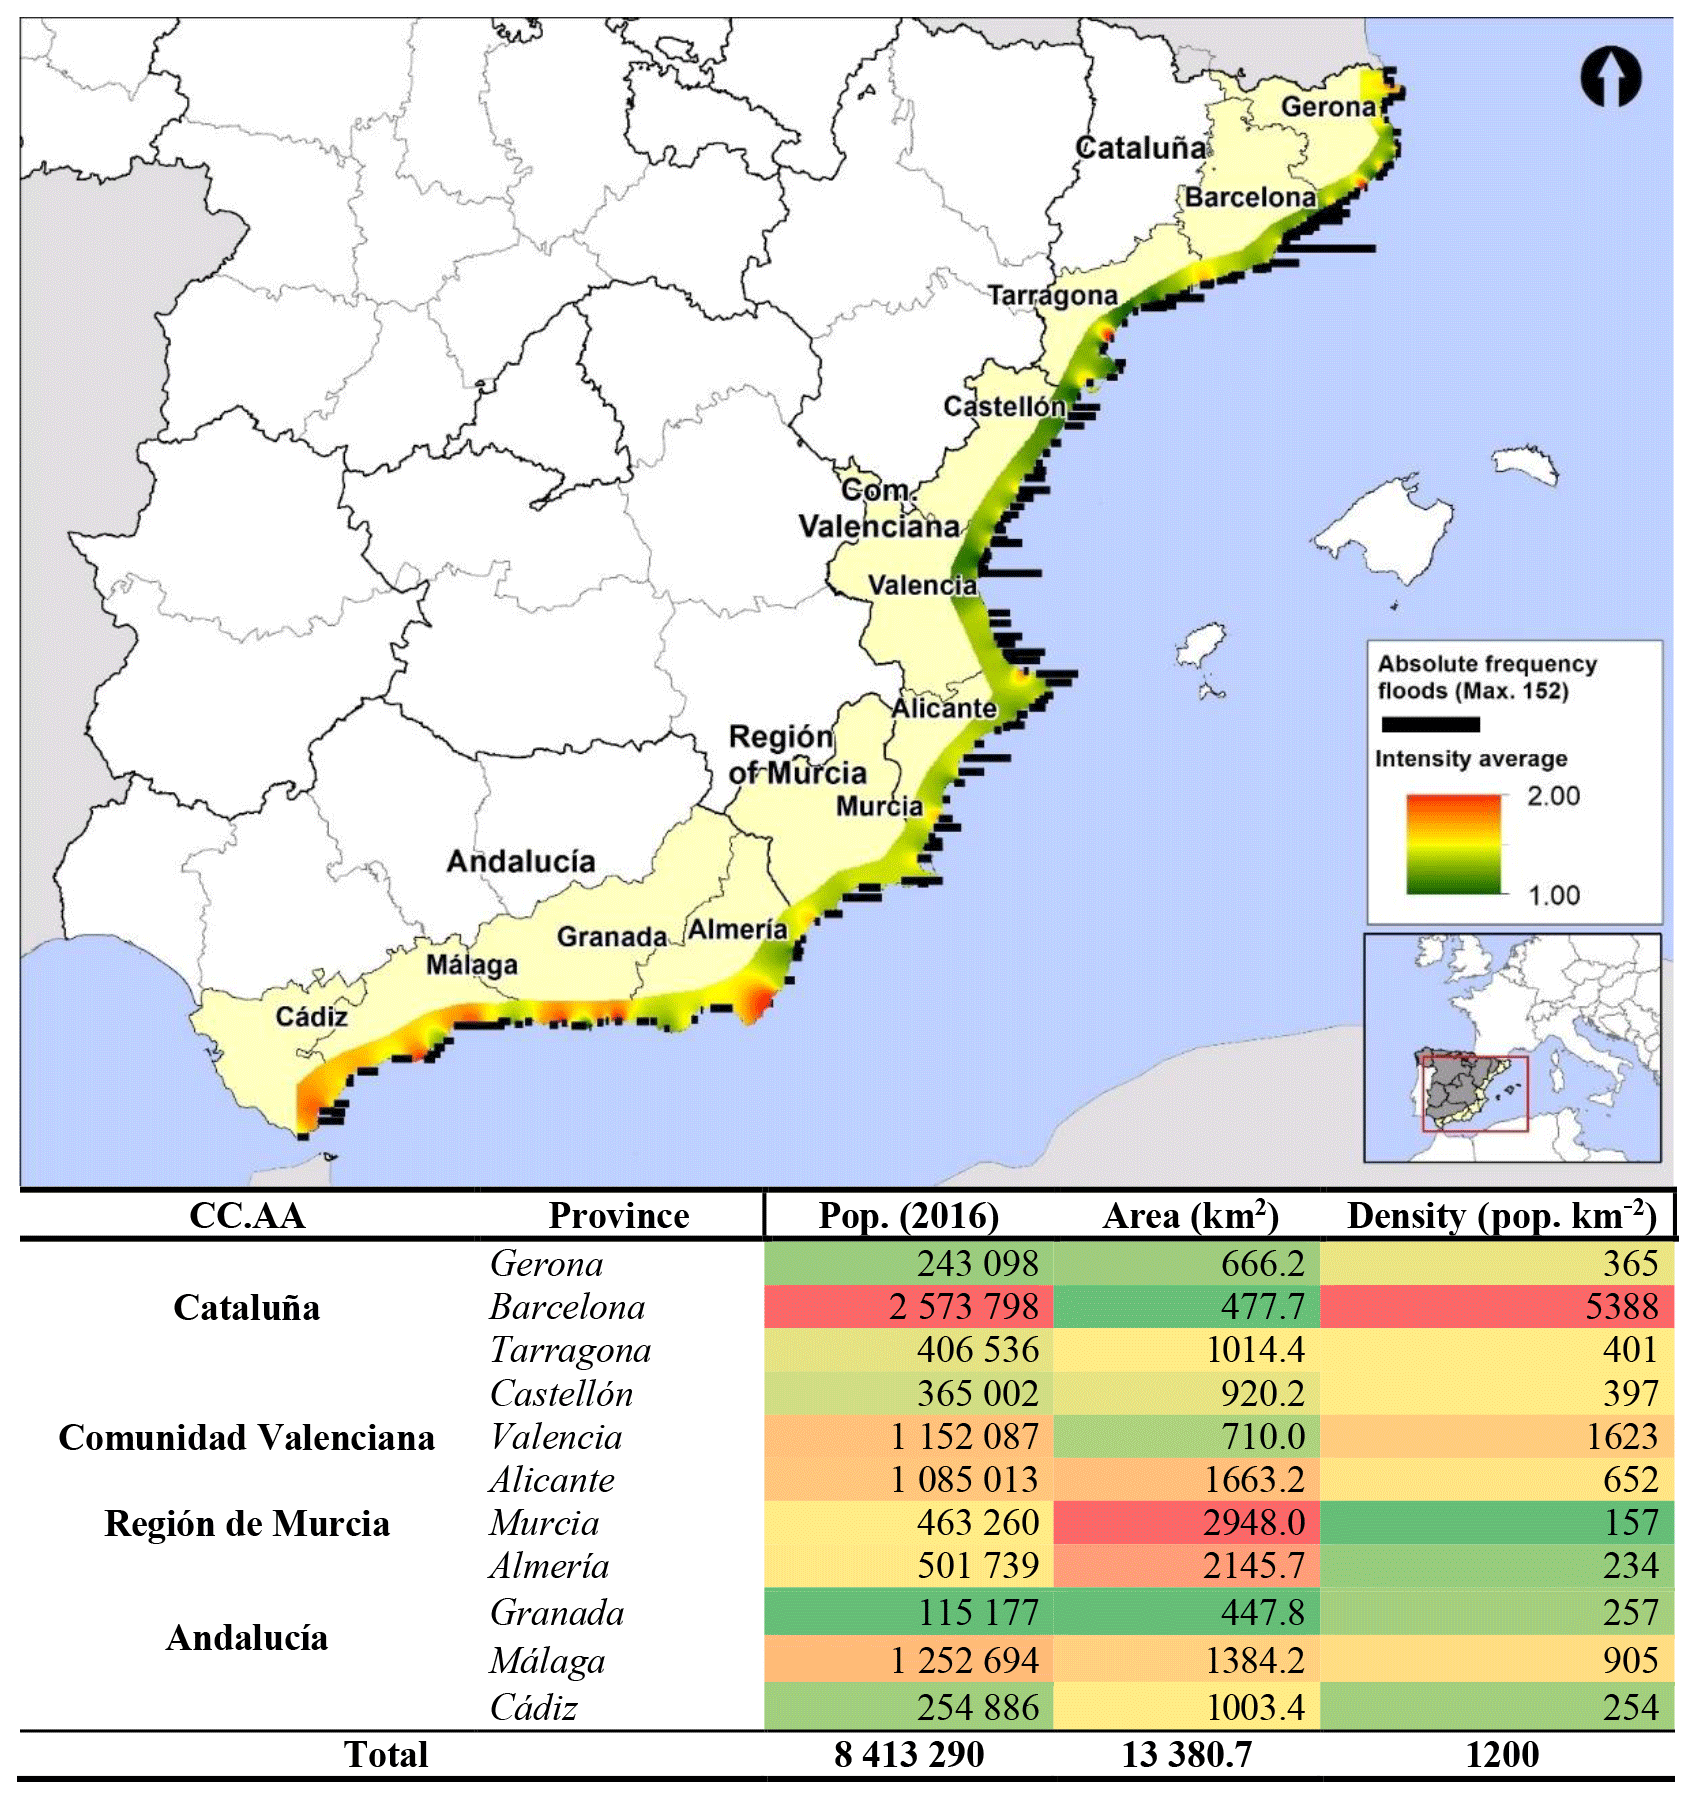
Figure 3Intensity average and total flood cases by municipality and Spanish Mediterranean coastal municipalities, spatial summary.
The map shows in different colours the average intensity of flood cases in each municipality, and the black bars represent the total number of flood cases in each municipality.
The table reports the total population, the total area and the population density by province. The different colours represent how the values deviate above (from yellow to red colours) or below (from yellow to green colours) from the 50th percentile within the mean values of the variables (population, area and density); source: INE (2018).
Table 3Spatial flood patterns in SMCM.
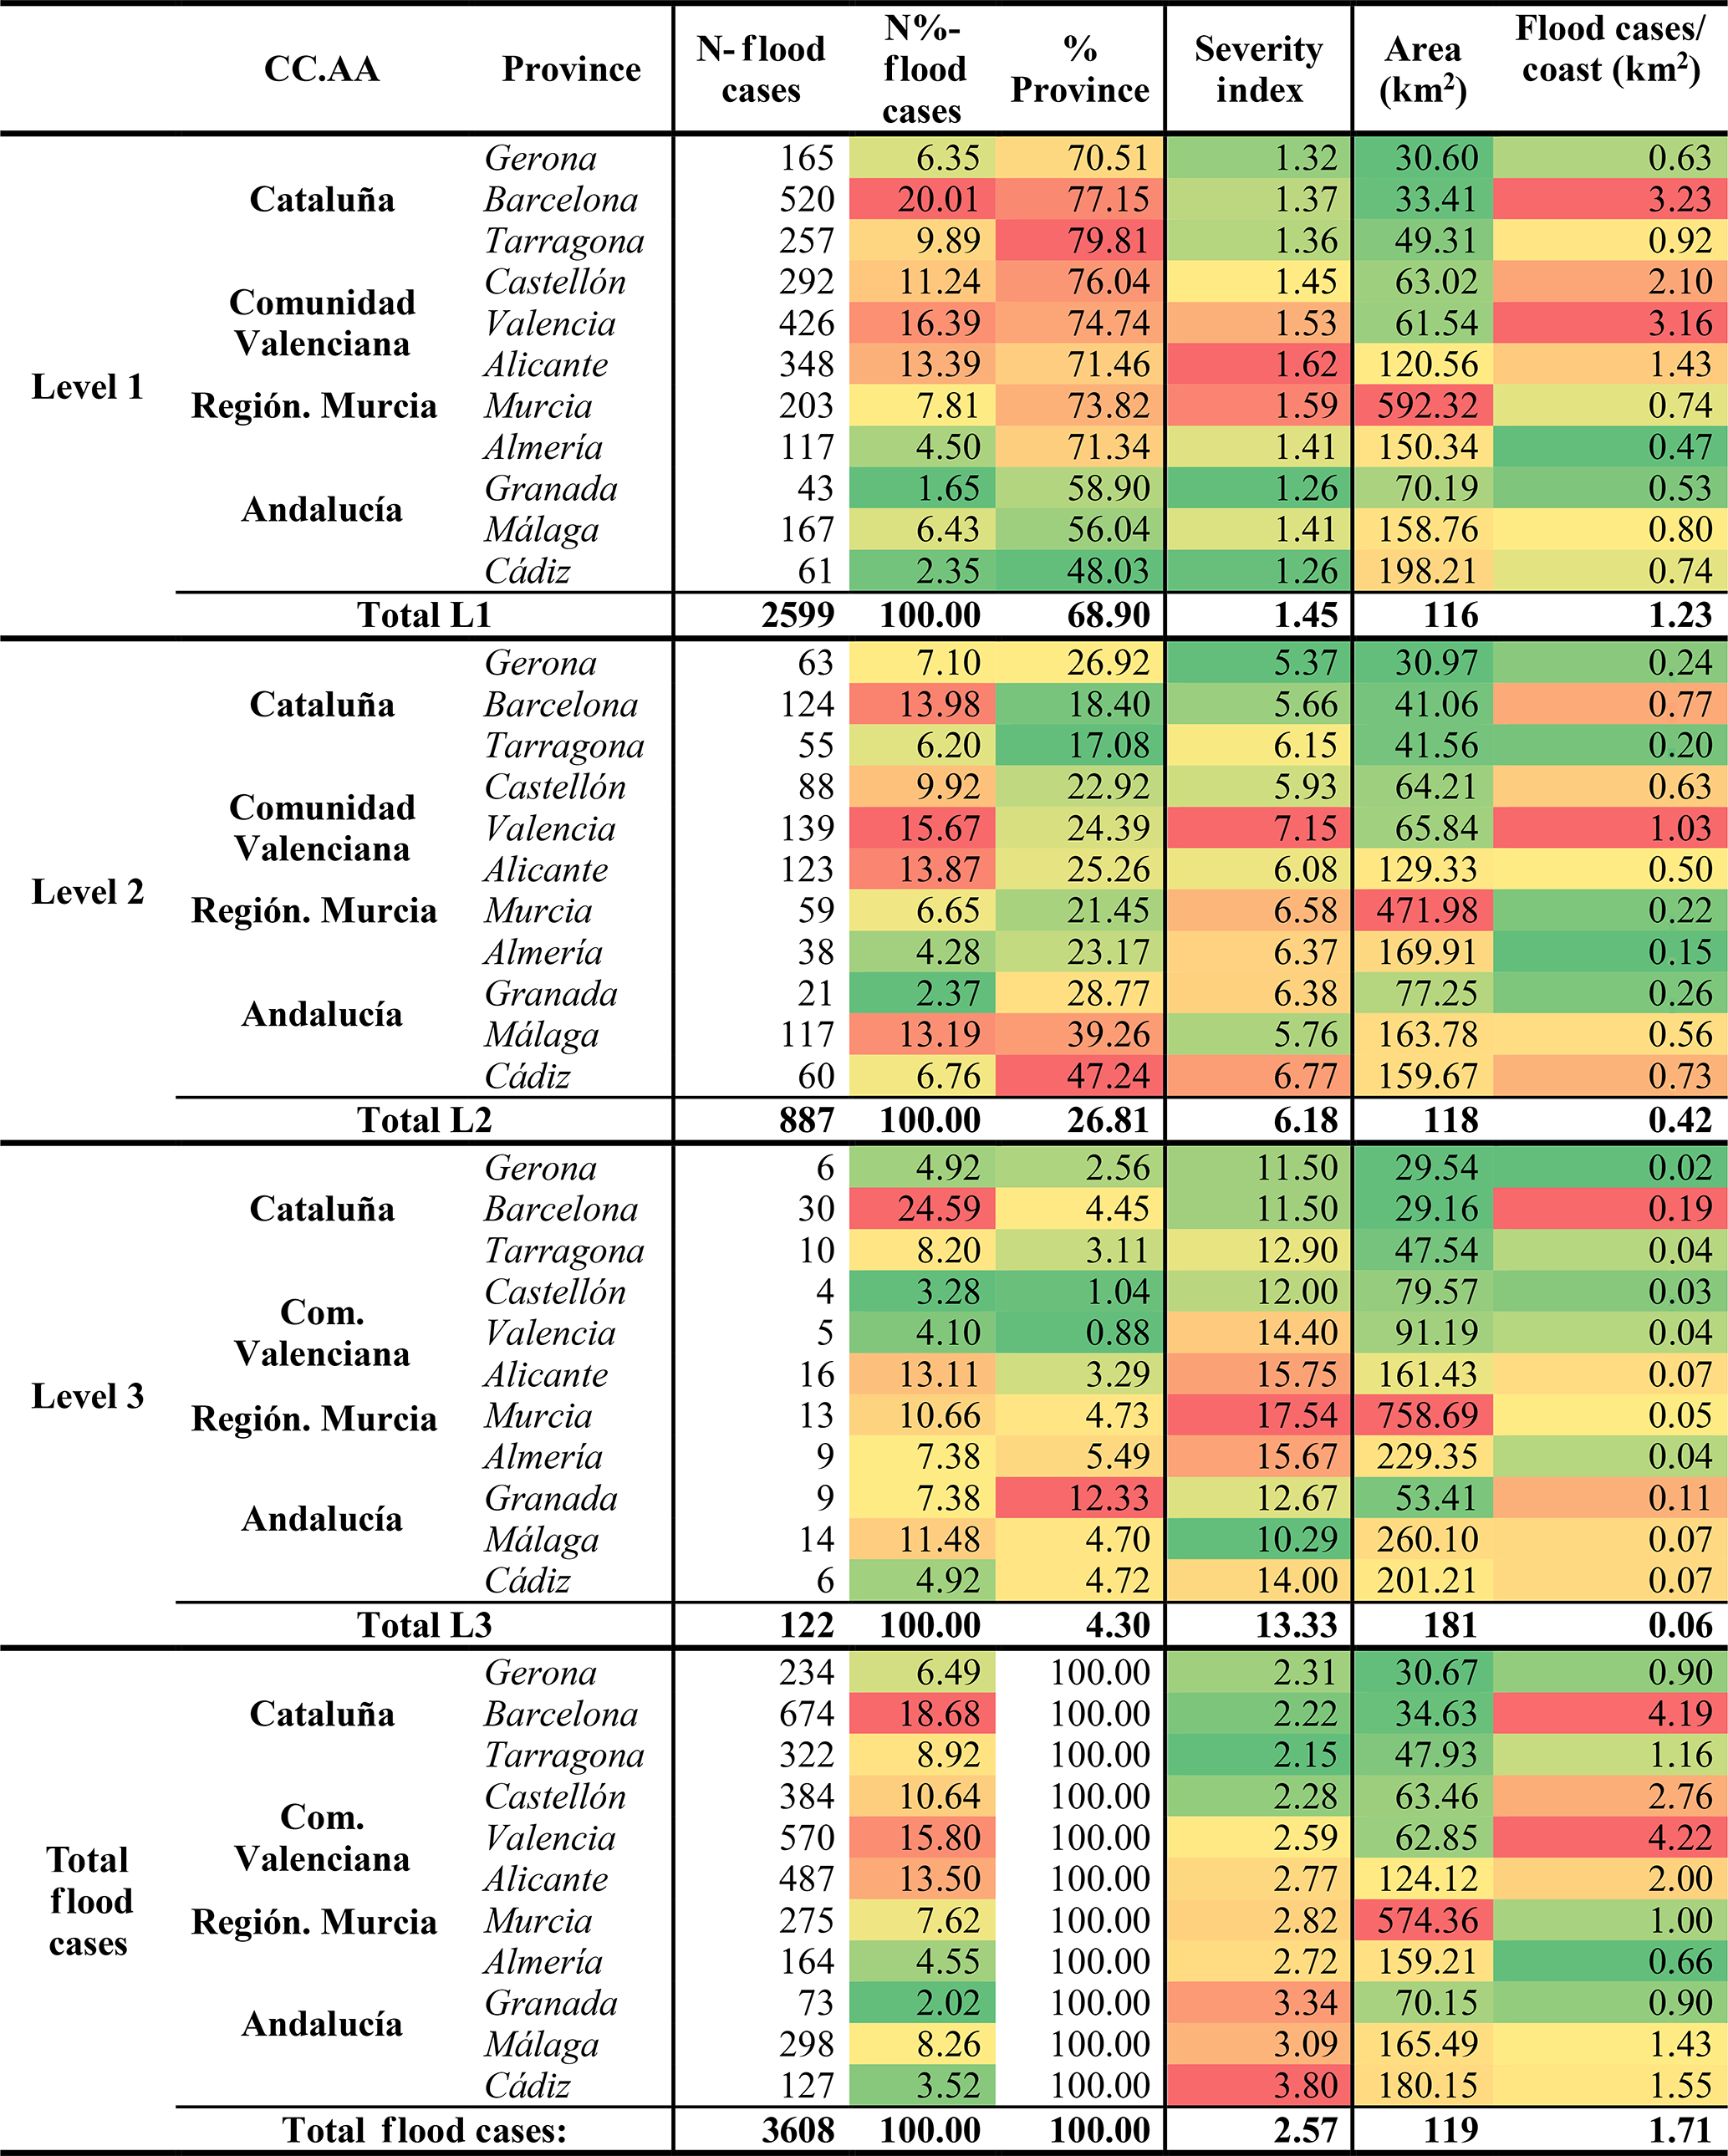
Note: N-floods cases indicates the number of flood cases in each province between 1960 and 2015. N%-flood cases reflects the percentage of the total flood cases that correspond to each province. % province indicates the percentage of the total flood cases in each province that corresponds to each intensity level. Severity index reflects this value for each province and for each intensity level. Area (km2) and floods cases/coast (km2) show, respectively, for each province the area (km2) affected and flood cases which, on average, affect each kilometre of coast. The different colours represent how the values deviate, above (red) or below (green) the average (yellow) of each variable (intensity level and total).
Analysing the variability of the data aggregated at the provincial level confirms some of the spatial patterns detected (see Table 3). The average area affected by each flood is directly related to the differential size of the municipalities in each province. In this respect, it is appropriate to point out that the average size of the municipalities in the province of Murcia is larger, which is reflected in the fact that flood cases have a greater spatial impact in this province (each flood case in Murcia affects an average of 574 km2, compared to an average of 119 for the whole study area). As for the province of Alicante, a latitudinal change takes place in the form of floods affecting larger areas, which may also be due to climatic factors, governance or the average size of the municipalities. On the other hand, the quantity of flood cases that occur in each province bears a direct relationship with the size and density of the exposed population (see Table in Fig. 3). This latter detail is especially important in the highly developed provinces (Barcelona, Valencia and Alicante). These provinces, together with Castellón, are those that support a higher number of flood cases per kilometre of coastline, and they confirm the latitudinal gradient detected. This uneven N–S distribution is noticed in the intensity of flood cases; i.e. the further south we go, the higher the proportion of Level 2 and 3 flood cases, compared to Level 1. Likewise, this is evidenced by the severity index, the expression of which is even clearer. Therefore, we can affirm the existence of a spatial pattern in both intensity and damage moving in a southerly direction. In this regard, between the severity index and the latitudinal gradient (the provinces ordered correlatively from north to south), there is a Pearson correlation of 0.91 with a significance level of 95 %. Furthermore, the correlation between the percentage of L1 flood cases and the latitudinal gradient is −0.81. For the L2 flood cases, the correlation is 0.73. Both cases have a significance level of 95 %. This tendency may be related to the adoption of more efficient flood control measures in the northern provinces (the Catalonia and Valencia), owing to their early tourism and economic development. Likewise, an explanation can also be found in the climatic factor, as the rains are more torrential in the southern provinces (Martín-Vide, 2004). However, given the clear differences between provinces in the same autonomous community, we cannot avoid considering the economic and institutional factors since other studies have detected growing institutional vulnerability following the aforementioned latitudinal gradient (López-Martínez et al., 2017).
4.3 Seasonal flood case variability over the SMCM
Flood cases that affect the SMCM have considerable seasonal variability with regard to number and intensity. As is to be expected from the climatic conditions (Barredo, 2007; Barrera-Escoda and Llasat, 2015), the majority of flood cases (58 %) take place during the autumn months, especially in October as a result of the recurrent “cold pool” that affects the region. Furthermore, flood cases become more highly concentrated during this season as the intensity increases (55 % of Level 1, 65 % of Level 2 and 74 % of Level 3). Therefore, autumn (September–November) is the season with the most danger of flooding in terms of both quantity and intensity. Autumn is followed by winter (December–February), summer (June–August) and finally spring (March–May) (Fig. 4a). However, there is little difference between the intensity of the autumn and winter flood cases (Fig. 4b) (mean intensity of 1.34 in the case of winter compared to 1.36 during the autumn). On the other hand, in spring and especially summer, the average intensities are lower (mean intensity of 1.22 and 1.16, respectively). The high intensity of the winter flood cases is probably related to the type of atmospheric situation that generates these floods and which usually leads to large accumulations of rainfall over several days (Muñoz-Diaz and Rodrigo, 2004). Related to this point, successive studies within this same project will analyse the climatic patterns in depth.
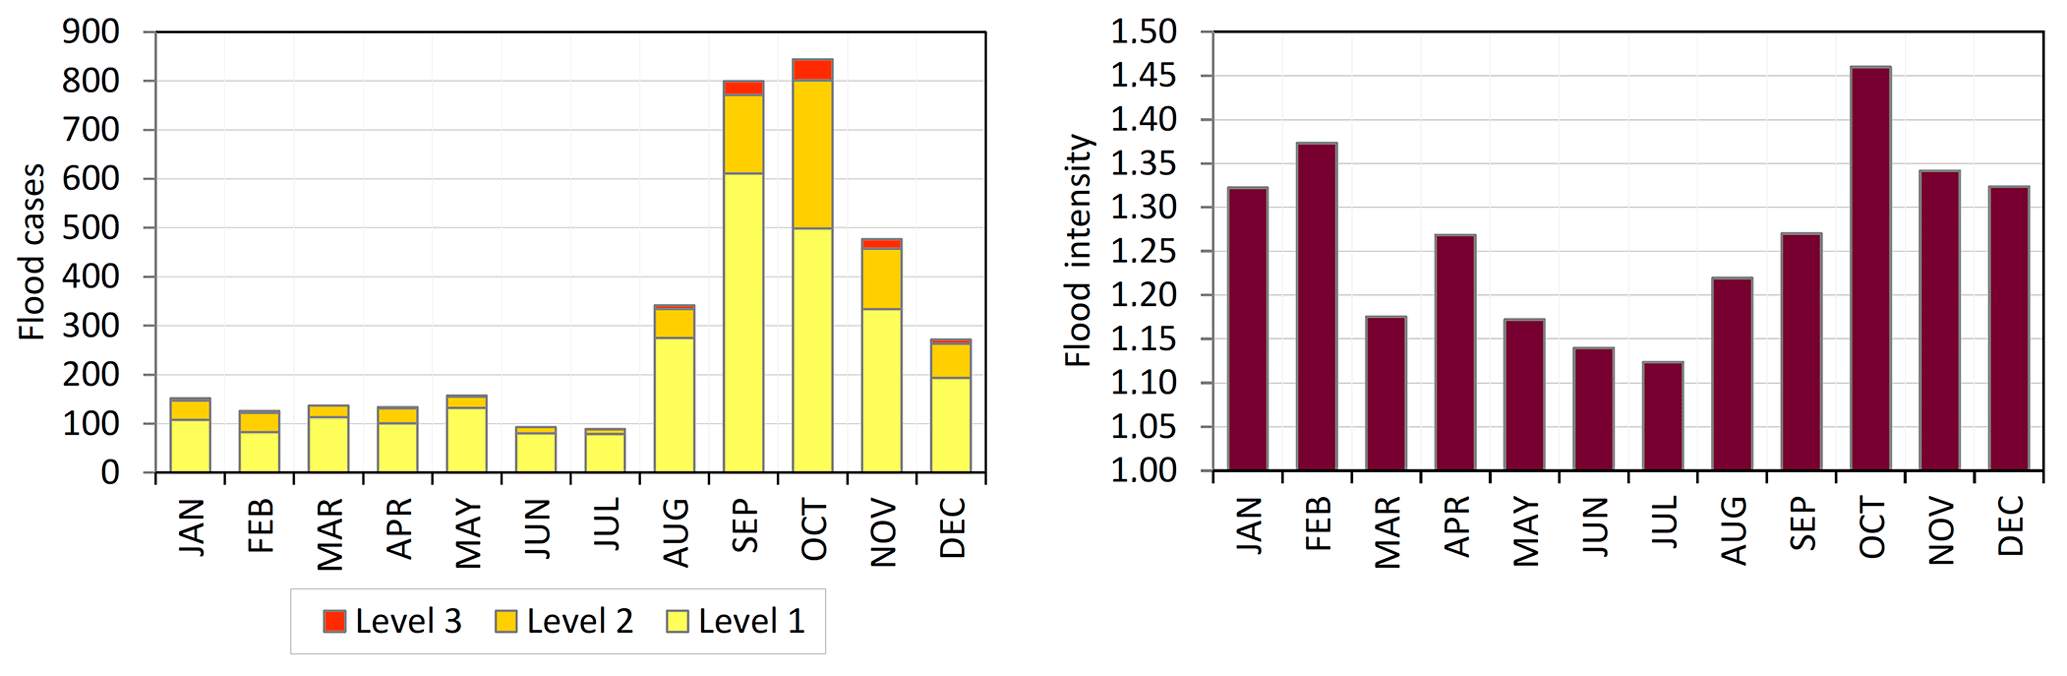
This seasonal variability presents notable differences between provinces (see Fig. 5). Regarding the number of flood cases among the provinces of the east coast, the autumn seasonal pattern mentioned above is reinforced while in the southern provinces autumn becomes less prominent compared to winter, which is the season with a greater concentration of flood cases. This reveals a rainfall pattern associated with intense rains owing to the variability of the polar front (Muñoz-Diaz and Rodrigo, 2004), which especially affects the provinces in the southwest part of the study area. However, these provinces are also not exempt from being impacted by the frequent synoptic situations associated with the same easterly flow that affects the rest of the study area.
A similar spatial distribution can be observed in the average monthly intensity per province. In the provinces of Granada and Málaga, the autumn flood cases present the highest intensity values in the study area. However, unlike the frequency, the distribution pattern is less clear. The autumn and winter months coincide in more intense flood cases, mainly in the provinces between and including Castellón and Granada. However, in the provinces of Gerona and Cádiz, the mean intensity is higher in the winter months. Finally, in the provinces of Barcelona and Tarragona, late summer flood cases are also significantly frequent. This observation is consistent with those in previous works on these provinces (Llasat et al., 2013a; Gilabert and Llasat, 2018).

Figure 5Spatial variability of flood case frequency and average intensity in SMCM by province.
4.4 Type of damage variability
The type of damage also presents notable spatial variability. With regard to the total number of types of damage per province (Fig. 6a), the size of the exposed population is the main factor. In fact, the provinces with higher populations (Barcelona, Valencia and Alicante) are those that report a higher number of types of damage (Fig. 6a). However, if we consider the average quantity of type of damage reported per flood case by province, we observe that the average amount of type of damage increases in a north–south direction. In this way, the average amount of type of damage also shows a latitudinal gradient in a north–south direction. In other words, the provinces to the north of Valencia report an average amount of type of damage per flood that is lower than 2, while from Valencia towards the south this value is higher.
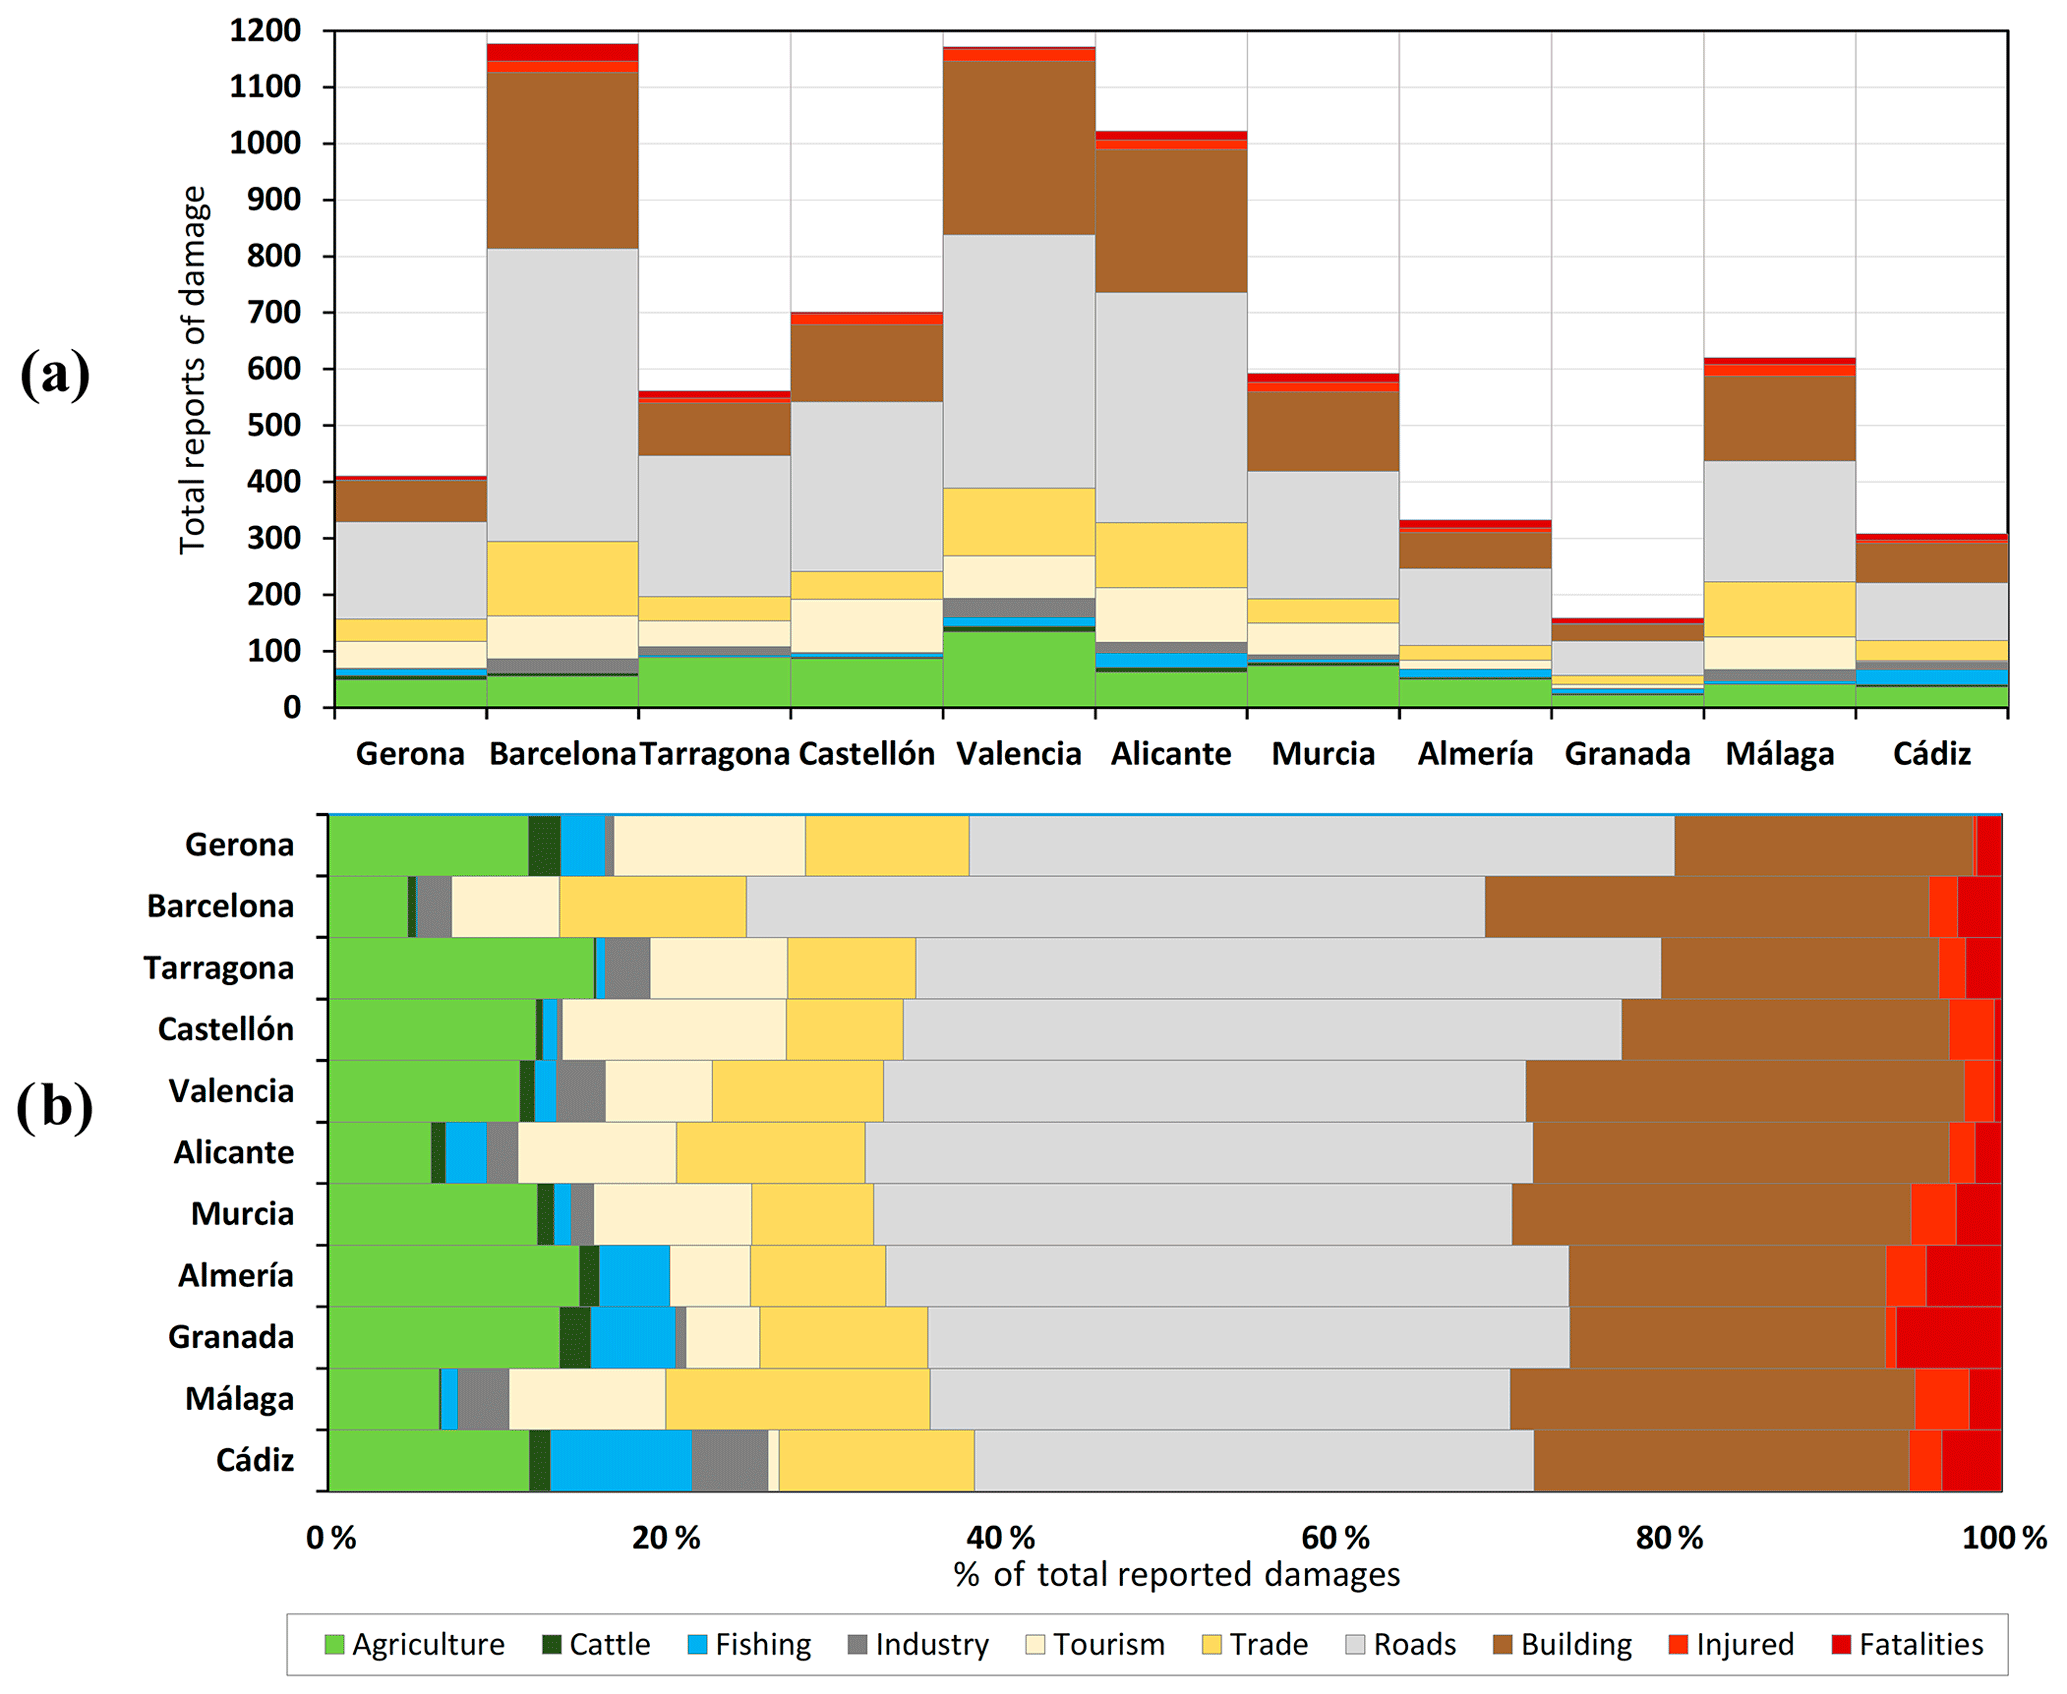
Figure 6Types of damage by province. Panel (a) shows the total types of damage per province. Panel (b) gives the reports of damage per type, as a percentage of the total type of damage in each province.
With regard to the different types of damage per province (Fig. 6b), the highest quantity of reports of damage affects roads and buildings, the sum of which represents over 60 % of all the types of damage reported. In the case of roads, riverbeds in the study area are for ephemeral purposes and therefore a large part of them can be crossed by roads without bridges or even used as communication routes between the headwater and mouth areas. Therefore, it is logical that most of the reports of damage pertain to roads. Regarding damage to buildings, if we consider that floods are a natural risk that affect societies (Bates and Peacock, 1987; Tapsell, et al., 2002), damage to buildings is perceived to be one of the most significant impacts on societies (Nadal et al., 2009).
The provinces of Barcelona, Alicante and Málaga are highly developed and specialized in the service sector and tourism, which is why types of damage related to the primary sector are low. However, in the provinces of Tarragona, Almería and Granada, where the agricultural sector continues to have an important comparative economic weight, the types of damage in this sector are considerable.
Lastly, an analysis of the type of damage reveals the same latitudinal gradient, which this time is indicated by the record of injured persons and fatalities. As we head further south, there is an alarming increase in the percentages of these variables: from 3 % on average between Gerona and Alicante to 6 % between Murcia and Andalusia.
4.5 Evolution and trends of flood cases
The flood cases in the SMCM present an annual variability in frequency, impact and intensity that is closely related to the variation in the frequency and intensity of precipitation (Martín-Vide, 2004). With regard to the annual mean intensity (see Fig. 7a) from 1960 to 1994, the data were more variable and extreme. In fact, the 10 years with the greatest average intensity took place during that period. Furthermore, the five years of highest mean intensity were, respectively, 1973, 1987, 1962, 1965 and 1961. However, it is important to emphasize that the mean annual intensity presents a statistically significant negative trend, i.e. the average intensity of flood cases descends during the period analysed. Likewise, even though the severity index during the first 5 years of the 1960s was particularly high, their average annual value also presents a significant negative trend. According to the severity index rank, the following years should be highlighted: 1973, 1962, 1987, 1982 and 1964. Some of the highlighted years coincide with the most catastrophic floods occurring in the study area (1973, 1962 and 1987) in the last century.
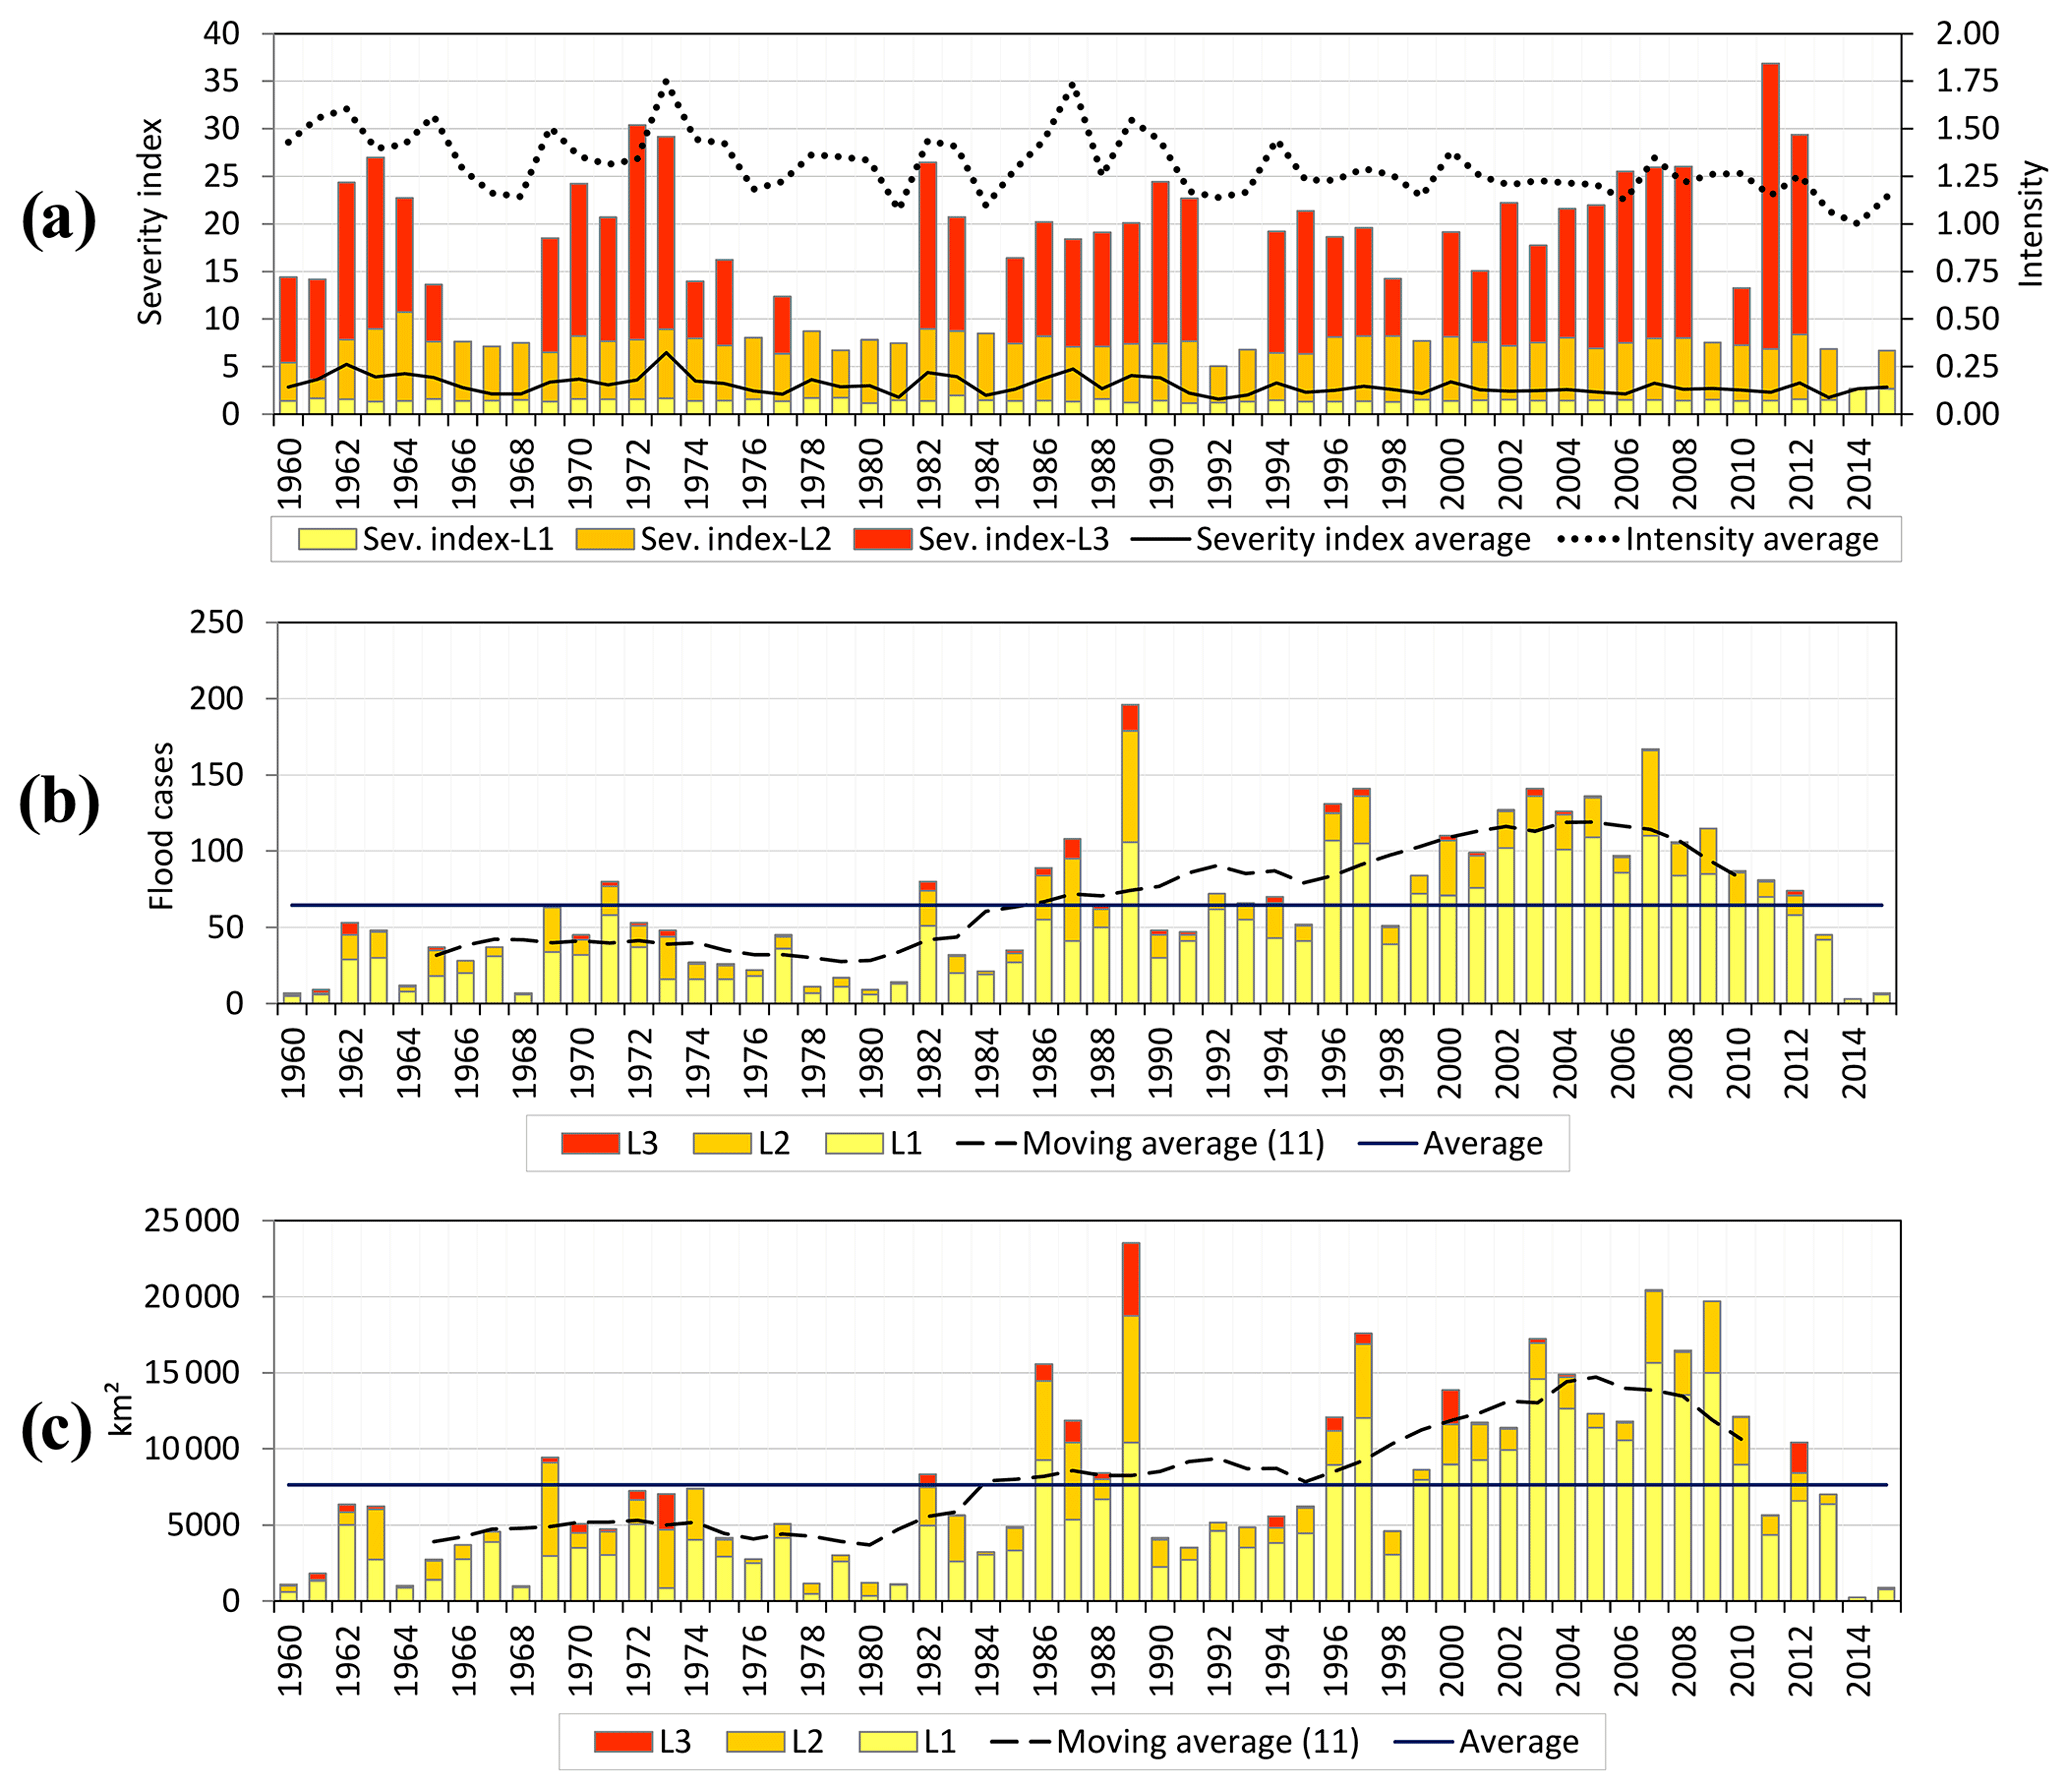
Figure 7Temporal variability of the intensity, severity and spatial impact of flood cases in the SMCM.
With regard to the annual frequency of flood cases (see Fig. 7b), an increase is observed since the 1980s and, especially, since 1996. Since then, the number of flood cases for the majority of years is above average. The trend analysis detects a statistically significant positive trend, which reveals that every year flood cases increase by 2.3 % compared to their average value. However, this increase is not homogenous according to the intensity level because the Level 1 and Level 2 flood cases present significant positive trends while those of Level 3 either remain stable or have no appreciable trend. The rising trend is more pronounced in the case of the Level 1 flood cases, which have an annual increase of 2.8 % compared to 1.1 % in the case of Level 2 flood cases. Turco and Llasat (2011) and Llasat et al. (2010) have also found that flood trends over recent decades in Catalonia are due mainly to an increase in urbanization in flood-prone areas near torrential and non-permanent streams.
Lastly, the evolution of the affected area presents variability that is similar to the frequency behaviour of flood cases (see Fig. 7c). The decade of the 1980s coincides with the time when values began to increase. Especially outstanding as disastrous periods are the second half of the 1980s and the decade of the 2000s. However, it is necessary to point out some nuances and differentiations. The total values for the affected area have a positive trend, but if we consider the size of the area affected according to intensity levels, a significant positive trend is detected only for Level 1 flood cases. That is, every year the area affected by flood cases increases by 166 km2 (an increase of 2.2 %). This situation becomes especially notable in the case of Level 1 flood cases, for which the new area affected is 158 km2 per year (a growth rate of 2.9 %).
During the comparable data period (1971–2015), the flood damage database on insured assets of the National Insurance Consortium of Spain (NISS) (Consorcio de Compensación de Seguros, 2019) also shows a positive trend in floods. In this case, it is evidenced by an increase in the annual amount of type of damage filed, i.e. in the amount of money paid in compensation. In addition, peaks in the amount of money paid in compensation detected in the NISS database coincide with the flood cases and impact peaks detected in our database (1987, 1989, 1997 and 2007). On the other hand, the NISS database coincides with our database in indicating the most dangerous months for floods (mainly September and October). However, the different characteristics of these two databases make comparison between its results and utilities difficult. While the NISS database offers aggregated data at the provincial level and refers only to the number of procedures for economic impacts and losses, the SMC-Flood database offers data at the municipal level for the Mediterranean coast and it refers to flood case intensity, severity and type of impact. In this regard, it should be noted that the Spanish insurance legal system does not require insuring one’s home. Therefore, the NISS database could be even more biased than ours, depending on the degree of insurance coverage in the municipalities of the study area (Clavero, 2016). On the other hand, because the National Insurance Consortium database is based on private insured assets, we have limited information on the impact of floods on public goods such as roads. On the other hand, the National Insurance Consortium database is based on private insured assets; for this reason its results have limited information on the impact of floods on public goods such as roads.
The values indicate the annual accumulation per intensity level. The mobile mean of 11 years has been added to temper the variability, as well as the total mean of each variable, in order to identify years with values above or below the mean.
Figure 7a indicates the variability of the annual intensity and severity of flood cases. Figure 7b indicates the variability of the annual number of flood cases. Finally, Fig. 7c indicates the variability of the area affected.
Related to the positive trend observed in the data, Llasat et al. (2016) pointed out that it may be due to the following main factors: (i) climatic issues (a greater recurrence of torrential rain events in the study area) and (ii) the increase in exposure and vulnerability due to the increase in population and economic growth.
Due to the fact that L1 flood cases concern not only river floods but also flash floods and in situ floods, the increase in exposure could take on more importance as the exposed surface in flood-prone areas becomes greater. Thus it is necessary to include the growing surface outside the floodplain (Pérez-Morales et al., 2018), for which the evidence indicates that L1 flood cases have the most clear upward trends.
However, there are other factors that should not be overlooked or dismissed. According to Llasat et al. (2009), it is important to consider that trends may be biased by (i) public opinion having greater sensitivity or perception towards natural risks due to increased newspaper coverage of floods and (ii) a greater spatial coverage of the news as a result of improved communications. Eisensee and Strömberg (2007) also argue that the coverage of natural disasters in the press depends on the availability of other newsworthy material at the time of the disaster. Additionally, there may be some spatial bias in the news based on the newspaper's spatial coverage (Walmsley, 1980). In this regard, the newspapers used in the SMC-Flood database are regional newspapers, which specifically cover the information on each autonomous community analysed throughout the study period. On the other hand, Llasat et al. (2009) show that the subjectivity of the journalist or newspaper can bias the flood intensity level, but not the type of damage. In this regard, the type of damage may be under-documented, but it can rarely be over-documented. However, population increase in the SMCM has been able to influence the increase in flood news for small populations. However, this last point does not imply a methodological bias. On the contrary, the positive correlation between population increase and increase in the number of floods shows that the increase in exposure is mainly responsible for the trends observed in the study area's floods. These results are in line with other works (Pérez-Morales et al., 2018) and are consistent with the general theory of risk, which postulates that risk is a social construction (Bates and Peacock, 1987; Tapsell et al., 2002), and therefore the occurrence of a natural risk depends on there being an exposed population susceptible to suffering an impact.
Table 4Flood case trends in Spanish Mediterranean coastal municipalities in relation to ranges of population increase between 1960 and 2011.
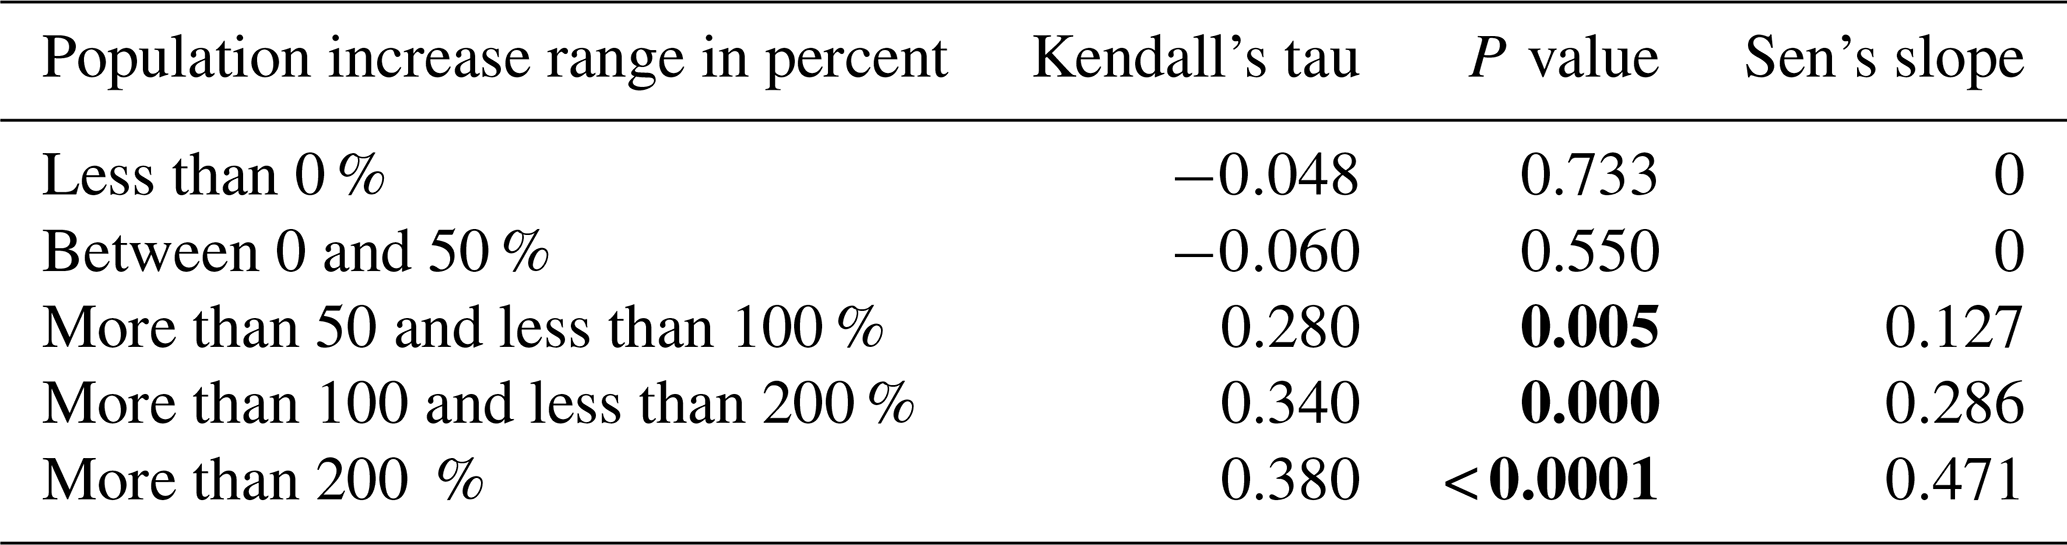
Note: To calculate trends, we used Hirsch and Slack's nonparametric test (1984), which is based on the Mann–Kendall range. The trial version of XLSTAT software (Addinsoft, 2019) was used to calculate it. The Mann–Kendall test provides a level of statistical significance (p value). The chosen threshold of significance was 95 %, which indicates that p values above 0.05 should lead to rejecting the hypothesis of a trend in the series. When the p value is less than 0.05, the trend can be positive or negative. Sen's slope shows the annual change rate in flood cases. That is, the value indicates the annual increase or decrease in flood cases. The p values less than 0.05 are highlighted in bold in the table.
The positive correlation between population increase and increase in the number of flood cases can be observed when we analyse the flood case trends according to population growth. In making this analysis, we observed that the greater the population increase in the municipalities between 1960 and 2011 (the two extreme census years of the study period), the greater the significance and intensity of the trend. In the following table (Table 4), it can be observed that no significant trend in flood cases exists for the set of municipalities where population has grown less than 50 % between 1960 and 2011. However, flood cases have a statistically significant trend in municipalities that have grown more than 50 %. The interesting thing is that the rate of increase in flood cases becomes greater as population growth becomes greater. In spite of all the above, the social factors involved in flood processes generate such complexity that we are unable to rule out the above-mentioned possible biases in the observed trends.
In this paper we present the initial results of the SMC-Flood database for the Spanish Mediterranean coastal municipalities between 1960 and 2015. This database provides information on local flood cases with information on affected area, intensity, severity and type of damage. The results have enabled reconstruction of 3008 flood cases that affected all the municipalities studied during the last 55 years.
Exploiting the database has made it possible to obtain a series of values that provide evidence of trends which reveal the socio-environmental dynamic. In this respect, the type of damage shows that the major impacts occur on roads, buildings, agriculture and trade. Furthermore, the mean municipal area affected by a flood case is 119 km2. In general, the months that pose the greatest hazard with regard to the number of flood cases and their intensity are the autumn months, although the winter is also a highly hazardous season.
The detailed spatial analysis has allowed us to identify a series of black spots where the intensity of flood cases and the amount of damage are very high (especially on most of the coast of Andalusia and in some areas of Gerona and Tarragona). Furthermore, there are places with large populations that are exposed, which in turn determines a high recurrence of flood cases.
However, our main contribution lies in establishing the presence of a clear latitudinal gradient that is characterized by more severe, intensive, extensive and damaging flood cases as we move from north to south. This spatial inequality is foreseeably explained by greater deficiencies in the spatial planning of the provinces in the south, although the climatic and orographic factors cannot be ruled out. Under these circumstances the southern areas are the places in need of the best adaptation plans, especially when taking into account that these provinces are also subject to a greater risk of mortality associated with floods.
Lastly, it is important to highlight that the intensity and mean annual severity of flood cases have begun to follow a statistically significant negative trend. That is, on average, flood cases tend towards lower intensity and severity. However, the annual frequency and average area affected by flood cases have experienced a positive trend. Nonetheless, this increase is not homogenous according to intensity level because Level 1 and Level 2 flood cases present significant positive trends while those of Level 3 remain stable. In this respect, a paradox is revealed: although it is certainly positive that the most catastrophic flooding is not increasing, society has become used to a larger frequency and area affected by flooding, even though the current flood management tools (structural and non-structural) could avoid them.
As a final conclusion, the positive trends in the number of flood cases are highly correlated with the increase in the exposed population. Nevertheless, the complexity of social factors involved in flood processes impedes us from ruling out possible biases in the observed trends. Therefore, deeper knowledge is needed on the climatic, geographic and socioeconomic variables involved in flood processes. This will be the objective of successive research projects.
The systematic data of the SMC-Flood database are not publicly accessible because they are currently being used in an ongoing research project. Aggregate data at the provincial level can be obtained by request addressed to the corresponding author.
The study conception and database design were conceived and coordinated by SGG, with the support of APM. SGG has also written the main part of the paper and performed the statistical analysis and interpretation of the results. He also coordinated the integration of the main part of the paper (tables, figures, text and composition). APM coordinated the integration of text between the different drafts. He also wrote parts of the main text, as well as reviewed in depth the different drafts of the paper and the final version. FLM contributed to graphic support. He also reviewed the different drafts of the work and the final version.
The authors declare that they have no conflict of interest.
We thank the newspapers LV and ABC for their open data access policy. Special thanks to the newspapers LVM and EMV for collaborating on this research project by allowing free access to their databases.
This research has been supported by the Spanish Ministry of Economy and Innovation (grant no. CGL2016-75996-R), the Spanish Ministry of Science, Innovation and Universities (“Juan de la Cierva-Incorporación”, grant no. IJCI-2016-29016) and the Interuniversity Institute of Geography (Own funds for review and translation of scientific texts).
This paper was edited by Maria-Carmen Llasat and reviewed by two anonymous referees.
Addinsoft, S. A.: XLSTAT software, available at: http://www.xlstat.com/es/, last access: 23 February 2019.
Adhikari, P., Hong, Y., Douglas, K. R., Kirschbaum, D. B., Gourley, J., Adler, R., and Brakenridge, G. R.: A digitized global flood inventory (1998–2008): compilation and preliminary results, Nat. Hazards, 55, 405–422, 2010.
Ashley, S. T. and Ashley, W. S.: Flood fatalities in the United States, J. Appl. Meteorol. Clim., 47, 805–818, 2008.
Barnolas, M. and Llasat, M. C.: A flood geodatabase and its climatological applications: the case of Catalonia for the last century, Nat. Hazards Earth Syst. Sci., 7, 271–281, https://doi.org/10.5194/nhess-7-271-2007, 2007.
Barredo, J. I.: Major flood disasters in Europe: 1950–2005, Nat. Hazards, 42, 125–148, 2007.
Barredo, J. I., Saurí, D., and Llasat, M. C.: Assessing trends in insured losses from floods in Spain 1971–2008, Nat. Hazards Earth Syst. Sci., 12, 1723–1729, https://doi.org/10.5194/nhess-12-1723-2012, 2012.
Barrera-Escoda, A. and Llasat, M. C.: Evolving flood patterns in a Mediterranean region (1301–2012) and climatic factors – the case of Catalonia, Hydrol. Earth Syst. Sci., 19, 465–483, https://doi.org/10.5194/hess-19-465-2015, 2015.
Barriendos, M., Coeur, D., Lang, M., Llasat, M. C., Naulet, R., Lemaitre, F., and Barrera, A.: Stationarity analysis of historical flood series in France and Spain (14th–20th centuries), Nat. Hazards Earth Syst. Sci., 3, 583–592, https://doi.org/10.5194/nhess-3-583-2003, 2003.
Barriendos, M., Ruiz-Bellet, J. L., Tuset, J., Mazón, J., Balasch, J. C., Pino, D., and Ayala, J. L.: The “Prediflood” database of historical floods in Catalonia (NE Iberian Peninsula) AD 1035–2013, and its potential applications in flood analysis, Hydrol. Earth Syst. Sci., 18, 4807–4823, https://doi.org/10.5194/hess-18-4807-2014, 2014.
Bates, F. L. and Peacock, W. G.: Disasters and Social Change, in: The Sociology of Disasters, edited by: Dynes, R. R., Demarchi, B., and Pelanda, C., Franco Angeli Press, Milan, 1987.
Bouwer, L. M.: Have disaster losses increased due to anthropogenic climate change?, B. Am. Meteorol. Soc., 92, 39–46, 2011.
Brakenridge, G. R.: Global Active Archive of Large Flood Events, Dartmouth Flood Observatory, University of Colorado, available at: http://floodobservatory.colorado.edu/Archives/index.html (last access: 12 May 2018), 2010.
Brázdil, R., Chromá, K., Řezníčková, L., Valášek, H., Dolák, L., Stachoň, Z., Soukalová, E., and Dobrovolný, P.: The use of taxation records in assessing historical floods in South Moravia, Czech Republic, Hydrol. Earth Syst. Sci., 18, 3873–3889, https://doi.org/10.5194/hess-18-3873-2014, 2014.
Burriel, E.: Empty Urbanism: The Bursting of the Spanish Housing Bubble, Urb. Res. Pract., 9, 158–180, 2015.
Camuffo, D. and Enzi, S.: The analysis of two bi-millennial series: Tiber and Po river floods, in: Climatic Variations and Forcing Mechanisms of the last 2000 years, Springer, Berlin, Heidelberg, 433–450, 1996.
Clavero, B. S.: Estadística de la cobertura de los riesgos extraordinarios en España por parte del Consorcio de Compensación de Seguros, Revista de Estadística y Sociedad, 67, 19–25, 2016.
Consorcio de Compensación de Seguros: Estadística de Riesgos Extraordinarios, Serie 1971–2018, Ministerio de Economía y Empresa, Madrid, 2019.
Diakakis, M., Mavroulis, S., and Deligiannakis, G.: Floods in Greece, a statistical and spatial approach, Nat. Hazards, 62, 485–500, 2012.
Eisensee, T. and Strömberg, D.: News droughts, news floods, and US disaster relief, Q. J. Econ., 122, 693–728, 2007.
EM-DAT: The OFDA/CRED International Disaster Database, Brussels, Belgium: Université Catholique de Louvain, available at: http://www.emdat.be, last access: 5 September 2018.
ESSL – European Severe Storms Laboratory: ESWD (European Severe Weather Database), available at: http://www.eswd.eu/, last access: 17 October 2018.
European Enviroment Agency: European past floods, available at: https://www.eea.europa.eu/data-and-maps/data/european-past-floods#tab-figures-produced, last access: 6 July 2018.
FitzGerald, G., Du, W., Jamal, A., Clark, M., and Hou, X. Y.: Flood fatalities in contemporary Australia (1997–2008), Emerg. Med. Australas., 22, 180–186, 2010.
Gilabert, J. and Llasat, M. C.: Circulation weather types associated with extreme flood events in Northwestern Mediterranean, Int. J. Climatol., 38, 1864–1876, 2018.
Gil-Guirado, S.: Reconstrucción climática histórica y análisis evolutivo de la vulnerabilidad y adaptación a las sequías e inundaciones en la Cuenca del Segura (España) y en la Cuenca del Río Mendoza (Argentina), Cuadernos Geográficos, 52, 132–151, 2013.
Gil-Guirado, S., Espín-Sánchez, J. A., and Prieto, M. D. R.: Can we learn from the past? Four hundred years of changes in adaptation to floods and droughts. Measuring the vulnerability in two Hispanic cities, Climatic Change, 139, 183–200, 2016.
Glaser, R. and Stangl, H.: Climate and floods in Central Europe since AD 1000: data, methods, results and consequences, Surv. Geophys., 25, 485–510, 2004.
Guzzetti, F., Stark, C. P., and Salvati, P.: Evaluation of flood and landslide risk to the population of Italy, Environ. Manage., 36, 15–36, 2005.
Hilker, N., Badoux, A., and Hegg, C.: The Swiss flood and landslide damage database 1972–2007, Nat. Hazards Earth Syst. Sci., 9, 913–925, https://doi.org/10.5194/nhess-9-913-2009, 2009.
Hirsch, R. M. and Slack, J. R.: A nonparametric trend test for seasonal data with serial dependence, Water Resour. Res., 20, 727–732, 1984.
Instituto Nacional de Estadística (INE): Demografía y Población, available at: https://www.ine.es/dyngs/INEbase/es/categoria.htm?c=Estadistica_P&cid=1254734710984, last access: 6 October 2018.
Jongman, B., Koks, E. E., Husby, T. G., and Ward, P. J.: Increasing flood exposure in the Netherlands: implications for risk financing, Nat. Hazards Earth Syst. Sci., 14, 1245–1255, https://doi.org/10.5194/nhess-14-1245-2014, 2014.
Jongman, B., Winsemius, H. C., Aerts, J. C., de Perez, E. C., van Aalst, M. K., Kron, W., and Ward, P. J.: Declining vulnerability to river floods and the global benefits of adaptation, P. Natl. Acad. Sci. USA, 112, E2271–E2280, 2015.
Kundzewicz, Z. W., Pińskwar, I., and Brakenridge, G. R.: Large floods in Europe, 1985–2009, Hydrolog. Sci. J., 58, 1–7, 2013.
Llasat, M. C., Barriendos, M., Barrera, A., and Rigo, T.: Floods in Catalonia (NE Spain) since the 14th century. Climatological and meteorological aspects from historical documentary sources and old instrumental records, J. Hydrol., 313, 32–47, 2005.
Llasat, M. C., Llasat-Botija, M., and López, L.: A press database on natural risks and its application in the study of floods in Northeastern Spain, Nat. Hazards Earth Syst. Sci., 9, 2049–2061, https://doi.org/10.5194/nhess-9-2049-2009, 2009.
Llasat, M. C., Llasat-Botija, M., Petrucci, O., Pasqua, A. A., Rosselló, J., Vinet, F., and Boissier, L.: Towards a database on societal impact of Mediterranean floods within the framework of the HYMEX project, Nat. Hazards Earth Syst. Sci., 13, 1337–1350, https://doi.org/10.5194/nhess-13-1337-2013, 2013a.
Llasat, M. C., Llasat-Botija, M., Petrucci, O., Pasqua, A. A., Rossello, J., Vinet, F., and Boissier, L.: Floods in the north-western Mediterranean region: presentation of the HYMEX database and comparison with pre-existing global databases, Houille Blanche, 1, 5–9, 2013b.
Llasat, M. C., Llasat-Botija, M., Rodriguez, A., and Lindbergh, S.: Flash floods in Catalonia: a recurrent situation, Adv. Geosci., 26, 105–111, https://doi.org/10.5194/adgeo-26-105-2010, 2010.
Llasat, M. C., Marcos, R., Turco, M., Gilabert, J., and Llasat-Botija, M.: Trends in flash flood events versus convective precipitation in the Mediterranean region: The case of Catalonia, J. Hydrol., 541, 24–37, 2016.
López-Martínez, F., Gil-Guirado, S., and Pérez-Morales, A.: Who can you trust? Implications of institutional vulnerability in flood exposure along the Spanish Mediterranean coast, Environ. Sci. Policy, 76, 29–39, 2017.
Martín-Vide, J.: Spatial distribution of a daily precipitation concentration index in peninsular Spain, Int. J. Climatol., 24, 959–971, 2004.
McEwen, L. J.: Flood seasonality and generating conditions in the Tay catchment, Scotland from 1200 to present, Area, 38, 47–64, 2006.
Munich Re: NatCat SERVICE Loss Database for Natural Catastrophes Worldwide, available at: https://www.munichre.com/en/reinsurance/business/non-life/natcatservice/index.html, last access: 30 July 2018.
Muñoz-Díaz, D. and Rodrigo, F. S.: Spatio-temporal patterns of seasonal rainfall in Spain (1912–2000) using cluster and principal component analysis: comparison, Ann. Geophys., 22, 1435–1448, https://doi.org/10.5194/angeo-22-1435-2004, 2004.
Nadal, N. C., Zapata, R. E., Pagán, I., López, R., and Agudelo, J.: Building damage due to riverine and coastal floods, J. Water Resour. Plan. Man., 136, 327–336, 2009.
Napolitano, E., Marchesini, I., Salvati, P., Donnini, M., Bianchi, C., and Guzzetti, F.: LAND-deFeND – An innovative database structure for landslides and floods and their consequences, J. Environ. Manage., 207, 203–218, 2018.
NOOA: Storm Events Database, available at: https://www.ncdc.noaa.gov/stormevents/ftp.jsp, last access: 24 July 2018.
Olcina Cantos, J., Hernández Hernández, M., Rico Amorós, A. M., and Martínez Ibarra, E.: Increased risk of flooding on the coast of Alicante (Region of Valencia, Spain), Nat. Hazards Earth Syst. Sci., 10, 2229–2234, https://doi.org/10.5194/nhess-10-2229-2010, 2010.
Pagán, J. I., Aragonés, L., Tenza-Abril, A. J., and Pallarés, P.: The influence of anthropic actions on the evolution of an urban beach: Case study of Marineta Cassiana beach, Spain, Sci. Total Environ., 559, 242–255, 2016.
Papagiannaki, K., Lagouvardos, K., and Kotroni, V.: A database of high-impact weather events in Greece: a descriptive impact analysis for the period 2001–2011, Nat. Hazards Earth Syst. Sci., 13, 727–736, https://doi.org/10.5194/nhess-13-727-2013, 2013.
Pascual, G. and Bustamante, A.: Catálogo Nacional de Inundaciones Históricas. Actualización, Ministerio del Interior, Madrid, Spain, 2011.
Pérez-Morales, A., Gil-Guirado, S., and Olcina-Cantos, J.: Housing bubbles and the increase of flood exposure. Failures in flood risk management on the Spanish south-eastern coast (1975–2013), J. Flood Risk Manag., 11, S302–S313, 2018.
Petrucci, O., Aceto, L., and Aurora Pasqua, A.: Long-term analysis of Damaging Hydrogeological Events in Calabria (Southern Italy), in: EGU General Assembly Conference Abstracts, Vol. 20, p. 7899, 2018.
Polemio, M. and Petrucci, O.: The occurrence of floods and the role of climate variations from 1880 in Calabria (Southern Italy), Nat. Hazards Earth Syst. Sci., 12, 129–142, https://doi.org/10.5194/nhess-12-129-2012, 2012.
Quan, R.: Risk assessment of flood disaster in Shanghai based on spatial–temporal characteristics analysis from 251 to 2000, Environ. Earth Sci., 72, 4627–4638, 2014.
Romero, R., Doswell III, C. A., and Ramis, C.: Mesoscale numerical study of two cases of long-lived quasi-stationary convective systems over eastern Spain, Mon. Weather Rev., 128, 3731–3751, 2000.
Salvati, P., Marchesini, I., Balducci, V., Bianchi, C., and Guzzetti, F.: A new digital catalogue of harmful landslides and floods in Italy. In Landslide science and practice, Springer, Berlin, Heidelberg, 409–414, 2013.
Sumner, G. N., Romero, R., Homar, V., Ramis, C., Alonso, S., and Zorita, E.: An estimate of the effects of climate change on the rainfall of Mediterranean Spain by the late twenty first century, Clim. Dynam., 20, 789–805, 2003.
Swiss Re: Sigma Natural Catastrophes and Man-made Disasters, available at: http://institute.swissre.com/research/overview/sigma/, last access: 27 September 2018.
Tapsell, S. M., Penning-Rowsell, E. C., Tunstall, S. M., and Wilson, T. L.: Vulnerability to flooding: health and social dimensions, Philos. T. R. Soc. A, 360, 1511–1525, 2002.
Terti, G., Ruin, I., Anquetin, S., and Gourley, J. J.: A situation-based analysis of flash flood fatalities in the United States, B. Am. Meteorol. Soc., 98, 333–345, 2017.
Turco, M. and Llasat, M. C.: Trends in indices of daily precipitation extremes in Catalonia (NE Spain), 1951–2003, Nat. Hazards Earth Syst. Sci., 11, 3213–3226, https://doi.org/10.5194/nhess-11-3213-2011, 2011.
Vennari, C., Parise, M., Santangelo, N., and Santo, A.: A database on flash flood events in Campania, southern Italy, with an evaluation of their spatial and temporal distribution, Nat. Hazards Earth Syst. Sci., 16, 2485–2500, https://doi.org/10.5194/nhess-16-2485-2016, 2016.
Walmsley, D. J.: Spatial bias in Australian news reporting, Aust. Geogr., 14, 342–349, 1980.
WMO, UCL: Atlas of mortality and economic losses from weather, climate and water extremes 1970–2012, Geneva, Switzerland, World Meteorological Organization (WMO), 2014.
Zêzere, J. L., Pereira, S., Tavares, A. O., Bateira, C., Trigo, R. M., Quaresma, I., Santos, P. P., Santos, M., and Verde, J.: DISASTER: a GIS database on hydro-geomorphologic disasters in Portugal, Nat. Hazards, 72, 503–532, 2014.
For more detailed information, the studies of Adhikari et al. (2010), Bouwer (2011), Llasat et al. (2013a) and Napolitano et al. (2018) include a detailed catalogue of some of these databases and their scope.
For example, FitzGerald et al. (2010) for Australia, McEwen (2006) for Scotland, Glaser and Stangl (2004) for central Europe, Quan (2014) for Shanghai, and Brázdil et al. (2014) for South Moravia (Czech Republic).