the Creative Commons Attribution 4.0 License.
the Creative Commons Attribution 4.0 License.
 | 28 Aug 2019
Efficacy of using radar-derived factors in landslide susceptibility analysis: case study of Koslanda, Sri Lanka
Ahangama Kankanamge Rasika Nishamanie Ranasinghe
Ranmalee Bandara
Udeni Gnanapriya Anuruddha Puswewala
Thilantha Lakmal Dammalage
Through the recent technological developments of radar and optical remote sensing in (i) the areas of temporal, spectral, spatial, and global coverage; (ii) the availability of such images either at a low cost or free of charge; and (iii) the advancement of tools developed in image analysis techniques and GIS for spatial data analysis, there is a vast potential for landslide studies using remote sensing and GIS as tools. Hence, this study aimed to assess the efficacy of using radar-derived factors (RDFs) in identifying landslide susceptibility using the bivariate information value method (InfoVal method) and the multivariate multi-criteria decision analysis based on the analytic hierarchy process statistical analysis. Using identified landslide causative factors, four landslide prediction models – bivariate with and without RDFs as well as multivariate with and without RDFs – were generated. Twelve factors such as topographical, hydrological, geological, land cover and soil plus three RDFs are considered. The weight of index for landslide susceptibility is calculated by using the landslide failure map, and susceptibility regions are categorized into four classes as very low, low, moderate, and high susceptibility to landslides. With the integration of RDFs, boundary detection between high- and very-low-susceptibility regions are increased by 7 % and 4 % respectively.
- Article
(3435 KB) - Full-text XML
-
Supplement
(4753 KB) - BibTeX
- EndNote


Landslides are one of the major types of geo-hazards in the world as approximately 9 % of global natural disasters are recorded as landslides (Chae et al., 2017; Chalkias et al., 2014). The recent statistics on landslide disasters per continent, from year 2000 to 2017, are summarized in the Emergency Events Database (EM-DAT, 2016). The database indicates that landslides cause around 16 500 deaths and affect 4.5 million people worldwide, with property damages of about USD 3.5 million (OFDA/CRED, 2016). The spatial prediction of landslide disasters, incorporating statistical analysis to identify areas that are susceptible to future land sliding, is one the important areas of geo-scientific research. These studies are based on the knowledge of past landslide events, topographical parameters, geological attributes, and other possible environmental factors (Park et al., 2013).
Presently, remote sensing has been used extensively to provide landslide-specific information for emergency managers and policy makers in terms of disaster management activities in the world (Baroň et al., 2014; Martha, 2011). The spatial resolution of space-borne optical data is now less than 1 m in panchromatic images, and at the same time synthetic aperture radar (SAR) sensors and related processing techniques have also increased. Radar is considered to be unique among the remote sensing systems, as it is all-weather, independent of the time of day, and is able to penetrate into the objects. Additionally, radar images have been shown to depend on several natural surface parameters such as the dielectric constant and surface roughness. The dielectric constant is highly dependent on soil moisture due to the large difference in dielectric constant between dry soil and water (Kseneman et al., 2012). It is accepted in the scientific community that remote sensing techniques do offer an additional tool for extracting information on the causes of landslides and their occurrences. Especially for deriving various parameters related to the landslide predisposing and triggering factors at global and regional scales, remote sensing plays a vital role (Corominas et al., 2014; Muthu et al., 2008; Pastonchi et al., 2018). Most importantly, landslide susceptibility analysis has greatly aided the prediction of future landslide occurrences, which is important for humans who reside in areas surrounded by unstable slopes. It is therefore identified that remote sensing techniques are significant in order to extract the landslide susceptibility regions by providing most suitable landslide predisposing factors at a smaller scale.
There is massive potential for research by applications in the area of disaster management if conventional remote sensing data and radar are integrated. This is because each method has its inherent disadvantages and shortcomings, as well as advantages, and integrating the two potentially complement each other. As such, this study combines the predisposing factors derived from both optical and radar satellite data for landslide susceptibility analysis. Furthermore, significant landslide predisposing factors like soil moisture, surface roughness, and forest biomass are derived from radar images, and the impacts of these factors on landslide susceptibility are examined.
1.1 Methods for landslide susceptibility analysis
There are inherent limitations and uncertainties in landslide susceptibility analysis, and yet several methods have been utilized and successfully applied in the past (Kanungo et al., 2009). These methods have been of both a qualitative and quantitative nature. Generally, qualitative methods are based on expert opinions while the quantitative approaches, such as statistical and probabilistic approaches, depend on the past landslide experiences.
Qualitative methods simply make use of landslide inventories to identify areas with similar geological and geomorphologic properties that show susceptibility to land failures. These methods can be divided into two groups: geomorphologic analysis and map combination. In geomorphologic analysis, the landslide susceptibility is determined directly either in the field or by the interpretation of images through geomorphologic analysis (Bui et al., 2011). Map combination is based on combining a number of predisposing factor maps for landslide susceptibility analysis. However, map combination analysis comprises a semi-quantitative nature by integrating the ranking and weighting of landslide susceptibility (Ayalew et al., 2004; Kavzoglu et al., 2014; Saaty, 1980). The analyses based on the quantitative approaches depend on numerical data and statistics, expressing the relationship between instability or predisposing factors with landslides (Reis et al., 2012). These methods are categorized into two groups: bivariate and multivariate statistical analysis. The popular information value method (InfoVal) is used as bivariate and multi-criteria decision analysis (MCDA) based on analytic hierarchy process (AHP) used as multivariate. Within the context of this work, these two methods are compared with respect to its performance in landslide susceptibility analysis.
1.2 Landslide predisposing factors
It is understood that landslides may occur as consequences of complex predisposing and triggering factors. Topographical and geological factors, together with local climatic conditions, lead to landslide occurrences. The selection of these factors and preparation of corresponding thematic data layers are vital for models used in landslide susceptibility analysis (Jakob et al., 2006; Lee et al., 2017). There are no universal guidelines regarding the selection of predisposing factors in landslide susceptibility analysis. Some parameters may be important factors for landslide occurrences in a certain area but not for another one. Scientists (van Westen, 1997, 2003; van Westen and Getahun, 2003) show that every study area has its own particular set of predisposal factors which condition landslides. Determination of appropriate causal factors is a difficult task, and no specific rule exists to define how many factors are sufficient for a specific landslide susceptibility analysis. Hence, the selection of predisposing factors is dependent on the nature of the study area, opinions of the experts, and the availability of data for generating the appropriate spatial and thematic information (Kavzoglu et al., 2015; Shahabi and Hashim, 2015).
Koslanda in Sri Lanka is located at the geographical coordinates of 06∘44′00′′ N and 81∘01′00′′ E, and the elevation is around 700–1000 m a.s.l. It is a remote, hilly area with harsh weather conditions, where the monthly rainfall ranges from 60 to 200 mm, and average temperature is 20 ∘C. The area has rains for most of the year, with a very short, dry period during the months of February to April. The population is around 5000 people, and the study area has an extent of 19 km2 within the Koslanda area. Koslanda has been the site of several massive landslides over the years, and both the Naketiya landslide in the year 1997 and Meeriyabedda landslide in the year 2014 are very distinct in Fig. 1, and within a span of 2 years major landslides have occurred three times at the same location. When considering the typology of landslides in this study area, falling, toppling, subsidence, lateral displacements, and debris flows are prominent (NBRO, 2016).
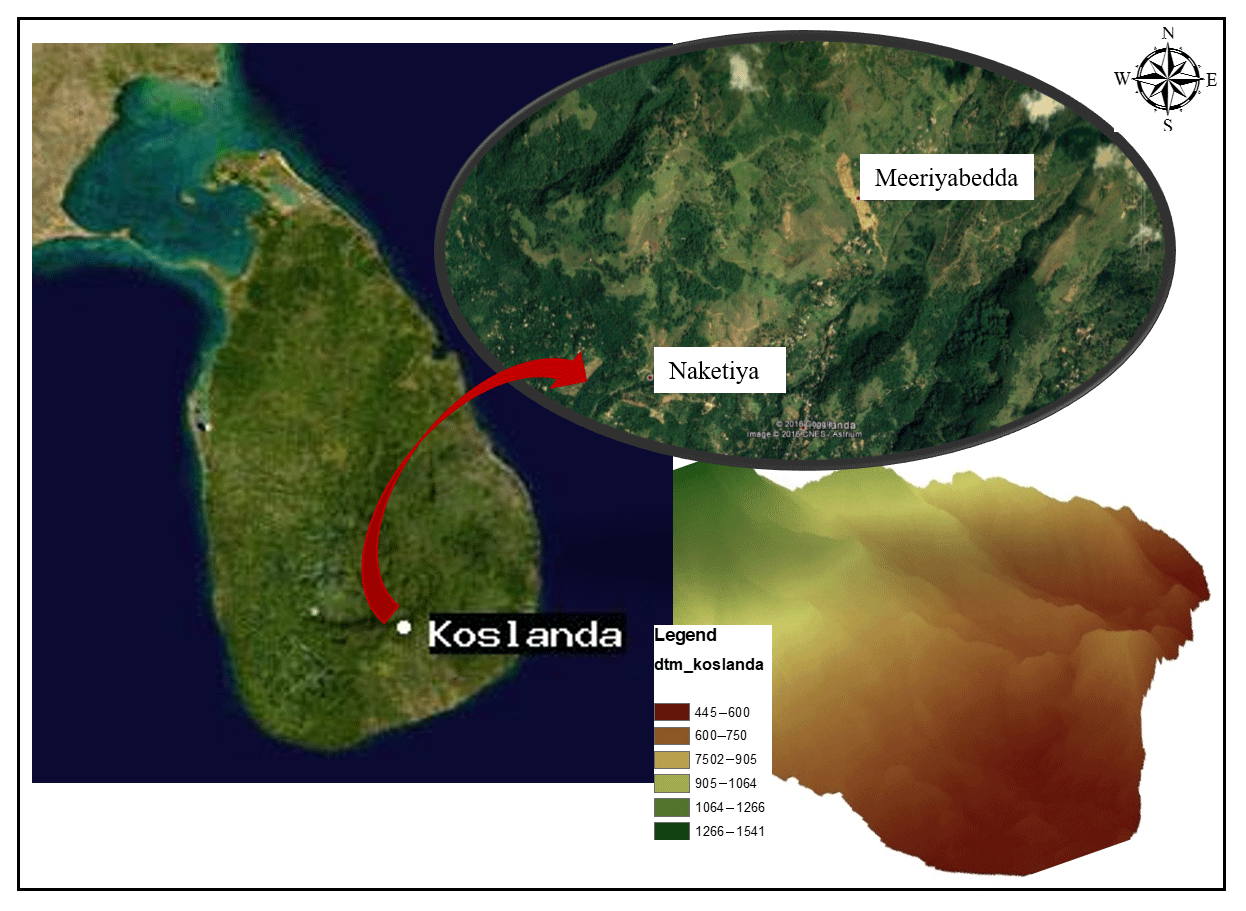
Figure 1Topographical formation of Koslanda, Sri Lanka, with its previous landslide signatures. Sources © Google Earth and CNES.
The geomorphology of the area is described as a gently inclined talus slope, with a thick, loosely compacted colluvium deposit at the foot of the near-vertical rocky scarp. Koslanda is situated at the middle part of the slope, with the lower area showing a fairly steep surface as well. The composition of the colluvium deposit in the area includes a randomly arranged mixture of weathered clayey and sandy materials, with the organic matter making the deposit act as a highly absorbing entity with high water content. The study area was an abandoned tea land in which the properly maintained surface drainage system has been neglected (Somaratne, 2016). Geology refers to the physical structure and the substance of the Earth. The study area consists mainly of undifferentiated charnockitic biotite gneisses and quartzites, according to the 1:10 000 geological map from the Geological Survey and Mines Bureau (GSMB), Sri Lanka. Such a geomorphological and geological formation, together with improper land use management practices, has made the area extremely vulnerable to landslide events.
The most important phases in landslide prediction analyses are the collection of data from different sources and the construction of a spatial database on a common platform (Lan et al., 2004). The data utilized for the landslide susceptibility analysis include the topographical, hydrological, geological, soil, and land cover factors. All factors are derived from optical images (Landsat-8, Sentinel-2), radar images (Sentinel-1, TerraSAR-X), the digital elevation model (DEM) derived from aerial triangulation, and other available data sources (geology, rainfall). Stereo aerial photographs from 1993 are used to generate the 7 m resolution DEM using aerial triangulation (Copernicus Open Access Hub, 2018; USGS Earth Explorer, 2018). The landslide inventory map for the study area was constructed by integrating the interpreted multi-temporal aerial photographs, satellite images, and some temporal images from Google Earth (Fig. 2). Verifications are carried out through field investigations. In this research, the predisposing factors were selected from among the most widely considered factors in the literature and opinion from the experts.
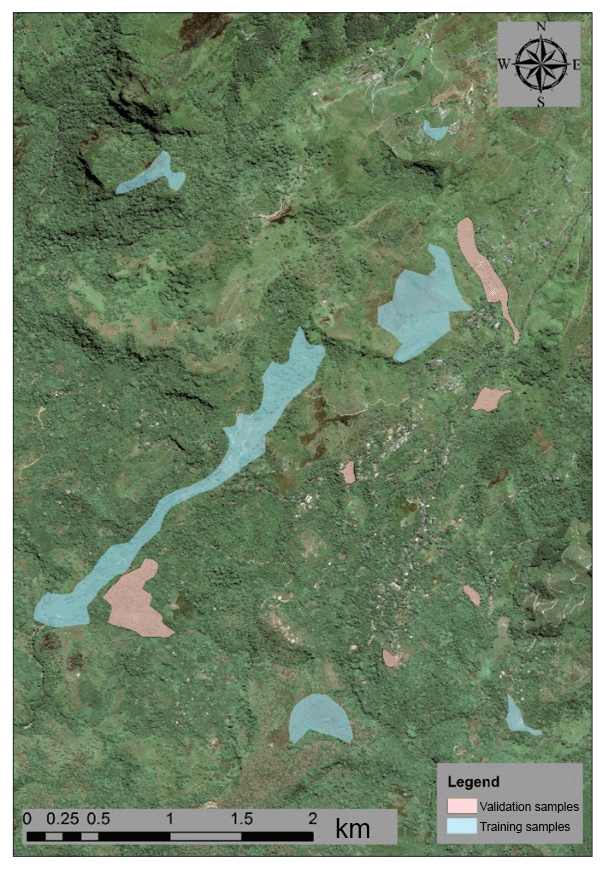
Figure 2Landslide catalogue of the Koslanda area with two different training and validating samples; background map from © Google Earth.
Most data are derived as primary data from remote sensing techniques for a large area with up-to-date information. As such, 15 predisposing factors are selected for the landslide susceptibility analysis by using bivariate and multivariate statistical techniques. Of these, 12 factors (elevation, slope, aspect, planar curvature, profile curvature, topographical wetness index (TWI), land use, lineament density, distance to water bodies, soil moisture, geology, and rainfall) are derived from optical images, DEM, and auxiliary data, while three more factors (soil moisture from delta index, surface roughness, and forest biomass) are derived from radar images. These factors were then combined in order to analyse the performance of this integration for landslide susceptibility analysis. Additional graphical information is available in Figs. S1, S2, and S3.
3.1 Topographical factors
The topographical factors include elevation, slope, aspect, planar curvature, profile curvature, and surface roughness of the terrain. The first four factors are derived from the 7 m resolution DEM, and surface roughness is derived using a Sentinel-1 radar image. The elevation is important to study the local relief of the terrain and ranges from 446 to 1537 m above mean sea level in the study area. Since the area contains high mountains, more than a 1000 m difference in elevation can be observed. The basic parameter for the slope stability analysis is the slope angle. The slope angle of the study area ranges from 0∘ to 80∘, showing a significant increase in slope within a relatively small area. Additionally, the area with steep slopes ranging from 60∘–80∘ can be seen in the northern part of Koslanda. Aspect is defined as the direction of maximum slope of the terrain surface, or the compass direction of a particular slope. The curvature is theoretically defined as the rate of change of slope (or slope) of the focused slope. Planar curvature describes convergence and divergence of the flow across a surface, while the profile curvature refers to acceleration or deceleration of the flow across a surface.
Under radar configuration, the magnitude of radar backscatter is defined as a function of surface roughness and moisture content. Similar studies from Rahman et al. (2008) and Septiadi and Nasution (2009) emphasized the extraction of surface roughness from radar data using textural analysis. Hence, to estimate the surface roughness without the use of any ancillary field data, a Sentinel-1 radar image on 12 March 2015 under dry climatic conditions was used to reduce the effect of the moisture component from the radar backscatter. The texture is the structure, or appearance, of the surface and, as such, describes the coarseness or the homogeneity of the image structure. One of the most prominent methods for texture analysis is the grey-level co-occurrence matrix (GLCM), which is based on the second-order probability density function. The GLCM describes how often a grey level occurs at a pixel located at a fixed geometric position relative to its neighbourhood pixels. The surface roughness is normally a measure of finer surface irregularity in the surface texture. These texture features extracted from the GLCM would be the best descriptors for quantifying the state of surface roughness (Septiadi and Nasution, 2009). Hence, the GLCM texture analysis is performed using a window size of 9 pixels ⋅ 9 pixels, and the homogeneity or dissimilarity criterion is used to determine the surface roughness of the study area.
3.2 Hydrological factors
Distance to hydrological features, rainfall, and TWI defined by Eq. (1) are selected as the hydrological factors for this landslide susceptibility analysis. Proximity to the hydrological features is an important factor when considering the landslide susceptibility analyses (Sar et al., 2016; Shahabi and Hashim, 2015). TWI is a solid index that is capable of predicting areas susceptible to saturation or wetness of land surfaces, as well as the areas that have the potential to produce an overland flow. Within the Sri Lankan context, heavy and prolonged rainfall is the main triggering factor for the landslides. The monthly average rainfall data for the years 2014 to 2016 from 10 nearby stations to Koslanda were used in this study. Monthly rainfall data from 10 rain gauge stations are averaged, and the average rainfall map for the study area is generated using the inverse distance weighting (IDW) interpolation method within the ArcGIS environment. TWI has been used to study the spatial scale effects, or topographic control, on hydrological processes. This index was developed by Beven and Kirkby (1979) and can be defined in Eq. (1) as
where ∝ is the local upslope area draining through a certain point per unit of contour length, and β is the gradient of the local slope in degrees. The applicability of the TWI in the calculation and validation of landslide susceptibility analysis has been shown by Kavzoglu et al. (2014) and Sørensen et al. (2006) among others.
3.3 Soil factors
The soil moisture index (SMI) defined in Eq. (2) and the delta index defined in Eq. (5) are the soil factors focused upon in this research. Surface soil moisture is one of the most important parameters in land susceptibility analysis (Carlson et al., 1994; Zhan et al., 2002). Several methods have been proposed to estimate the surface soil moisture conditions accurately with in situ measurements. However, these methods are time-consuming and costly when the area of interest is large and the scale of work is small. Hence, this research uses the universal triangle relationship between soil moisture, the normalized difference vegetation index (NDVI), and land surface temperature (LST) derived from Landsat-8 image bands as an optical remote sensing approach, as well as the delta index derived from two radar images, as wet and dry conditions, as a radar remote sensing approach. Band 5 (near-infrared, NIR; 30 m resolution), band 4 (red, 30 m resolution), and band 11 (thermal, TIR-2, 100 m resolution) of the Landsat-8 image of 3 July 2015 are processed for extracting the soil moisture index in the thermal-NDVI space. The SMI is “0” along the dry edge and “1” along the wet edge. According to the studies from Wang and Qu (2009) and Zenga et al. (2004), SMI can be defined in Eq. (1) as
where Tmax and Tmin are the maximum and minimum surface temperature for a given NDVI, and T is the remotely sensed derived surface temperature at a given pixel for a given NDVI. The simple regression relationship between T and NDVI is formulated in Eqs. (3) and (4) as
where , b1=300.14, a2=2.9254, and b2=289.11. Radar remote sensing provides advantages for extracting near-surface soil moisture (0–5 cm), including timely coverage with repeat passes during day and night, under all weather conditions. Radar imagery from space can provide broad-scale information on near-surface soil moisture as radar signal return is responsive to changes in soil moisture. Technically, the surface roughness and vegetation affect radar backscatter much more than soil moisture. Hence, both the surface roughness and vegetation have to remain unchanged during the image acquisition for soil moisture estimation (Thoma et al., 2006). The delta index is a modified, image-differencing technique, and many studies (Barrett et al., 2009; Sano et al., 1998; Thoma et al., 2004) have proven it to be a good predictor for near-surface soil moisture extraction. This index describes the change in wet scene backscatter relative to the dry scene backscatter and is defined by Thoma et al. (2004) in Eq. (5) as
where is the radar backscatter (decibels) from a pixel in the radar image representing wet soil conditions, and is the radar backscatter (decibels) from a pixel in the same geographic location representing dry soil conditions at a different time. Sentinel-1 images with 10 m spatial resolution and VV polarization are used in the presented study. The dry reference image was acquired on 12 March 2015 and the wet image was acquired on 24 November 2014 after the landslide in Meeriyabedda, Sri Lanka. Therefore, the topographical changes like roughness and vegetation density showed no significant changes during these 4 months.
3.4 Land use
The major land uses existing in this study area are identified as tea, scrub, forest, rock, rice, water, and residential. The Sentinel-2A image from 10 October 2016 is used to extract the desired land uses from the study area by applying supervised classification. Scrub areas are typically the tea estates that are in abundance, while the residential areas are the rooms of tea workers. It is noted that most of the devastating landslides in this area had occurred within the extensive tea estates. Hence, the main reason for the continuous occurrence of these landslides can be identified as the lack of proper land use management in the area.
Forest biomass is a significant factor that can control the landmass failures or landslides. The main limitations of using optical remote sensing for forest biomass estimation are the near-constant tropical cloud cover and the insensitivity of reflectance to change in the biomass in older and mixed forests. Radar has the potential to overcome the above limitations due to its all-weather, day and night capability, with the positive relationship of radar backscatter and forest biomass. The spatial, spectral, temporal, and polarization characteristics of radar backscatter have a known influence on the forest biophysical properties. Kuplich et al. (2005) and Caicoya et al. (2016) related the radar image texture derived from GLCM to the forest biomass. An experiment was conducted by Kuplich et al. (2005) with seven texture measures, but only the GLCM-derived contrast increased the correlation between the backscatter and the log of biomass in Eq. (6) as
where b is the radar backscatter and c represents the GLCM contrast texture for the particular radar image. A TerraSAR-X spotlight image from 2 November 2014, with 3 m resolution and dual polarization (HH and VV), was used to estimate the forest biomass in this research.
3.5 Geological factors
Geology refers to the physical structure and the substance of the Earth. In order to investigate the land mass failures, the geological structure of that particular area has to be analysed carefully. In addition to the geology of the area, lineament density has also been considered as a factor. The geological information of the particular area is obtained from the geological map available at the Geological Survey and Mines Bureau, Sri Lanka, at a 1:100 000 scale, and seven types of different geological structures are contained in the selected study region. Primarily the undifferentiated charnockitic biotite gneisses and quartzites are prominent with garnet-sillimanite and garnetiferous quartzofeldspathic gneiss in the study area. Lineaments are extractable linear features which are correlated with the geological structures of the Earth. When considering the analysis of lineaments with respect to the landslide potentiality, lineaments exhibit the zones of weak surfaces such as faults, fractures, and joints (Adiri, et al., 2017; Kati, et al., 2018; Mandal and Maiti, 2015). This study uses the Sentinel-2 optical satellite image, with 10 m resolution, for the extraction of lineaments of the study area.
The InfoVal method determines the susceptibility at each point or pixel, jointly considering the weight of influence of all predisposing factors. The weight of influence is based on the landslide inventory map of the particular area. When constructing a probability model for landslide prediction, it is necessary to assume that the landslide occurrence is determined by landslide-related factors and that future landslides will also occur under the same, or almost similar, conditions as past landslides (Remondo et al., 2013; Saha et al., 2005). Hence, at the beginning of the analysis, the landslide inventory map is divided in to two samples – training and validation – enabling the use of these data for landslide susceptibility analysis and validation of results respectively as in Fig. 2. The log function is used to control the large variation of weights in calculations. The larger the weight of influence, the stronger the relationship between landslide occurrence and the given factor's attribute.
This method overlays all individual predisposing factors such as thematic maps with the landslide inventory map to calculate the density of the landslide detachment zones for each class of the selected factors. The density of landslide pixels represents the weight of influence of each predisposing factor in Eq. (7) as
where Wi is the weight given to the parameter class, Densclass is the landslide density within the parameter class and Densmap is the landslide density within the entire map. Npix(Si) is the number of landslide pixels within parameter class i, and Npix(Ni) is the total number of pixels in the same parameter class. It means that, if the parameter class contains no landslide occurrence, it will have no correlation with the landslide inventory map (Bui et al., 2011; Kavzoglu et al., 2015).
The MCDA method integrates all the independent predisposing factors with the inclusion of relative contribution of each factor by putting more emphasis on the predisposing factors that contribute to landslide occurrence. The same predisposing factors with or without radar are used to investigate the landslide susceptibility regions from the AHP technique within the GIS domain. In AHP, each pair of factors in a particular factor group is examined at one time, in terms of their relative importance. Relative weights for each factor are calculated based on a questionnaire survey from experts in the field (further information for the questionnaire is available in Fig. S4). These relative weights are then used to generate a pairwise comparison matrix, which is the basic measurement mode when applying the AHP procedure. The selected predisposing factors, and relevant relative weights, are used to generate the normalized matrix with final average weights. However, expert knowledge could be subjective at times, or may cause one to assign different weights for each factor, when dealing with a large number of causative factors. Hence, in order to avoid this inconsistency, the consistency ratio (CR) is calculated. For better predictive models, the CR should be less than 0.01, otherwise each factor has to be generated with the proper pairwise comparison.
The calculated final weights for 12 landslide predisposing factors without RDFs such as elevation–slope, aspect, planar curvature, profile curvature, TWI, land use, lineament density, distance to water bodies, soil moisture, geology, and rainfall were 0.030, 0.172, 0.022, 0.018, 0.014, 0.074, 0.149, 0.052, 0.045, 0.094, 0.185, and 0.145, respectively. The CR is 0.089, making it less than 0.1, which is the value shown to be the reasonable level of consistency in the pairwise comparison. The final weights for 15 predisposing factors with RDFs – elevation, slope, aspect, planar curvature, profile curvature, TWI, land use, lineament density, distance to water bodies, SMI in NDVI-T domain, geology, rainfall, soil moisture (delta index), surface roughness, and forest biomass – are 0.022, 0.145, 0.016, 0.013, 0.011, 0.053, 0.126, 0.039, 0.033, 0.065, 0.153, 0.124, 0.088, 0.088, and 0.027, respectively. When considering the 15 predisposing factors, the CR is calculated as 0.092, which is less than 0.1, thereby showing a realistic level of consistency in the pairwise comparison matrix.
After decisive analysis of the types of predisposing factors, the presented work proceeded to consider 15 predisposing factors that are derived from optical, radar, and other available auxiliary data sources. Three significant causative factors – surface roughness, soil moisture from the delta index, and forest biomass – were estimated by using radar satellite images. Thus, this work investigated the performance of landslide susceptibility analysis using bivariate and multivariate methods with the inclusion of RDFs and described the processing steps in Fig. 3.
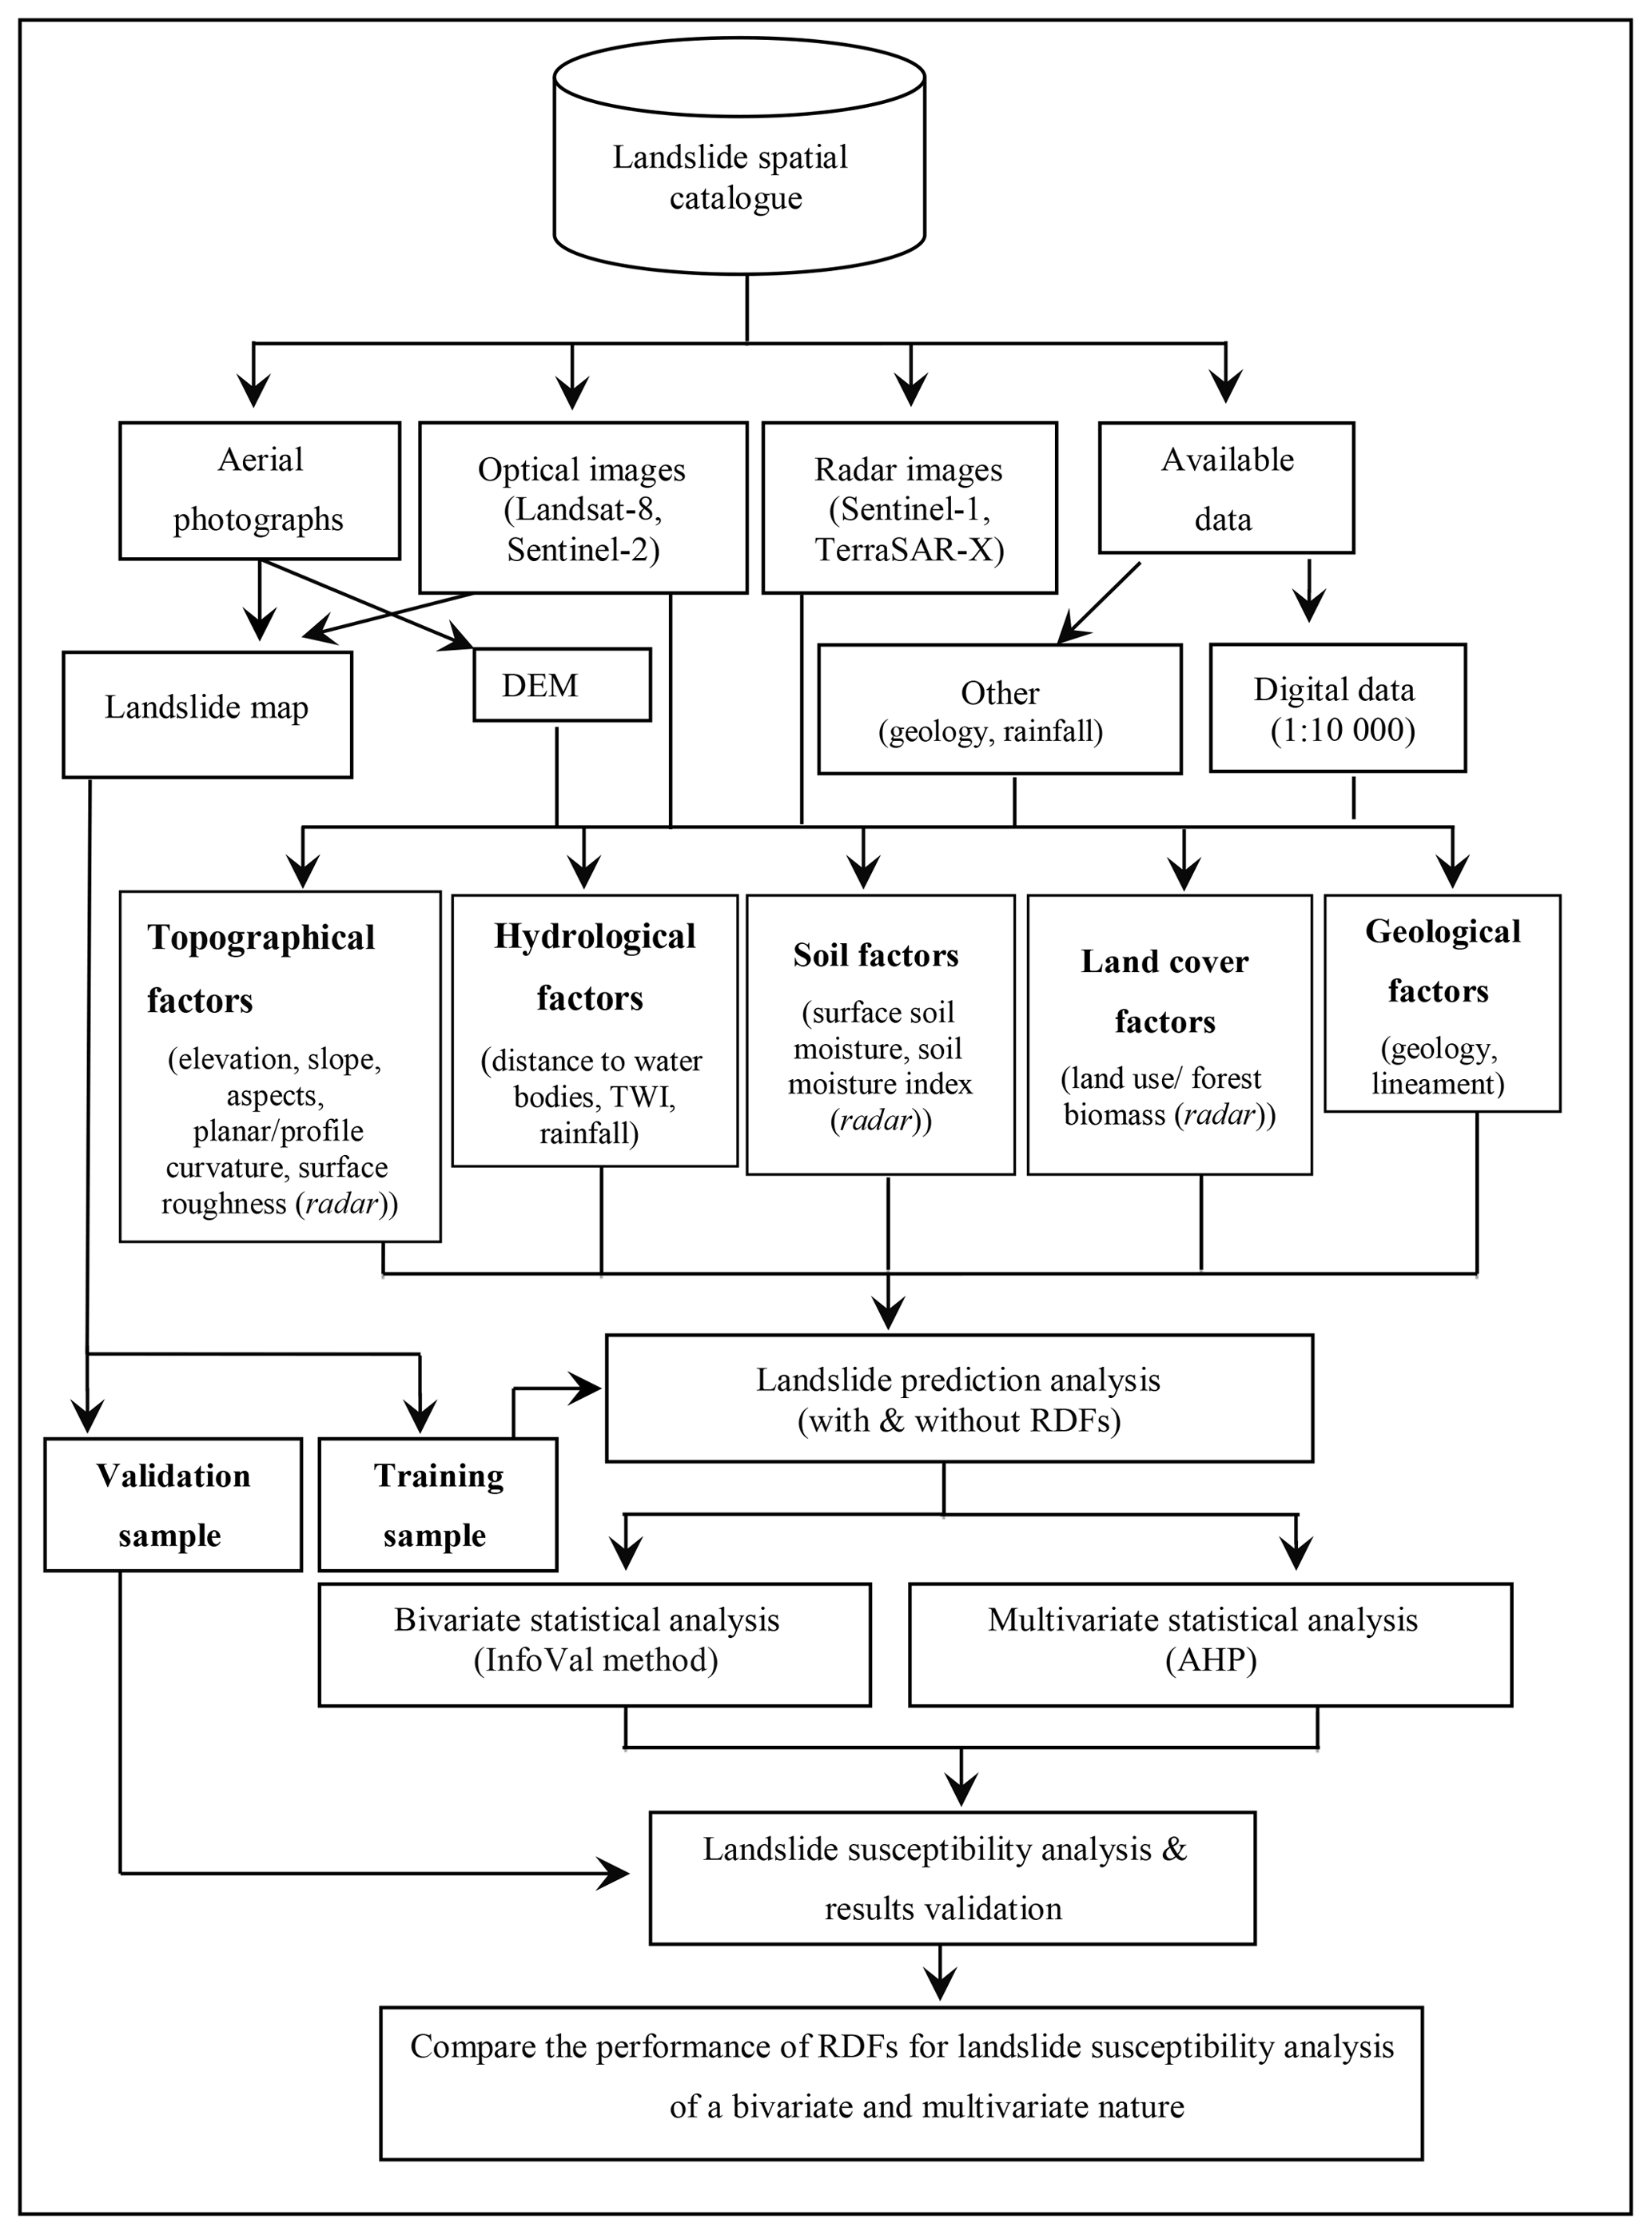
Figure 3Workflow of the landslide susceptibility analysis using bivariate and multivariate approaches.
The weight of influence of all predisposing factors such as thematic maps is added in a bivariate and multivariate manner to obtain the contribution of all predisposing factors for landslide susceptibility analysis. After calculating the cumulative percentage of failures of the weighted susceptibility maps, value ranges for each percentage of failure are obtained from quantile classification for 10 classes. The entire study area of each landslide susceptibility map is then discretized in to four classes as 0 %, 10 %, 30 %, and 60 % of failure regions for very-low-, low-, moderate-, and high-susceptibility classes, respectively.
Four landslide prediction models, (i) bivariate without RDFs (BiNR), (ii) bivariate with RDFs (BiWR), (iii) multivariate without RDFs (MNR), and (iv) multivariate with RDFs (MWR), are discussed. The region has been analysed and classified into four (04) landslide susceptibility regions: high, moderate, low, and very low.
5.1 Bivariate analysis with and without radar-derived factors
Susceptible regions are identified from the bivariate InfoVal method without RDFs as 12 % for high, 45 % for moderate, 38 % for low, and 5 % for very low as shown in Fig. 4a. Hence, 57 % of areas from the total study area are predicted to have high and moderate susceptibility to landslide hazards. Very steep slope mountains in the north, north-west, and east regions are identified as very-low-susceptibility areas, given that the area was free from historical landslides. The middle regions with 30∘–50∘ slope are detected as having a high probability of landslide occurrences. The bivariate InfoVal method with RDFs identified 19 % of failure regions for high-susceptibility, 39 % for moderate-susceptibility, 33 % for low-susceptibility, and 9 % for very-low-susceptibility regions as presented in Fig. 4b. Therefore, 58 % of the total study area is predicted to have high and moderate susceptibility to landslides. Very steep slope mountains in the north, north-west, east, and south-east regions, the area near the Eruwendumpola Oya, are identified as having very low susceptibility to landslides. Similar to the bivariate analysis without RDFs, the middle regions with 30∘–50∘ slope are detected as having a high probability of landslide occurrences, and the reason for this is mainly because of past experiences from the Naketiya and Meeriyabedda landslides that took place in the same area.
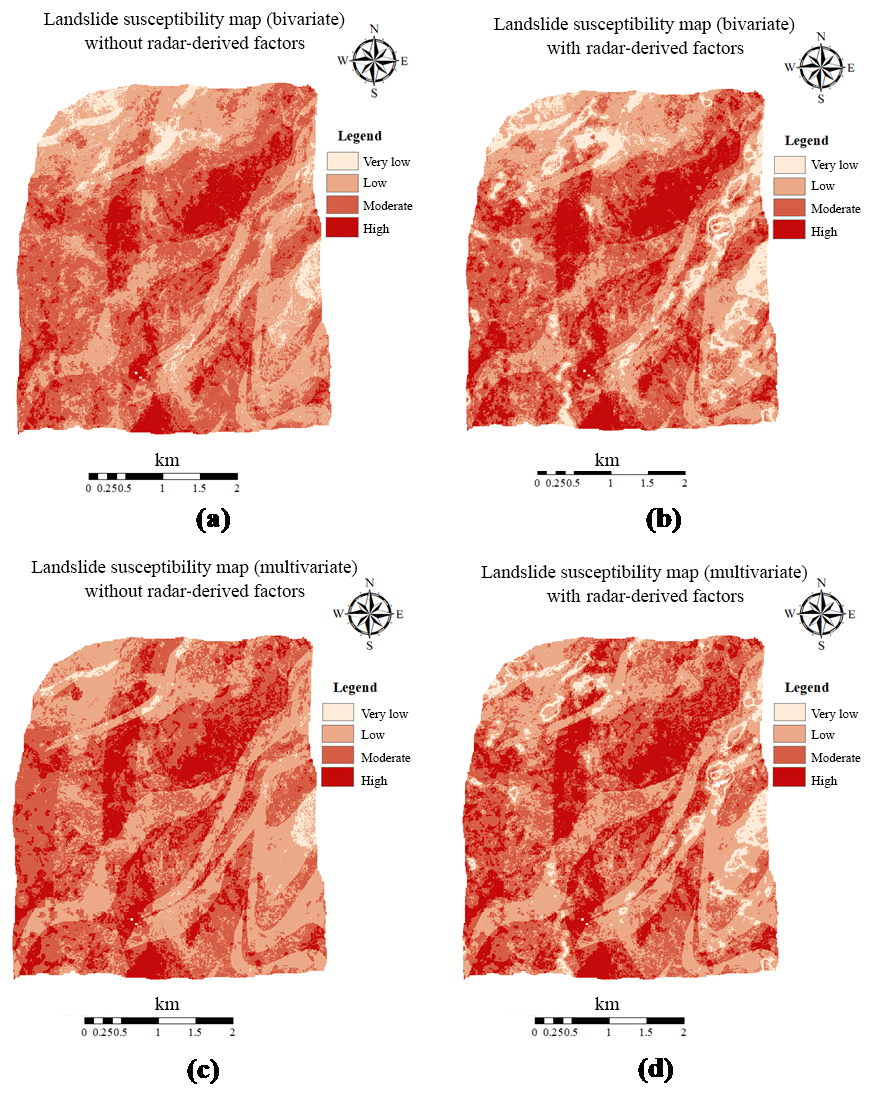
Figure 4Landslide susceptibility maps from bivariate and multivariate analysis with and without RDFs. (a) Bivariate without RDFs, (b) bivariate with RDFs, (c) multivariate without RDFs, and (d) multivariate with RDFs.
5.2 Multivariate analysis with and without radar-derived factors
All 15 weighted predisposing factors were grouped as with and without RDFs, and the weighted overlay is performed separately in order to obtain the landslide susceptibility regions.
Figure 4c illustrates the landslide susceptibility map from the multivariate method without RDFs and is able to identify 18 % for high-, 44 % for moderate-, 36 % for low-, and 2 % for very-low-susceptibility regions. Hence, 62 % of areas from the total study area are predicted to be of high and moderate susceptibility to landslide hazards. In the landslide susceptibility map from the multivariate method with RDFs, from the total area, 21 % of the area shows a high susceptibility to landslides, with 40 % of the area as moderate, 34 % of the area as low, and 5 % of the area as having very low susceptibility as shown in Fig. 4d. Hence, 61 % of areas from the study area are predicted to have high and moderate susceptibility to landslide hazards. In a similar manner to the InfoVal method, the top of the mountains in the north, north-west, east, and south-east regions, the area near to the Eruwendumpola Oya, are identified as having a very low susceptibility to landslide hazards, while the middle regions with 30∘–50∘ slopes are detected as having high and moderate probability of landslide occurrences.
Landslide prediction is of utmost importance in all phases of disaster management and development activities in a country. In recent years Koslanda in Sri Lanka has been found to be significantly prone to landslide disasters. Hence, this study investigated the efficacy of radar-derived factors for landslide susceptibility analysis of a bivariate and multivariate nature. The main difference between bivariate and multivariate analysis is that in multivariate analysis the predisposing factors are weighted by considering how each of them affect landslide hazard. Four landslide susceptibility maps are produced from bivariate and multivariate analysis with and without radar-derived factors. The areas identified as having high- and moderate-susceptibility classes in these four approaches (57 %, 58 %, 62 %, and 61 % respectively in BiNR, BiWR, MNR, and MWR) are close in value but show an increase in multivariate analysis when compared with bivariate analysis as tabulated in Table 1. Moderate- and low-landslide-susceptibility areas show very small ((1–2) %) changes between these four types of analysis. With the integration of RDFs such as surface roughness, near-surface soil moisture from the delta index, and forest biomass in bivariate and multivariate analysis, the high- and very-low-susceptibility areas are increased significantly (high: 7 % – bivariate, 3 % – multivariate; very low: 4 % – bivariate, 3 % – multivariate). However, when comparing the high- and very-low-susceptibility areas from bivariate and multivariate analysis, high-susceptibility areas show a considerable increase (without radar: 6 %; with radar: 2 %) while very-low-susceptibility areas have a noteworthy decrease (without radar: 3 %; with radar: 4 %).
Table 1Landslide-susceptible area comparison from bivariate and multivariate analysis with and without RDFs. BiNR – bivariate analysis without RDFs, BiWR – bivariate analysis with RDFs, MNR – multivariate analysis without RDFs, and MWR – multivariate analysis with RDFs.

6.1 Results validation
The landslide susceptibility maps derived from the bivariate and multivariate analysis are validated using the selected validation samples from the landslide failure map. The most commonly used and scientifically recognized receiver operating characteristic (ROC) curves are used to analyse the prediction and validation performances. The ROC curve is a graphical plot that illustrates the performance of classification and is considered to be a powerful tool for the validation of landslide susceptibility analysis for many years (Neuhäuser et al., 2012). The areas under the curve (AUCs) for the four different approaches – bivariate and multivariate with and without RDFs – are calculated and graphed in Fig. 5.
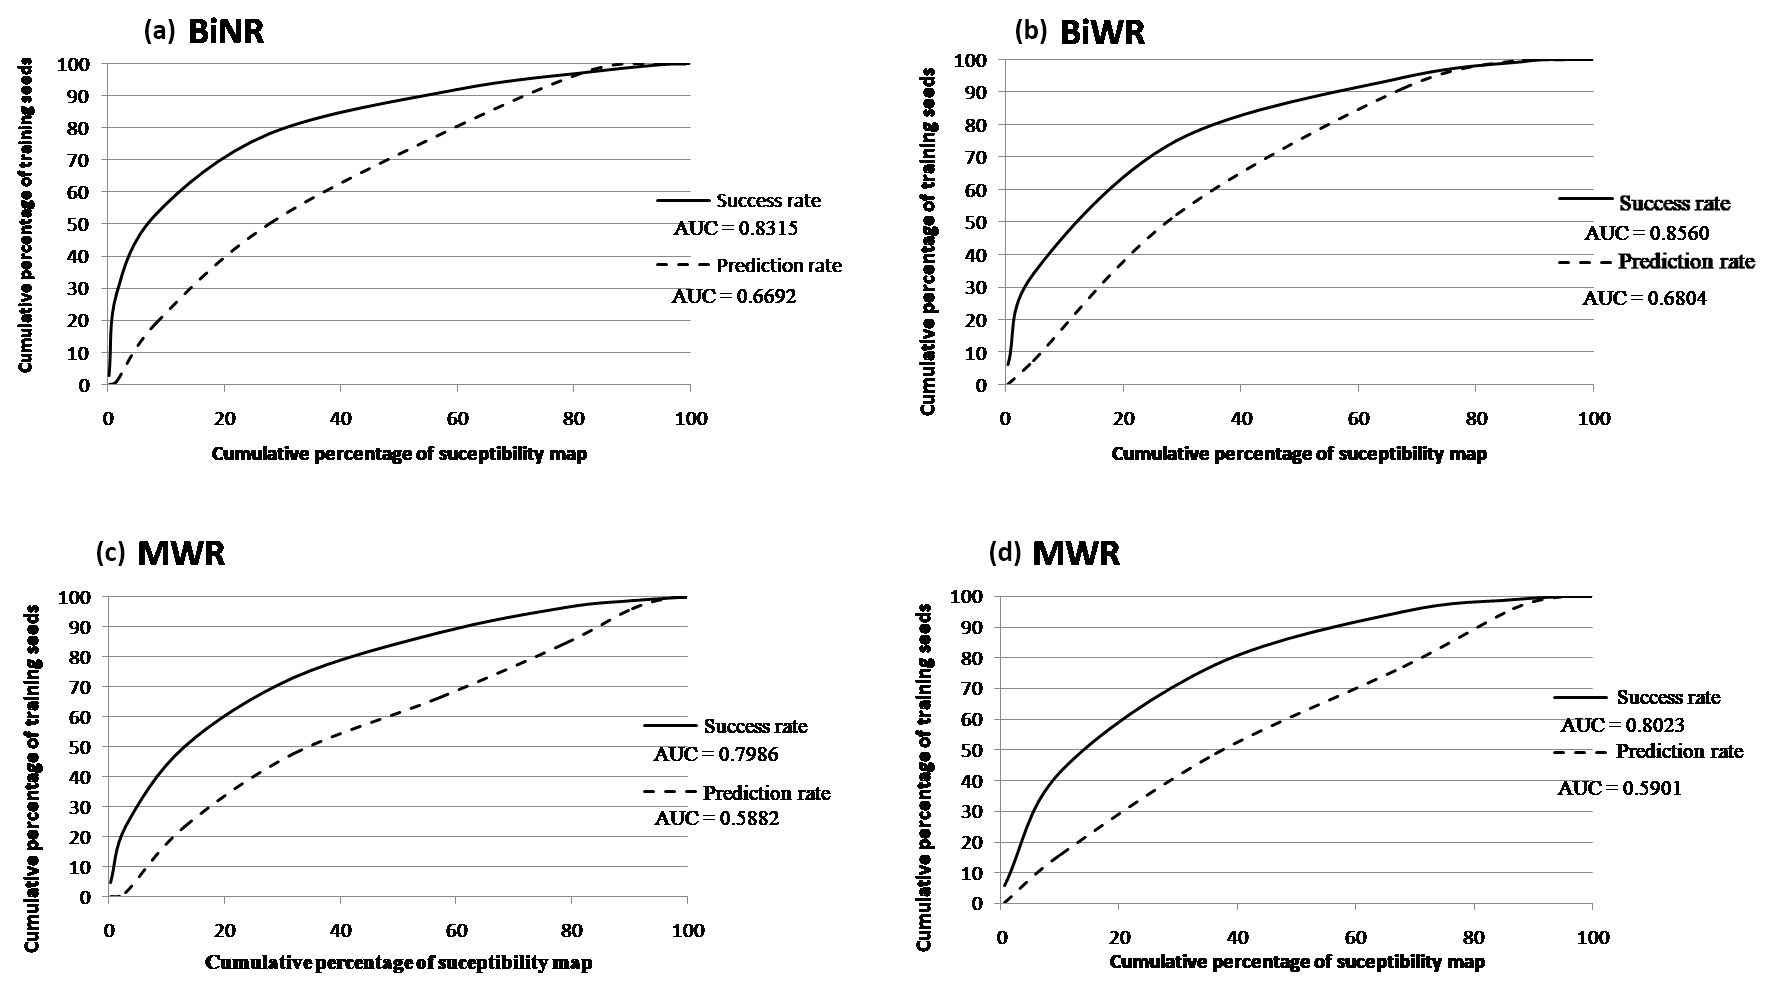
Figure 5Success rate and prediction rate curves with AUC for the bivariate and multivariate analysis with and without RDFs. The x axis denotes the cumulative percentage of susceptibility regions, and the y axis denotes the cumulative percentage of training samples. (a–d) BiNR – bivariate analysis without RDFs, BiWR – bivariate analysis with RDFs, MNR – multivariate analysis without RDFs, and MWR – multivariate analysis with RDFs.
The areas under the success rate curves measure how the landslide prediction analysis fit with the training data set, while the areas under the prediction rate curves measure how well the landslide prediction models and landslide causative factors predict the landslides. If the area under the ROC curve is closer to 1, the result of the test is excellent and vice versa, and when AUC is closer to 0.5, the result of the test is fair or acceptable (Kamp et al., 2008).
The AUCs of all the success rates are more-or-less near 0.80, indicating good prediction performances according to the definition. The AUCs of all the prediction rates are having values above 0.50, thereby indicating that they are within the acceptable range as per the definition. As such, they indicate that the accuracy of the prediction rate of land susceptibility and the selection of land causative factors are acceptable, but not excellent, even though the fit between the landslide prediction and the training data set is excellent as compared in Table 2. The incompleteness of the available landslide inventory map, as well as an insufficient number of validation samples in the study area, can be shown as reasons for the discrepancy. As a whole, better prediction and validation capabilities are shown by the bivariate analysis when compared with the multivariate approaches.
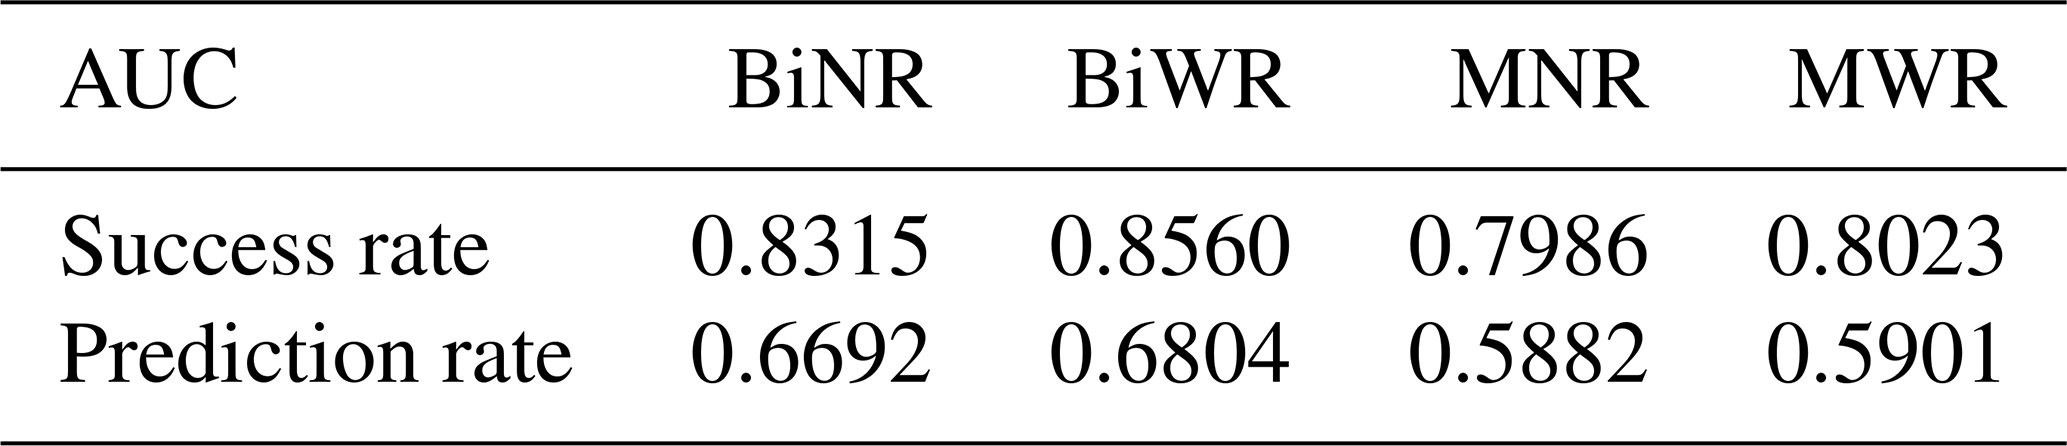
Table 2Comparison of area under success rate and prediction rate curves for bivariate analysis without RDFs (BiNR), bivariate analysis with RDFs (BiWR), multivariate analysis without RDFs (MNR), and multivariate analysis without RDFs (MWR).
This study focused on the applicability of remote sensing and GIS for rapid landslide prediction analysis at a finer scale. Furthermore, by considering the significance of radar data for landslide analysis, this study mainly investigates the efficacy of radar-derived factors for landslide prediction analysis, which is not well experimented in the current research. Most significant predisposing factors such as surface roughness, soil moisture, and forest biomass derived from radar are incorporated to examine the landslide prediction analysis. The prediction analysis is performed by using bivariate and multivariate statistical analysis.
The main difference between bivariate and multivariate analysis is that in multivariate analysis selected predisposing factors are weighted by considering how each of them are influenced for landslide susceptibility. This study investigated 15 landslide predisposing factors: elevation, slope, aspect, planar curvature, profile curvature, TWI, land use, lineament density, distance to hydrology, SMI in NDVI-T domain, geology, rainfall, soil moisture (delta index), surface roughness, and forest biomass. Most of the factors are derived from radar and optical remote sensing techniques, where smaller-scale studies with up-to-date information allow the work to be conducted with metre-level accuracy and repeated analysis simultaneously.
From the results obtained, it can be concluded that the bivariate and multivariate statistical analysis, with and without RDFs, can be used for landslide prediction analysis. However, with the integration of RDFs such as surface roughness, near-surface soil moisture from the delta index, and forest biomass, the detection of the boundary between the high- and very-low-susceptibility regions is increased. When comparing the bivariate analysis with multivariate, the increase of high- and very-low-susceptibility regions is higher in bivariate than multivariate. In landslide prediction analysis, the most important susceptibility classes are the high- and very-low-susceptibility classes, as they provide significant information about the danger from a disaster. Hence, with the integration of radar-derived factors, by increasing the accuracy of prediction for high-susceptibility regions, the possibility of mitigating dangers can be considerably improved. When the accuracy and prediction of very-low-susceptibility regions are increased, the use of such lands can be encouraged for residential, community places, and safe areas when a landslide occurs.
Successful prediction and validation of prediction analysis via ROC curves are achieved. Even though this study was tested for a sample area, the same methodology can be applied for any landslide-prone area to investigate the landslide prediction analysis using radar-derived factors by using bivariate and multivariate analysis. This is because the radar-derived factors can be derived for any area, as long as the data are available, and at any time under any weather conditions as radar is weather independent. Additionally, the technology can be learned easily and anyone can be trained to use this methodology to predict landslide susceptibility areas, and this is especially helpful for developing countries which do not have up-to-date data at fine resolutions. With the increasing availability of free data from optical sensors, radar sensors, and DEM, it is possible to derive more landslide predisposing factors such as thematic maps. Furthermore, there are many statistical analyses developed of a qualitative and quantitative nature for spatial data analysis. Hence, further investigations have to be performed for landslide susceptibility analysis, even focusing on the changing nature of the environments.
Landsat-8 data can be freely downloaded from USGS Earth Explorer (2018), https://gisgeography.com/usgs-earth-explorer-download-free-landsat-imagery/. Sentinel-1 and Sentinel-2A data can be freely downloaded from the Copernicus Open Access Hub (2018), https://scihub.copernicus.eu/dhus/\#/home. The DEM, predisposing factors, and other auxiliary data can be obtained by contacting the corresponding author by email (nishamanie@geo.sab.ac.lk).
The supplement related to this article is available online at: https://doi.org/10.5194/nhess-19-1881-2019-supplement.
AKRNR performed the conceptualization, data curation, formal analysis, funding acquisition, investigation, methodology, validation, visualization, and writing of the original draft; RB supervised the study and reviewed and edited the original draft of the manuscript. UGAP and TLD supervised the study.
The authors declare that they have no conflict of interest.
The authors wish to acknowledge the Sabaragamuwa University of Sri Lanka for offering an opportunity for this research and the HETC project, Ministry of Higher Education, Sri Lanka, for providing financial support under the grant number SUSL/O-Geo/N2 as well as the University of Siegen, Germany, for providing their support in collecting and initial processing of the TerraSAR-X images from DLR, Germany. The DLR, Germany, is acknowledged with appreciation for providing radar images free of charge, and the GSMB, Sri Lanka, is acknowledged for providing the geological data necessary for this research work freely.
This research has been supported by the HETC project, Ministry of Higher Education, Sri Lanka (SUSL/O-Geo/N2).
This paper was edited by Filippo Catani and reviewed by three anonymous referees.
Adiri, Z., Harti, A. E., Jellouli, A., Lhissou, R., Maacha, L., Azmi, M., Zouhair, M., and Bachaoui, E. M.: Comparison of Landsat-8, ASTER and Sentinel 1 satellite remote sensing data in automatic lineaments extraction: A case study of Sidi Flah-Bouskour inlier, Moroccan Anti Atlas, Adv. Space Res., 60, 2355–2367, 2017.
Ayalew, L., Yamagishi, H., and Ugawa, N.: Landslide susceptibility mapping using GIS-based weighted linear combination, the case in Tsugawa area of Agano River. Niigata Prefecture, Japan, Landslides, 1, 73–81, 2004.
Baroň, I., Bečkovský, D., and Míča, L.: Application of infrared thermography for mapping open fractures in deep-seated rockslides and unstable cliffs, Landslides, 11, 15–27, 2014.
Barrett, B. W., Dwyer, E., and Whelan, P.: Soil Moisture Retrieval from Active Spaceborne Microwave Observations: An Evaluation of Current Techniques, Remote Sensing, 1, 210–242, https://doi.org/10.3390/rs1030210, 2009.
Beven, K. J. and Kirkby, M. J.: A physically based, variable contributing area model of basin hydrology, Hydrology, 24, 43–69, 1979.
Bui, D. T., Lofman, O., and Revhaug, I. D. O.: Landslide susceptibility analysis in the HoaBinh province of Vietnam using statistical index and logistic regression, Nat. Hazards, 59, 1413–1444, 2011.
Caicoya, A. T., Kugler, F., Hajnsek, I., and Papathanassiou, K. P.: Large Scale Biomass Classification in Borel Forests with TanDEM-X Data., IEEE T. Geosci. Remote, 54, 5935–5951, 2016.
Carlson, T., Gillies, R., and Perry, E.: A method to Make use of Thermal Infrared Temperature and NDVI Measurements to Infer Surface Soil Water Content and Fractional Vegetation Cover, Remote Sensing Review, 9, 161–173, 1994.
Chae, B. G., Park, H. J., Catani, F., Simoni, A., and Berti, M.: Landslide Prediction, monitoring, and early warning: a concise review of state-of-the-art, J. Geosci., 21, 1033–1070, 2017.
Chalkias, C., Ferentinou, M., and Polykretis, C.: GIS-Based Landslide Susceptibility Mapping on the Peloponnese Peninsula, Greece, Geosciences, 4, 176–190, 2014.
Copernicus Open Access Hub: Sentinel-1 and Sentinel-2A data, https://scihub.copernicus.eu/dhus/\#/home, last access: 5 January 2018.
Corominas, J., van Westen, C., Frattini, P., Cascini, L., Malet, J. P., and Fotopoulou, S.: Recommendations for the quantitative analysis of landslide risk, Engineering Geology and the Environment, 73, 209–263, 2014.
EM-DAT, International Disaster Database – University of Catholique de Louvain, Brussels, Belgium, available at: http://www.em-dat.net, last access: 4 May 2016.
Jakob, M., Holm, K., Lango, O., and Schwab, J.: Hydrometeorological threshold for landslide initiation and forest operation shutdowns on the north coast of British Columbia, Landslides, 03, 228–238, 2006.
Kamp, U., Growley, B. J., Khattak, G. A., and Owen, L. A.: GIS-based landslide susceptibility mapping for the 2005 Kashmir earthquake region, Geomorphology 101, 631–642, 2008.
Kanungo, D. P., Arora, M. K., Sarkar, S., and Gupta, R. P.: Landslide susceptibility zonation (LSZ) mapping, Journal of South Asia Disaster Studies, 2, 81–105, 2009.
Kati, I. E., Nakhcha, C., Bakhchouch, O. E., and Tabyaoui, H.: Application of ASTER and Sentinel 2-A images for geological mapping in arid regions: the Safsafate Area in the Neogen Guercif basin, Northern Morocco, International Journal of Remote Sensing and GIS, 7, 2782–2792, 2018.
Kavzoglu, T., Sahin, E. K., and Colkesen, I.: Landslide susceptibility mapping using GIS-based multi-criteria decision analysis, support vector machines, and logistic regression, Landslides, 11, 425–439, 2014.
Kavzoglu, T., Sahin, E. K., and Colkesen, I.: An assessment of multivariate and bivariate approaches in landslide susceptibility mapping: a case study of Duzkoy district, Nat. Hazards, 76, 471–496, https://doi.org/10.1007/s11069-014-1506-8, 2015.
Kseneman, M., Gleich, D., and Potočnik, B.: Soil-moisture estimation from TerraSAR-X data using neural networks, Mach. Vision Appl., 23, 937–952, https://doi.org/10.1007/s00138-011-0375-3, 2012.
Kuplich, T. M., Curran, P. J., and Atkinson, P. M.: Relating SAR image texture to the biomass of regenerating tropical forests, Int. J. Remote Sens., 26, 4829–4854, 2005.
Lan, H. X., Zhou, C. H., Wang, L. J., Zhang, H. Y., and Li, R. H.: Landslide hazard spatial analysis and prediction using GIS in the Xiaojiang watershed, Yunnan, China, Eng. Geol., 76, 109–128, 2004.
Lee, S., Hong, S. M., and Jung, H. S.: A Support Vector Machine for Landslide Susceptibility Mapping in Gangwon Province, Korea, Journal of Sustainability, 9, 48, https://doi.org/10.3390/su9010048, 2017.
Mandal, S. and Maiti, R.: Geo-spatial Variability of Physiographic Parameters and Landslide Potentiality, in: Semi-quantitative Approaches for Landslide Assessment and Prediction, 1 ed., Springer, Singapore, 2015.
Martha, T.: Detection of landslides by object – oriented image analysis, PhD, Faculty of Geo-Information and Earth Observation, University of Twente, the Netherlands, 187 pp., 2011.
Muthu, K., Petrou, M., Tarantino, C., and Blonda, P.: Landslide possibility mapping using fuzzy approaches, IEEE T. Geosci. Remote, 46, 1253–1265, 2008.
NBRO (National Building Research Organization): Landslide Research and Risk Management Division, Ministry of Disaster management, Sri Lanka, available at: http://www.nbro.gov.lk, last access: 8 May 2016.
Neuhäuser, B., Damm, B., and Terhorst, B.: GIS-based assessment of landslide susceptibility on the base of the weights-of-evidence model, Landslides, 9, 511–528, 2012.
OFDA/CRED: EM-DAT International Disaster Database – University of Catholique de Louvain, Brussels, Belgium, available at: http://www.em-dat.net, last access: 4 May 2016.
Park, S., Choi, C., Kim, B., and Kim, J.: Landslide susceptibility mapping using frequency ratio, analytic hierarchy process, logistic regression, and artificial neural network methods at the Inje area, Korea, Environ. Earth Sci., 68, 1443–1464, 2013.
Pastonchi, L., Barra, A., Monserrat, O., Luzi, G., Solari, L., and Tofani, V.: Satellite Data to Improve the Knowledge of Geohazards in World Heritage Sites, J. Remote Sens., 10, 992, https://doi.org/10.3390/rs10070992, 2018.
Rahman, M. M., Moran, M. S., Thoma, D. P., Bryant, R., Holifield-Colins, C. D., and Jackson, T.: Mapping Surface Roughness and Soil Moisture using Multi-angular radar imagery without ancillary data, Remote Sens. Environ., 112, 391–402, 2008.
Reis, S., Yalcin, A., Atasoy, M., Nisanci, R., Bayrak, T., Erduran, M., Sancar, C., and Ekercin, S.: Remote sensing and GIS-based landslide susceptibility mapping using frequency ratio and analytical hierarchy methods in Rize province (NE Turkey), Environ. Earth Sci., 66, 2063–2073, 2012.
Remondo, J., González, A., Díaz de Terán's, J. R., Cendrero, A., Fabbri, A., and Chung, C. F.: Validation of landslide susceptibility maps; examples and applications from a case study in Northern Spain, Nat. Hazards, 30, 437–449, 2013.
Saaty, T. L.: The analytic hierarchy process, McGraw-Hill, New York, 1980.
Saha, A. K., Gupta, R. P., Sarkar, I., Arora, M. K., and Csaplovics, E.: An approach for GIS-based statistical landslide susceptibility zonation – with a case study in the Himalayas, Landslides, 2, 61–69, 2005.
Sano, E. E., Huete, A. R., Troufleau, D., Moran, M. S., and Vidal, A.: Relation between ERS-1 Synthetic Aperture Radar data and Measurements of Surface Roughness and Moisture Content of Rockey Soils in a semiarid rangeland, Water Resour. Res., 34, 1491–1498, 1998.
Sar, N., Khan, A., Chatterjee, S., Das, A., and Mipun, B. S.: Coupling of analytical hierarchy process and frequency ratio based spatial prediction of soil erosion susceptibility in Keleghari river basin, India, Journal of International Soil and Water Conservation Research, ISSN 2095-6339, Elsevier B. V., 2016.
Septiadi, D. and Nasution, A. M. T.: Determine Surface Roughness Level Based on Texture Analysis. ICACSIS-09, University of Indonesia, Jakarta, Indonesia, 7–8 December, International Conference on Advanced Computer Science and Information Systems, 2009.
Shahabi, H. and Hashim, M.: Landslide susceptibility mapping using GIS based statistical models and Remote sensing data in tropical environment, Sci. Rep.-UK, 5, 9899, https://doi.org/10.1038/srep09899, 2015.
Somaratne, M.: Challenges to Overcome: An Overview of Koslanda Landslide, Geological Society of Sri Lanka, available at: http://www.gsslweb.org/challenges-to-overcome-an-overview-of-koslanda-landslide/, last access: 15 February 2016.
Sørensen, R., Zinko, U., and Seibert, J.: On the calculation of the topographic wetness index: evaluation of different methods based on field observations, Hydrol. Earth Syst. Sci., 10, 101–112, https://doi.org/10.5194/hess-10-101-2006, 2006.
Thoma, D., Moran, M., Bryant, R., Holifield-Colins, C., Rahman, M., and Skirvin, S.: Comparison of Two Methods for Extracting Surface Soil Moisture from C-band Radar Imagery, IEEE T. Geosci. Remote, 4, 827–830, 2004.
Thoma, D. P., Moran, M. S., Bryant, R., Rahman, M., and Holifield-Colins, C. D.: Comparison of four models to determine surface soil moisture from C-band radar imagery in a sparsely vegetated semiarid landscape, Water Resour. Res., 42, W01418, https://doi.org/10.1029/2004WR003905, 2006.
USGS Earth Explorer: Download Free Landsat Imagery, available at: https://gisgeography.com/usgs-earth-explorer-download-free-landsat-imagery/, last access: 10 March 2018.
van Westen, C. J.: Statistical landslide hazard analysis. In: Application guide, ILWIS 2.1 for Windows, ITC, Enschede, the Netherlands, 73–84, 1997.
van Westen, C. J. and Getahun, F. L.: Analysing the evolution of the Tessina Landslide using aerial photographs and digital elevation models, Geomorphology, 54, 77–89, 2003.
van Westen, C. J., Rengers, N., and Soeters, R.: Use of geomorphological information in indirect landslide susceptibility assessment, Nat. Hazards, 30, 399–419, 2003.
Wang, L. and Qu, J. J.: Satellite Remote Sensing applications for Surface Soil Moisture Monitoring: A review, Frontiers of Earth Science in China, 3, 237–247, https://doi.org/10.1007/s11707-009-0023-7, 2009.
Zenga, Y., Fengb, Z., and Xianga, N.: Assessment of soil moisture using Landsat ETM+ temperature/vegetation index in semiarid environment, Geoscience and Remote Sensing Symposium, IGARSS '04, Anchorage, AK, 4306–4309, 2004.
Zhan, X., Miller, S., Chauhan, N., Di, L., Ardanuy, P., and Running, S.: Soil Moisture Visible/Infrared Imager/Radiometer Suite Algorithm Theoretical Basis Document, Version 5, 2002.