the Creative Commons Attribution 4.0 License.
the Creative Commons Attribution 4.0 License.
 | 15 Aug 2019
How size and trigger matter: analyzing rainfall- and earthquake-triggered landslide inventories and their causal relation in the Koshi River basin, central Himalaya
Cees J. van Westen
Hakan Tanyas
Olga Mavrouli
Yonggang Ge
Samjwal Bajrachary
Deo Raj Gurung
Megh Raj Dhital
Narendral Raj Khanal
Inventories of landslides caused by different triggering mechanisms, such as earthquakes, extreme rainfall events or anthropogenic activities, may show different characteristics in terms of distribution, contributing factors and frequency–area relationships. The aim of this research is to study such differences in landslide inventories and the effect they have on landslide susceptibility assessment. The study area is the watershed of the transboundary Koshi River in the central Himalaya, shared by China, Nepal and India. Detailed landslide inventories were generated based on visual interpretation of remote-sensing images and field investigation for different time periods and triggering mechanisms. Maps and images from the period 1992 to 2015 were used to map 5858 rainfall-triggered landslides, and after the 2015 Gorkha earthquake, an additional 14 127 coseismic landslides were mapped. A set of topographic, geological and land cover factors were employed to analyze their correlation with different types and sizes of landslides. The frequency–area distributions of rainfall- and earthquake-triggered landslides (ETLs) have a similar cutoff value and power-law exponent, although the ETLs might have a larger frequency of a smaller one. In addition, topographic factors varied considerably for the two triggering events, with both altitude and slope angle showing significantly different patterns for rainfall-triggered and earthquake-triggered landslides. Landslides were classified into two size groups, in combination with the main triggering mechanism (rainfall- or earthquake-triggered). Susceptibility maps for different combinations of landslide size and triggering mechanism were generated using logistic regression analysis. The different triggers and sizes of landslide data were used to validate the models. The results showed that susceptible areas for small- and large-size rainfall- and earthquake-triggered landslides differed substantially.
- Article
(9342 KB) - Full-text XML
- BibTeX
- EndNote


Landslides are one of the most harmful geological hazards causing substantial fatalities and loss of property worldwide, affecting settlements, agriculture, transportation infrastructure and engineering projects (Dilley et al., 2005; Petley, 2012; Zhang et al., 2015; Haque et al., 2016). Among the various characteristics that determine the potential damage of landslides, size plays an important role, as well as velocity, depth, impact pressure or displacement, which differs for the various mass movement types. Volume may be an even more important landslide characteristic than size, but this is difficult to measure as it requires specific geophysical or geotechnical methods that can be applied at a site investigation level or the use of multitemporal digital elevation models (SafeLand, 2015; Martha et al., 2017a). Therefore, empirical relations between landslide area and volume are generally used (Hovius et al., 1997; Dai and Lee, 2001; Guzzetti et al., 2008; Larsen et al., 2011; Klar et al., 2011; Larsen and Montgomery, 2012). To investigate whether earthquake- and rainfall-triggered landslide (ETL and RTL) inventories have similar area–frequency distributions, area–volume relations and spatially controlling factors, it is important to collect event-based landslide inventories. The difficulty is in collecting complete inventories that are independent for earthquakes and rainfalls in same study area.
The quality of a landslide inventory can be indicated by its accuracy, which refers to the correctness in location and classification of the landslides, and its completeness, which measures how many of the total number of landslides in the field were actually mapped (Guzzetti et al., 2012). The accuracy and completeness have a large influence on the quality and reliability of the susceptibility and hazard maps that are using the inventory as input (e.g. in statistical modeling) and in validation (e.g. statistical and physically based modeling) (Li et al., 2014). There are several explanations for why landslide inventories differ in frequency–area distribution, such as the undersampling of small slides (Stark and Hovius, 2001) or the amalgamation, the merging of several landslides into single polygons (Marc and Hovius, 2015).
Landslides might be triggered by various processes, among which are anthropogenic activities, volcanic processes, sudden temperature changes, earthquakes and extreme rainfall (Highland and Bobrowski, 2008). The latter two are the most frequently occurring and cause the highest number of casualties (Keefer, 2002; Petley, 2012; Kirschbaum et al., 2015; Froude and Petley, 2018). Comparing landslide inventories for the same area and for the same triggering event has been carried out by several authors (e.g. Pellicani and Spilotro, 2015; Tanyas et al., 2017). Some studies took independent earthquake- and rainfall-triggered landslide inventories to compare the characteristics of landslides induced by different triggers. Malamud et al. (2004) compared earthquake-triggered landslides from the Northridge earthquake, Umbria snowmelt-triggered landslide, and Guatemala rainfall-triggered landslide as examples and concluded that the three frequency–area distributions were in good agreement with each other. Meunier et al. (2008) compared earthquake-triggered landslides, from Northridge, Chi-Chi and Finisterre Mountains (Papua New Guinea), to evaluate topographic site effects on the distribution of landslides. Tanyas et al. (2018) created a database with 363 landslide-triggering earthquakes and 64 digital landslide inventories, which were compared. The number of studies that compare earthquake-triggered landslides with rainfall-triggered ones for the same area is lower. They mostly focus on mapping rainfall-induced landslides after an earthquake, such as for the 1999 Chi-Chi earthquake (Lin et al., 2006, 2008), the 2005 Kashmir earthquake (Saba et al., 2010) or the 2008 Wenchuan earthquake (Tang et al., 2010, 2016; Fan et al., 2018a). A few studies were carried out on multitemporal RTL inventories in Taiwan, Papua New Guinea, Japan and Central Nepal before an earthquake, which supplied a good comparison study for RTLs under the effect and without the effect of earthquakes (Marc et al., 2015, 2019). The problem with the studies indicated above is that rainfall-triggered landslides that occur shortly after a major earthquake are generally following the same spatial patterns, due to the availability of large volumes of landslide materials of the coseismic landslides (Hovius et al., 2011; Tang et al., 2016; Fan et al., 2018a). However, other studies argue that there is not a clear correlation of rainfall-triggered landslides with the coseismic pattern, as only the 20 %–30 % of the RTLs that occurred just after an earthquake are spatially related to ETLs, suggesting limited reactivation of ETLs by RTLs (Marc et al., 2015, 2019).
Landslide susceptibility was employed to define the likelihood or probability of occurrence of landslides in a regional scale, which can supply valuable information for landslide disaster prevention or land-use planning (Wachal and Hudak, 2000; Dai et al., 2001). There are very few studies that have validated landslide susceptibility maps with independent landslide inventories of triggering events that occurred after the maps were produced. Chang et al. (2007) used landslides triggered by a major earthquake and a typhoon prior to the earthquake to develop an earthquake-induced model and a typhoon-induced model. The models were then validated by using landslides triggered by three typhoons after the earthquake. According to the results, typhoon-triggered landslides tended to be near stream channels and earthquake-triggered landslides were more likely to be near ridge lines. Although landslide size is often considered important in hazard and risk assessment, it is generally not considered a separate component of the susceptibility assessment. The different relation with contributing factors of earthquake-triggered and rainfall-triggered landslides may also be related to the size distribution (Korup et al., 2007). For instance, Fan et al. (2012) concluded that small (<10×104 m3) rainfall-triggered landslides and earthquake-triggered landslides have similar runout distances, whereas for larger landslides earthquake-triggered ones showed longer runouts. Peng et al. (2014) analyzed the landslides in the Three Gorges area and found that different landslide sizes had different relations with contributing factors.
The aim of this study is to investigate the differences in the characteristics of earthquake-triggered and rainfall-triggered landslides in terms of their frequency–area relationships, spatial distributions and relation with contributing factors, as well as to evaluate whether separate susceptibility maps generated for specific landslide sizes and triggering mechanism are better than a generic landslide susceptibility assessment including all landslide sizes and triggers. This research aims to address a number of questions related to the difference in using earthquake-induced and rainfall-induced landslide inventories for the generation of landslide susceptibility maps. The question of whether different landslide size groups are controlled by different sets of contributing factors and, by extension, whether it is possible to utilize inventories of earthquake-triggered landslides as inputs for analyzing the susceptibility of rainfall-triggered landslides and vice versa will be addressed.
The study was carried out in the Koshi River basin, which is a transboundary basin located in China, Nepal and India in the central Himalaya (Fig. 1a). The mountainous regions in the upper reaches of the basin where landslides have occurred are located in China and Nepal, and the Indian part consists of relatively flat areas. The elevation of the Koshi River basin varies from 60 m a.s.l. at the outlet in India up to 8844 m at the highest point at Mount Everest. The Koshi basin can be classified into six physiographic zones from south to north: Terai, Siwalik Hills, Mahabharat Lekh, Middle Mountains, High Himalaya and the Tibetan Plateau (Gurung and Khanal, 1986–1988; Dhital, 2015). Considering the distribution of landslides, the Tibetan Plateau in the upper reaches and the plains in the lower reaches were excluded.
In the Koshi basin, the major geological structures have an approximate east–west orientation, such as the foreland thrust–fold belt, the Main Central Thrust (MCT), the South Tibetan Detachment System (STDS) and the Yarlung Zangbo Suture Zone (YZSZ) (Gansser, 1964; Dhital, 2015). The southernmost part of the basin consists of the Quaternary sediments underlain by the Neogene Siwaliks. The Siwaliks comprise soft mudstones, sandstones and conglomerates. In this part of the foreland basin, a number of emergent and blind imbricate faults originate from the Main Himalayan Thrust. The overlying Lesser Himalayan succession forms duplexes and imbricate stacks. The Proterozoic to Miocene rocks of the Lesser Himalaya include limestones, dolomites, slates, phyllites, schists, quartzites and gneisses (Dhital, 2015). A regional-scale thrust MCT separates the Lesser Himalayan sequence from the overlying High Himalayan crystallines, which consist of medium- to high-grade metamorphic rocks (e.g., schists, quartzites, amphibolites, marbles, gneisses and migmatites) and granites aged from the Proterozoic to Miocene. The STDS delineates the High Himalayan rocks from the overlying Tethyan sedimentary sequence of the Paleozoic–Cenozoic age (Gansser, 1964; Burg et al., 1984; Hodges et al., 1996) (Fig. 1b).
In the study area there are three main tributaries of the Koshi River: the Arun (main branch) coming from the north, the Sunkoshi from the west and Tamor from the east. Nearly every year, during the monsoon period, which generally lasts from June to September, the area is affected by rainfall-triggered landslides. Dahal and Hasegawa (2008) used a dataset of 193 landslides occurring from 1951 to 2006, part of which were from the Koshi River basin, to generate a threshold relationship between rainfall intensity, rainfall duration and landslide initiation. The latest research from Marc et al. (2019) gives the magnitude of annual landsliding in different High Himalayan valleys.
The area was severely affected by the Gorkha earthquake, with a moment magnitude of 7.8 on 25 April 2015. The epicenter was located near Gorkha, which is about 80 km west of the study area. A second major earthquake occurred along the same fault on 12 May 2015 with a moment magnitude of 7.3, with the epicenter located inside the Koshi River basin. The second event is considered a major aftershock of the main Gorkha earthquake. Both events triggered many landslides (Collins and Jobson, 2015; Kargel et al., 2016; Zhang et al., 2016; Martha et al., 2017b).
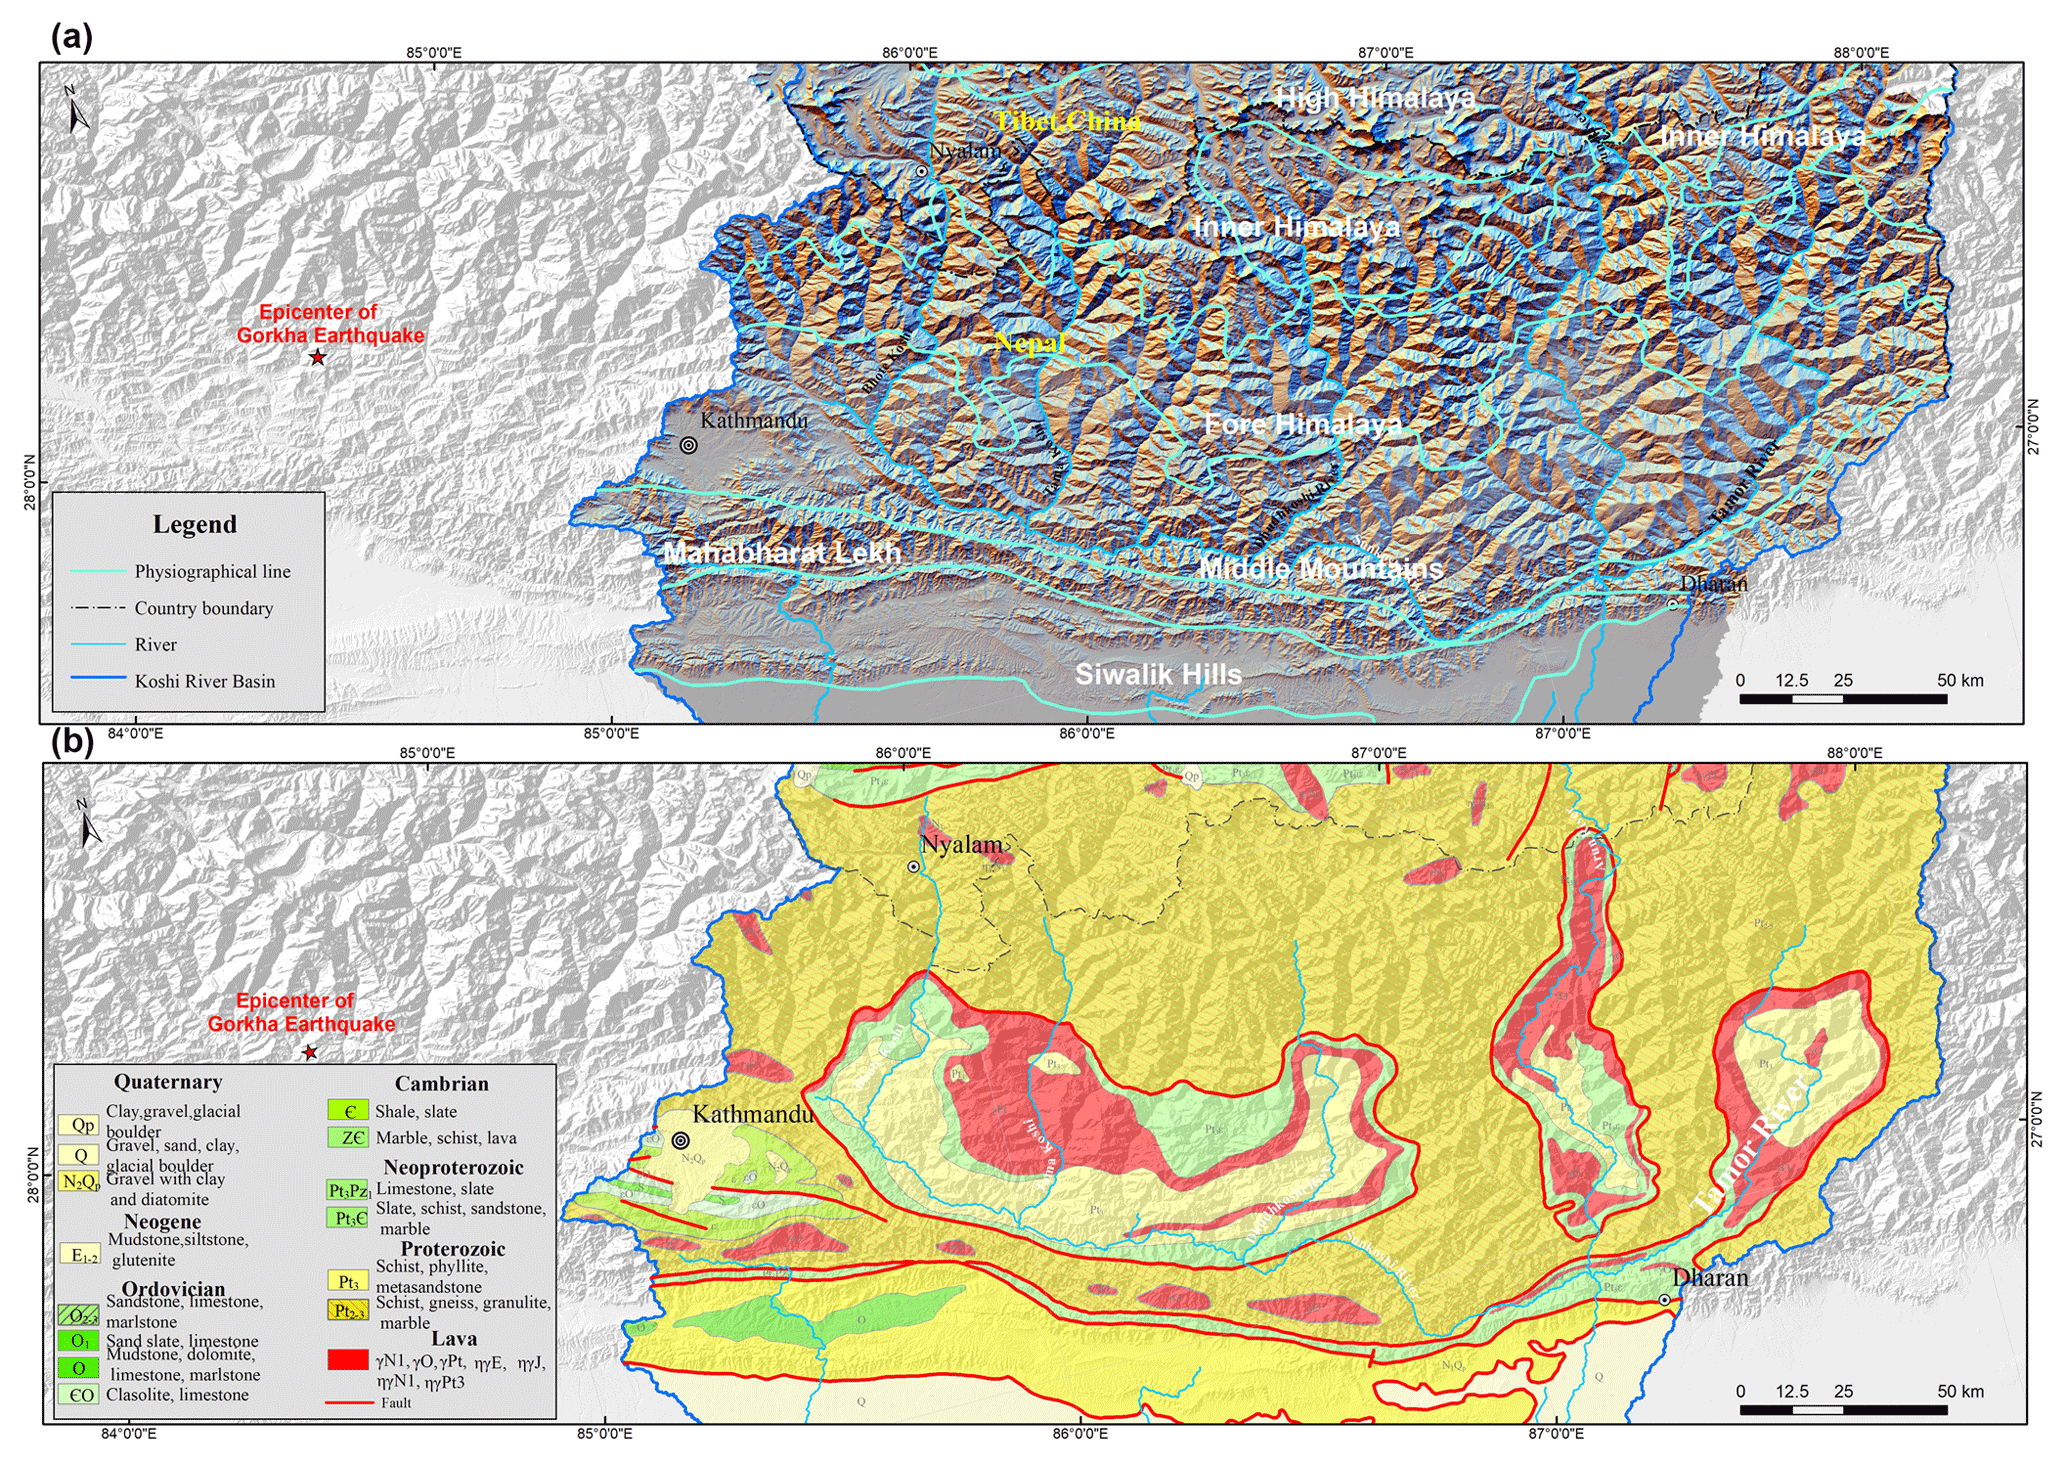
Figure 1Maps showing the study area. (a) Physiographic zones of the Koshi River basin. (b) Geological map showing the main geological zones (Dhital, 2015; Zhang et al., 2016).
The study requires a series of landslide inventory maps and contributing factor maps, which were generated for the middle part of the Koshi basin, where most of the landslides were concentrated. Two landslide inventories were generated: a pre-2015 inventory showing rainfall-triggered landslides, and a coseismic landslide map for the 2015 Gorkha earthquake. The pre-2015 inventory map was generated using topographic maps, multitemporal Google Earth Pro images and Landsat ETM/TM images. We were able to digitize landslide polygons from the available 1:50 000 scale topographic maps, which cover only the Nepalese part of the Koshi River basin. These maps were generated from aerial photographs acquired in 1992, and active landslides with a minimum size of 450 m2 visible on these images were marked as separate units. The landslides could not be separated in initiation and accumulation zones, and also no classification of landslide types could be done, as this was not indicated on the topographic maps. A set of pre-2015 Landsat ETM/TM images were available for the entire study area, including from the post-1992 and pre-2015 landslides. Pre-2015 landslides were also mapped from historical images using the Google Earth Pro Historical Imagery Viewer, which contains images from 1984 onwards. Although the oldest images are Landsat images, the more recent ones have much higher resolution, although not covering the whole study area in equal level of detail. By comparing the different images for the period between 1992 and 2015 we were able to recognize most of the landslides. We carried out field verification for a number of samples (Fig. 2). Images from Google Earth were downloaded and geo-referenced, and landslides were mapped using visual image interpretation and screen digitizing. A total of 5858 rainfall-induced landslides were identified in the Koshi River basin. This inventory has a limitation that a landslide that occurred and revegetated during 1992 to 2015 could not be identified by the remote-sensing images obtained in 2015. It is impossible to make a complete historical landslide inventory in this region due to a lack of multitemporal high-resolution images (Marc et al., 2019).
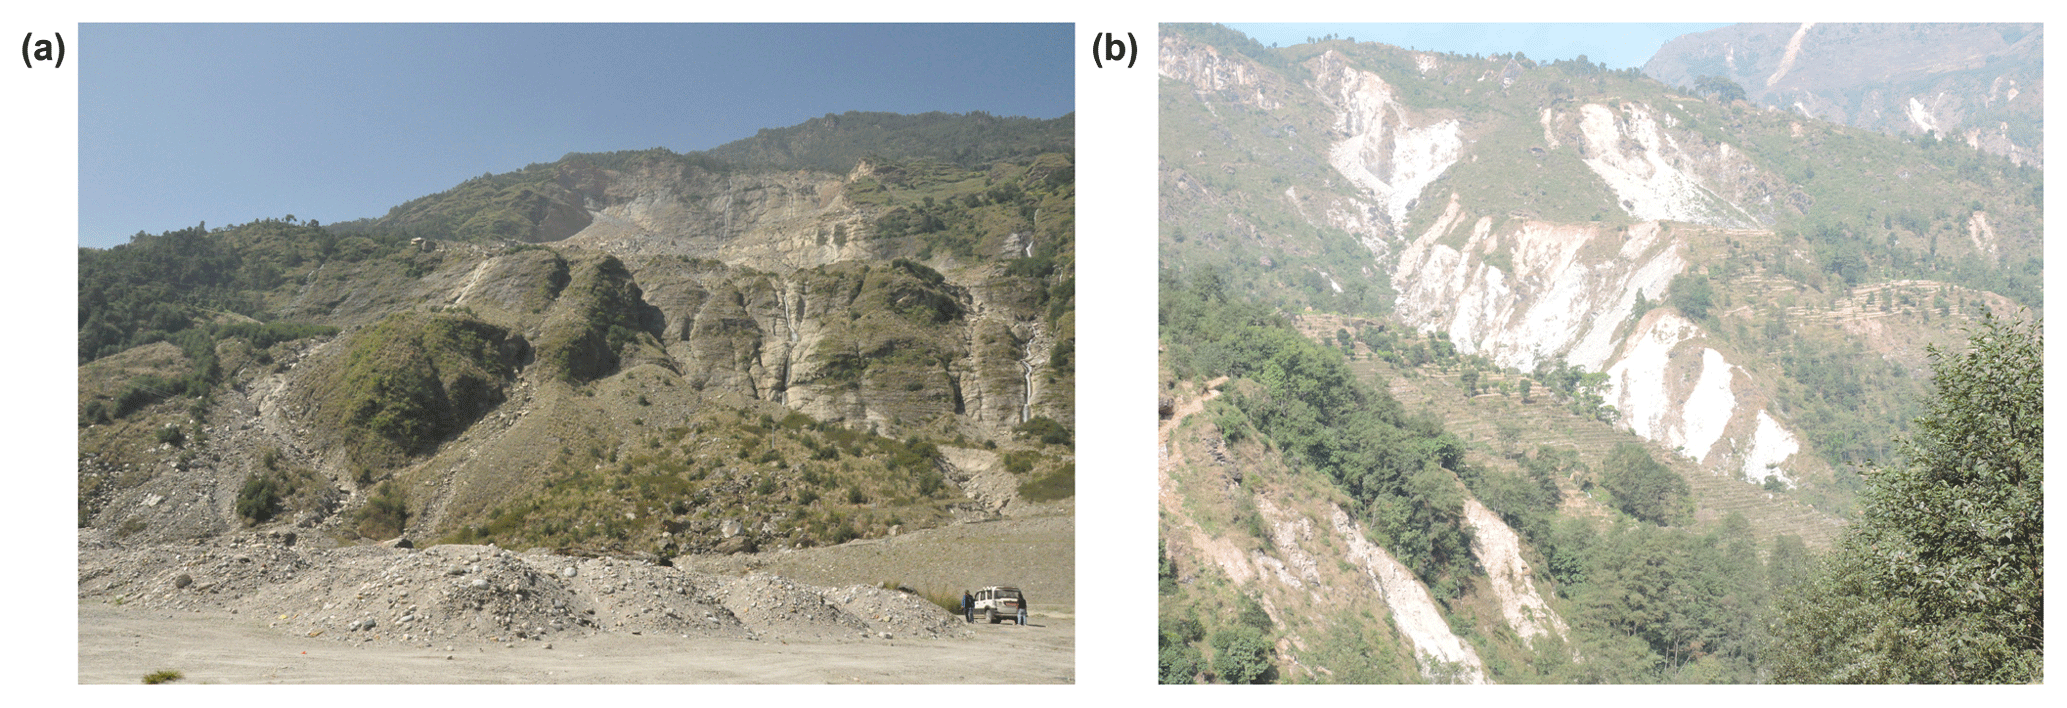
Figure 2Field investigation on landslide in the Koshi River basin. (a) Jure landslide triggered by rainfall which occurred on 2 August 2014 at the Sunkoshi river (photo by Bintao Liu in 2017). (b) Small-size landslides triggered by the Gorkha earthquake in the Bhote Koshi watershed.
After the 25 April 2015 Gorkha earthquake, a substantially complete earthquake-triggered landslide inventory was created by Roback et al. (2017). They mapped landslides using high-resolution (<1 m pixel resolution) pre- and postevent satellite imagery. In total 24 915 landslide areas were mapped, of which 14 022 landslides were located in the Koshi River basin. Chinese Gaofen-1 and Gaofen-2 satellites imageries (with 2.5 m resolution) of the CNSA (China National Space Administration), which are part of the HDEOS (High-Definition Earth Observation Satellite) program, were employed to validate this landslide inventory. These images were captured during 27 April to 14 May 2015. Finally 15 landslide polygons were deleted, and 120 landslides were added to the inventory.
For the susceptibility assessment, we extracted the point located in the highest part of the landslides, as indicative of the initiation conditions. Different digital elevation models (DEMs), such as the ASTER GDEM and SRTM DEM, both with 90 and 30 m spatial resolution, and ALOS PALSAR DEM were evaluated for use in this study. After careful analysis, however, both ASTER GDEM and 30 m SRTM contained many erroneous data points; ALOS PALSAR DEM with a highest resolution of 12.5 m was utilized in this study. ESRI ArcGIS software enabled the calculation of topographical factors including slope gradient, aspect and curvature. Streams and gullies were obtained through DEM processing, and the drainage density was calculated. The land cover dataset GlobeLand30 with 30 m×30 m spatial resolution, developed by the National Geomatics Center of China, was employed in this study. The land cover types include cultivated land, forest, grassland, shrub land, wetland, water bodies, tundra, artificial surfaces and bare land. Geological maps of Nepal and Tibet were obtained from Chengdu Geological Survey Center of the China Geological Survey. The peak-ground-acceleration data for the Gorkha earthquake were obtained from USGS ShakeMap, which was designed as a rapid response tool to portray the extent and variation of ground shaking throughout the affected region immediately following significant earthquakes (Wald et al., 1999). Given the rather low resolution of the input data, the relation with landslides as small as 50 m2 may not be optimal, especially also considering the rather long time period over which land cover changes have occurred in many areas. But given the regional scale of this analysis, the use of higher-resolution data was unfortunately not a viable option.
Figure 3 gives an overview of the method followed in this study. The landslide inventories were subdivided into training and test datasets. It is a generally accepted method in the literature to separate the landslide dataset into a training and validation set (e.g. Hussin et al., 2016; Reichenbach et al., 2018), although the separation thresholds differ among authors. We decided to select 60 % of the landslide data as training data for the modeling and 40 % for the validation. We examined the frequency–area distribution of the gathered inventories using the method described by Clauset et al. (2009). They proposed a numerical method to identify the slope of the power-law distribution (β) and the point where the frequency–area distribution diverges from the power law (cutoff point).
Based on the frequency–area distribution the RTL and ETL inventories were separated in two size groups each. Initially bivariate statistical analysis was used for the different types and sizes of landslides to investigate the correlation between landslides with contributing factors. After selecting the relevant factors, the logistic regression method was used to build the susceptibility model for each size group. The logistic regression method is the most commonly used model in landslide susceptibility assessment (Ayalew and Yamagish, 2005; Bai et al., 2010; Das et al., 2000; Nandi and Shakoor, 2010; Wang et al., 2013). For the susceptibility modeling of RTLs, the following factors were used: altitude (x1), slope gradient (x2), curvature (x3), slope aspect (x4), relative relief (x5), drainage density (x6), lithology (x7), distance to faults (x8), land cover type (x9), and precipitation during monsoon (x10). For the susceptibility modeling of ETLs, precipitation during monsoon (x10) was instead peak ground acceleration (x10). The statistical software R developed at Bell Laboratories was used to build the models for different types and sizes of landslides respectively. ROC (receiver operating characteristic) curves (Fawcett, 2006) were used to verify the accuracy of the susceptibility models, and finally six landslide susceptibility maps were generated and compared (Fig. 3).

Figure 3Methodology for susceptibility assessment of different types and sizes of landslides.
In the Koshi River basin, a total of 5858 RTLs were mapped. The Gorkha earthquake triggered more than 25 020 landslides, of which 14 127 were located in the Koshi River basin. Landslide characteristics were analyzed based on frequency–area distribution and factor statistics (Fig. 4).

Figure 4Landslide inventories of the Koshi River basin. (a) Rainfall-induced landslide inventory of events before 1992. (b) Rainfall-induced landslide inventory for the period between 1992 and 2015. (c) Inventory of landslides triggered by the 2015 Gorkha earthquake (Roback et al., 2017).
5.1 Landslide frequency–area distributions
Size statistics of landslides are analyzed using frequency–area distribution curves of landslides (e.g., Malamud et al., 2004). There is a large amount of literature arguing that the frequency–area distribution of medium and large landslides has a power-law distribution which diverges from the power law towards smaller sizes (e.g., Hovius et al., 1997, 2000; Malamud et al., 2004). Given this argument, we can identify the divergence point of the frequency–area distribution curve to determine site-specific threshold values referring to the limit between medium and small landslides.
The frequency–area distributions (FADs) of landslides were separately analyzed for both RTL and ETL inventories (Fig. 5). For the RTLs both landslide inventory datasets of before 1992 and 1992–2015 were analyzed (Fig. 5a). For the ETLs of the Gorkha earthquake, landslides located in the Koshi River basin were analyzed separately from the entire landslide-affected area. We obtained similar β values for the RTLs triggered before 1992 (β=2.44) and triggered from 1992 to 2015 (β=2.38) (Fig. 5a). On the other hand, we observe larger differences between the β values obtained for ETL inventories created for both the Koshi River basin and the entire landslide-affected area (Fig. 5b).
We also examine the cutoff values of inventories. The historical RTL inventories and ETL inventory that we examined for both the Koshi River basin and the entire landslide-affected area gave similar cutoff values changing from 24 884 to 32 913 m2 (Fig. 5). This finding shows that the limit between small and large landslides is consistently obtained from these inventories to be about 30 000 m2. Given this finding, the proposed landslide size classification system of China in Tong et al. (2013) seems like an acceptable approach for our study area. They proposed a classification with landslides with an area smaller than 10 000 m2 as small, those with an area between 10 000 and 100 000 m2 as medium, and those with larger sizes than 100 000 m2 as large-size landslides. Considering this study, and the cutoff values calculated in our study, 30 000 m2 was picked as a threshold value for large landslides.
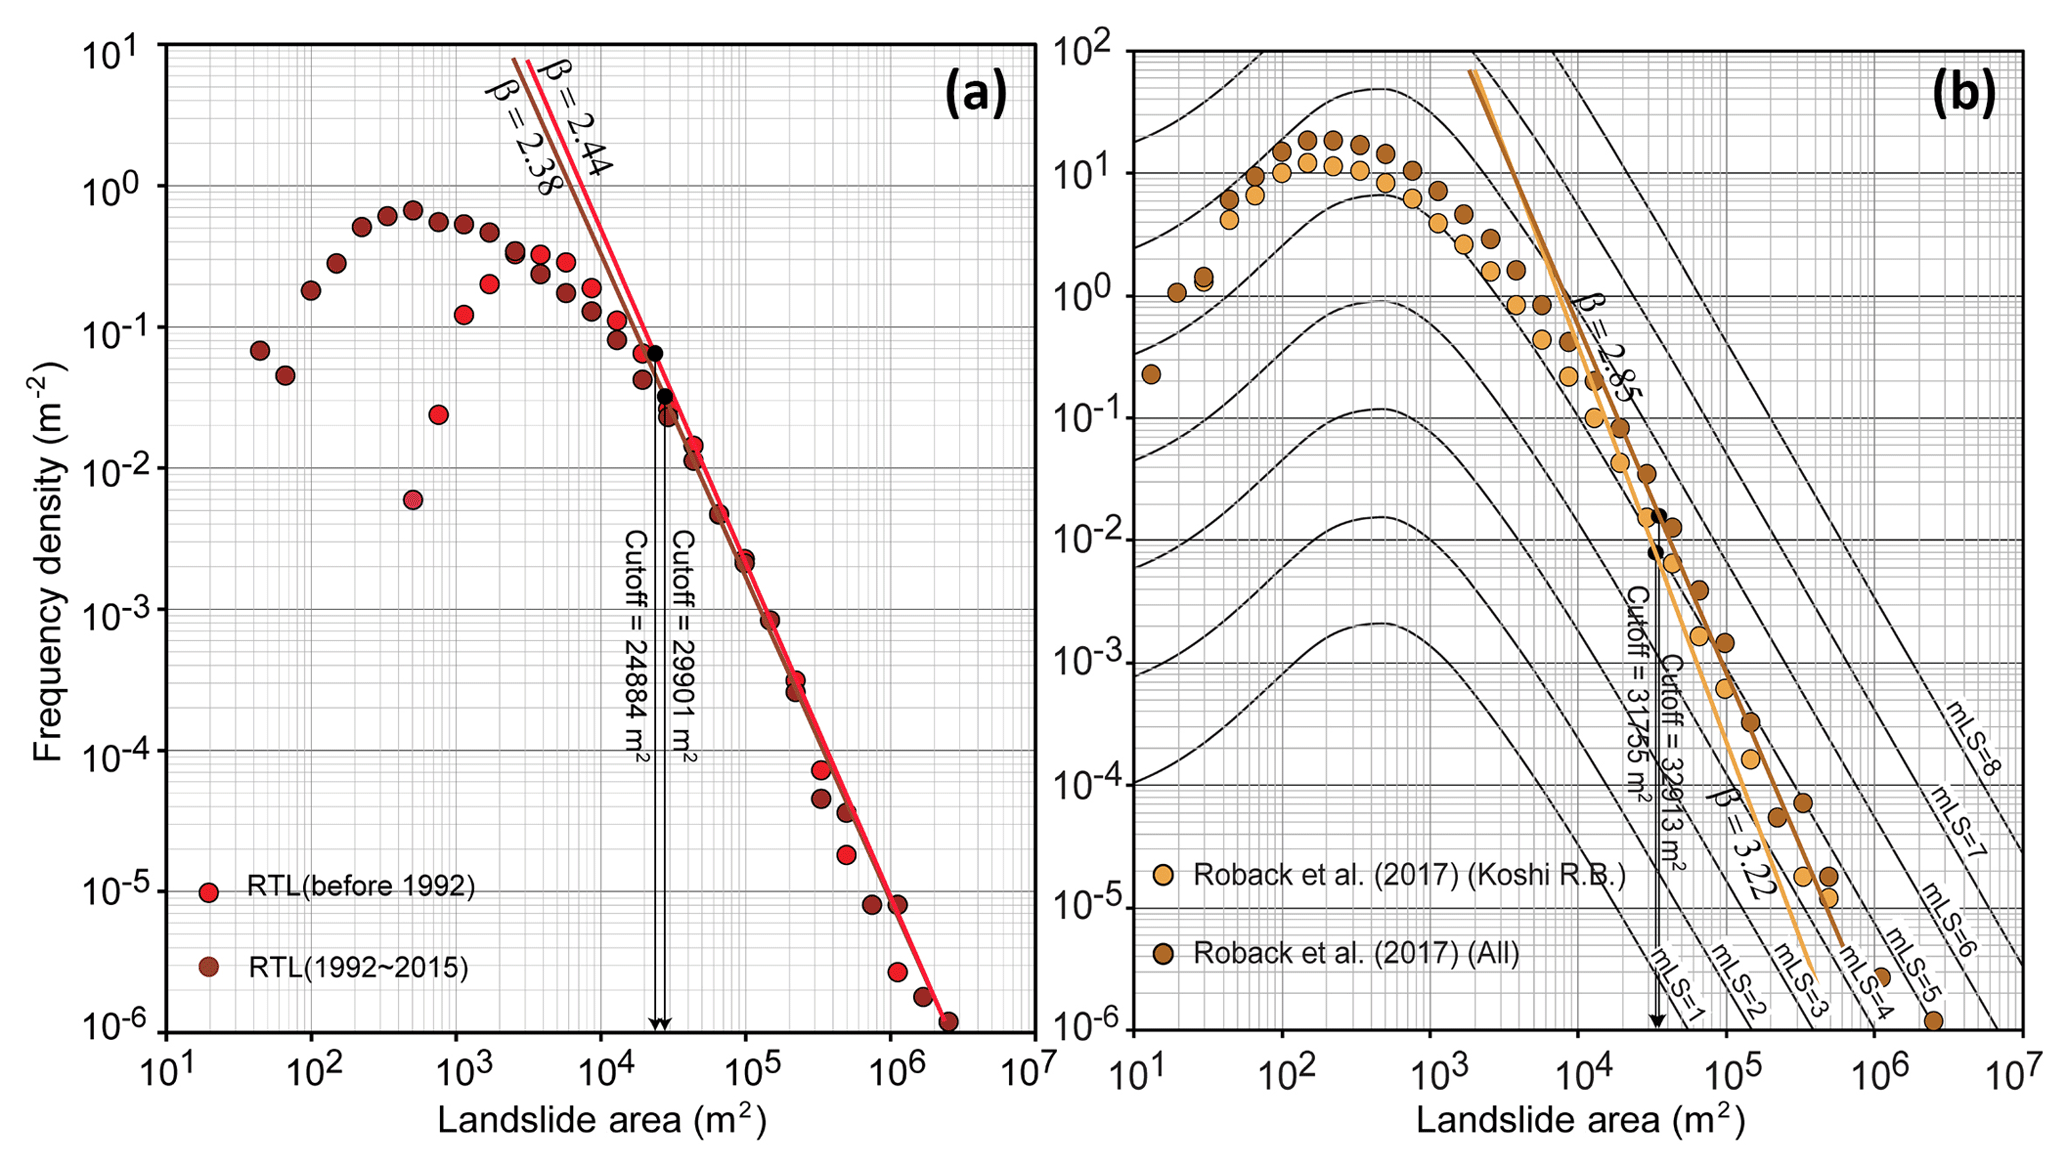
Figure 5Landslide frequency – area distributions of (a) RTL inventories and (b) ETL inventories created for the Koshi River basin and ETL inventories created for the entire landslide-affected area of the 2015 Gorkha, Nepal, earthquake (Roback's landslide inventory was validated). Cutoff and β values are calculated using the method proposed by Clauset et al. (2009).
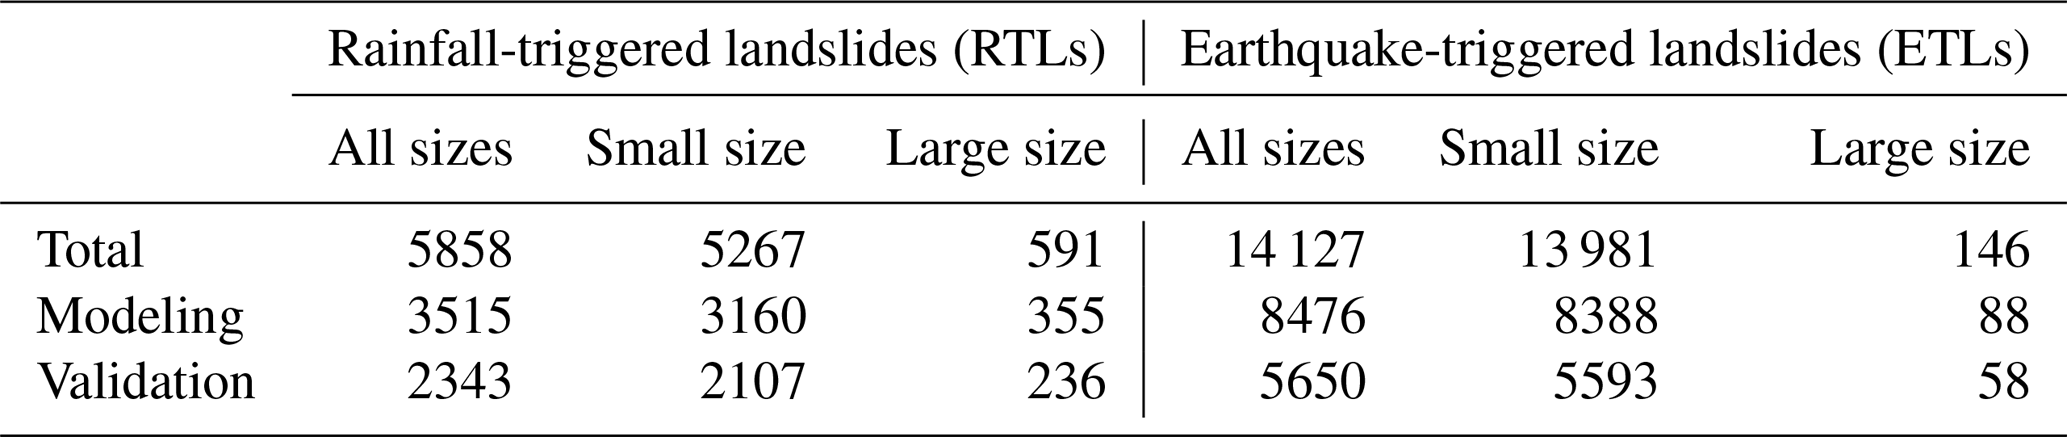
Based on the results of the FAD analysis that resulted in similar cutoff values for the RTLs and ETLs and similar β values, we subdivided them into two size groups, with 30 000 m2 as threshold value (Table 1). The results will therefore be more reliable for the class above the threshold of 30 000 m2, where undersampling is not an issue, than for the small landslide class, which has different rollover points and completeness levels.
Table 1Numbers for different types and sizes of landslides in the Koshi River basin.
5.2 Correlation of landslides with contributing factors
In order to evaluate their relation with landslide occurrence the factor maps were analyzed using the frequency ratio method (Razavizadeh et al., 2017).
where E is the area of landslides in the conditioning factor group, F is the area of landslides in the entire study area, M is the area of the conditioning factor group and L is the entire study area. The analysis was carried out for different triggers and size groups, and each time two factors were combined (e.g. altitude with slope gradient, altitude with slope direction, lithology with slope gradient). The results are summarized in Fig. 6. Figure 6a and b show that rainfall-triggered landslides are more frequent in low-altitude areas than earthquake-triggered landslides. However, it is important to keep in mind that the ETL inventory is an event inventory of a single earthquake where the epicenter was located at higher altitude (See Fig. 4), and the RTL inventory is a multitemporal inventory showing the accumulated inventory of many individual events.
Figure 6c and d show the relation with slope and lithology. RTLs are concentrated in Proterozoic metamorphic lithological units (Pt3), consisting of schist, phyllite and metasandstone; and in Quaternary molasse (N2Qp) units, consisting of gravel and clay (See Fig. 1). ETLs are linked to units consisting of shale and slate (Pt3ϵ), as well as Cambrian units consisting of shale and slate (ϵ) and marble, schist and lava (Zϵ).
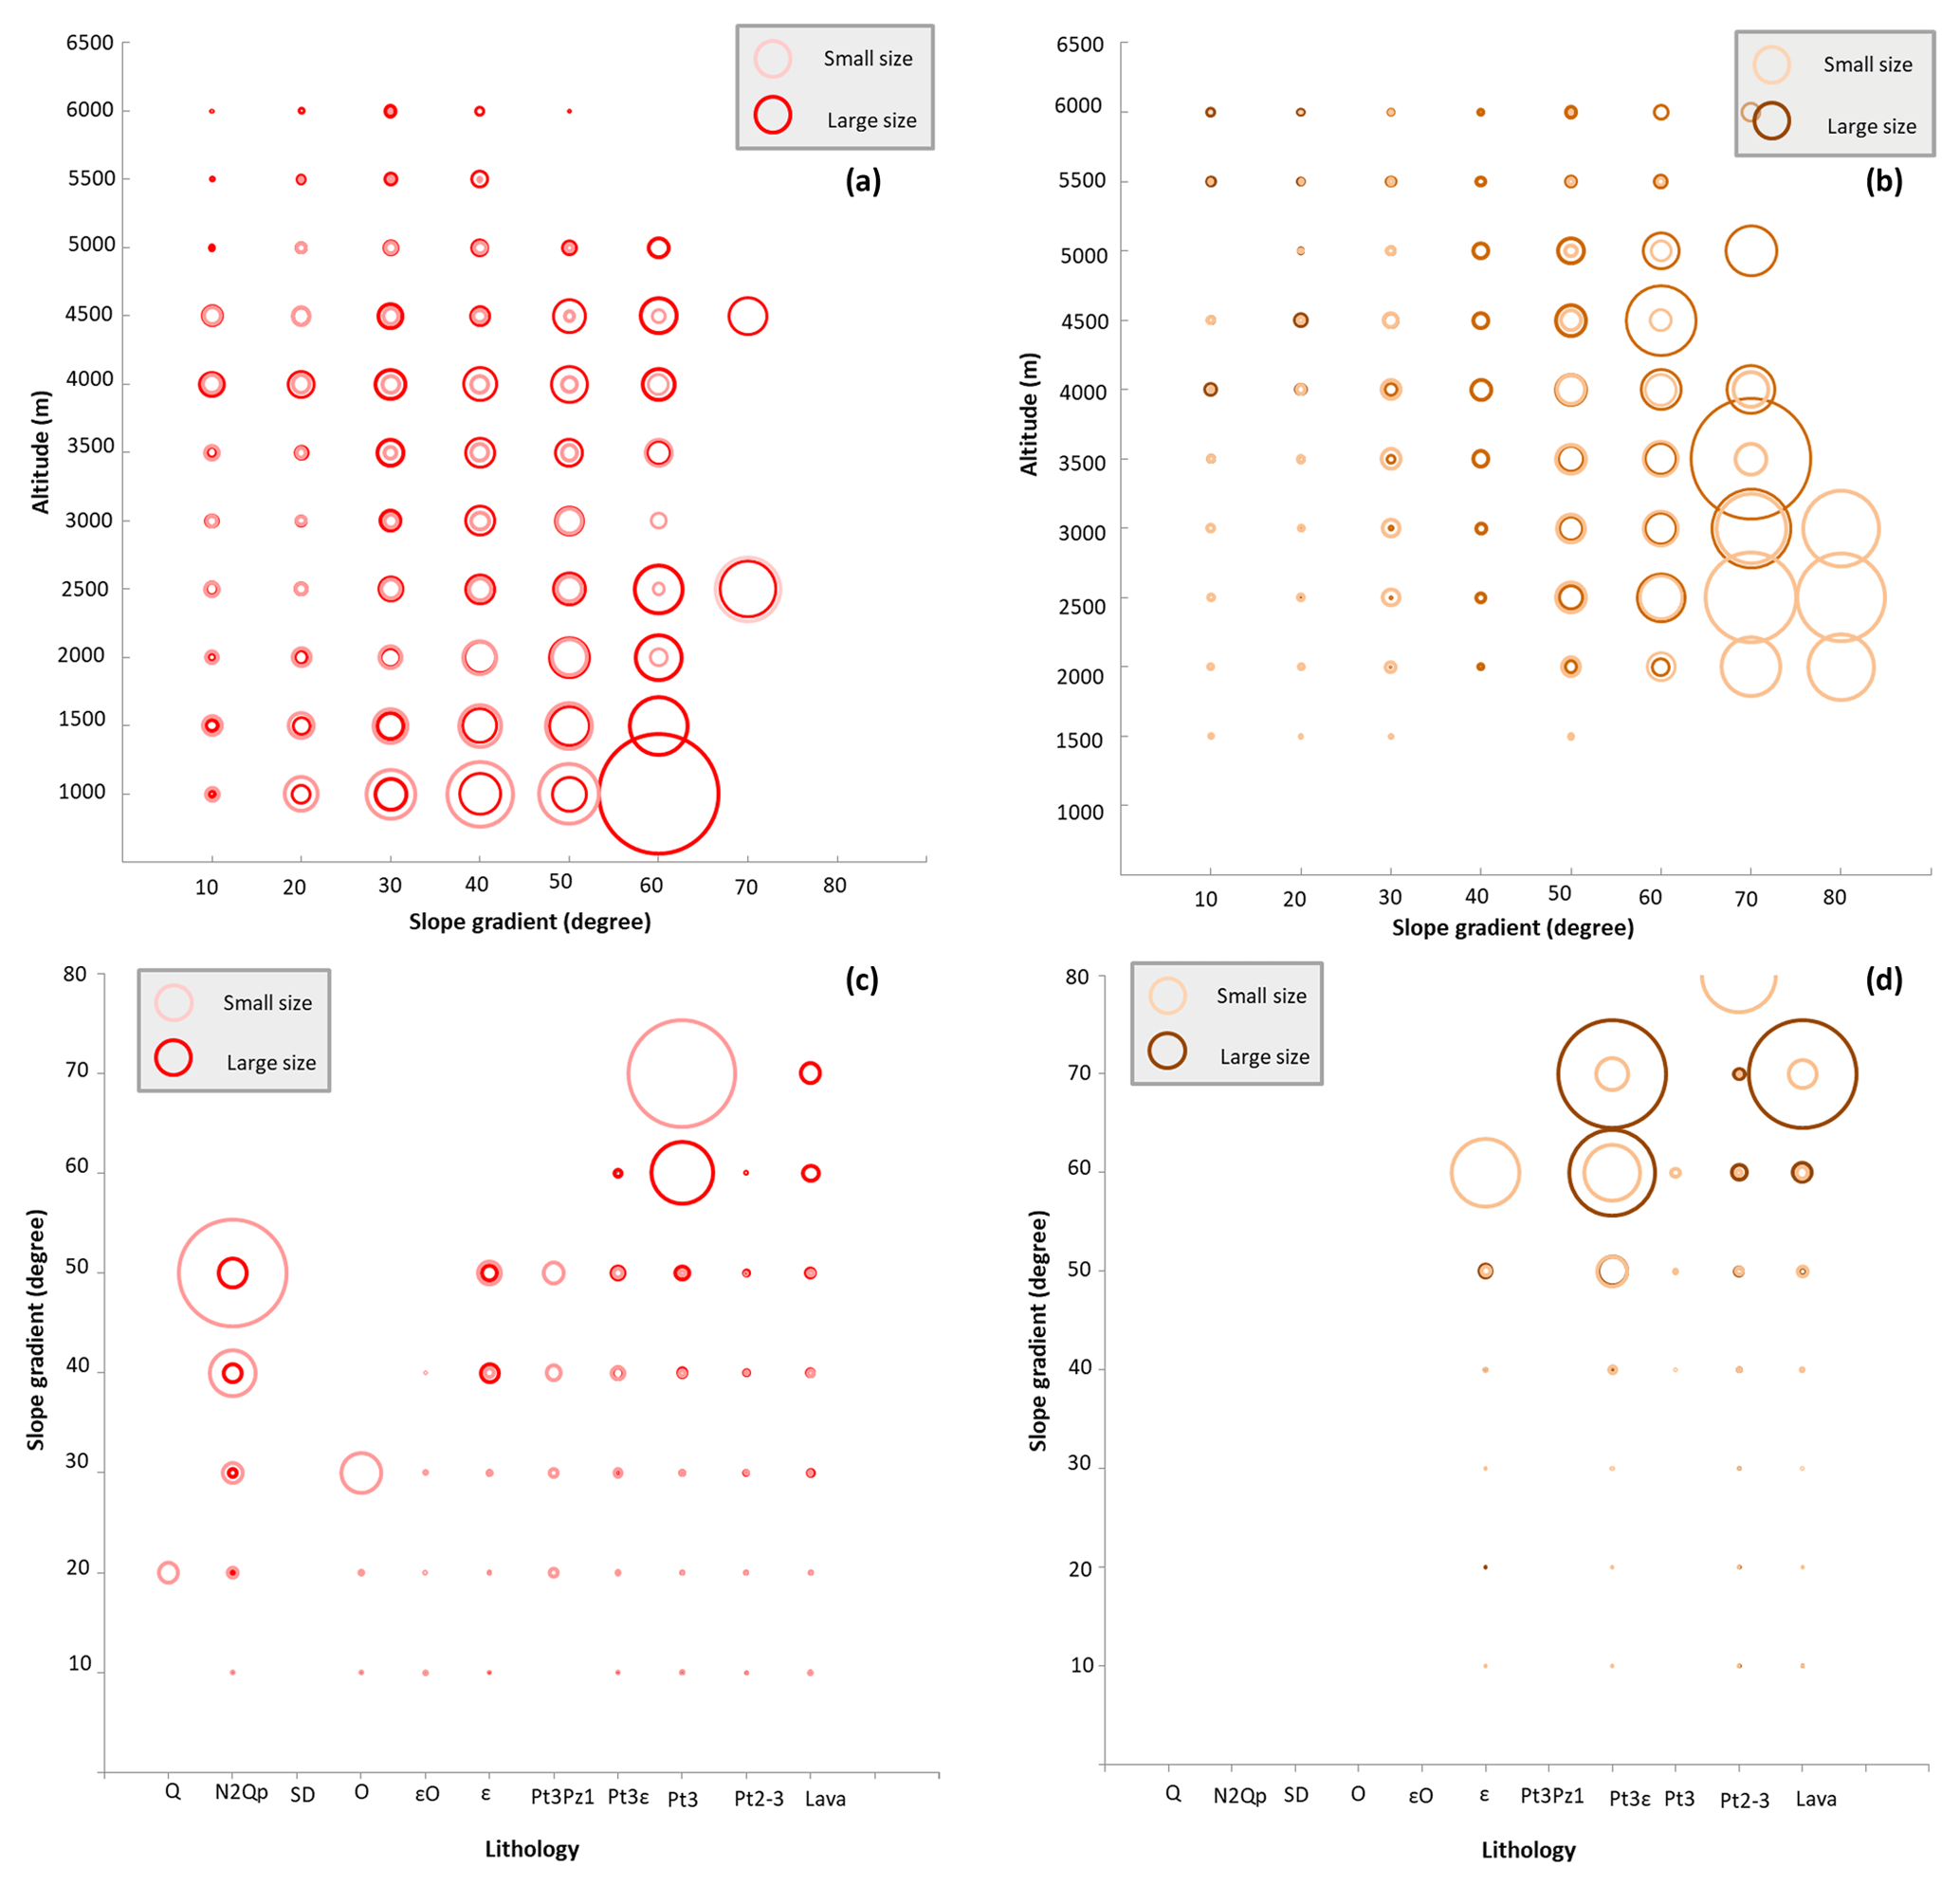
Figure 6Correlation between landslides and other factors for rainfall-triggered landslides (RTLs; a, c) and earthquake-triggered landslides (ETLs; b, d). The size of the circles indicates the value of the frequency ratio. (a, b) Relation between altitude and slope gradient. (c, d) Relation between lithology and slope gradient.
6.1 Landslide susceptibility models
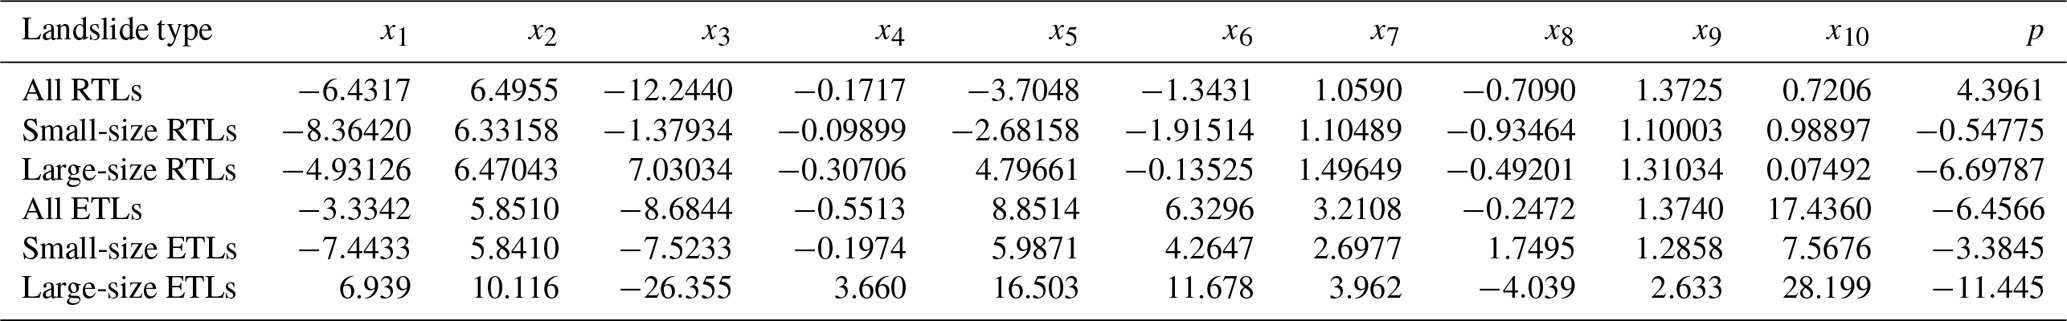
The following factors were used for the susceptibility modeling of RTLs: altitude (x1), slope gradient (x2), curvature (x3), slope aspect (x4), relative relief (x5), drainage density (x6), lithology (x7), distance to fault (x8), land cover type (x9) and precipitation during monsoon (x10). Peak ground acceleration (PGA) was used instead of precipitation for the susceptibility modeling of ETLs (Fig. 7). The R software was used to build the models using the logistic regression method for different types and sizes of landslides respectively (Table 2). ROC curves were generated to verify the accuracy of each susceptibility model, and value of the area under the curve (AUC) was calculated (Table 2).
The coefficients for the contributing and triggering factors in the landslide susceptibility models show differences between triggers and different sizes of landslides. Curvature, altitude and slope gradient have a high impact on the susceptibility of RTLs, while curvature, PGA, relative relief and slope gradient have high impact on the susceptibility of ETLs. The size classes of RTLs show larger differences in weight of curvature, relative relief and altitude. For ETLs the differences between size classes are largest for factors of PGA, curvature and relative relief.
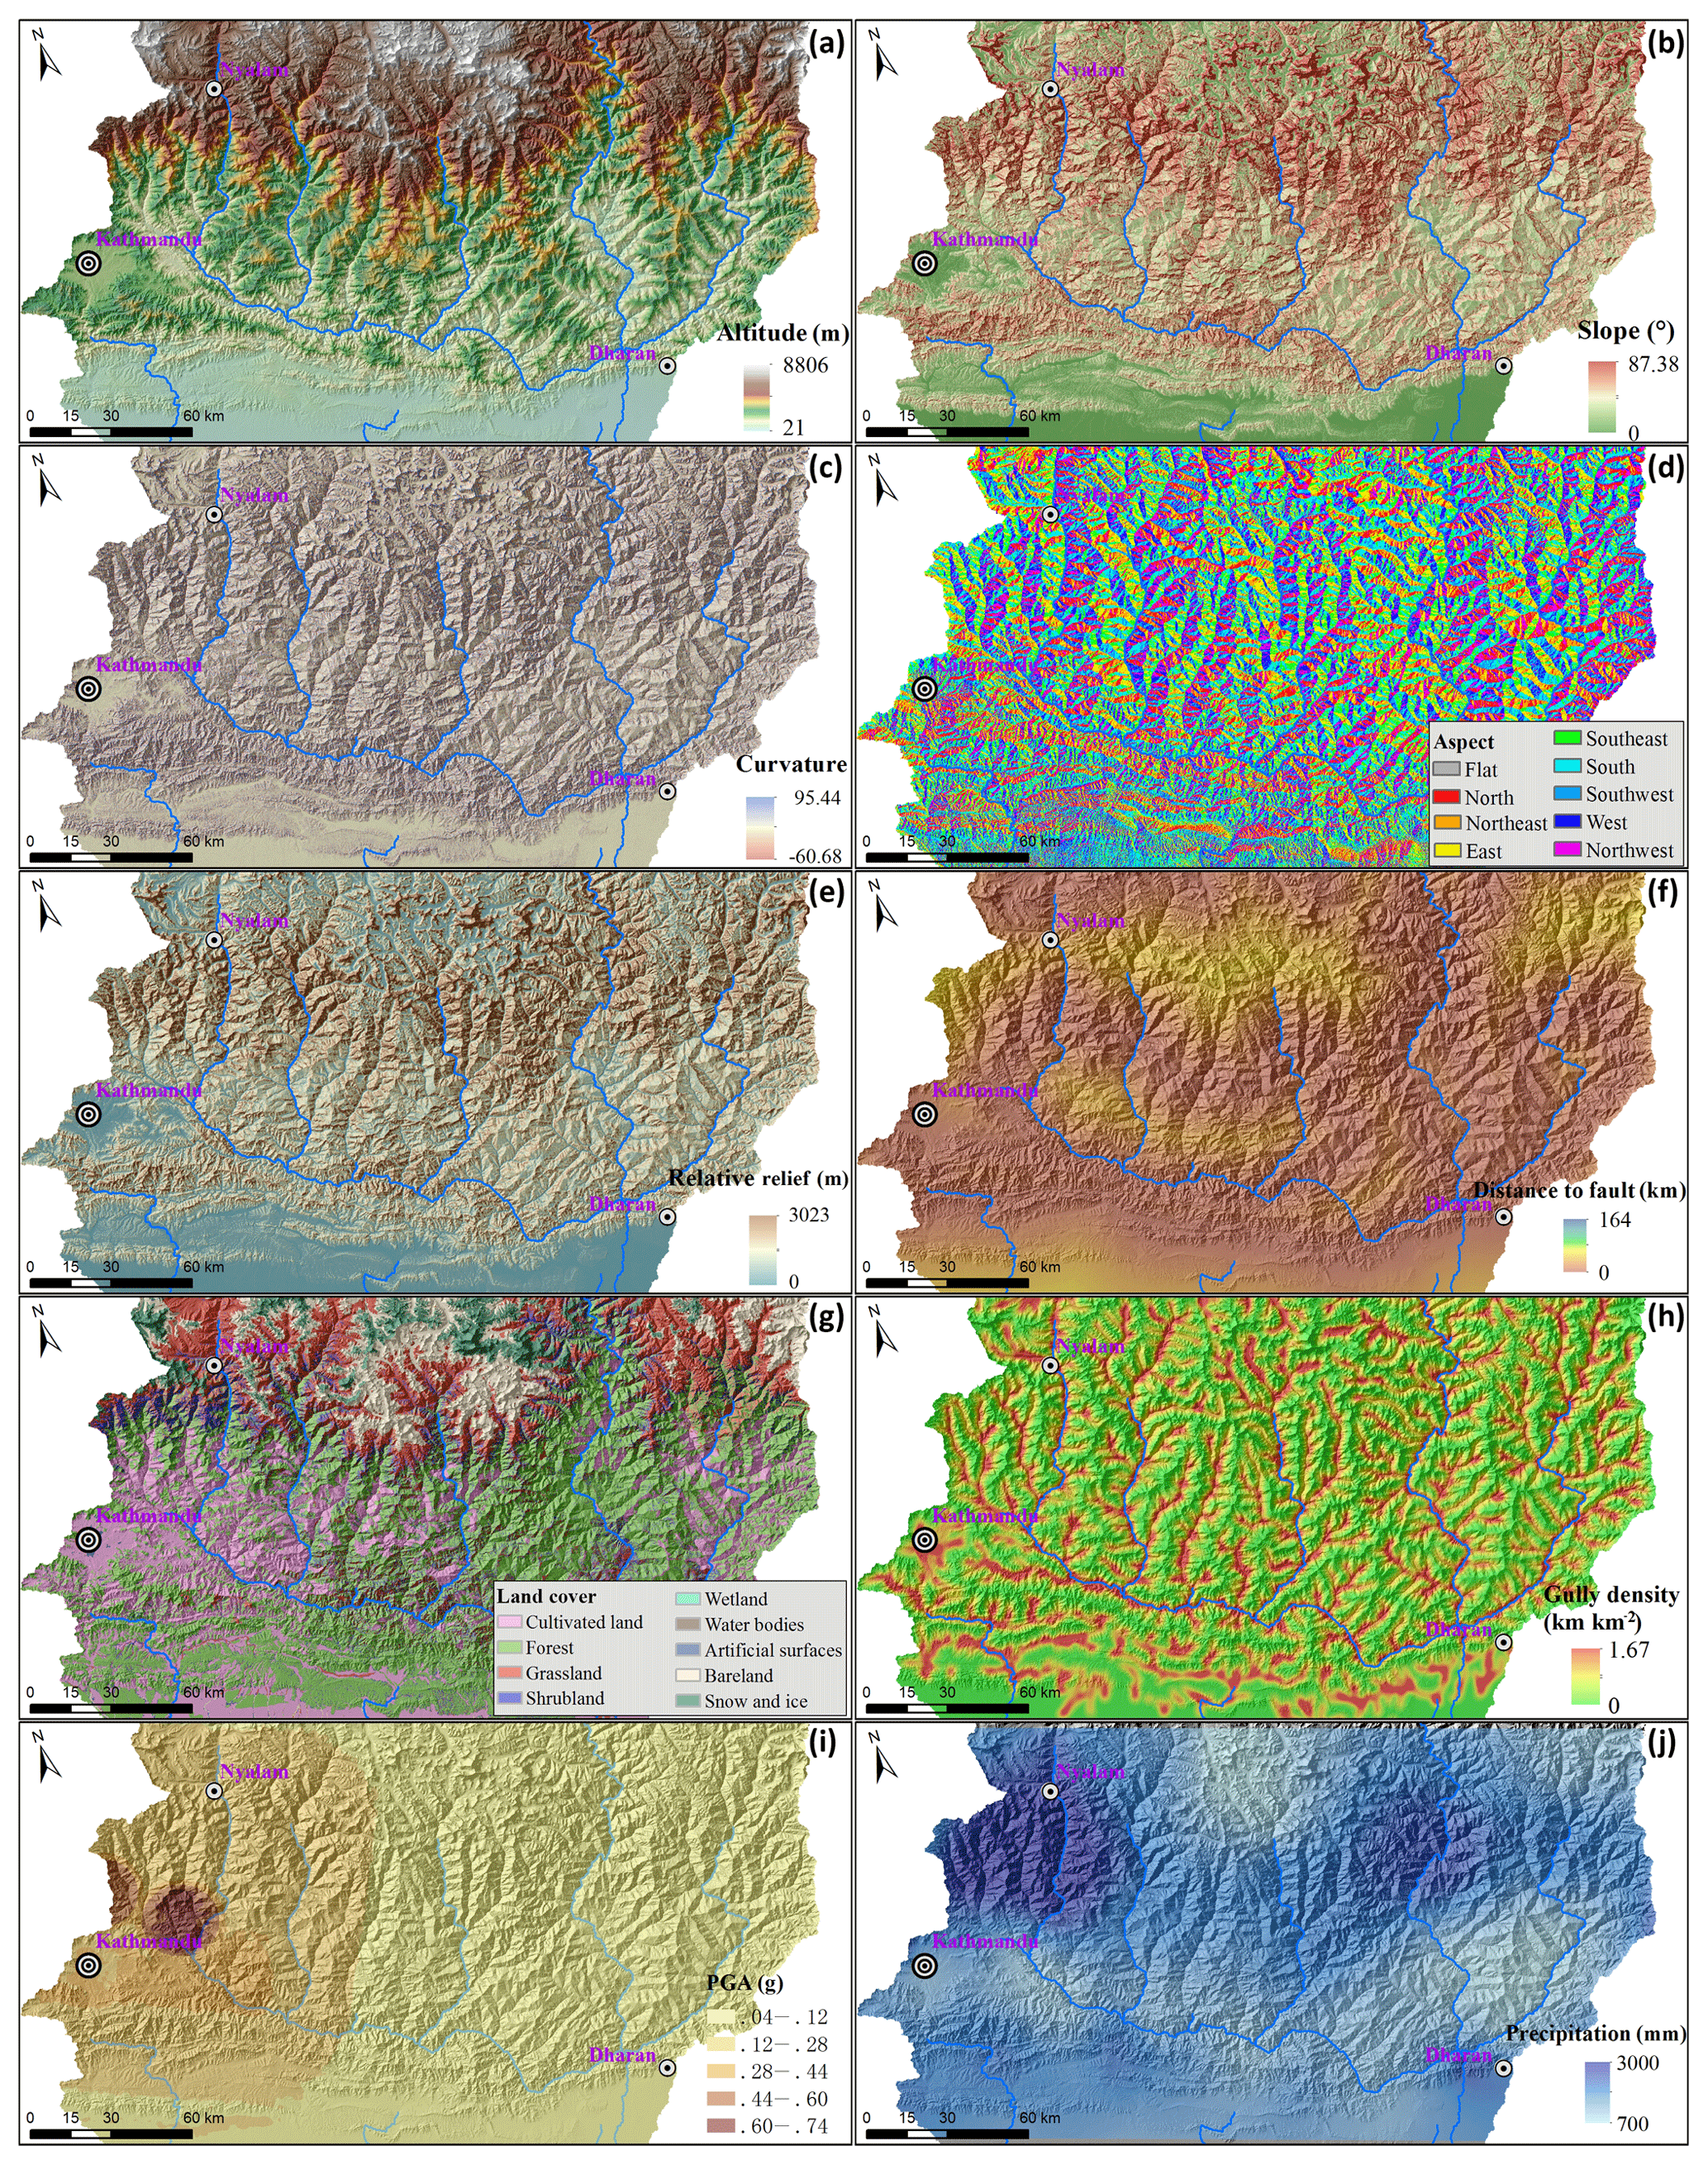
Figure 7Landslide susceptibility assessment factors: (a) altitude (data source: JAXA/METI ALOS PALSAR DEM); (b) slope gradient; (c) slope curvature; (d) slope direction; (e) relative relief; (f) distance to fault; (g) land cover; (h) drainage density; (i) peak ground acceleration of the 2015 Gorkha earthquake (peak-ground-acceleration data for the Gorkha earthquake were obtained from USGS ShakeMap, which was designed as a rapid response tool to portray the extent and variation of ground shaking throughout the affected region immediately following significant earthquakes); (j) average total monsoon precipitation. (ICIMOD and the National Meteorological information Center of China. These data are the average precipitation for the period 1991–2010, for the monsoon season from June to October.)
Table 2Susceptibility models for different triggers and landslide size classes in the Koshi River basin.
ROC curves were drawn to verify the accuracy of each susceptibility model (Fig. 8), and the area under the curve was calculated. The AUC values of the ETL models were higher than for RTLs, since the ETLs were more concentrated than the RTLs, as the inventory is from one single triggering event, whereas the RTLs are from many different rainfall events over a longer time period.
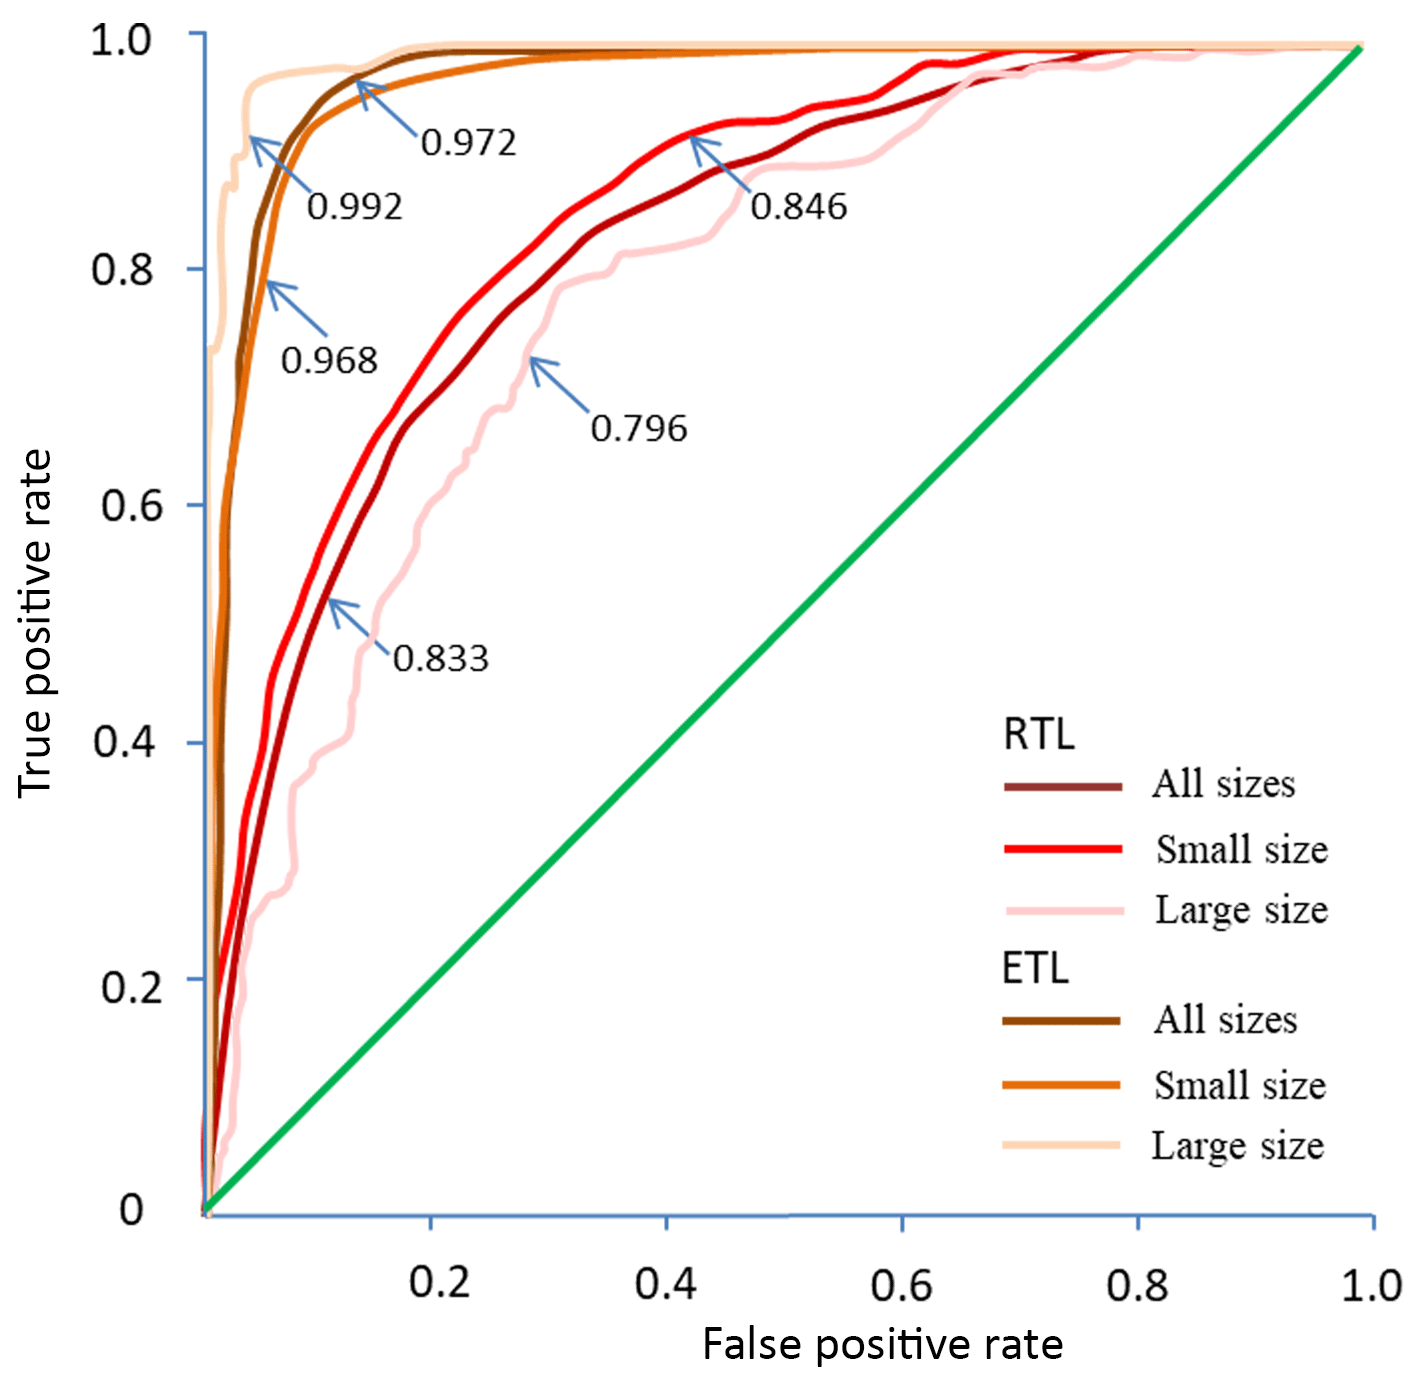
Figure 8ROC curves for the susceptibility assessment models for different sizes of RTLs and ETLs.
6.2 Results
The logistic regression models were employed for the Koshi River basin, and in total six susceptibility maps were generated (Fig. 9). Susceptibility values were classified into four levels – low, moderate, high and very high – based on the following susceptibility threshold values: 0–0.25, 0.25–0.5, 0.5–0.75 and 0.75–1.
The RTL susceptibility map (Fig. 9a) shows that high and very high susceptibility levels are located mostly in the Siwaliks and in the Mahabharat Lekh region in the west–east direction and in the Middle to High Himalaya region in the north–south direction. The Siwaliks and Mahabharat Lekh regions (Fig. 1) have high and very high susceptibility levels for small landslides and lower susceptibility levels for large ones. The Middle and High Himalaya region (Fig. 1) has a reverse situation: high and very high susceptibility levels for large landslides and lower levels for small ones.
The ETL susceptibility map reflects the coseismic landslide pattern of the Gorkha earthquake, with very high and high susceptibility in the western part of the Koshi River basin. It is important to note that the ETL susceptibility map only reflects the characteristics of the Gorkha earthquake and is therefore not a reliable map for future earthquakes that may have another epicentral location, length of fault ruptures and magnitudes.
Both ETL and RTL susceptibility maps show different patterns for the large-size landslide class (Fig. 9c and f), whereas the maps for small size (Fig. 9b and e) resemble those of all size classes (Fig. 9a and d). This is due to the relative small fraction of the large-size landslides in comparison with the small ones, as well as their more restricted location, which gives different weight values for some factor maps (Table 2).
The highest-susceptibility zones for small-size and large-size RTLs show a large overlapping area, although the area of these classes is much smaller for large-size RTLs. In the Siwaliks and Mahabharat Lekh regions high- and very-high-susceptibility zones for large-size RTLs are located in the upper steep hillslopes. In the Middle and High Himalaya region, the highest-susceptibility zones for both small-size and large-size RTLs are mostly located on steep slopes along rivers. The highest-susceptibility zones for both small and large-size ETLs are located in the northwestern part of the Koshi basin. For large-size ETLs these are concentrated in a smaller area to the northeast of Kathmandu (with altitude higher than 3000 m) where small ETLs also show high susceptibility in the southeast of Kathmandu.
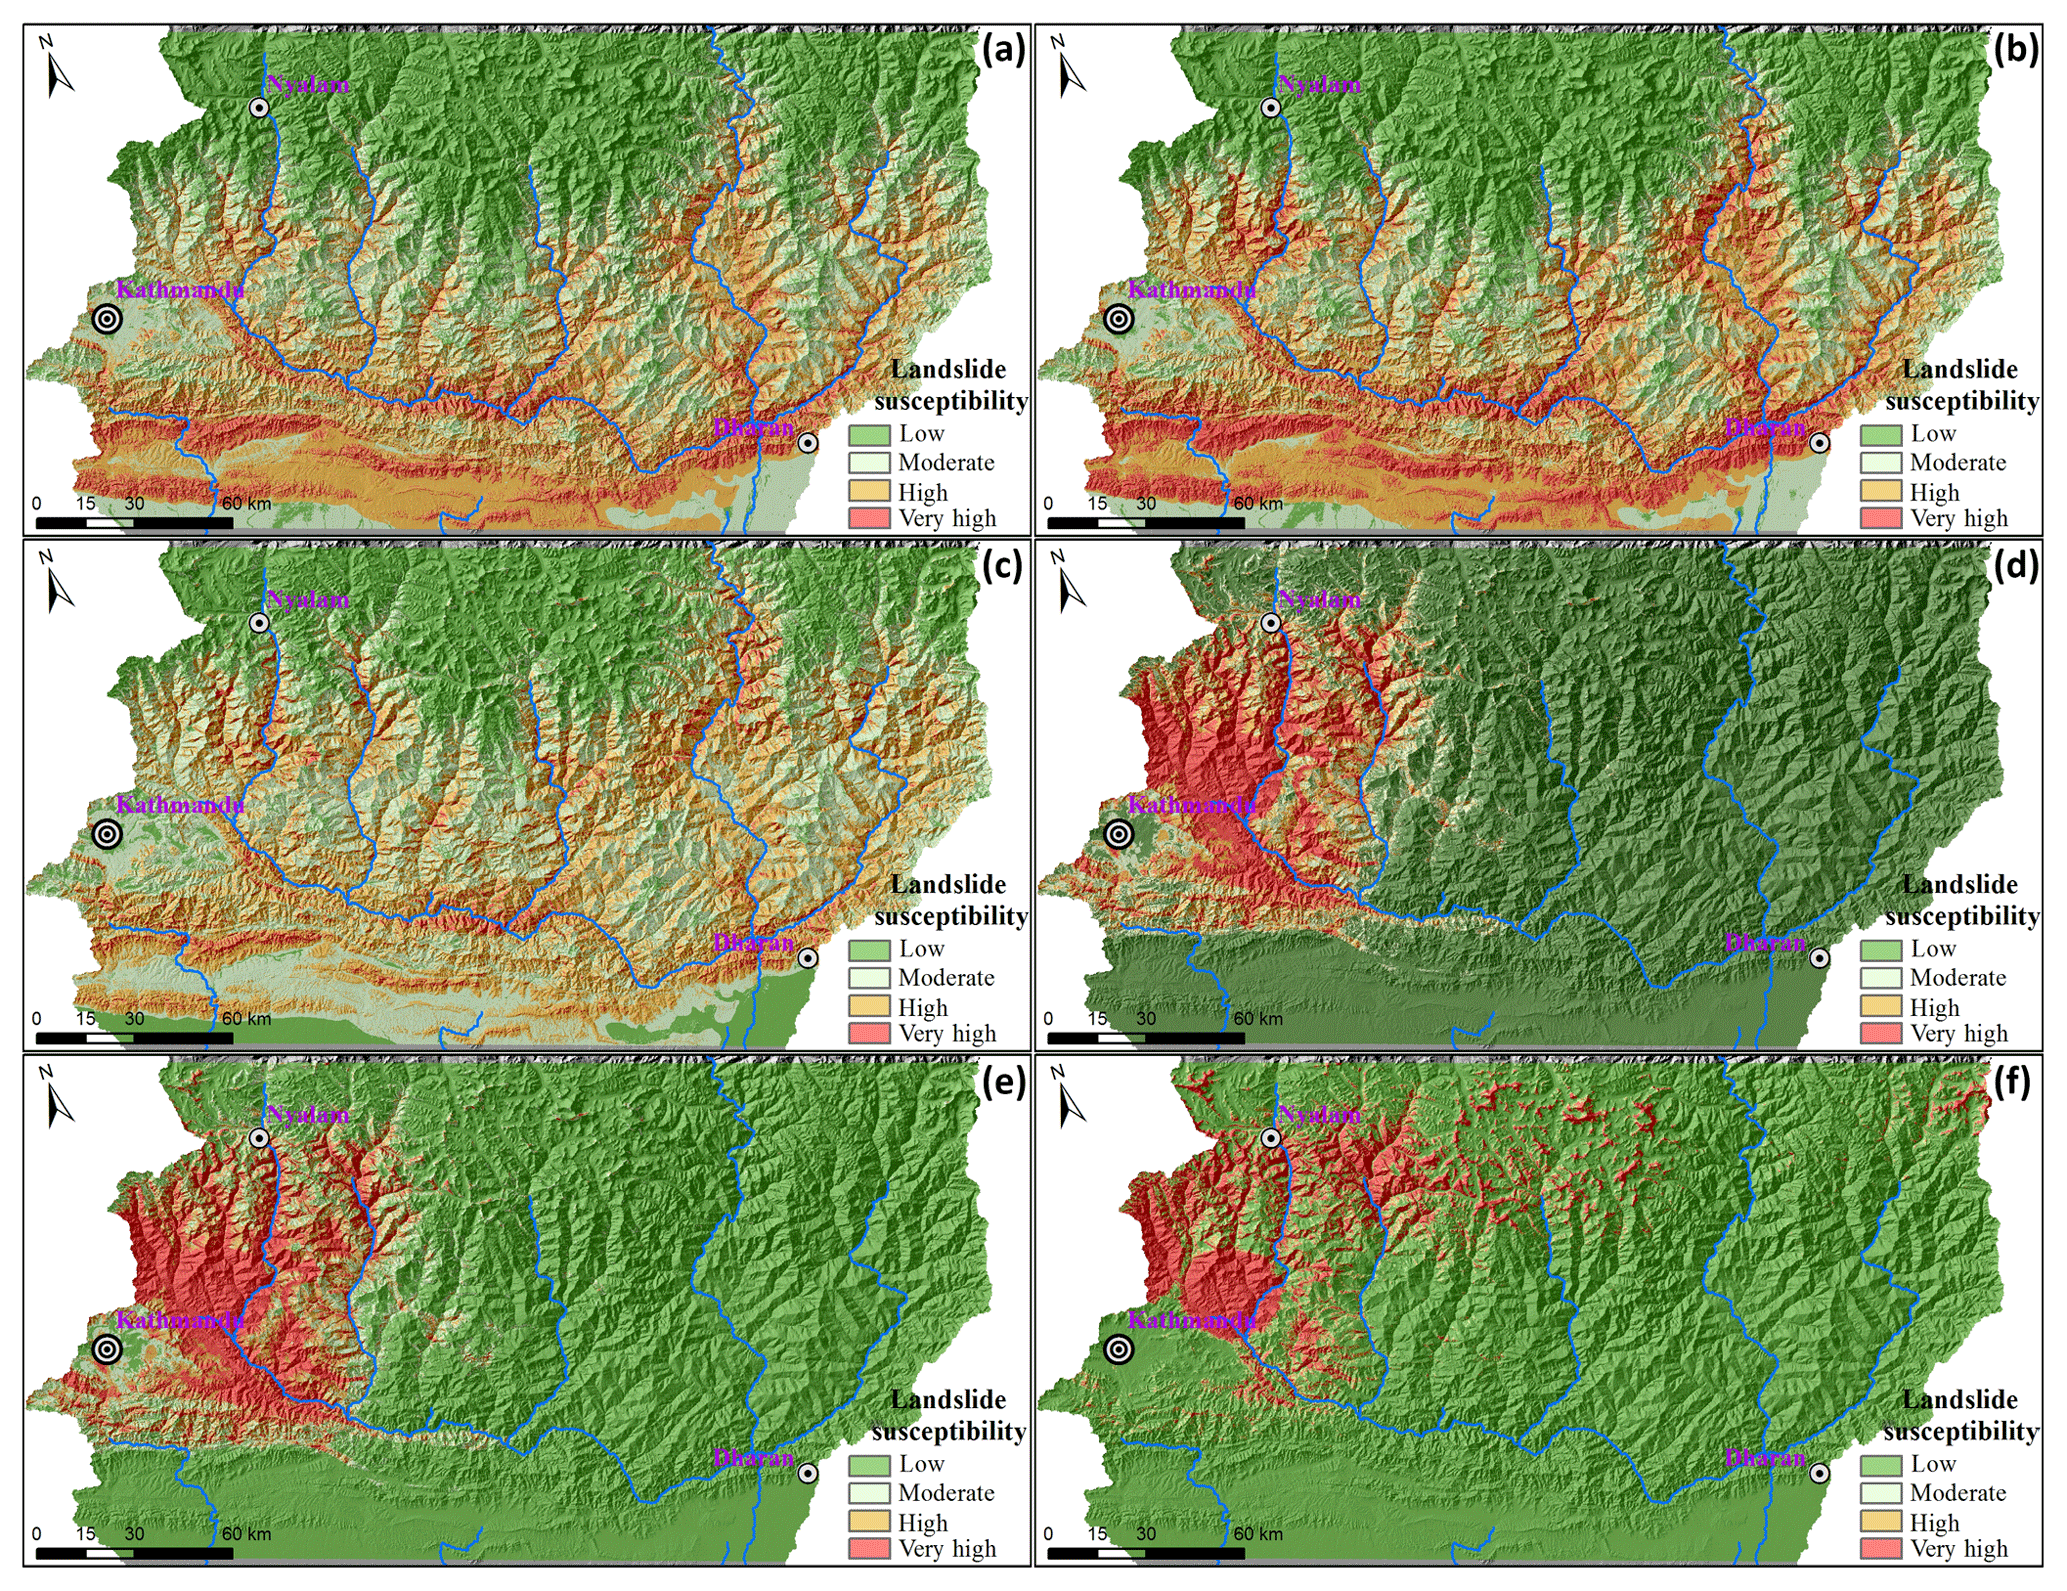
Figure 9Susceptibility maps for different sizes of RTLs and ETLs (a) for all RTLs, (b) for small RTLs, (c) for large RTLs, (d) for all ETLs, (e) for small ETLs and (f) for large ETLs.
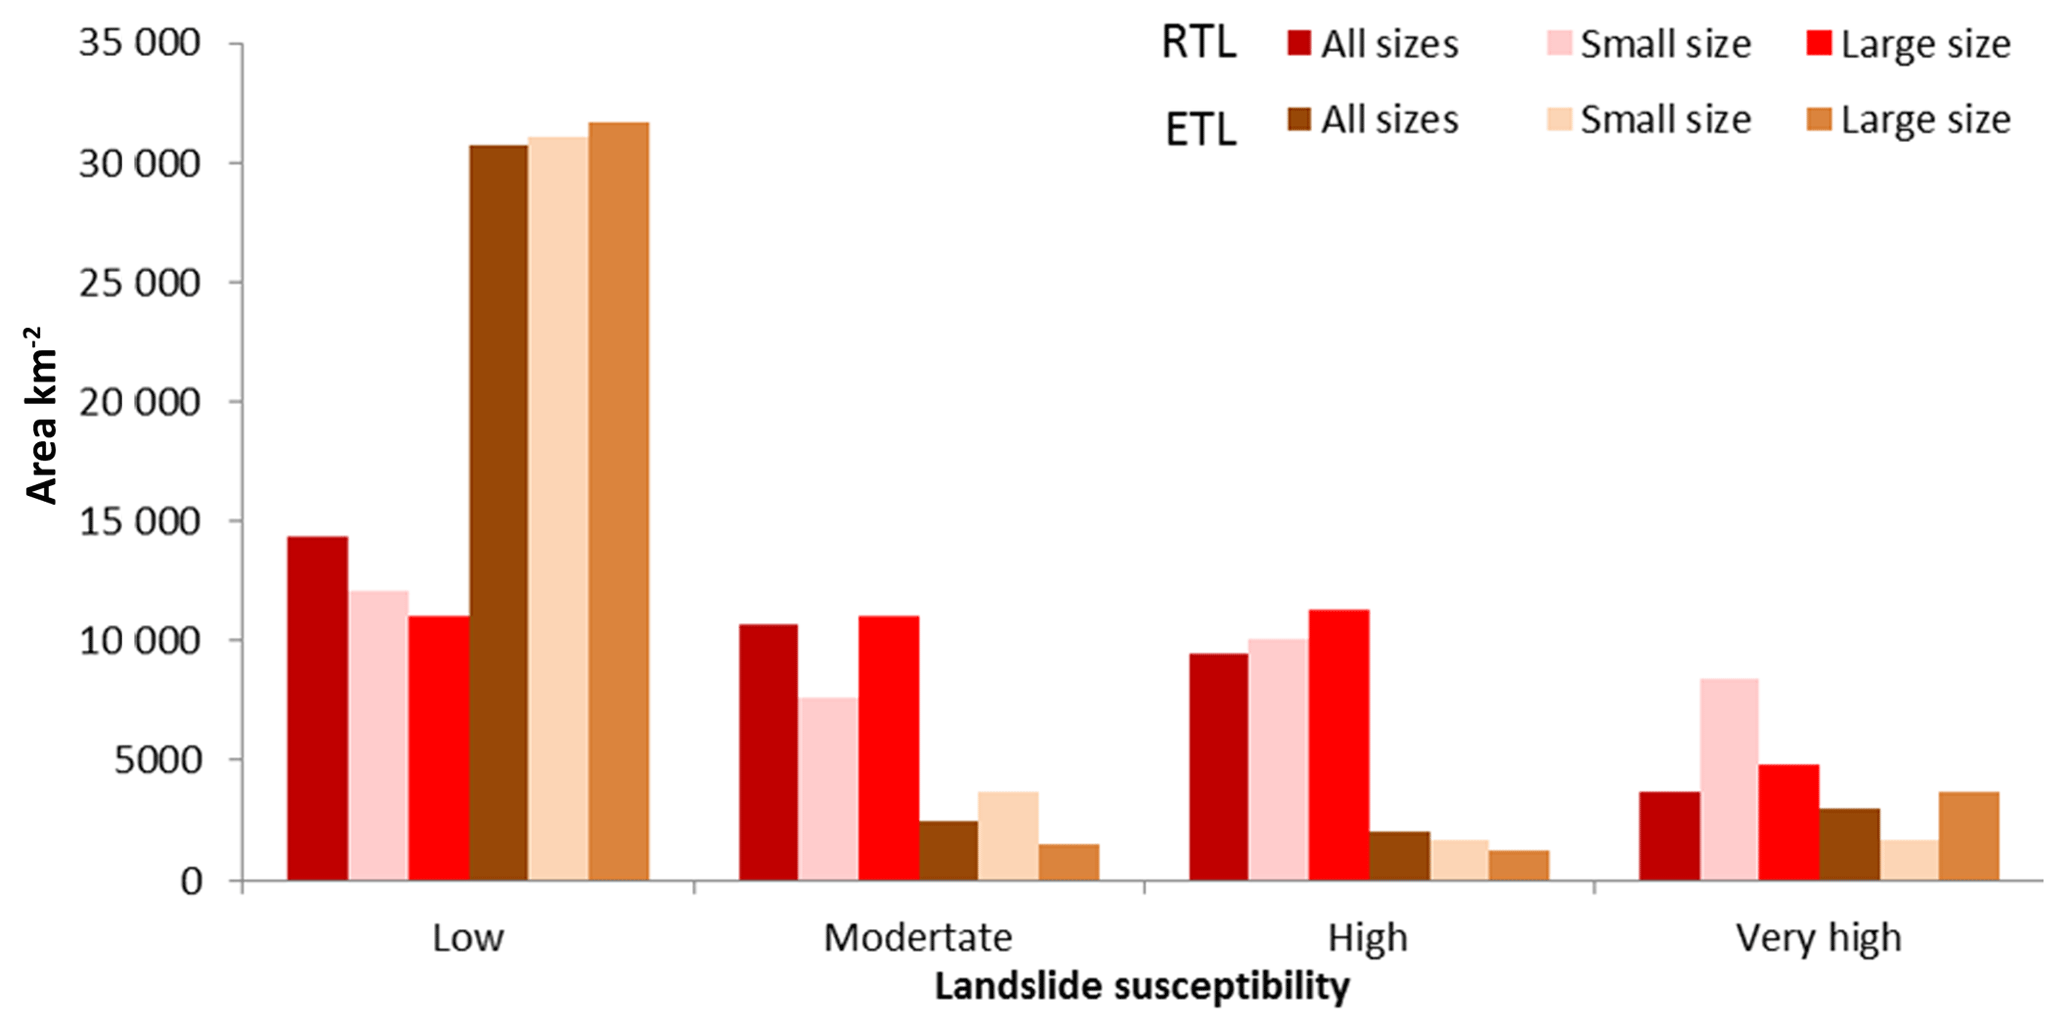
The areal coverage of the landslide susceptibility classes was calculated for each susceptibility map (Fig. 10). Compared to RTLs, the ETL susceptibility maps have a larger area with low susceptibility, due to fact that the Koshi River basin is far from the epicenter of the Gorkha earthquake; thus the earthquake-affected region is only part of the basin. The very-high- and high-susceptibility region for ETLs is mostly concentrated in the western and southwestern parts of the basin, clearly reflecting the PGA pattern (Fig. 7i). The RTL susceptibility also reflects the triggering factor (monsoonal rainfall), with the highest susceptibility in the south of the basin. However, the higher rainfall peak in the Middle and High Himalaya region is less pronounced in the susceptibility maps, as well as in the inventory maps (Fig. 4). The higher-susceptibility classes for large ETLs occupy more area than for small ETLs, while the opposite can be observed for RTLs.
Different groups of landslide data were used to validate the landslide susceptibility maps for RTLs and ETLs. For each trigger and size class, the number of landslides was calculated, inside the areas with a certain susceptibility level, to cross-validate the results.
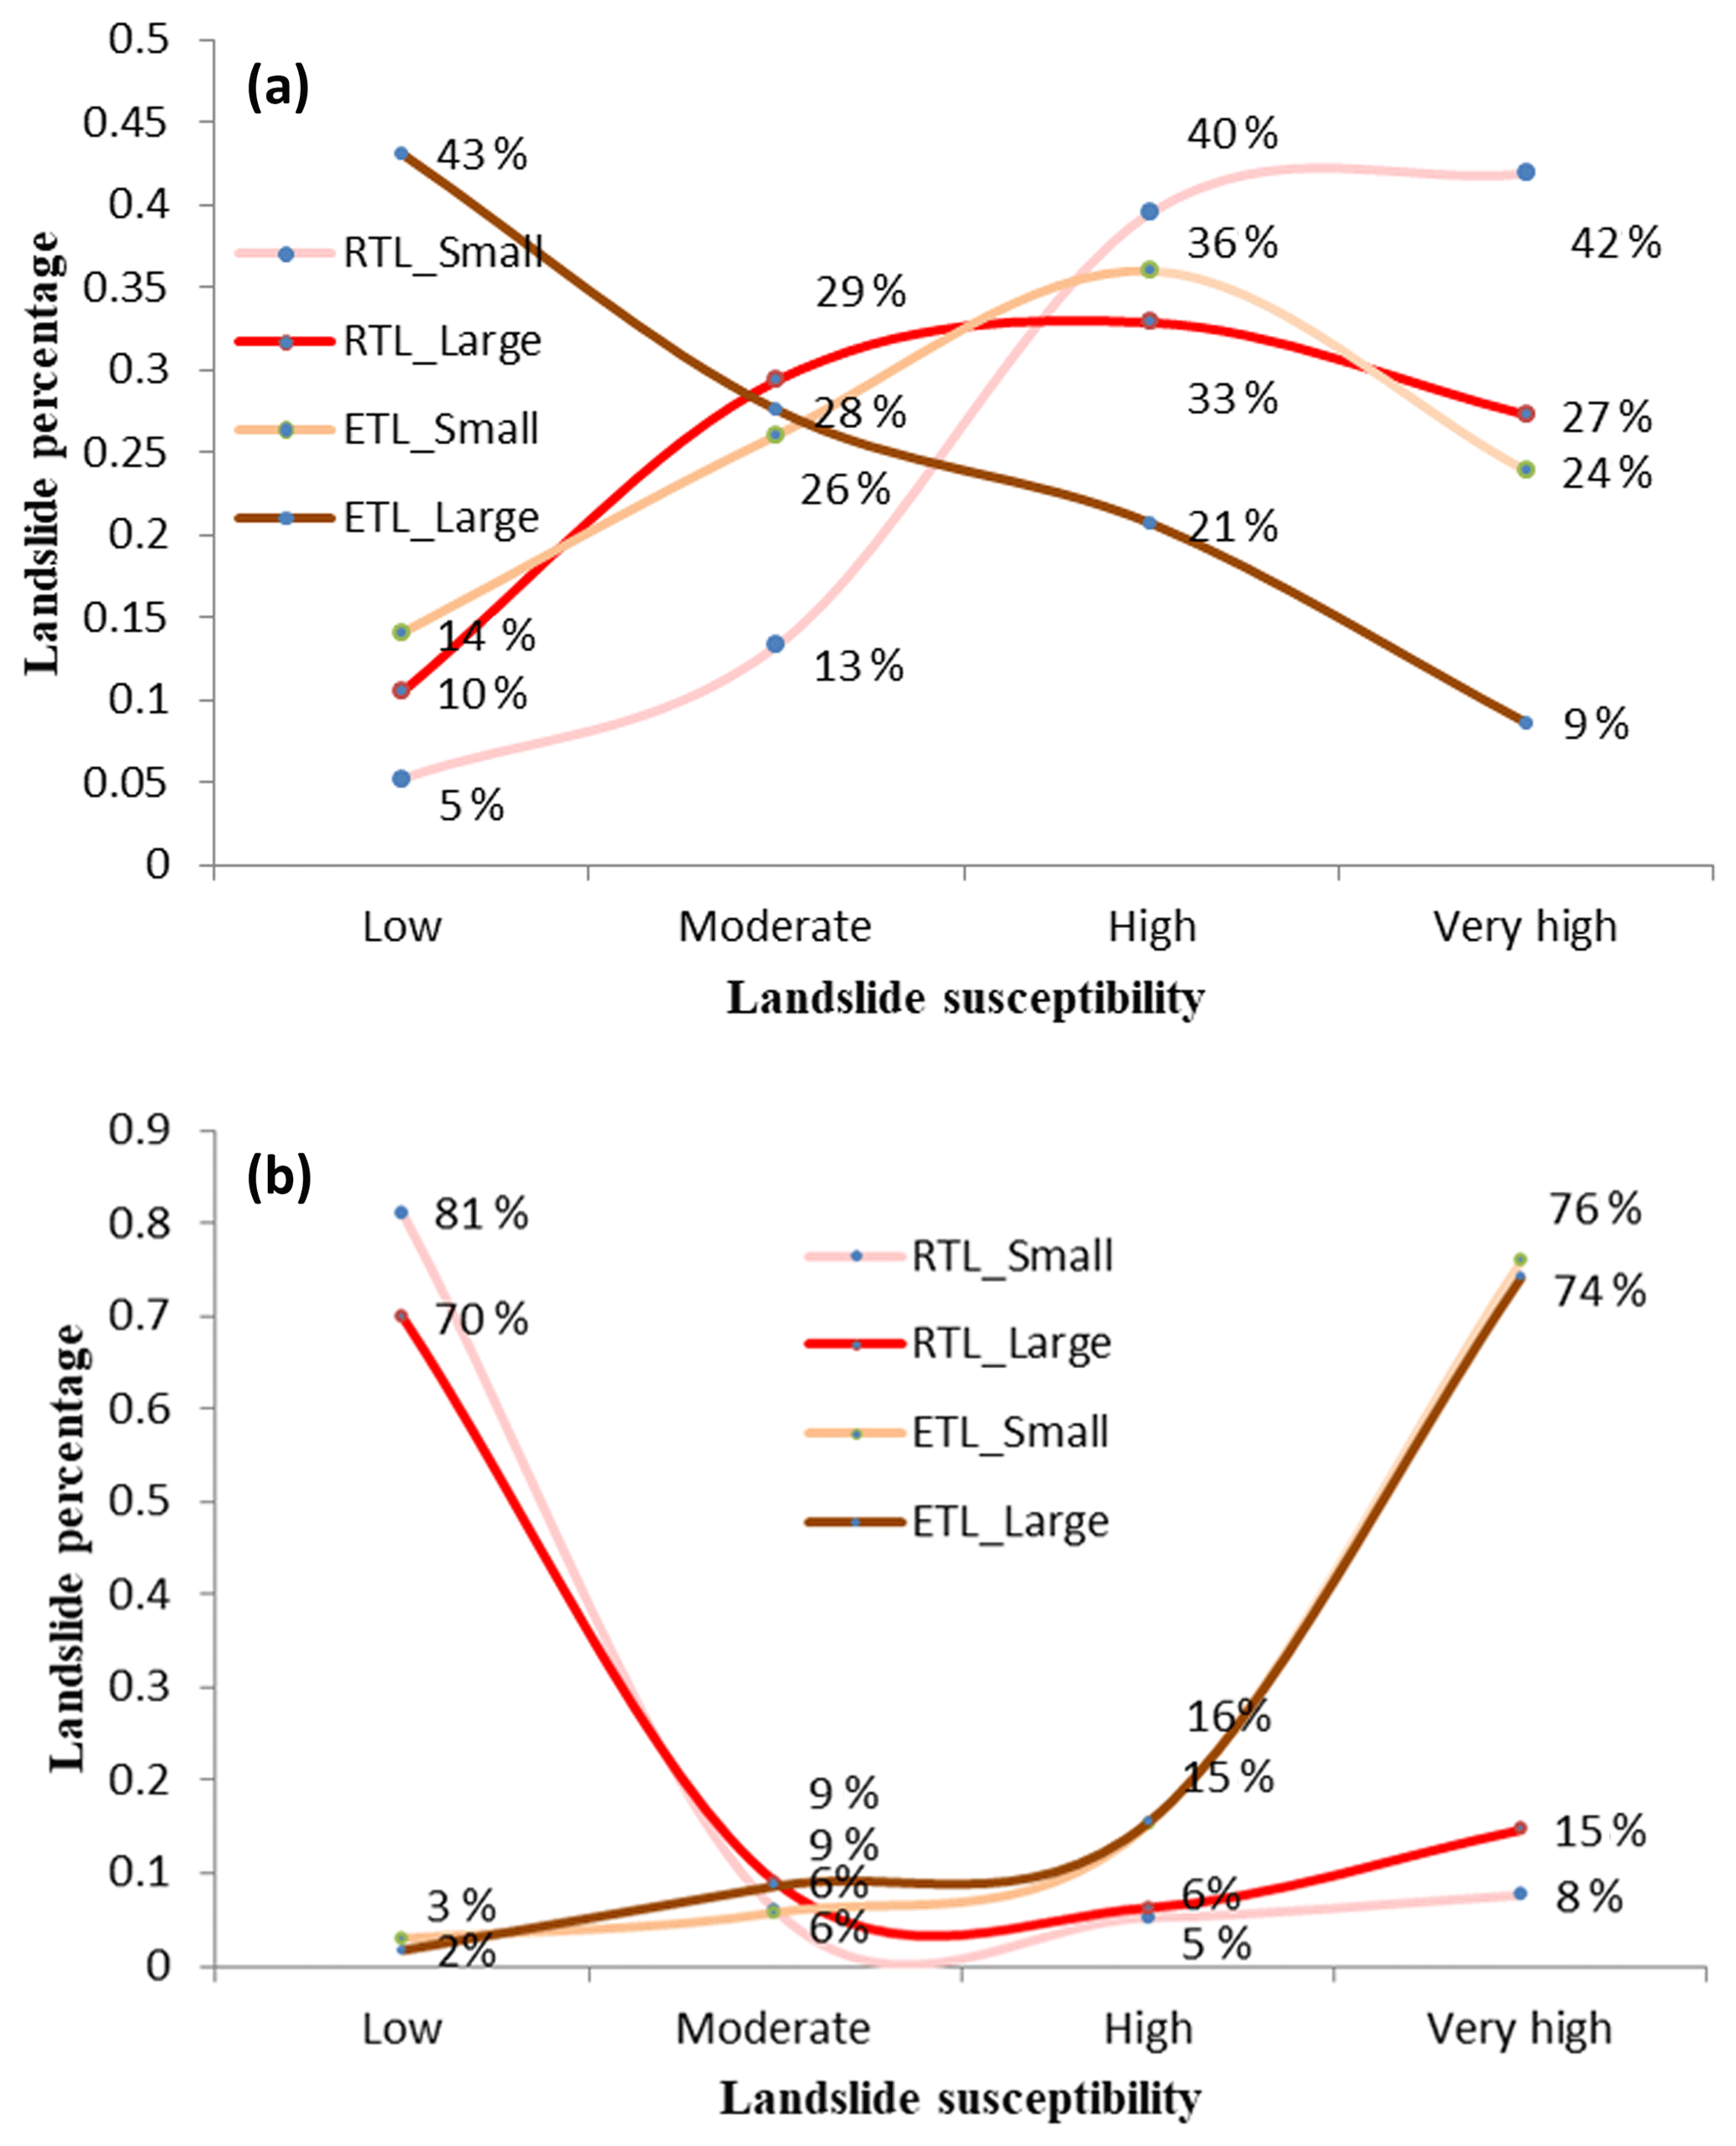
Figure 11Cross validation of the landslide susceptibility maps. (a) The percentage of landslides in the various classes of the RTL susceptibility map. (b) The percentage of landslides in the various classes of the ETL susceptibility map.
The percentages of different-size RTLs and ETLs in each susceptibility are shown in Fig. 11. For the RTL susceptibility map, percentages of small-size and large-size landslides show a similar tendency for both triggers. Most of the landslides were located in high- and very-high-susceptibility zones. Only large-size ETLs show an opposite tendency. There is a marked difference between the percentages of ETLs and RTLs in the ETL landslide susceptibility classes. The RTL and ETL percentages show completely different patterns. Most of the RTLs (both small and large) are located in the low ETL susceptible regions. Conversely, a large fraction of small-size and large-size ETLs are located in the high-susceptibility regions.
This study aimed to analyze independent rainfall- (RTL) and earthquake-triggered landslide (ETL) inventories for a large mountainous watershed in the Himalaya, located in India, Nepal and China. It is important to mention that the two rainfall-triggered landslide inventories are not event-based inventories (Guzzetti et al., 2012). A major limitation in this work was that we were not able to use separate event-based inventories for RTLs and only one event-based inventory for ETLs. The collection of event-based inventories, both for rainfall and earthquake triggers, remains one of the main challenges in order to advance the study of landslide hazard at a watershed scale. Another limitation for this landslide inventory was that the spatial and temporal resolution of images as well as revegetation affect the number of historic landslide inventories. As multiple storm events occur in the Koshi River basin, every year, during the monsoon season, landslide triggering differs depending on the event. Nevertheless, as the temporal resolution of remote-sensing images is too limited to capture the respective landslide occurrence, it is not possible to attribute landslides to a given storm event, which is a limitation in this study. Revegetation, additionally, affects the completeness of the long-term landslide inventory. An increasing number of researchers make great efforts on the event-based landslide inventories and database (Marc et al., 2018), which may supply more samples for comparison studies of RTLs and ETLs.
The two RTL inventories differ in the sense that the 1992 inventory is based on landslides that were large enough to be mapped on the topographic map, whereas the inventory between 1992 and 2015 represents the landslides that could be mapped from multitemporal images over a number of years. Both inventories were lacking a separation into initiation and accumulation parts, and no separation in landslide types could be made. The effects of amalgamation of landslides might certainly have played a role in the frequency–area distribution (Marc and Hovius, 2015), although we are not able to quantify this due to the lack of an independent dataset. For the 1992–2015 dataset we were able to control this as we carried out the image interpretation ourselves, but the pre-1992 inventory could not be verified as the aerial photographs that were used to generate the updated topographic maps were not available to us. Although the two inventories differ substantially with respect to the number of small landslides, it is striking to see that the cutoff values and β values in the frequency–area distribution (FAD) are similar. It is very difficult to obtain a complete event-based landslide inventory for rainfall-triggered landslides in Nepal, as landslides are generally generated by a number of extreme rainfall events during the monsoon, which cannot be separated, as the area is cloud-covered through most of the period. The earthquake-triggered landslide distribution is an event-based inventory for a single earthquake (2015 Gorkha earthquake) and based on an extensive mapping effort by Roback et al. (2017), resulting in an inventory that can be considered complete (Tanyas et al., 2017). When comparing the FAD for RTLs and ETLs it is striking that the size–frequency distributions for both ETLs and RTLs show very similar behavior for landslides above the cutoff value of 30 000 m2. Although there is no consensus regarding the factors dictating the power-law distribution of landslides, there is accumulating evidence that topography, as well as mechanical properties, has to be one of the important controlling factors (e.g., Stark and Guzzeti, 2009; ten Brink et al., 2009; Frattini and Crosta, 2013; Liucci et al., 2017). Our finding regarding similar cutoff values obtained from different inventories created for the same area also supports this argument. This conclusion is also supported by Marc et al. (2019), who found similar beta values between ETLs and RTLs, but the cutoff value is much smaller because a correction to remove runout was applied.
The pattern of the triggers (precipitation in the monsoon for RTLs, and PGA distribution for ETLs) has major influence on the distribution of landslides and susceptibility zones. These trigger patterns differ substantially. When moist airflow from the India Ocean crosses over the Mahabharat Lekh, the intensity of precipitation reduces because the altitude decreases and temperature rises. As the airflow continues northwards to the Middle Mountains and High Himalaya; it rises again and consequently induces high precipitation in the area at an altitude between 2500 and 4000 m. It results in two high-precipitation regions during the monsoon season (Fig. 7i), which are reflected in the zones of high susceptibility to RTLs. The precipitation pattern is different from the PGA distribution (Fig. 7j) for the Gorkha earthquake, with a strong shaking area located in the north and northeast of Kathmandu, with PGA values larger than 0.44 g. One limitation that needs to be clarified is the fact that normally the rainfall on the day of the land sliding event and antecedent daily rainfall, which have a close correlation with landslide occurrence, are usually taken as the key factors for landslide threshold. But in this study the mean precipitation during monsoon season was taken as the rainfall factor. This can only supply a general tendency for landslide distribution in a regional scale. In the RTL susceptibility assessment model, the weight of precipitation factor is low, which means this factor was not strong correlated with landslide susceptibility. It is better to characterize the variability of daily rainfall during the monsoon season and take into account the daily rainfall instead of the mean. So use of the short-term rainfall variability to study the long-term historical landslide inventory and susceptibility assessment may be more reasonable (Deal et al., 2017). Further studies could focus on spatial distributions of triggering intensity or different triggering processes.
The distributions of RTL and ETL susceptibility classes are also very different. As the ETL susceptibility map is based on a single event, the distribution of the susceptibility classes is controlled by the PGA for the 2015 Gorkha earthquake, and the patterns of the ETL susceptibility map differ from the RTL susceptibility map. This was confirmed by the cross validation (Fig. 11), which showed that the RTL susceptibility map has a modest capability of explaining the ETL pattern but that the ETL susceptibility cannot properly predict the RTLs.
This means one should be careful with using susceptibility maps that were made for earthquake-induced landslides as prediction tools for rainfall-induced landslides. Such maps are in fact of little practical implication, as the next earthquake may not be likely to occur in the same location and therefore produce a similar landslide pattern. The generation of ETL susceptibility maps should not be based on single earthquake scenarios (Jibson, 2011), and ideally many earthquake scenarios should be used to model the overall ETL susceptibility. However, using PGA values based on probabilistic seismic hazard assessment might result is relatively poor statistical correlations with event-based inventories. Therefore, PGA maps and ETL inventories of specific earthquake scenarios are required to improve the statistical models. This requires more event-based ETL inventories, and efforts to generate worldwide digital databases should be encouraged (Tanyas et al., 2017).
The relationship between ETLs and RTLs might also change over time. Rainfall-induced landslide activity is generally much higher in the first years after an earthquake and generally decreases to pre-earthquake levels within a decade, due to depletion of coseismic sediments, progressive coarsening of available sediments and revegetation (Fan et al., 2018b; Hovius et al., 2011; Marc et al., 2015). Landslide susceptibility maps should also be updated after major earthquakes.
Both ETL susceptibility maps and RTL susceptibility maps show different patterns for large landslides as compared to the small landslides or all landslides. In general the susceptibility maps, for both RTLs and ETLs, for all landslide sizes together show a large similarity with the ones for the small landslides only. This is due to the fact that the number of large landslides is quite limited as compared to the small landslides (See Table 1), and the samples used for generating the models for all landslides and only small landslides are almost the same. However, the resulting susceptibility patterns are quite different, and it is therefore questionable whether landslide susceptibility maps that are generated for all landslide size would be able to accurately predict the large landslides. More emphasis should be given to the evaluation of landslide size in susceptibility and subsequent hazard and risk assessment. This is relevant for analyzing the potential runout areas of landslides and for evaluation of landslide damming susceptibility (Fan et al., 2014, 2018b). Therefore, size and trigger matter in landslide susceptibility assessment.
Landslide inventories for the Koshi River basin are available at http://rds.icimod.org/Home/DataDetail?metadataId=23176&searchlist=True and http://rds.icimod.org/Home/DataDetail?metadataId=23175&searchlist=True (ICIMOD, 2014a, b).
JZ and CJvW designed the methodology; JZ, SB, DRG and NRK carried out the landslide interpretation and field validation; MRD analyzed the geologic background of study area; HT did the area–frequency analysis and YG did the factor analysis; JZ assessed the landslide susceptibility; and JZ, CJvW and OM wrote the manuscript.
The authors declare that they have no conflict of interest.
This research was supported by the National Natural Science Foundation of China (grant no. 41401007); the External Cooperation Program of BIC, Chinese Academy of Sciences (grant no. 131551KYSB20130003); and the 135 Program of IMHE (grant no. SDS-135-1708). This study was also jointly supported by the Australian-government-funded Koshi Basin Programme at ICIMOD as well as ICIMOD's core funds contributed by the governments of Afghanistan, Australia, Austria, Bangladesh, Bhutan, China, India, Myanmar, Nepal, Norway, Pakistan, Switzerland and the UK.
This research has been supported by the National Natural Science Foundation of China (grant no. 41401007); the External Cooperation Program of BIC, Chinese Academy of Sciences (grant no. 131551KYSB20130003); and the 135 Program of IMHE (grant no. SDS-135-1708).
This paper was edited by Paolo Tarolli and reviewed by Odin Marc and two anonymous referees.
Ayalew, L. and Yamagishi, H.: The application of GIS-based logistic regression for landslide susceptibility mapping in the Kakuda-Yahiko Mountains, Central Japan, Geomorphology, 65, 15–31, https://doi.org/10.1016/j.geomorph.2004.06.010, 2005.
Bai, S., Wang, J., Lü, G. N., Zhou, P. G., Hou, S. S., and Xu, S. N.: GIS-based logistic regression for landslide susceptibility mapping of the Zhongxian segment in the Three Gorges area, China, Geomorphology, 115, 23–31, https://doi.org/10.1016/j.geomorph.2009.09.025, 2010.
Burg, J. P., Guiraud, M., Chen, G. M., and Li, G. C.: Himalayan metamorphism and deformations in the North Himalayan Belt (southern Tibet, China), Earth Planet. Sc. Lett., 69, 391–400, https://doi.org/10.1016/0012-821x(84)90197-3, 1984.
Chang, K. T., Chiang, S. H., and Hsu, M. L.: Modeling typhoon- and earthquake-induced landslides in a mountainous watershed using logistic regression, Geomorphology, 89, 335–347, https://doi.org/10.1016/j.geomorph.2006.12.011, 2007.
Clauset, A., Shalizi, C. R., and Newman, M. E.: Power-law distributions in empirical data, SIAM Rev., 51, 661–703, https://doi.org/10.1137/070710111, 2009.
Collins, B. D. and Jibson, R. W.: Assessment of existing and potential landslide hazards resulting from the April 25, 2015 Gorkha, Nepal earthquake sequence, Open-File Report 2015-1142, U.S. Geological Survey, Reston, VA, USA, 50 pp., https://doi.org/10.3133/ofr20151142, 2015.
Dahal, R. K. and Hasegawa, S.: Representative rainfall thresholds for landslides in the Nepal Himalaya, Geomorphology, 100, 429–443, https://doi.org/10.1016/j.geomorph.2008.01.014, 2008.
Dai, F. C. and Lee, C. F.: Frequency-volume relation and prediction of rainfall-induced landslides, Eng. Geol., 59, 253–266, https://doi.org/10.1016/S0013-7952(00)00077-6, 2001.
Dai, F. C., Lee, C. F., and Xu, Z. W.: Assessment of landslide susceptibility on the natural terrain of Lantau Island, Hong Kong, Environ. Geol., 40, 381–391, https://doi.org/10.1007/s002540000163, 2001
Das, I., Sahoo, S., van Westen, C. J., Stain, A., and Hack, R.: Landslide susceptibility assessment using logistic regression and its comparison with a rock mass classification system, along a road section in the northern Himalayas (India), Geomorphology, 114, 627–637, https://doi.org/10.1016/j.geomorph.2009.09.023, 2000.
Deal, E., Favre, A. C., and Braun, J.: Rainfall variability in the Himalayan orogen and its relevance to erosion processes, Water Resour. Res., 53, 4004–4021, https://doi.org/10.1002/2016WR020030, 2017.
Dhital, M. R.: Geology of the Nepal Himalaya, Regional Perspective of the Classic Collided Orogen, Springer, Switzerland, https://doi.org/10.1007/978-3-319-02496-7, 2015.
Dilley, M., Chen, R. S., Deichmann, U., Lerner-Lam, A. L., and Arnold, M.: Natural disaster hotspots: a global risk analysis, The World Bank Hazard Management Unit, Washington, USA, 2005.
Fan, X., Qiao, J., Han, M., and Zeng, Y.: Volumes and movement distances of earthquake and rainfall-induced catastrophic landslides, Rock and Soil Mechanics, 33, 3051–3058, 2012.
Fan, X., Rossiter, D. G., van Westen, C. J., Xu, Q., and Görüm, T.: Empirical prediction of coseismic landslide dam formation: coseismic landslide dam formation, Earth Surf. Proc. Land., 39, 1913–1926, https://doi.org/10.1002/esp.3585, 2014.
Fan, X., Domènech, G., Scaringi, G., Huang, R., Xu, Q., Hales, T. C., Dai, L., Yang, Q., and Francis, O.: Spatio-temporal evolution of mass wasting after the 2008 Mw 7.9 Wenchuan Earthquake revealed by a detailed multi-temporal inventory, Landslides, 15, 2325–2341, https://doi.org/10.1007/s10346-018-1054-5, 2018a.
Fan, X., Juang, C. H., Wasowski, J., Huang, R., Xu, Q., Scaringi, G., van Westen, C. J., and Havenith, H.-B.: What we have learned from the 2008 Wenchuan Earthquake and its aftermath: A decade of research and challenges, Eng. Geol., 241, 25–32, https://doi.org/10.1016/j.enggeo.2018.05.004, 2018b.
Fawcett, T.: An introduction to ROC analysis, Pattern Recogn. Lett., 27, 861–874, https://doi.org/10.1016/j.patrec.2005.10.010, 2006.
Frattini, P. and Crosta, G. B.: The role of material properties and landscape morphology on landslide size distributions, Earth Planet. Sc. Lett., 361, 310–319, https://doi.org/10.1016/j.epsl.2012.10.029, 2013.
Froude, M. J. and Petley, D. N.: Global fatal landslide occurrence from 2004 to 2016, Nat. Hazards Earth Syst. Sci., 18, 2161–2181, https://doi.org/10.5194/nhess-18-2161-2018, 2018.
Gansser, A.: Geology of the Himalayas, Interscience, New York, USA, 1964.
Gurung, H. B. and Khanal, N. R.: Landscape processes in the Chure range Central Nepal, Himalayan Review, XVII-XIX, 1–39, 1986–1988.
Guzzetti, F., Ardizzone, F., Cardinali, M., Rossi, M., and Valigi, D.: Landslide volumes and landslide mobilization rates in Umbria, central Italy, Earth Planet. Sc. Lett., 279, 222–229, https://doi.org/10.1016/j.epsl.2009.01.005, 2008.
Guzzetti, F., Mondini, A. C., Cardinali, M., Fiorucci, F., Santangelo, M., and Chang, K.-T.: Landslide inventory maps: New tools for an old problem, Earth-Sci. Rev., 112, 42–66, https://doi.org/10.1016/j.earscirev.2012.02.001, 2012.
Haque, U., Blum, P., da Silva, P. F., Andersen, P., Pilz, J., Chalov, S. R., Malet, J.-P., Auflič, M. J., Andres, N., Royiadji, E., Lamas, P. C., Zhang, W., and Peshevski, I.: Fatal landslides in Europe, Landslides, 13, 1545–1554, https://doi.org/10.1007/s10346-016-0689-3, 2016.
Highland, L. M. and Bobrowsky, P. (Eds.): The landslide handbook: A guide to understanding landslides, U.S. Geological Survey, Reston, USA, 2008.
Hodges, K. V., Parrish, R. R., and Searle, M. P.: Tectonic evolution of the central Annapurna Range, Nepalese Himalaya, Tectonics, 15, 1264–1291, 1996.
Hovius, N., Stark, C. P., and Allen, P. A.: Sediment flux from a mountain belt derived by landslide mapping, Geology, 25, 231–234, https://doi.org/10.1130/0091-7613(1997)025<0231:SFFAMB>2.3.CO;2, 1997.
Hovius, N., Stark, C. P., Chu, H. T., and Lin, J. C.: Supply and removal of sediment in a landslide-dominated mountain belt: Central Range, Taiwan, J. Geol., 108, 73–89, https://doi.org/10.1086/314387, 2000.
Hovius, N., Meunier, P., Lin, C. W., Chen, H., Chen Y. G., Dadson, S. J., Horng, M. J., and Lines, M.: Prolonged seismically induced erosion and the mass balance of a large earthquake, Earth Planet. Sc. Lett., 304, 347–355, https://doi.org/10.1016/j.epsl.2011.02.005, 2011.
Hussin, H. Y., Zumpano, V., Reichenbach, P., Sterlacchini, S., Micu, M., van Westen, C. J., and Balteanu, D.: Different landslide sampling strategies in a grid – based bi – variate statistical susceptibility model, Geomorphology, 253, 508–523, https://doi.org/10.1016/j.geomorph.2015.10.030, 2016.
ICIMOD: Landslides in Koshi Basin 2010 [Data set], ICIMOD, https://doi.org/10.26066/rds.23176, 2014a.
ICIMOD: Landslides in Koshi Basin 1990 [Data set], ICIMOD, https://doi.org/10.26066/rds.23175, 2014b.
Jibson, R. W.: Methods for assessing the stability of slopes during earthquakes-A retrospective, Eng. Geol., 122, 43–50, 2011.
Kargel, J. S., Leonard, G. J., Shugar, D. H., Haritashya, U. K., Bevington, A., Fielding, E. J., Fujita, K., Geertsema, M., Miles, E. S., Steiner, J., Anderson, E., Bajracharya, S, Bawden, G. W., Breashears, D. F., Byers, A., Collins, B., Dhital, M. R., Donnellan, A., Evans, T. L., Geai, M. L., Glasscoe, M. T., Green, D., Gurung, D. R., Heijenk, R., Hilborn, A., Hudnut, K., Huyck, C., Immerzeel, W. W., Jiang, L., Jibson, R., Kääb, A., Khanal, N. R., Kirschbaum, D., Kraaijenbrink, P. D. A., Lamsal, D., Shiyin, L., Lv, M., McKinney, D., Nahirnick, N. K., Nan, Z., Ojha, S., Olsenholler, J., Painter, T. H., Pleasants, M., Pratima, K. C., Yuan, Q. I., Raup, B. H., Regmi, D., Rounce, D. R., Sakai, A., Donghui, S., Shea, J. M., Shrestha, A. B., Shukla, A., Stumm, D., van der Kooij, M., Voss, K., Xin, W., Weihs, B., Wolfe, D., Wu, L., Yao, X., Yoder, M. R., and Young, N.: Geomorphic and geologic controls of geohazards induced by Nepal's 2015 Gorkha earthquake, Science, 351, aac8353, https://doi.org/10.1126/science.aac8353, 2, 2016.
Keefer, D. K.: Investigating landslides caused by earthquakes – a historical review, Surv. Geophys., 23, 473–510, https://doi.org/10.1023/A:1021274710840, 2002.
Kirschbaum, D., Stanley, T., and Zhou, Y.: Spatial and temporal analysis of a global landslide catalog, Geomorphology, 249, 4–15, https://doi.org/10.1016/j.geomorph.2015.03.016, 2015.
Klar, A., Aharonow, E., Kalderon-Asael, B., and Katz, O.: Analytical and observational relations between landslide volume and surface area, J. Geophys. Res., 116, 1–10, https://doi.org/10.1029/2009JF001604, 2011.
Korup, O., Clague, J. J., Hermanns, R. L., Hewitt, K., Strom, A. L., and Weidinger, J. T.: Giant landslides topography and erosion, Earth Planet. Sc. Lett., 261, 578–589, https://doi.org/10.1016/j.epsl.2007.07.025, 2007.
Larsen, I. J. and Montgomery, D. R.: Landslide erosion coupled to tectonics and river incision, Nat. Geosci., 5, 468–473, https://doi.org/10.1038/ngeo1479, 2012.
Larsen, I. J., Montgomery, D. R., and Korup, O.: Landslide erosion controlled by hillslope material, Nat. Geosci., 3, 247–251, https://doi.org/10.1038/ngeo776, 2011.
Li, G., West, A. J., Densmore, A. L., Jin, Z., Parker, R. N., and Hilton, R. G.: Seismic mountain building: Landslides associated with the 2008 Wenchuan earthquake in the context of a generalized model for earthquake volume balance, Geochem. Geophy. Geosy., 15, 833–844, https://doi.org/10.1002/2013GC005067, 2014.
Lin, C. W., Liu, S. H., Lee, S. Y., and Liu, C. C.: Impacts of the Chi-Chi earthquake on subsequent rainfall-induced landslides in central Taiwan, Eng. Geol., 86, 87–101, https://doi.org/10.1016/j.enggeo.2006.02.010, 2006.
Lin, G. W., Chen, H., Hovius, N., Horng, M. J., Dadson, S., Meunier, P., and Lines, M.: Effects of earthquake and cyclone sequencing on landsliding and fluvial sediment transfer in a mountain catchment, Earth Surf. Proc. Land., 33, 1354–1373, https://doi.org/10.1002/esp.1716, 2008.
Liucci, L., Melelli, L., Suteanu, C., and Ponziani, F.: The role of topography in the scaling distribution of landslide areas: A cellular automata modeling approach, Geomorphology, 290, 236–249, https://doi.org/10.1016/j.geomorph.2017.04.017, 2017.
Malamud, B. D., Turcotte, D. L., Guzzetti, F., and Reichenbach, P.: Landslide inventories and their statistical properties, Earth Surf. Proc. Land., 29, 687–711, https://doi.org/10.1002/esp.1064, 2004.
Marc, O. and Hovius, N.: Amalgamation in landslide maps: effects and automatic detection, Nat. Hazards Earth Syst. Sci., 15, 723–733, https://doi.org/10.5194/nhess-15-723-2015, 2015.
Marc, O., Hovius, N., Meunier P., Uchida, T., and Hayashi, S.: Transient changes of landslide rates after earthquakes, Geology, 43, 883–886, https://doi.org/10.1130/G36961.1, 2015.
Marc, O., Stumpf, A., Malet, J.-P., Gosset, M., Uchida, T., and Chiang, S.-H.: Initial insights from a global database of rainfall-induced landslide inventories: the weak influence of slope and strong influence of total storm rainfall, Earth Surf. Dynam., 6, 903–922, https://doi.org/10.5194/esurf-6-903-2018, 2018.
Marc, O., Behling, R., Andermann, C., Turowski, J. M., Illien, L., Roessner, S., and Hovius, N.: Long-term erosion of the Nepal Himalayas by bedrock landsliding: the role of monsoons, earthquakes and giant landslides, Earth Surf. Dynam., 7, 107–128, https://doi.org/10.5194/esurf-7-107-2019, 2019.
Martha, T. R., Reddy, P. S., Bhatt, C. M., Govindha, Raj, K. B., Nalini, J., Padmanabha, A., Narender, B., Kumar, K. V., Muralikrishnan, S., Rao, G. S., Diwakar, P. G., and Dadhwal, V. K.: Debris volume estimation and monitoring of Phuktal river landslide-dammed lake in the Zanskar Himalayas, India using Cartosat-2 images, Landslides, 14, 373–383, https://doi.org/10.1007/s10346-016-0749-8, 2017a.
Martha, T. R., Roy, P., Mazumdar, R., Govindharaj, K. B., and Kumar, K. V.: Spatial characteristics of landslides triggered by the 2015 Mw 7.8 (Gorkha) and Mw 7.3 (Dolakha) earthquakes in Nepal, Landslides, 14, 697–704, https://doi.org/10.1007/s10346-016-0763-x, 2017b.
Meunier, P., Hovius, N., and Haines, J. A.: Topographic site effects and the location of earthquake induced landslides, Earth Planet. Sc. Lett., 275, 221–232, https://doi.org/10.1016/j.epsl.2008.07.020, 2008.
Nandi, A. and Shakoor, A.: A GIS-based landslide susceptibility evaluation using bivariate and multivariate statistical analyses, Eng. Geol., 110, 11–20, https://doi.org/10.1016/j.enggeo.2009.10.001, 2010.
Pellicani, R. and Spilotro, G.: Evaluating the quality of landslide inventory maps: comparison between archive and surveyed inventories for the Daunia region (Apulia, Southern Italy), B. Eng. Geol. Environ., 74, 357–367, https://doi.org/10.1007/s10064-014-0639-z, 2015.
Peng, L., Xu, S., and Peng, J.: Research on development characteristics and size of landslide in the Three Gorges area, Geoscience, 28, 1077–1086, 2014.
Petley, D.: Global patterns of loss of life from landslides, Geology, 40, 927–930, https://doi.org/10.1130/G33217.1, 2012.
Razavizadeh, S., Solaimani, K., Massironi, M., and Kavian, A.: Mapping landslide susceptibility with frequency ratio, statistical index, and weights of evidence models: a case study in northern Iran, Environ. Earth Sci., 76, 499, https://doi.org/10.1007/s12665-017-6839-7, 2017.
Reichenbach, P., Rossi, M., Malamud, B. D., Mihir, M., and Guzzetti, F.: A review of statistically-based landslide susceptibility models, Earth-Sci. Rev., 180, 60–91, https://doi.org/10.1016/j.earscirev.2018.03.001, 2018.
Roback, K., Clark, M. K., West, A. J., Zekkos, D., Li, G., Gallen, S. F., Champlain, D., and Godt, J. W.: Map data of landslides triggered by the 25 April 2015 Mw 7.8 Gorkha, Nepal earthquake: U.S. Geological Survey data release, https://doi.org/10.5066/F7DZ06F9, 2017.
Saba, S. B., van der Meijde, M., and van der Werff, H.: Spatio-temporal landslide detection for the 2005 Kashmir earthquake region, Geomorphology, 124, 17–25, https://doi.org/10.1016/j.geomorph.2010.07.026, 2010.
SafeLand: Guidelines for landslide susceptibility, hazard and risk assessment and zoning, available at: https://www.ngi.no/eng/Projects/SafeLand (last access: 15 April 2018), 2015.
Stark, C. P. and Guzzetti, F.: Landslide rupture and the probability distribution of mobilized debris volumes, J. Geophys. Res.-Earth, 114, F00A02, https://doi.org/10.1029/2008JF001008, 2009.
Stark, C. P. and Hovius, N.: The characterization of landslide size distributions, Geophys. Res. Lett., 28, 1091–1094, https://doi.org/10.1029/2000GL008527, 2001.
Tang, C., Zhu, J., and Qi, X.: Landslide hazard assessment of the 2008 Wenchuan earthquake: a case study in Beichuan area, Can. Geotech. J., 48, 128–145, https://doi.org/10.1139/T10-059, 2010.
Tang, C., Van Westen, C. J., Tanyas, H., and Jetten, V. G.: Analysing post-earthquake landslide activity using multi-temporal landslide inventories near the epicentral area of the 2008 Wenchuan earthquake, Nat. Hazards Earth Syst. Sci., 16, 2641–2655, https://doi.org/10.5194/nhess-16-2641-2016, 2016.
Tanyas, H., van Westen, C. J., Allstadt, K. E., Jesse, M. A., Gorum, T., Jibson, R. W., Godt, J. W., Sato, H. P., Schmidt, R. G., Marc, O., and Hovius, N.: Presentation and Analysis of a World-Wide Database of Earthquake-Induced Landslide Inventories, J. Geophys. Res.-Earth, 122, 1991–2015, https://doi.org/10.1002/2017jf004236, 2017.
Tanyas, H., Allstadt, K. E., and van Westen, C. J.: An updated method for estimating landslide-event magnitude, Earth Surf. Proc. Land., 43, 1836–2814, https://doi.org/10.1002/esp.4359, 2018.
ten Brink, U. S., Barkan, R., Andrews, B. D., and Chaytor, J. D.: Size distributions and failure initiation of submarine and subaerial landslides, Earth Planet. Sc. Lett. 287, 31–42, https://doi.org/10.1016/j.epsl.2009.07.031, 2009.
Tong, L., Qi, S., An, G., and Liu, C.: Large scale geo-hazards investigation by remote sensing in Himalayan region, Science Press, Beijing, China, 2013.
Wachal, D. J. and Hudak, P. F.: Mapping landslide susceptibility in Travis County, Texas, USA, GeoJournal, 51, 245–253, https://doi.org/10.1023/A:1017524604463, 2000.
Wald, D. J., Quitoriano, V., Heaton, T. H., and Kanamori, H.: Relationship between Peak Ground Acceleration, Peak Ground Velocity, and Modified Mercalli Intensity for Earthquakes in California, Earthq. Spectra, 15, 557–564, 1999.
Wang, L., Sawada, K., and Moriguchi, S.: Landslide susceptibility analysis with logistic regression model based on FCM sampling strategy, Comput. Geosci., 57, 81–92, https://doi.org/10.1016/j.cageo.2013.04.006, 2013.
Zhang, J., Gurung, D. R., Liu, R. K., Murthy, M. S. R., and Su, F. H.: Abe Barek landslide and landslide susceptibility assessment in Badakhshan Province, Afghanistan, Landslides, 12, 597–609, https://doi.org/10.1007/s10346-015-0558-5, 2015.
Zhang, J., Liu, R., Deng, W., Khanal, N. R., Gurung, D. R., Murthy, M. S. R., and Wahid, S.: Characteristics of landslide in Koshi River basin, central Himalaya, J. Mt. Sci., 13, 1711–1722, https://doi.org/10.1007/s11629-016-4017-0, 2016.
- Abstract
- Introduction
- Study area
- Input data
- Methods
- Landslide characteristics
- Landslide susceptibility assessment
- Validation of landslide susceptibility maps
- Discussion
- Conclusions
- Data availability
- Author contributions
- Competing interests
- Acknowledgements
- Financial support
- Review statement
- References