the Creative Commons Attribution 4.0 License.
the Creative Commons Attribution 4.0 License.
 | 21 Jan 2019
Real-time monitoring and FEMLIP simulation of a rainfall-induced rockslide
Zhaohua Li
Zhigang Tao
Yuanjun Jiang
Qian Lv
Felix Darve
Manchao He
Rockslides are a common and devastating problem affecting mining and other engineering activities all over the world; consequently, there have been many studies into their prediction and prevention. This study focused on a recent rockslide in an open-pit mine in Liaoning Province, China. The stability of the rock slope under excavation and rainfall conditions was monitored using an efficient real-time monitoring system. A further numerical analysis was performed using the finite element method with Lagrangian integration points (FEMLIP), and two forms of the normalized global second-order work were calculated to analyze the stability of the rock slope. In fact for the future it would be very interesting to compare measurements and simulations in real time, and not only to develop back computations after failure. The numerical results indicate that the rock slope remained stable during excavation, yet lost stability after subsequent rainfall. Water infiltration, along with a major geological discontinuity, degraded the strength of the weak zone and induced the rockslide. The monitoring approach presented its robustness and generality, and was worth being generalized. The numerical approach proposed the evolution of the safety factor, the monitoring data were compared, and the mechanism of the rockslide was determined. It could be used as an assistant tool for disaster prediction.
- Article
(17400 KB) - Full-text XML
- BibTeX
- EndNote


Rockslides characterized by sudden occurrence, large volume, and frequently high acceleration are a hazard around the world. The mechanisms driving this hazard are complex, and rockslides can be influenced by a large number of factors, including topography, earthquakes, human factors, and climatic variation (Chen et al., 2006; Wang et al., 2011; Tu et al., 2009). Rockslides can occur suddenly and rapidly, for example, after rock slopes undergo a series of slow and imperceptible changes. For civil safety and engineering activities, careful monitoring and accurate prediction are challenging geological and geotechnical issues.
Not all rock slope instabilities induce catastrophic consequences. Recently, a sudden rockslide in an open-pit iron ore mine was successfully monitored on 31 October 2016. Early warnings were received, and fatalities and economic damage were avoided. This rockslide occurred after excavation on the toe of the slope and subsequent rainfall lasting about 21 h. The slope was reinforced and the stability was monitored using constant resistance and large deformation (CRLD) cables, which could support a large elongation of 2 m and provide a constant resistance for the large elongation (He, 2009; He et al., 2014). Using real-time monitoring data, the early warning system sent urgent slide warnings, so that all staff and equipment were evacuated in time. After 4 h, global instability occurred and a rock mass with a volume of 1.35×10⁴ m3 slid down the slope. It should be noted that this rockslide was the second slide in the same area, and there was another rockslide, induced by excavation, which occurred in 2011. It was also successfully predicted using the monitoring system, and the reliability of this monitoring system for excavation-induced rockslides has been proven (Li et al., 2018b). One of the objectives of this study is to present the monitoring of the second rockslide in 2016, and to discuss the adaptability of the monitoring system for rockslides induced by different triggering factors. Figure 1 illustrates the remote-sensing system for monitoring and predicting landslides. The CRLD cables are usually installed in the rock mass with an inclination of 25∘, and their fixed parts are anchored under the weak zone. The sensing device is installed at point D1, as shown in Fig. 1a, and the monitored data are sensed by the receiver in the Beidou satellite and then transmitted to the indoor monitoring center. By means of the satellite system, the monitored anchorage force can be transmitted once every 1–2 h in real mining projects (Li et al., 2018b).
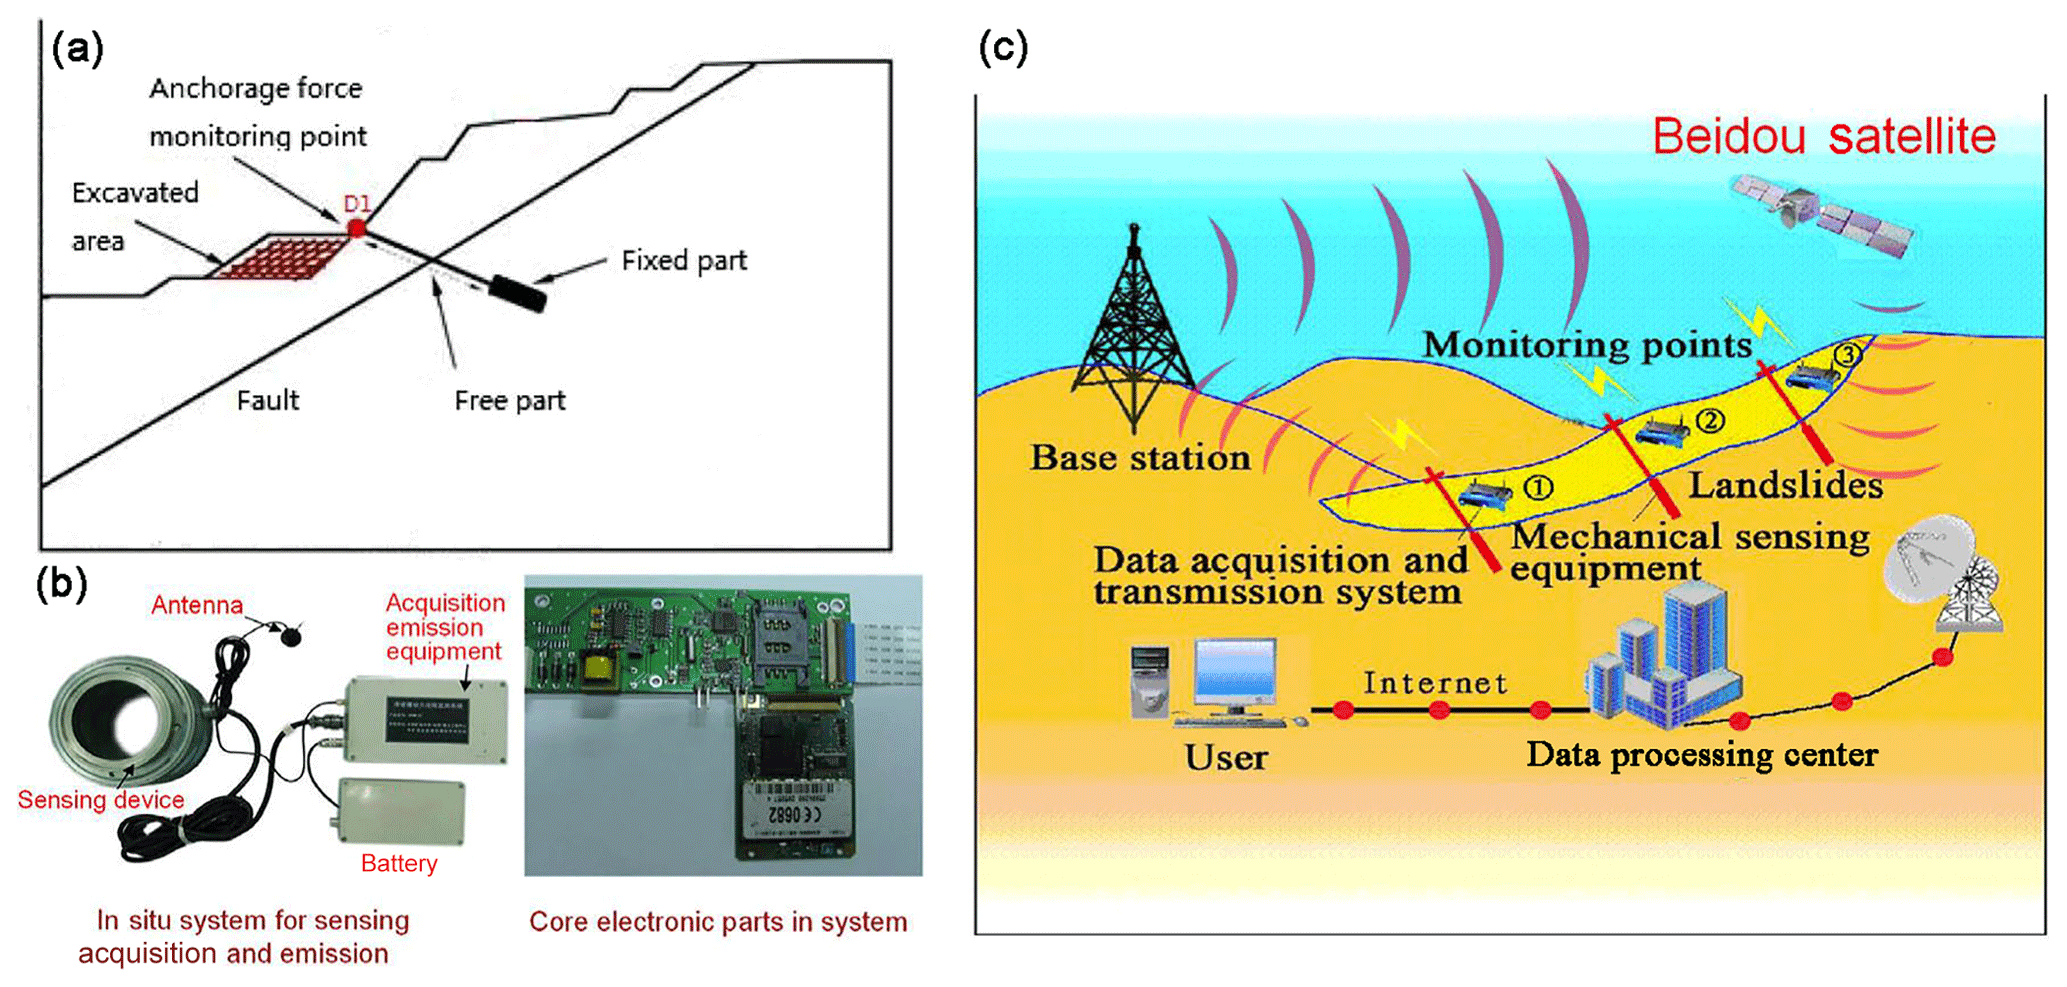
Figure 1Remote-sensing system for monitoring and predicting landslides: (a) simplified model of the CRLD cable sliding-resistant system, (b) remote-sensing equipment, and (c) Beidou satellite remote-sensing system for monitoring the anchorage force (Li et al., 2018b).
Numerical methods are an important tool to analyze the failure mechanisms and the instability issues of geomaterials. Besides the classical finite element method (FEM) and the finite difference method (FDM), diverse new numerical approaches have been proposed (Soga et al., 2016). Smooth particle hydrodynamics (Cascini et al., 2014) has been used to simulate channelized landslides of flow type; the material point method (Soga et al., 2016; Abe et al., 2013; Marcelo et al., 2016; Bandara et al., 2016) can describe the whole process of landslide movement using hydromechanical coupling; the discrete element method has been used to model the instability of jointed rock slopes (Dong et al., 2015; Huang et al., 2015); and the finite element method with Lagrangian integration points (FEMLIP; Cuomo et al., 2013) has been developed from the particle-in-cell method (Harlow, 1964; Moresi et al., 2002, 2003) and satisfies the two requirements for simulating the complete evolution of landslides: precise tracking of internal variables and the ability to solve large displacements (Li et al., 2016, 2018a; Prime et al., 2013). In contrast to the material point method, the numerical weight of material particles used in the FEMLIP method is updated at each time step, leading to an acceptable calculation cost, owing to the use of an implicit solver (Li et al., 2018a). Each method has its advantages and drawbacks, and for details, the reader can refer to the previous contributions (Soga et al., 2016; Li et al., 2018a). In this study, the FEMLIP method was used to simulate the rockslide because it overcame the problem of mesh distortion during the large deformation of geomaterials and could easily take into account the normalized global second-order work as a safety factor.
This paper is organized as follows: Sect. 2 presents the engineering geological properties and the monitoring anchorage force corresponding to the studied rockslide. Section 3 describes our FEMLIP model of the studied rockslide. First, the hydro-elastoplastic model is briefly presented, second, FEMLIP modeling of the rockslide is performed, and third, the numerical results are analyzed and compared with monitoring data, and the cause of the rockslide is determined. In Sect. 4, some conclusions and future research prospects are discussed.
2.1 Location of study site
The Nanfen open-pit iron mine is one of the largest iron ore mines in Asia, with a mining history of more than 100 years. This mine is situated in the city of Nanfen, Liaoning Province, China. In recent years, the local slope has reached 552 m (elevation 142 to 694 m, and the bottom elevation of the mine was 160 m in 2011 (Li et al., 2018b), owing to mining of shallow strata and an increase in mining depth. From 1999 to 2016, several rockslides of different scales were reported, due to both mining activity and rainfall. This study focused on a rockslide on 31 October 2016, which followed excavations on the toe of the slope and occurred after a period of rainfall. As shown in Fig. 2a, several CRLD cables were installed within the area of an old landslide, to reinforce the slope and monitor the anchorage force, and the studied rockslide at elevations between 442 and 502 m (red zone in Fig. 2a) was monitored by the CRLD cable 478-3. In the same area, a previous rockslide occurred in 2011 at elevations between 442 and 550 m (purple zone in Fig. 2a), and it was monitored using the CRLD cable 478-3' (green point in Fig. 2a).
2.2 Engineering geological properties
The open-pit mine is located at the southern side of the Heibeishan inverted anticline, composed of the Archean Anshan Group, Proterozoic Liaohe Group, and Sinian and Quaternary strata. Figure 2b shows that the rockslide occurred on the heading wall, an inclined hard rock slope consisting of chlorite schist and chlorite–hornblende, separated by a major weak zone with a slope of 48∘, and a strike angle of 295∘. The hanging wall is an anti-inclined rock slope consisting principally of migmatitic gneiss and two-mica quartz schist, with a hardness of 13–16 and a slope of 46–48∘. The weak zone consisted of the strongly fragmented two-mica quartz schist, with a thickness of about 2 m and a length of about 600 m (Li et al., 2018b). This weak zone was considered to run through the heading wall, and controlled the stability of the slope on the heading wall. It partially emerged after the rockslide, and was humid and partially sandwiched with mud.
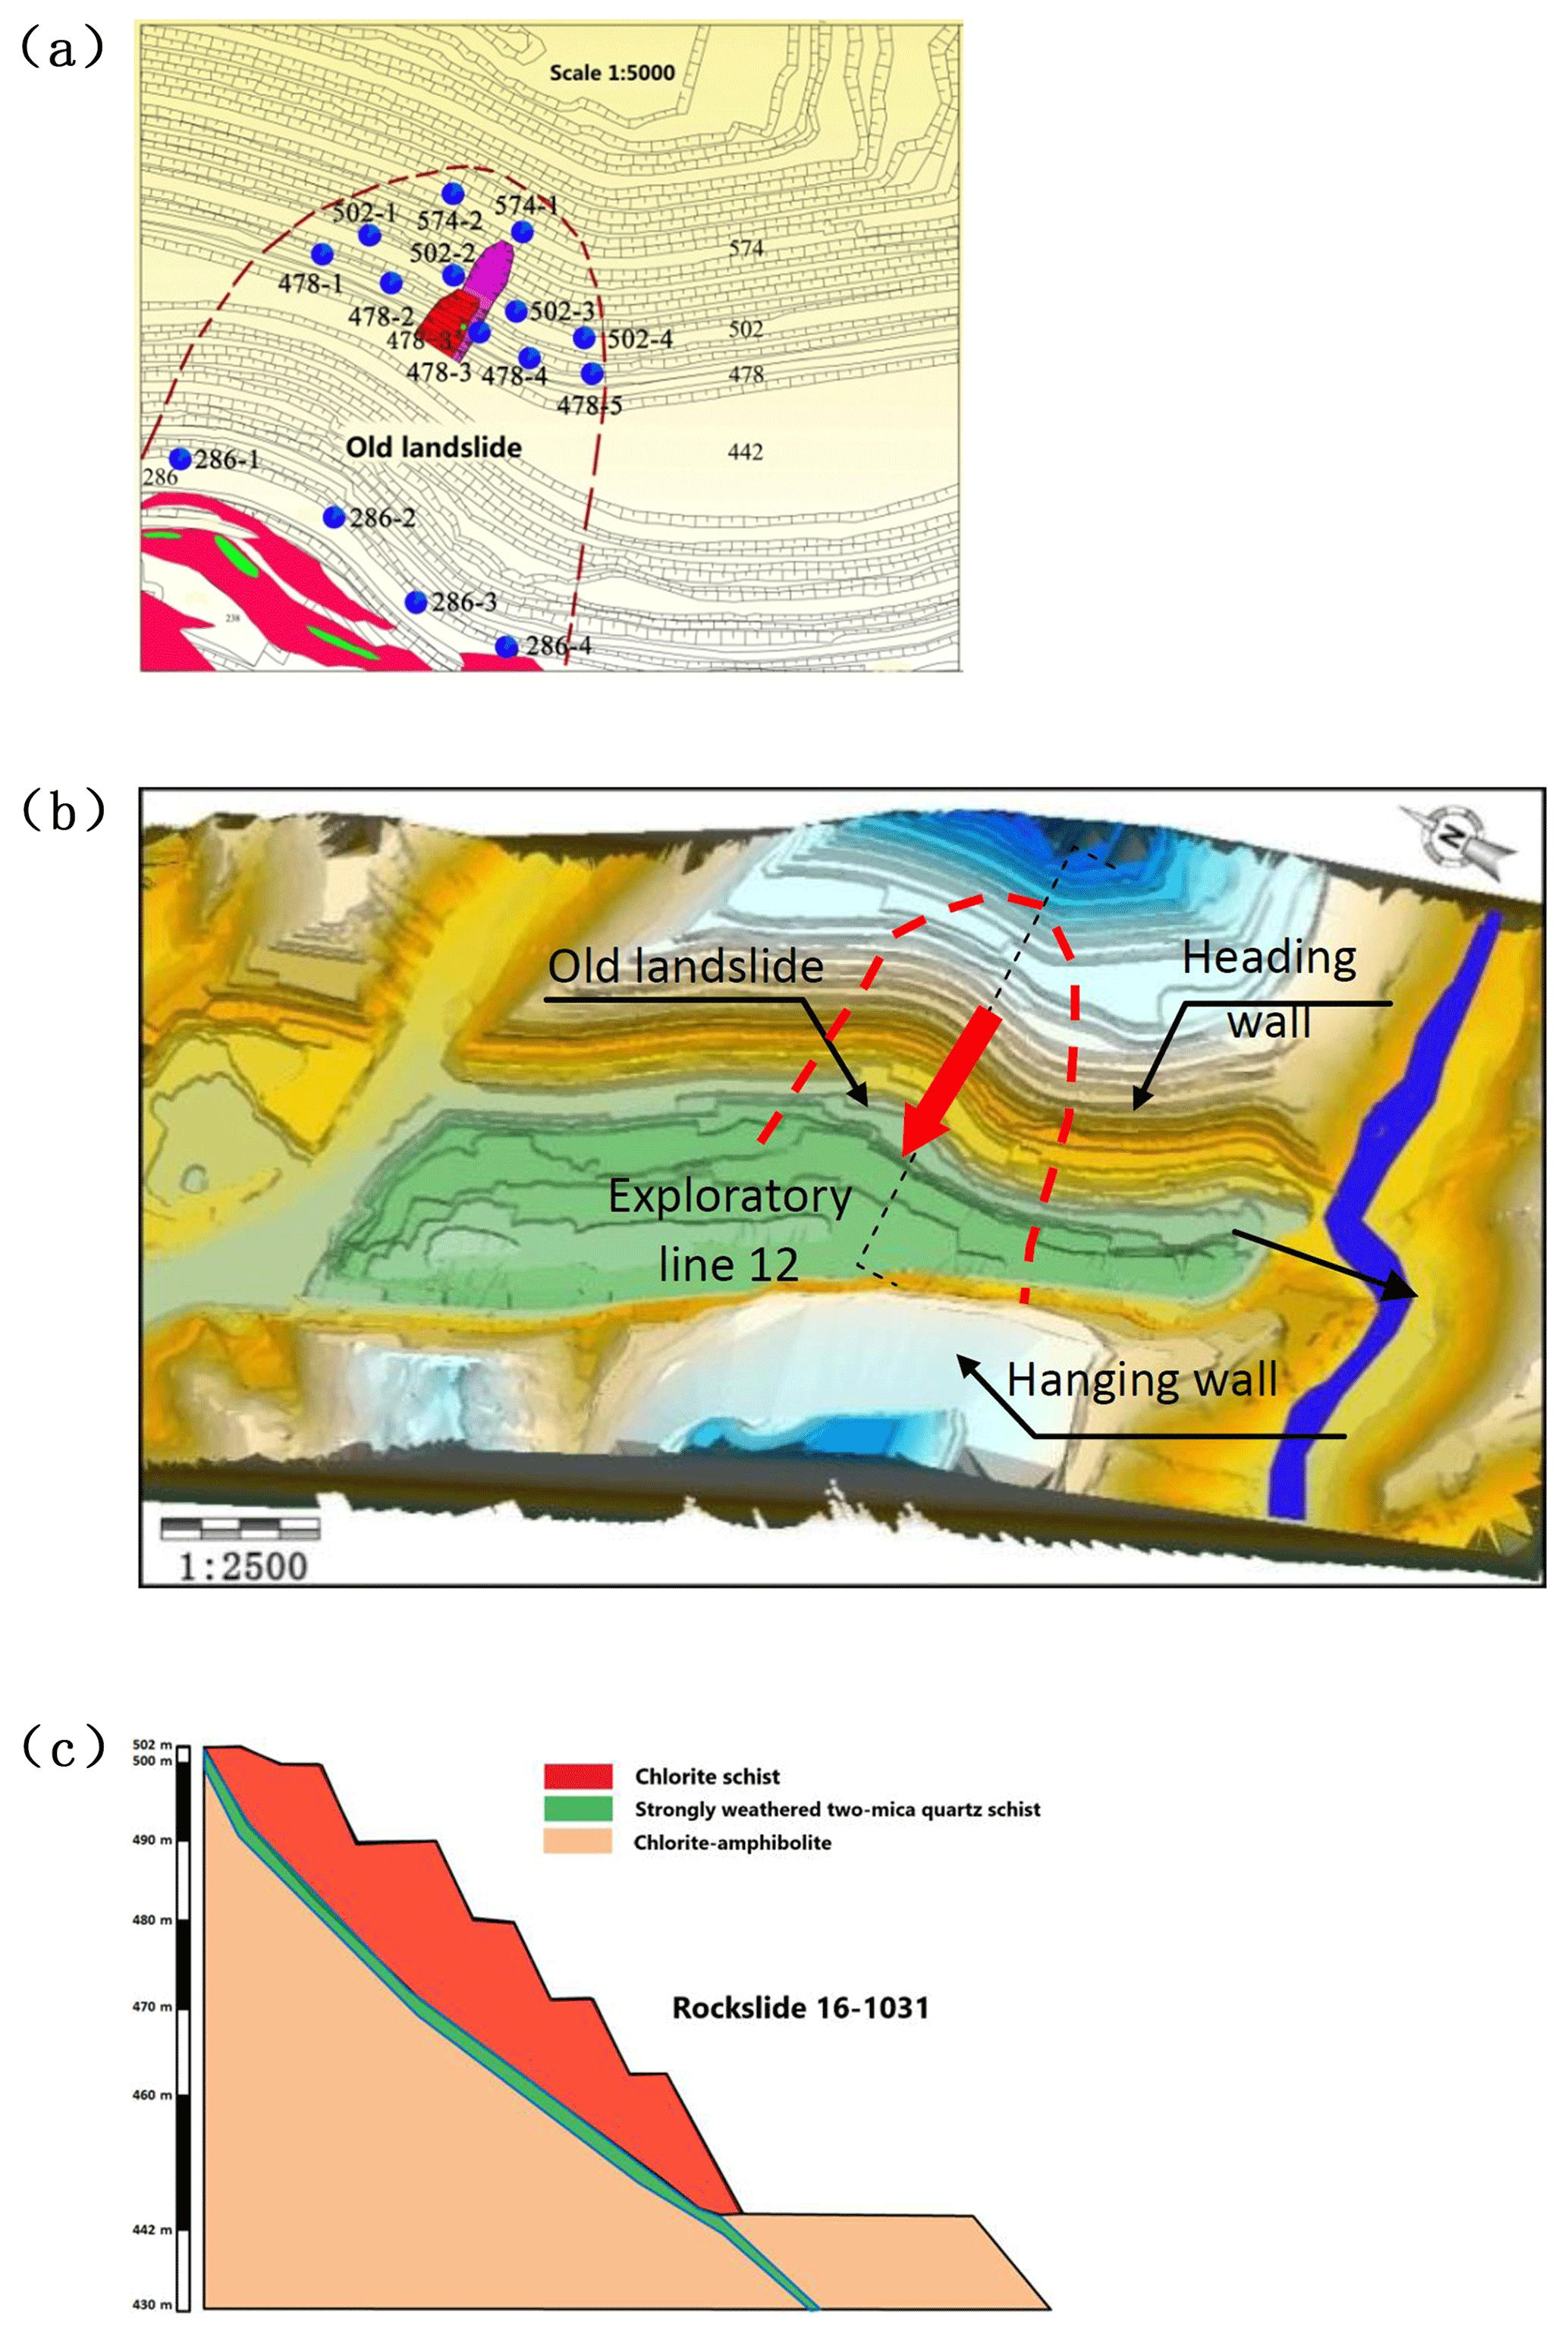
Figure 2(a) Plan graph of the Nanfen open-pit iron mine rockslide location. The red area shows the location of the studied landslide that occurred on 31 October 2016. The purple zone shows the boundary of a rockslide that occurred in 2011. Blue circles show the current distribution of force monitoring points, and the green one, 478-3', indicates the CRLD cable that was employed during the rockslide in 2011. (b) Relief map of the Nanfen mine. (c) Geological profile along exploratory line 12.
2.3 Site survey and rockslide characteristics
In order to understand the geological properties of the open-pit mine in detail, detailed investigations were performed along 28 exploratory lines. For each exploratory line, 140 boreholes were drilled at intervals of 50 m. The dip direction of the studied rockslide was close to the direction of exploratory line 12 (see Fig. 2b); the length along the dip direction was 60 m. The width along the strike line was 50 m, and the corresponding surface was about 3000 m2. The rockslide was inclined and had a volume of 1.35×10⁴ m3; the maximum thickness of the sliding bodies was about 18 m.
The landslide front was situated on a bench at 442 m elevation, and deposits were concentrated at this level and on the slope between the benches at 442 and 430 m elevation. The trailing edge of the rockslide was situated on the bench at 502 m elevation, where a sinking of 7.5 m was induced by the rockslide, as shown in Fig. 3.

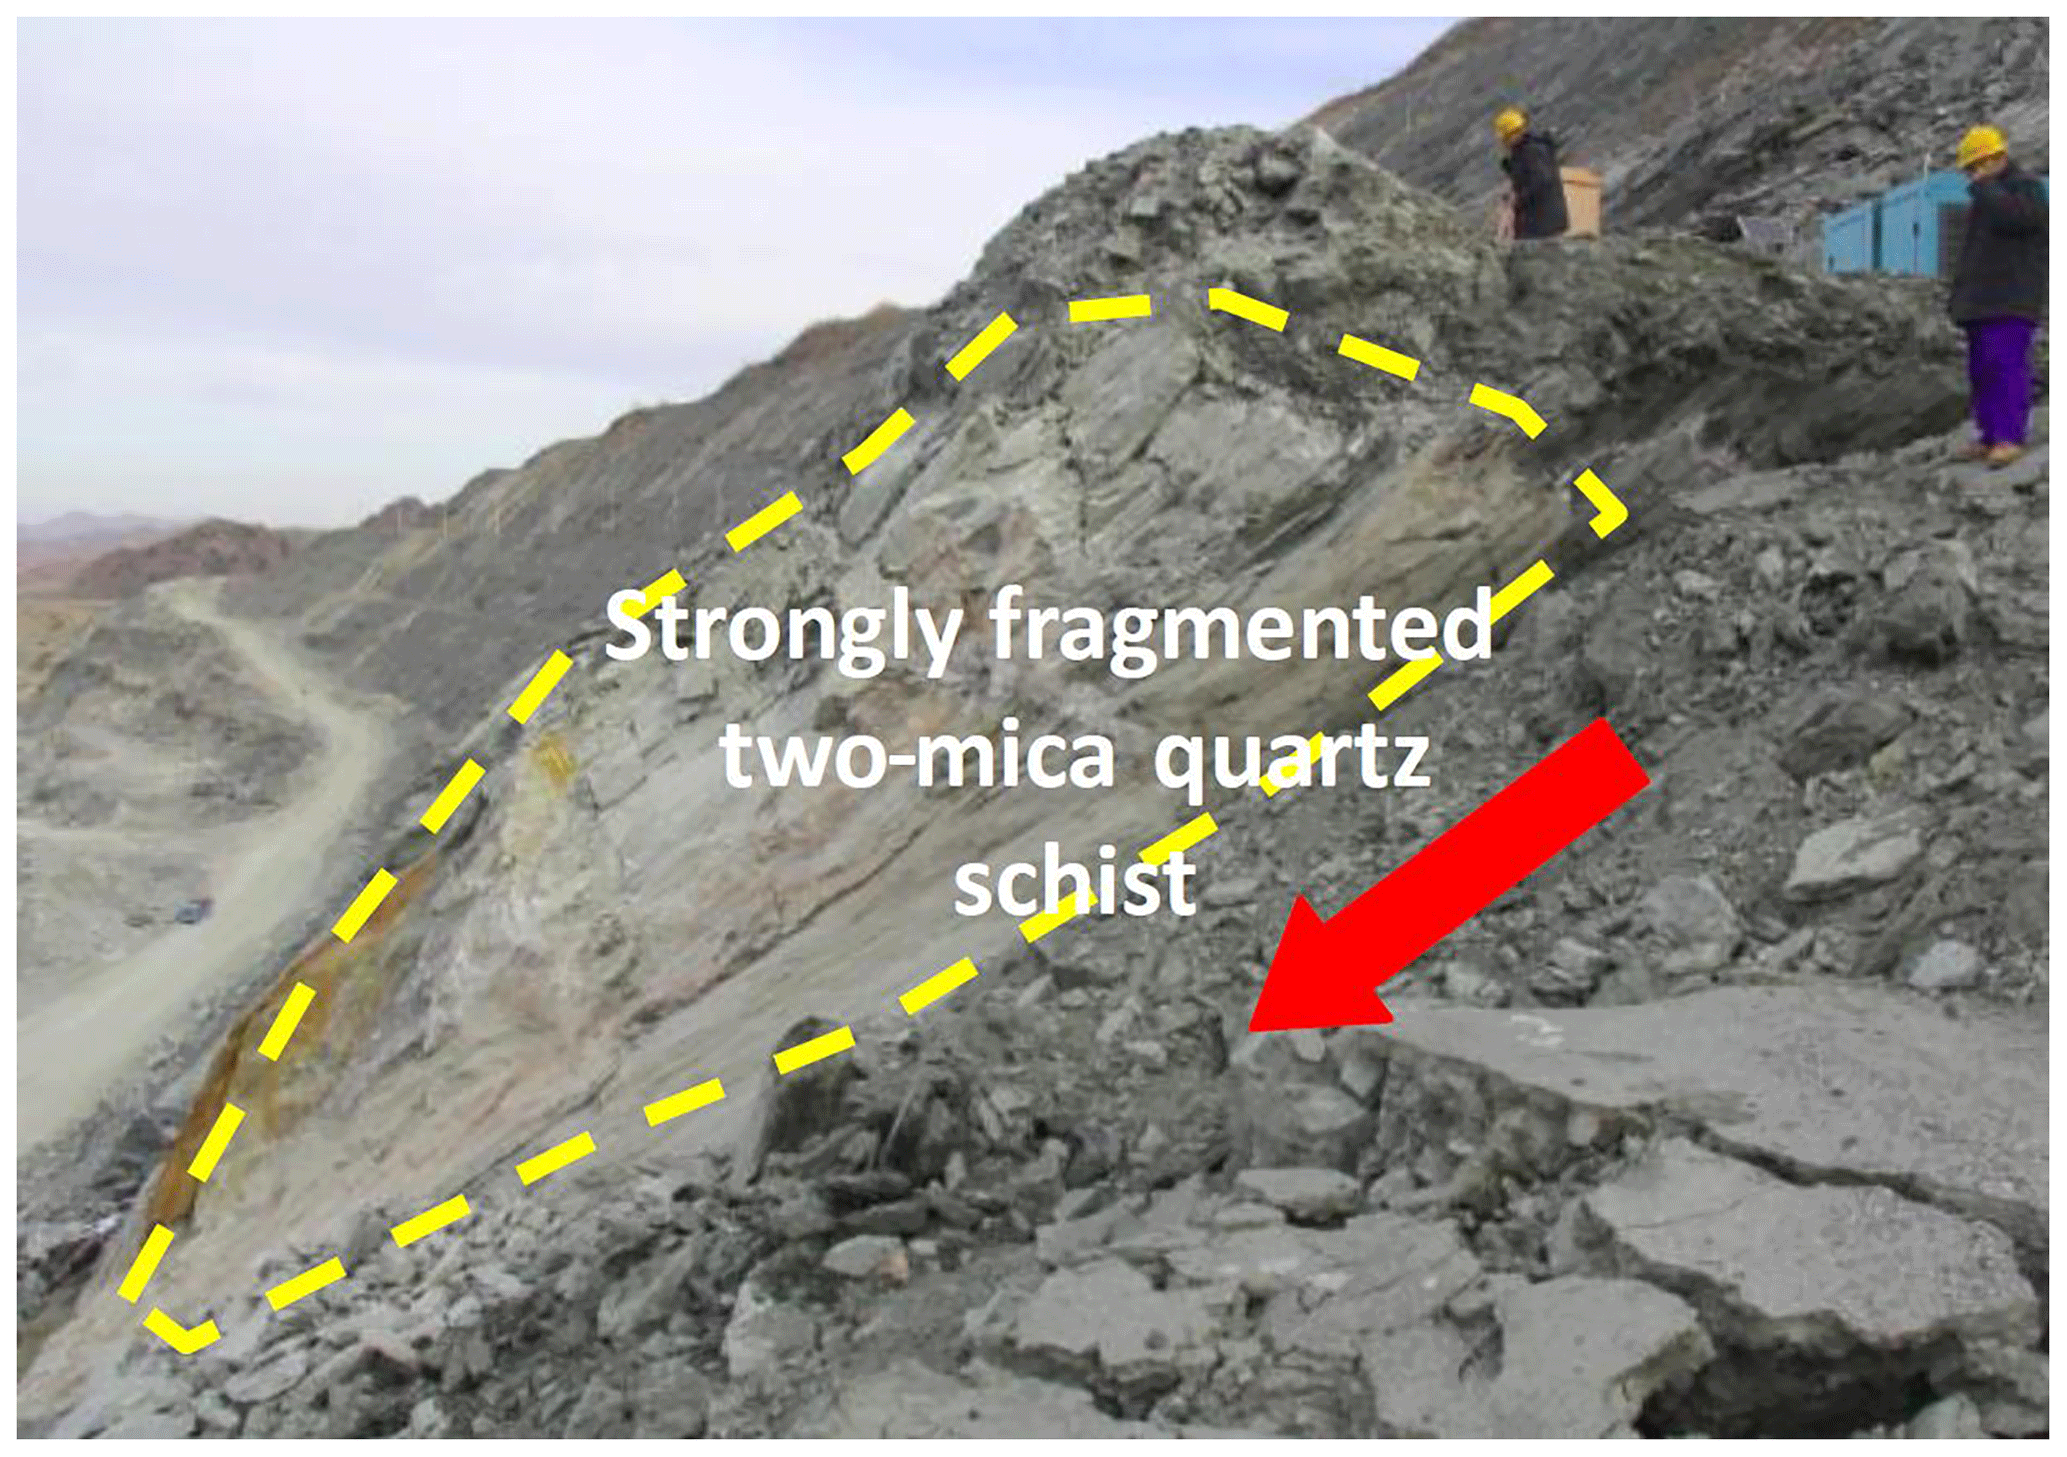
The slip surface mainly included a major geological discontinuity, and was smooth and significantly striated (Fig. 4). The major geological discontinuity, which consisted of strongly fragmented two mica-quartz schist, decreased in strength, owing to water infiltration. After the rockslide, rock along the slip surface was moist and the mechanical properties were observed to be significantly degraded. Throughout the rockslide, the slide body did not completely disintegrate, but slid as big blocks along the slip surface.
2.4 Real-time monitoring
The rock slope was under real-time monitoring by the CRLD cables, developed in the State Key Laboratory for Geomechanics and Deep Underground Engineering. A cable of this type can support large deformation (up to 2 m) while offering constant resistance. The development of the CRLD cable not only reinforced the anchoring ability, but also made it possible to monitor crustal stress in deep strata, and it successfully predicted the rockslide that occurred in 2011 due to the excavation on the toe of the slope (Li et al., 2018b). As shown in Fig. 5a, the CRLD cable is composed of a piston-like cone body installed on a bundle of cables (6–8 cables) and a sleeve pipe with an inner diameter slightly smaller than the diameter of the large end of the cone; a face pallet served as the retention element. The anchored end is fixed using grout, and the relative displacement appears between the sleeve pipe and the cables when an axial pull load larger than the constant resistance of the cable is exerted on the face pallet end. The large-end diameter of the cone is slightly larger than the inner diameter of the sleeve pipe, in order to produce sufficient frictional resistance during the relative movement and to avoid failure of the sleeve pipe. Figure 5b shows the constant resistance and large deformation properties according to the static pullout tests in the laboratory, and this advantage makes monitoring and prediction possible during the occurrence of landslides, even if significant relative movement appears on the sliding surface. More details of the CRLD cable and the remote monitoring system can be found in the previous contributions (He, 2009; Sun et al., 2011; He et al., 2014).
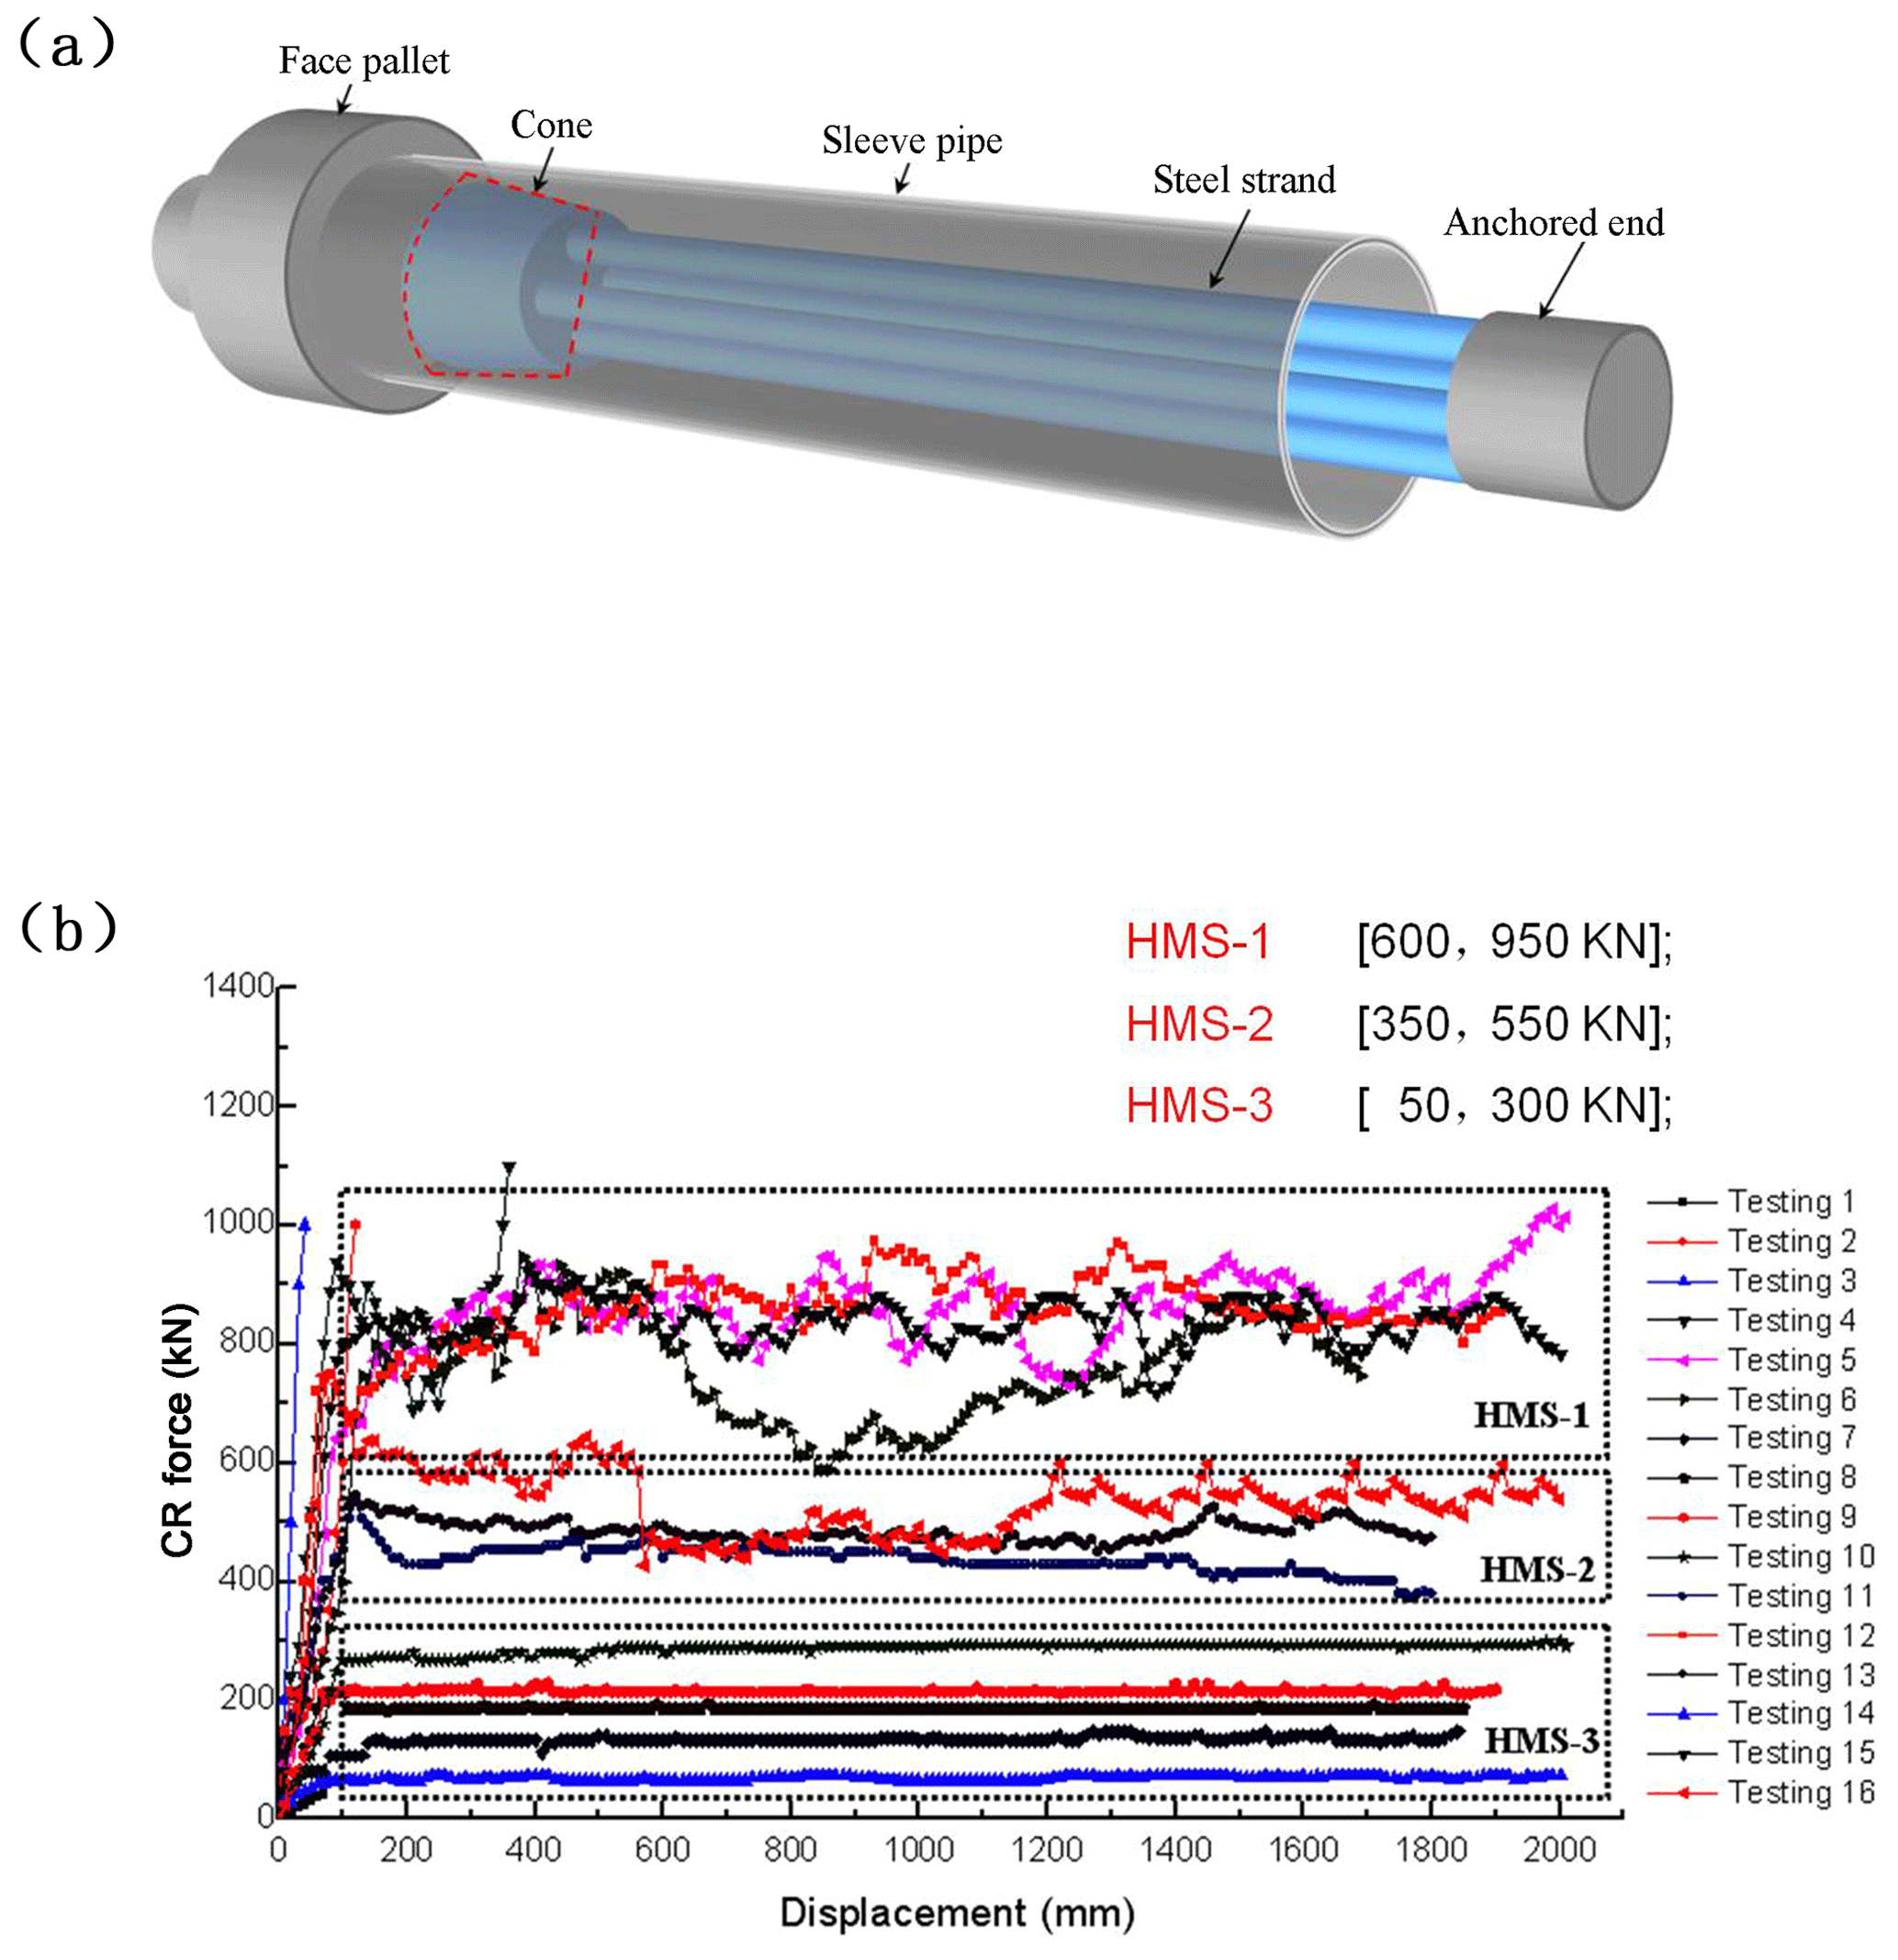
Figure 5(a) Structure of the CRLD cable in three-dimensional view (Li et al., 2018b). (b) Constant resistance and large deformation exhibited by the CRLD cable of different specifications, under static loading.
In the old landslide area (as shown in Fig. 1), 15 anchorage force monitoring points and two GPS surface displacement monitoring points were installed. One of the surface displacement monitoring points was located on the bench at 478 m, within the domain of the studied rockslide, and it was destroyed by a rockfall during the rockslide (Fig. 6). In the hanging wall, which was stable compared with the footwall, one GPRS relay station and one Beidou satellite relay station were installed. These installations were completed in August 2010 and became operational in October 2010, and have proposed several successful predictions for rockslides which have occurred in this zone, including the one in 2011 (Li et al., 2018b).

2.5 Anchorage force monitoring
From 7 September 2015, the anchorage force monitored at point 478-3 showed a series of slow increases and three sudden increases, which accumulated a force increase from 270 to 600 kN until 1 September 2016, as denoted by the points A, B, and C in Fig. 7a. Before 1 September 2016, the cumulative value had not strictly reached the warning threshold proposed by He (2009), and no obvious fissures were observed according to in situ surveys; therefore, no warning was sent. As a result of constant mining activity, the cumulative increase of anchorage force reached 330 kN, and the fourth sudden increase appeared after 1 September 2016, as denoted by point D in Fig. 7a. Although no fissures were observed, the first long-term warning was sent by field staff due to the sudden increase, and the monitoring frequency was increased to twice per hour. When the anchorage force returned to a constant level on 1 October 2016, the cumulative force increase exceeded 220 kN and a few surface fissures appeared, and the medium-term warning was sent. Mining activities ceased and the monitoring frequency was doubled to four times per hour. In the following days, the curve remained constant and no obvious fissures continued to develop; therefore, mining excavations restarted along the bench at 442 m elevation on 28 October 2016. On 30 October, the anchorage force suddenly increased again at 04:53, and reached a peak value of 855 kN at 17:07, during a period of rainfall. A subsequent dive of the anchorage force was observed. The short-term warning was sent at 08:56 on 31 October, and all staff were urgently evacuated. At 23:52 on 31 October, the rockslide occurred, prompting a large volume of rock to slide downhill and pile up on the bench at 442 m elevation.
Mining activities on the toe of the rock slope explain the first four sudden increases in monitored anchorage force. However, the last excavation before the rockslide occurred on 28 October 2016, and there was no obvious increase in the curve of anchorage force (Fig. 7b), though it remained a high level. On 30 October 2016, the last abrupt increase in anchorage force appeared during a period of intense rainfall, before the subsequent rockslide on 31 October 2016. Based on the survey data, this rainfall was considered to directly trigger this rockslide.
Figure 7c shows the monitoring anchorage force during the excavation-induced rockslide in 2011, and similar evolution, that the anchorage force quickly increases to a peak and sharply decreases until the rockslide occurs, is observed. Comparing Fig. 7a and b, both of the peak and the decrease during the rockslide are on a significantly larger scale, with values of 1678 kN and about 200 kN, respectively. The reason was that the CRLD cable 478-3' was located within the range of the rockslide that occurred in 2011, and thus completely reflected the variation of the sliding force; the CRLD cable 478-3 was located outside the range of the rockslide that occurred in 2016, so the variation of the sliding force was partially reflected. However, this does not obstruct the successful monitoring and prediction.
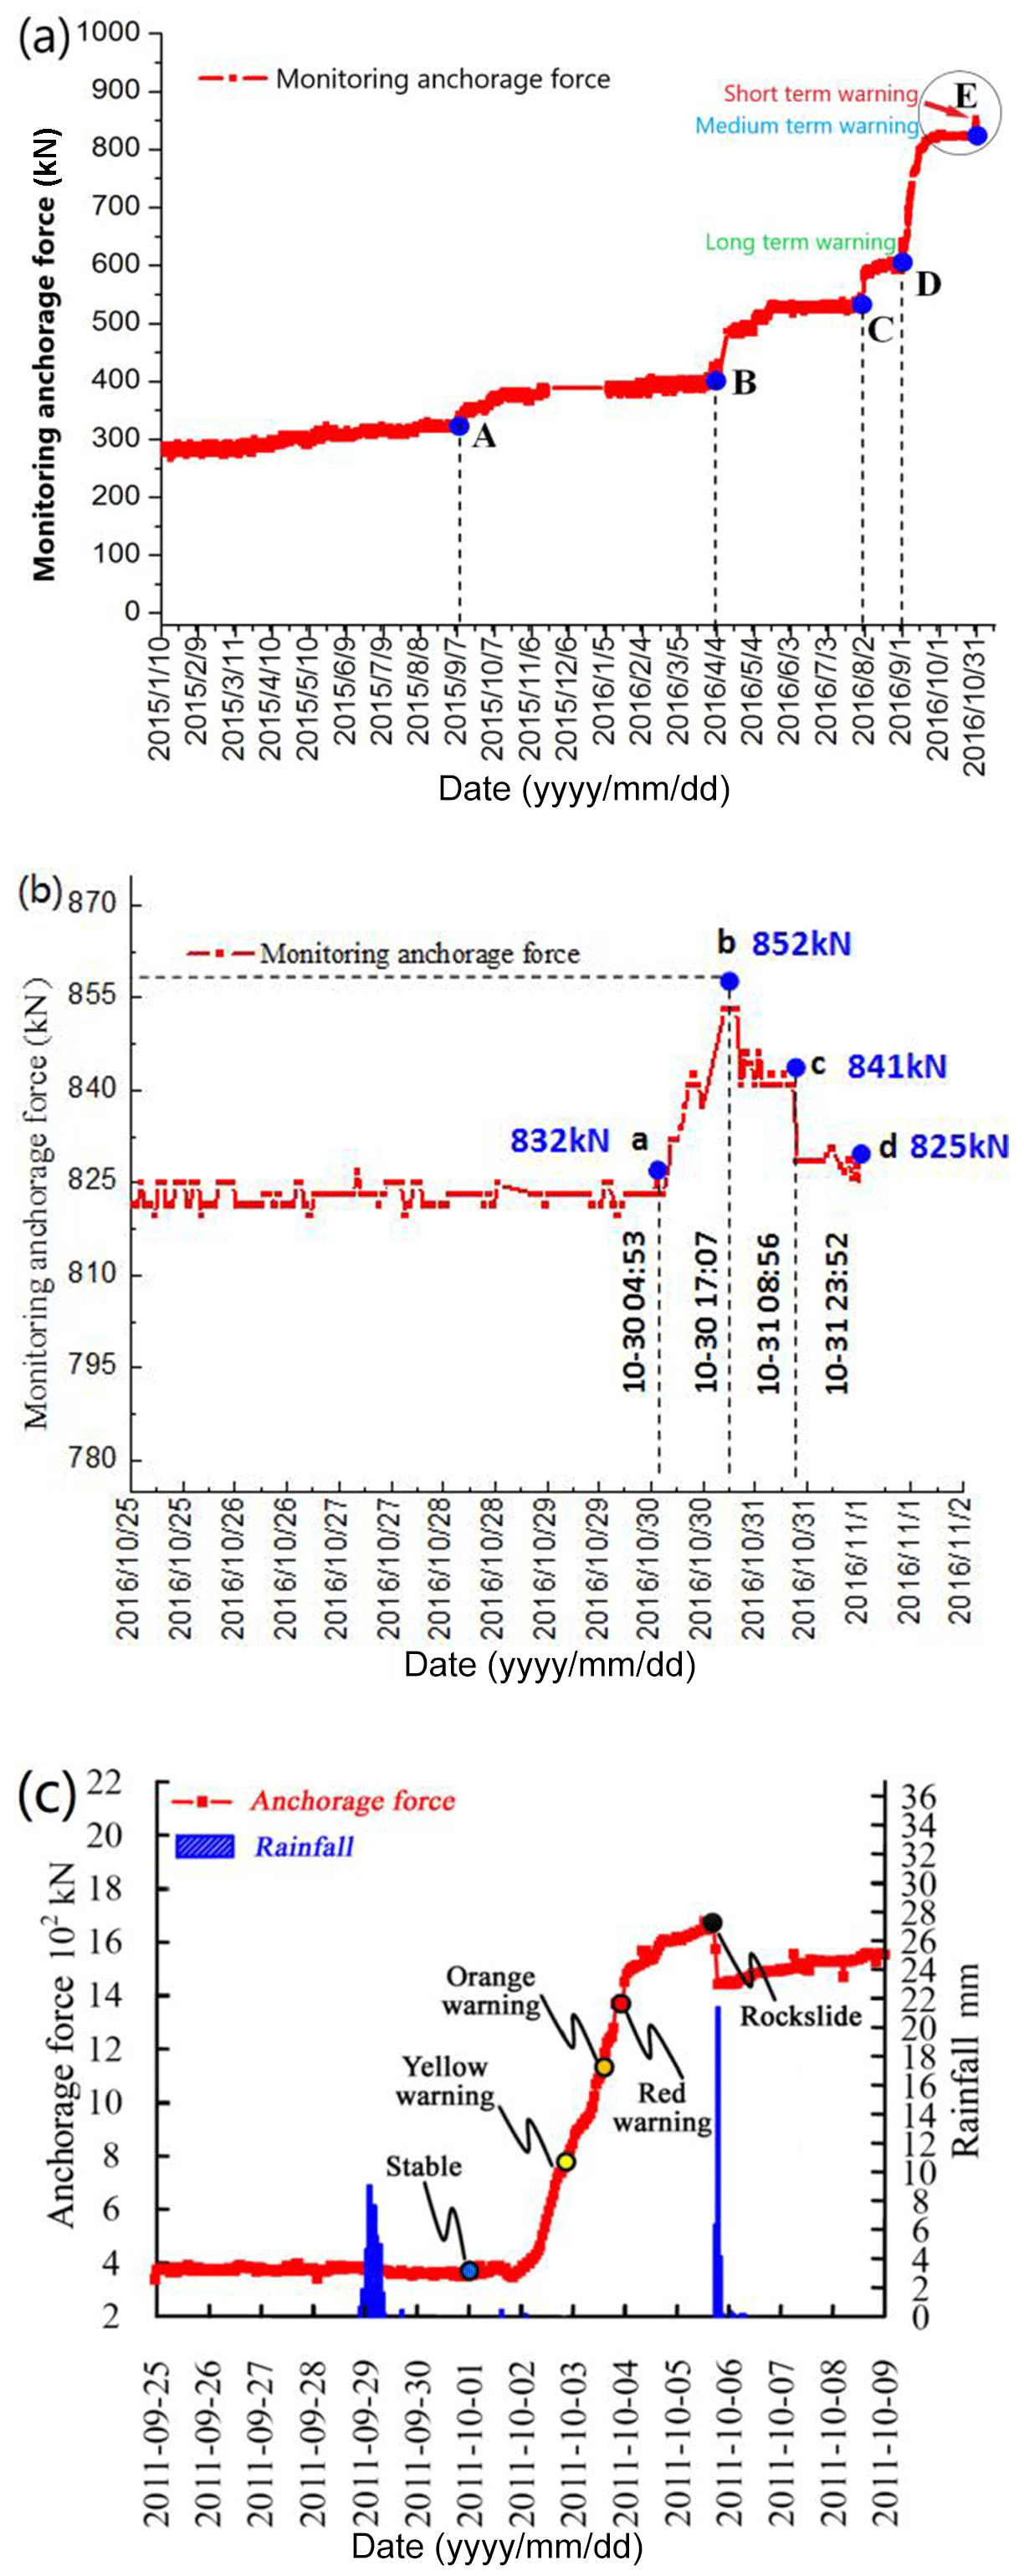
Figure 7Real-time monitoring curve of the anchorage force. (a) Points A–E represent five sudden increases before the rockslide in 2016. (b) Anchorage force during the rockslide in 2016 (partially enlarged from panel a). (c) Monitoring anchorage force during the rockslide in 2011 (Li et al., 2018b).
The prediction of geological disasters is a complex issue, with rainfall, earthquakes, and human activities all presenting potential triggers. Variables such as stress, strain, and water pressure are often used for monitoring purposes; however, for landslides, these variables are not always predictive. Anchorage force monitoring was chosen because it can accurately reflect increasing sliding force and the degradation of the mechanical properties of geomaterials, which in turn result in increased anchorage force and the possibility of slope instability. In some cases, the sliding force is significantly changing during the instability process, but the displacement on the surface of the slope cannot yet be clearly observed (for example, the potential sliding surface is deep). In these cases, the monitoring system based on the anchorage force of the CRLD cable may be a more suitable tool.
Different instability mechanisms complicate the analysis of rockslides, and many issues remain open to discussion. Although the stability of rock slopes hinges on a large number of factors, such as the type and the history of the rock, the size of the slope and so on, the geological discontinuities, which have lower strength and more commonly developed fissures, also play an important role in the mechanical behavior and the stability, especially for the geological-discontinuity-controlled slopes (Regmi et al., 2012; Zhang et al., 2016). Generally, geological discontinuities have higher porosity and function as channel systems for water infiltration (Regmi et al., 2012). The rock slope in the study area is characterized by a major geological discontinuity of highly fragmented two-mica quartz schist. The two-mica quartz schist is highly fragmented, presented as blocks and debris, and filled with mud, and can be considered as granular material.
We used the FEMLIP method to realize the large deformation during the rockslide. By using the FEMLIP method, the simulated materials are discretized by an Eulerian mesh and a series of Lagrangian material points, the control equations are solved, and the solution is obtained in the Eulerian calculation mesh. After interpolation according to corresponding shape functions, the internal variables (stress, strain, water content, etc.) can be obtained for each material point. At each time step, the position of material points is refreshed. In this process, the material points move in line with the deformation of the studied material, but the mesh is not deformed. The relative movement between the material points and the mesh makes the simulation of large deformation possible (Li et al., 2018c).
3.1 Elastoplastic model incorporating complete hydromechanical coupling
In this study, an elastoplastic model, the PLASOL model, was used to describe the elastoplastic behavior with plastic hardening for the major discontinuity, according to experimental data (as shown in Fig. 9). For describing the decrease of strength on the major geological discontinuity due to wetting, a Bishop-type effective stress formulation and modified Van Genuchten water retention curves were introduced into the PLASOL model.
3.1.1 PLASOL model
This nonassociated elastoplastic model was first used for solving structural geology problems within the framework of finite element methods (Barnichon, 1998), and is also appropriate for dealing with a wide range of geomaterials (Lignon et al., 2009; Prime et al., 2013; Prunier et al., 2016; Li et al., 2016, 2018b). A Van Eekelen plasticity criterion (Van Eekelen, 1980), which is similar to the Mohr–Coulomb criterion but avoids geometric singularities, is used as the plastic limit in the model. Let us invoke three effective stress tensor invariants ), where σ′is Bishop's effective stress, calculated as follows:
where σ, ua, and uw are the total stress vector, the isotropic air pressure, and the isotropic water pressure, respectively; χ is Bishop's parameter taken as a scalar in this model; and , is the suction value. For the sake of simplification, Bishop's proposition (Bishop, 1959) was used to formulate parameter χ in this study:
Considering Bishop's effective stress, the expression of the Van Eekelen yield criterion can be written as follows:
where c is cohesion, φc is the mobilized friction angle under triaxial compression conditions, and m is a coefficient defined as follows:
The Lode angle β is given by , and parameters a and b are functions of the friction angles φc (compression path) and φe (extension path), as defined by
where parameters rc and re are the reduced radii for triaxial compression and extension tests, respectively, and are calculated as follows:
The exponent n controls the shape of the yield surface, and the default value is −0.299 according to the work of Van Eekelen (1980).
In the PLASOL constitutive model, the plastic hardening of the yield surface during loading is controlled by internal variables (the cohesion values and friction angles), which are functions of the Von Mises equivalent plastic strain: , . Consequently, the compression, extension friction angles, and cohesion formulated in Eq. (7) vary between elastic initial values (c0, φe0, φc0) and plastic limit values (), depending on the equivalent plastic strain and the hardening parameters Bc and Bp (Lignon et al., 2009; Prunier et al., 2009).
Furthermore, the dilatation angle ψ is required to define the nonassociated plastic law (Prunier et al., 2009; Li et al., 2016). In total, 13 parameters are required to adequately describe the elastoplastic behavior of geomaterials: E and v are Young's modulus and Poisson's coefficient, respectively; φc0 and φcf are the mobilized friction angles at elastic and plastic limits under triaxial compression, respectively; φe0 and φef are the mobilized friction angles at elastic and plastic limits under triaxial extension, respectively; ψc and ψe are the dilatation angles under triaxial compression and extension, respectively; c0 and cf are the cohesion at elastic and plastic limits, respectively; Bc and Bp are the hardening parameters; and n is the exponent controlling yield surface shape.
3.1.2 Water retention curves
In order to determine Bishop's parameter χ from the degree of saturation, it is necessary to determine the relationship between suction and the degree of saturation. A large number of water retention models have been proposed (Van Genuchten, 1980; Parlange, 1980; James et al., 1998; Feng and Fredlund, 1999), and the modified Van Genuchten model (Van Genuchten, 1980; James et al., 1998) was selected to complete the hydromechanical coupling in this study because the boundary curves are simple and commonly used. The formulation of this model is as follows:
where the index v stands for d or w in the drying or wetting processes, respectively; Srres, Srsat, and Srv are the residual, saturated, and current degrees of saturation, respectively; and av and nv are two parameters depending on porosity, whose expressions can be found in Arairo et al. (2013).
3.1.3 Second-order work criterion
In this study, instead of classical plasticity criteria, the second-order work criterion was used, and the sign of the second-order work indicated local and global failures.
As the lower border of the bifurcation domain and the most conservative failure criterion, the second-order work criterion has been systematically investigated for evaluating the stability and failure of geomaterials (soils and jointed rocks) (Darve and Servant, 2004; Darve et al., 2004; Laouafa et al., 2011; Duriez et al., 2011; Nicot and Darve, 2011). The local second-order work and its normalized form are written as follows:
where d2wnorm is the normalized local second-order work at material point i, and and ∥dεi∥ are the norms of the stress increment and the strain increment of the material point i, respectively. Hence, d2wnorm is equal to the cosine of the angle α between the incremental stress and strain vectors, and its value is thus limited between −1 and 1. If d2wnorm>0 for all loading directions, the material is strictly stable; if d2wnorm<0 at least in one loading direction, the material is considered potentially unstable; and if d2wnorm<0 in the current loading direction, the material is unstable, and diffuse or localized failures can occur. In order to save computational time in the simulation, the local second-order work (see Eq. 9) was only calculated for the current loading direction.
In order to analyze the global instability for the boundary value problems, an appropriate expression of normalized global second-order work is needed. According to the integral expression of d2w (Hill, 1958), , with V the volume of interest and dQ and dF the global nodal incremental displacement and force, respectively, the normalized global second-order work was firstly proposed as follows (Khoa et al., 2006):
where ωi is the numerical weight of the material point i and Ji is the determinant of the Jacobian matrix. This expression is convenient to compute, but it is mesh-dependent (Prunier et al., 2009). Recently, a new expression, independent of the number of elements, has been proposed as follows (Prunier et al., 2016):
Evidently, both the numerators in Eqs. (10) and (11) are identical, but the denominator in Eq. (10) is larger with finer mesh, and that in Eq. (11) is mesh-independent. Note that Eq. (11) needs the use of a sufficiently open numerical code, in order to manipulate basic integration operators over the elements or to obtain access to shape functions and mesh description.
3.2 Numerical analysis of the Nanfen rockslide
3.2.1 Geometry and boundary conditions of the rockslide model
Geological data from the field survey and engineering geology drilling showed that the sliding surface was principally along the major geological discontinuity (i.e., along strongly fragmented two-mica quartz schist). The FEMLIP model of the rock slope was established in a calculation domain, in which the horizontal and vertical dimensions were 120 and 80 m, respectively. The calculation domain was discretized by 1920 meshes, and each mesh consisted of 25 material points. The slope was composed of three materials (Fig. 8): chlorite–hornblende stable bedrock, chlorite schist slide bodies, and a two-mica quartz schist as the major geological discontinuity. The model dimensions were as follows: height 72 m; width 110 m; and bedrock height and width 64 and 60 m, respectively. The widths of the seven benches were 5, 5, 10, 5, 5, 5, and 30 m, respectively.
In this model, all boundaries were free slip, and the horizontal displacement at the left boundary and the vertical displacement at the bottom boundary were constrained. Gravity increased linearly for the first 150 time steps, until a value of 9.81 m s−2 was reached. For the sake of simplification, the initial suction in the major geological discontinuity was assumed to be homogeneously distributed. Moreover, an excavation on the toe of the slope was performed at the 38th hour, and rainfall on the top surface induced downward water infiltration under a constant water flux of 24 mm h−1 over 21 h.
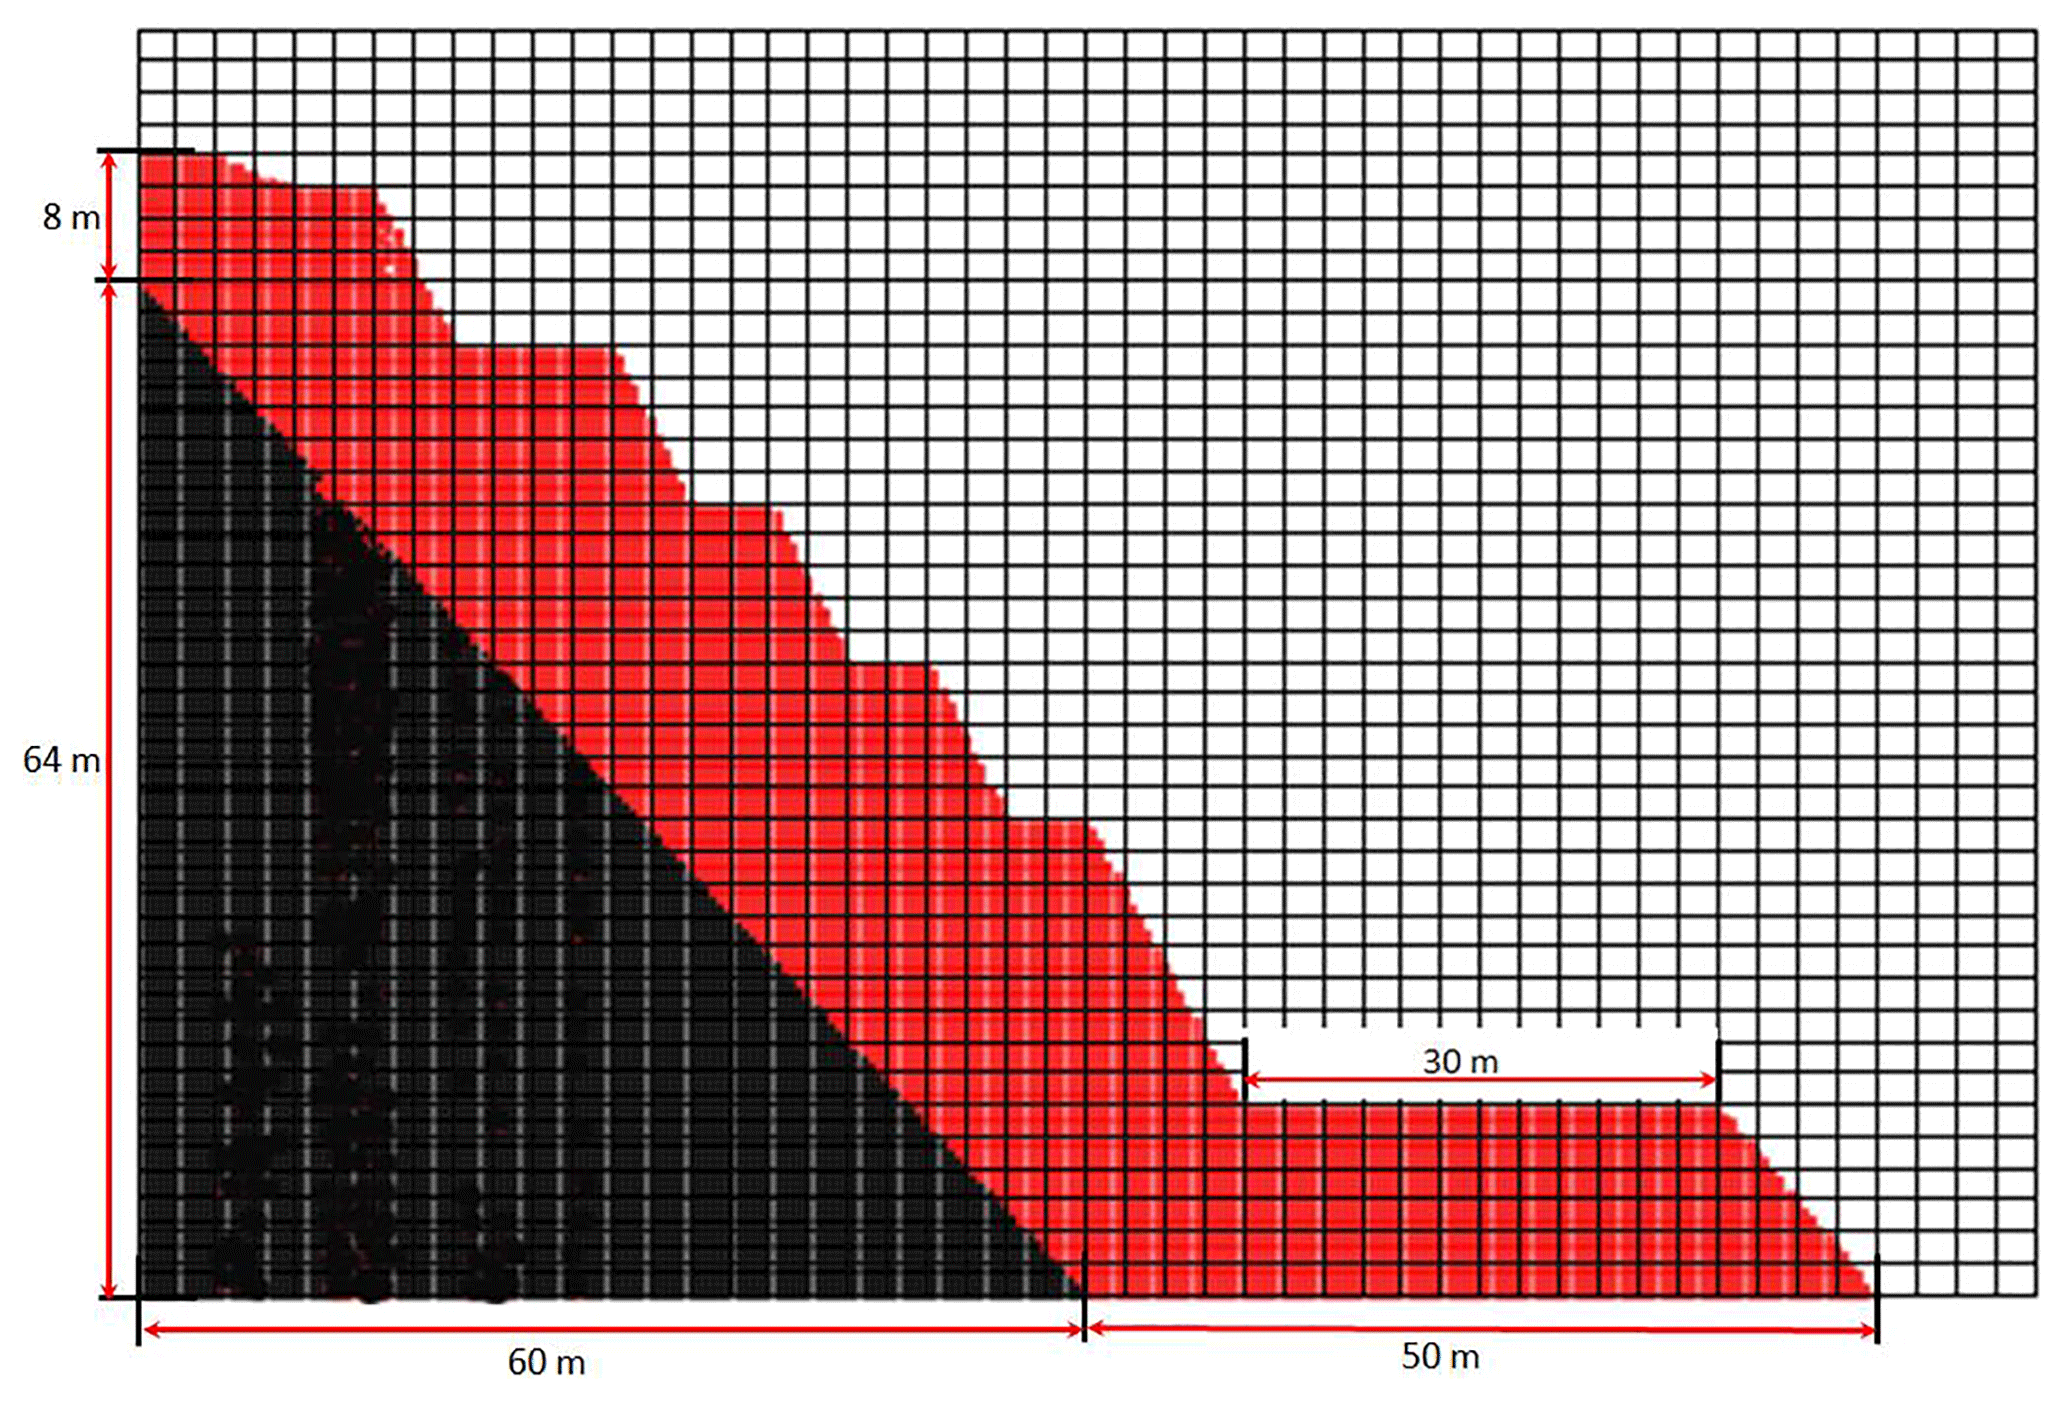
Figure 8Geometry of the rock slope FEMLIP model. Stable bedrock (black layer) is chlorite–hornblende. The slide body (red) comprises chlorite schist. The interface between the black and red layers comprises a two-mica quartz schist functioning as the major geological discontinuity.
3.2.2 Determination of physical parameters
In the model, all three materials were described by an elastoplastic constitutive law, and the hydromechanical coupling was only taken into account for the chlorite schist and the highly fragmented two-mica quartz schist. The geomechanical parameters were estimated according to the triaxial compression tests and geological survey. Sample of two mica-quartz schist for the triaxial compression tests are shown in Fig. 9a. Figure 9b and c give typical stress–strain curves under a confining stress of 20 MPa, for the sample with a degree of saturation of 43 % and the one in a saturated state, respectively. The values of c0 and cf could thus be estimated. It was necessary to reduce the strengths obtained from the experimental data because the weak zone emerged after the rockslide presented a high discontinuity density. According to the empirical strength reduction method, the cohesion values used in the paper were reduced by the following equation: , where c and ci are reduced cohesion and that of an intact rock sample, respectively; n is the discontinuity density, which was assigned to be 30; and k is a coefficient related to the fragmentation index with a value of 40. Considering the empirical strength reduction method and the values recommended by in situ tests (Sun et al., 2011; Yang et al., 2012; Li et al., 2018b), the elastoplastic parameters are summarized in Table 1.

Figure 9Triaxial compression tests for determining the geomechanical parameters of the two mica-quartz schist. (a) Samples for the experimental tests. Typical stress–strain relations under a confining stress of 20 MPa are shown for (b) the samples with a degree of saturation of 43 % and (c) the samples in a saturated state, respectively.
The degree of saturation of the two-mica quartz schist before rainfall was 43 %. The permeability of the two-mica quartz schist was cm s−1 and that of the chlorite schist was cm s−1, according to a top surface aperture of 1 mm and a slope surface aperture of less than 0.025 mm; consequently, the permeabilities were considered strong and very weak, respectively (GB50487-2008). It should be noted that decreasing strength of rocks under rainfall conditions is generally due to the saturation effect in the unsaturated stage and the softening effect in the saturated stage. The latter is generally a long-duration process, and is not the objective of this study. The former results in an increasing degree of saturation and a decreasing suction; thus, the apparent cohesion and strength are reduced according to Eq. (12):
where c′ is the effective cohesion measured from the sample on the top surface after rainfall, and is the apparent cohesion measured from the sample before the rockslide. With the assumption of χ= Sr, the suction after rainfall could be considered 0, and the initial suction before rainfall could be obtained by the following expression: kPa. The initial suction was thus 105 kPa.
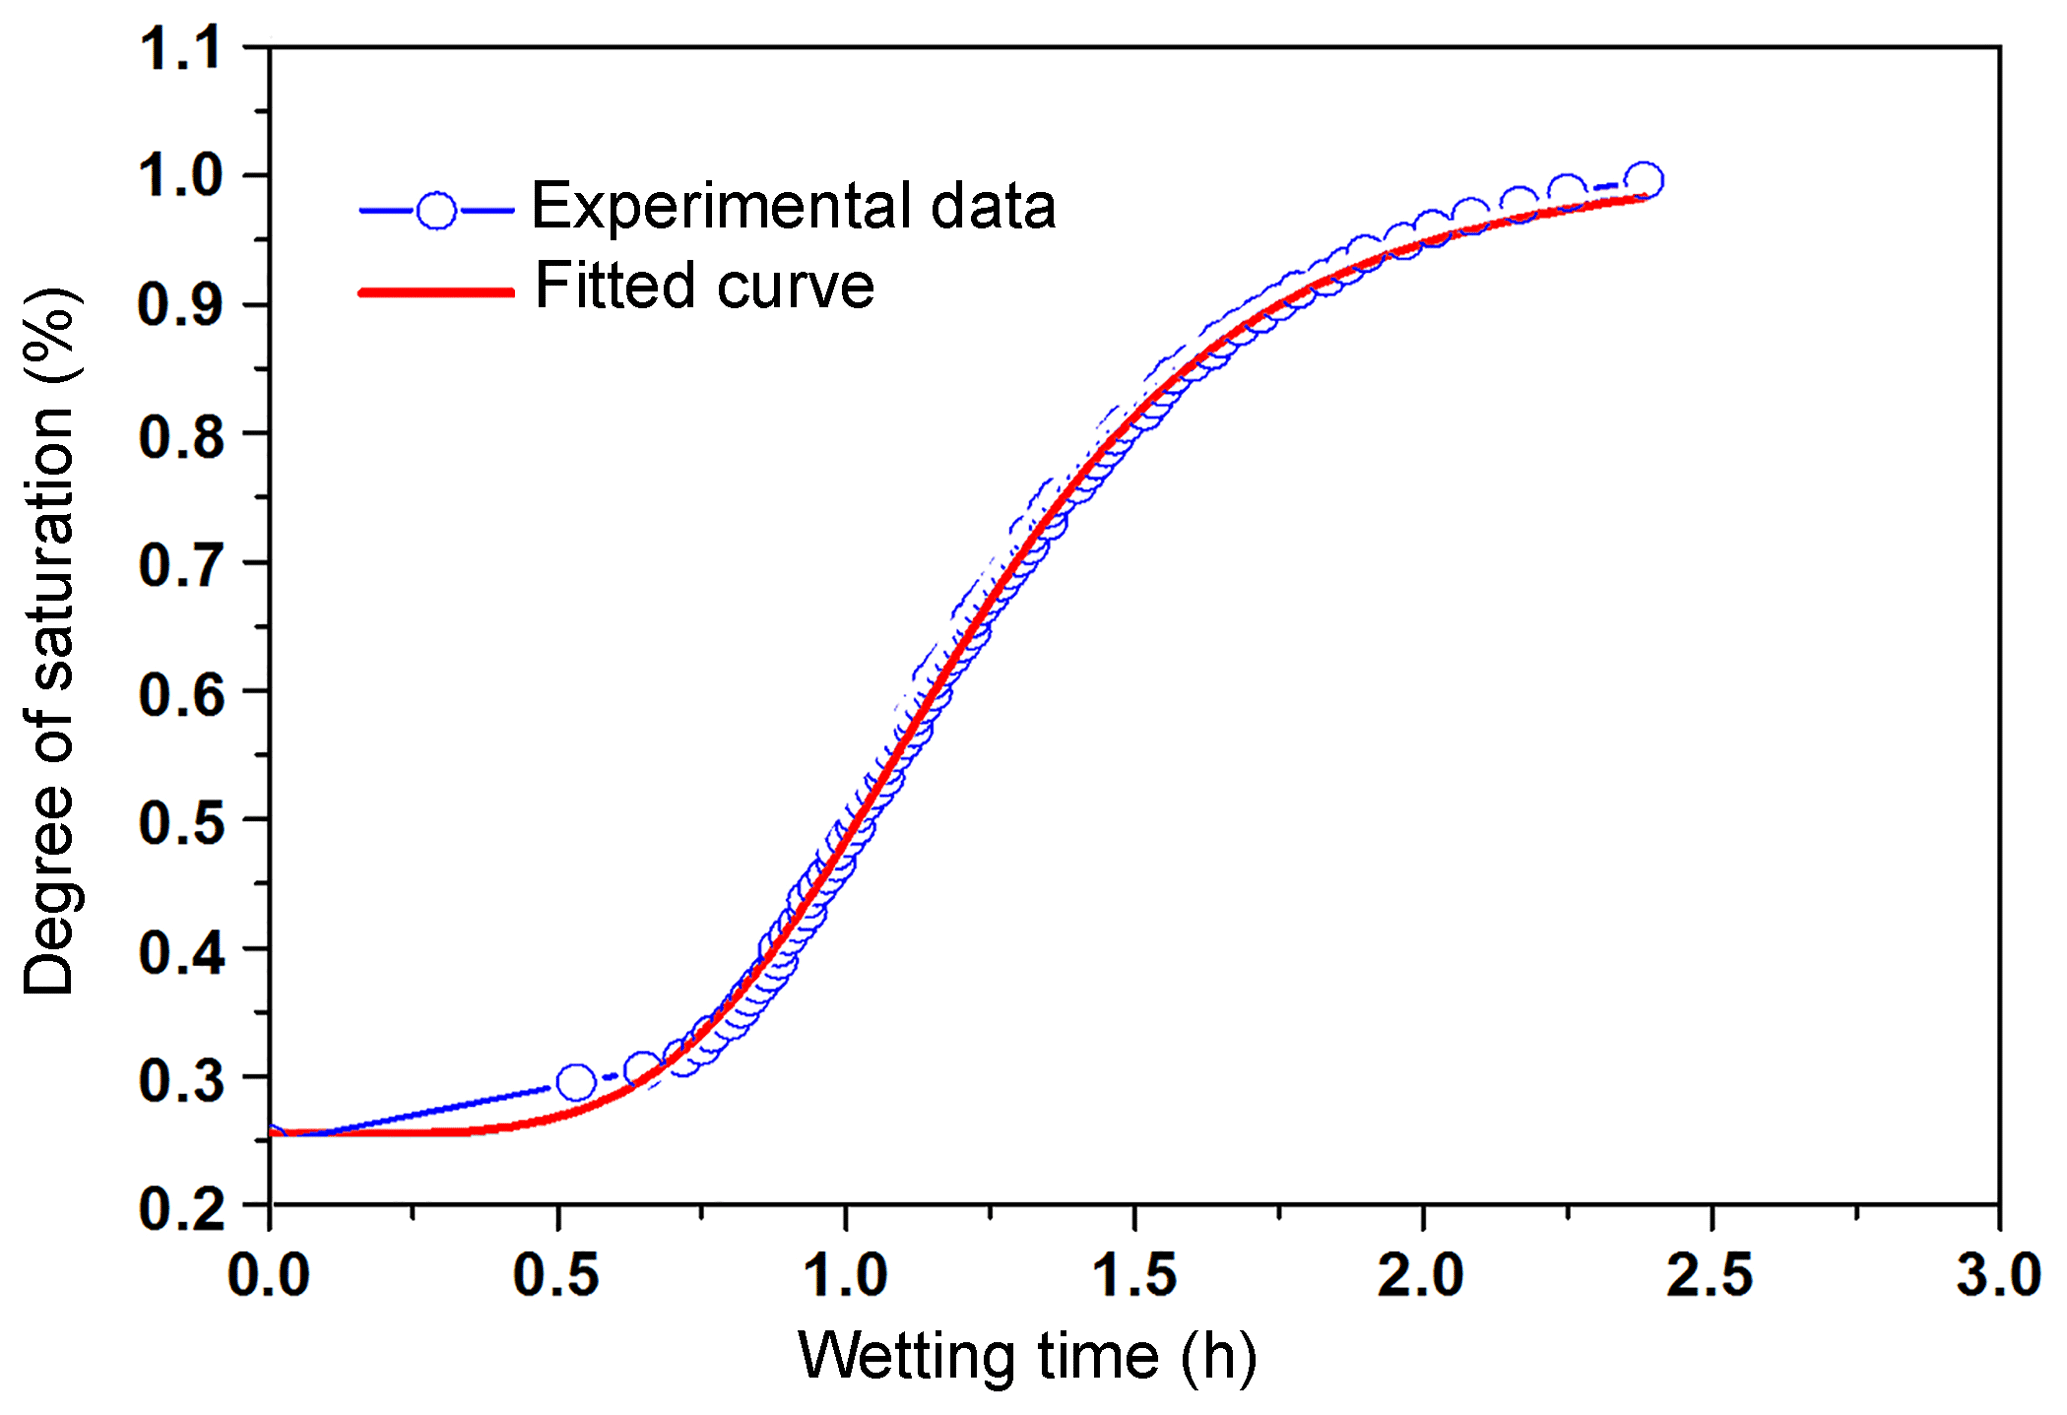
According to the wetting test (Fig. 10), Srsat=1 and Srres=0.27. The hydraulic parameters could be simplified as ad=aw and nd=nw because the water infiltration could be simplified as a monotonous wetting process. With the initial and final degree of saturation and the suction, the parameters could be back-calculated (Table 2).
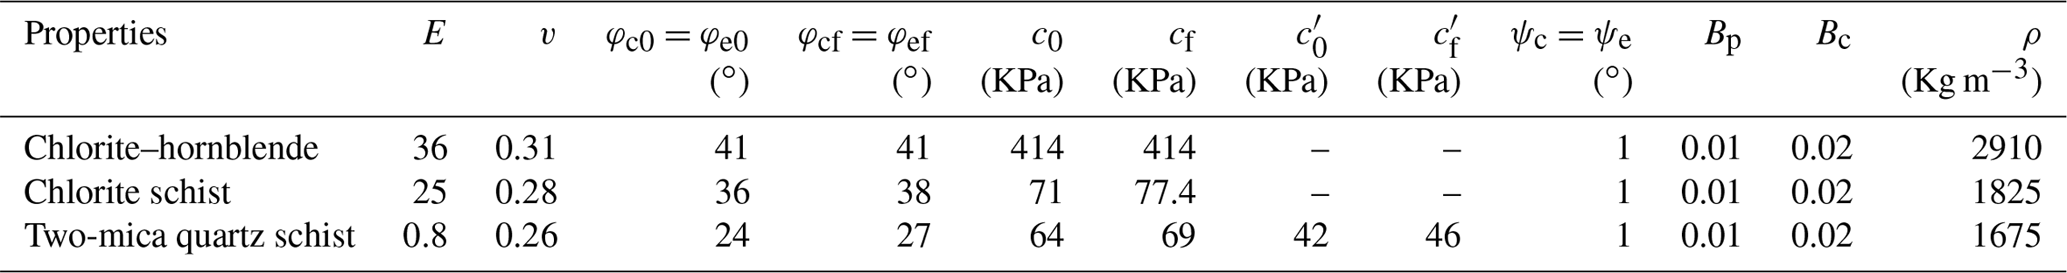
Table 2Hydraulic parameters of two-mica quartz schist and chlorite schist.

3.2.3 Results and analysis
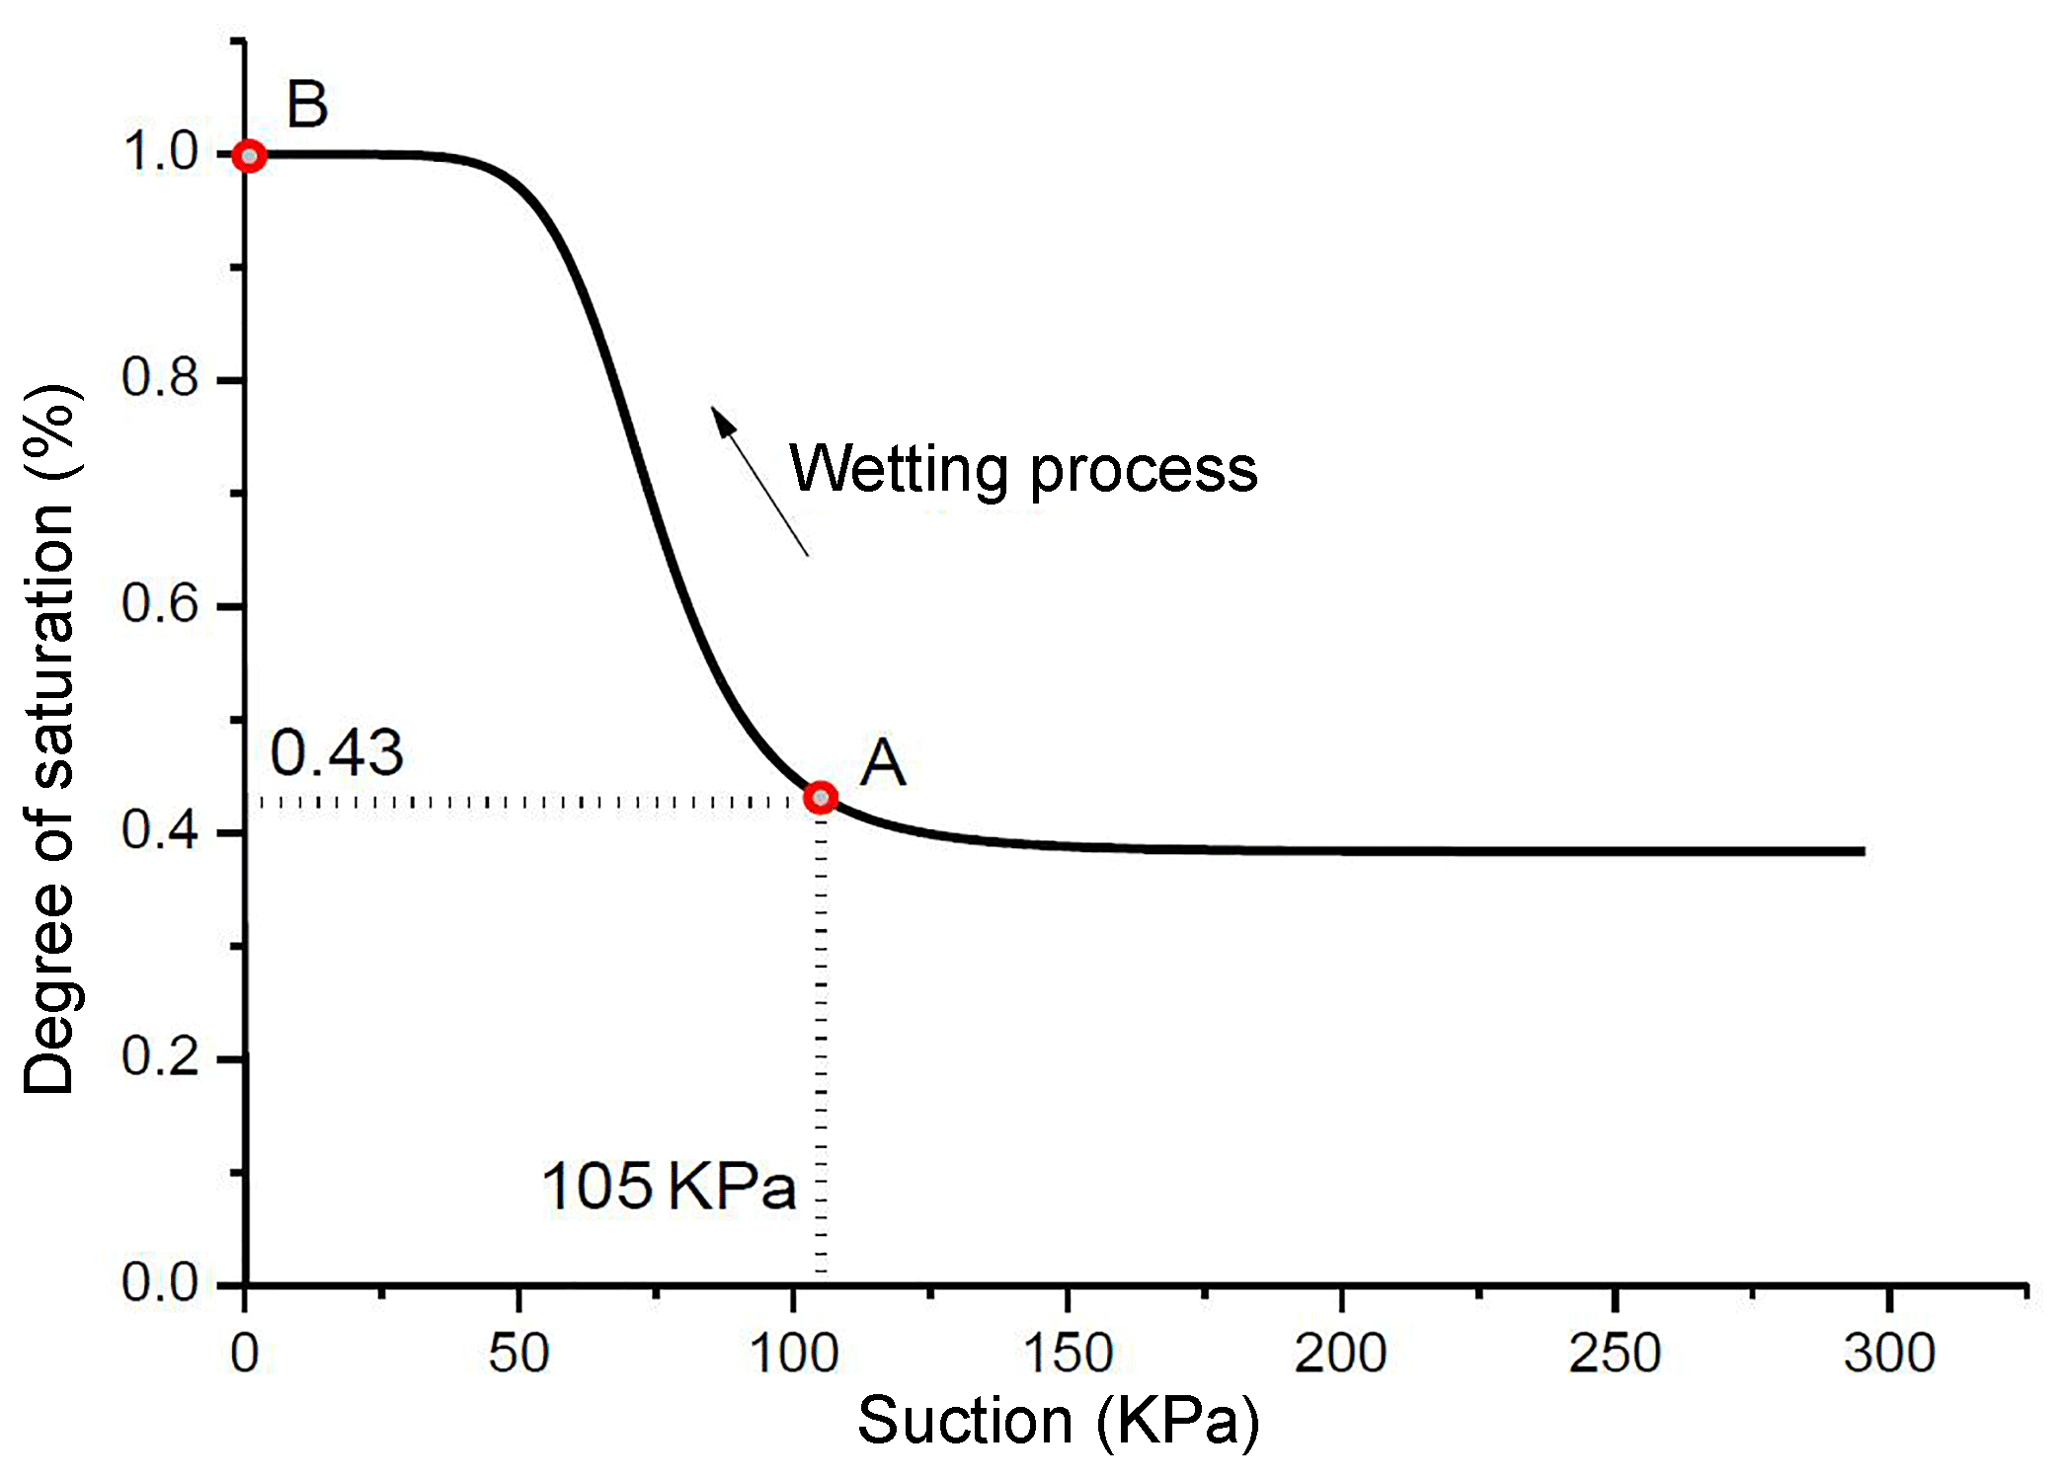
Figure 11Relationship between suction and the degree of saturation during the monotonous wetting process. The segment from point A to point B shows the two mica-quartz schist.
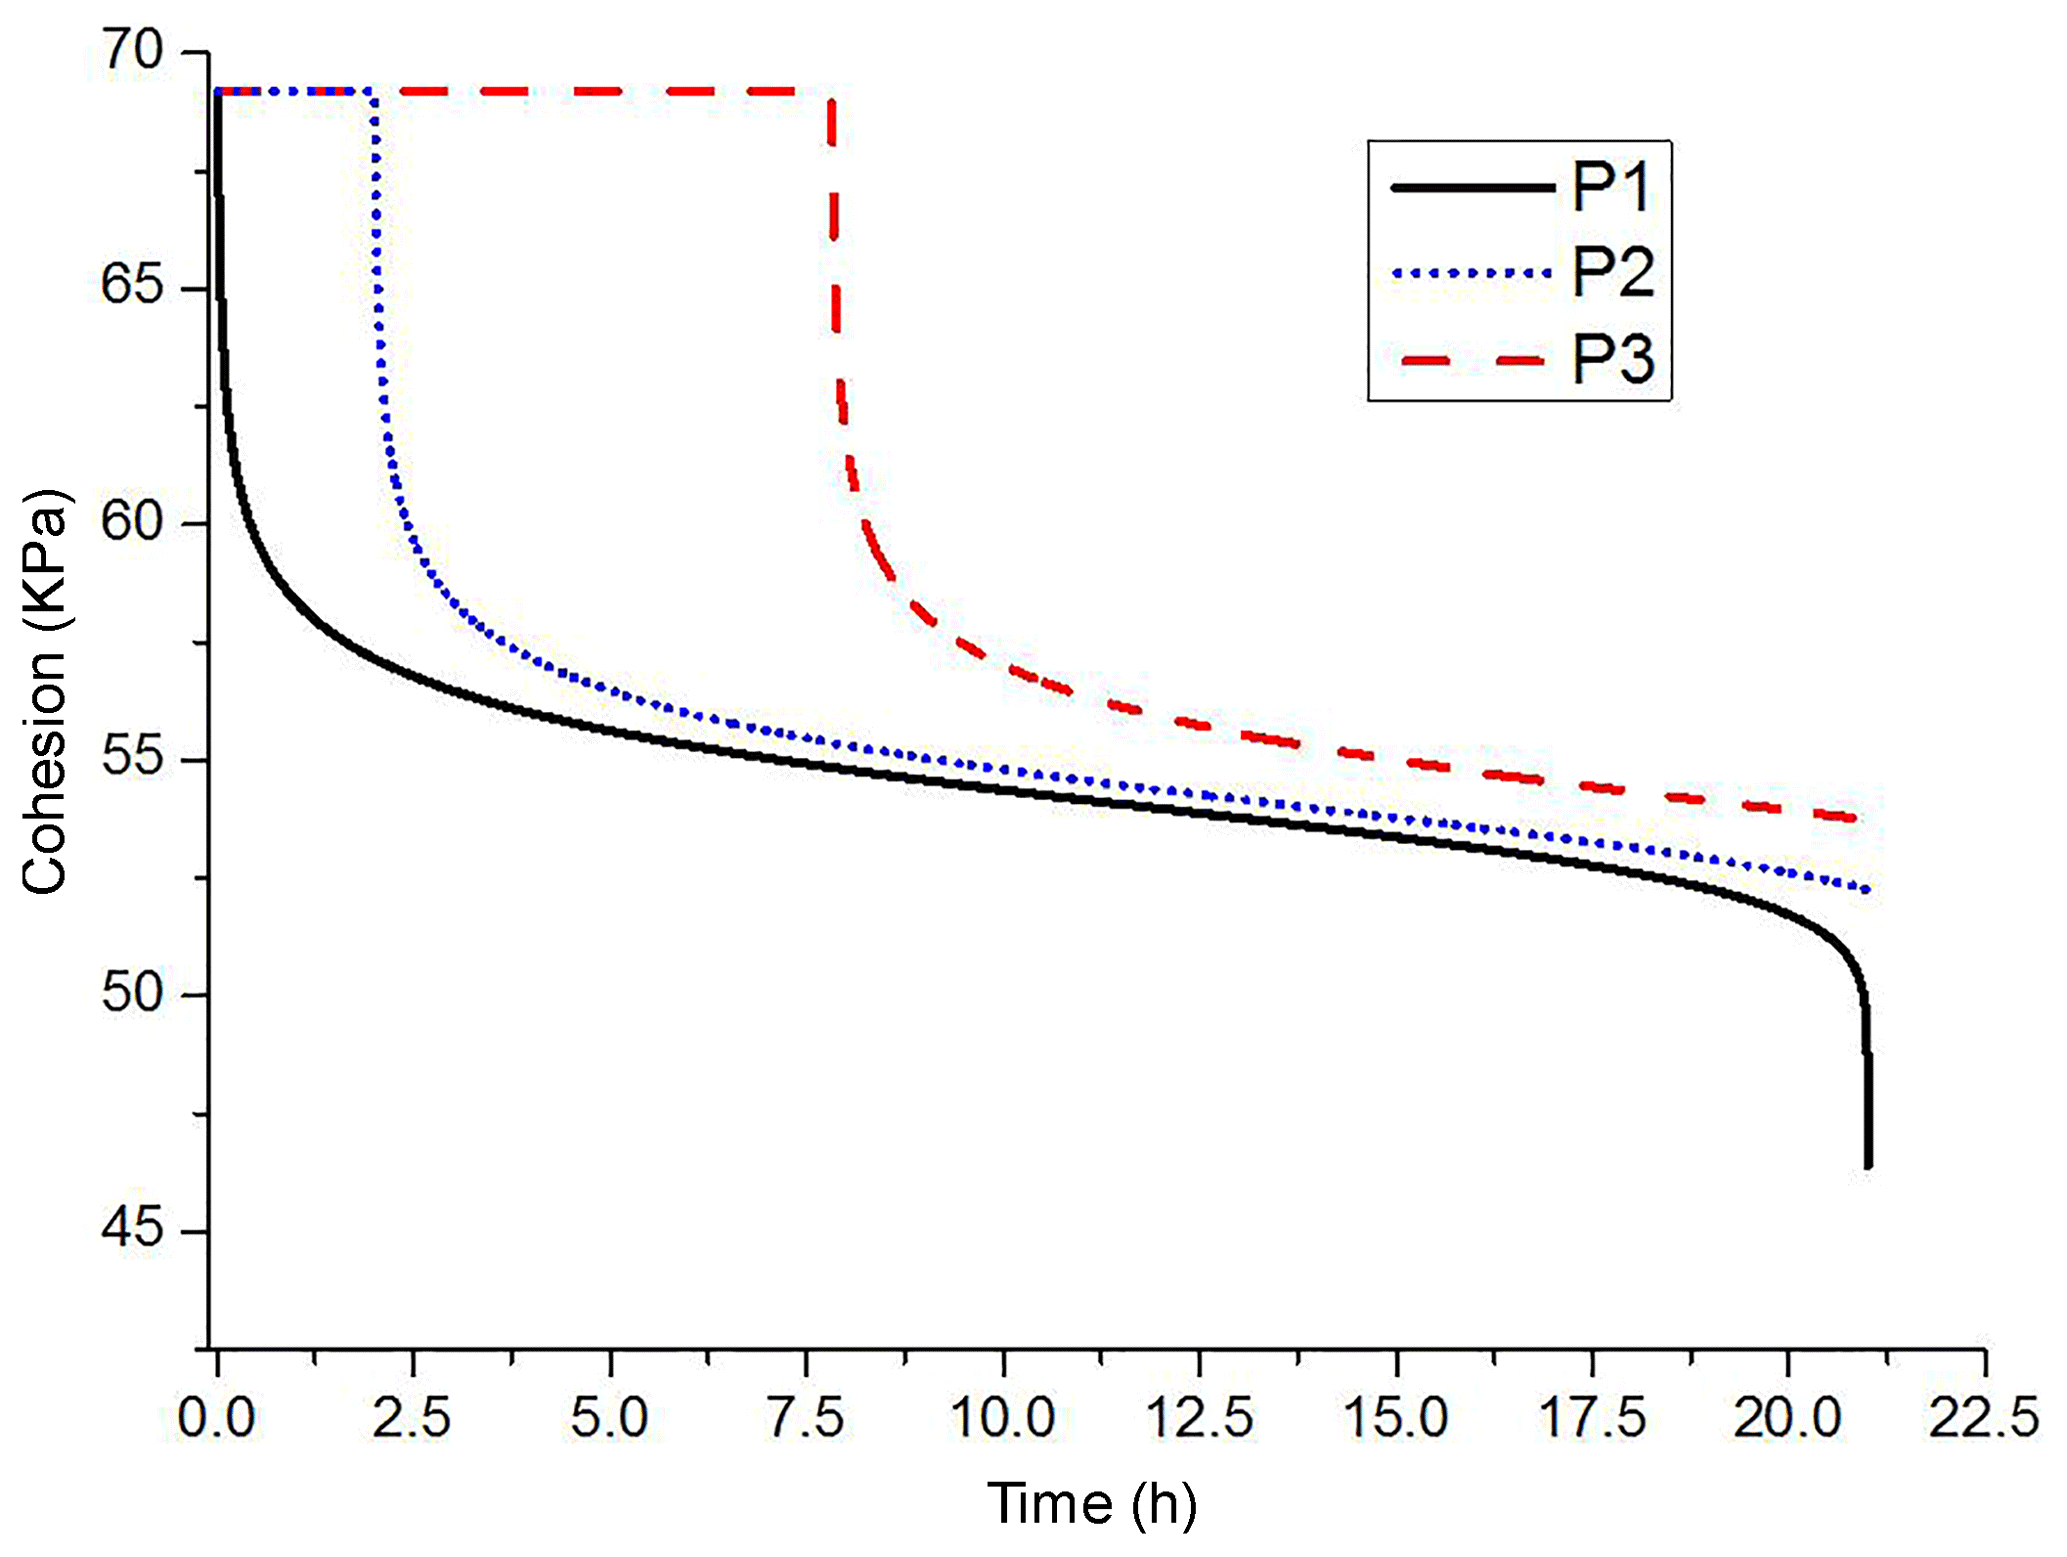
Figure 11 shows the suction-degree of saturation curve for the monotonous wetting process. The segment from point A to point B corresponds to the two mica-quartz schist. At point A, the suction was 105 kPa, corresponding to a degree of saturation of 43 %. At point B, the suction was 0, corresponding to a degree of saturation of 100 %. For a detailed comparison of apparent cohesion and second-order work at different positions along the slope, three material points, P1, P2, and P3, were selected on the top surface, the middle of the slope, and the toe of the slope, respectively (Fig. 13a). The decrease of apparent cohesion was induced by the decrease in suction, according to Eq. (12). Clearly, the material at point P1 underwent an immediate decrease of apparent cohesion from 69 to 46 kPa, and points P2 and P3 showed a delay in strength reduction (Fig. 12) because of infiltration at different altitudes; therefore, the homogeneous initial suction began to decrease at different times.
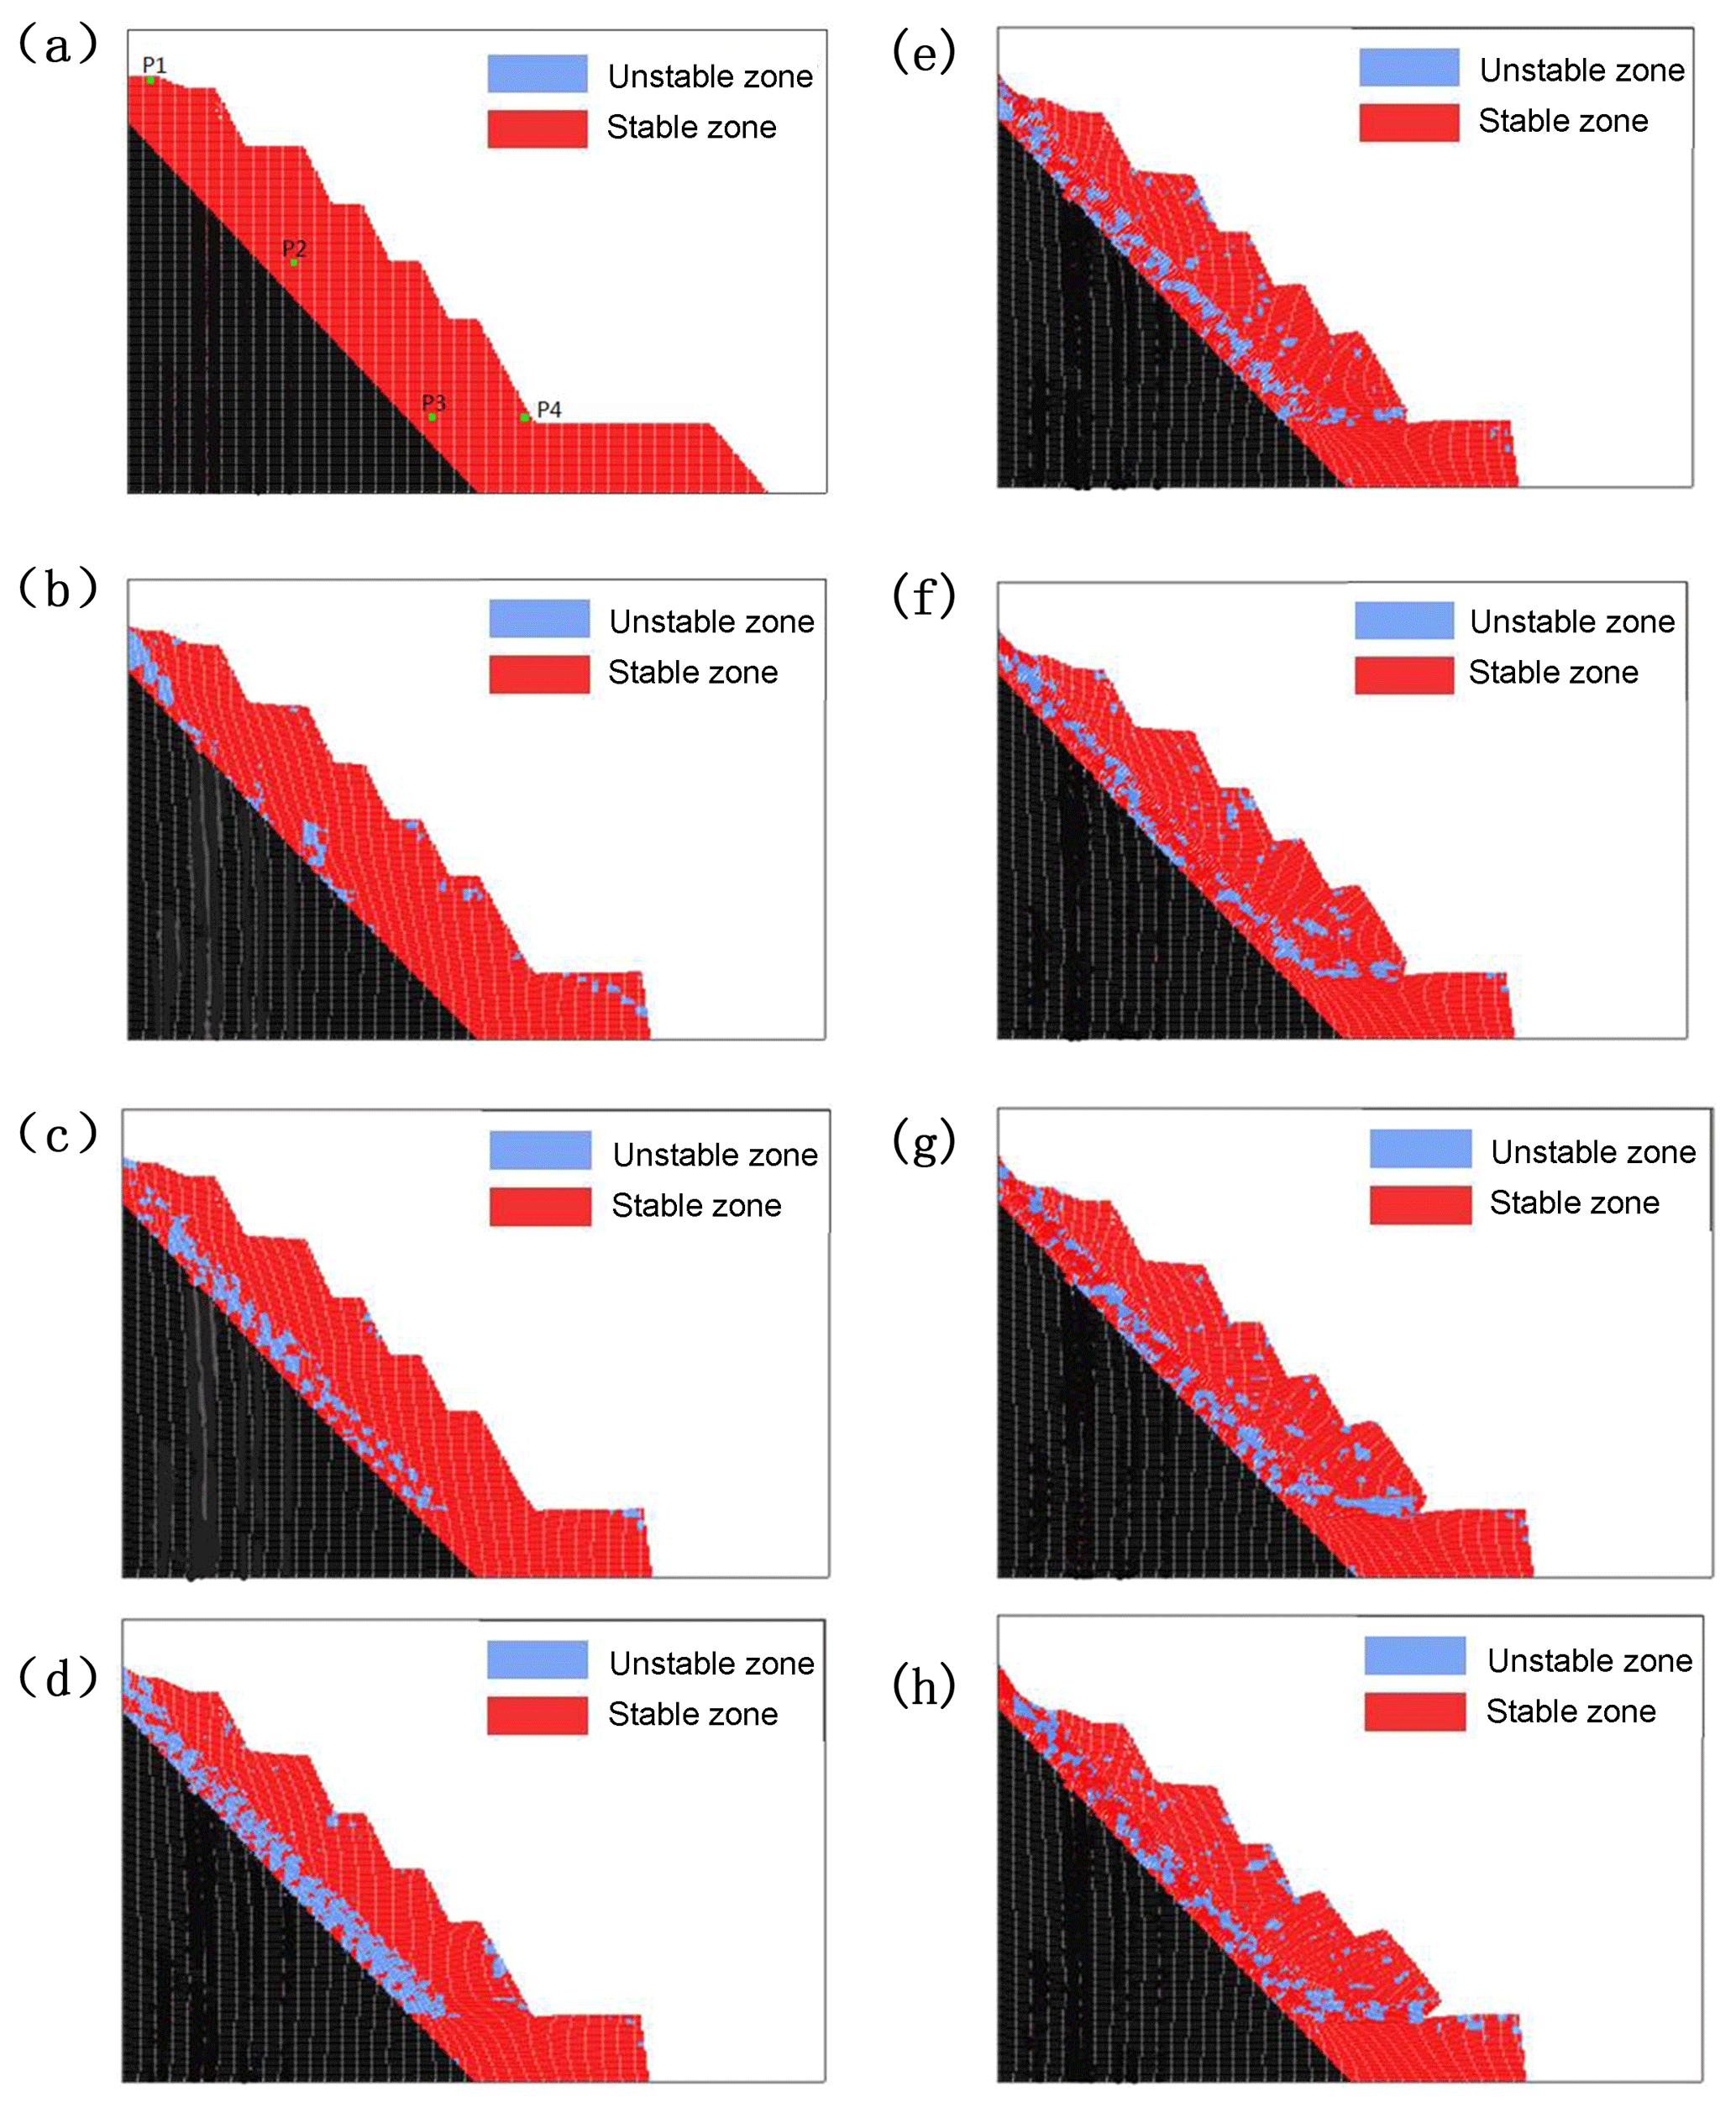
Figure 13Stable zones (red) and the development of unstable zones (blue) during the consistent evolution of the rockslide. (a) Initial configuration after gravity initialization. (b) Unstable zones after excavation. (c) Water infiltration after 12 h. (d) Water infiltration after 25 h: D2Wnorm=0. (e) Slip configuration after 1 s. (f) Slip configuration after 3 s. (g) Slip configuration after 5 s. (h) Slip configuration after 7 s.
Figure 13 shows the development of unstable zones under excavation and water infiltration conditions, and the entire rockslide process at various elapsed times. The unstable zones correlate to the negative local second-order work calculated by Eq. (9a). Unstable zones first concentrate at material points on the top and toe of the slope because of excavation at the toe (Fig. 13b). Compared with Fig. 15, d2wnorm at points P1 and P2 indicates a slight decrease, and point P3 shows a more significant decrease at 38 h, when excavation on the toe was performed. However, this change did not induce any clear instability, and all three material points remained stable. During the subsequent 46 h after excavation, values of d2wnorm remained positive and constant, and that of point P3 progressively increased. When water infiltration occurred on the top surface, the d2wnorm of points P1, P2, and P3 started to decrease quickly, and became zero at 92.8, 102, and 109 h, respectively, according to Fig. 15, which signifies failures at these points. Figure 13c and d also show that unstable zones developed quickly along the major geological discontinuity under infiltration conditions, but few unstable zones appeared in the upper slide bodies because of the very low permeability ( cm s−1).
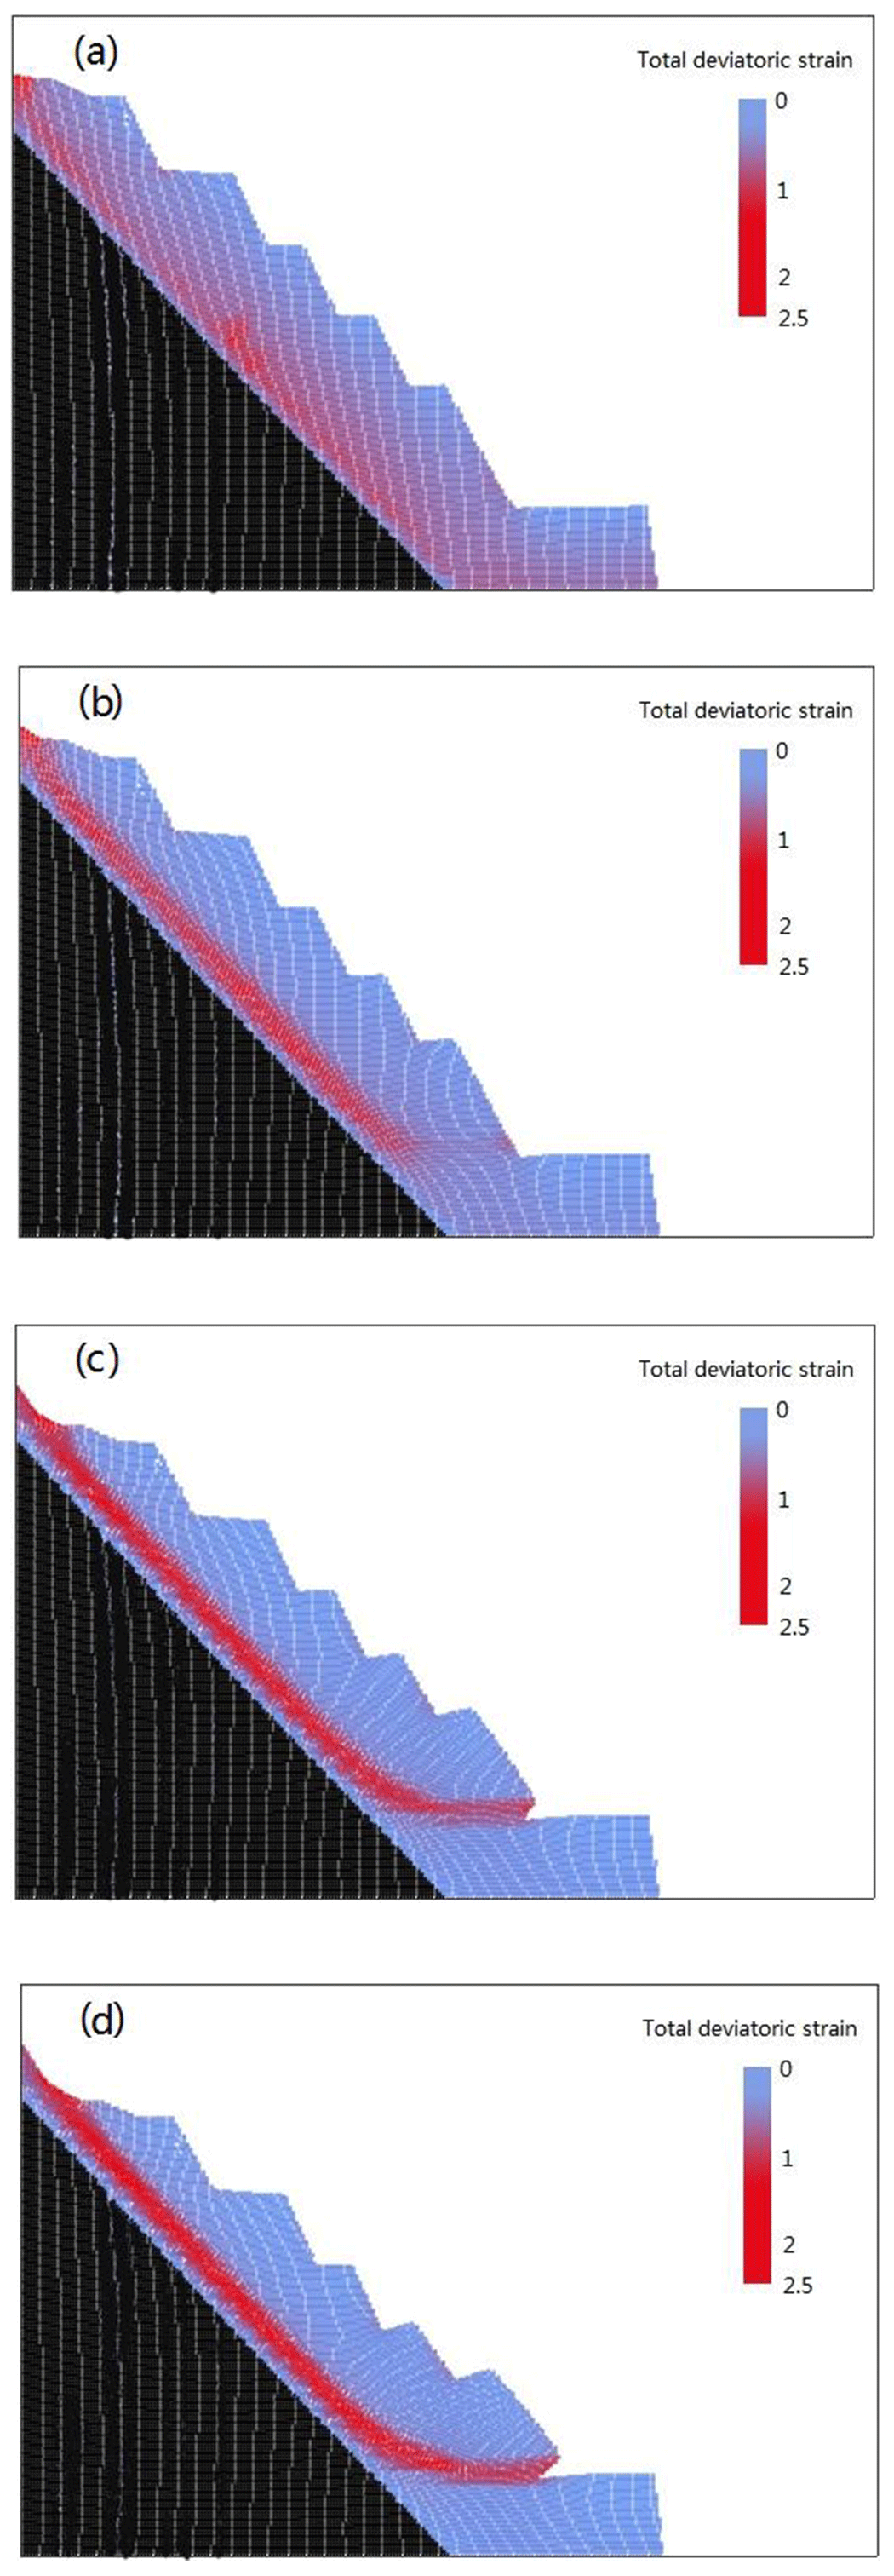
Figure 14Evolution of the shear strain band: (a) after excavation; (b) global failure, D2Wnorm=0; (c) slip configuration after 5 s; and (d) slip configuration after 7 s.
After failure, the simulated rockslide involved continuous, large deformation (Fig. 13e–h). The shear strain band developed first along the major discontinuity, and then a horizontal band appeared between that and the toe of the slope (Fig. 14). The shear strain band became well developed and failure occurred. Clearly, the rockslide developed owing to large deformation along the major discontinuity and at the toe of the slope. Most zones of the upper chlorite schist remained stable during the elastic stage, and then slipped as one mass along the two-mica quartz schist weak zone. The simulation results were therefore consistent with the real case.
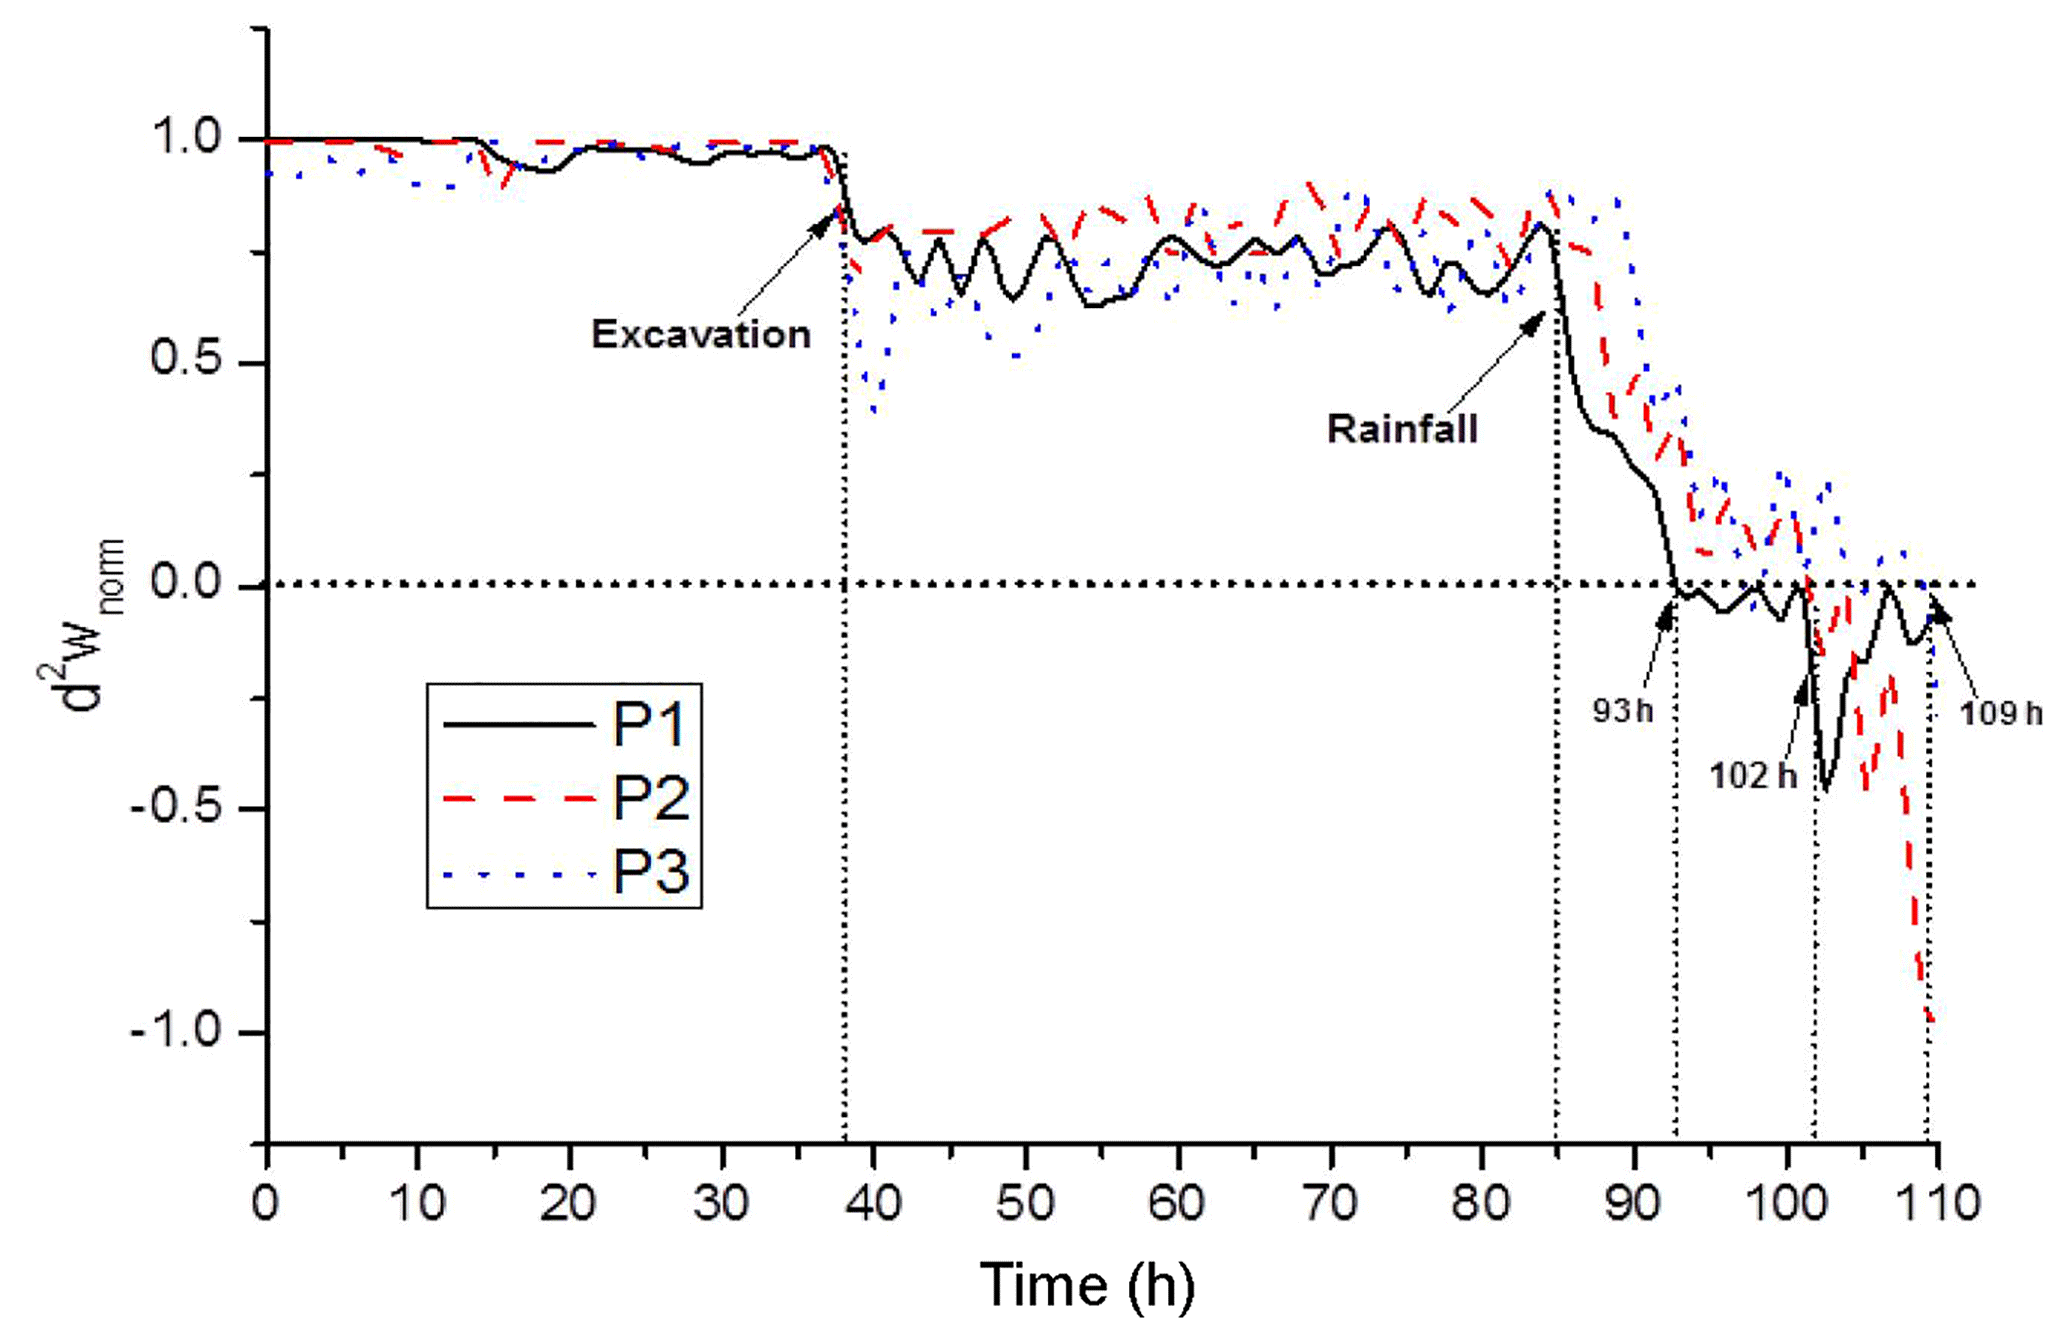
Figure 16 illustrates the evolution of the normalized global second-order work calculated according to Eqs. (10) and (11), respectively, and compares them with that of the monitored anchorage force. The excavation at 37 h caused a slight decrease in D2Wnorm, correlated with the trend in d2wnorm. However, mining activity on the toe of the slope did not influence the stability of the slope significantly, and the curve of anchorage force only showed a slight fluctuation before returning quickly to its previous value. The second significant decrease of D2Wnorm was caused by water infiltration at 84–105 h. During the rainfall, D2Wnorm decreased quickly with failure along the major discontinuity, and became zero at 109 h, after 4 h of rainfall. At the same time, the anchorage force reached a peak of 852 kN because the decreasing apparent cohesion was not sufficient to resist the increasing sliding force. The anchorage force then decreased to 841 kN, corresponding to a local slide between the benches at 502 and 490 m elevation. Subsequently, the anchorage force showed a second decrease, to a value of 825 kN, at the point of global failure and the rockslide event. The trend of D2Wnorm mainly correlates to that of the monitoring data, and both prove that the 31 October 2016 rockslide was induced by rainfall. Regarding the comparison between the two global second-order work equations, both of them presented two sudden decreases during excavation and the occurrence of rainfall, and both of them vanished at 109 h. It was evident that their evolution was mainly similar because the numerators in Eqs. (10) and (11) were identical. However, the value of the former decreased with the finer mesh and that of the latter varied between 1 and 0 in any case, and presented less fluctuation. The normalized global second-order work computed by Eq. (11) can theoretically be used as a safety factor for analyzing the global stability of a boundary value problem.
In this study, we considered a recent rockslide in the Nanfen open-pit iron ore mine that was successfully predicted using the real-time monitoring system. The core of the monitoring system was the CRLD cable, whose properties, the constant resistance and large deformation, made the disaster prediction possible, during the occurrence of landslides. The CRLD cable can monitor and reflect increasing sliding force and the degradation of the mechanical properties of geomaterials in deep strata, despite the triggering factors, and the successful predictions of the excavation-induced rockslide in 2011 and the rainfall-induced rockslide in 2016 are good evidence for this. This monitoring system has exhibited its reliability and generality, and further generalization is thus expected.
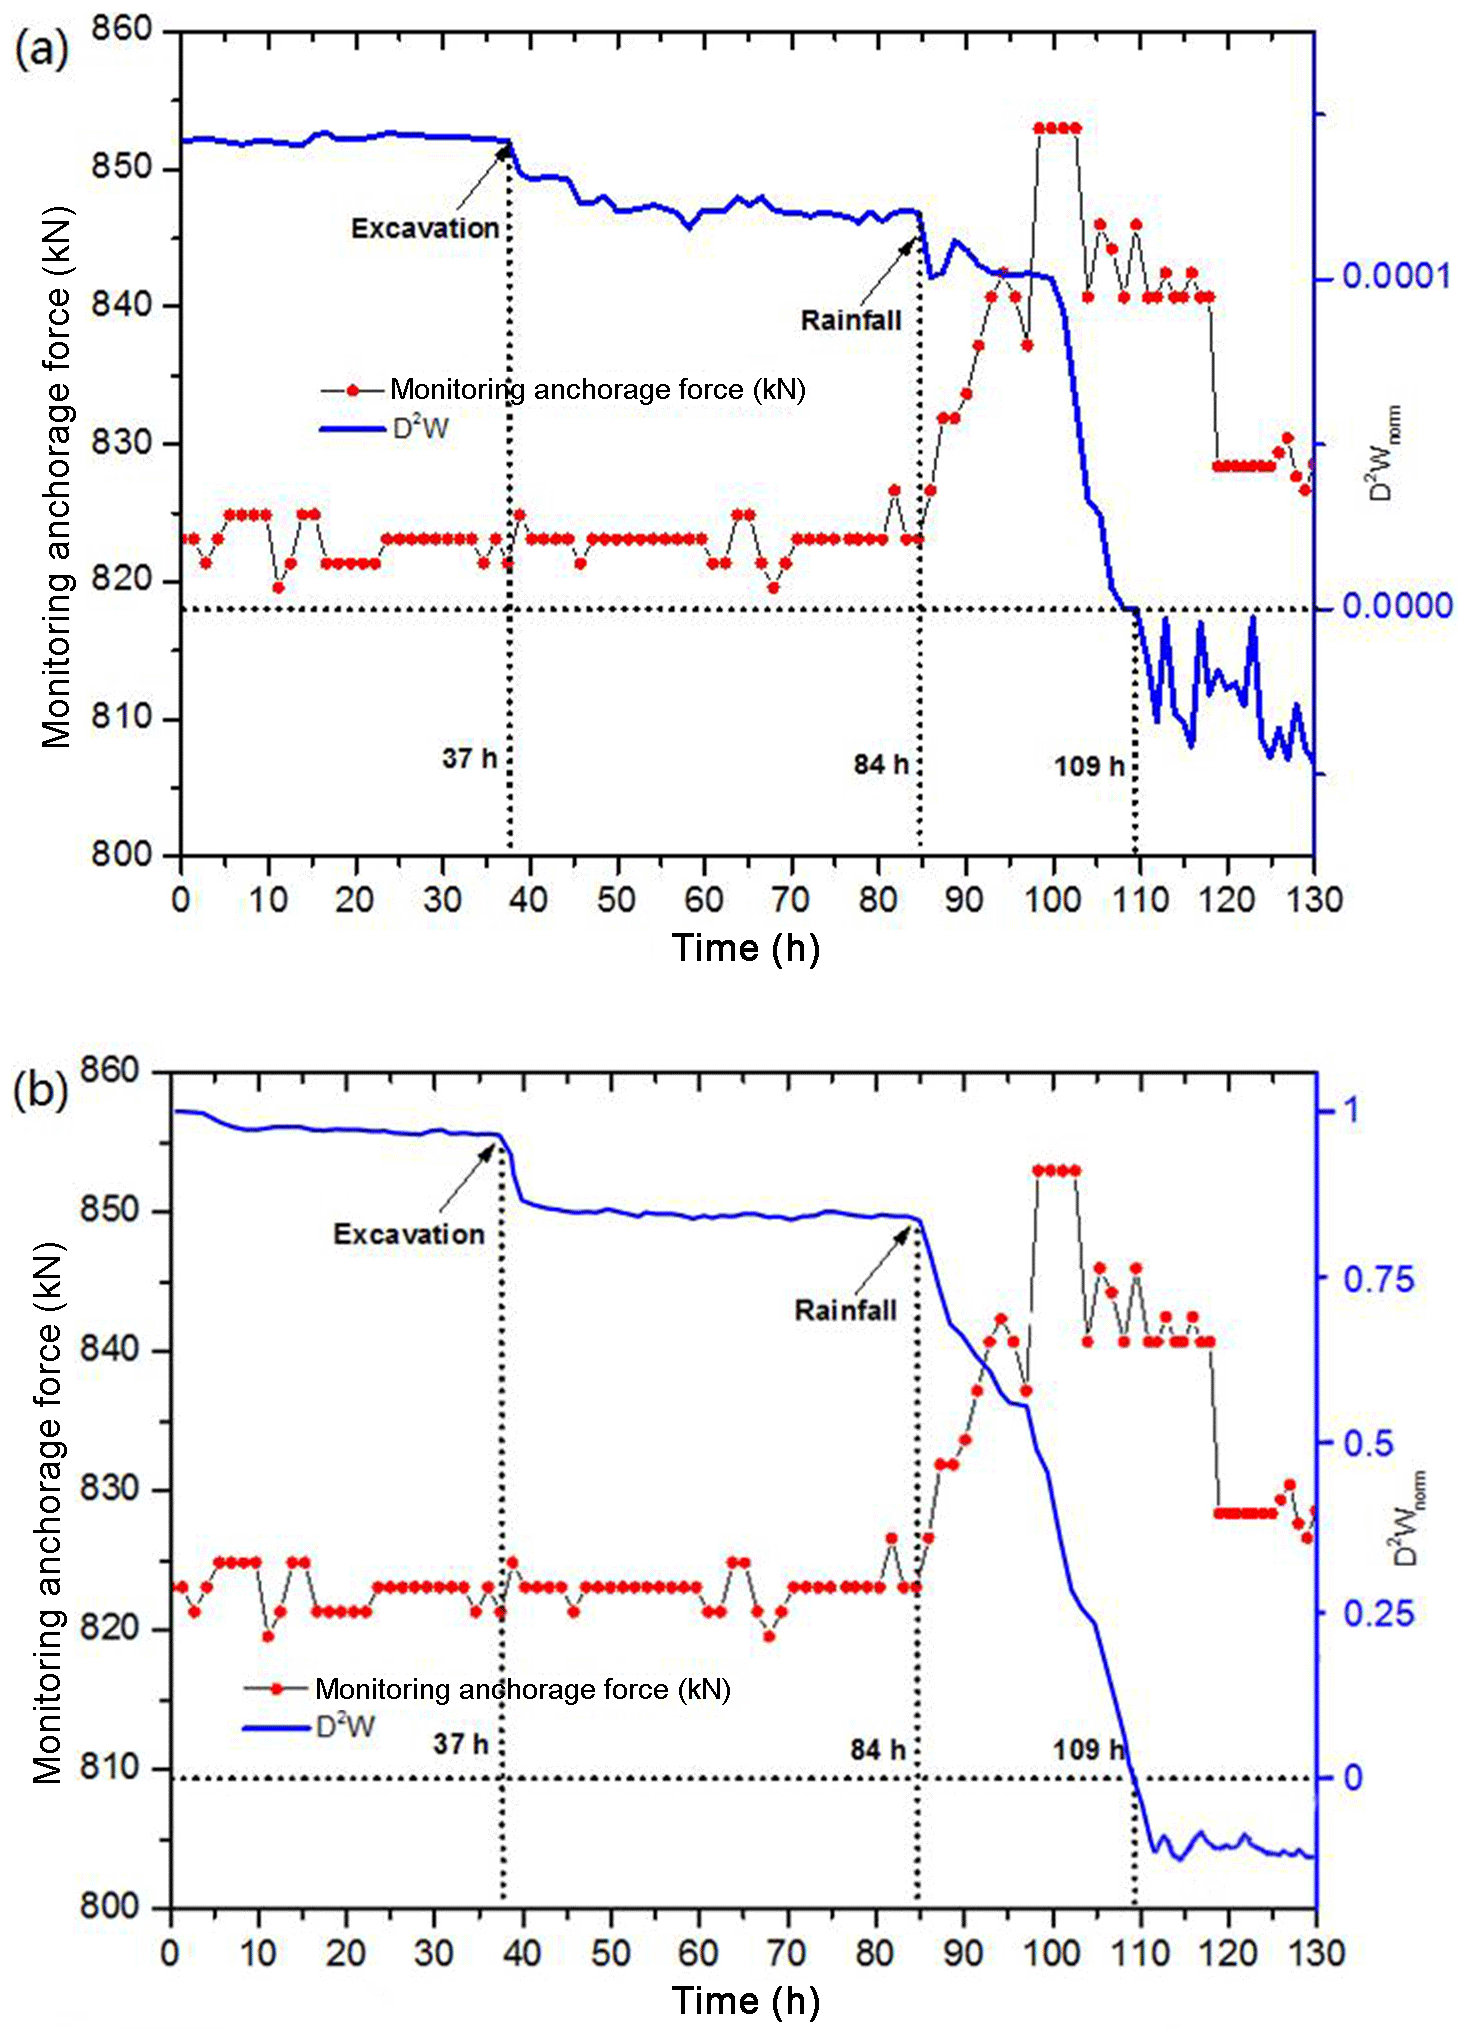
Figure 16Evolution of monitoring anchorage force and normalized global second-order work, computed according to (a) Eq. (10) and (b) Eq. (11).
Based on in situ surveys and monitoring data, this rockslide was considered to have been induced by rainfall. Mining activities augmented the instability risk but were not the direct cause of the rockslide. A numerical analysis was performed using the FEMLIP method. An elastoplastic constitutive model incorporating hydromechanical coupling and the second-order work criterion was employed in order to solve water infiltration and instability problems. The results were carefully analyzed and compared with the monitoring data, and several conclusions could be obtained:
-
The evolution of second-order work indicated a good correlation with monitoring data, both for the failure mechanism predicted by the local values of second-order work and failure time by its global value. Water infiltration induced a decrease in strength of the major geological discontinuity, and a subsequent increase in the anchorage force to support the increasing sliding force due to adjacent sliding bodies. Accordingly, the decrease in the local and global values of second-order work was a response to the decreasing geomaterial strength. Finally, water infiltration along the major geological discontinuity prompted the rockslide.
-
Both Eqs. (10) and (11) of the normalized global second-order work were implanted in FEMLIP code, and the corresponding results were compared. Equation (11) resulted in a result with less fluctuation, and its value was limited within the range 0 to 1, despite the mesh. It can be used as a safety factor, which is more general and more physical than the numerical divergence of the calculation.
-
Differing from classical methods, such as the FDM method, the complete evolution of the rockslide could be simulated in a unified frame using the FEMLIP method, which has been shown more generally as being useful for predicting the disaster domain and evaluating the dynamic effect on the retaining wall. The numerical analysis is a good assistant tool for understanding the failure mechanisms and predicting landslides.
This research suggests that subsequent mining activities should be undertaken with more care, and geological discontinuities with low strength and high permeability should be avoided as much as possible. Geological surveys and monitoring measures should also be carefully consulted. These results have to be compared with some adequate numerical models to fully understand both the failure mechanisms and the critical parameter values inducing catastrophic instability.
In addition, the instability of rock slopes usually proceeds with the breakage of intact rock bridges. The description of this discontinuous phenomenon using the FEMLIP method is worth being considered. By implementing the level-set functions, widely used in X-FEM, the FEMLIP method can be extended to solve the issues of discontinuous media.
No data sets were used in this article.
ZL and YJ discussed and conceived the research. ZL carried out the numerical simulations and wrote the manuscript. ZT provided the monitoring data in the field and the mechanical parameters of the geomaterials involved. QL produced the figures. FD gave valuable suggestions and revised the manuscript. MH gave valuable suggestions and provided financial support for this study.
The authors declare that they have no conflict of interest.
First, the authors sincerely acknowledge the CAS Pioneer Hundred Talents
Program for making the completion of this research possible. The research
presented in this paper was also jointly supported by the National Natural
Science Foundation of China (grant no. 41502334) and fund of the Institute
of Mountain Hazards and Environment (grant no.
SDS-135-1705 and grant no. SDS-135-1704). The authors wish to acknowledge
these financial contributions and convey our appreciation to these
organizations for supporting this basic
research.
Edited by: Thomas Glade
Reviewed by: two anonymous referees
Abe, K., Soga, K., and Bandara, S.: Material point method for coupled hydromechanical problems, J. Geotech. Geoenviron., 140, 1–16, https://doi.org/10.1061/(ASCE)GT.1943-5606.0001011, 2013.
Arairo, W., Prunier, F., Djéran-Maigre, I., and Darve, F.: A new insight into modeling the behavior of unsaturated soils, Int. J. Numer. Anal. Met., 37, 2629–2654, 2013.
Bandara, S., Ferrari, A., and Laloui, L.: Modelling landslides in unsaturated slopes subjected to rainfall infiltration using material point method, Int. J. Numer. Anal. Met., 40, 1358–1380, 2016.
Barnichon, J. D.: Finite element modelling in structural and petroleum geology, PhD Thesis, University of Liege, 1998.
Bishop, A. W.: Principle of effective stress, Teknisk Ukeblad, 106, 859–863, 1959.
Cascini, L., Cuomo, S., Pastor, M., Sorbino, G., and Piciullo, L.: SPH run-out modeling of channelized landslides of the flow type, Geomorphology, 214, 502–513, 2014.
Chen, H., Dadson, S., and Cui, Y.: Recent rainfall-induced landslides and debris flow in northern Taiwan, Geomorphology, 77, 112–125, 2006.
Cuomo, S., Prime, N., Iannone, A., Dufour, F., Cascini, L., and Darve, F.: Large deformation FEMLIP drained analysis of a vertical cut, Acta Geotech., 8, 125–136, 2013.
Darve, F. and Servant, G.: Fundamental of constitutive equations for geomaterials, Cism. Cour. L., 461, 1–33, 2004.
Darve, F., Servant, G., Laouafa, F., and Khoa, H. D. V.: Failure in geomaterials: continuous and discrete analyses, Comput. Method. Appl. M., 193, 3057–3085, 2004.
Dong, H. K., Ivan, G., and Arumugam, B.: Back analysis of a natural jointed rock slope based on the photogrammetry method, Landslides, 12, 147–154, 2015.
Duriez, J., Darve, F., and Donze, F. V.: Incrementally non-linear plasticity applied to rock joint modeling, Int. J. Numer. Anal. Met., 37, 453–477, 2011.
Feng, M. and Fredlund, D. G.: Hysteretic influence associated with thermal conductivity sensor measurements, in: Proceedings from Theory to the Practice of Unsaturated Soil Mechanics in Association with the 52nd Canadian Geotechnical Conference and the Unsaturated Soil Group, Regina, Sask, 14, 14–20, 1999.
Harlow, F. H.: The particle-in-cell computing method for fluid dynamics, Computer Methods in Physics, 3, 319–343, 1964.
He, M. C.: Real-time remote monitoring and foresting system for geological disasters of landslides and its engineering application, Chinese Journal of Rock Mechanics and Engineering, 28, 1081–1090, 2009 (in Chinese).
He, M. C., Gong, W. L., Wang, J., Qi, P., Tao, Z. G., Du, S., and Peng, Y. Y.: Development of a novel energy-absorbing bolt with extraordinarily large elongation and constant resistance, Int. J. Rock Mech. Min., 67, 29–42, 2014.
Hill, R.: A general theory of uniqueness and stability in elastic-plastic solids, J. Mech. Phys. Solids, 6, 236–249, 1958.
Huang, D., Cen, D. F., Ma, G. W., and Huang, R. Q.: Step-path failure of rock slopes with intermittent joints, Landslides, 12, 911–926, 2015.
James, J., Conca, A. B., and Judith Wright, A. B.: The UFA method for rapid, direct measurements of unsaturated transport properties in soil, sediment, and rock, Aust. J. Soil Res., 36, 291–315, 1998.
Khoa, H. D. V., Georgopoulos, I. O., Darve, F., and Laouafa, F.: Diffuse failure in geomaterials: experiments and modelling, Comput. Geotech., 33, 1–14, 2006.
Laouafa, F., Prunier, F., Daouadji, A., Al Gali, H., and Darve, F.: Stability in geomaterials, experimental and numerical analyses, Int. J. Numer. Anal. Met., 35, 112–139, 2011.
Li, Z. H., Dufour, F., and Darve, F.: Hydro-elasto-plastic modelling with a solid/fluid transition, Comput. Geotech., 75, 69–79, 2016.
Li, Z. H., Dufour, F., and Darve, F.: Modelling rainfall-induced mudflows using FEMLIP and a unified hydro-elasto-plastic model with solid-fluid transition, Eur. J. Environ. Civ. En., 22, 491–521, 2018a.
Li, Z. H., Jiang, Y. J., Tao, Z. G., and He, M. C.: Monitoring prediction of a rockslide in an open-pit mine and numerical analysis using a material instability criterion, B. Eng. Geol. Environ., 1–13, https://doi.org/10.1007/s10064-017-1224-z, 2018b.
Li, Z. H., Jiang, Y. J., Lv, Q., Sousa, L., and He, M. C.: Consistent modeling of a catastrophic flowslide at the Shenzhen landfill using a hydro-elasto-plastic model with solid-fluid transition, Acta Geotech., 13, 1451–1466, 2018c.
Lignon, S., Laouafa, F., Prunier, F., Khoa, H. D. V., and Darve, F.: Hydro-mechanical modelling of landslides with a material instability criterion, Géotechnique, 59, 513–524, 2009.
Marcelo, A., Llano-Serna, M. F., and Dorival, M. P.: An assessment of the material point method for modeling large scale run-out processes in landslides, Landslides, 13, 1057–1066, 2016.
Moresi, L., Dufour, F., and Muhlhaus, H. B.: Mantle convection modeling with viscoelastic/brittle lithosphere: numerical methodology and plate tectonic modeling, Pure Appl. Geophys., 159, 2335–2356, 2002.
Moresi, L., Dufour, F., and Muhlhaus, H. B.: A Lagrangian integration point finite element method for large deformation modelling of viscoelastic geomaterials, J. Comput. Phys., 184, 476–497, 2003.
Nicot, F. and Darve, F.: Diffuse and localized failure modes: Two competing mechanisms, Int. J. Numer. Anal. Met., 35, 586–601, 2011.
Parlange, J. Y.: Water transport in soils, Annual Revision of Fluid Mechanics, 12, 77–102, 1980.
Prime, N., Dufour, F., and Darve, F.: Unified model for Geomaterial solid/fluid states and the transition in between, J. Eng. Mech., 140, 682–694, 2013.
Prunier, F., Laouafa, F., Lignon, S., and Darve, F.: Bifurcation modelling in geomaterial: From the second-order work criterion to spectral analyses, Int. J. Numer. Anal. Met., 33, 1169–1202, 2009.
Prunier, F., Chomette, B., Brun, M., and Darve, F.: Designing geotehcnical structures 1 with a proper stability criterion as a safty factor, Comput. Geotech., 71, 98–114, 2016.
Regmi, A. D., Yoshida, K., Dhital, M. R., and Devkota, K.: Erratum to: Effect of rock weathering, clay mineralogy, and geological structures in the formation of large landslide, a case study from DumreBesei landslide, Lesser Himalaya Nepal, Landslides, 9, 299–301, 2012.
Soga, A., Alonso, E., Yerro, A., Kumar, K., and Bandara, S.: Trends in large deformation analysis of landslide mass movements with particular emphasis on the material point method, Géotechnique, 66, 1–26, 2016.
Sun, D. X., Tao, Z. G., Fan, L. J., and Feng, X. R.: Stability assessment and sensibility analysis of Nanfen open-pit mine slope, Metal Mine, 5, 57–60, 2011 (in Chinese).
Tu, X. B., Kwong, A. K. L., Dai, F. C., Tham, L. G., and Min, H.: Field monitoring of rainfall infiltration in a loess slope and analysis of failure mechanism of rainfall-induced landslides, Eng. Geol., 105, 134–150, 2009.
Van Eekelen, H. A. M.: Isotropic yield surfaces in three dimensions for use in soil mechanics, International Journal of Numerical and Analytical Methods in Geomechanics, 4, 89–101, 1980.
Van Genuchten, M. T.: A closed-form equation for predicting the hydraulic conductivity of unsaturated soils, Soil Sci. Soc. Am. J., 44, 892–898, 1980.
Wang, J. J., Zhang, H. P., and Liu, T.: Determine to slip surface in waterfront soil slope analysis, Adv. Mat. Res., 378–379, 466–469, 2011.
Yang, F., Hou, K. P., and Xie, Y. L.: Mechanical parameters determination method for strongly weathered mica-quartz schise, Journal of Chang'an University, 32, 29–38, 2012 (in Chinese).
Zhang, K., Tan, P., Ma, G. W., and Can, P.: Modeling of the progressive failure of an overhang slope subject to differential weathering in Three Gorges Reservoir, China, Landslides, 13, 1303–1313, 2016.