the Creative Commons Attribution 4.0 License.
the Creative Commons Attribution 4.0 License.
 | 15 Jul 2019
Towards early warning of gravitational slope failure with co-detection of microseismic activity: the case of an active rock glacier
Jérome Faillettaz
Martin Funk
Jan Beutel
Andreas Vieli
We developed a new strategy for disaster risk reduction for gravitational slope failure: we propose validating on a case study a simple method for real-time early warning of gravity-driven failures that considers and exploits both the heterogeneity of natural media and characteristics of acoustic emissions attenuation. This method capitalizes on co-detection of elastic waves emanating from micro-cracks by a network of multiple and spatially distributed sensors. Event co-detection is considered to be surrogate for large event size with more frequent co-detected events marking imminence of catastrophic failure. In this study we apply this general method to a steep active rock glacier, a natural heterogeneous material sharing all relevant properties of gravitational slope failure, and demonstrate the potential of this simple strategy for real world cases, i.e., at slope scale. This new strategy being theoretically valid for all types of failures, it constitutes a first step towards the development of a new early warning system for gravitational slope failure.
- Article
(12622 KB) - Full-text XML
- BibTeX
- EndNote


Slope and rock instabilities due to permafrost degradation, rockfalls, landslides, snow avalanches or avalanching glacier instabilities are common in high mountain areas. These gravity-driven rupture phenomena occurring in natural heterogeneous media are rare, but have potential to cause major disasters, especially when they are at the origin of a chain of processes involving other materials such as snow (snow avalanche), water (flood) and/or debris (mudflow) (Gill and Malamud, 2014). They potentially endanger mountain communities or real estate development and are at the origin of huge human fatalities and economic costs (Petley et al., 2005; Sidle and Ochiai, 2006; Lacasse et al., 2009; Petley, 2012). In the context of climate warming, degradation of permafrost is expected to further promote slope destabilization in high mountains and thus increase the occurrence of such natural disasters (Gruber et al., 2004). Because of the potential magnitude of such catastrophic phenomena, a reliable forecasting combined with a timely evacuation of the endangered areas is often the most effective way to cope with such natural hazards. However, the nonlinear nature of geological material failure hampered by inherent heterogeneity, unknown initial mechanical state and complex load application (rainfall, temperature, etc.) hinders predictability.
In the last decades, landslide hazard analysis and risk assessment have become a major subject in landslide studies, leading to recent advances in local landslide early warning systems (Chae et al., 2017). Such systems are based on different monitoring strategies (ground-based or remote sensing) (Chae et al., 2017), as well as on a variety of methods and techniques (for a review, see Pecoraro et al., 2019), possibly involving long-term monitoring of event precursors (Stähli et al., 2015). In general, slope stability assessment (and prediction of slope failures) is based on the long-term monitoring and analysis of the temporal evolution of external parameters such as geometry and surface displacement (or surface velocity) as well as on the observation of external forcing such as meteorological/climatic conditions (e.g., rainfall duration and intensity, temperature, wind, snow accumulation).
On the basis of a theoretical/modeling study, Faillettaz et al. (2016) recently proposed a new method to investigate natural slope stability based on continuous monitoring and interpretation of seismic waves generated by the potential instability before the failure – i.e., an internal parameter. This method capitalizes on both heterogeneity and attenuation properties of natural media for developing a new strategy for early warning systems: as heterogeneous materials break gradually, with their weakest parts breaking first, they produce precursory “micro-cracks” with associated elastic waves traveling in the material. Therefore the monitoring of such microseismic activity offers valuable information concerning the progression of damage and imminence of global failure (Michlmayr et al., 2012; Faillettaz and Or, 2015). Such monitoring provides new insights into the imminence of break-off and in some cases it has been applied to natural gravity-driven instabilities such as cliff collapse (Amitrano et al., 2005), slope instabilities (Dixon et al., 2003; Kolesnikov et al., 2003; Dixon and Spriggs, 2007), glacier break-off (Faillettaz et al., 2011) or failure in snowpack (Van Herwijnen and Schweizer, 2011; Reiweger et al., 2015). However, as elastic waves travel in the material, their amplitudes decay with distance from the source. Due to attenuation of propagating acoustic/seismic signals (elastic waves), an event (i.e., a crack formation in the material) may also be observed and recorded differently by an acoustic/seismic sensor depending on its location. Theoretical considerations based on simple numerical modeling suggest that, although statistical properties of attenuated signal amplitude could lead to misleading results, detecting emergence of large events announcing impeding failure (precursors) is possible even with attenuated signals (Faillettaz et al., 2016). It requires a network of (seismic/acoustic) sensors on a potential unstable slope and the detection of events in real time. Real-time processing of measured events that are detected concurrently on more than one sensor (co-detected) enables us to then easily access their initial magnitude as well as their approximate initial location. This simple method based on co-detection of elastic waves traveling through natural media provides a simple means to access characteristics and temporal evolution of surrogate variables linked to hillslope damage and mechanical state. For this method to function, temporal synchronization between sensors must be sufficiently accurate to reliably classify events detected simultaneously by multiple sensors; therefore the sensor network needs to be precisely synchronized. Preliminary application to acoustic emissions during failure of snow samples at lab scale has confirmed the potential usefulness of co-detection as an indicator for imminent failure.
To demonstrate the application potential of this simple strategy for early warning systems to real cases, i.e., at slope scale, we designed and built an experimental system composed of a network of six seismic sensors wired to a data acquisition unit, ensuring an interleaved sampling time synchronization between sensors. This experimental setup was installed and tested on the steep tongue of the Dirru rock glacier, a location where small-scale slope instabilities were highly probable. Note that the steep slope is composed of a highly heterogeneous material consisting of a mixture of ice, rock, fine sediment, air and water. In this study, we show the first results of the analysis of the seismic activity generated by the steep tongue during summer 2017. Thanks to a meteorological station located close to the rock glacier and L1 differential GPS unit on the rock glacier (Wirz et al., 2013), we were able to investigate the relation between seismic activity, surface displacement and external forcing (rainfall, temperature). Using additional webcam images with a time interval of 30 m, we identified three small-scale failure events (of approximately 10 m3 each) and analyze the associated number and temporal evolution of co-detection prior to failure. This co-detection analysis showed typical patterns of precursory events prior to failure, thus demonstrating the potential of this method for real-world applications in early warning. Moreover, this seismic method provides new insights into the rock glacier dynamics, especially the short-term peaks of velocity in relation to external forcing.
The motivations of this study are twofold: first, it aims at testing the applicability of the co-detection method at the slope scale and thus at demonstrating its application potential in the context of natural slope stability assessment. Second, as our experiment was deployed on a fast-moving rock glacier, we had the opportunity to investigate, for the first time, the seismic activity emitted by the glacier tongue and its link to complex rock glacier dynamics.
The paper is organized as follows: after describing the study site and the experimental setup, we performed the analysis of the co-detection method and demonstrate its potential applicability to early warning of gravity-driven geofailure. Comparing results with all available data, ranging from surface displacement to meteorological data, complex rock glacier dynamics are discussed in light of these new observations.
2.1 Study site
The study site is located in the area of the Dirruhorn in the Matter Valley, above Herbriggen/Randa, Switzerland. The mainly westerly exposed slopes range from 2600 to 4000 m a.s.l. Permafrost is abundant in this area (Delaloye et al., 2010). The field area includes various cryosphere-related slope movements: e.g., exceptionally fast and potentially dangerous rock glaciers moving up to 10 m a−1 (Delaloye et al., 2010). The rock glacier Dirru is composed of various lobes and fronts, originating from different rock glacier generations. The currently active lobe, which is located on the orographic right side of Dirrugrat, has a total length of more than 1 km, is about 60 to 120 m wide and is approximately 20 m thick (Wirz et al., 2016b). It has a convex profile and slope angles increase from about 15∘ in the upper part to more than 30∘ in the lower part towards its front. Since the 1970s and 1980s this steep frontal part (tongue) has progressively accelerated and reached surface velocities above 5 m a−1, potentially indicating a phase of destabilization (Delaloye et al., 2013). Its front already collapsed in some parts in the recent past. At this front, water emerges occasionally in spring and summer. Based on past photographs, it was found that the actual acceleration phase of its frontal part started progressively during the 1970s and 1980s and that the origin of the destabilization of the entire rock glacier seems to be older (Delaloye et al., 2013; Wirz et al., 2016b).
2.2 Field experiment setup
The seismic experimental setup is composed of six geophones (Ion SM-6, one channel with a natural frequency of 10 Hz) directly wired to a central data acquisition unit (Fig. 1, right inset), ensuring a good time synchronization. Each sensor is also embedded in a waterproof casing specially designed for these sensors (Fig. 1). A preamplifier (micropower precision operational amplifiers – OPAx333 from Texas Instruments – with a gain of −57) was also installed to mitigate attenuation effects in the 20 m cables (for more technical details, see Appendix A). A data acquisition unit was built and designed specially for this experiment. The analog signal is first amplified (OPA4330 from TI, gain of 10) and filtered, then converted to a digital signal with an analog-to-digital converter (ADC) of 12-bit resolution. A mini computer Arduino records and stores on an SD card signal amplitude (0±2048) of the six sensors at a sampling rate of 250 Hz.

Figure 1General view of the Dirru rock glacier. White arrows indicate the location of the GPS and meteorological stations installed on the rock glacier and analyzed in this study. Bottom left inset: location and associated number of each sensor installed near the steep tongue of the Dirru rock glacier. Top right inset: general location of Dirru glacier. Middle right inset: view of the central data acquisition unit, with each sensor being wired to this unit. Bottom right inset: view of a sensor installed on the field with a large rock sheltering it.
The procedure for recording data is the following: As soon as a signal with an amplitude higher than a preset threshold is detected, the ADC is powered on and data are recorded from all sensors for 1 s. If, during this period, one of these sensors records an amplitude higher than the preset threshold, the whole array continues to record for another whole second. If the activity is high, this procedure could result in a single long record. During the monitoring period (11 July–5 September 2017) the maximum duration of a signal was around 500 s.
In addition to the highly probable occurrence of failure events during summer, this site was also selected for a pilot experimental study because of the proximity to other concurrent measurement setups during the Xsense I and II projects (Wirz et al., 2016a, b). During this period, air temperature and precipitation were monitored (from the meteorological station installed a few hundreds meters from the tongue; see Fig. 1) along with a webcam that took images from the tongue at a 30 min interval (Fig. 1). These images provide valuable information on the timing, the location and the rough magnitude of failure events occurring at the tongue. Events ranging from single rockfalls/rockslides to large slides were detected. Analyzing the seismic activity during these short periods provides a unique way to investigate the seismic signature of each event, and thus to characterize the potential precursory seismic signals associated with each event. During bad weather conditions the webcam images were obscured by fog, but this only occurred a few days during the observation period in summer (<7 d). Two differential L1-GPS sensors permanently installed on the fast-moving part of the rock glacier were also monitoring surface displacement (Fig. 1).
3.1 General overview of meteorological conditions and rock glacier dynamics
Figure 2 shows temperature, precipitation and surface velocity of the rock glacier at two different locations (Fig. 1), over the monitoring period in summer 2017. As already observed for earlier years by Wirz et al. (2016a), rock glacier movement shows a seasonal pattern with an increase starting with the snow melt and reaching maximum flow in late summer–early autumn. In addition to these seasonal variations, short-term peaks in surface velocity are also recorded, in agreement with previous observations (Wirz et al., 2016a, b). During such peaks, velocity approximately doubles over a period of a few days to speeds of a few centimeters per days (2 to 5 cm d−1) and drops rapidly to its initial value. These peaks seem to be related to the presence of large amounts of liquid water within the glacier. Indeed they appear after intense precipitation events or during the snowmelt period. Moreover, a stream spilling out of the tongue, indicating substantial flux of liquid water within the rock glacier, was observed four times in the summer period (May to September) and once during the monitoring period, i.e., 11 July–5 September 2017 (indicated with a red band in Fig. 2). Note that the occurrence of such water outflow is also concomitant with such short-term speed-up events.
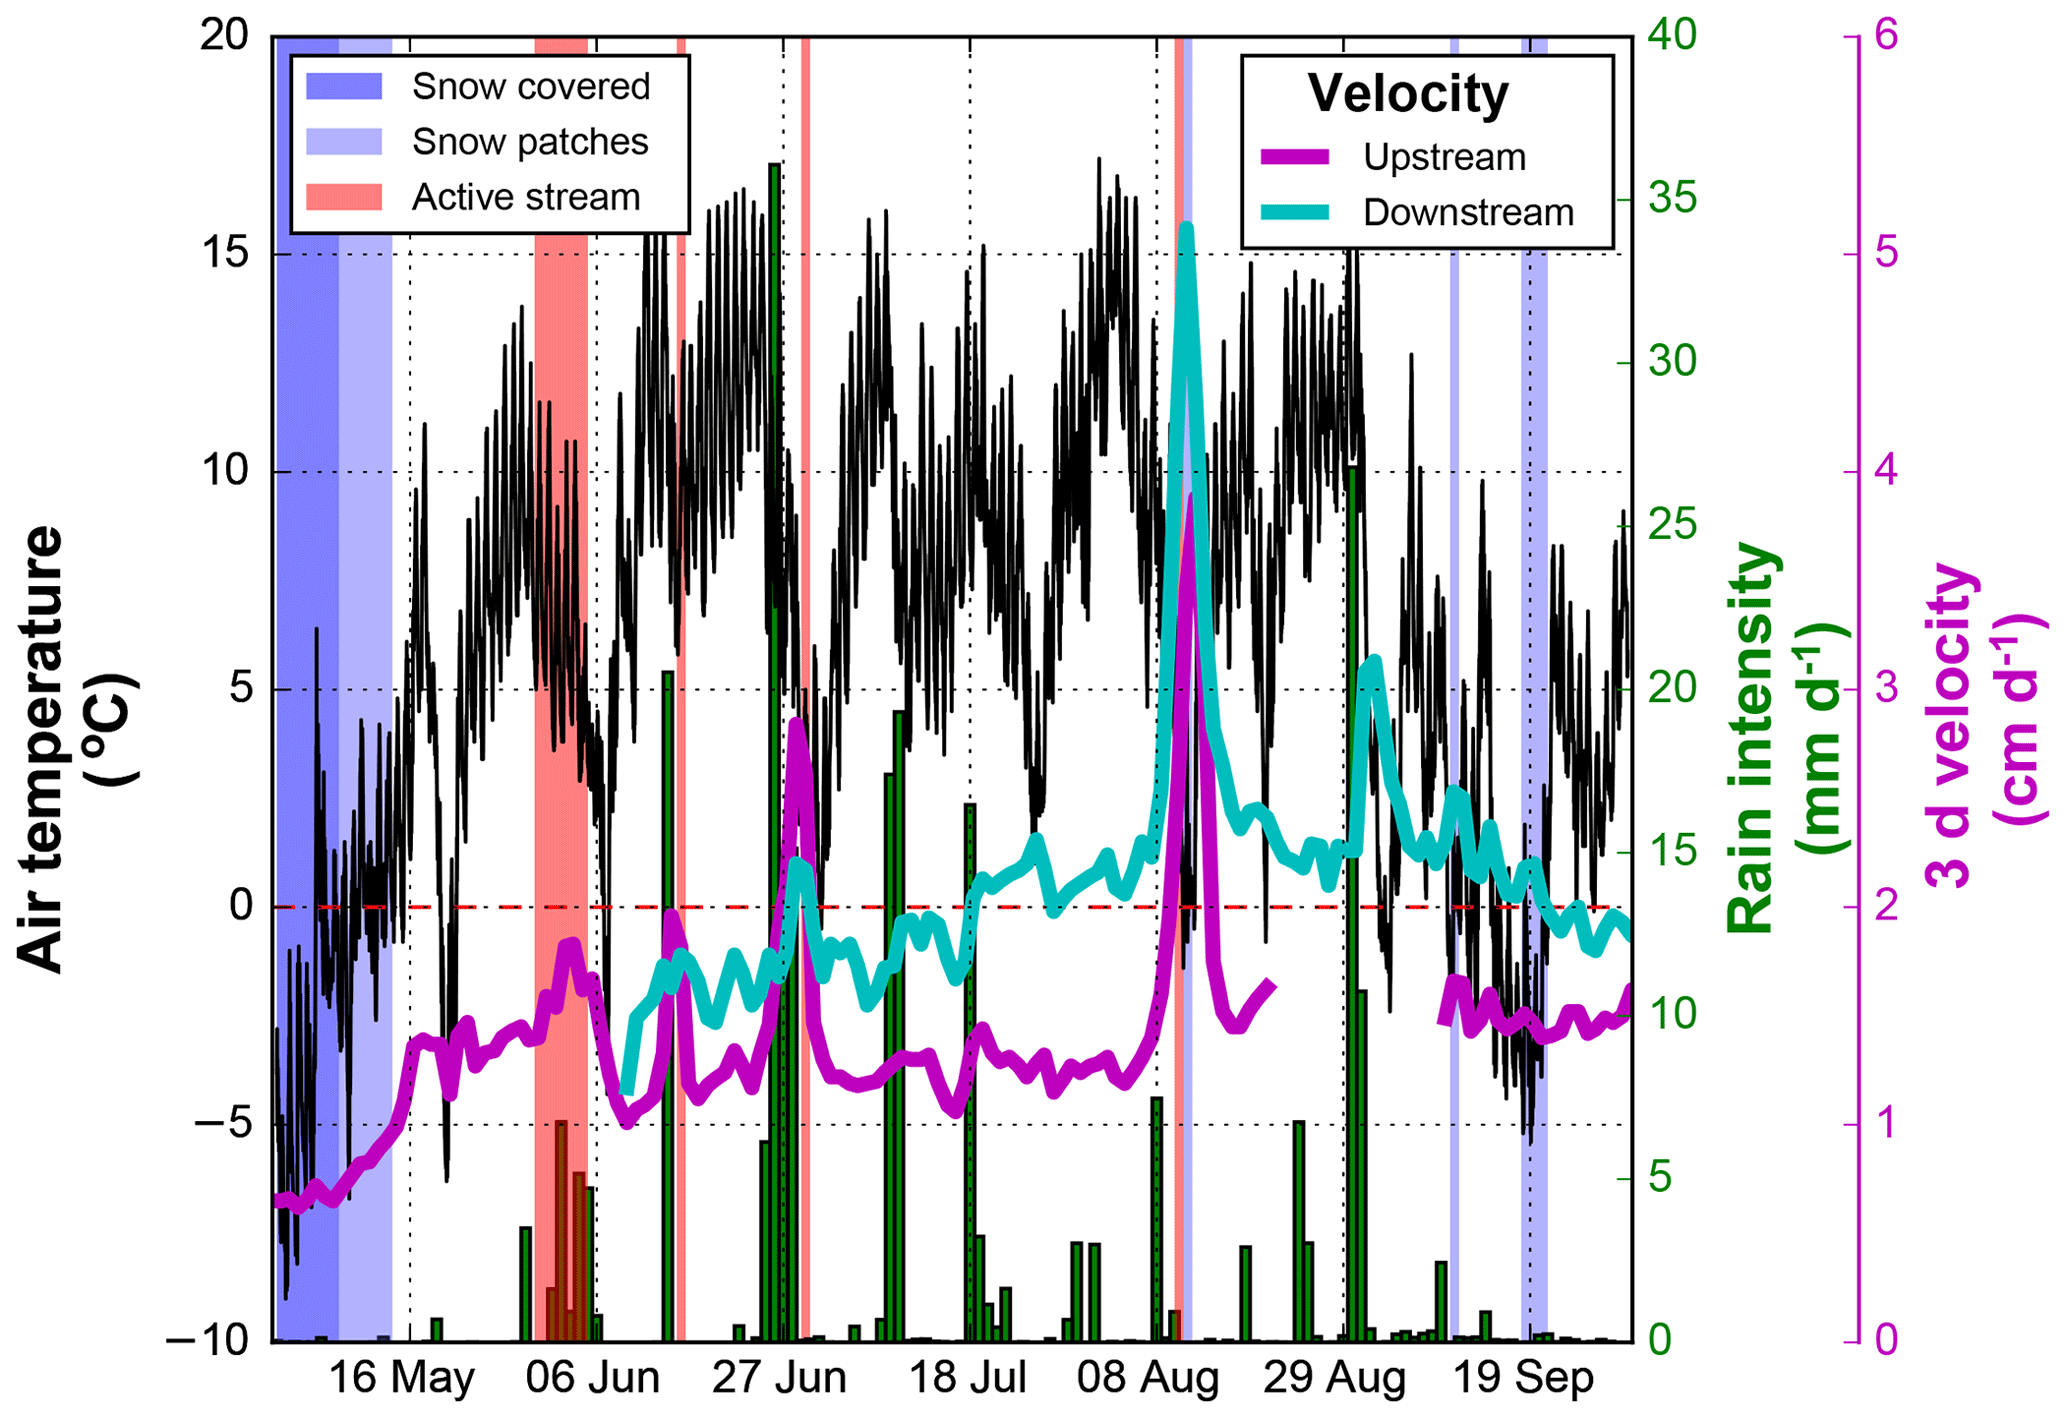
Figure 2Temperature (black line), precipitation (green bars) and surface velocity (blue and magenta line) of the rock glacier during summer 2017. Upstream and downstream velocities refer to the velocities of two differential L1 GPS stations located in the upper and lower parts of the rock glacier tongue, respectively. Red bars in the background indicate periods when a stream was spilling out the rock glacier tongue, dark blue period when snow fully covered the rock glacier and light blue periods when snow only partially covered the rock glacier.
Figure 3 shows the hourly seismic activity (seismic hit probability) emanating from the rock glacier tongue during the monitoring period. Seismic activity shows a clear correlation with air temperature: the number of seismic events increases during the day, reaching its maximum concurrently with the maximum in air temperature. Further, the seismic activity is shown to be clearly higher during periods when liquid precipitation occurred (Fig. 3 inset). As a result, the seismic activity generated by the steep rock glacier tongue appears to be strongly correlated with both air temperature and the presence of liquid water (rainfall or snowmelt).
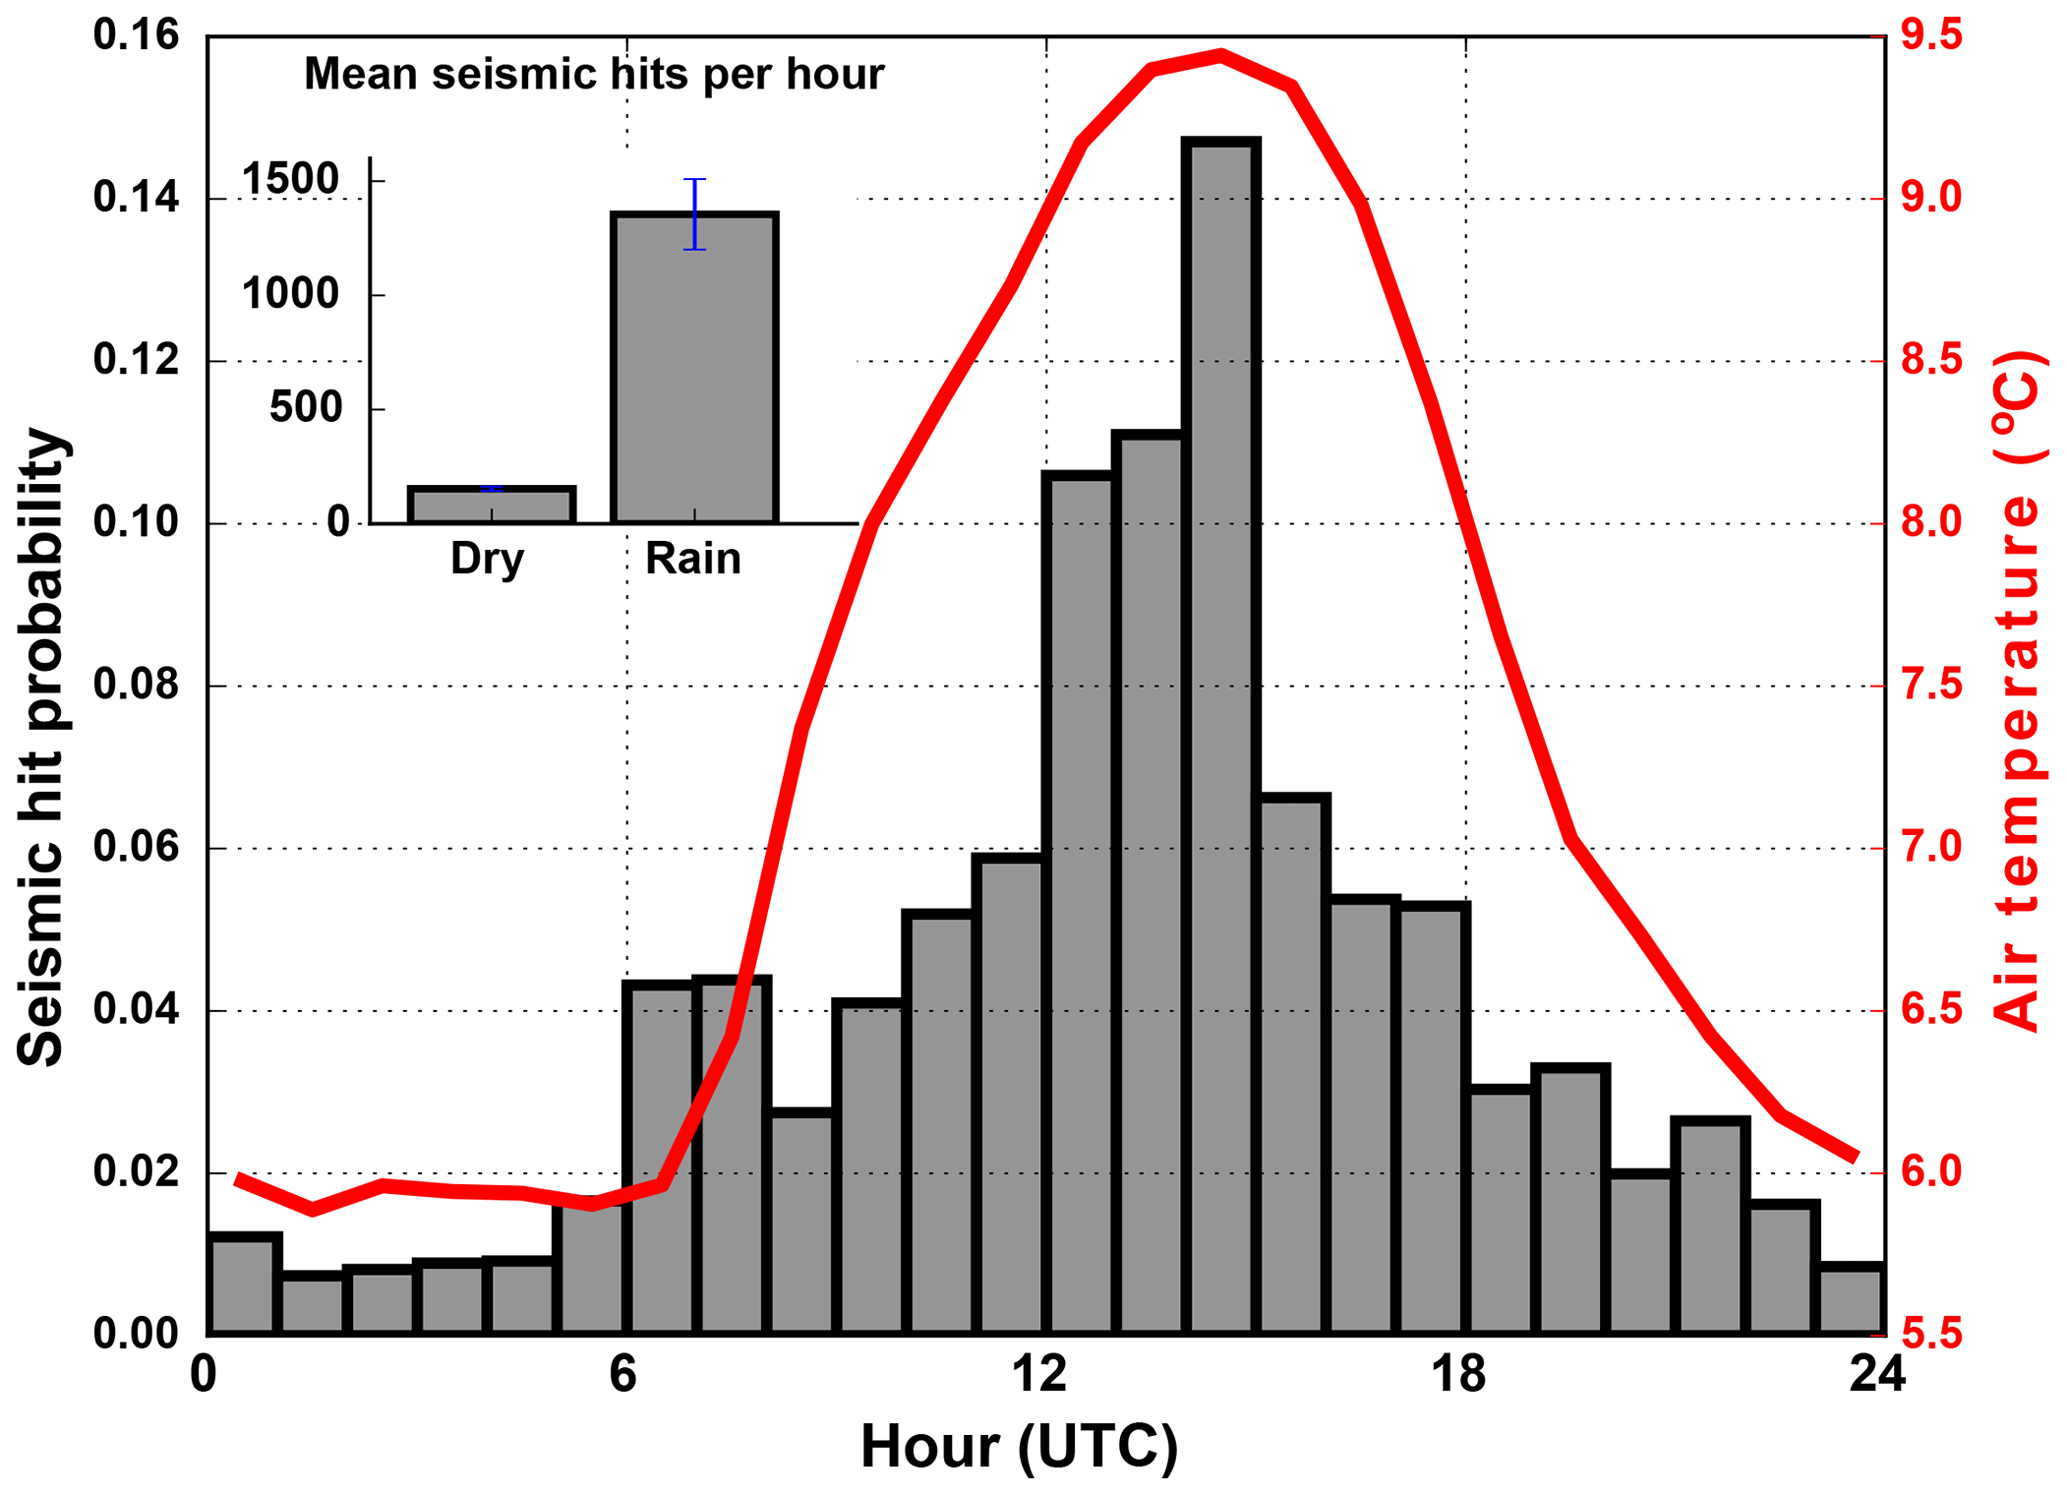
Figure 3Mean hourly seismic activity (expressed in hits per hour) during the seismic monitoring period (11 July–5 September 2017). The inset shows the difference in seismic activity between wet (i.e., when liquid precipitation occurred) and dry days.
3.2 Co-detection
The number of co-detections is defined as the number of sensors that detect an event emanating from the same source (i.e., the signal amplitude is larger than a predefined threshold). In practice, we counted the number of sensors detecting a signal within a short period (here 0.1 s), with this time window being evaluated according to the sensor spacing and the signal propagation in the medium. Although the real detection threshold (RDT) is given by the properties of the sensors and the setup, it could be enhanced during the post-analysis, as the full waveforms of the seismic signals are concurrently recorded and the trigger threshold in the original setup is set sufficiently low. Figure 4 shows (a) the number of co-detections as a function of time using different post-analysis detection thresholds (PADTs) based on the amplitude of the recorded digital amplitude of the waveforms (ranging from −2048 to 2048), the larger the PADT, the less sensitive the detection (the numbers given – 500 to 2000 – are arbitrary, without unit, corresponding to the amplitude of recorded digital signal); (b) which sensor is detecting an event; (c) the daily seismic hits and the mean daily velocity from two different locations; and (d) the air temperature and precipitation during the monitoring period.

Figure 4(a) Number of co-detections as a function of time using different detection thresholds (colored different sized circles); the larger the threshold, the less sensitive the detection (the numbers given – 500 to 2000 – are arbitrary, without unit). (b) Event detection per sensor number; each vertical line represents a detected seismic event. (c) Daily seismic hits (bars) and mean daily velocity from two different GPS locations (blue and red lines). (d) Air temperature (red line) and liquid precipitation (black bars) recorded at the meteorological station located a few hundreds of meters from the tongue (see Fig. 1). The seismic monitoring period ranges from 10 July to 5 September.
In general, the number of co-detections exhibits a similar trend to the seismic activity (total number of seismic events detected by the network, independently of their amplitudes or energy, third panel of Fig. 4): during the monitoring period, three periods with high seismic activity and a high number of co-detections can be highlighted (17–21 July, 8–11 August and 1–4 September). The initiation of these active seismic phases occurred after wet periods (rainfall event or snow melt event, i.e., periods of high air temperatures). Whereas surface velocity exhibits a slightly increasing trend (except a few velocity peaks shortly after or close to enhanced seismic activity), the seismic activity or the number of co-detections show a different temporal variation pattern during the monitoring period and even a calm period (e.g., 13–20 August, Fig. 4c), indicating that glacier dynamics and seismic activity are not directly correlated.
As already shown in Fig. 3, a rainfall event (i.e., a direct addition of liquid water on the rock glacier) increases seismic activity at the tongue, but Fig. 4 shows that the response is not linear: low precipitation rates are sometimes related to high activity (e.g., 7 August), whereas during large rainfall events only a small increase in seismic activity is recorded (e.g., 17 July).
Sensors 2 and 3, located closed to the steep left-side front, detect more seismic events than the others, whereas sensor 4, located a few tens of meters upstream from the front, detects substantially fewer events. Even if these sensors are not located that far apart (less than 50 m), the recorded seismic activity is substantially different, thus demonstrating that the attenuation phenomenon has a huge influence on seismic monitoring.
3.3 Destabilization process and associated seismic precursors
Classical failure of infinite slopes is described by an equation (called factor of safety) that balances the downslope component of (gravitational) driving stress against the resisting stress (due to basal Coulomb friction, mediated by pore water pressure). In this concept slope destabilization results due to either an increase in the driving stress or a decrease in the resisting stress. In general, a combination of dynamical and quasi-static processes can lead to the change in one of these components: an initial change in the external forcing (e.g., rainfall, meltwater, earthquakes) and from internal changes (e.g., increase in internal damage, leading to a decrease in resisting stress).
The different types of data from our field experiment allow us to carefully identify, isolate and analyze both processes during the monitoring period. Failure events were detected using the webcam images with a temporal resolution of 30 min (when usable). Results are shown in Figs. 6 and 7.
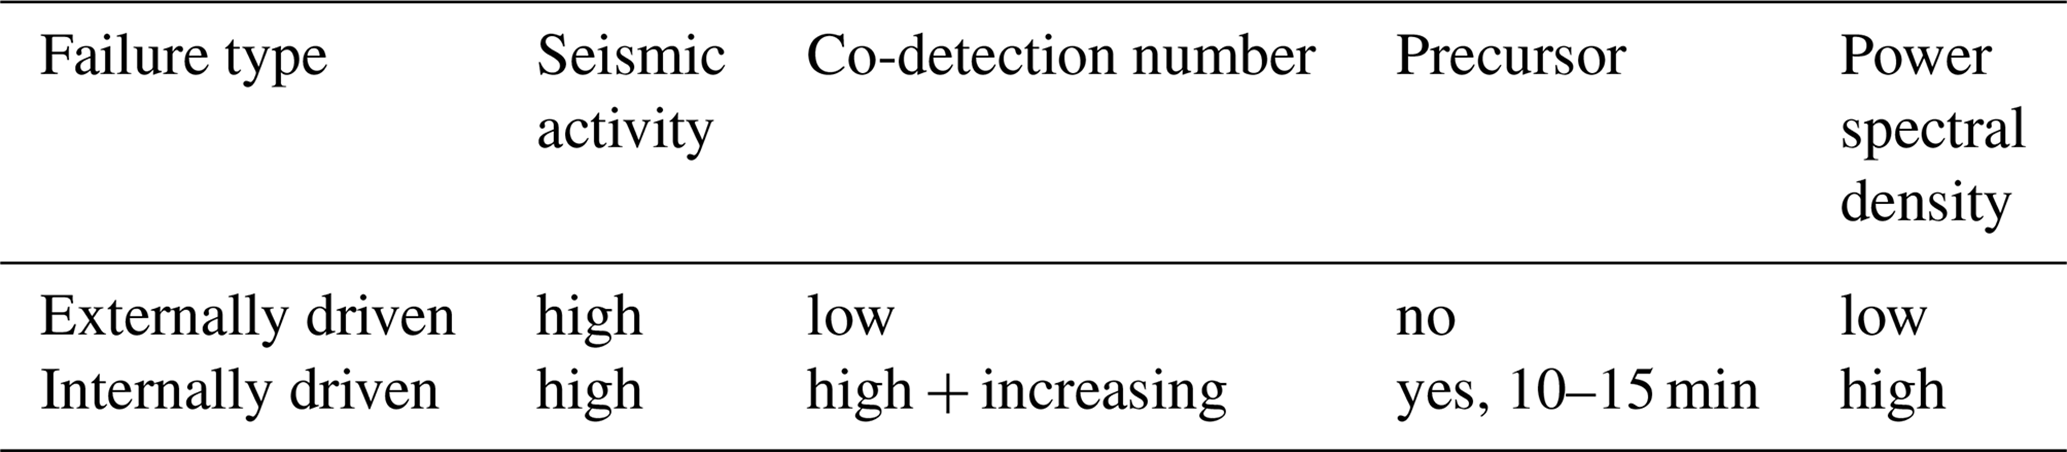
During the monitoring period, we identified two clear failure events corresponding to internally driven events (Fig. 6): differences between consecutive usable webcam images show undoubtedly small landslide-type events (3–10 m3) occurring at the tongue during dry periods. According to the webcam images, such confirmed debris slides occurred (i) between 19 July at 19:40 LT and 20 July at 06:10 LT (a long time interval because of night) and (ii) on 21 July between 09:40 and 10:10 LT. During these periods, the recorded seismic activity was low with almost no co-detections except during short periods, i.e., on 20 July at 00:45 LT and on 21 July at 09:45 LT (Fig. 5). As landslide-type events release high seismic energy generating large seismic waves (e.g., shocks between rolling blocks), these high numbers of co-detection might correspond to the exact timing of the occurrence of the instabilities. As no rainfall occurred during and in the 2 d preceding these events, the destabilization was not directly triggered by changes in external forcing, and could thus be attributed to an internally driven event. The detailed analysis of the co-detection monitoring of two of these periods is shown in Fig. 6. These internally driven events exhibit strong similarities (Table 1): (1) a clear increase in seismic activity and increasing number of co-detections about 45 min prior to the failure event (a pattern as expected by Faillettaz et al., 2016), (2) the occurrence of a precursory event 10 to 15 min prior the main failure, (3) a strong increase in the number of detections of the sensors located close to the final event, allowing to some degree location of the final event (event 20 July between sensors 2 and 3, 21 July between sensors 1 and 6 and 31 August near sensor 2).

Figure 5Close-up images (800×800 pixels) taken from the webcam during the internally driven events of 20 and 21 July 2017. First column shows the last exploitable image (with its exact timing) before the associated event, and the second column the first exploitable image after the event. The third column shows the differences between the two images using a heat map (arbitrary ranging between 0 and 256) where yellow and blue colors highlight locations experiencing the larger mismatch between images. These differences are evaluated for each pixel as the maximum of the absolute difference on each channel (red, green and blue) separately.
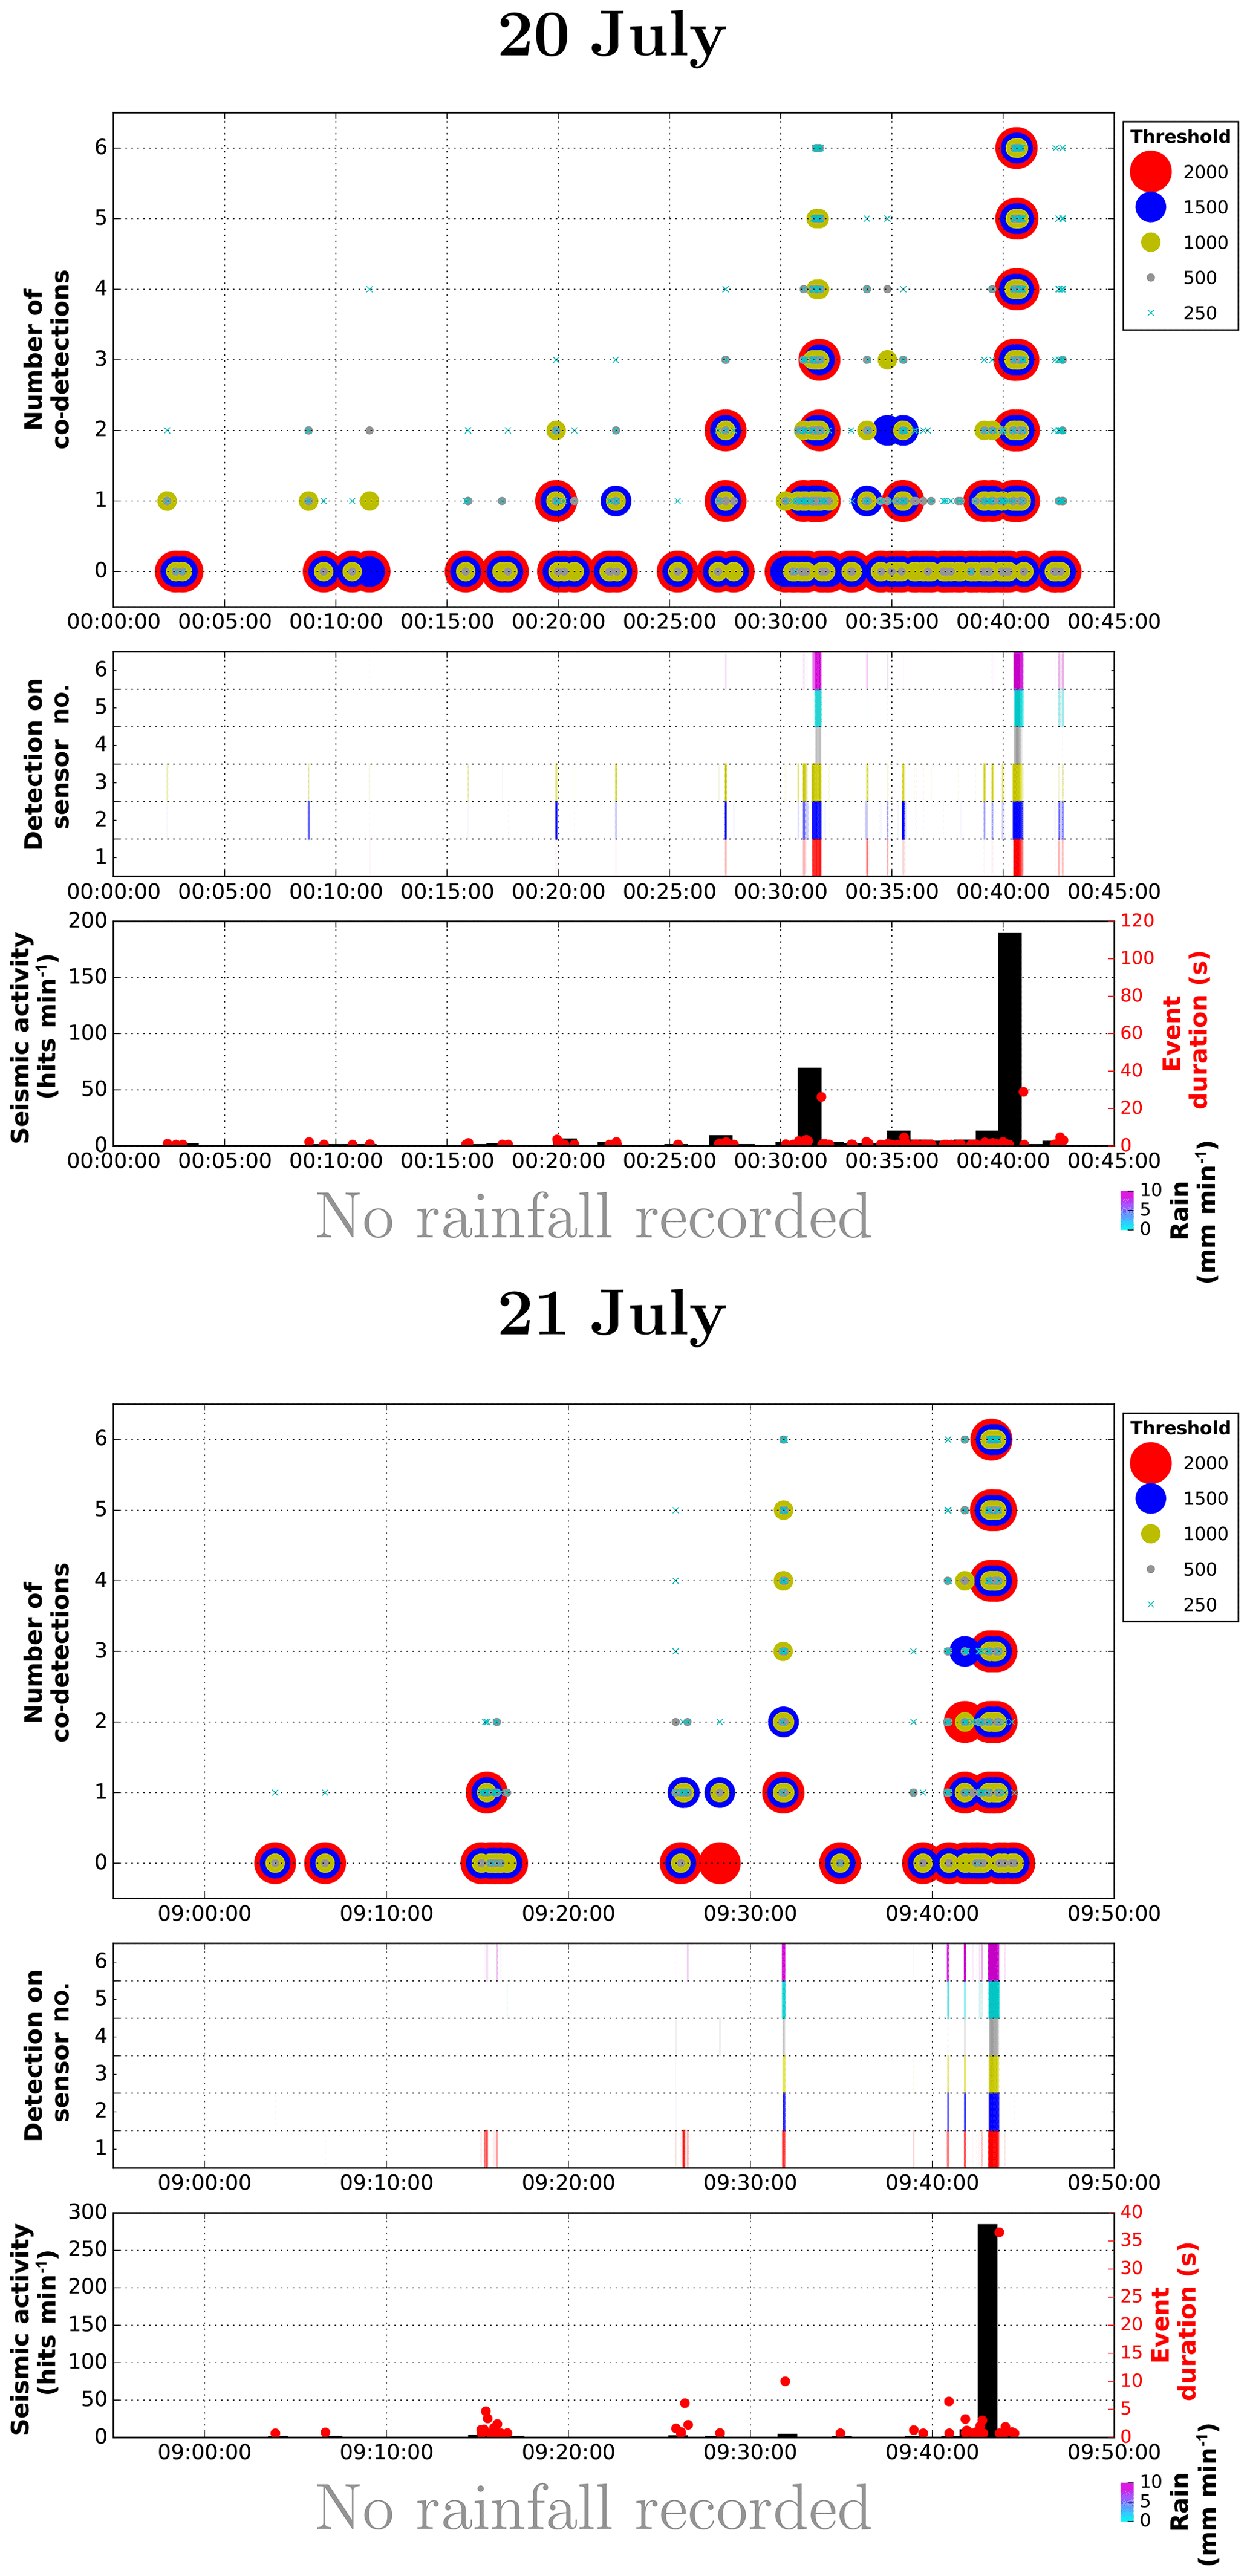
Figure 6Internally driven event (top panel: 20 July; bottom: 21 July): number of co-detections using different thresholds (same arbitrary unit as in Fig. 4), their associated detecting sensors, the corresponding seismic activity (and event duration) and the precipitation record during this period.
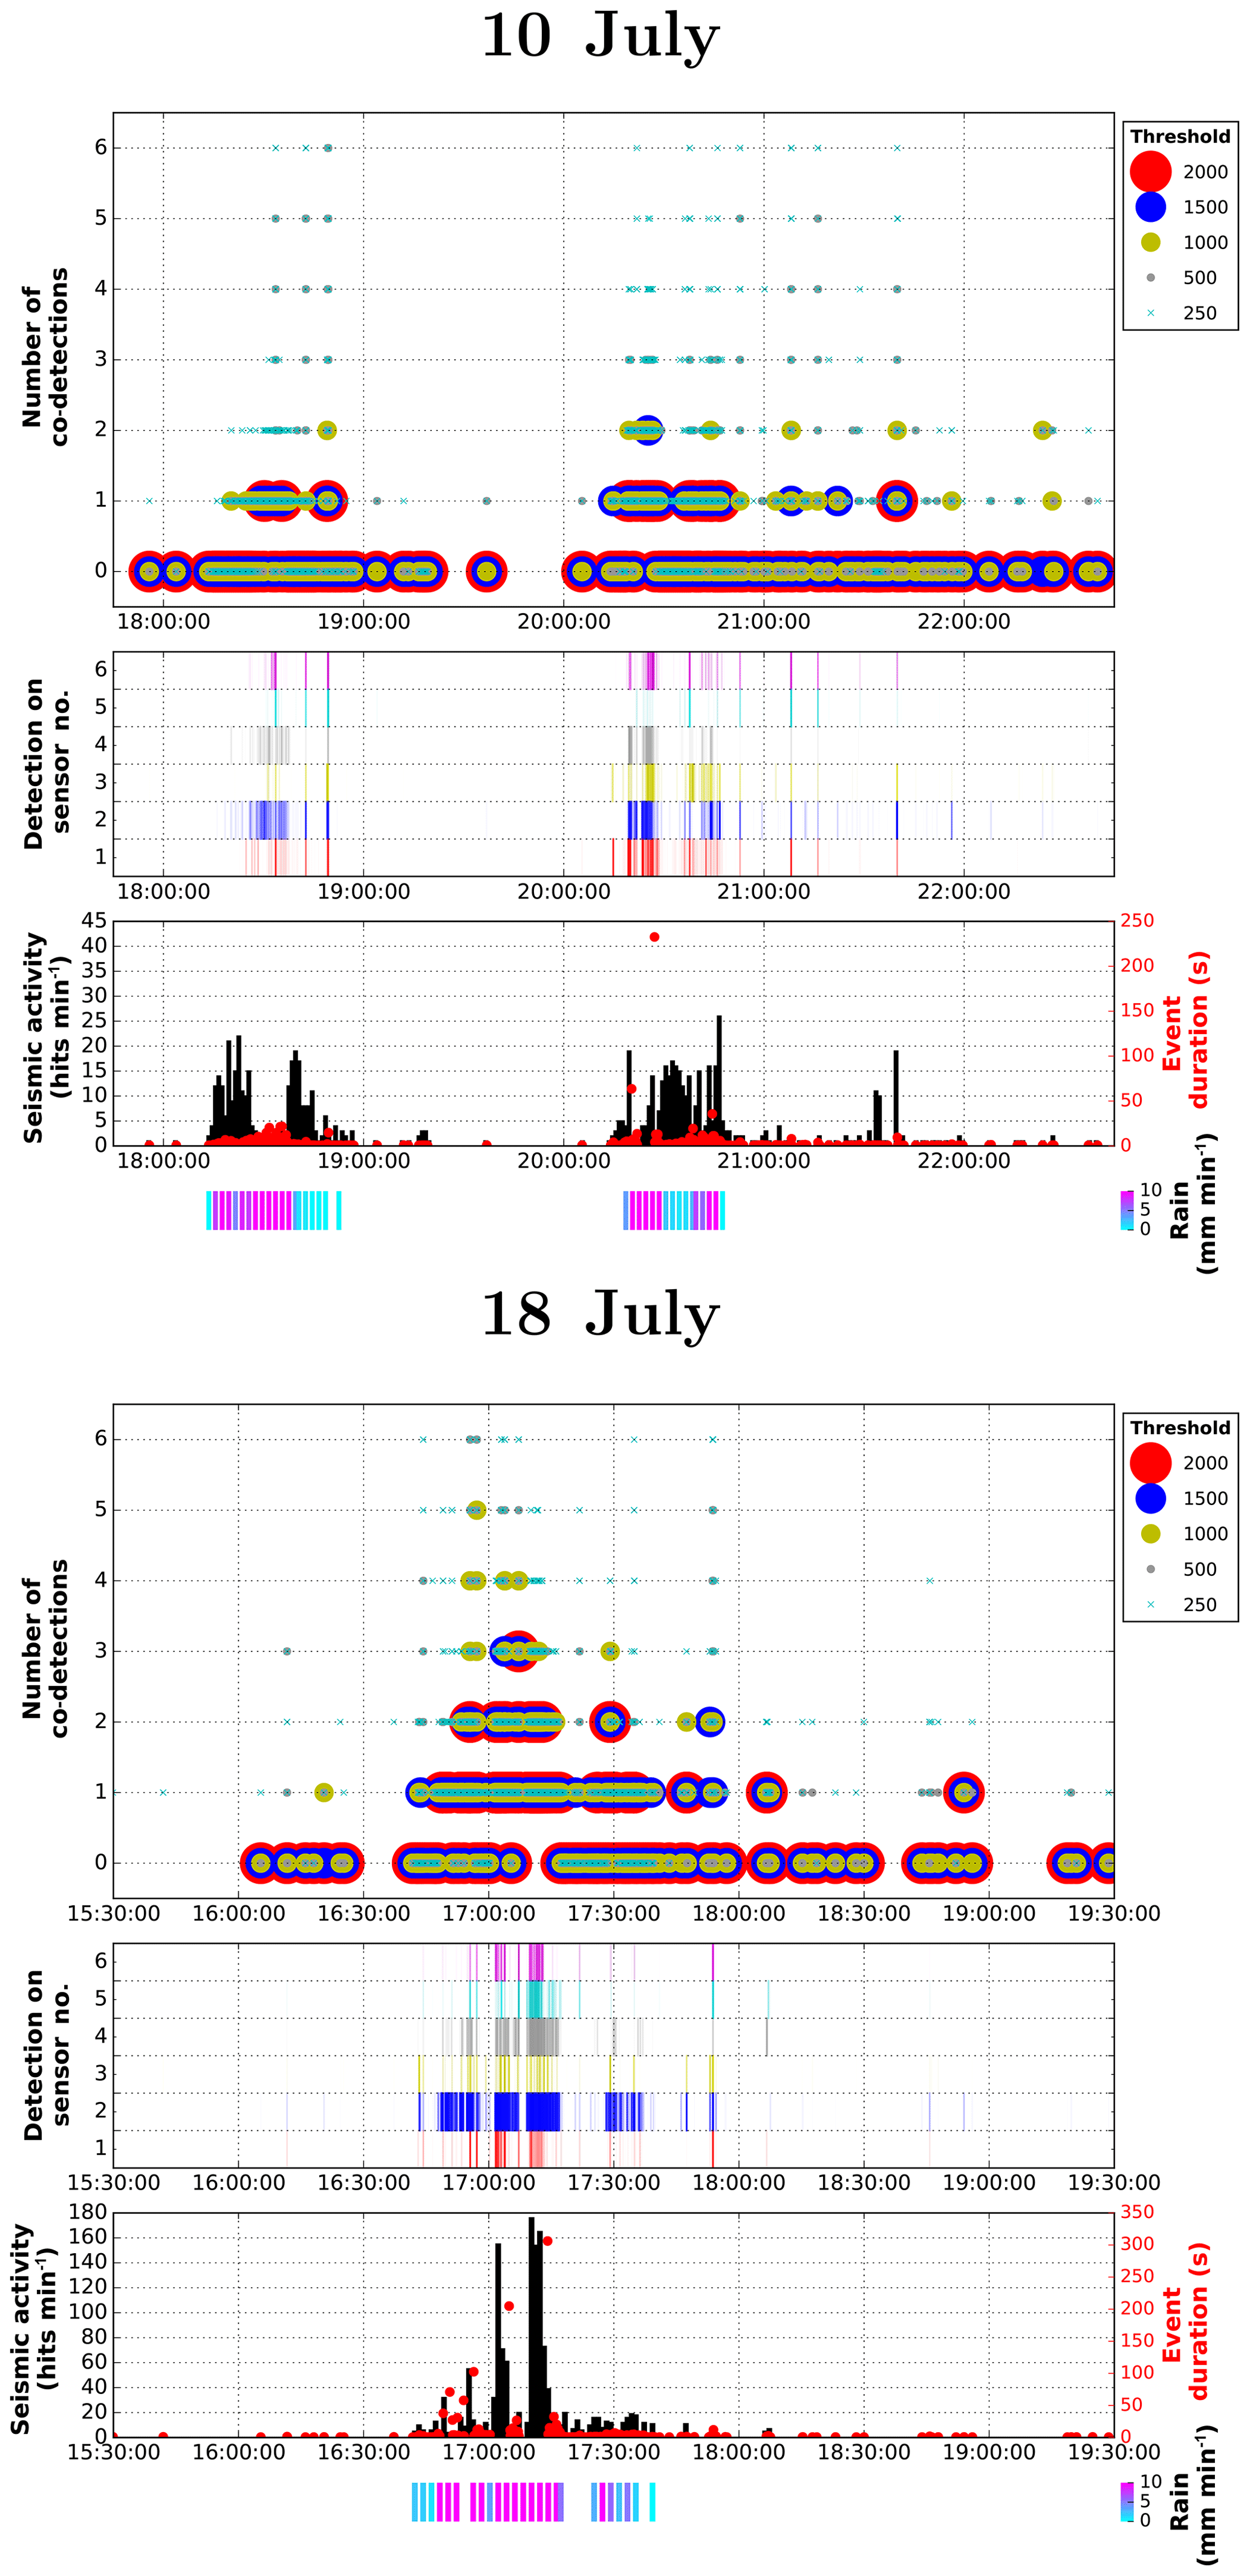
Figure 7Externally driven event (top panel: 10 July; bottom: 18 July): number of co-detections using different thresholds, their associated detecting sensors (same arbitrary unit as in Fig. 4), the corresponding seismic activity (and event duration) and the precipitation record during this period.
Externally driven events were also identified from the webcam images during large rainfalls. The detailed analysis for two typical events is shown in Fig. 7. In such cases, a different seismic activity has been recorded: although the seismic activity is very high, there are only a few co-detections, indicating that such seismic events have low amplitudes. In contrast to internally driven events, no clear precursors can be found (Table 1). Moreover, the analysis of the spectrograms shows a clear difference in the frequency content of these events: whereas an internally driven event exhibits a dominant frequency around 20–40 Hz (highlighted in red in Fig. 8), externally driven events are less energetic, with only a few isolated frequency bands containing substantial energy, apparently linked to each sensor location (Fig. 8).
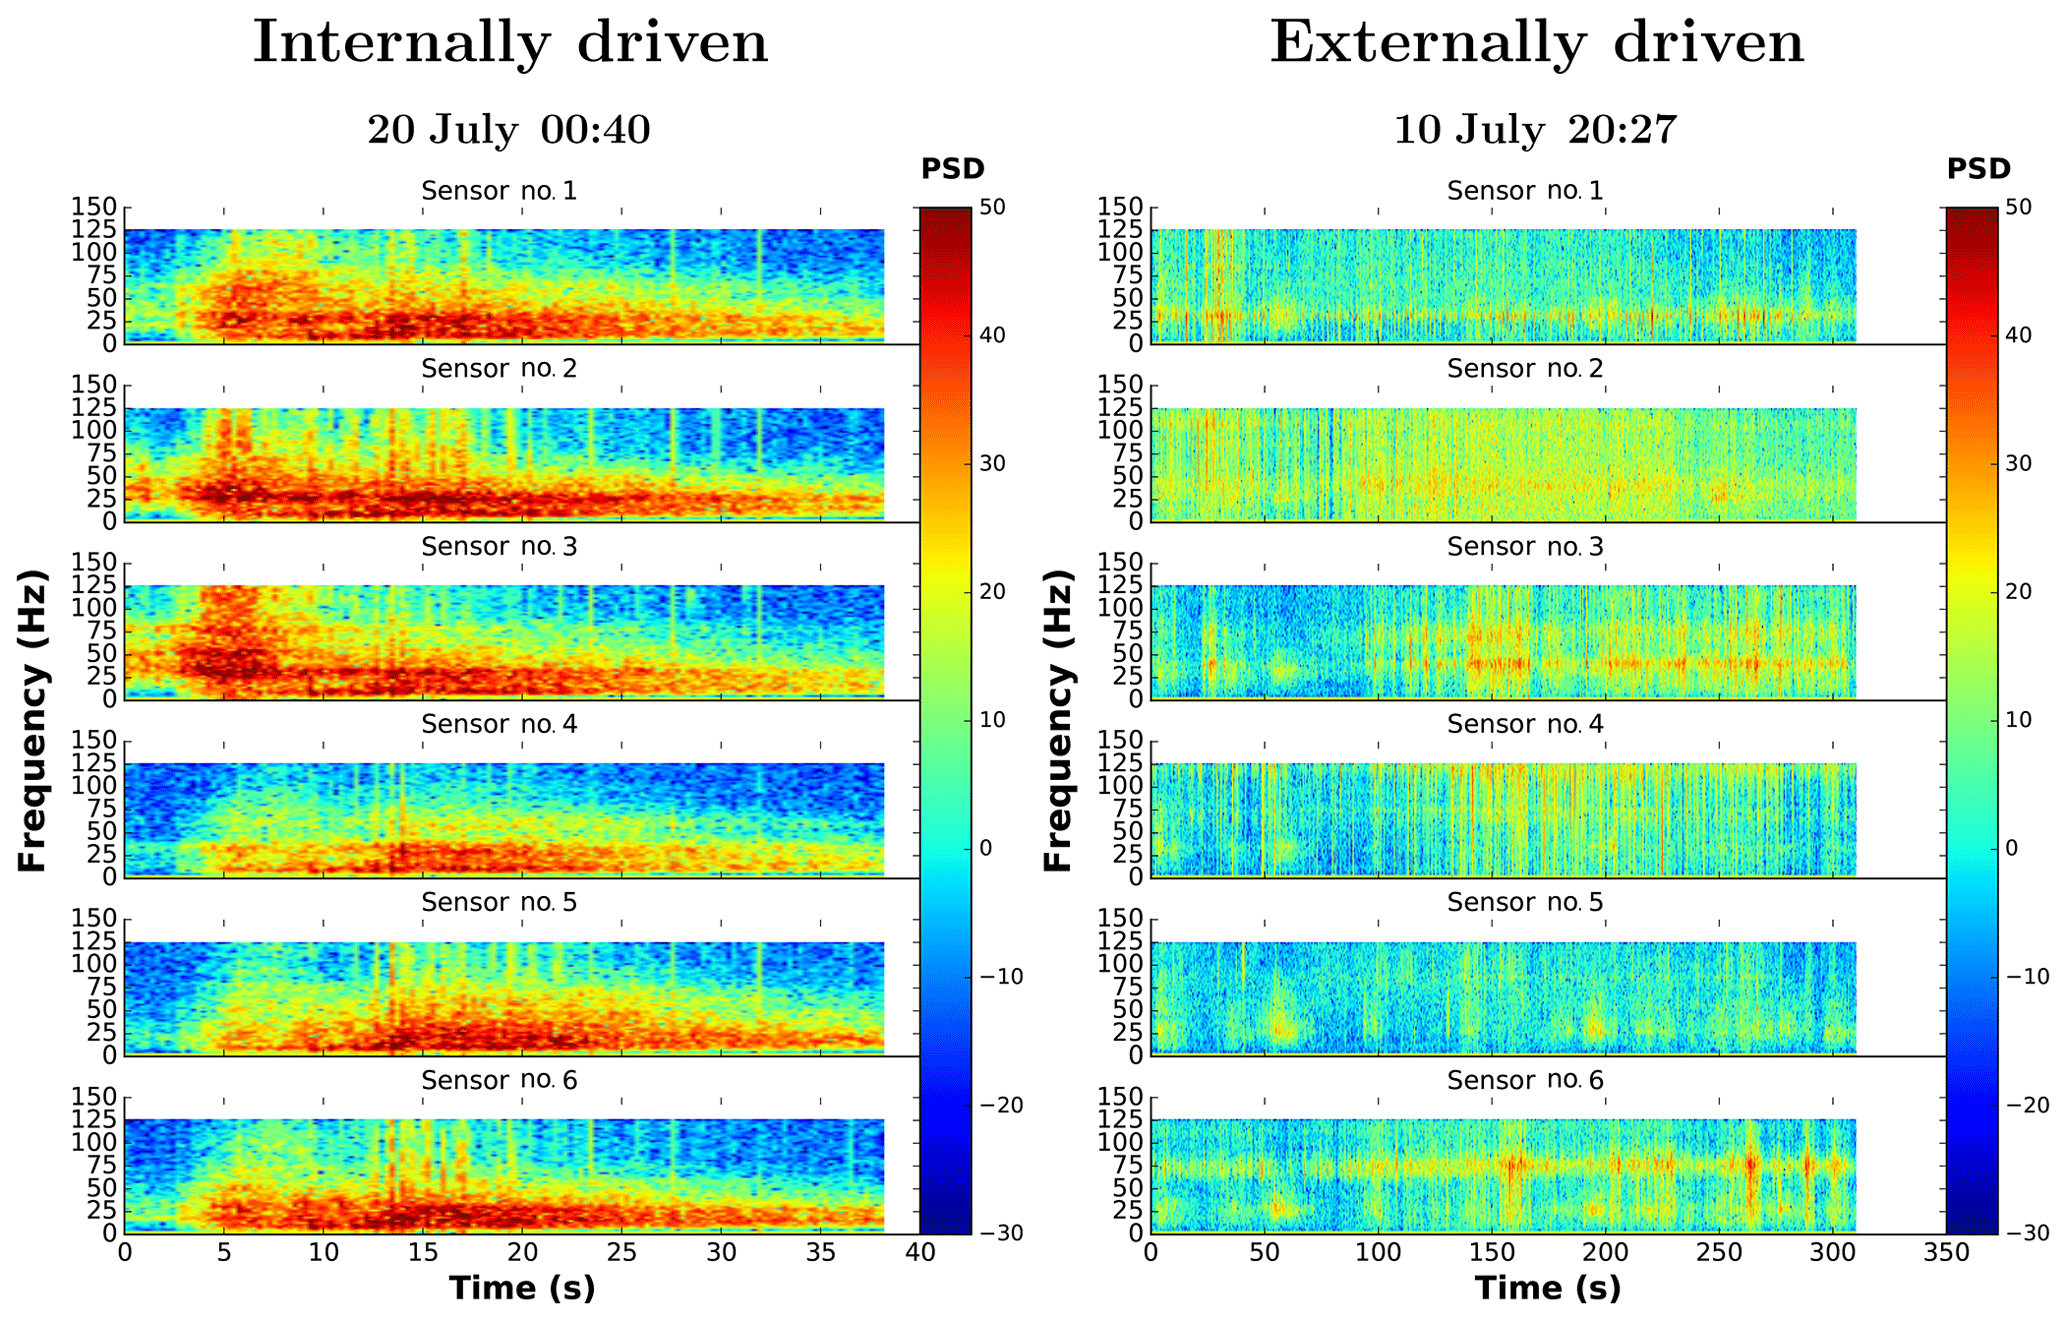
Figure 8Typical power spectral densities (i.e., spectrograms) associated with internally and externally driven events, plotted with the same scale. Frequency domains are colored from red for high power to blue for low power.
Table 1The different types of failure and their associated behavior.
Seismic waves captured by our geophone network system can be produced by the initiation or propagation of internal cracks, by the landslide event itself and also by surface activity, i.e., small rock sliding and rolling on the steep tongue, or rearrangement of the larger blocks located at the surface of the rock glacier. The direct impact of rainfall on the geophone can also create seismic signals (noise), but, as we sheltered the sensors with large stones (Fig. 1), we will excluded this process as a potential source of seismic activity.
However, other types of noise (background/environmental/extraneous) can perturb our analysis. The core of our method is to co-detect seismic signals. By definition, a co-detection only occurs if the signal corresponds to the same source; uncorrelated noise will be naturally filtered out (although each sensor can individually detect noise). Conversely, a large landslide or rockfall occurring far outside our experimental site could, in principle, produce a high number of co-detections: in this case, the micro-cracks' activity resulting from the evolution of internal slope damage is too far away to be detected, whereas the slide will generate co-detected seismic signals (a unique remote extraneous source). However, we did not observe any of these highly unlikely events during this study. Moreover, our analysis is based on the temporal evolution of the number of co-detections, implying that the stationary/constant noise will not perturb our results.
During periods with external forcing (i.e., rainfall, snow melt periods), it appears that seismic activity is rather distributed along all the sensors, indicating a homogeneous distribution of seismic events over the rock glacier (Fig. 4b). Movements in unconsolidated materials (or over a preexisting failure plan) or progressive melting under large superficial blocks is not expected to produce seismic waves. Moreover, such externally driven events appear to be less energetic with longer duration (Fig. 8) than the internally driven events (Figs. 6 and 7). This suggests that the externally driven seismic activity is mainly produced by the sudden rearrangement of the superficial blocks of the rock glacier. As the rock glacier experiences superficial acceleration, the blocks located at the surface can be moved to unstable positions. Rainfall events can then trigger sudden readjustment of superficial blocks, as water lubricates the contacts between the larger blocks and thus reduces friction. Of course, blocks located near to the steepest part of the tongue might also slide and roll, thus explaining the slight increase in seismic activity detected close to the tongue.
Infiltration of liquid water in the rock glacier causes elevated pore pressure, which reduces effective stress and hence shearing resistance, causing slope movement and its possible destabilization. Note that during the short peak velocity that occurred between 10 and 13 August, seismic activity and co-detection numbers stay at a very low level (Fig. 4), indicating aseismic displacement of the glacier. This period also corresponds to the appearance of an active stream at the tongue (see Fig. 2), indicating that the material is fully saturated. Strictly speaking, our system does not record any slope movements but only the resulting seismic activity. If the slope is simply sliding over a soft layered interface, no seismic waves are expected to be generated, resulting in an aseismic behavior. This might be the case here, in a fully saturated rock glacier.
As our co-detection strategy makes it possible to separate externally and internally driven activity, periods, timing and locations of debris release can be quantified and, hence, rough estimates of debris delivery from the tongue can potentially be derived. Such information is needed for debris flow modeling, as the initial volume of unstable debris is a key parameter to model debris flow runout.
We analyzed different landslide-type events based on our new strategy and concurrently analyzed the variations in glacier velocity during this period. In this particular experiment, two internally driven events (on 20 and 21 July) occurred during relative “slow” periods (1–3 cm d−1; see Fig. 4) and a low seismic activity emanating from the tongue. In contrast, the co-detection analysis combining different post-analysis thresholds showed a clear increase before each event, thus indicating that the proposed strategy has for this particular example a better potential application to prediction of failure than seismic activity or even surface displacement. The co-detection method also provides another metric helping experts to assess slope stability, this metric being related to the ongoing destabilization of the rock glacier.
In this pilot study we were able to find precursory signs announcing the impeding failure for small landslides. Moreover, analyzing the spatial distribution of the sensors detecting this precursory seismic activity provides a rough estimate of the location of the potentially unstable zone. In both events shown in Fig. 6, the closest sensors to each event were mostly active prior to failure: sensors 2 and 3 before the 20 July event and sensors 1 and 6 before the 21 July event. The existence of precursors to catastrophic failure highly depends on the nature of the rupture process (Faillettaz and Or, 2015). For ductile-like rupture, a lot of precursors are expected to occur, thus suggesting a high potential for early warning perspectives. In contrast, for brittle-like rupture, even if precursors exist, they are seldom (Faillettaz and Or, 2015). In this case, the ongoing destabilization is expected to be more difficult to detect in advance. However, the proposed method has clear potential to assess the general type of rupture by studying the effect of external forcing (rainfall for example) on the generated seismic activity. As Faillettaz and Or (2015) proposed with their universal global failure criterion (damage-weighted stress), a sudden change in external forcing may directly imply an enhanced production of seismic waves for ductile-like failure. In contrast, for brittle-like failure, the external forcing is not expected to produce any additional seismic activity. Studying the seismic response to a change in the external forcing would then offer a direct characterization of the nature of the rupture at stake on a particular slope. In this way, even if no seismic activity is recorded during a change in external forcing, the system might also provide new insights into the nature of the studied instability. “Listening to silence” in combination with observing external forcing might also be as relevant as capturing seismic events.
To really efficiently assess slope stability, long-term monitoring is needed. As every slope is different (composed of different materials, having different external forcing, etc.), their behavior will differ. Therefore, the instantaneous seismic activity emanating from the slope does not provide conclusive information for stability assessment purposes. Continuous monitoring of the seismic activity over a long period will allow us to establish a reference state, then enabling us to detect potential changes and trends in behavior, and therefore to estimate/assess the state of stability.
We demonstrated that the sudden increase in co-detected events is a good indicator of slope destabilization, providing more insights than seismic activity. However, defining a suitable criterion based on the number of co-detections for assessing slope stability and providing early warning perspectives still needs to be determined. Concurrently analyzing the same set of data (waveforms) using different post-analyzed detection thresholds allows us to better characterize the size and location of the precursory events. However, it is not clear if such analysis is able to determine such a robust threshold criteria for co-detection, the maximum co-detection number, i.e., the number of sensors, being too small (six) to characterize an increase. Moreover, different metrics can be used to define a criterion suitable for early warning. Such criterion could be based on (i) an absolute number of co-detected events which would be easy to be implement in real time, but, as every slope is different, such a criterion might depend on the overall background noise and number and spatial arrangement of the sensors; (ii) the differences in the temporal evolution of co-detections for different detection thresholds; or (iii) the statistics of “record breaking” events, in the same way as in the mean field model of fracture (Danku and Kun, 2014). Records are bursts (i.e., seismic events) which have the largest size since the beginning of the time series; hence their behavior involves extreme values statistics. Danku and Kun (2014) showed that, thanks to such analysis, two regimes of the failure process can be identified, one dominated by the disorder of the material (corresponding to a relative slowdown of the record dynamics) and another dominated by the enhanced triggering of events towards failure (characterized by a temporal acceleration of the record dynamics). Performing such a co-detection analysis would provide a direct way to assess the time of the failure, even if the initial state is not known.
In order to demonstrate the application potential of this simple co-detection strategy for early warning systems to real cases, i.e., at slope scale, we designed and built an experimental system composed of a network of six geophones wired to a central recording unit, thus ensuring a perfect time synchronization between the sensors. This experimental setup was installed and tested on the steep tongue of the Dirru rock glacier, a location where small-scale slope instabilities were highly likely. To our knowledge, this constitutes the first detailed seismic study on a rock glacier. Note that the steep slope is composed of a highly heterogeneous material resulting from a mixture of ice, rock, fine sediment, air and water. In this study, we present the first results and analysis of the seismic activity generated by the steep tongue during summer 2017. Using additional data from a meteorological station and GPS located on the rock glacier, we were able to investigate the relation between seismic activity, surface displacement and external forcing (rainfall, temperature). Using an additional webcam taking images at a time interval of 30 min, we could identify three small-scale failure events (of approximately 10 m3) and analyzed the associated number of co-detected events prior to failure. This detailed analysis allowed us to detect typical patterns of precursory events prior to slide events, demonstrating the potential of this method for real-word applications. Moreover, such a seismic method provides new insights into the rock glacier dynamics, especially into the short-term peaks of velocity in relation to external forcing. Additionally, as this simple strategy filters out the small seismic events (generally produced by externally driven event), only the information relevant for slope stability assessment is delivered and analyzed.
As a next step we propose developing low-cost tightly integrated sensors that can communicate the relevant seismic data in a wireless manner and in real time with a sufficient time synchronization (less than 0.1 s). As the principle of this method is quite general and is virtually applicable to all gravity-driven instabilities, potential applications are numerous, ranging from natural hazard prevention and warning of snow avalanches, rockfall, landslides, debris flow, moraine stability, glacier break-off to glacier lake outburst, etc. Thanks to its simplicity and its robustness, this new strategy would (a) reduce the number of data to be processed (as only the precise detection time is needed, not the waveform), (b) simplify data analysis and thus enable on-site real-time analysis, (c) provide a low-energy monitoring solution and (d) have low production cost. This new system – which tracks the in situ evolution of a potential unstable slope in real time – would provide a simple and complementary alternative to the existing early warning systems.
The GPS, webcam images and meteorological station data are available from http://data.permasense.ch. The seismic data are available at https://doi.org/10.5281/zenodo.3245183 (Faillettaz and Wasser, 2019).
-
Preamplifiers at geophone: micropower precision operational amplifiers (OPAx333 from Texas Instruments) configured as an inverting amplifier with capacitive coupling to Geophone, and pseudo balanced output.
-
Gain (fix): −57
-
High pass (first order): 1.94 Hz
-
Low pass (first order): 720.48 Hz
-
-
Input amplifiers at main board (Peli Case): micropower, precision, zero-drift CMOS operational amplifiers (OPA4330 from TI) configured as differential input amplifiers with capacitive coupling.
-
Gain (fix): 10
-
High pass (first order): 1.59 Hz
-
Low pass (first order): 338.63 Hz
-
-
Filter before ADC (same OPAmps as above):
-
Gain (fix): 2
-
Low pass (third order): 153.92 Hz
-
-
Microcontroller ADC: the AD converter has a resolution of 12 bits. Since the circuit is running on a single supply (3.3 V, referenced to ground), we have introduced a pseudo ground at 1.65 V. In this way, when no geophone signal is recorded, there is 1.65 V at the last filter stage, representing 2048 in the digital domain. The maximal swing is therefore 2048±2047 (ADC values: 0.4095).
JF designed the field experiment. JF prepared the data, performed all the data analysis, and made the figures in Python 3 with input and advice from the other authors. JF prepared the paper with critical revision and final approval from all co-authors.
The authors declare that they have no conflict of interest.
This work was partly supported by the project Xsense II funded by nano-tera.ch. The authors thank Diego Wasser for handling the technical development of this pilot field experiment and Reynald Delaloye (University of Fribourg, Switzerland) for providing the webcam images. We further acknowledge Tonio Gsell, Samuel Weber, Vanessa Wirz and Alessandro Cicoira for their support in the setup and running of the GPS devices and meteorological station in the field.
This paper was edited by Thomas Glade and reviewed by two anonymous referees.
Amitrano, D., Grasso, J. R., and Senfaute, G.: Seismic precursory patterns before a cliff collapse and critical point phenomena, Geophys. Res. Lett., 32, L08314, https://doi.org/10.1029/2004GL022270, 2005. a
Chae, B.-G., Park, H.-J., Catani, F., Simoni, A., and Berti, M.: Landslide prediction, monitoring and early warning: a concise review of state-of-the-art, Geosci. J., 21, 1033–1070, https://doi.org/10.1007/s12303-017-0034-4, 2017. a, b
Danku, Z. and Kun, F.: Record breaking bursts in a fiber bundle model of creep rupture, Front. Phys., 2, 8, https://doi.org/10.3389/fphy.2014.00008, 2014. a, b
Delaloye, R., Lambiel, C., and Gärtner-Roer, I.: Overview of rock glacier kinematics research in the Swiss Alps, Geogr. Helv., 65, 135–145, https://doi.org/10.5194/gh-65-135-2010, 2010. a, b
Delaloye, R., Morard, S., Barboux, C., Abbet, D., Gruber, V., Riedo, M., and Gachet, S.: Rapidly moving rock glaciers in Mattertal, Mattertal – ein Tal in Bewegung, edited by: Graf, C., Publikation zur Jahrestagung der Schweizerischen Geomorphologischen Gesellschaft, 29, 21–31, 2013. a, b
Dixon, N. and Spriggs, M.: Quantification of slope displacement rates using acoustic emission monitoring, Can. Geotech. J., 44, 966–976, 2007. a
Dixon, N., Hill, R., and Kavanagh, J.: Acoustic emission monitoring of slope instability: development of an active waveguide system, ICE – Geotech. Eng., 156, 83–95, https://doi.org/10.1680/geng.2003.156.2.83, 2003. a
Faillettaz, J. and Or, D.: Failure criterion for materials with spatially correlated mechanical properties, Phys. Rev. E, 91, 032134, https://doi.org/10.1103/PhysRevE.91.032134, 2015. a, b, c, d
Faillettaz, J. and Wasser, D.: Seismic data (ASCII), Zenodo, https://doi.org/10.5281/zenodo.3245183, 2019. a
Faillettaz, J., Funk, M., and Sornette, D.: Icequakes coupled with surface displacements for predicting glacier break-off, J. Glaciol., 57, 453–460, https://doi.org/10.3189/002214311796905668, 2011. a
Faillettaz, J., Or, D., and Reiweger, I.: Codetection of acoustic emissions during failure of heterogeneous media: New perspectives for natural hazard early warning, Geophys. Res. Lett., 43, 1075–1083, https://doi.org/10.1002/2015GL067435, 2016. a, b, c
Gill, J. C. and Malamud, B. D.: Reviewing and visualizing the interactions of natural hazards, Rev. Geophys., 52, 680–722, https://doi.org/10.1002/2013RG000445, 2014. a
Gruber, S., Hoelzle, M., and Haeberli, W.: Permafrost thaw and destabilization of Alpine rock walls in the hot summer of 2003, Geophys. Res. Lett., 31, L13504, https://doi.org/10.1029/2004GL020051, 2004. a
Kolesnikov, Y. I., Nemirovich-Danchenko, M. M., Goldin, S. V., and Seleznev, V. S.: Slope stability monitoring from microseismic field using polarization methodology, Nat. Hazards Earth Syst., 3, 515–521, https://doi.org/10.5194/nhess-3-515-2003, 2003. a
Lacasse, S., Nadim, F., Lacasse, S., and Nadim, F.: Landslide Risk Assessment and Mitigation Strategy, Springer, Berlin, Heidelberg, 31–61, https://doi.org/10.1007/978-3-540-69970-5_3,, 2009. a
Michlmayr, G., Cohen, D., and Or, D.: Sources and characteristics of acoustic emissions from mechanically stressed geologic granular media – A review, Earth-Sci. Rev., 112, 97–114, https://doi.org/10.1016/j.earscirev.2012.02.009, 2012. a
Pecoraro, G., Calvello, M., and Piciullo, L.: Monitoring strategies for local landslide early warning systems, Landslides, 16, 213–231, https://doi.org/10.1007/s10346-018-1068-z, 2019. a
Petley, D.: Global patterns of loss of life from landslides, Geology, 40, 927–930, https://doi.org/10.1130/G33217.1, 2012. a
Petley, D. N., Dunning, S. A., Rosser, N. J., and Hungr, O.: The analysis of global landslide risk through the creation of a database of worldwide landslide fatalities, in: Landslide risk management, Balkema, Amsterdam, 367–374, 2005. a
Reiweger, I., Mayer, K., Steiner, K., Dual, J., and Schweizer, J.: Measuring and localizing acoustic emission events in snow prior to fracture, Cold Reg. Sci. Technol., 110, 160–169, https://doi.org/10.1016/j.coldregions.2014.12.002, 2015. a
Sidle, R. C. and Ochiai, H.: Landslides: processes, prediction, and land use, in: vol. 18, American Geophysical Union, Washington, 2006. a
Stähli, M., Sättele, M., Huggel, C., McArdell, B. W., Lehmann, P., Van Herwijnen, A., Berne, A., Schleiss, M., Ferrari, A., Kos, A., Or, D., and Springman, S. M.: Monitoring and prediction in early warning systems for rapid mass movements, Nat. Hazards Earth Sys., 15, 905–917, https://doi.org/10.5194/nhess-15-905-2015, 2015. a
Van Herwijnen, A. and Schweizer, J.: Seismic sensor array for monitoring an avalanche start zone: design, deployment and preliminary results, J. Glaciol., 57, 267–276, https://doi.org/10.3189/002214311796405933, 2011. a
Wirz, V., Beutel, J., Buchli, B., Gruber, S., and Limpach, P.: Temporal characteristics of different cryosphere-related slope movements in high mountains, in: Landslide Science and Practice, Springer, Berlin, Heidelberg, 383–390, https://doi.org/10.1007/978-3-642-31337-0_49, 2013. a
Wirz, V., Geertsema, M., Gruber, S., and Purves, R. S.: Temporal variability of diverse mountain permafrost slope movements derived from multi-year daily GPS data, Mattertal, Switzerland, Landslides, 13, 67–83, https://doi.org/10.1007/s10346-014-0544-3, 2016a. a, b, c
Wirz, V., Gruber, S., Purves, R. S., Beutel, J., Gärtner-Roer, I., Gubler, S., and Vieli, A.: Short-term velocity variations at three rock glaciers and their relationship with meteorological conditions, Earth Surf. Dynam., 4, 103–123, https://doi.org/10.5194/esurf-4-103-2016, 2016b. a, b, c, d