the Creative Commons Attribution 4.0 License.
the Creative Commons Attribution 4.0 License.
 | 14 Jan 2019
Atmospheric conditions of extreme precipitation events in western Turkey for the period 2006–2015
Bulent Oktay Akkoyunlu
Hakki Baltaci
Mete Tayanc
This paper investigates the precipitation types and background physical mechanisms of extreme precipitation events (EPEs) over western Turkey during the period 2006–2015. The EPEs are described as the precipitation values above the 90th percentile obtained from the hourly precipitation dataset, which has high spatial resolution. Precipitation types associated with EPEs are identified by using radar outputs and the Lamb weather type (LWT) approach. It is found that EPEs occurred more frequently in the Marmara and Aegean regions during autumn and winter months. In Marmara, mainly 21 %, 17 %, and 15 % of total autumn EPEs show convective, cyclonic, and sea-effect precipitation characteristics, respectively. While convective EPEs are seen more commonly in the southern portions, cyclonic and sea-effect-originated EPEs mainly affect the southwest and northeastern parts of Marmara. Among these three precipitation types, convective mechanisms generally produce more intense daily precipitation (66.1 mm on average) in the Marmara Region under the proper synoptic conditions (high-pressure center over the Balkan Peninsula and low-pressure center over the eastern Mediterranean). Based on the hourly observations, convective types of extreme precipitation (EP) show two peak values during afternoon and evening times of the day and are linked to diurnal heating. In terms of the Aegean Region, cyclone-originated EP, which includes 65 % of the total winter EPEs, is more common in the whole territory and reaches its peak value during the early hours of the day.
- Article
(7086 KB) - Full-text XML
- BibTeX
- EndNote


The occurrence of extreme precipitation events (EPEs) and background physical mechanisms triggering these episodes became a fundamental issue in the last decade due to its great impacts on agriculture, health, energy, and tourism. From this perspective, many researchers first identified the EPEs by applying fixed (e.g., Brooks and Stensrud, 2000; Ralph and Dettinger, 2012; Hitchens et al., 2012, 2013) or percentile-based precipitation thresholds (e.g., Piccarreta et al., 2013; Krichak et al., 2014) to the daily precipitation. In the later studies, the main atmospheric systems that cause extreme precipitation (EP) were investigated in detail by focusing on the role of large-scale (e.g., Madden–Julian oscillation – MJO, ENSO, PDO) (Jones, 2000; Higgins et al., 2000; DeFlorio et al., 2013) or the synoptic-scale circulations for the selected regions in the US (Schumacher and Johnson, 2006; Warner et al., 2012; Moore et al., 2015). Afterwards, the characteristics of the EPEs were defined by using radar (Moore et al., 2015), outgoing longwave radiation (Carvalho et al., 2002), or horizontal temperature advection data (Milrad et al., 2010).
Owing to the spatial complexity, rugged topography, and land–sea interactions of the Mediterranean Basin, many devastating flash floods occurred in various parts of the region in the last decade. Therefore, researchers have analyzed the atmospheric conditions that cause these extraordinary events by focusing on these selected flood days (e.g., Ferretti et al., 2000; Nuissier et al., 2008; Pastor et al., 2010). Only a few researchers analyzed the climatological and general synoptic behaviors of the EPEs for this large territory (Ricard et al., 2012; Reale and Lionello, 2013).
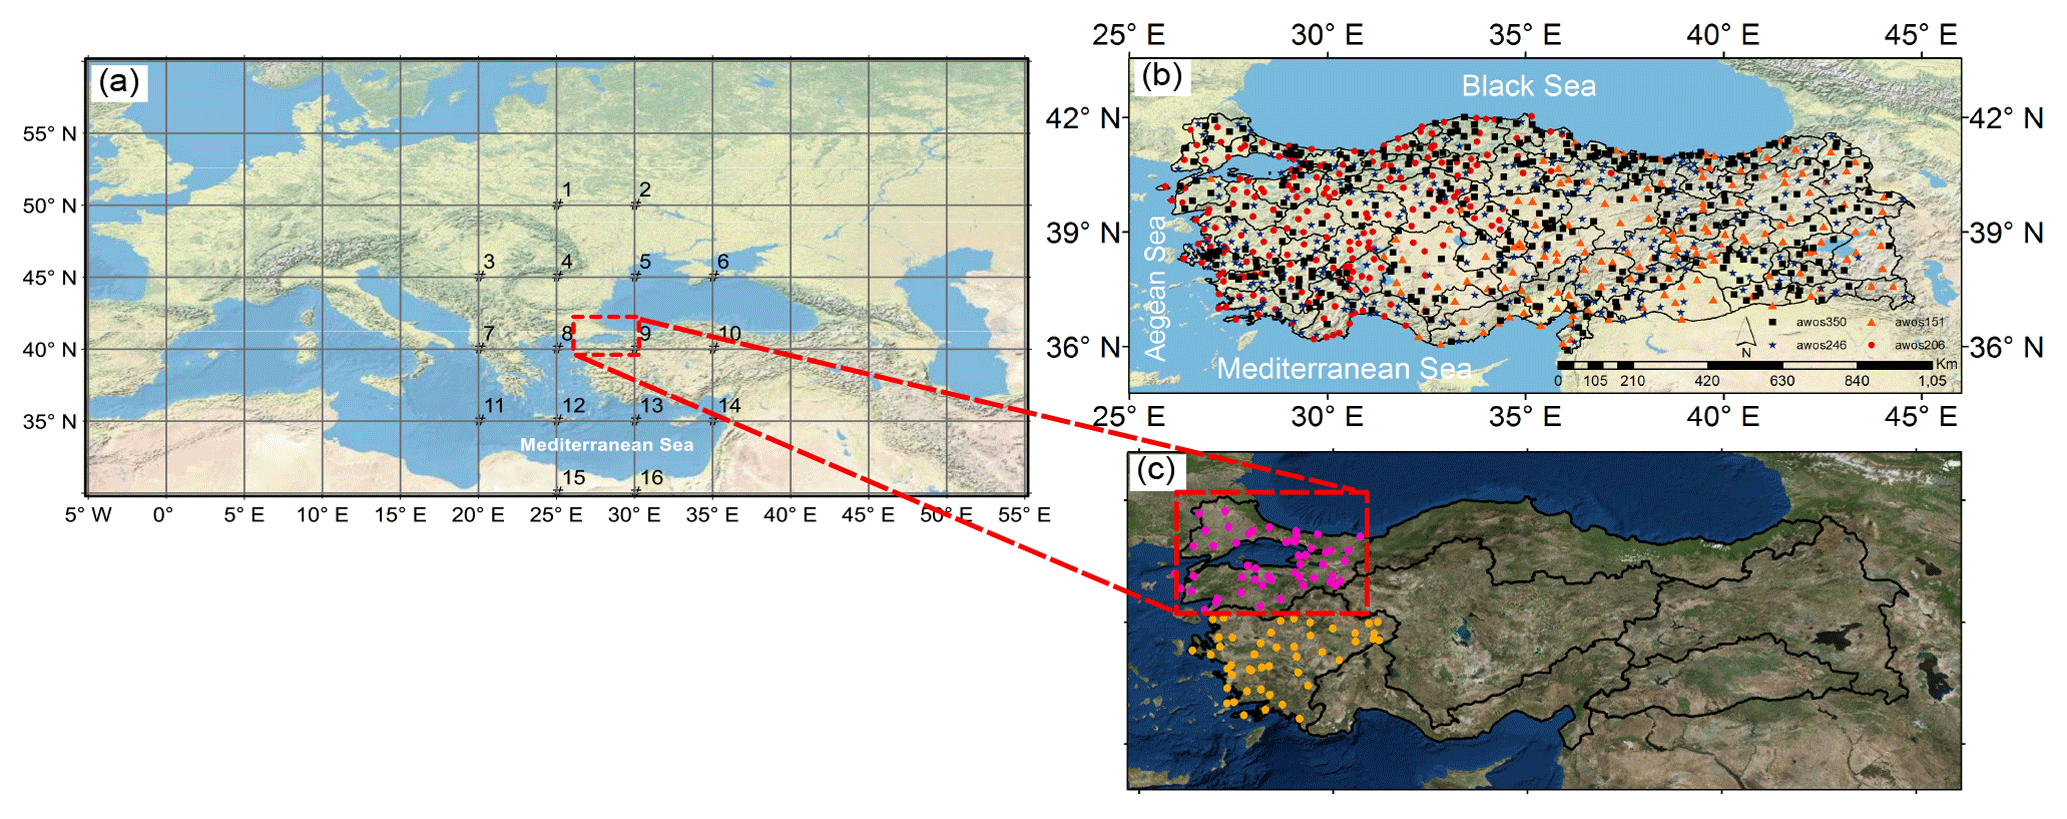
Figure 1(a) The 16 mean sea level pressure (MSLP) grid points used in the Lamb weather type analysis. The dashed rectangle covers the Marmara Region. (b) The distribution of a total of 953 automatic weather observing systems (AWOSs) over Turkey depending on the four projects (AWOS 206, 151, 246, and 350), and (c) the locations of the 51 (pink points) and 46 (light brown points) AWOS stations, at the Marmara and Aegean regions, respectively. Hourly precipitation data of these 97 stations were provided by the Turkish State Meteorological Service (TSMS) for the period of 2006–2015.
Turkey is located in the East Mediterranean, and EPEs there, in general, cause sudden flash floods resulting in deaths and economic losses in infrastructure and agriculture. As a result of the EPEs in the last decade, numerous flash floods and landslides occurred in some particular regions of Turkey. During September 2009, Ayamama creek in Istanbul (NW Turkey, most populated city in Europe) overflowed as a consequence of the dense daily precipitation episodes, which produced more than 250 mm of rainfall over 3 days, causing 32 people to die along with millions of dollars in economic losses (Kömüşçü and Çelik, 2013). On 9 October 2011, 238 mm of total rainfall was measured during a 6 h time period at the province of Antalya (in the south of Turkey), which damaged the infrastructure of the tourism center of the country (Demirtaş, 2016). During August 2015, torrential rainfalls caused a devastating landslide in the Hopa district (NE Turkey, slopy domain of the country), and 11 people died during this natural hazard (Baltaci, 2017). Turkey and its sub-basins are mainly influenced by these EPEs in all seasons in a variety of the atmospheric conditions such as baroclinic waves and cyclones, mesoscale convective systems, land–sea interactions, and orographic forcing.
In the literature, numerous studies investigated the influence of large-scale circulation patterns or synoptic weather types on precipitation mechanisms over Turkey and its subregions (Karabörk and Kahya, 2003; Karabörk et al., 2005; Unal et al., 2012; Baltacı et al., 2015, 2017). Only a limited number of these studies explored the atmospheric conditions that caused extreme precipitation over Turkey for a set of selected episodes (Kömüşçü et al., 1998; Kömüşçü and Çelik, 2013; Demirtaş, 2016). Although a number of prior studies have focused on the synoptic characteristics of the EPEs ending with life or economic losses over Turkey, environmental characteristics of these EPEs and underlying causes were not studied in detail. To overcome this deficit, we identified the types of the EP, which are taken from 10-year (2006–2015) high-resolution precipitation datasets, by using the Lamb weather type (LWT) approach (Fig. 1a) and radar outputs in western Turkey. Therefore, the goal of this study is to document the spatiotemporal and environmental characteristics of the EPEs and investigate the synoptic-scale patterns associated with EPEs.
In Sect. 2, the precipitation characteristics of EPEs, along with the data and methods used, are described. Results of the EPEs and the related discussion are presented in Sect. 3. The last part, Sect. 4, is devoted to the summary and conclusions.
2.1 Precipitation dataset
Values of meteorological parameters in Turkey had been recorded manually from the late 1920s to the beginning of the 21st century. After the year 2003, starting from the western regions, existing meteorological stations were replaced by automatic ones (automatic weather observing systems, AWOSs), and uncultivated land was also covered with AWOS stations by the support obtained from large projects. These projects can be explained in the four parts as follows:
-
AWOS 206: excessive rainfalls on 21–25 May 1998, which also triggered landslides, resulted in many flash floods over the western Black Sea Region of Turkey. In order to eliminate damage that originates from floods, the TEFER project (Turkey Emergency Flood and Earthquake Recovery) was introduced, which was financially supported by the International Public Works and Development Bank (World Bank) with a fund of USD 369 million, to strengthen the emergency early warning systems in the west of Turkey. As a part of this project, a total of 206 AWOS stations were started and became operational during 2003 and 2004 (red points in Fig. 1a). With this project, 120 classical meteorology stations were replaced by the new automated ones, and an additional 86 AWOS stations were installed into new areas.
-
AWOS 151: after the setup of 206 AWOS stations, an extra 151 AWOS stations were installed in the central and eastern parts of Turkey during 2009 (brown triangles in Fig. 1a). Out of the 151, 120 manual meteorology stations were transformed into new tech ones, and the remaining 31 were located in the uncultivated areas of the country.
-
AWOS 246: to expand the spatial density of the meteorological stations, 246 new AWOS stations started to be used in the following years. The 246 stations aimed to cover new districts which did not have any active meteorological stations before (blue stars in Fig. 1b).
-
AWOS 350: later, due to the high topographical differences of the country, 350 new automated meteorology stations were mainly located at the higher elevation points and started to operate from 2016 (black squares in Fig. 1b).
In our study, for the first time, we aimed to obtain the atmospheric conditions of EPEs in Turkey with high resolution and coverage. Therefore, we have chosen a long-term hourly precipitation dataset of the AWOS stations. For this reason, hourly precipitation records of 206 AWOS stations were selected for the investigation of the environmental characteristics of EPEs. Firstly, daily total precipitation amounts (00:00–24:00 UTC) were calculated from hourly precipitation records. Quality control of data was done by the RCLIMDEX method which was explained by Zhang and Yang (2004) and Baltacı et al. (2018). The years which had more than 10 % missing data per day and stations that were subjected to relocation were eliminated from the study. As a consequence of the quality control and assurance of precipitation data in the period 2006–2015, we selected 97 stations densely located in the west of Turkey (Fig. 1c). From the 97, 51 stations are located in the Marmara (NW Turkey, pink points), and 46 are located in the Aegean (W Turkey, light brown points) regions of Turkey.
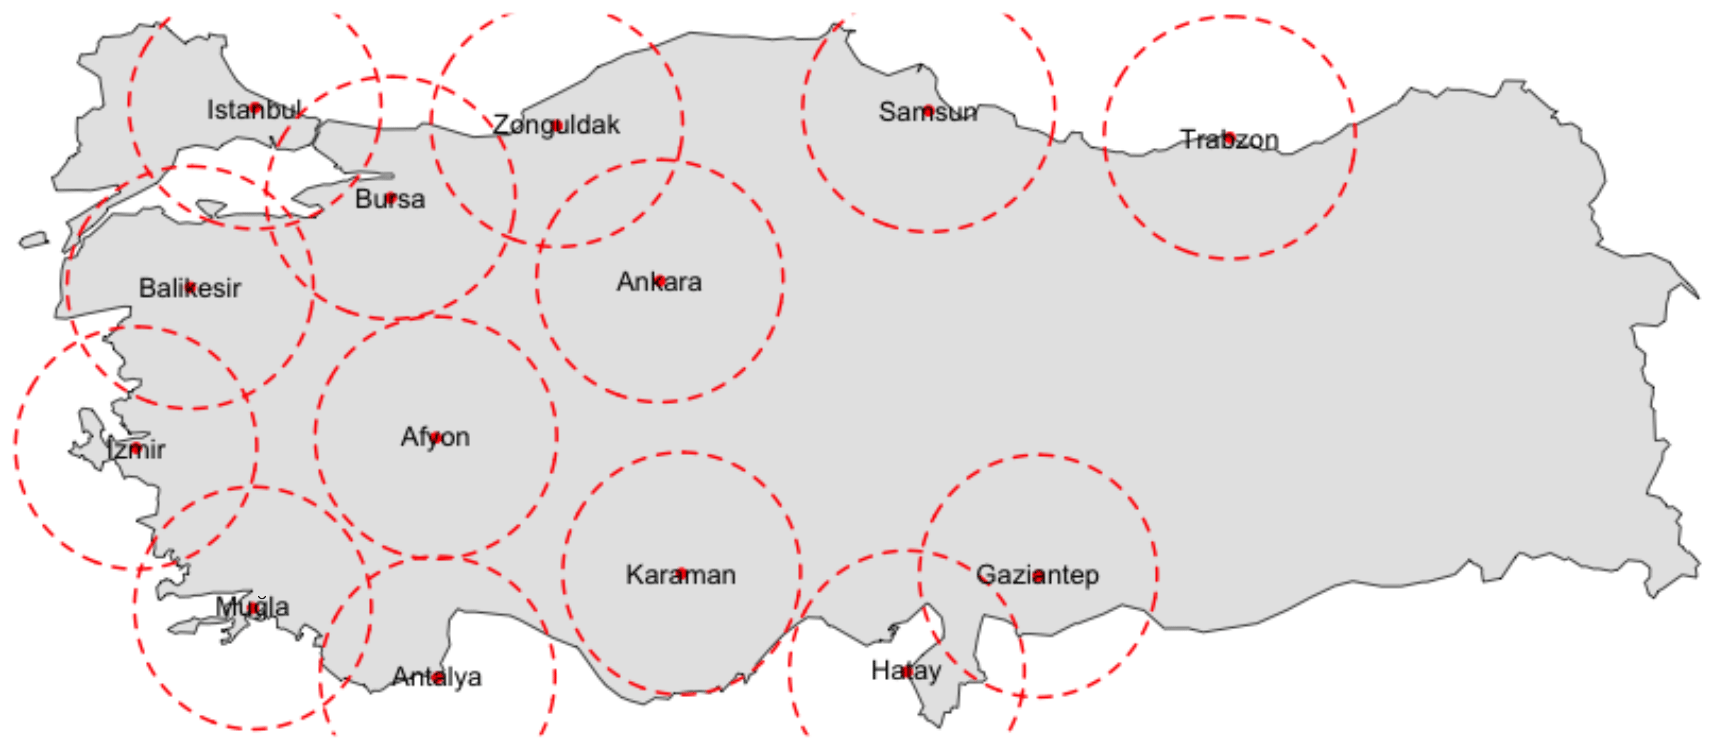
Figure 2The distribution of 14 radar networks over Turkey. Precipitation products of six radars (Istanbul, Bursa, Balikesir, İzmir, Muǧla, and Afyon), which were taken from the TSMS, were evaluated manually to describe the characteristics of the precipitation types.
Climatic characteristics of the Marmara and Aegean regions
The Marmara Region is located in the northwest of Turkey, between latitudes 29 and 32∘ N and longitudes 38 and 42∘ E, and covers an area of 67 000 km2. Marmara has different climatic characteristics within its region. While inland areas have a temperate continental climate, the milder climate of places on the Black Sea coast resembles more of an oceanic climate, typical to other areas of Turkish Black Sea coast. The coasts in the Marmara and Aegean parts have a Mediterranean (Med) climate, and this region is the second smallest Turkish region in size after the Southeastern Anatolia Region. Only the southern and eastern parts of the region are more mountainous.
In terms of the Aegean, this region has a Med climate with a mean annual precipitation changing from 450 to 1200 mm yr−1 (Asikoglu and Benzeden, 2014). Although climatic behavior of the Aegean is similar to the Med climate, there are obvious differences in landscape. Unlike the more parallel mountains found along the Med, the Aegean mountains often cut directly into the sea.
2.2 Radar data over Turkey
The first meteorology radar over Turkey was installed in Ankara for nowcasting purposes during the year of 2000 (Fig. 2). Afterwards, Istanbul, Zonguldak, and Balikesir radars were installed during 2003 by the TEFER project. Later, to detect EPEs that can be effective over the Mediterranean and Black seas, another six C-band radars were setup in the İzmir, Muǧla, Antalya, Hatay, Samsun, and Trabzon cities during 2007. Due to the forecast difficulties of convective precipitation by the numerical weather prediction models, another four C band radars (Bursa, Afyon, Karaman, and Gaziantep) were located in the inner parts of the country during 2013. From the network of these 14 radar stations, we used Istanbul, Zonguldak, Ankara, and Balikesir radar 8 min PPI (plan position indicator) and Max products, which are provided by the Turkish State Meteorological Service (TSMS) to check the characteristics of EPEs (cyclonic, convective, or sea effect originated) in combination with LWT classification (e.g., Hellström, 2003; Burt and Ferranti, 2012; Moore et al., 2015). Additionally, data of the other radars, İzmir and Muǧla, were analyzed in the study from the beginning of 2007, and data of Bursa and Afyon from the year of 2013.
2.3 Lamb weather type (LWT) methodology
The subjective version of Lamb's work (Lamb, 1972) was first developed as an objective version by Jenkinson and Collison (1977) and refined by Jones et al. (1993) to indicate the circulation types (CTs) influencing the British Isles. According to the objective methodology, vorticity and directions of the geostrophic flows are calculated using sea level pressure (SLP) fields over a predetermined central point. As a consequence of the six parameters and certain thresholds for the defined region, a total of 27 different CT types were defined (16 hybrid, 8 directional, 1 cyclonic, 1 anticyclonic, and 1 unclassified). In this study, we used daily mean SLP values on 16 grid points (between 5∘ W–55∘ E and 30–60∘ N, Fig. 1a), centered over the Marmara Region and separated by 5∘ from each other. The six parameters, namely the westerly flow (WF), southerly flow (SF), resultant flow (FF), westerly shear vorticity (WSV), southerly shear vorticity (SSV), and total shear vorticity (Z) are computed as follows:
where pi is the daily mean SLP at grid point i (Fig. 1a). Finally, classification of CTs is done according to the following criteria:
-
Directional type (N, NE, E, SE, S, SW, W, NW) is found by tan−1 (WF∕SF) and adding 180∘ to the final value if WF is positive. A value of 45∘ is allocated for each sector.
-
If < FF, CT is one of the eight pure directional types listed above.
-
If FF, the CT is either cyclonic or anticyclonic.
-
If FF < FF, the CT is one of the 16 hybrid types: a combination of directional and vorticity types.
-
If or FF < 6, then the CT is “unclassified”.
For the Aegean Region, the equations based on six circulation parameters for Marmara were also recalculated by using a different 16 grid points (centered over the Aegean) and coefficients (due to latitudinal difference).
2.4 Identification of EPEs and precipitation characteristics
An extreme precipitation event is generally defined as a daily amount exceeding a certain threshold (e.g., Brooks and Stensrud, 2000; Ralph and Dettinger, 2012; Hitchens et al., 2012, 2013). For example, Karl et al. (1996) used 50.8 mm to define extreme precipitation events for the United States. For our country, this and other threshold limits were not suitable because of the large topographical difference and irregularity of the precipitation distribution. For this reason, similar to the previous studies (e.g., Jones, 2000; Zhang et al., 2001; Piccarreta et al., 2013; Krichak et al., 2014), we chose a methodology that defines the threshold levels of each station according to its own precipitation characteristics. Thus, this relative technique is based on considering the largest 10 % of the daily precipitation amounts for each station separately as its own extreme. Then, the annual contribution of EP for each station is determined by a standardized total that is the division of the cumulative totals of EP for each station by 10.

Figure 3(a) The map shows the threshold values (in mm) of the stations during 2006–2015 when precipitation exceeded the 90th percentile generating an EPE. (b) The contribution of the total EP of a station to its annual mean precipitation (mm).
We defined EPE types by using the LWT technique and the radar outputs. With the LWT technique, basic airflow coming from the sea and generating extreme precipitation is defined as sea-effect precipitation. The cyclones, which generate severe precipitation over a defined region, are also characterized with cyclonic EPEs. We identified the convective EPEs as the precipitation bands coming from the terrestrial areas. As a result of these definitions, EPEs having northerly (N) and northeasterly (NE) CTs for the Marmara Region were considered to have a Black Sea effect. For the sea-effect EPEs over the Aegean, westerly (W) and southwesterly (SW) CTs were selected. For the convective EPEs, easterly (E), southeasterly (SE), and southerly (S) CTs for Marmara and E and SE types for the Aegean were chosen. In terms of cyclonic (C) EPEs, a low-pressure center over the Marmara and Aegean regions was selected as a cyclonic CT in accordance to LWT methodology.
The physical mechanisms behind the EP were investigated by using NCEP/NCAR Reanalysis products (Kalnay et al., 1996). For this purpose, sea level pressure and temperature data of 850 hPa were examined on a 2.5∘ × 2.5∘ grid resolution of the reanalysis data. For the sea surface temperature (SST) distribution over the neighboring sea areas around Turkey, NOAA High Resolution SST data provided by the NOAA, OAR, and ESRL PSD, Boulder, CO, USA, from their website at http://www.esrl.noaa.gov/psd (last access: 1 August 2017) (Reynolds et al., 2007) were used in the study.
3.1 Spatial variation of EPEs in western Turkey
For the first time, different daily precipitation threshold limits of 97 stations were constructed from a 10-year dataset (Fig. 3a). According to the results, the highest daily precipitation rates exceeding 100 mm are observed in the southern Aegean Region where it can be classified as “rich” in terms of extreme amounts of precipitation. This suggests that if the daily precipitation amount of a station located in the South Aegean exceeds this limit, that day is recorded as an EPE for that station. A daily precipitation threshold ranging from 60 to 100 mm is shown to be mainly located on the coastal regions in the west of Turkey. When one moves towards interior continental areas, the daily EP threshold decreases from 60 to 20 mm. The lowest limits are observed in the semi-arid continental areas of the Aegean and Marmara regions, having threshold values lower than 40 mm, as illustrated in blue in Fig. 3a and can be classified as “poor” in terms of extreme amounts of precipitation.
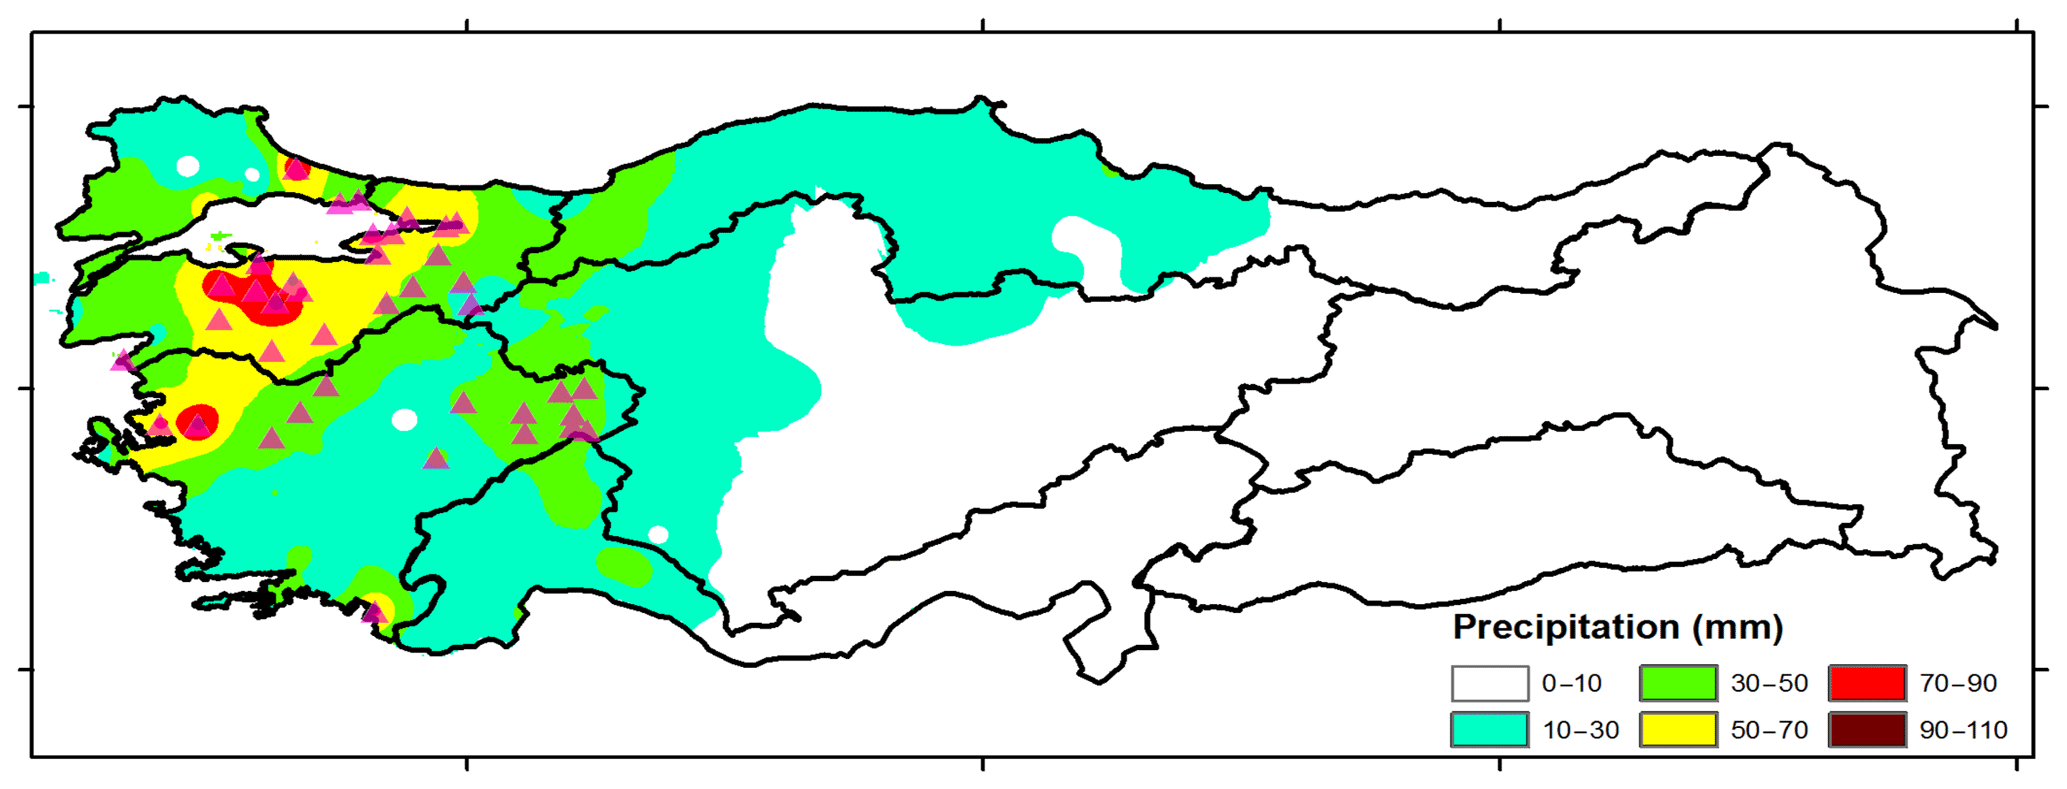
Figure 4Daily total precipitation amounts over Turkey on 28 October 2010 (mm, in shaded) and the stations exceeding their 90th percentile threshold (triangle).
The annual contribution of EP for each station (cumulative totals of EP for each station divided by 10) is shown in Fig. 3b. We observe that the largest normalized annual amounts of EPEs are mainly located on the southwest of the Aegean and the mid-south and northeast of the Marmara Region, with values larger than 60 mm. It is interesting to see that the interior continental areas of the Aegean and Marmara regions that were characterized as poor in terms of extreme amounts of precipitation (Fig. 3a) now exhibit a better picture in their normalized value, generally having a better value between 40 and 60 mm. The reason for this can be the convective precipitation, generating intensified rain that can accumulate higher amounts of precipitation during a single rainstorm. On the other hand, western regions of Marmara that exhibited considerably larger threshold values with precipitation totals larger than 60 mm (Fig. 3a) show a worse image, with the normalized precipitation values being between 40 and 60 mm.
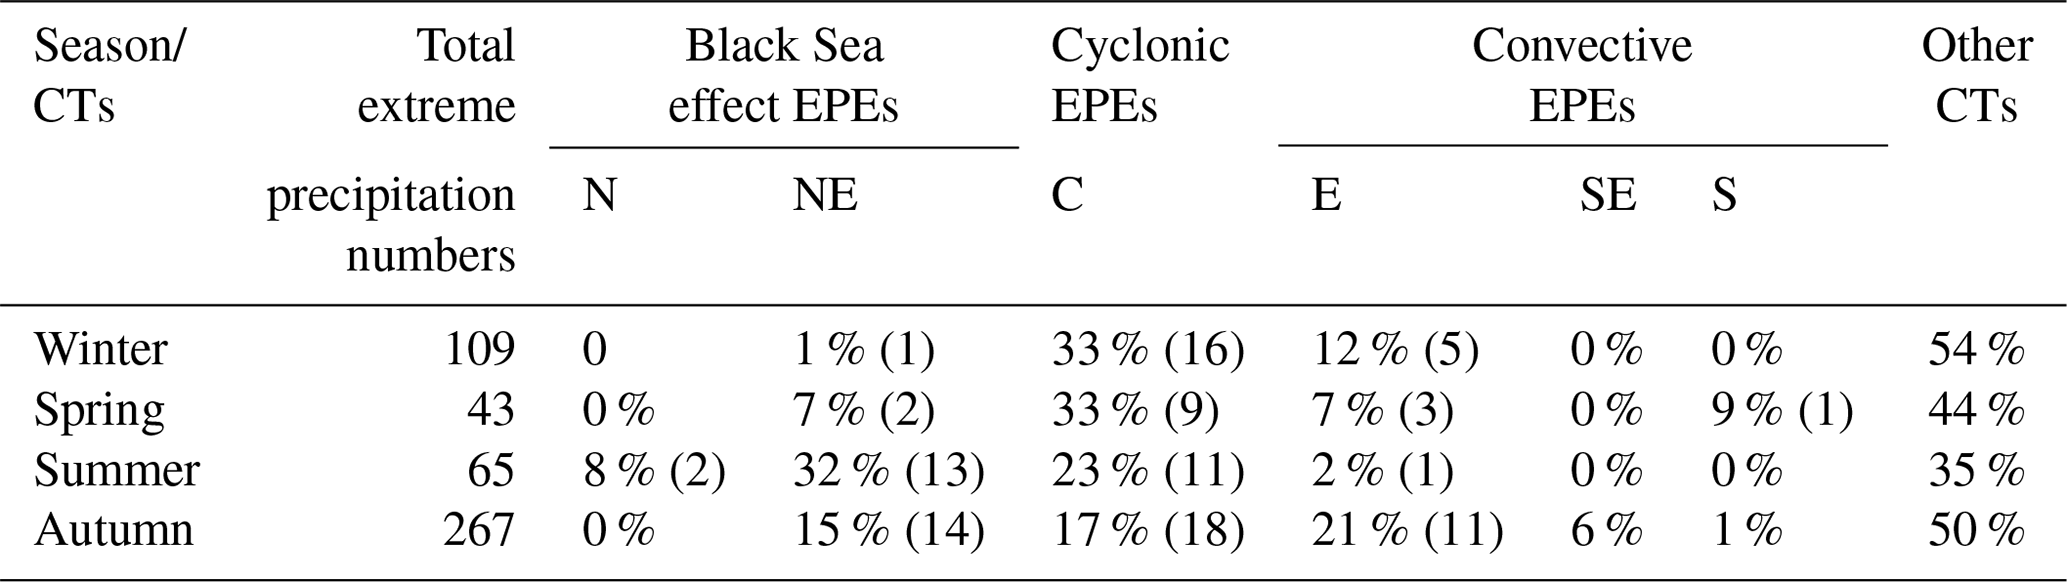
Table 1Total extreme precipitation numbers over Marmara considering 51 stations and their percentage frequency distribution according to Black Sea effect, cyclonic, and convective precipitation types for the period 2006–2015. The total number of the days with EPEs are shown in parentheses.
As an example, on 28 October 2010 intense daily rainfalls and many associated flash floods occurred in the western parts of Turkey. As a result of this extraordinary event, daily precipitation amounts exceeded 70 mm in the Bandirma province (south seaside station of Marmara Sea, in Fig. 4). During this day, daily precipitation totals exceeding 50 mm are shown in yellow in Fig. 4, extending from the coastal Aegean Region towards Marmara as an enlarging region that reaches up to Black Sea and passes over the Gulf of İzmit and Silivri. This squall line affected majority of the Marmara Region and to a lesser extent the Aegean Region. However, many stations located outside of this critical yellow region also had rainfall totals above their extreme daily precipitation limits.
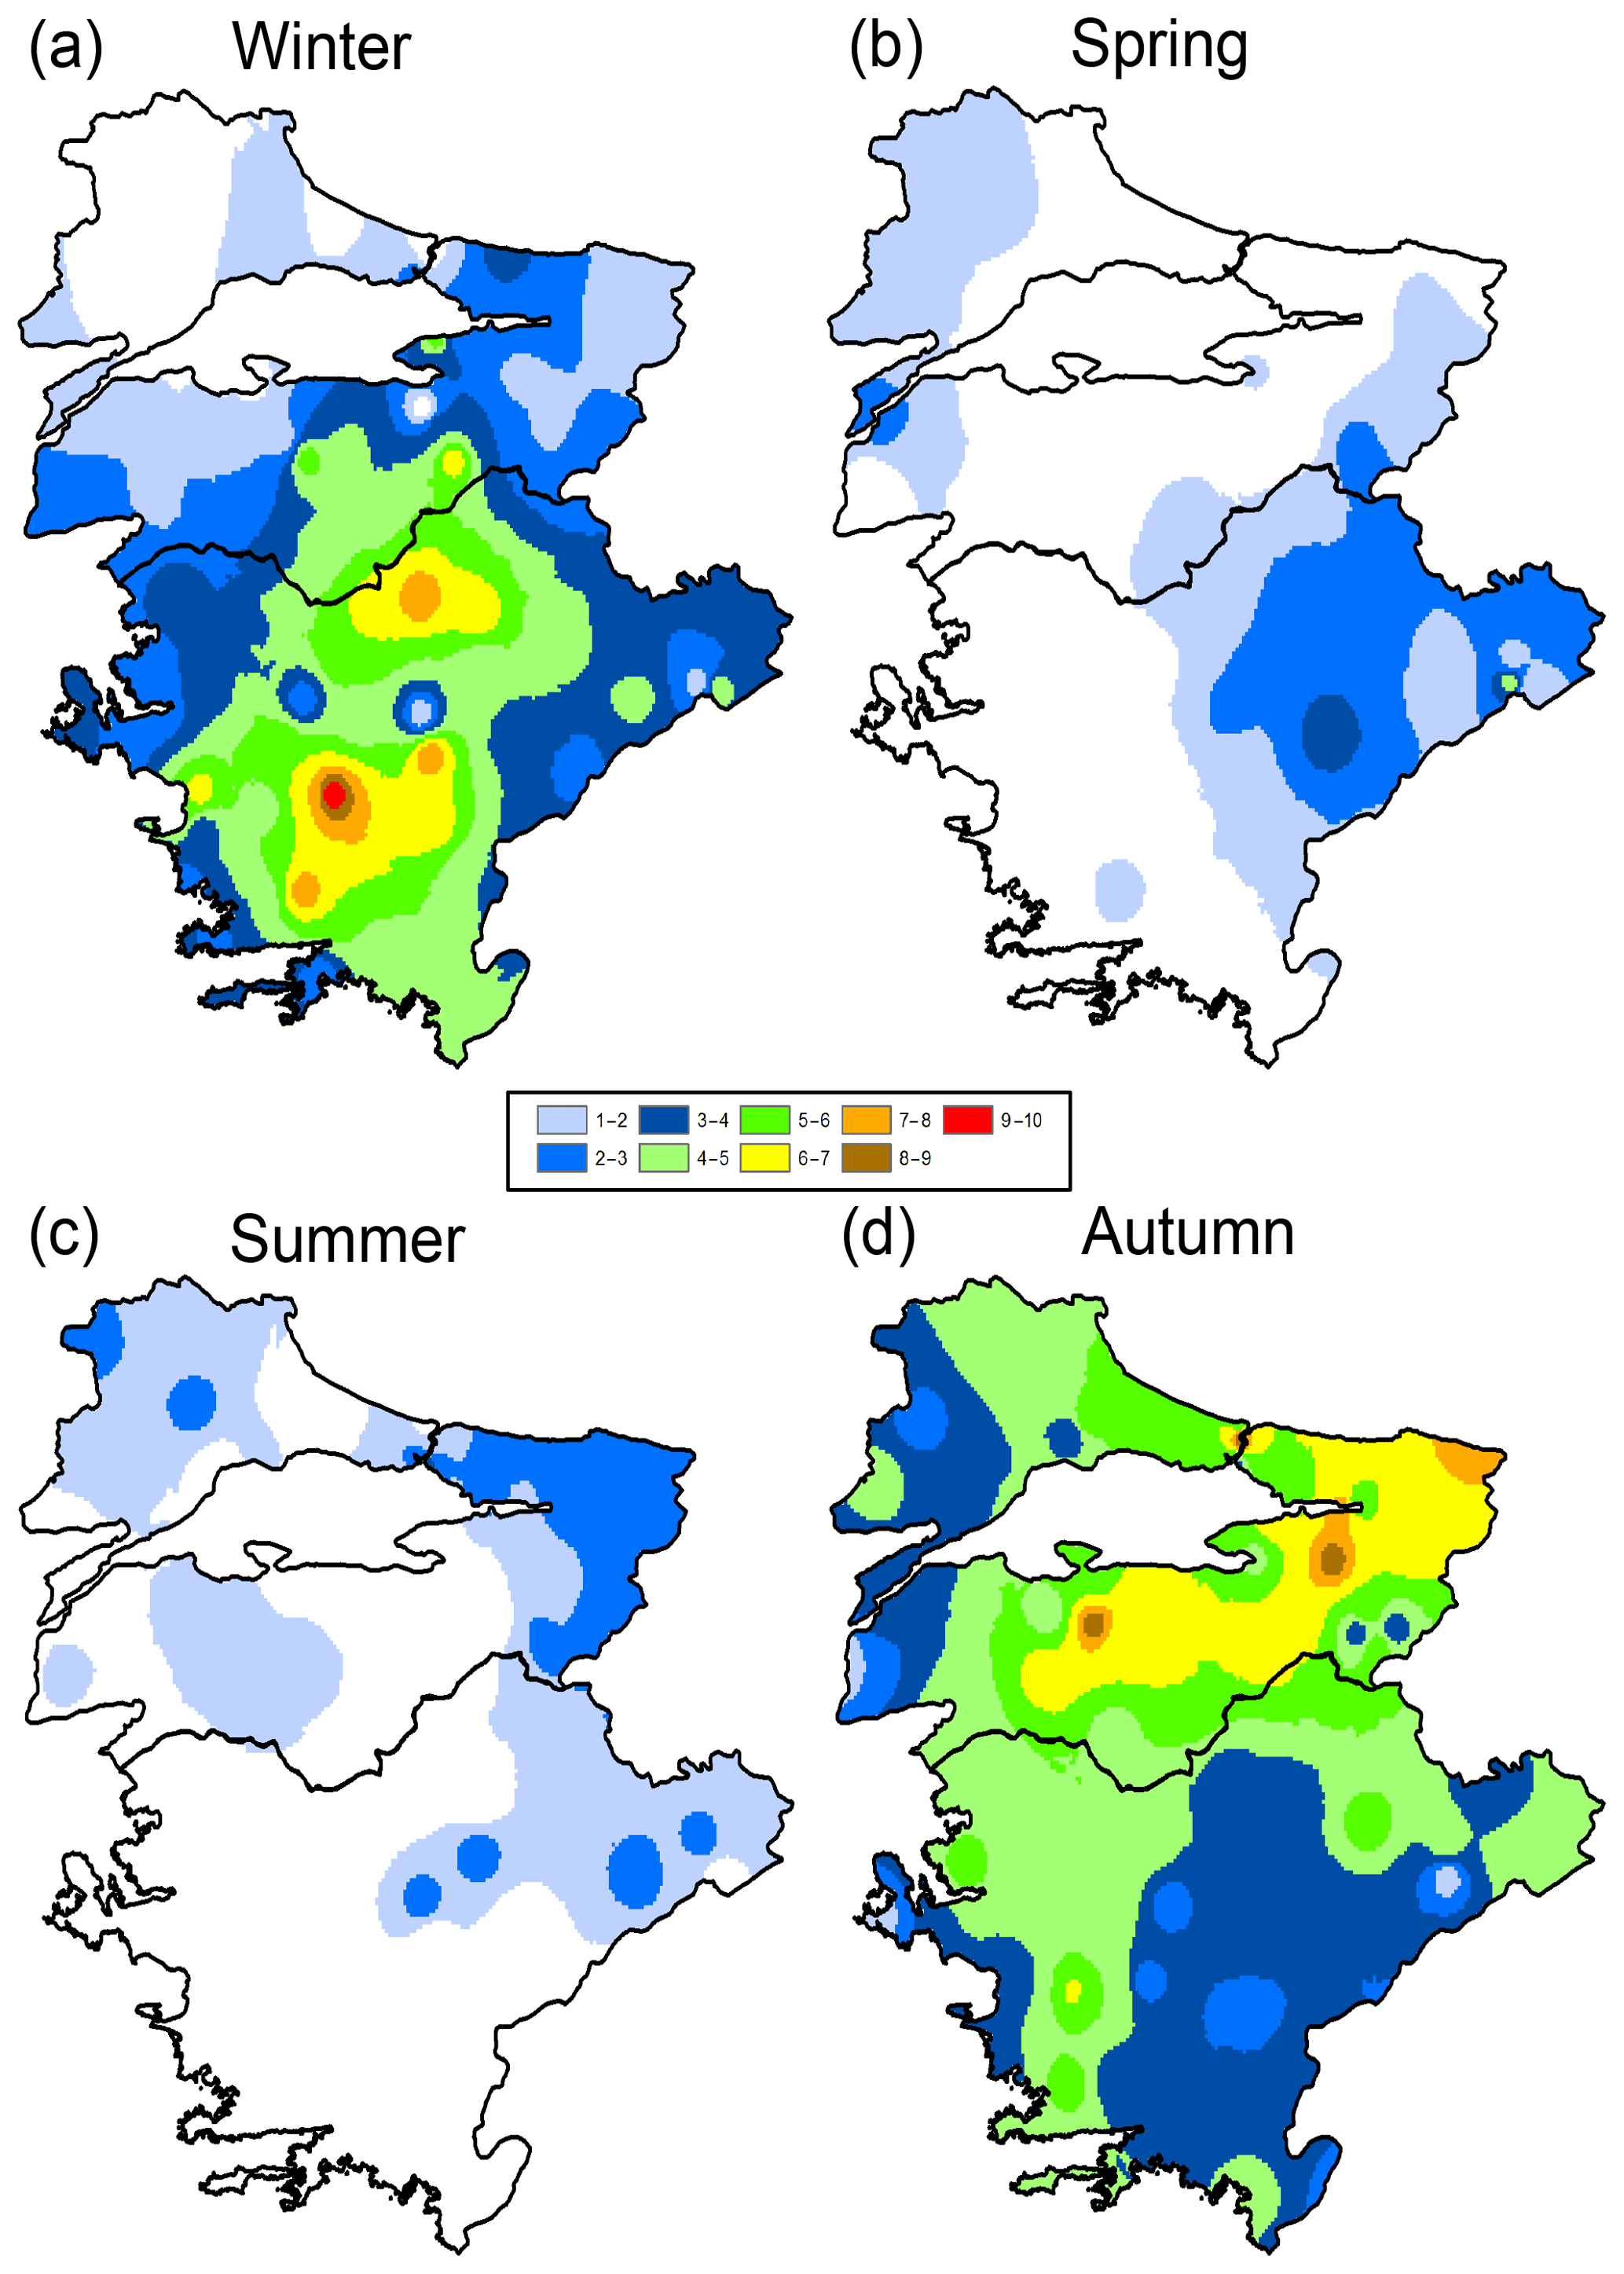
Figure 5Seasonal distribution of the counts of the days for the stations when precipitation exceeded their 90th percentile during an EPE case for (a) winter, (b) spring, (c) summer, and (d) autumn seasons.
The seasonal distribution of the EPE frequencies can provide important information to understand the physical mechanisms forcing these extreme events. For this reason, we analyzed the total counts of EPEs for four seasons, and the results are depicted in Fig. 5. It can be stated from Fig. 5 that winter (DJF) and autumn (SON) are more significant than the other seasons (Fig. 5a and d). During winter, two areas over the Aegean resulted in more than six extreme precipitation days (Fig. 5a). Spring is mainly characterized as having EPEs between 2 and 4 days on the eastern portions of the Aegean Region (Fig. 5b). During summer, the highest count of the EPEs, with 3 days, is shown to be located over the areas of the Marmara Region that were affected by the Black Sea (Fig. 5c). Seasonally, the second highest frequency of EPEs can be found in the autumn. In this season, an area extending from northeast to south of Marmara receives a frequency considerably higher than 6 days (Fig. 5d). From this point of view, a detailed analysis of the atmospheric systems generating EPEs and effecting the Aegean Region mainly during winter and the Marmara Region during autumn becomes important. The next section focuses on this aim.
3.2 Regional features of the seasonal EPEs
In this section, we carried out frequency analysis of the seasonal EP events for the Marmara Region and documented the results in Table 1. The Marmara basin seems to be the most sensitive to these occasional precipitation events during the autumn season. It is clear in Table 1 that 53 % of the EPEs (sea effect, cyclonic, and convective in origin) occurred a total of 43 days in this season, followed by 27, 15, and 22 days in the summer, spring, and winter months, respectively. During autumn, convective, cyclonic, and the Black Sea effect EPEs are most influential over Marmara with the percentages of 21 %, 17 %, and 15 %, respectively.
At the Aegean Region, which is represented by a total of 46 stations, EP is more frequent during the winter months and a total of 35 different winter days ended up with cyclonic EPEs during the 10-year period (Table 2). It can be seen from the table that cyclonic EPEs represent 61 % of the wintertime extreme precipitation events belonging to the region. The second highest frequency belongs to the autumn, with a value of 43 % corresponding to 28 events.
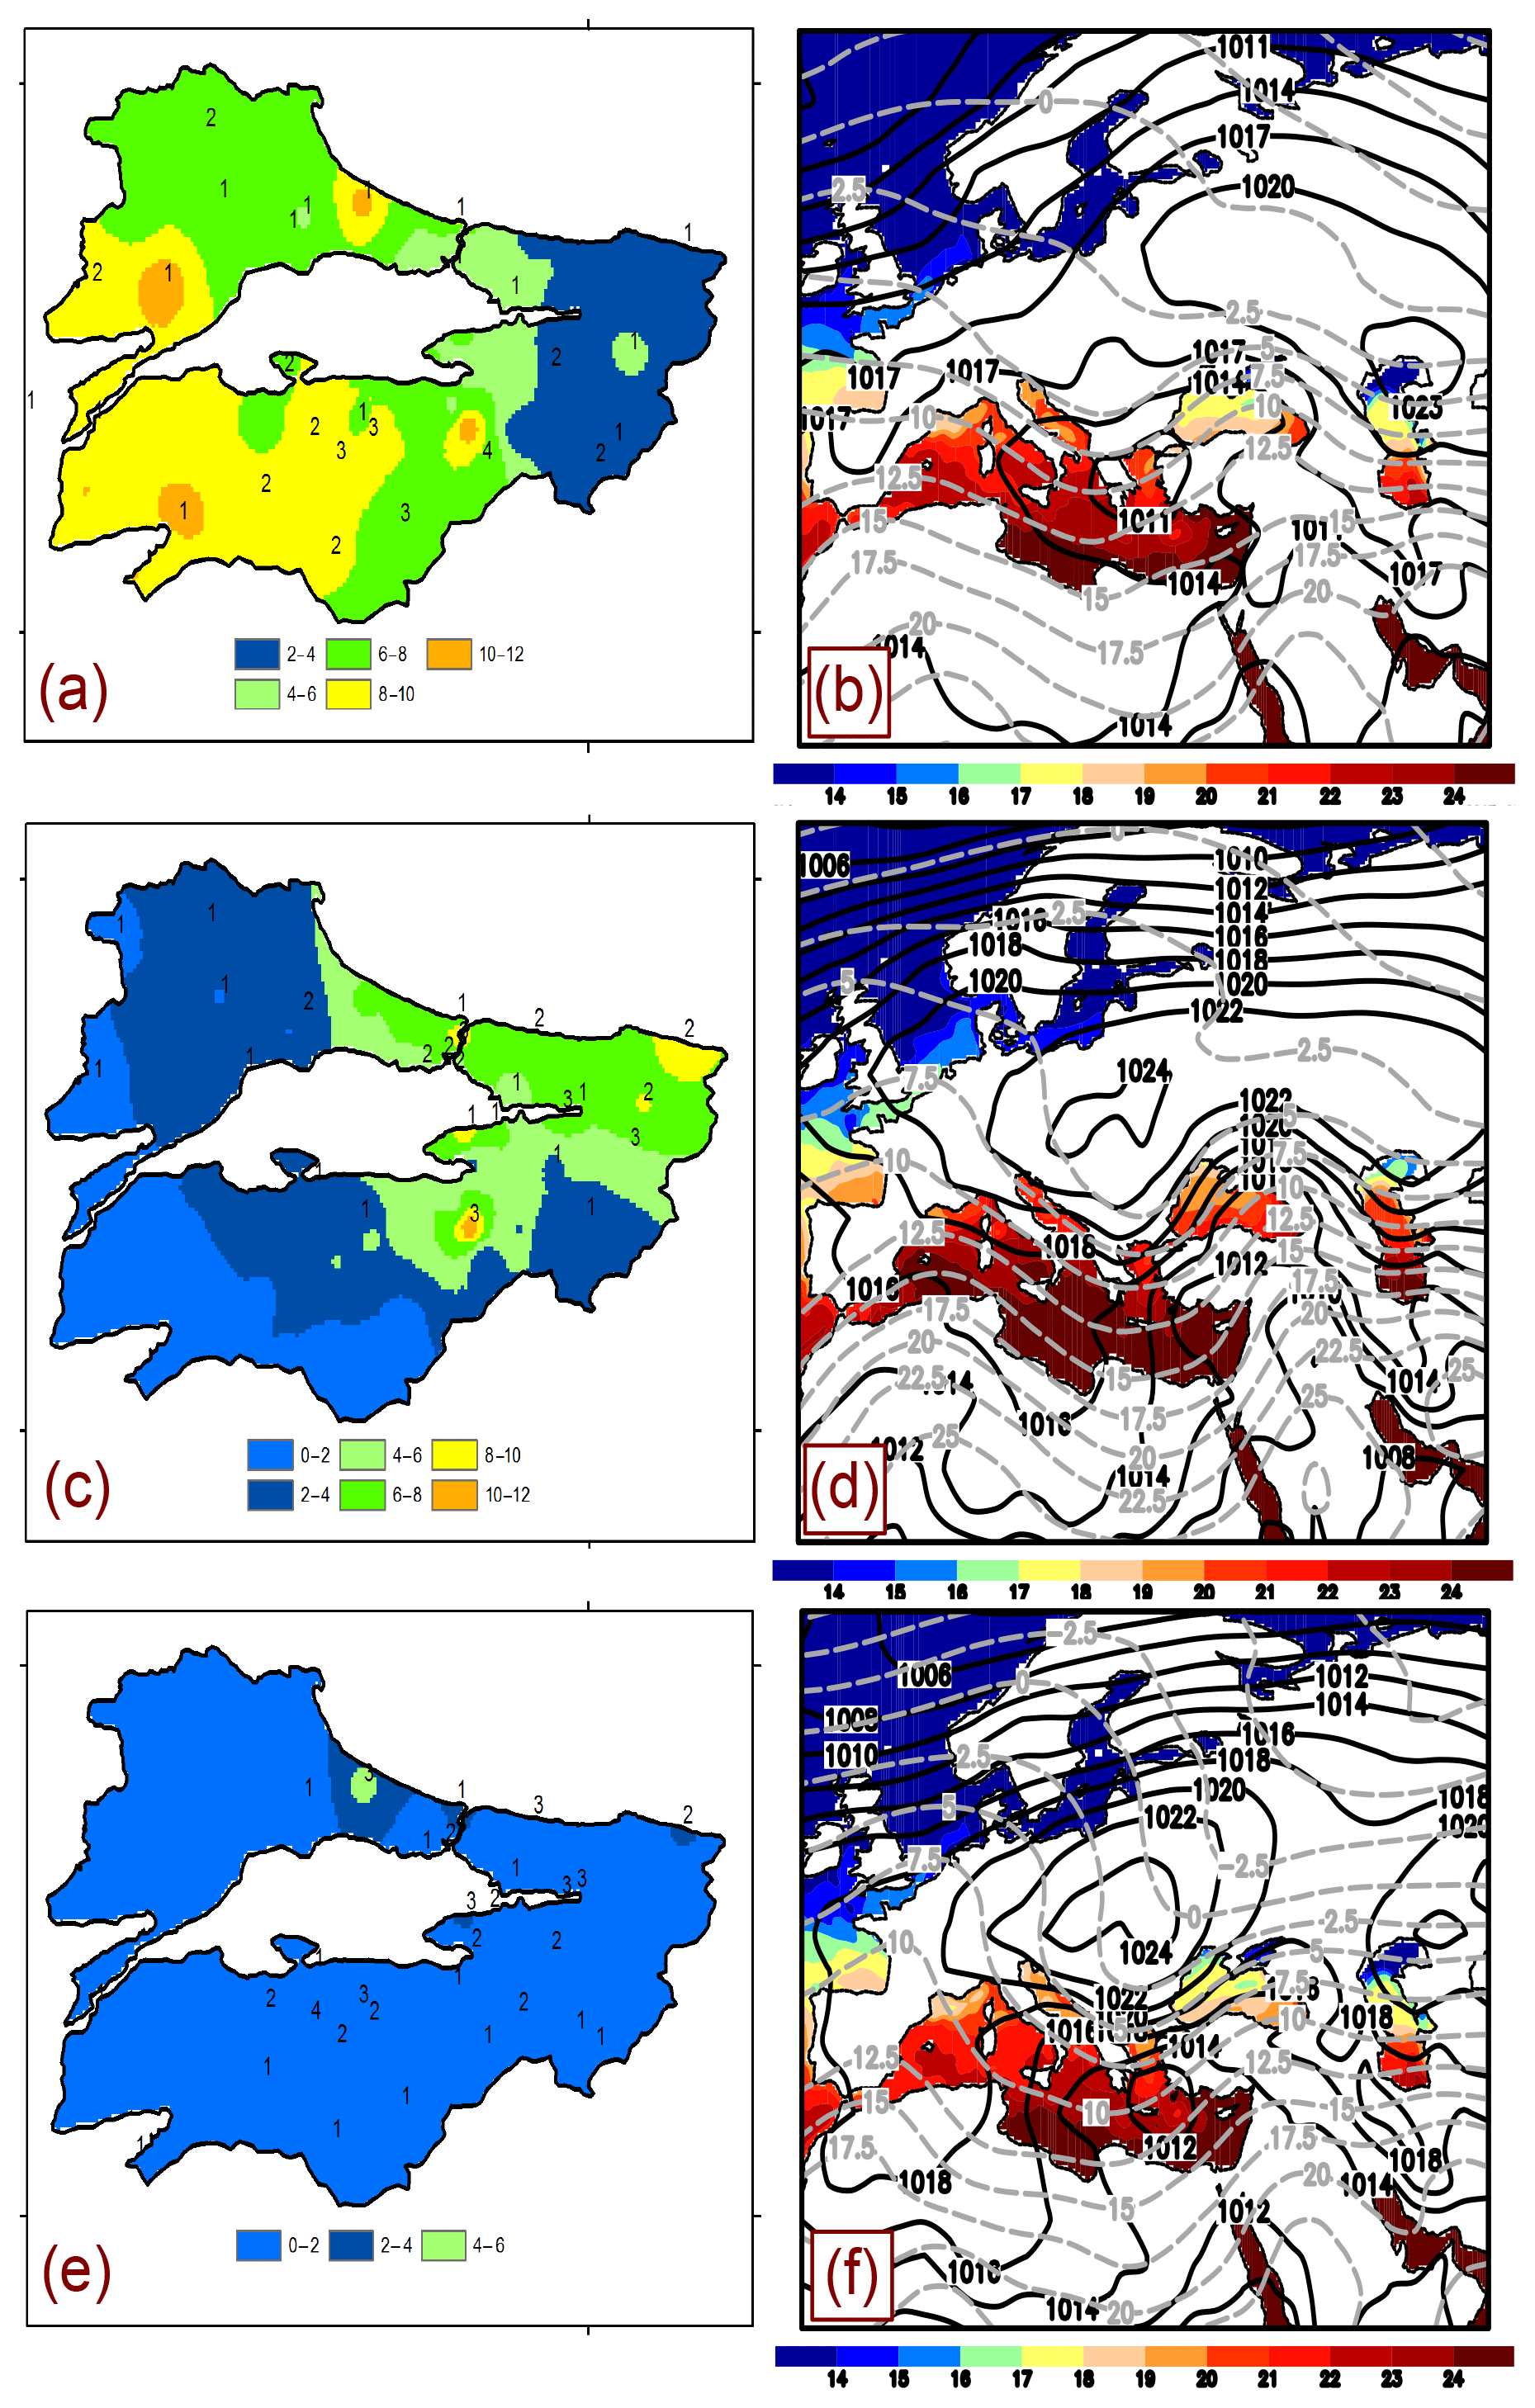
Figure 6(a) Daily mean precipitation values of cyclonic precipitation types (mm, shaded) and the counts of EP days for the stations of Marmara during the autumn of 2006–2015. (b) Composites of the daily mean sea level pressure (MSLP, solid lines), sea surface temperature (SST, colored), and air temperature at 850 hPa (dashed lines) for the average of 18 extreme precipitation days over Marmara. (c) Same as (a) but for the sea effect (NE) precipitation types. (d) Same as (b) but for the 14 extreme precipitation days. (e) Same as (a) but for the convective (E) precipitation types. (f) Same as (b) but for the 11 extreme precipitation days.
3.2.1 Precipitation characteristics of EPEs over Marmara with its background synoptic-scale atmospheric conditions
As discussed in the previous section, we mainly focused on the months of autumn to analyze the spatial distribution of daily mean precipitation, to determine the counts of station-based EPEs in the Marmara Region, and to investigate the synoptic-scale atmospheric conditions responsible from the development of these extreme precipitation events. In this respect, the 2006–2015 period autumn mean precipitation values, counts of EPEs, and their associated average weather maps are illustrated in Fig. 6.
During cyclonic CTs, the highest daily mean precipitation amounts exceeding 8 mm are shown to exist on the southwestern parts of the region. Similarly, the count of EPEs is higher in this portion of the Marmara Region (Fig. 6a). When the synoptic composite maps are analyzed, one can see the low-pressure center that probably came from the west (Karaca et al., 2000) and remained over the Aegean Sea and west of Marmara. Sea surface temperature varies between 19 and 20 ∘C, and temperature in the low level of the atmosphere (approximately 1.5 km high from the ground) is shown to be between 7.5 and 10 ∘C (Fig. 6b).
Table 2Seasonal total extreme precipitation numbers over the Aegean considering 46 stations and their percentage frequency distribution according to the Aegean Sea effect, cyclonic, and convective precipitation types for the period 2006–2015. The total number of the days with EPEs are shown in parentheses.

During NE types, the north and northeast parts of Marmara get higher daily mean precipitation amounts (between 6 and 8 mm in Fig. 6c). A total of 28 extreme precipitation cases in the northeastern stations exceed their threshold levels at this part of the region. It is shown from the previous studies that the primary factor for the formation and intensity of sea-effect precipitation is known to be the temperature difference between the sea surface and the air at 850 hPa level (Holroyd, 1971; Niziol, 1987; Steenburgh et al., 2000). If the SST–T850 difference becomes higher, the chance of precipitation increases due to higher convective instability. Millan et al. (1995) argued that enhanced evaporation resulting from temperature differences between European continental air and the relative warm Mediterranean Sea in fall can become a key factor in determining the onset of precipitation. Pastor et al. (2015) have shown that regions of high heat and moisture air–sea exchange over the Mediterranean Basin are prone to enhancing convection, leading to torrential rain. In a later study, Baltacı et al. (2015) mainly emphasized that a 13 ∘C temperature difference between the sea surface and the 850 hPa level can cause above-normal precipitation records at the northeast of Marmara. Our results indicate that as a consequence of the combination of a high-pressure center (HPC) located over eastern Europe and a low-pressure center (LPC) over southern Turkey, strong northeasterly flows can be generated owing to high pressure gradient force bringing significant amounts of moisture from the relatively warm Black Sea (21 ∘C) to the northeast of Marmara. The temperature difference between the SST and 850 hPa level exceeds the 13 ∘C threshold level, and this increases the strength of instability conditions (Fig. 6d).
As explained by Ricard et al. (2012), the orographic properties of the area induce mesoscale convergence and lift of the low-level conditionally unstable flow. Most active regions for deep convection in the Mediterranean Basin (MB) are the Alps, the western Croatian coast, the south of France, and the wider area of Tunisia (Dayan et al., 2015). Alhammoud et al. (2014) found a maximum frequency of deep convection over the MB in September–October and a minimum one in June and July. Similar to the previous studies for the MB (e.g., Funatsu et al., 2009; Melani et al., 2013; Alhammoud et al., 2014), convective EP events over Marmara are mostly shown during autumn season. Although daily mean precipitation amounts are lower (between 0 and 2 mm) in the convective (E) type, extreme cases are seen more commonly in the southern part of the region (Fig. 6e). The mountainous area (Mt. Uludaǧ over 2500 m high) of Marmara is located in this part and, due to the interaction between HPC over eastern Europe and LPC over western Turkey, strong easterly flows coming from flat land areas meet with highland barriers producing higher amounts of orographically enforced convective EP, if the atmospheric condition such as temperature exchange (explained in Sect. 3.6) is suitable (Fig. 6f).

Figure 7Balikesir radar PPI (plan position indicator) image of the Marmara region on 28 September 2015. The red star marks the Mt. Uludaǧ. The figure was adapted from Google Maps.
As an example, convective activity in southern Marmara started in the afternoon on 28 September 2015 (Fig. 7). Due to the movements of the single cell clouds to the easterly directions, their spatial area expanded. When the cells met with the orographic barrier over Bursa (Mt. Uludaǧ, red star in Fig. 7) quasi-stationary conditions developed the convective instability. As a result, extreme precipitation amounts were recorded in the western part of the mountainside in a very short time.
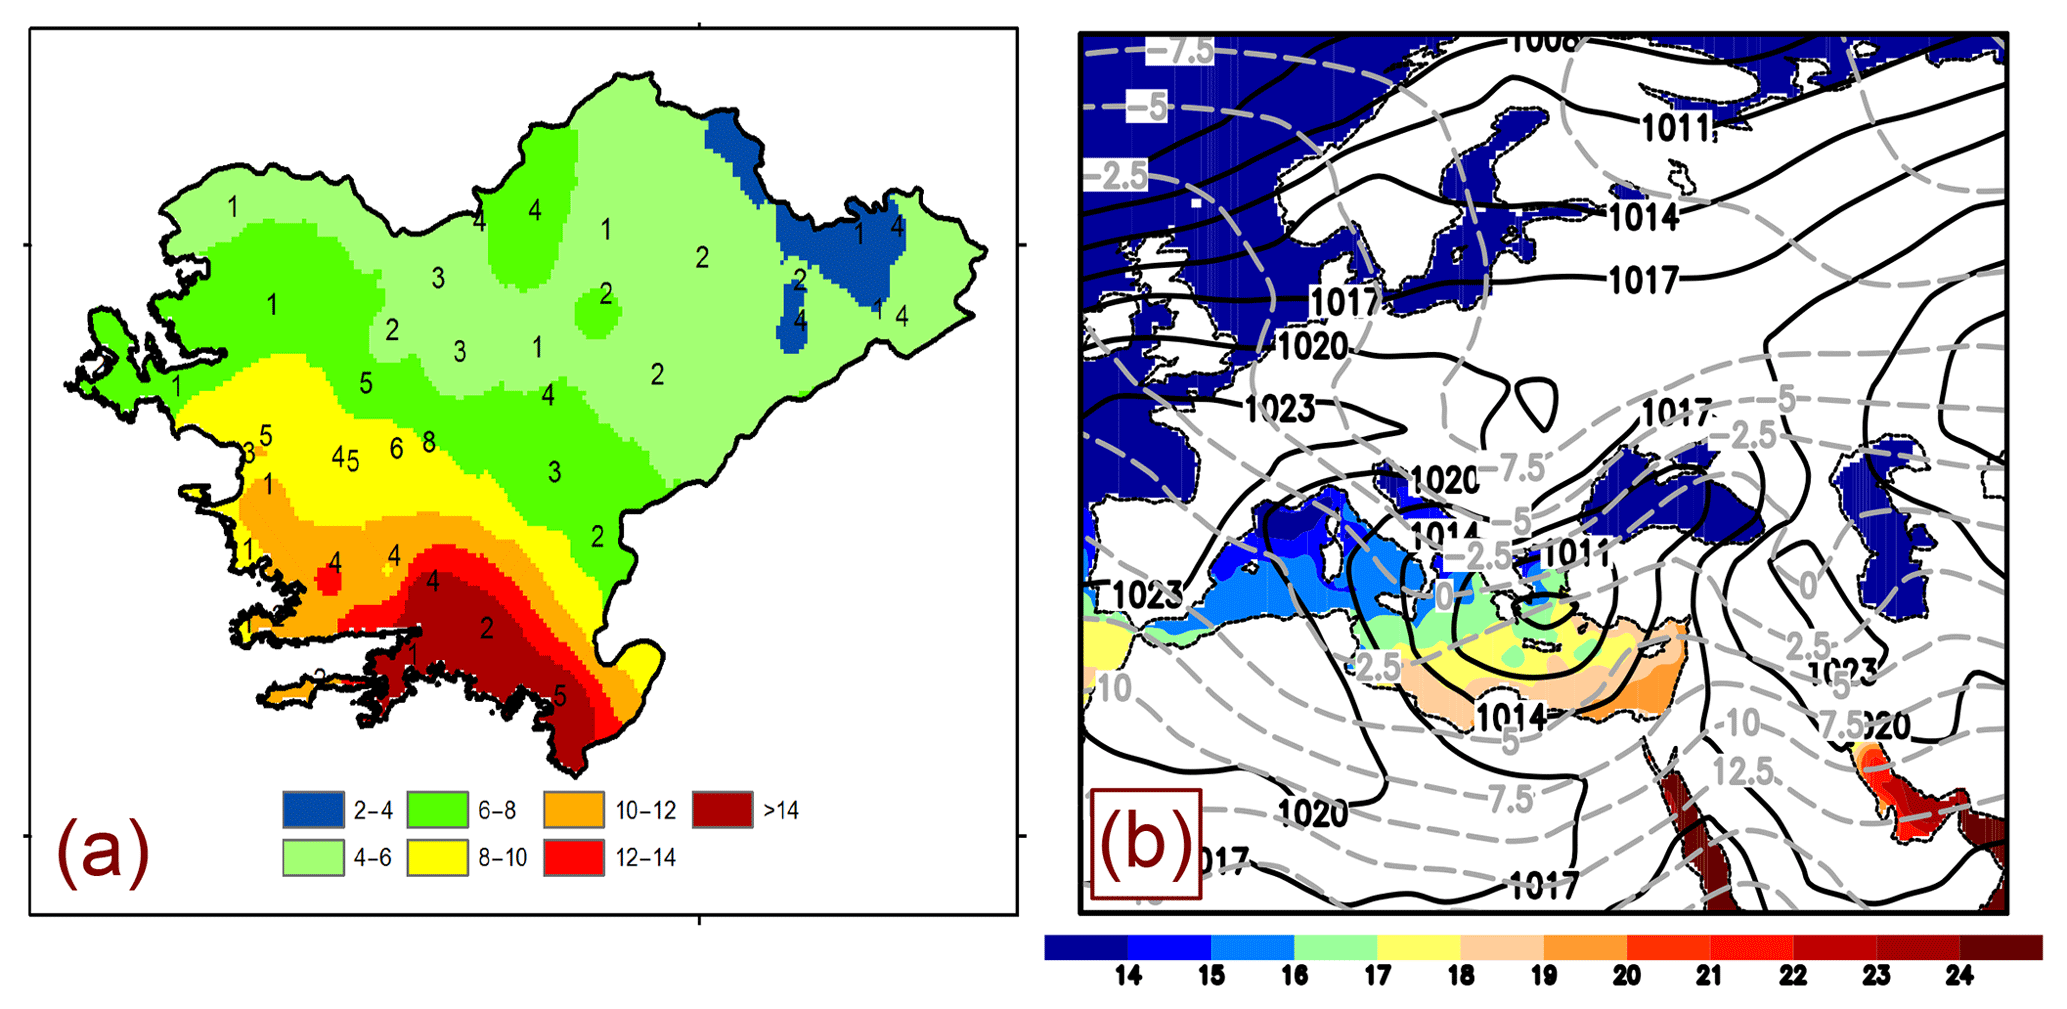
Figure 8(a) Daily mean precipitation values of cyclonic precipitation types (mm, shaded) and the counts of EP days of the Aegean stations for the winter months during 2006–2015. (b) Composites of the daily mean sea level pressure (MSLP, solid lines), sea surface temperature (SST, shaded), and air temperature at 850 hPa (dashed lines) for the average of 35 extreme precipitation days over the Aegean.
3.2.2 Precipitation characteristics of EPEs over the Aegean with its background synoptic-scale atmospheric conditions
As mentioned above, winter months are more important for extreme precipitation events over the Aegean. As previously explained by Ulbrich and Christoph (1999), high-pressure conditions in southeastern Europe tend to divert the Mediterranean storm track southwards, resulting in increased precipitation in the eastern Mediterranean. As a consequence the positioning of cyclones over the Aegean in this season, more daily precipitation amounts occur in the southern corner of the region (above 14 mm), and we observe higher EP cases close to the coastal stations (Fig. 8a). In addition, during appropriate synoptic conditions, cyclonic activity can result in intense rainstorms at the majority of the stations of the Aegean Region, especially at those located in the south. When compared with cyclonic CTs over Marmara, a more deepened LPC is located over the Aegean Sea. In this case, cold air aloft coming from the north can meet with the relatively warm Aegean Sea, and the convergence of warm air above the cold air can generate cyclogenesis which can result in heavy precipitation (Fig. 8b).
3.3 Interannual and hourly variation of EPEs
The annual distribution of the total counts of EP days together with their precipitation characteristics was also analyzed for the Marmara and Aegean regions during autumn and winter months and depicted in Fig. 9. In terms of Marmara, cyclonic CTs were more active in the years of 2009, 2011 and 2013 (Fig. 9a). On the other hand, the highest counts of Black Sea effect EPEs happened during the years of 2008 and 2015. It is known that 2010 was a wet year for Marmara and dense daily rainfall amounts were generated by convective activity. The annual distribution of the cyclonic EPEs in winter indicates that the Aegean Region had been under the influence of midlatitude cyclones during the years 2009 and 2010 (Fig. 9b). As previously indicated by Türkeş and Erlat (2003), negative relationships were found between NAO indices and Turkish precipitation series. Statistically significant changes in the precipitation amounts during the extreme NAO phases are more apparent in the west and central Turkey. Hence, one reason for this cyclonic EP could be the negative phase of NAO pattern, where warm and moist air over the Mediterranean Sea can be transferred to the Aegean Region by strong westerly or southwesterly flows.
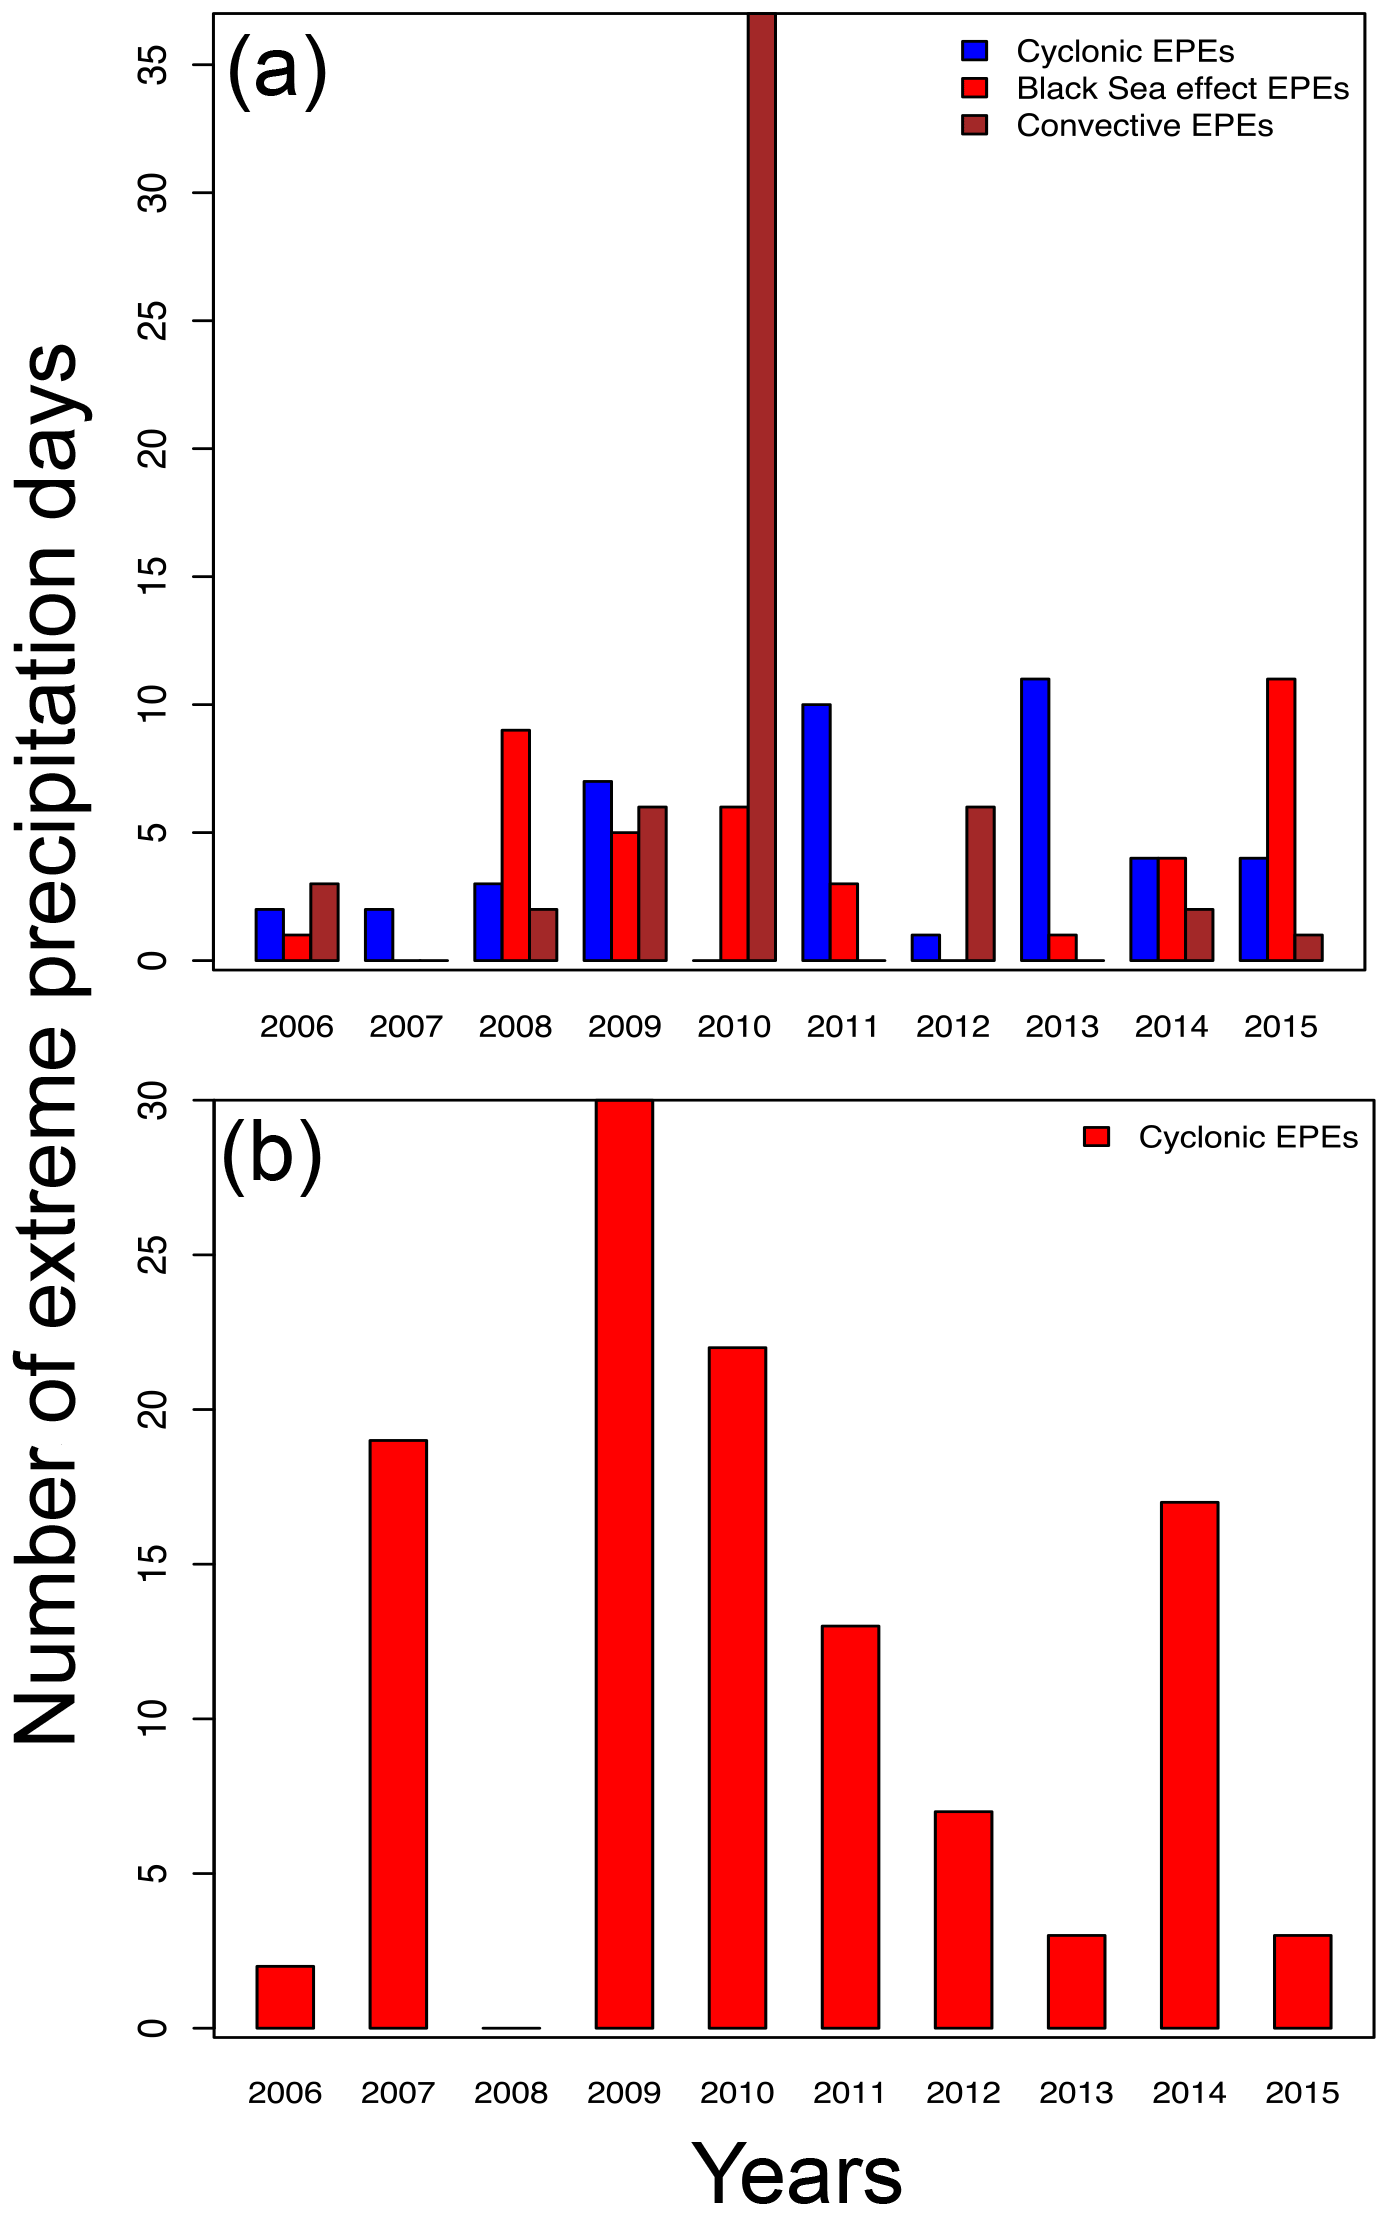
Figure 9Annual distribution of the total counts of EPEs as well as precipitation characteristics for (a) Marmara in autumn and (b) the Aegean in winter months.
Peak times of extreme precipitation in a day can give us important information for understanding the possible causes triggering this event. For this reason, we investigated hourly behavior of the mean EP for the Marmara and Aegean regions belonging to the autumn and winter months (Fig. 10). In Marmara, the highest daily mean extreme precipitation is shown to occur under the convective types, followed by Black Sea effect and cyclonic CTs. During convective activity, we showed a peak during afternoon hours of the day. The main reason of this event can be the diurnal heating, and this is further investigated in the next section. For the Black Sea effect EPEs, we observe an hourly peak of the precipitation close to noontime, and this suggests that when maximum solar radiation reaches the sea surface, a significant amount of moisture and heat are transferred by northerly flows to Marmara, generating a considerable amount of precipitation (Baltacı et al., 2015, 2017). During the cyclonic CT, the region takes dense hourly precipitation at the mid-afternoon of the day. In regard to the Aegean in winter, cyclones generally release dense precipitation potentials from nighttime to noontime.
3.4 Relationship between extreme daily precipitation and surface temperature
From the previous studies, it can be said that the link between precipitation intensity and temperature was explained by the Clausius–Clapeyron (C–C) relation. The C–C relation presents the moisture-holding capacity of the atmosphere to temperature, hinting a roughly 7 % increase in atmospheric moisture storage per degree Celcius. Pall et al. (2007) found a high agreement between the C–C relation and the changes in the rainfall extremes at midlatitudes. Lenderink and van Meijgaard (2008) found for the Netherlands that changes in hourly and daily precipitation intensity generally increased at the 7 % ∘C−1 rate anticipated by the C–C relation at temperatures below 10 ∘C, but that hourly precipitation exhibited a “super C–C” relation (increase greater than 7 % ∘C−1). Later, Lenderink and van Meijgaard (2009) considered that stronger updrafts due to greater latent heat release are the main physical mechanism in the formation of the super C–C relationships. Haerter and Berg (2009) suggested that super C–C scaling may be prevalent in regions that have a relatively balanced coexistence of both convective and large-scale rainfall events.
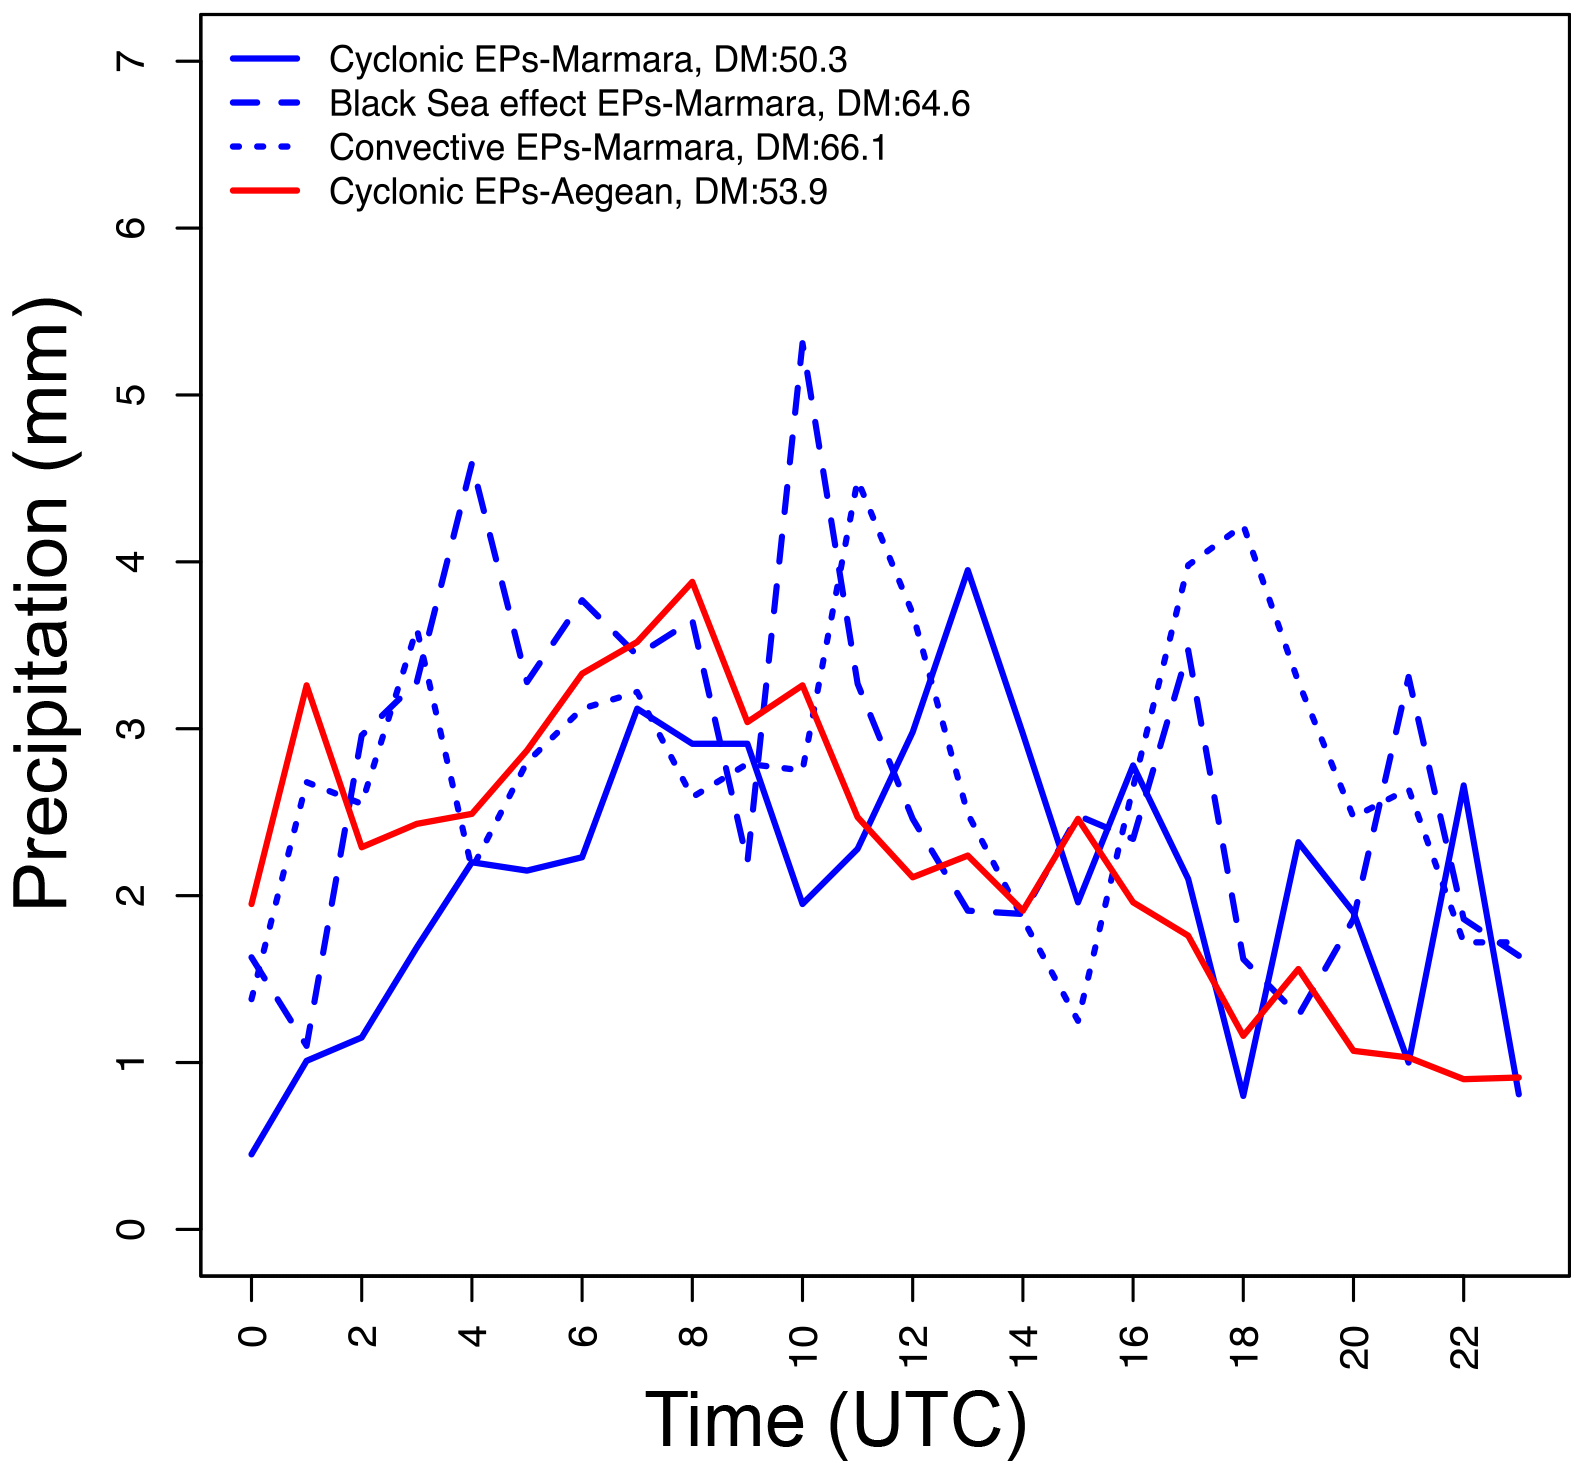
Figure 10Average hourly precipitation amounts (mm) of EP days according to cyclonic, Black Sea effect, and convective types in Marmara for autumn and cyclonic EPEs for the Aegean in winter. DM indicates the daily mean precipitation amounts (mm) associated with the count of days that ended up with extreme precipitation.
In this part, to examine the C–C relation for the convective EPEs, we extracted 10 daily mean temperature records and extreme hourly precipitation records of the extreme precipitation days for the selected south (Bursa) and east (Kocaeli) stations of Marmara in autumn (Table 3). It was shown that hourly extreme precipitation is more linked to daily mean temperature (r=0.69, statistically significant at 95 % confidence level) in the south of Marmara under the proper synoptic conditions and daily mean temperature changes from 12.2 to 18.4 ∘C.
Table 3Daily mean temperature and extreme hourly precipitation records and their temporal correlations during the 10 convective extreme precipitation days in the southern (Bursa) and eastern (Kocaeli) stations. The bold value indicates the statistical significance at the 95 % confidence level according to Student's t test.

In this study, a 10-year (2006–2015) climatology of EPEs in the west of Turkey was developed using hourly precipitation values of 51 and 47 stations in the Marmara and Aegean regions, respectively. To define extreme precipitation, we used geographically varying thresholds based upon the 90th percentile of 24 h precipitation at each station. The characteristics of the EPEs in each region were analyzed objectively using Lamb weather type (LWT) methodology and radar products. Physical mechanisms behind EPEs were evaluated by considering synoptic-scale composites of NCEP/NCAR Reanalysis daily mean sea level pressure, sea surface temperature, and air temperature at 850 hPa. Salient results of the analysis are as follows:
-
While highest EP threshold limits are shown to exist at the seaside stations of western Turkey (above 80 mm), the lowest limits are observed at the semi-arid continental areas of the Aegean and Marmara regions. Seasonal numbers of the EP days showed that the Marmara and Aegean areas of Turkey are more influenced from these intense rainfall episodes during autumn and winter months, respectively.
-
During autumn, convective, cyclonic, and sea-effect-originated EPEs represent 21 %, 17 %, and 15 % of total extreme precipitation numbers occurring in the stations of Marmara, respectively. If the region has the proper synoptic conditions (HPC over the Balkan Peninsula and LPC over the eastern Mediterranean) and diurnal heating, convective types of EP mainly occur at the south of Marmara during afternoon and evening times of the day. Daily extreme precipitation amounts are more common in the southwestern parts of Marmara when the cyclone is located over Marmara. Additionally, as a consequence of the interaction between HPC over eastern Europe and LPC over central Anatolia, strong moisture can be transferred by the northeasterly flows, and this can result in higher daily precipitation records that were sea effect in origin being shown to develop at the northeast parts of Marmara.
-
At the Aegean Region, 61 % of the total EPEs occur from the cyclonic activity during winter, and torrential rainfall is found to be experienced at the majority of the stations, especially those located in the south. This condition can be explained by cold air transfer from the north that meets with the relatively warm Aegean Sea, and thus the convergence of warm air above the cold air generates cyclogenesis, which results in heavy precipitation.
We conclude by noting that the methods and the results of the current study can serve as a basis for future research related to EPEs in western Turkey and elsewhere. The methods applied to identify EPEs can be adopted for use in other geographical regions in Turkey.
All data included in this study are available upon request by contacting the corresponding author.
BOA and HB conducted the analysis and wrote the paper, and MT helped with the language.
The authors declare that they have no conflict of interest.
We sincerely thank the anonymous referees for the comments and suggestions on
the earlier draft of this paper.
Edited by: Maria-Carmen Llasat
Reviewed by: two anonymous referees
Alhammoud, B., Claud, C., Funatsu, B. M., Beranger, K., Chaboureau, J. P.: Patterns of Precipitation and Convection Occurrence over the Mediterranean Basin Derived from a Decade of Microwave Satellite Observations, Atmosphere, 5, 370–398, 2014.
Asikoglu, O. L. and Benzeden, E.: Simple generalization approach for intensity–duration–frequency relationships, Hydrol. Process., 28, 1114–1123, 2014.
Baltaci, H.: Meteorological analysis of flash floods in Artvin (NE Turkey) on 24 August 2015, Nat. Hazards Earth Syst. Sci., 17, 1221–1230, https://doi.org/10.5194/nhess-17-1221-2017, 2017.
Baltacı, H., Göktürk, O. M., Kındap, T., Ünal, A., and Karaca, M.: Atmospheric circulation types in Marmara Region (NW Turkey) and their influence on precipitation, Int. J. Climatol., 35, 1810–1820, 2015.
Baltacı, H., Kıdap, T., Ünal, A., and Karaca, M.: The influence of atmospheric circulation types on regional patterns of precipitation in Marmara (NW Turkey), Theor. Appl. Climatol., 127, 563–572, 2017.
Baltacı, H., Akkoyunlu, B. O., and Tayanc, M.: Relationships between teleconnection patterns and Turkish climatic extremes, Theor. Appl. Climatol., 134, 1365–1386, 2018.
Brooks, H. E. and Stensrud, D. J.: Climatology of heavy rain events in the United States from hourly precipitation observations, Mon. Weather Rev., 128, 1194–1201, 2000.
Burt, T. P. and Ferranti, E. J. S.: Changing patterns of heavy rainfall in upland areas: a case study from northern England, Int. J. Climatol., 32, 518–532, 2012.
Carvalho, L. M. V., Jones, C., and Liebmann, B.: Extreme precipitation events in Southeastern South America and large-scale convective patterns in the South Atlantic Convergence Zone, J. Climate, 15, 2377–2394, 2002.
Dayan, U., Nissen, K., and Ulbrich, U.: Review Article: Atmospheric conditions inducing extreme precipitation over the eastern and western Mediterranean, Nat. Hazards Earth Syst. Sci., 15, 2525–2544, https://doi.org/10.5194/nhess-15-2525-2015, 2015.
DeFlorio, M. J., Pierce, D. W., Cayan, D., and Miller, A.: Western U.S. extreme precipitation events and their relation to ENSO and PDO in CCSM4, J. Climate, 26, 4231–4243, 2013.
Demirtaş, M.: The October 2011 devastating flash flood event of Antalya: triggering mechanisms and quantitative precipitation forecasting, Q. J. Roy. Meteorol. Soc., 142, 2336–2346, 2016.
Ferretti, R., Low-Nam, S., and Rotunno, R.: Numerical simulations of the Piedmont flood of 4–6 November 1994, Tellus A, 52, 162–180, 2000.
Funatsu, B. M., Claud, C., and Chaboureau, J. P.: Comparison between the large-scale environments of moderate and intense precipitation systems in the Mediterranean region, Mon. Weather Rev., 137, 3933–3959, 2009.
Haerter, J. O. and Berg, P.: Unexpected rise in extreme precipitation caused by a shift in rain type?, Nat. Geosci., 2, 372–373, 2009.
Hellström, C.: Atmospheric conditions during extreme and non-extreme precipitation events in Sweden, Int. J. Climatol., 25, 631–648, 2003.
Higgins, R. W., Schemm, J. K. E, Shi, W., and Leetmaa, A.: Extreme precipitation events in the western United States related to tropical forcing, J. Climate, 13, 793–820, 2000.
Hitchens, N. M., Baldwin, M. E., and Trapp, R. J.: An object-oriented characterization of extreme precipitation producing convective systems in the Midwestern United States, Mon. Weather Rev., 140, 1356–1366, 2012.
Hitchens, N. M., Brooks, H. E., and Schumacher, R. S.: Spatial and temporal characteristics of heavy hourly rainfall in the United States, Mon. Weather Rev., 141, 4564–4575, 2013.
Holroyd, E. W.: Lake-effect cloud bands as seen from weather satellites, J. Atmos. Sci., 28, 1165–1170, 1971.
Jenkinson, A. F. and Collison, F. P.: An initial climatology of gales over the North Sea, in: Synoptic Climatology Branch Memorandum 62, Meteorological Office, Bracknell, UK, 1977.
Jones, C.: Occurrence of extreme precipitation events in California and relationships with the Madden-Julian oscillation, J. Climate, 13, 3576–3587, 2000.
Jones, P. D., Hulme, M., and Briffa, K. R.: A comparison of Lamb circulation types with an objective classification scheme, Int. J. Climatol., 13, 655–663, 1993.
Kalnay, E., Kanamitsu, M., Kistler, R., Collins, W., Deaven, D., Gandin, L., Iredell, M., Saha, S., White, G., Wollen, J., Zhu, Y., Chelliah, M., Ebisuzaki, W., Higgins, W., Janowiak, J., Mo, K. C., Ropelewski, C., Wang, J., Leetmaa, A., Reynolds, R., Jenne, R., and Joseph, D.: The NCEP/NCAR 40 year reanalysis project, B. Am. Meteorol. Soc., 77, 437–471, 1996.
Karabörk, M. Ç. and Kahya, E.: The teleconnections between the extreme phases of the southern oscillation and precipitation patterns over Turkey, Int. J. Climatol., 23, 1607–1625, 2003.
Karabörk, M. Ç., Kahya, E., and Karaca, M.: The influences of the Southern and North Atlantic Oscillations on climatic surface variables in Turkey, Hydrol. Process., 19, 1185–1211, 2005.
Karaca, M., Deniz, A., and Tayanç, M.: Cyclone Track Variability over Turkey in Association with Regional Climate, Int. J. Climatol., 20, 1225–1236, 2000.
Karl, T. R., Knight, R. W., Easterling, D. R., and Quayle, R. G.: Indices of climate change for the United States. B. Am. Meteorol. Soc., 77, 279–292, 1996.
Kömüşçü, A. Ü. and Çelik, S.: Analysis of the Marmara flood in Turkey, 7–10 September 2009: An assessment from hydrometeorological perspective, Nat. Hazards, 66, 781–808, 2013.
Kömüşçü, A. Ü., Erkan, A., and Çelik, S.: Analysis of meteorological and terrain features leading to the İzmir flash flood, 3–4 November 1995, Nat. Hazards, 18, 1–25, 1998.
Krichak, S. O., Breitgand, J. S., Gualdi, S., and Feldstein, S. B.: Teleconnection-extreme precipitation relationships over the Mediterranean region, Theor. Appl. Climatol., 117, 679–692, 2014.
Lamb, H. H.: British Isles weather types and a register of daily sequence of circulation patterns, 1861–1971, Geophysical Memoir 116, HMSO, London, 1972.
Lenderink, G. and van Meijgaard, E.: Increase in hourly precipitation extremes beyond expectations from temperature changes, Nat. Geosci., 1, 511–514, 2008.
Lenderink, G. and van Meijgaard, E.: Unexpected rise in extreme precipitation caused by a shift in rain type?, Nat. Geosci., 2, 372–373, 2009.
Melani, S., Pasi, F., Gozzini, B., and Ortolani, A.: A four year (2007–2010) analysis of long-lasting deep convective systems in the Mediterranean Basin, Atmos. Res., 123, 151–166, 2013.
Millan, M. M., Estrela, M. J., and Casellas, V.: Torrential precipitations on the Spanish east coast: The role of the Mediterranean sea-surface temperature, Atmos. Res., 36, 1–16, 1995.
Milrad, S. M., Atallah, E. H., and Gyakum, J. R.: Synoptic typing of cool-season precipitation events at St. John's, Newfoundland, 1979–2005, Weather Forecast., 25, 562–586, 2010.
Moore, B. J., Mahoney, K. M., Sukovich, E. M., Cifelli, R., and Hamill, T. M.: Climatology and environmental characteristics of extreme precipitation events in the southeastern United States, Mon. Weather Rev., 143, 718–741, 2015.
Niziol, T. A.: Operational forecasting of lake effect snowfall in western and central New York, Weather Forecast., 2, 310–321, 1987.
Nuissier, O., Ducrocq, V., Ricard, D., Lebeaupin, C., and Anquetin, S.: A numerical study of three catastrophic precipitating events over southern France. I: Numerical framework and synoptic ingredients, Q. J. Roy. Meteorol. Soc., 134, 111–130, 2008.
Pall, P., Allen, M. R., and Stone, D. A.: Testing the Clausius–Clapeyron constraint on changes in extreme precipitation under CO2 warming, Clim. Dynam., 28, 351–363, 2007.
Pastor, F., Gómez, I., and Estrela, M. J.: Numerical study of the October 2007 flash flood in the Valencia region (Eastern Spain): the role of orography, Nat. Hazards Earth Syst. Sci., 10, 1331–1345, https://doi.org/10.5194/nhess-10-1331-2010, 2010.
Pastor, F., Valiente, J. A., and Estrela, M. J.: Sea surface temperature and torrential rains in the Valencia region: modelling the role of recharge areas, Nat. Hazards Earth Syst. Sci., 15, 1677–1693, https://doi.org/10.5194/nhess-15-1677-2015, 2015.
Piccarreta, M., Pasini, A., Capolongo, D., and Lazzari, M.: Changes in daily precipitation extremes in the Mediterranean from 1951 to 2010: the Basilicata region, southern Italy, Int. J. Climatol., 33, 3229–3248, 2013.
Ralph, F. M. and Dettinger, M. D.: Historical and national perspectives on extreme West Coast precipitation associated with atmospheric rivers during December 2010, B. Am. Meteorol. Soc., 93, 783–790, 2012.
Reale, M. and Lionello, P.: Synoptic climatology of winter intense precipitation events along the Mediterranean coasts, Nat. Hazards Earth Syst. Sci., 13, 1707–1722, https://doi.org/10.5194/nhess-13-1707-2013, 2013.
Reynolds, R. W., Smith, T. M., Liu, C., Chelton, D. B., Casey, K. S., and Schlax, M. G.: Daily high-resolution-blended analyses for sea surface temperature, J. Climate, 20, 5473–5496, 2007.
Ricard, D., Ducrocq, V., and Auger, L.: A climatology of the mesoscale environment associated with heavily precipitating events over a northwestern Mediterranean area, J. Appl. Meteorol. Clim., 51, 468–488, 2012.
Schumacher, R. S. and Johnson, R. H.: Characteristics of U.S. Extreme Rain Events during 1999–2003, Weather Forecast., 21, 69-85, 2006.
Steenburgh, W. J., Halvorson, S. F., and Onton, D. J.: Climatology of lake-effect snowstorms of the Great Salt Lake, Mon. Weather Rev., 128, 709–727, 2000.
Türkeş, M. and Erlat, E.: Precipitation changes and variability in Turkey linked to the North Atlantic Oscillation during the period 1930–2000, Int. J. Climatol., 23, 1771–1796, 2003.
Ulbrich, U. and Christoph, M.: A shift of the NAO and increasing storm track activity over Europe due to anthropogenic greenhouse gas forcing, Clim. Dynam., 15, 551–559, 1999.
Unal, Y. S., Deniz, A., Toros, H., and Incecik, S.: Temporal and spatial patterns of precipitation variability for annual, wet, and dry seasons in Turkey, Int. J. Climatol., 32, 392–405, 2012.
Warner, M. D., Mass, C. F., and Salathe Jr., E. P.: Wintertime extreme precipitation events along the Pacific Northwest coast: Climatology and synoptic evolution, Mon. Weather Rev., 140, 2021–2043, 2012.
Zhang, X. and Yang, F.: RClimDex (1.0)-User Manual, Climate Research Branch Environment Canada Downsview, Ontario, 2004.
Zhang, X., Hogg, W. D., and Mekis, E.: Spatial and temporal characteristics of heavy precipitation events over Canada, J. Climate, 14, 1923–1936, 2001.