the Creative Commons Attribution 3.0 License.
the Creative Commons Attribution 3.0 License.
Characteristics of debris avalanche deposits inferred from source volume estimate and hummock morphology around Mt. Erciyes, central Turkey
Yuichi S. Hayakawa
Hidetsugu Yoshida
Hiroyuki Obanawa
Ryutaro Naruhashi
Koji Okumura
Masumi Zaiki
Ryoichi Kontani
Debris avalanches caused by volcano sector collapse often form characteristic depositional landforms such as hummocks. Sedimentological and geomorphological analyses of debris avalanche deposits (DADs) are crucial to clarify the size, mechanisms, and emplacement of debris avalanches. We describe the morphology of hummocks on the northeastern flank of Mt. Erciyes in Kayseri, central Turkey, likely formed in the late Pleistocene. Using a remotely piloted aircraft system (RPAS) and the structure-from-motion and multi-view stereo (SfM–MVS) photogrammetry, we obtained high-definition digital elevation model (DEM) and orthorectified images of the hummocks to investigate their geometric features. We estimated the source volume of the DAD by reconstructing the topography of the volcano edifice using a satellite-based DEM. We examined the topographic cross sections based on the slopes around the scar regarded as remnant topography. Spatial distribution of hummocks is anomalously concentrated at a certain distance from the source, unlike those that follow the distance–size relationship. The high-definition land surface data by RPAS and SfM revealed that many of the hummocks are aligned toward the flow direction of the debris avalanche, suggesting that the extensional regime of the debris avalanche was dominant. However, some displaced hummocks were also found, indicating that the compressional regime of the flow contributed to the formation of hummocks. These indicate that the flow and emplacement of the avalanche were constrained by the topography. The existing caldera wall forced the initial eastward flow to move northward, and the north-side caldera wall forced the flow into the narrow and steepened outlet valley where the sliding debris underwent a compressional regime, and out into the unconfined terrain where the debris was most likely emplaced on an extensional regime. Also, the estimated volume of 12–15 × 108 m3 gives a mean thickness of 60–75 m, which is much deeper than the reported cases of other DADs. This suggests that the debris avalanche must have flowed further downstream and beyond the current DAD extent. Assessments of the DAD incorporating the topographic constraints can provide further insights into the risk and mitigation of potential disasters in the study area.
- Article
(18616 KB) - Full-text XML
- BibTeX
- EndNote


Catastrophic sector collapses are often observed in volcanoes when they become structurally and gravitationally unstable. The collapses are triggered by earthquakes, magma intrusion, or phreatic eruptions (Siebert, 1984, 1992; Ui, 1983; Ui et al., 2000). This phenomenon is hazardous because of a large amount of mass movement involved that appears as a debris avalanche moving at high speed (Ui, 1975; Vallance et al., 1995; Glicken, 1996; Vallance and Scott, 1997; Yoshida and Sugai, 2006). Furthermore, sector collapse can repeatedly occur on the same volcano after regrowing an unstable flank (Tibaldi and Vezzoli, 2004; Zernack et al., 2009). Such recurrence of sector collapse is often expected in single or multiple directions (Lagmay et al., 2000; Yoshida and Sugai, 2007a; Paguican et al., 2012, 2014). However, since the recurrence interval is not constant and the stationary period can last for more than 103 to 104 years (Moriya, 1988), the areas around an unstable volcano can be highly urbanized without considering the risk of a sector collapse. In particular, the downstream area of debris avalanche deposits (DADs) is often flat enough to be urbanized or cultivated. In such urbanized areas, detailed information of the past debris avalanche including its timing, size, and kinematics is crucial for the future hazard assessment.
Debris avalanches caused by a volcanic sector collapse form characteristic depositional landforms called hummocks, composed of large block facies within a matrix (Siebert, 1984; Ui et al., 1986, 2000; Orton, 1996). Block facies are composed of the volcanic edifice transported, potentially showing an intact clast or multiple deformed clasts of a single or multiple rock types (Evans and DeGraff, 2002). Within the domain of debris avalanche deposits, hummocks often have clear boundaries and are readily identifiable, thus providing a chance to carry out the robust size and shape analysis (Mizuno, 1958; Hashimoto et al., 1979). Such a morphology of hummocks, located on the surface of DADs, can be used to estimate the characteristics of the debris avalanche, i.e., the kinematics of the sliding mass (Dufresne and Davies, 2009; Koarai et al., 2008; Yoshida and Sugai, 2010; Yoshida, 2012, 2013, 2014; Yoshida et al., 2012). Although sedimentological investigations of the internal structures of DADs often provide insights into the transport mechanisms (e.g., Glicken, 1996; Bernard et al., 2008; Shea et al., 2008), geomorphological or geometrical analyses of the surficial morphology of DADs including hummocks can also provide estimations on the size and processes of the debris avalanche. In particular, because the sedimentary structure is mutually related to the hummock distribution and shape, the distribution and morphology of hummocks formed in DADs provide an opportunity to examine the volumetric and kinematic characteristics of the debris avalanche (Dufrense and Davies, 2009; Yoshida and Sugai, 2010; Yoshida et al., 2012). During the sliding of a sector collapse, the fractured mass of the original volcanic edifice forms collapse structures along with the alternate regimes of extension and compression (Paguican et al., 2012, 2014). This often results in the alternate extensional and compressional structures of DADs along the avalanche path, while the compressional regime may result in the denser distribution of hummocks particularly around the flow front (Yoshida et al., 2012).
Hummocks are often on the order of tens to hundreds of meters in size, so aerial photographs are often used for their identification and morphological analysis (Glicken, 1996; Yoshida, 2012, 2013, 2014; Yoshida and Sugai, 2010; Yoshida et al., 2012). Digital elevation models (DEMs) by airborne laser scanning (ALS) within 1–5 m resolution can also be used for such analysis (e.g., Hayakawa et al., 2017), but such high-definition data including paired aerial photographs and ALS DEMs are often unavailable in many areas. High-definition satellite remote sensing imagery and DEMs can also be used for the analysis of hummocks, but the acquisition cost is often high and may not be readily obtained in many cases. Due to availability, details of many known DADs remain unexamined.
Recent developments in the remotely piloted aircraft system (RPAS), as well as that in the structure-from-motion and multi-view stereo (SfM–MVS) photogrammetry, have enabled on-site, cost-efficient acquisition of high-definition topographic and imagery data (e.g., Westoby et al., 2012; Fonstad et al., 2013; Obanawa et al., 2014; Hayakawa et al., 2016). Such detailed earth surface data are useful for detailed topographic analysis, including topographic feature extraction and landform classifications, for areas of approximately 0.1–10 × 109 m2 that cannot be achieved by low-resolution satellite imagery (e.g., Koarai et al., 2008). Moreover, although ordinary aerial photographs taken by manned aircraft have often been utilized to investigate topographic features of DADs in such a small- to medium-sized area (Siebert, 1984; Glicken, 1996; Yoshida and Sugai, 2007a, 2012), high-quality stereo-paired aerial photographs are often unavailable in many areas over the world. Without the availability of ordinary aerial photographs, RPAS-derived land surface data (topography and imagery) are therefore useful enough even if not fully taking advantage of their highest resolution. Furthermore, the higher-resolution data acquired by RPAS should serve as a potential archive for future studies, because the rapid increase in the use of RPAS will enable further data collection of such high-definition data in many areas.
Using the combined RPAS- and satellite-derived topographic data, we analyze the morphology of hummocks and DAD on the northeast flank of Mt. Erciyes, previously described by Şen et al. (2003). We use RPAS for the acquisition and analysis of detailed, high-definition morphological data for the hummocks formed on the DAD, where neither ordinary stereo-paired aerial photographs nor ALS-derived topographic data are available. The high-definition topographic data are crucial for the identification and analysis of 10 to 100 m scale hummocks. We also utilize topographic data at 10 m resolution from satellite synthetic-aperture radar imagery for the analysis of the surrounding areas. The volume of the DAD crucial for describing the sector collapse, which is hard to know from the extent and depth of the deposits, is obtained by reconstructing the original topography of the source area.
Mt. Erciyes, located in the south of the Kayseri city in central Turkey (Fig. 1), is the highest stratovolcano in this region with an elevation of 3917 m at its summit. The current volcano edifice was formed after the pre-Erciyes volcanic activities terminated about 3 Ma with an extensive ignimbrite eruption (Innocenti et al., 1975; Şen et al., 2003). The stratigraphy of Mt. Erciyes is composed of basaltic, andesitic, and dacitic lava flows in ca. 2.5–0.2 Ma, followed by pumice and pyroclastic flow deposits (Şen et al., 2003).

Figure 1Map of the study area. A–E are different areas in DAD. A: source area; B: DAD; C: andesitic lava domes; D: lake area; E: flat lava terrain over which most of the debris went after exiting the narrow gorge. Dark polygons are hummocks; other polygons are other lithological units not affected by the avalanche. The dashed curving gray line with triangles indicates the remnant of caldera walls before the formation of the modern Mt. Erciyes. The Erciyes Fault is shown with the thick black dashed line as mapped by Emre et al. (2011). The stars indicate the locations of outcrops described in this study, and the dotted white arrow is the estimated course of the debris avalanche in this study. Note that the northern half of the lava domes (C) previously mapped by Şen et al. (2003) is in fact the DAD.
The youngest deposit is the DAD, emplaced after 83 ka (Şen et al., 2003). Moraines that formed in the last glacial maximum (21.3 ka) are also present in the valley along the avalanche flow (Üçker valley, A in Fig. 1) (Sarıkaya et al., 2009). This gives an approximate age of the sector collapse of between 20–80 ka.
The DAD is observed within 2000–9000 m downstream along a fluvial valley from the mountaintop, covering an area of ∼ 14 × 109 m2 (Şen et al., 2003) (B and northern part of C in Fig. 1). The downstream extent, however, is hard to identify due to limited exposure and erosion and remobilization of DAD after emplacement, particularly in the fluvial valley. Nevertheless, we found several outcrops of the DAD along a newly constructed highway with locations shown as stars in Fig. 1. The farthest outcrop is 16 000 m away from the summit of Mt. Erciyes. Moreover, hummocks appear within 11 000–13 000 m downstream from the summit. These indicate that the potential extent of the DAD is farther downstream over the area mapped by Şen et al. (2003), with an area greater than 20 × 109 m2.
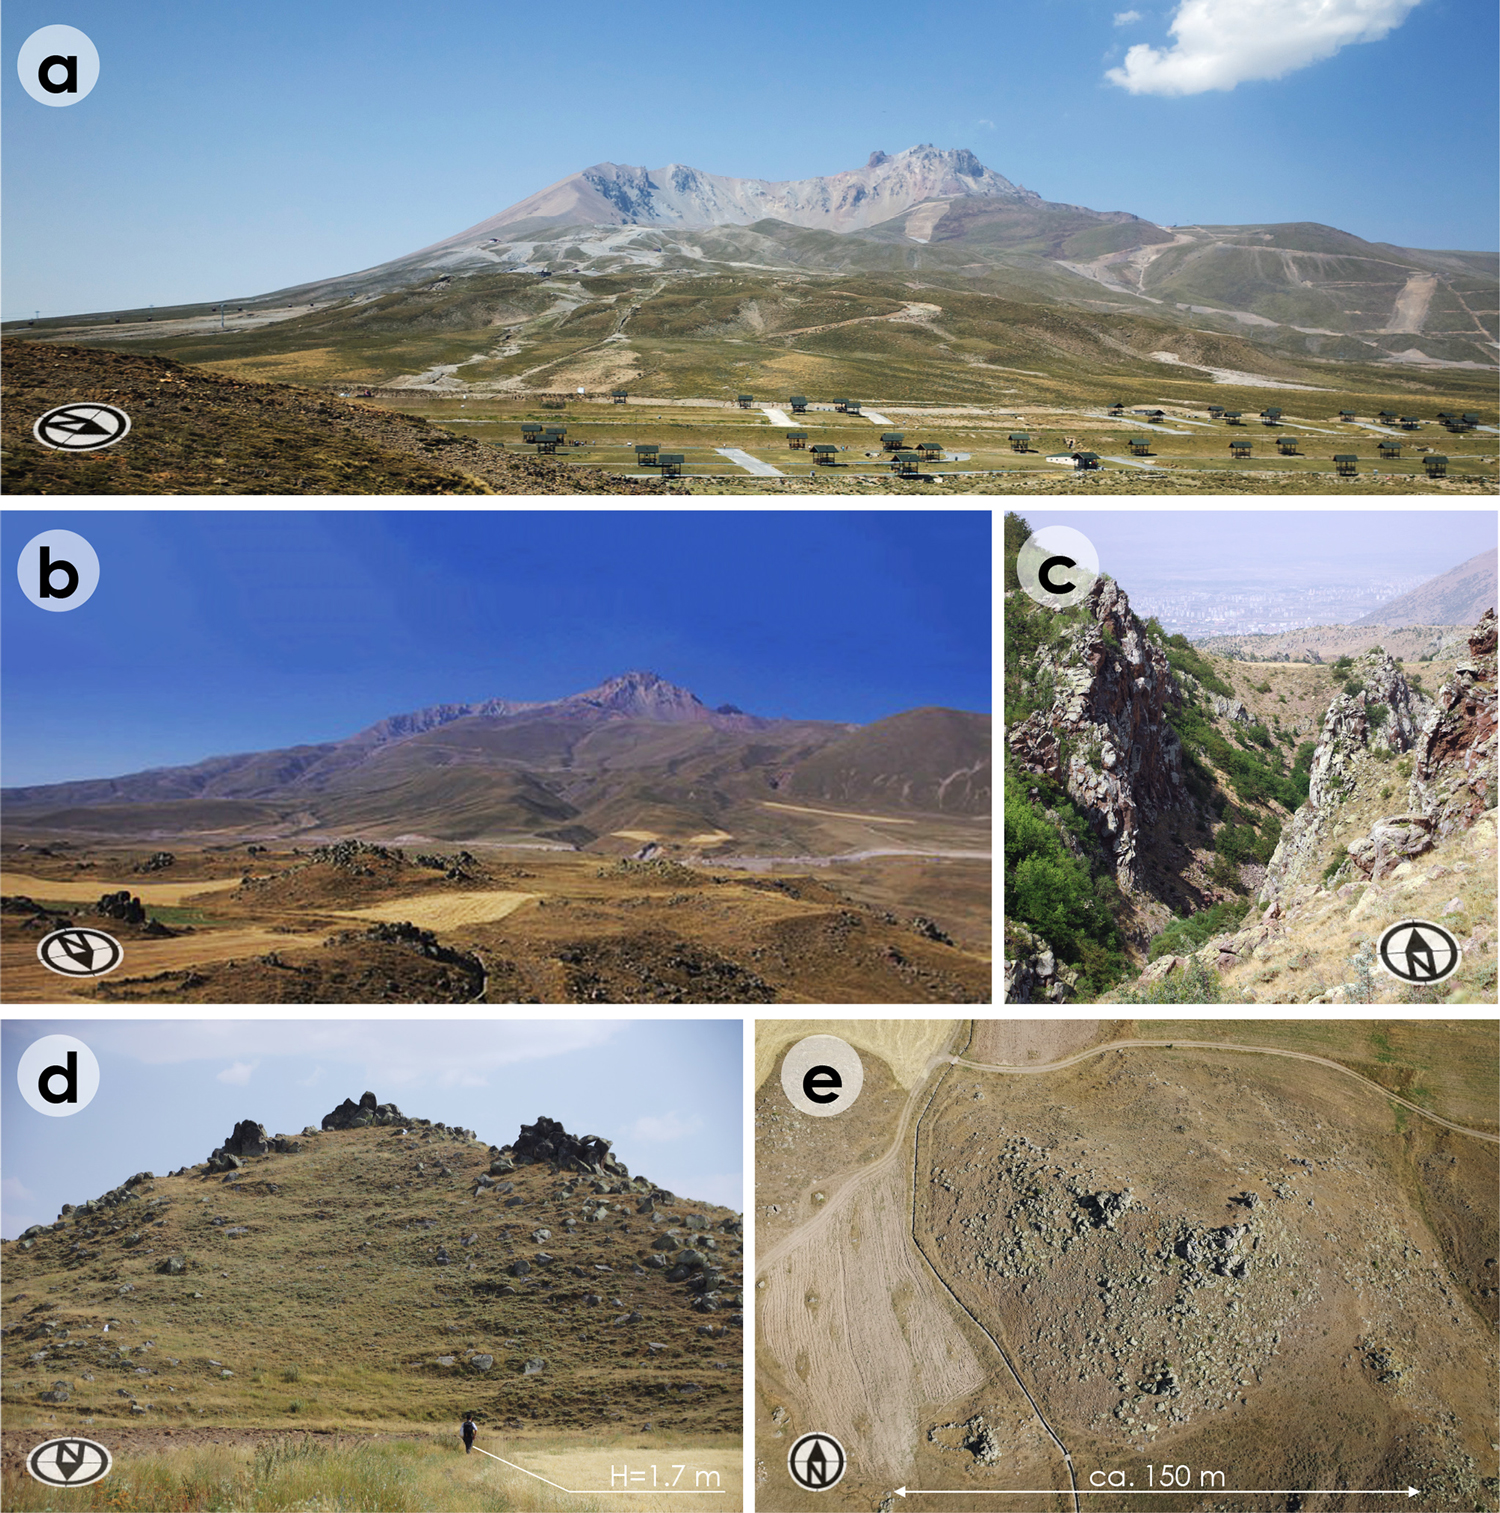
Figure 2Pictures of the study area. Locations of these photos are shown in Fig. 1. (a) Collapse scar of Mt. Erciyes (photo taken westward). On the foreground is where the avalanche changed direction from east to north. The relative height of the edifice is 1800 m (∼ 2100 m a.s.l. on the foreground DAD surface and 3917 m a.s.l. at the summit). (b) Mt. Erciyes and the 10 to 100 m sized hummocks on the foreground (photo taken southward). (c) Downstream view of deeply incised gorge past the hummock-dominated area (photo taken northward). The incision depth is ∼ 40 to 60 m. (d) Ground-based view of a hummock, ∼ 30 m high (photo taken southward). (e) Aerial view of hummock in (d) with a diameter of ∼ 150 m (photo without distortion correction).
Based on the collapse scar (Fig. 2a), the debris avalanche was supposed to be flowing to the east (A in Fig. 1). The flow then turned to the north due to confinement by preexisting caldera walls. Unfortunately, we could not find any outcrops in the field including abutting deposits on the footslopes of caldera wall. However, the present lake, which is located in the south of the bend of the DAD and now serves as a reservoir (D in Fig. 1), is possibly a remnant of a dammed lake. Based on this, it is clear that the debris avalanche flow did not largely turn to the south, but followed northward along the preexisting caldera wall.
Hummocks, characteristic mound-shaped topographic features of DADs, are densely located in an approximately 2 × 10⁹ m2 area around 11 000–13 000 m (along-valley distance) from the summit of Mt. Erciyes. Our topographic measurements, therefore, focus on this domain. As noted, this domain of hummocks is out of the range of the DAD area previously reported (B in Fig. 1; Şen et al., 2003), but the potential extent of the DAD likely covers this domain and farther downstream (E in Fig. 1). In our investigation, no hummock is observed in other areas of the DAD along the valley. Mound-shaped features on the eastern side of the DAD (C in Fig. 1) are confirmed to be basaltic or andesitic lava domes.
The left-lateral strike-slip Erciyes Fault is mapped to potentially cut across Mt. Erciyes along the north–northeast direction (Emre et al., 2011). It is a member of the Ecemiş Fault group of the East Anatolian Fault zone. The age and history of the fault activity, however, are not well known.
The climate in the area is warm and dry, with an annual precipitation of ∼ 400 mm, resulting in scarce vegetation cover. Climatic fluctuations including relatively wet periods in the late Pleistocene to Holocene have been dry enough that no dense vegetation has grown since the last interglacial (Kuzucuoglu et al., 1999; Bayer Altin et al., 2015; Pickarski et al., 2015). Hence, the slope processes have not been active enough to significantly modify the topography. The original topography of the debris avalanche, as well as the landforms surrounding the sector collapse, is therefore supposed to be well preserved, except for areas around valley bottoms where fluvial or glacial modifications have been active and volcanic alluvial fans are well developed.
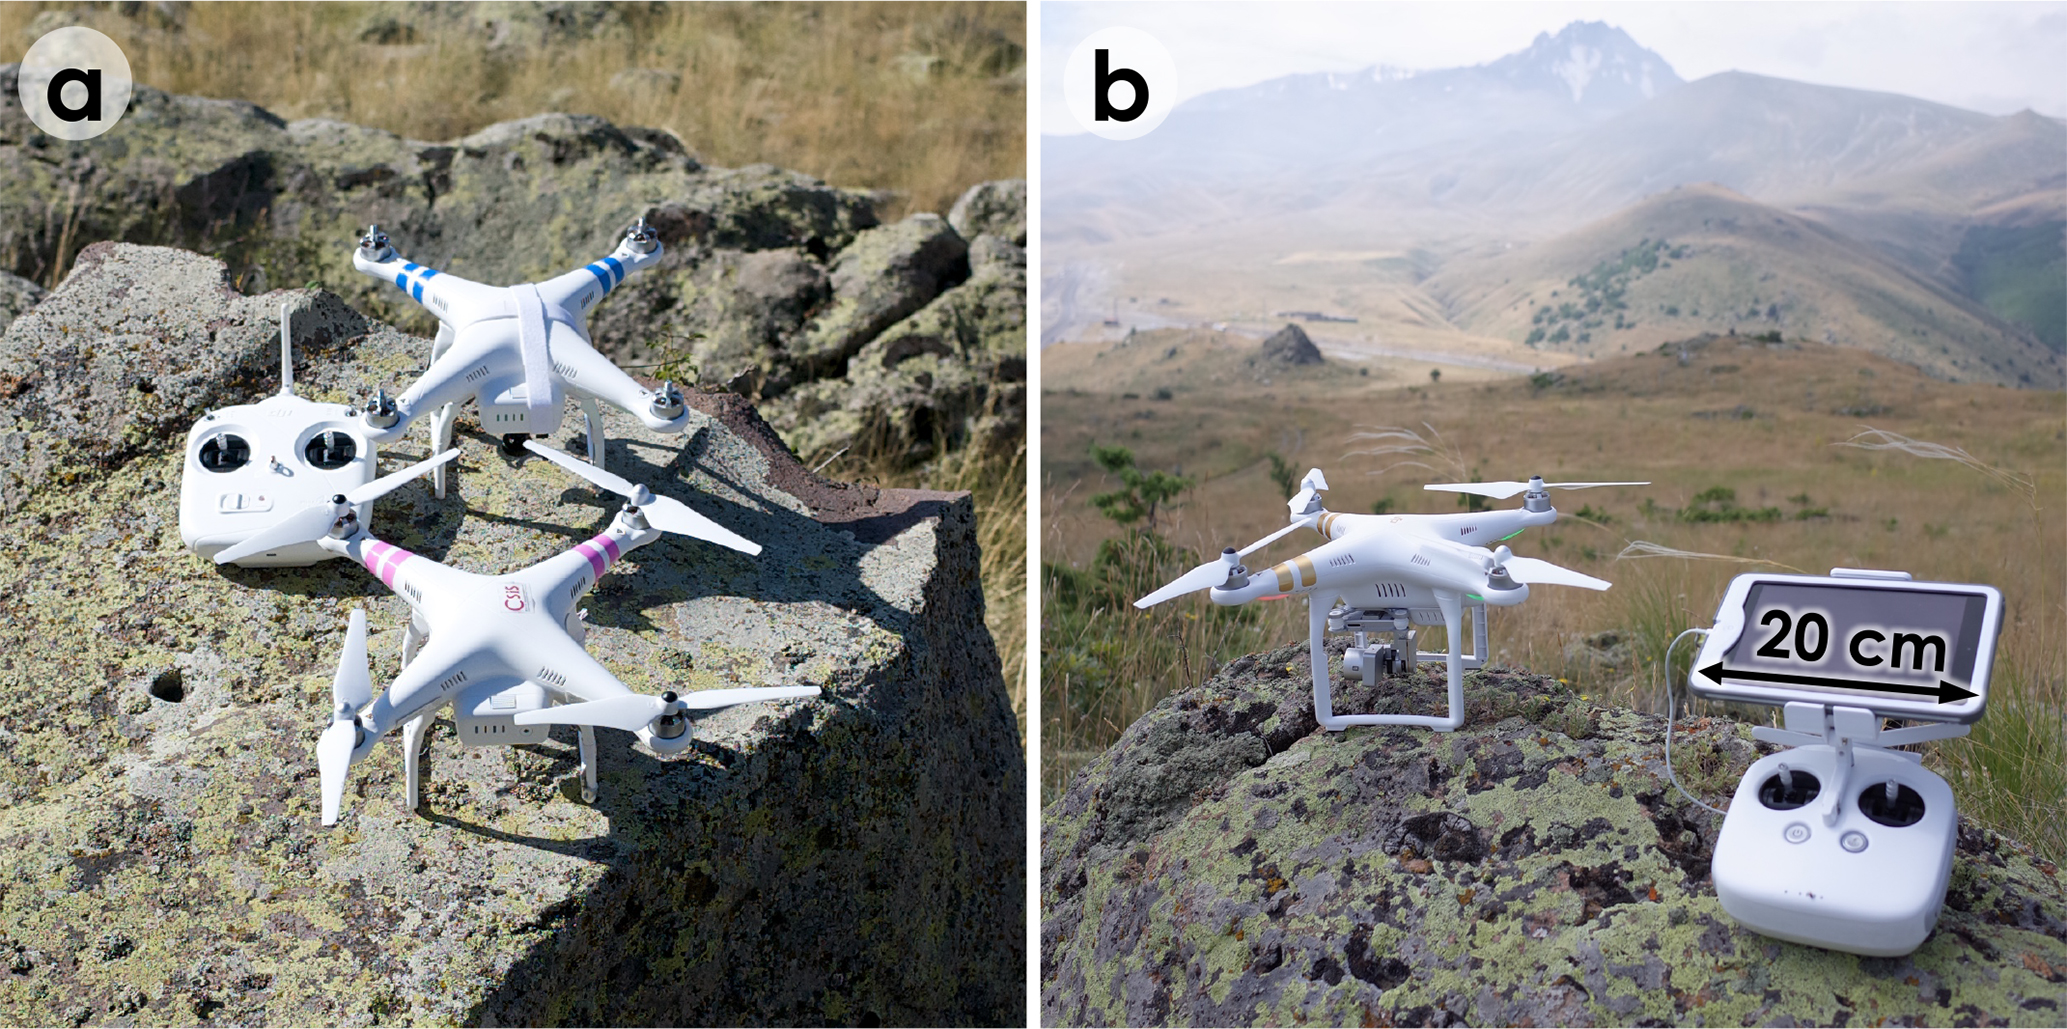
Figure 3RPAS used in this study. (a) DJI Phantom 2. External digital cameras of Nikon Coolpix A and Ricoh GR are attached. (b) DJI Phantom 3 Professional with a built-in digital camera.
3.1 RPAS-based SfM–MVS photogrammetry and hummock mapping
To measure the detailed surface morphology of the DAD, we apply the SfM–MVS photogrammetry using low-altitude aerial photographs taken by an RPAS (Fig. 3). The RPAS includes a small unmanned aerial vehicle (UAV) equipped with a digital camera that obtains low-altitude aerial photographs in the field. The image data obtained are used to capture earth surface condition and morphology data with a relatively broad areal coverage, typically for 0.1–10 × 109 m2. We used two UAVs for the measurement: (i) DJI Phantom 2 on which a Nikon Coolpix A (sensor resolution: 4928 × 3264 pixels; 35 mm equivalent focal length: 28 mm) digital camera or Ricoh GR (sensor resolution: 4928 × 3264 pixels; 35 mm equivalent focal length: 28 mm) is mounted and (ii) DJI Phantom 3 Professional with a built-in stabilized camera FC300X (sensor resolution: 4000 × 3000 pixels; 35 mm equivalent focal length: 20 mm).
The UAVs are flown from several locations in and around the hummocky area. The UAVs were manually operated, and flight courses were set to cover the area of interest sufficiently. During flights, the camera shutter automatically records data every 2 s. A flight of ∼ 10 to 20 min takes 300–600 photographs.
Geographical coordinates of several ground control points (GCPs) were obtained, using a post-processed kinematic Global Navigation Satellite System (GNSS) receiver. The Trimble GeoExplorer 6000XH was used as the GNSS rover, with log data corrected using the fixed GNSS base station of the International GNSS Service (IGS) network. The GCPs are in the main target area around the hummocks. Characteristic objects that are readily identifiable in the aerial photographs were selected as GCPs such as road intersections, flat stone surfaces on bridges, and large flat-topped boulders. The projection of the geographical coordinates is set to UTM zone 36N on WGS 84 (EPSG:32636).
We carried out SfM–MVS photogrammetry using PhotoScan Professional Edition photogrammetric software by Agisoft LLC. From multiple photographs, the SfM process provides three-dimensional positions of the stereo-paired photographs, in which the same features are identified among the paired photographs as tie points. Although geographical coordinates of the camera locations can be known from the GNSS records in the built-in camera of the UAV devices, the positional accuracies of the single-source GNSS receiver of the UAVs are low, being on the order of meters. Several GCPs whose coordinates are obtained by the post-processed GNSS receiver are therefore placed in the image data to improve positional accuracies at a decimeter level, which are low enough for the analysis of hummocks in 101–103 m2 scales. The tie point cloud is adjusted to fit the GCPs (bundle adjustments), and the points with large reprojection errors (≥ 1.0 pixels) are removed to achieve decimeter-scale accuracies of the bundle adjustments. By the MVS-photogrammetric process, denser three-dimensional points are further obtained from the aligned and paired images. Based on the resultant point density and ground resolution of the images, the resolution of the raster data including a DEM and an orthorectified composite image is determined.
Slope distribution and topographic contour lines are derived from the DEM using GIS software (ArcGIS Desktop 10.3 by Esri). Hummock bases were manually traced using the DEM-derived topographic data and orthorectified image. Although several approaches to automatically derive hummocky mounds from DEMs that may be useful for inaccessible remote areas have been proposed, manual interpretation from stereo-paired aerial photographs and field validation have long been the standard method, which is still the robust way (Glicken, 1996; Yoshida et al., 2012; Hayakawa et al., 2017). In this study, we carried out manual identification of hummocks using the RPAS-derived DEM and orthorectified aerial images instead of stereo-paired aerial photographs that are unavailable in this area. The procedures are as follows.
To identify local convex mounds in the DEM, the elevation values are multiplied by −1 to generate the inverse of the DEM, and the local depressions in the inverse surface are highlighted by applying the sink-fill process. For this process, the D8 flow directions, which are the potential water flow directions simply identified using the lowest elevation in the surrounding eight cells (Jenson and Domingue, 1988), are derived from the inverse DEM, and the depressions are virtually filled up to match with the local trend surface. The filled areas roughly correspond to the local mounds in the original DEM. This generally results in the interpretation of some large hummocks having several peaks, if those peaks are closely located and elevated compared to the surrounding flat areas. If the surrounding areas are sloping, the mound base can be underestimated due to the insufficient filling of the depressions (inverse of the mounds). Therefore, these local mounds are used as a supportive material for the manual interpretation of hummocks
Together with the image of local mounds, orthorectified ground-surface image and slope maps are used to manually detect boundaries of the actual mounds. Because the flat lands, which are predominantly composed of the DAD matrix, are mostly cultivated whereas the mounds of hummocks are unsuitable for cultivation due to their rocky composition, the boundaries of the hummock mounds can be clearly interpreted in the ground-surface images. Also, the gap of slope angles is clear enough to separate the steep mounds and surrounding flat lands.
Topographic contour lines and hillshade image maps derived from the DEM are also supportively used for the manual tracing of mound boundaries. However, boundaries are not always horizontal and the contour lines do not generally follow the mound boundaries except in flat areas. In that case, interpretations by the local mound images, aerial images, and slope maps are given priority.
After polygon vector data of hummock boundaries were obtained, a field check was done to ensure the reliability and accuracy of interpreted hummock boundaries. In the field, the composition of mounds is mainly checked to confirm whether the interpreted mounds are actually hummocks and whether the boundaries are correct.
The geometric features of hummocks are then examined in GIS and the area is calculated for each polygon. The height of a hummock is estimated by constructing a flat basal surface by interpolating elevation values on the polygon peripherals by triangular irregular network (TIN) surface. The maximum difference between the actual surface and the estimated basement surface is regarded as the height of the hummock. Although the actual mass of a hummock should exist in the underground areas, the depth of such a submerged structure is less known, and the surficial height of hummocks has often been utilized as a representative index showing their morphological characteristics (Glicken, 1996). The upper-half volume of a hummock, i.e., the volume of the hummock mound above the basement surface, is also obtained as one of the proximal indicators of the hummock size. The volume is calculated as the sum of the elevation differences between the actual surface and the estimated basement surface for each cell in a hummock polygon.
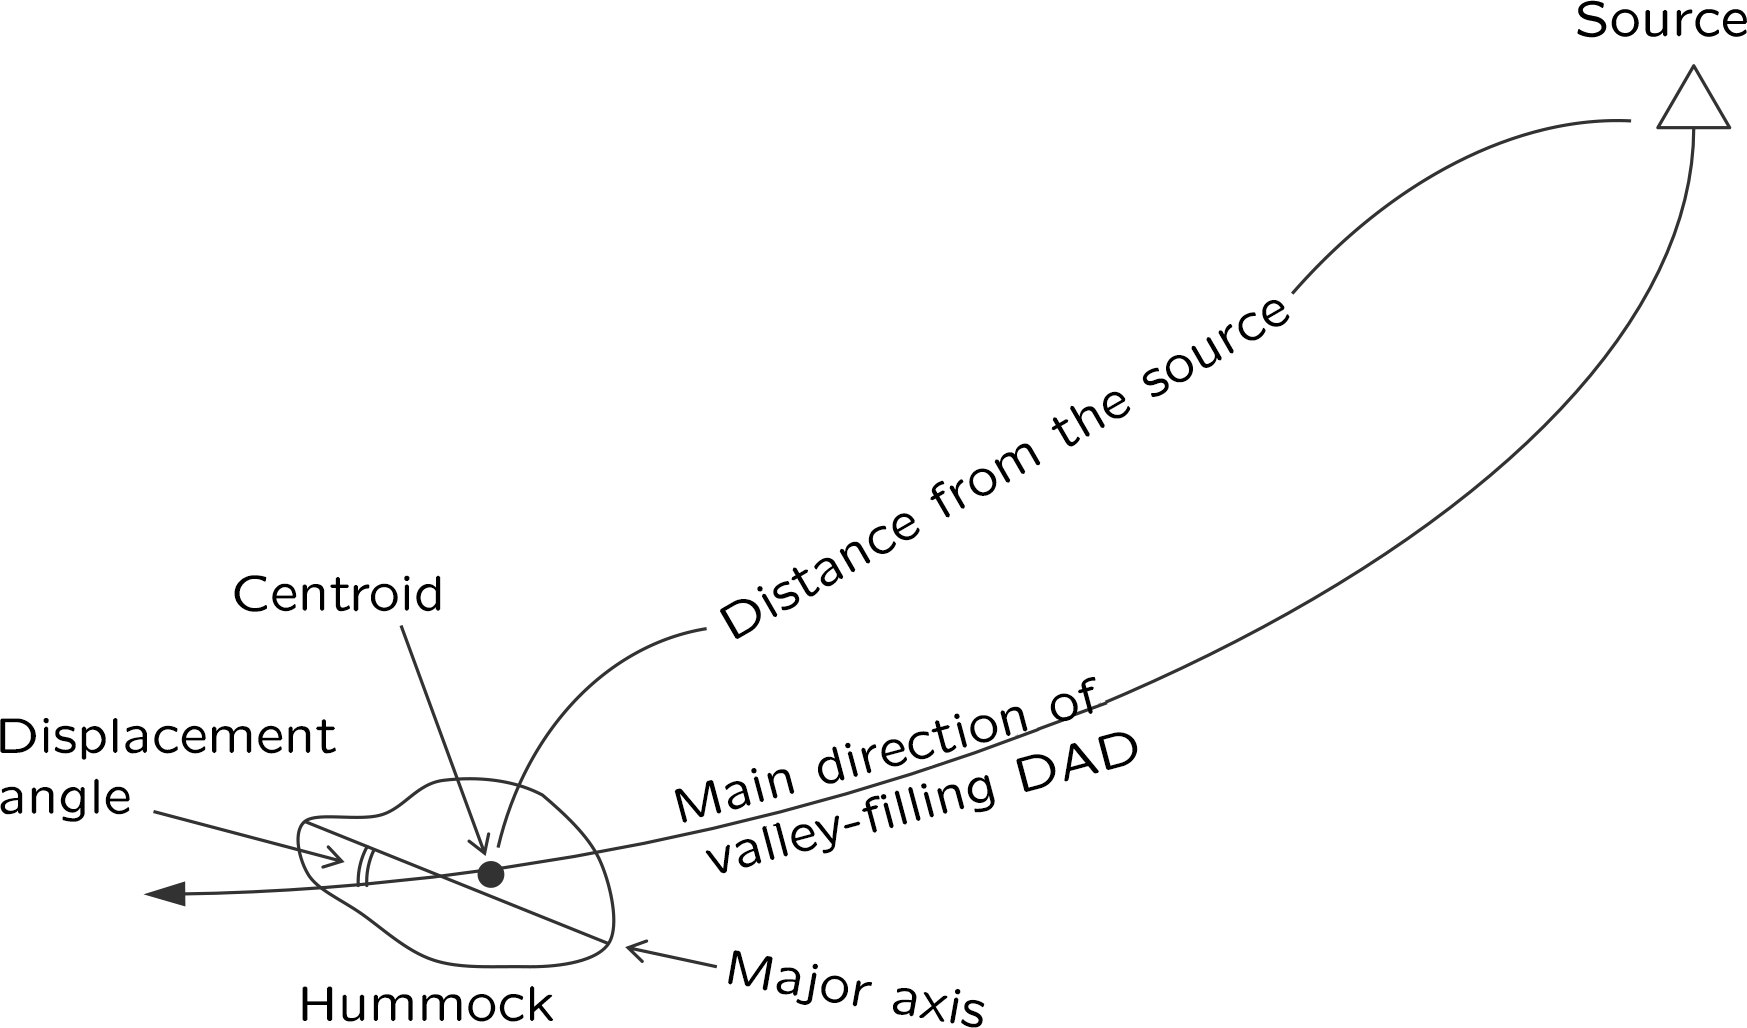
The relationship between hummock alignments and the flow direction of the debris avalanche has been studied. The orientation of hummocks is a key morphological measure to investigate the dynamics of debris avalanches (Glicken, 1996; Paguican et al., 2012; Yoshida, 2014). Here, two directionality indices of the polygons are calculated based on their major axis. One is the direction from the north and another is the displacement angle against the flow direction of DAD. These two are similar measures because the main direction of the DAD is to the north but different in that the former has both positive (east) and negative (west) values, while the latter only gives absolute values. Figure 4 shows the definition of the displacement angle of the major axis of a hummock: the absolute angle between the main direction of the valley-filling DAD and the major axis (Yoshida, 2014). The distance from the source along the valley, as explained later, is also assigned to the centroid of each polygon (Fig. 4).
3.2 Reconstruction of the source area of DAD using the PRISM DEM
We use satellite-based imagery and topographic data to cover wider areas than the RPAS-derived data: AVNIR-2 (Advanced Visible and Near-Infrared Radiometer type 2) and PRISM (Panchromatic Remote-sensing Instrument for Stereo Mapping), both of which were mounted on ALOS (Advanced Land Observation Satellite). The AVNIR-2 sensor has four bands for visible and near-infrared wavelengths, with a typical resolution of 10 m. These data are too coarse for hummock extraction but can be used as background data. The AVNIR-2 data were used to confirm the hummocky topography in and around the DAD. The PRISM optical sensor is a panchromatic radiometer for wavelengths of 0.52–0.77 µm, with a spatial resolution of 2.5 m. The original data were processed to generate a 3 m resolution DEM with a vertical accuracy of ∼ 6 m (Takaku and Tadono, 2007; Habib et al., 2017). This is resampled to 10 m resolution to avoid surficial noises. Although there are still errors, particularly around the borders of mosaic images due to mismatch, the DEM can be used as a background topographic condition covering the whole area of the sector collapse, DAD, and surrounding areas. The resolution and accuracy of the DEM are, however, unsuitable for the extraction and analysis of small hummocks.
The PRISM DEM was further processed to show topographic characteristics in the study site. The distances along flow paths based on the D8 flow directions are generated using the hydrological toolset in the GIS software, providing the position of the hummocks (the distance from the source) based on the flow directions (Fig. 4). The longitudinal and transverse profiles along the main course of the DAD are also obtained from the PRISM DEM. Elevation and distance from the source (the summit of Mt. Erciyes) are sampled at a 100 m interval along the main course of the debris avalanche for the longitudinal profile. At the same time, the maximum elevation within a 500 m length of a transverse cross section perpendicular to the flow direction is recorded for each sampling point to represent the amount of relief along the valley bottom. Stream gradients at different scales are calculated from the sampled elevation by averaging for 400 and 2000 m horizontal lengths. The 400 m scale stream gradient represents local fluctuations in the longitudinal profile, while the 2000 m gradient reflects the trend of elevation changes along the profile. Transverse cross profiles (3000 m long) perpendicular to the flow direction are extracted at every 1500 m along the main course of the debris avalanche.
The original surface of edifice slopes before the sector collapse is estimated based on the shape of the surrounding slopes, assuming that the topography has not been highly modified. For this purpose, two different approaches are applied: one is a simple linear extrapolation of the original slopes in a cross profile on both sides of the sector collapse, and the other is the fitting of a Bézier curve to the linearly extrapolated cross profile. The linear extrapolation may result in an overestimate of the original surface, while the Bézier curve fitting may result in an underestimate. The original surface may fall within these two different reconstructions. For the linear extrapolation, the cross-section points on the surrounding slopes just behind the scars which are supposed to be original topography are used as the source. The length of the cross sections for the linear fitting is defined as ∼ 400 m, according to the preservation of slope linearity in the cross sections. The extrapolated two lines over the collapsed area from both sides of the scar (P0 and P2 in Fig. 5) cross at a certain point (P1 in Fig. 5), which is regarded as the ridge of the reconstructed original slopes.
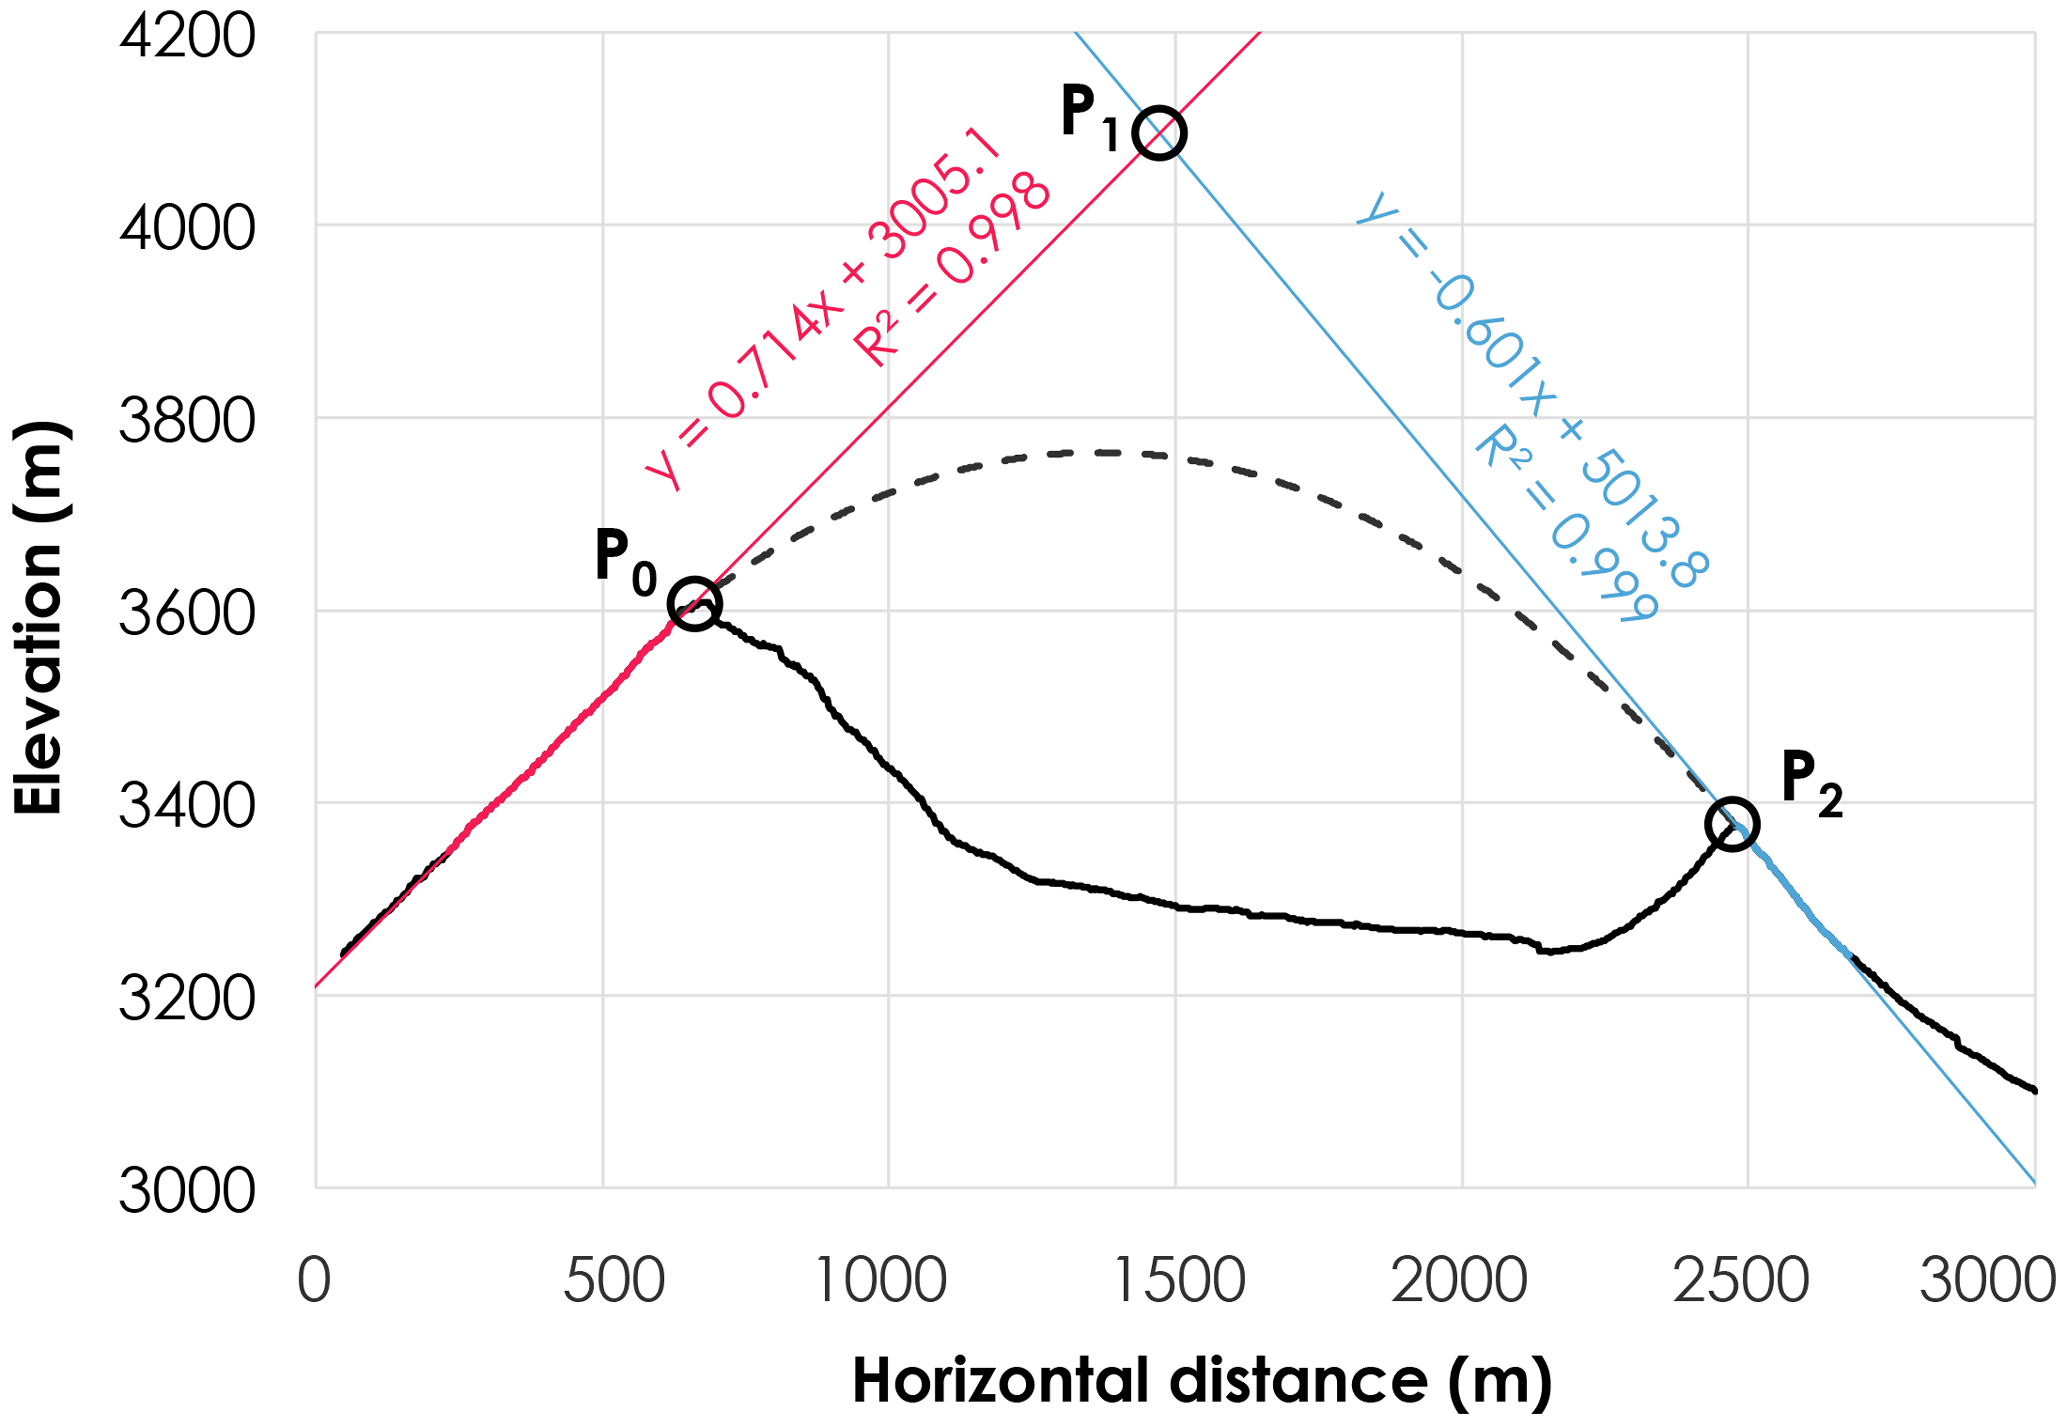
Figure 5Reconstructing the original topographic surface of the sector collapse by two methods: linear extrapolation (solid red and blue lines) and Bézier curve fitting (dashed line).
For the quadratic Bézier curve fitting, the edge points of the surrounding slopes on both sides of the collapsed area (P0 and P2) are used as the endmost control points, while the intermediate control point (P1) is given as the cross point of the two linearly extrapolated lines (Fig. 5). The function of a quadratic Bézier curve is given as
and hence
where B(t) is the estimated elevation and t represents the relative position between the points of P0 and P2 (0 1). Equation (2) was applied to the multiple transverse profiles across the collapsed area (A in Fig. 1), which are set at a horizontal interval of 300 m.
Reconstruction of the original topography by linear and Bézier methods used three-dimensional TIN models. The differences between the reconstructed TIN surface and the present land surface are calculated as the estimated volumes of the sector collapse.
4.1 Morphometric characteristics and distribution of hummocks
There were eight UAV flights that took 2900 photos. Of these, 1572 were used for photogrammetry after excluding low-quality or misaligned images. To adjust the geographical coordinates of the tie points and camera locations, GCPs were set in the images and the tie points and camera locations were adjusted to fit the GCP-derived coordinates. Five GCPs were set around the main hummock area. Geographical coordinates taken by the post-processed GNSS-provided positional errors of 0.31 and 0.41 m in horizontal and vertical directions, respectively. The bundle adjustment using these GCPs resulted in the estimated horizontal and vertical accuracies of the topographic model of 0.48 and 0.99, respectively. Although the number of GCPs is not high, and the errors are on the order of decimeters, we assume that these error values are sufficiently low for the 101–103 m2 hummock analysis. After removing the points with large reprojection errors (> 0.79 pixels), the number of valid tie points for the paired images was 14 220 242. The multi-view stereo photogrammetry was then performed to generate the dense point cloud of 51 505 810. Based on this three-dimensional point cloud and the original images, the data of land surface imagery and topography were obtained, covering an area of 8.5 × 10⁹ m2. The resolution of the raster-type topographic data (DEM) was set to be 36 cm, based on the average point density of 7.8 pts m−2. The orthorectified image was given with a resolution of 9.0 cm, based on the average ground resolution of the original image of 8.96 cm pix−1.
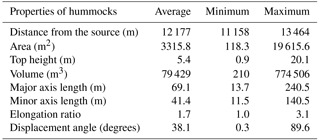
The outline of hummocks was then traced from the RPAS-derived topographic and image data (Fig. 6). In total, 65 hummocks were extracted, and all are within ∼ 11 000 to 13 000 m away from the DAD source. Table 1 shows the basic morphological properties of the hummocks. The polygon area ranges over 2 orders of magnitude from 100 m2 to 20 000 m2, with a mean area of 3315 m2. The height shows less variation from 1 to 20 m with a mean of 5.4 m, while the volume largely ranges from 200 to 770 000 m3 with a mean of 79 429 m3. The lengths of major and minor axes are tens to hundreds of meters with means of 69 and 41 m, respectively. The mean elongation ratio, i.e., the length ratio of the major axis to the minor axis, is 1.7, which is equivalent to an approximate aspect ratio of 5 : 3 of the hummock bounding box.
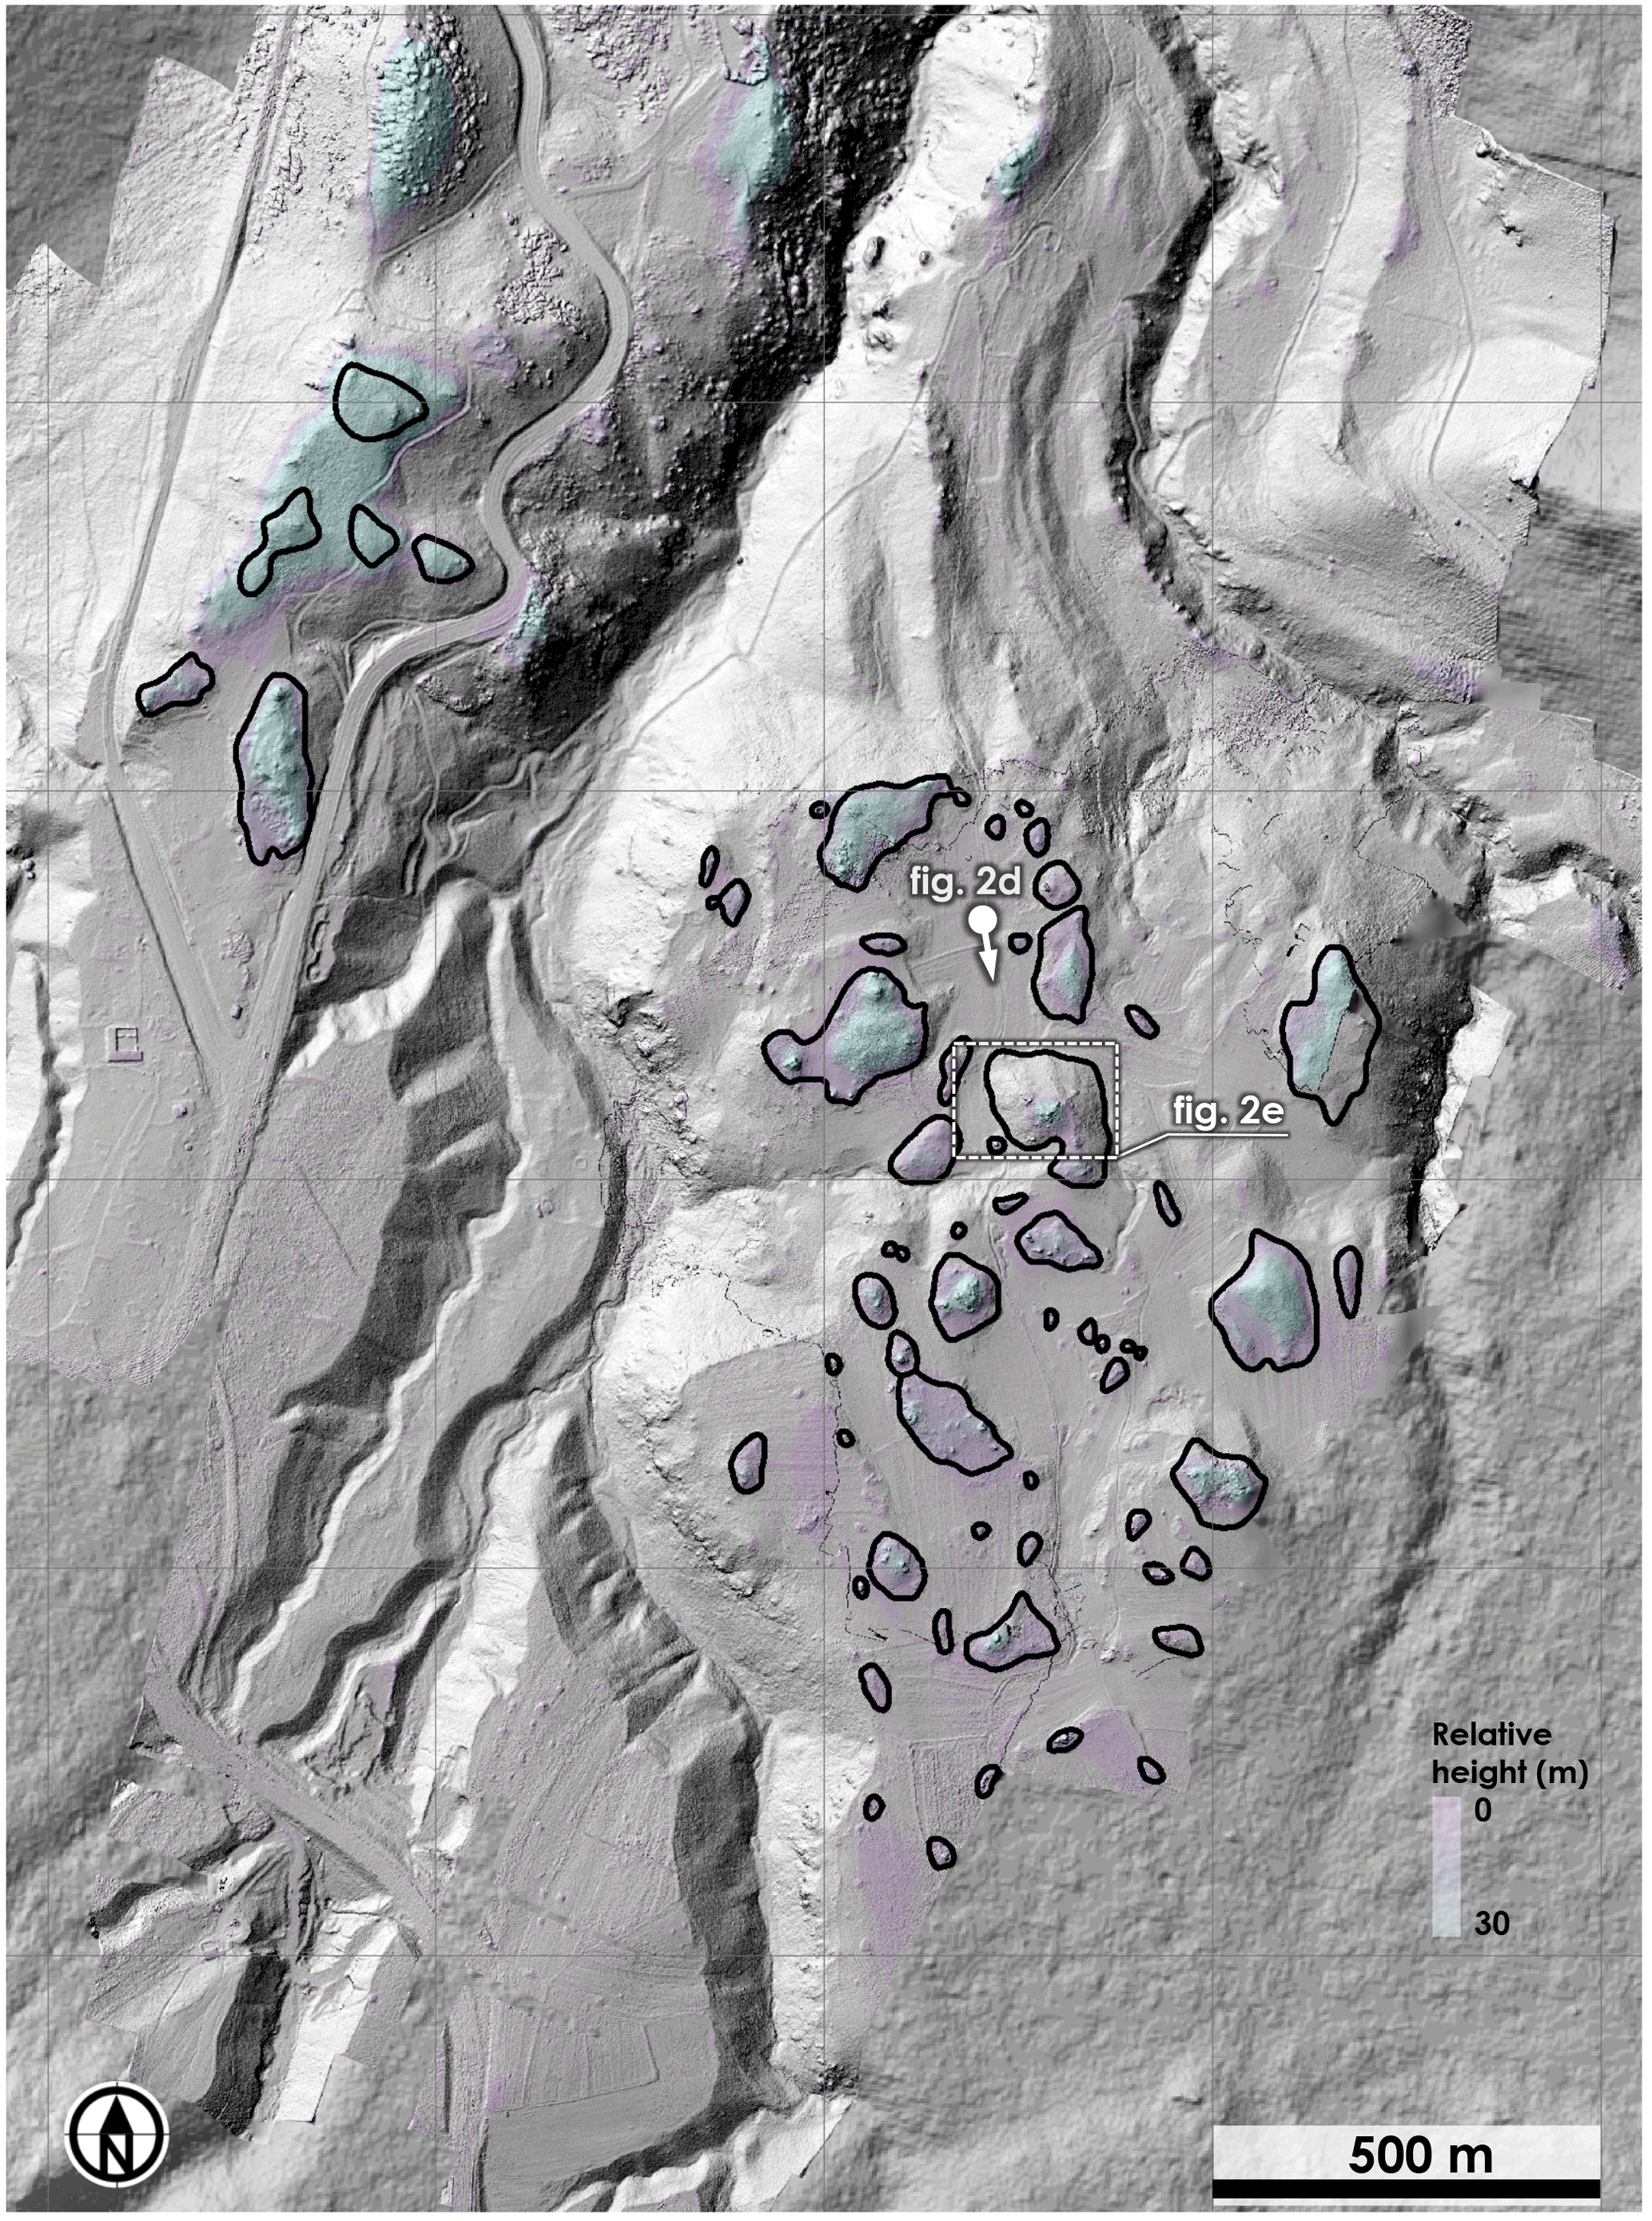
Figure 6Map of the hummocks extracted in the study area (n=65). Blue to purple colors show the sink-filled areas on the inverse DEM, indicating the locations of local mounds and ridges. Black solid lines represent the mound boundaries of hummocks identified. Note that not all the sink-filled areas are identified as hummocks, based on the interpretation of orthorectified images and field observations. Hillshade images are derived from the RPAS-derived 36 cm DEM (foreground) and 10 m PRISM DEM (background).
The displacement angle (the relative orientation against the flow direction of the debris avalanche) almost fully ranges from 0 to 90∘, with an average of 38∘. Figure 7 shows more details of the orientation and displacement of the hummocks in histograms. The north-based orientation shows a large fraction toward the north (Fig. 7a), while the displacement angle shows a bimodal distribution in the histogram, with a relatively large fraction around 0–40∘ (Fig. 7b). These indicate that many hummocks tend to follow the direction of the northward flow of the debris avalanche, but some are exceptionally placed with large displacements against the flow direction.
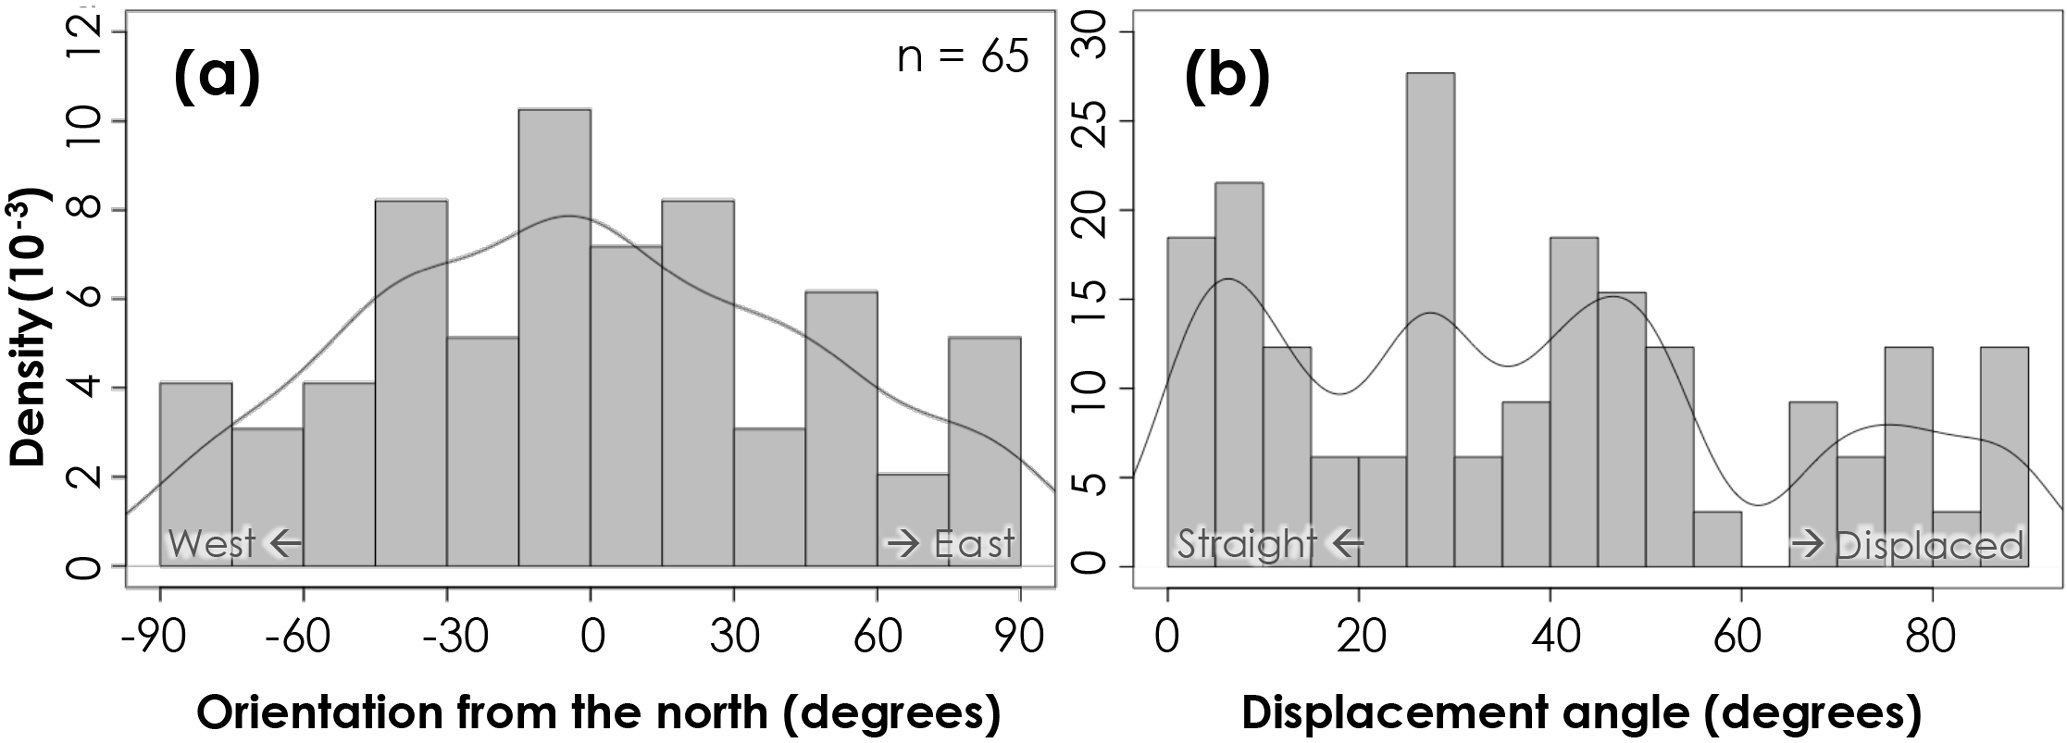
Figure 7Horizontal angles of the direction of hummocks. (a) Orientation from the north. West is −90∘ and east is 90∘. (b) Displacement angle, i.e., the relative orientation of the major axis of hummock polygons to the main flow direction of the debris avalanche, given in 0–90∘. The smaller displacement angle (straight to the flow direction) indicates the extensional regime of the debris avalanche, while the larger displacement angle (displaced against the flow) corresponds to the compressional regime.
Figure 8 shows the longitudinal profile and stream gradients along the main course of the DAD derived from the PRISM DEM. The longitudinal traces of maximum elevation within 500 m from the valley center are also shown as a gray line. The differences of the maximum elevation and the bottom elevation indicate the deepness of the incision in the valley bottom. With some fluctuations, both the local and trend stream gradients decrease as the distance from the source increases. The gradients are particularly low in the zone upstream of the portion where hummocks are present (around 8000–12 000 m from the source). In this upstream zone within the caldera wall, less difference in elevations is observed for the valley bottom and nearby 500 m cross-section area, representing the low relief along the stream. In contrast, the stream gradients, as well as the elevation differences, are particularly high in the downstream zone of the hummock-dominated area for approximately 5000 m (13 000–18 000 m from the source). In this zone, the trend stream gradient (2000 m scale) increases up to 0.1 m m−1, while the elevation difference between the ridges and streambed ranges 100–200 m. This zone corresponds to the outlet of the caldera and shows the form of the deep gorge (Fig. 2c). This can be regarded as a knickzone, which has a relatively steeper gradient than the adjacent upstream and downstream zones (Hayakawa and Oguchi, 2006).
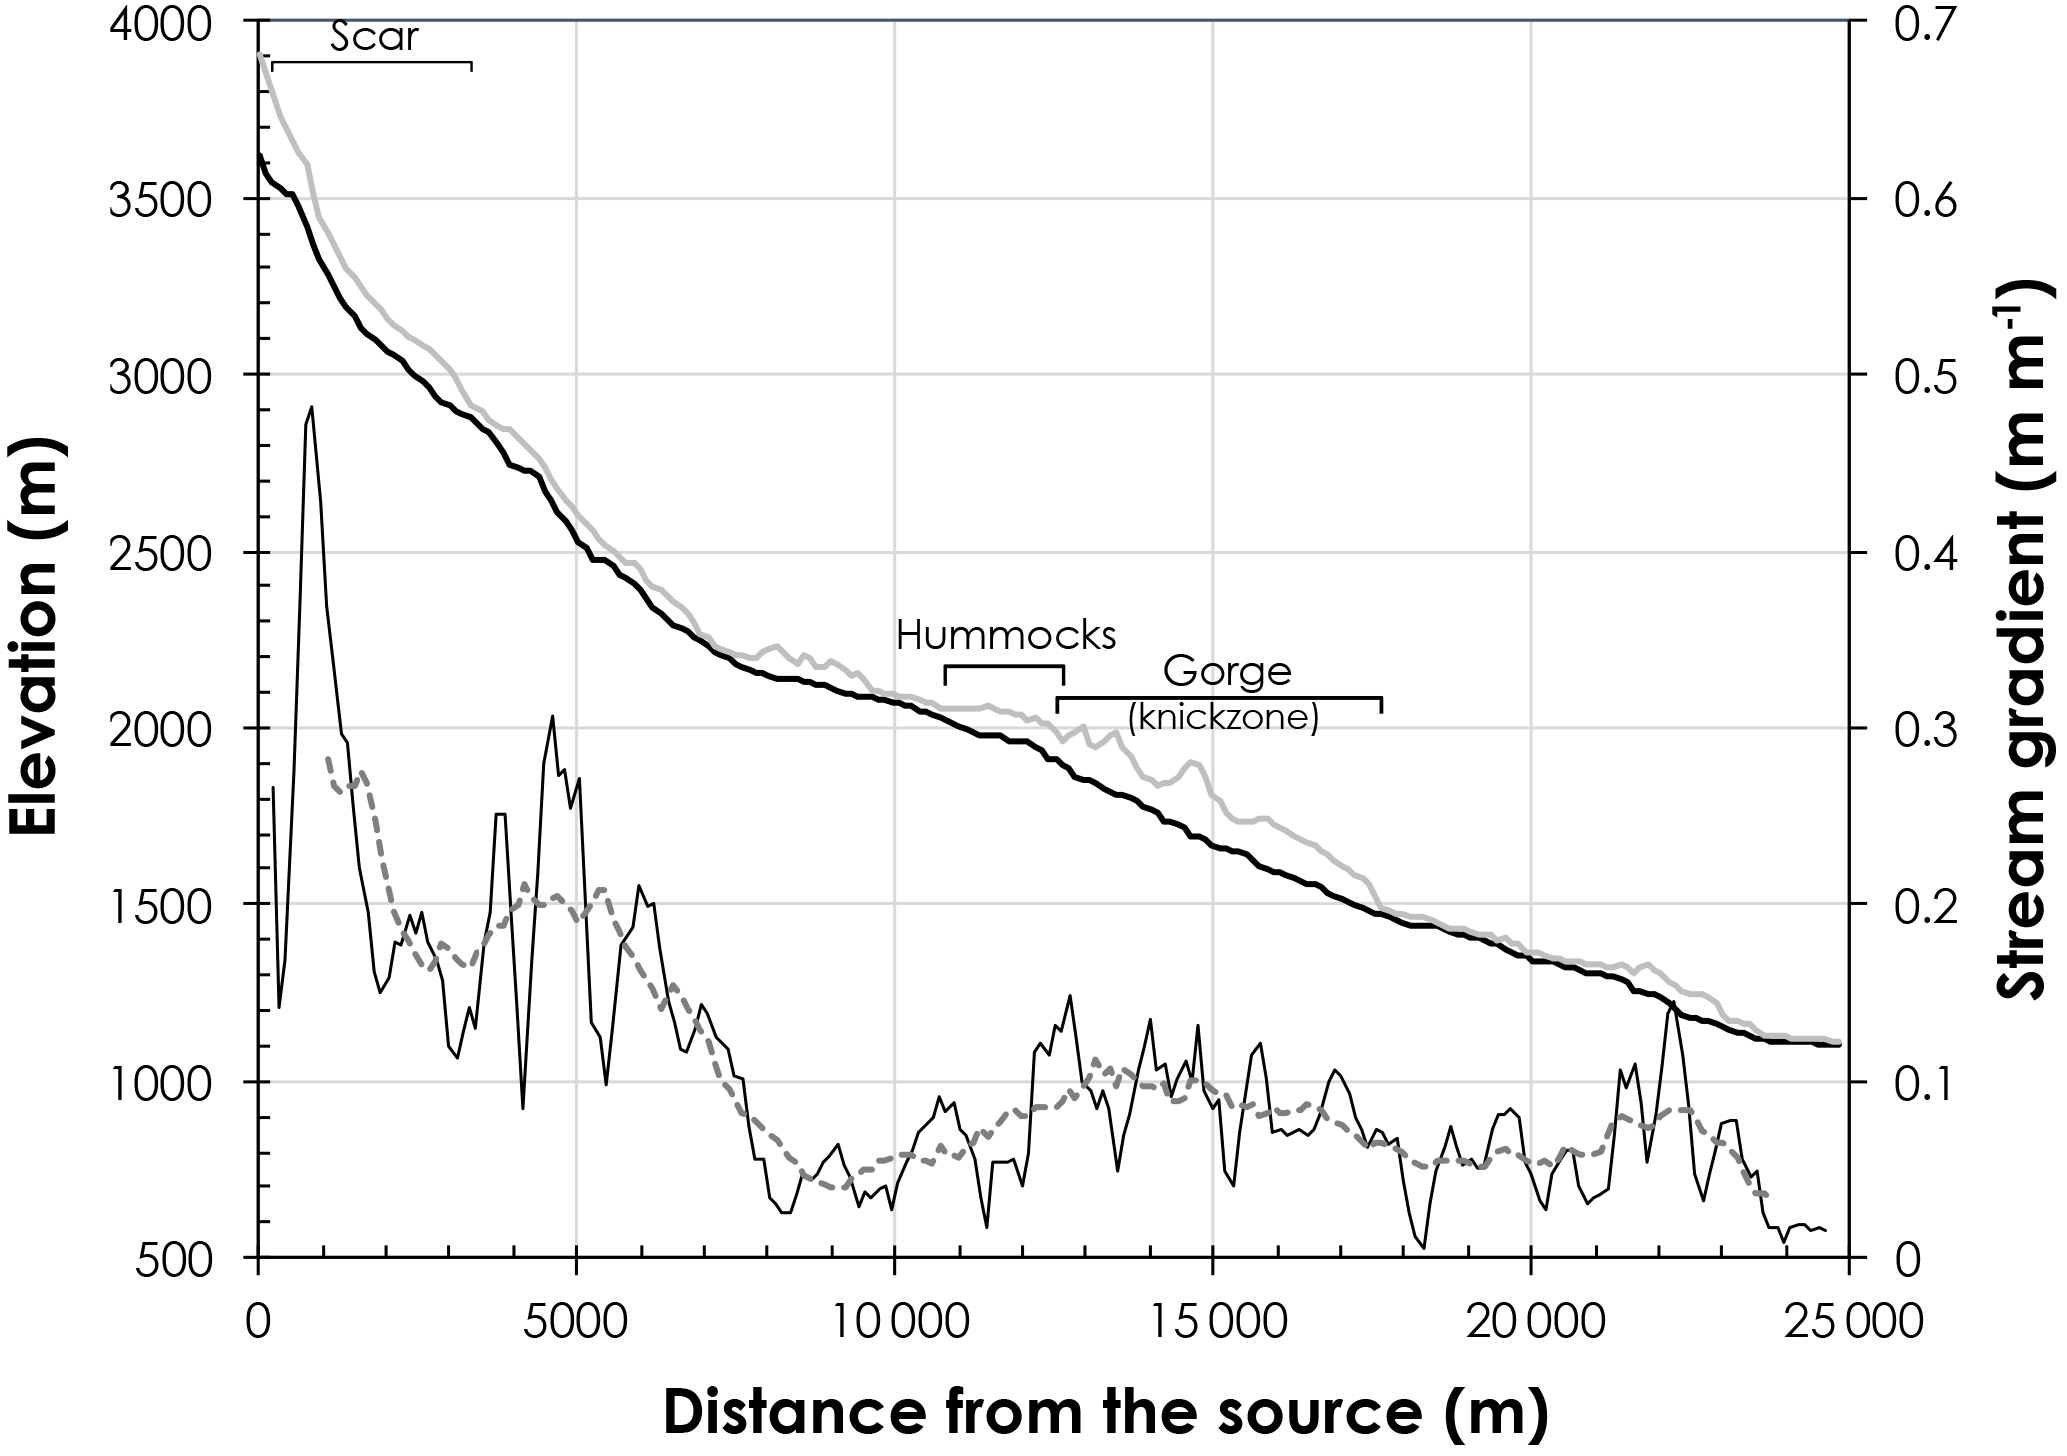
Figure 8Longitudinal profile and stream gradient along the main course of the DAD. The black solid line in the upper side (left y axis) indicates the longitudinal profile along the main course whose location is shown in Fig. 1, while the solid gray line indicates the maximum elevation within the 500 m range across the main course. The thin black line on the lower side (right y axis) is the stream gradient averaged for the 400 m zone upstream and downstream for each sampling point, whereas the dashed gray line is that averaged for the 2000 m zone.
Transverse cross profiles along the DAD extracted from the PRISM DEM show downstream widening of the DAD in elevations of 2800–2200 m and narrowing in 2200–1600 m (Fig. 9). The potential extent of the DAD in the downstream limit, corresponding to the location of the northernmost outcrop identified in the field (Fig. 1), was highlighted as solid black lines in Fig. 9. The upper part of the DAD (approximately 2800–2300 m in elevation) shows convex-up cross profiles, whereas the middle part (2300–2000 m) is more straight and flat. The downstream-most part (2000–1500 m) exhibits a more rugged shape by the incised valley of the knickzone. The hummocks are located in the transitional area (around 2000 m elevation) from the flat to the incised areas. Far downstream areas out of the DAD extent (1500–1000 m) again show straight and flat transverse profiles.
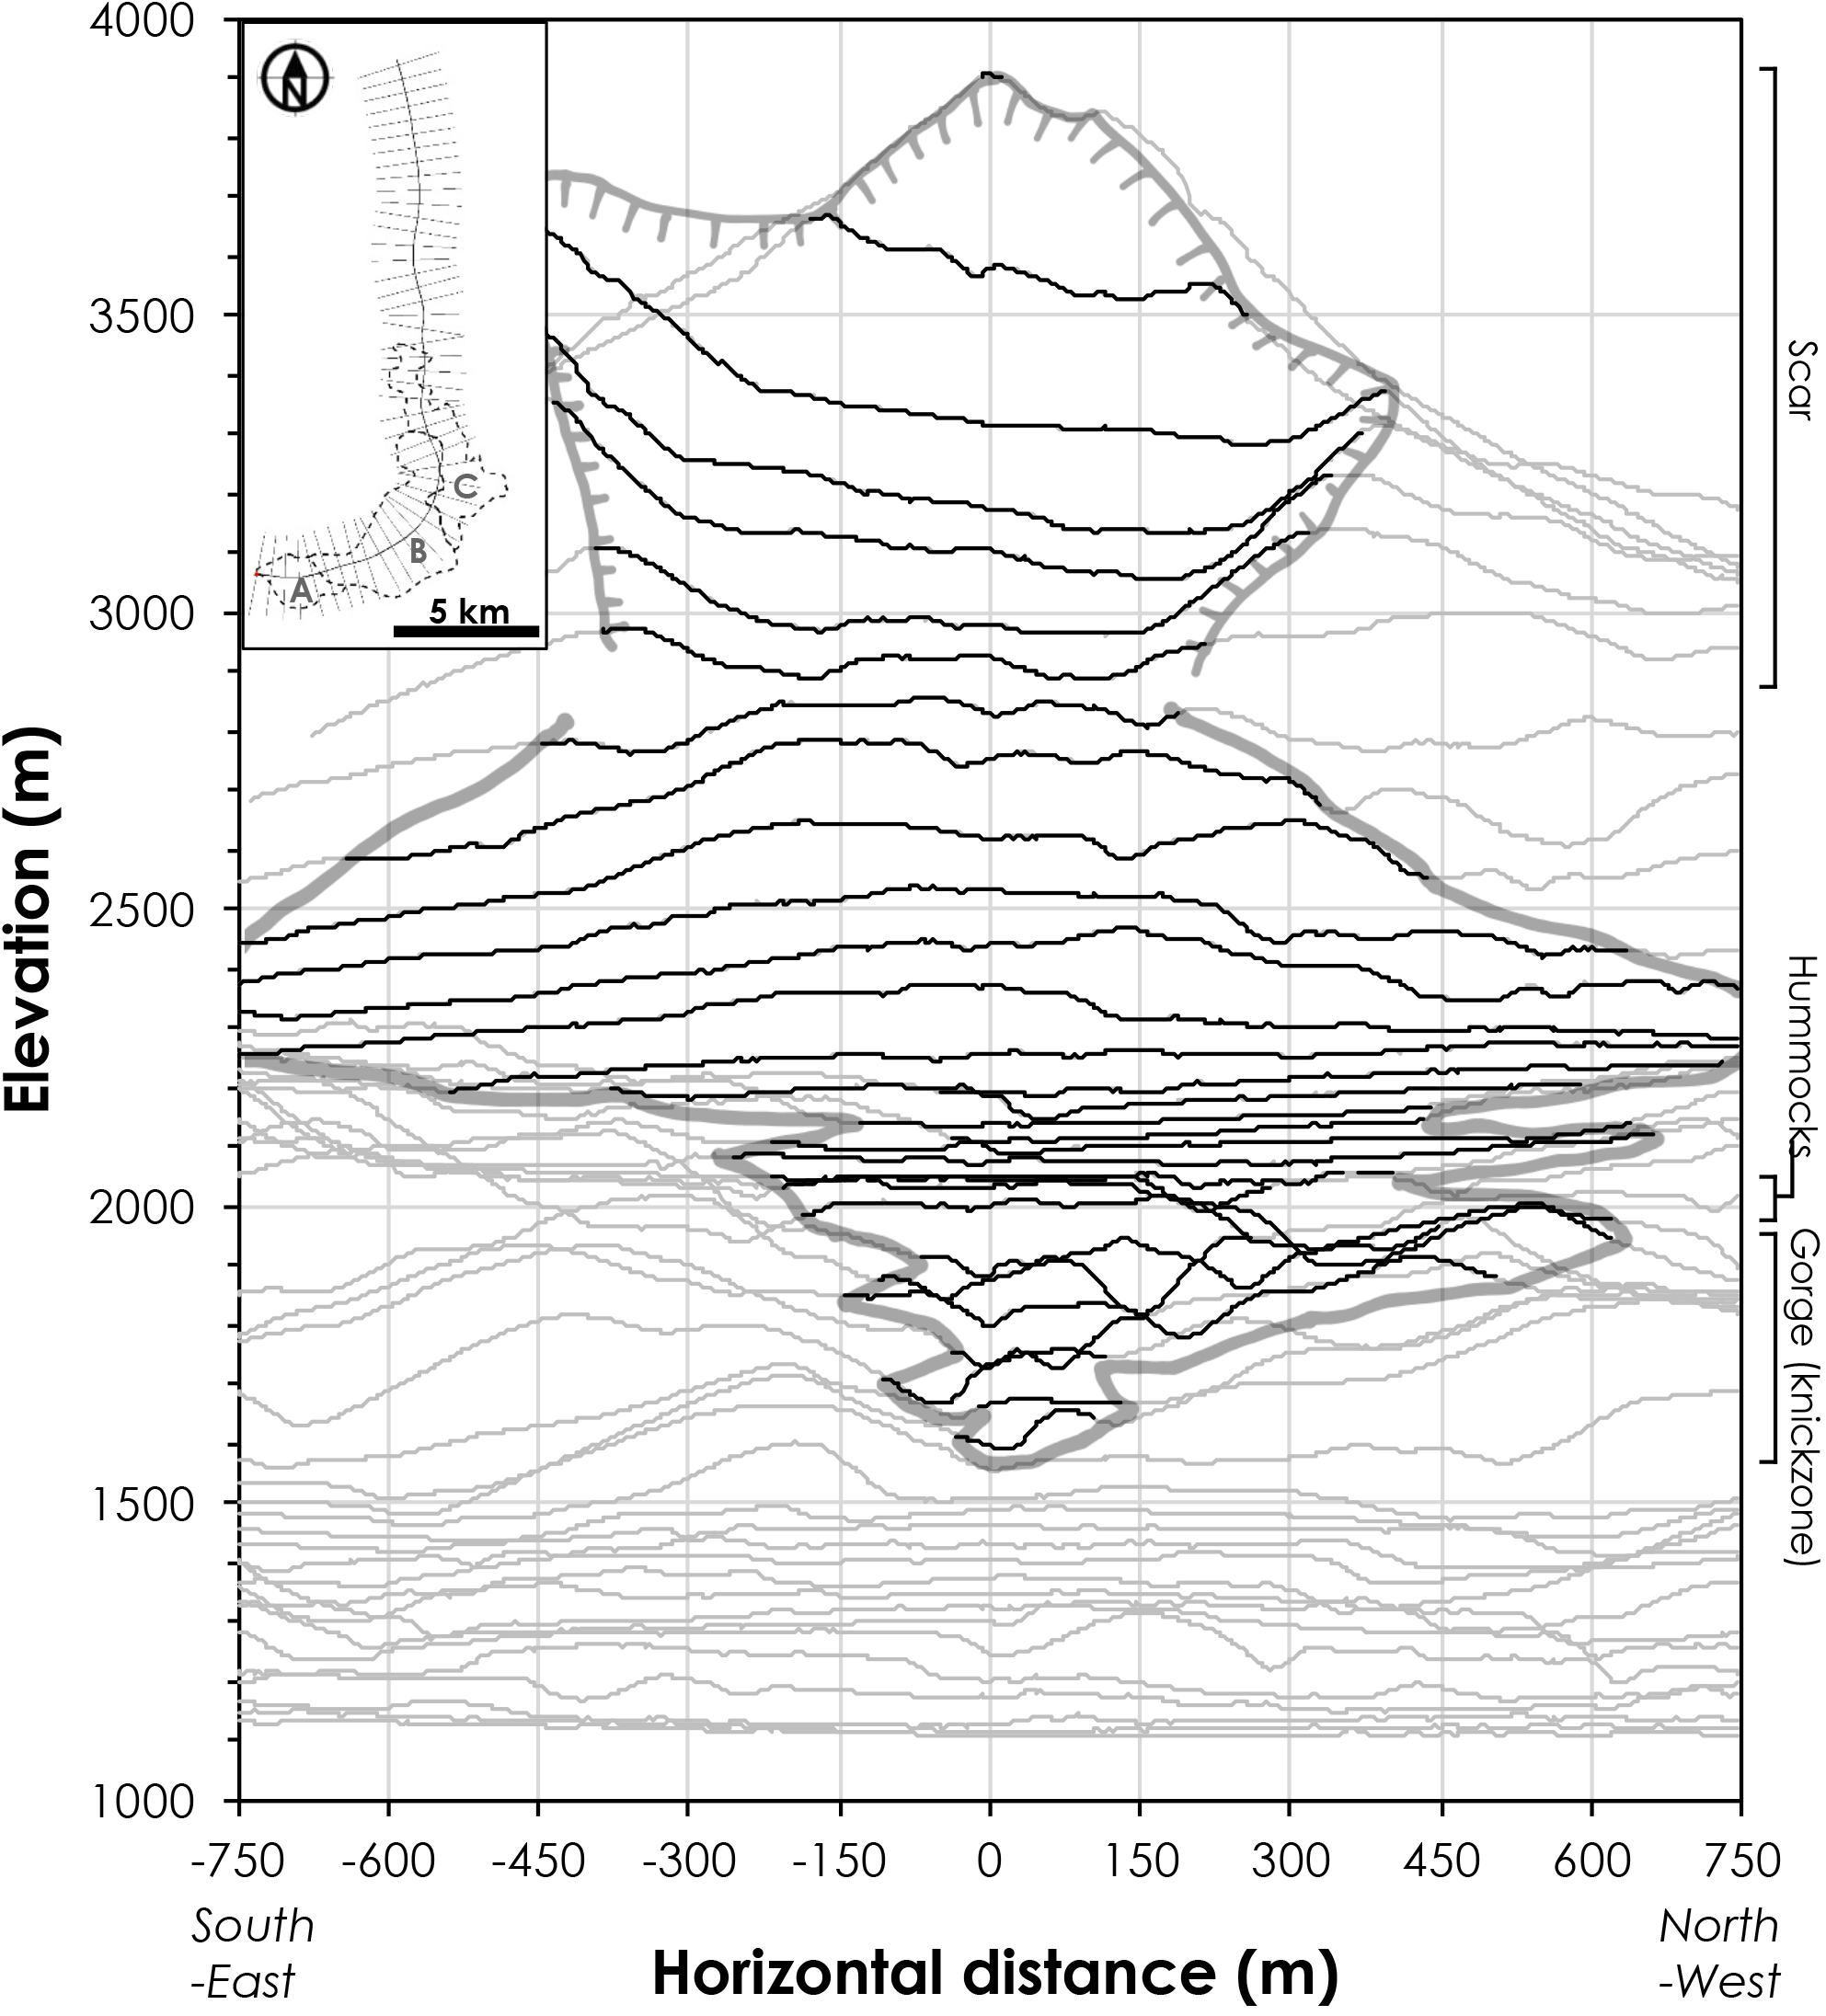
Figure 9Transverse profiles across the DAD. Areas of the sector collapse and the potential DAD extent are shown in black surrounded by thick gray lines. The inset map (upper left) shows the location of these sections along the main course of the debris avalanche over the mapped extent of the DAD. The alphabet marks (A, B, and C) in the inset correspond to those in Fig. 1.
The area of the polygons of the hummocks was summarized for each 500 m bin of the distance from the source summit to be compared with the previously reported binned average of hummock areas along the distance (Fig. 10; Yoshida et al., 2012). In Fig. 10, the mean area of all hummocks identified for each 500 m distance is shown as white circles, whereas the mean area for all the hummocks is shown as a black horizontal bar. The limited distribution and concentration of hummocks only in the area 11 000–13 000 m from the summit and the downstream increase in hummock area suggest that the distance–size relationship does not work for the Mt. Erciyes DAD.
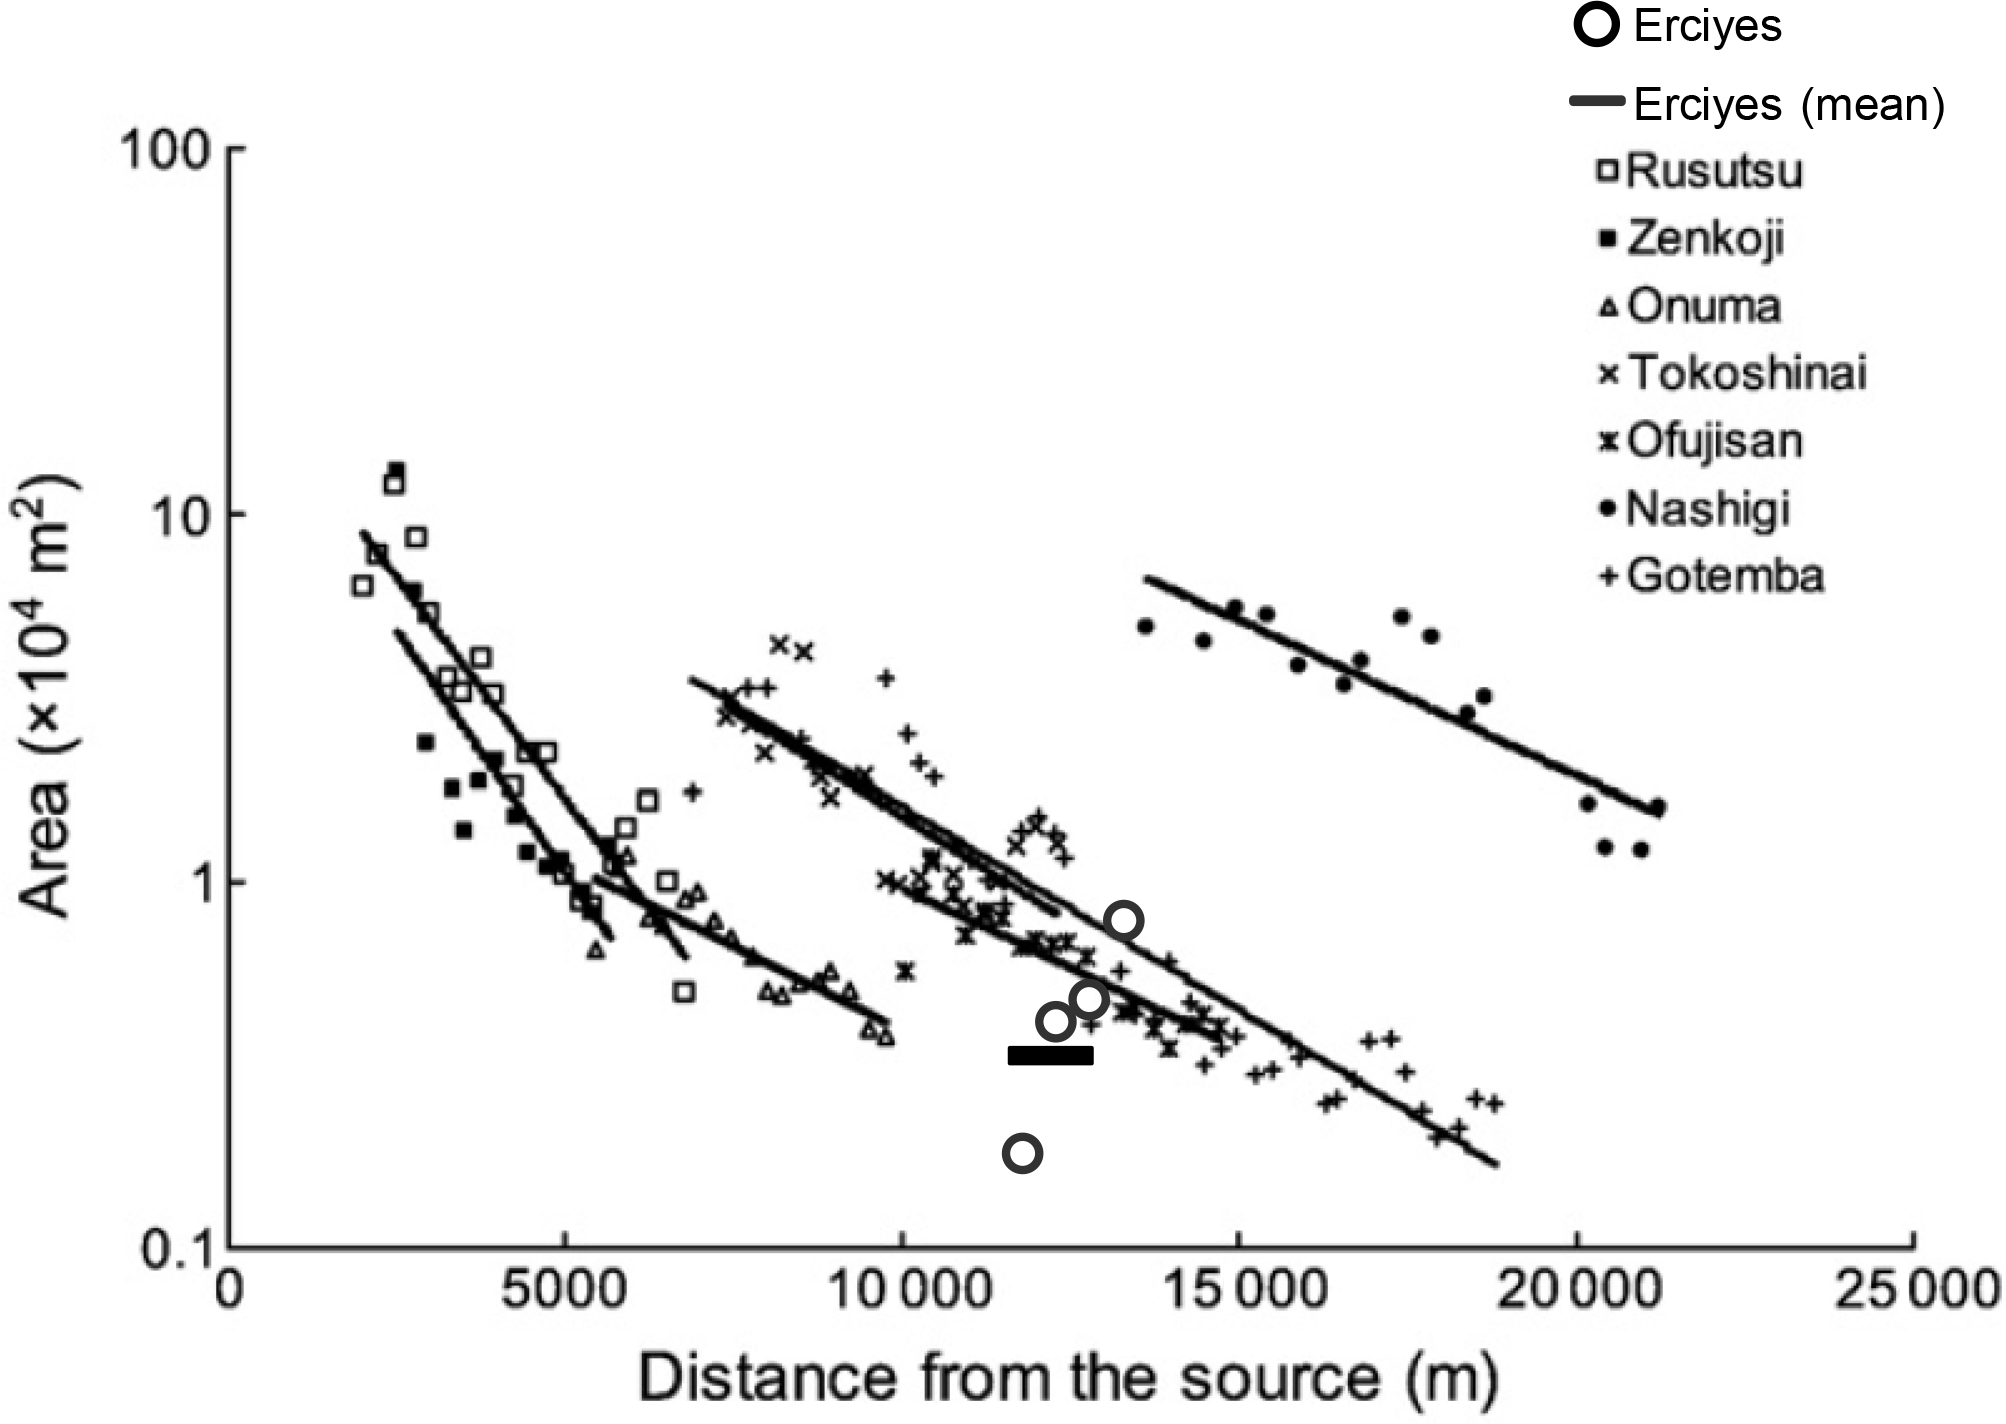
Figure 10Relationship between the distance from the source and hummock size for the avalanche at Mt. Erciyes and those previously reported by Yoshida et al. (2012). The white circles indicate the mean area of hummock polygons summarized for each 500 m bin of the distance, while the black horizontal bar shows the average areas for all the hummocks in Erciyes. Solid lines are linear regressions for each avalanche previously reported.
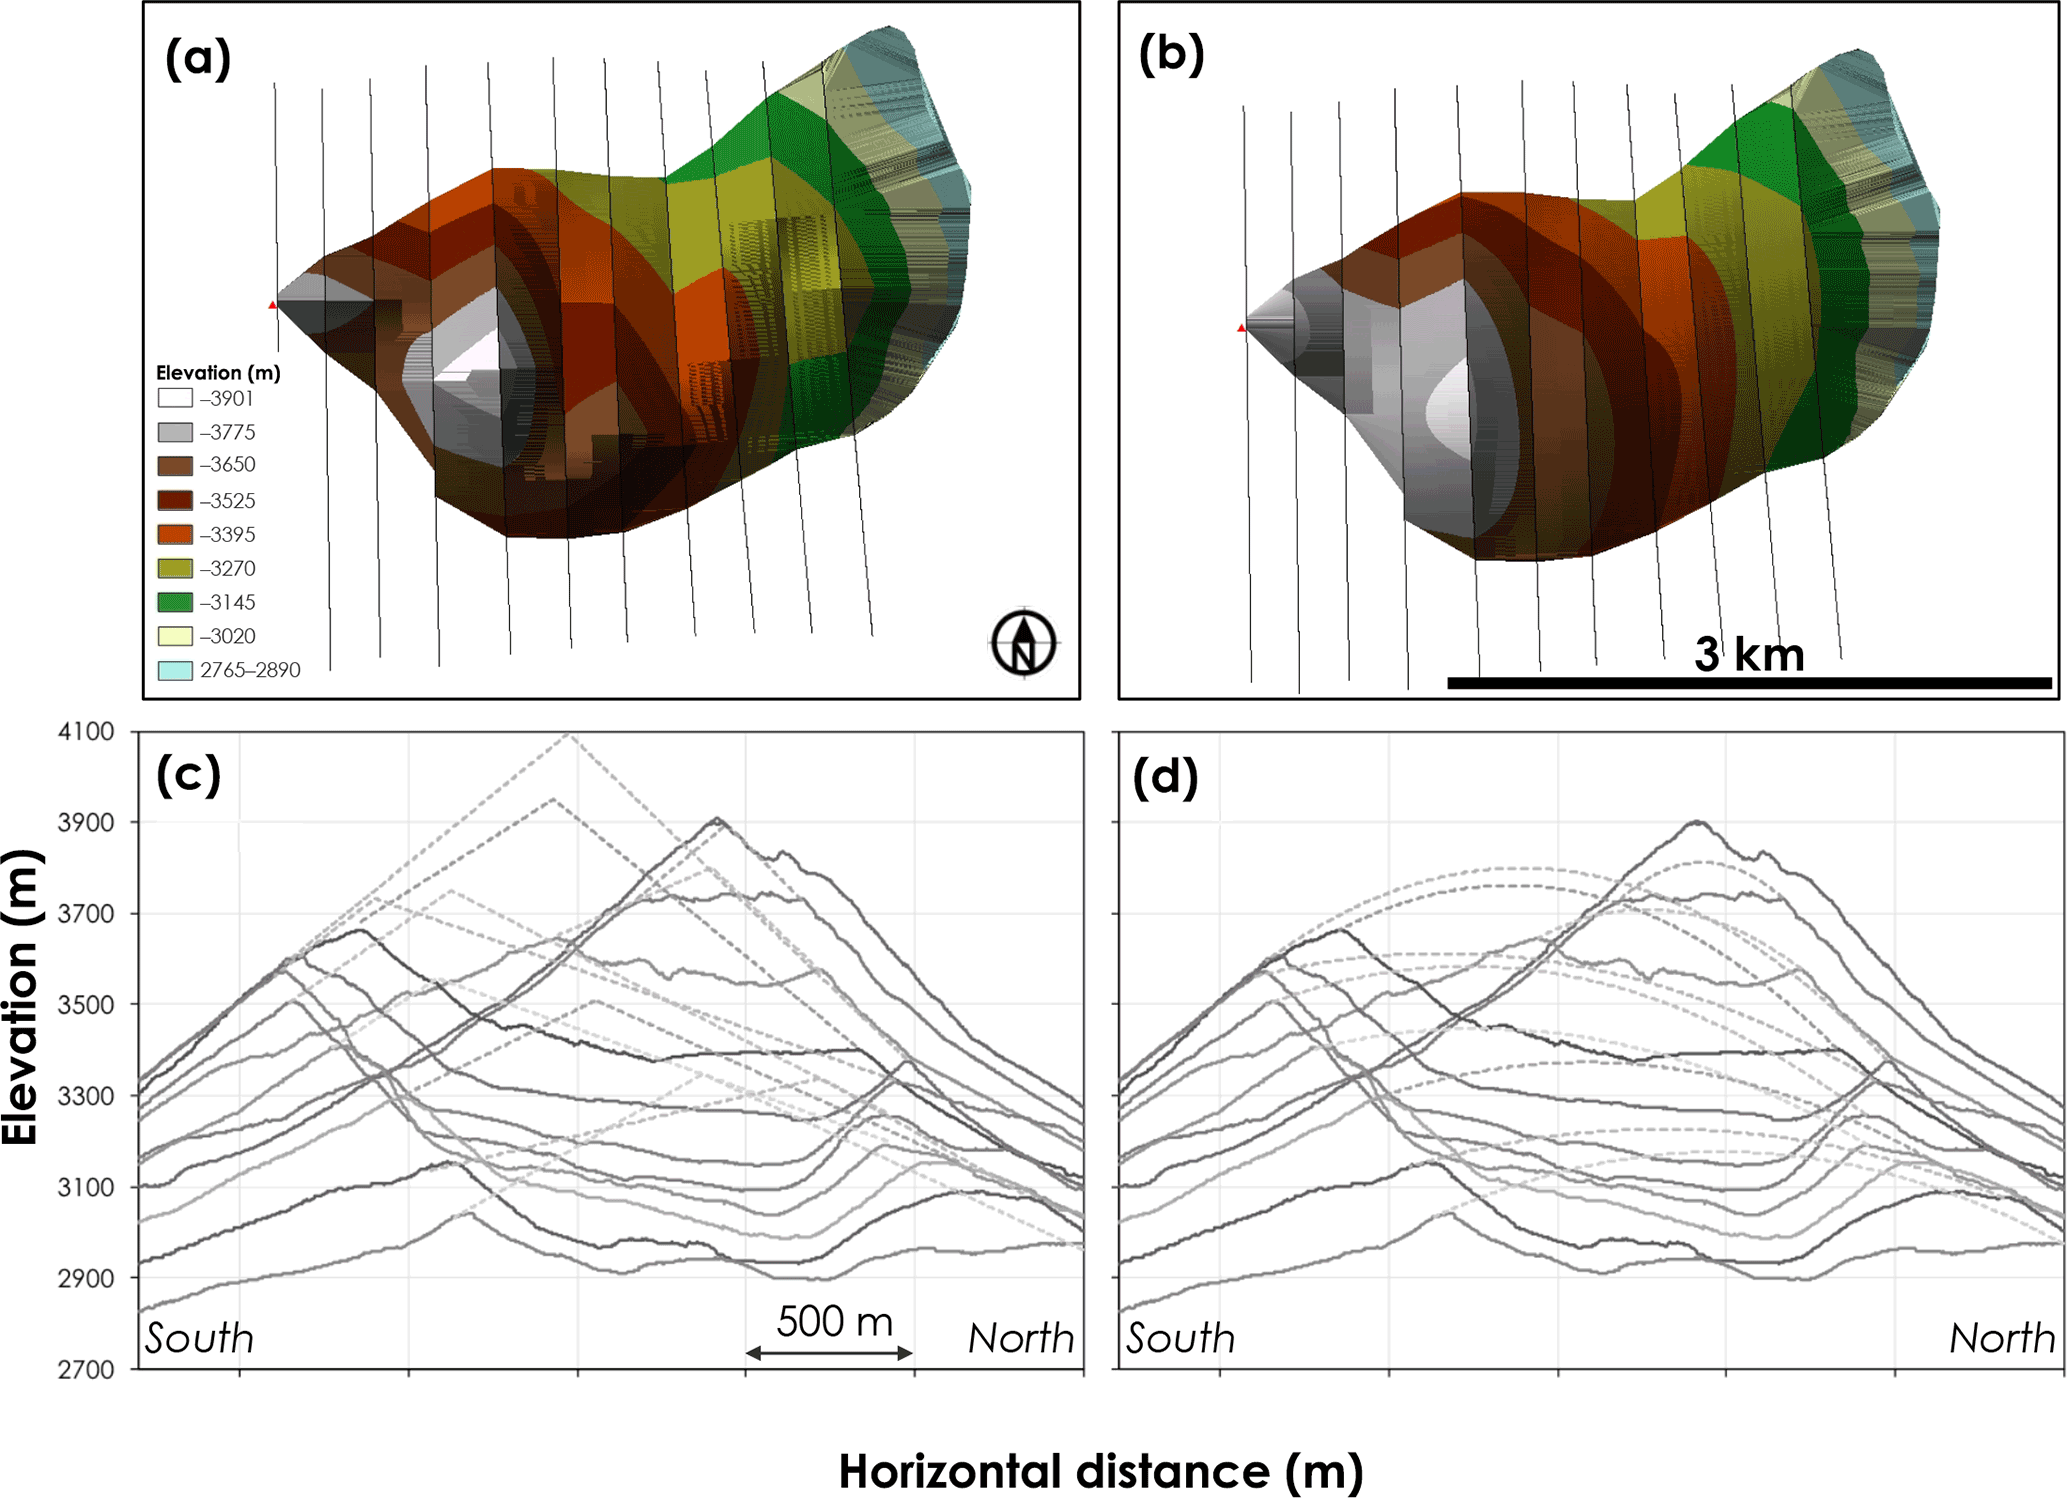
Figure 11Reconstruction of the source area of the sector collapse. Scales are the same for a/b and c/d, respectively. (a) Plan view of the reconstructed surface by the linear method. The red triangle indicates the location of the current summit of Mt. Erciyes. (b) Plan view of the reconstructed surface by the Bézier method. (c) Transverse profiles of the original surface by the linear extrapolations. (d) Transverse profiles by Bézier curve fitting.
4.2 Volume estimation of DAD by the source area reconstruction
Using two different interpolation methods, linear and Bézier, the original surface of the edifice before the sector collapse was reconstructed (Figs. 11, 12). The particular difference between the linear and Bézier methods is the maximum summit elevation of the reconstructed surface. The pre-avalanche edifice summit generated by linear interpolation is at 4100 m elevation. This is much higher than the present summit of 3917 m (Fig. 11c). The summit generated by the Bézier method does not exceed the present summit elevation (Fig. 11d). In both cases, the summit of the reconstructed edifice is at 1000 m southeast of the current summit (Figs. 11a, b, 12b, c).
The volume of the missing edifice by the sector collapse is calculated as the sum of the elevation differences between the reconstructed surface and the present landform: 12.75 × 10⁸ m3 by the linear method and 10.67 × 10⁸ m3 by the Bézier method. If we assume the preexisting fluvial dissection of the edifice or a crater on the top (Aramaki, 1963), this reconstructed volume may be reduced by approximately 10 % (Aramaki, 1963; Yonechi et al., 1988; Yoshida and Sugai, 2007a). The estimated source volume of the sector collapse is then given as 9.60–11.48 × 10⁸ m3. Since the plan area of the sector collapse source area is 5.2 × 10⁹ m2, the mean depth of the missing edifice is obtained to be 186–223 m. Although the accuracy of this estimation is hard to quantify due to the lack of any morphological evidence of the sector before the collapse, we consider these values as a feasible, order-of-magnitude estimate of the missing volume and depth.
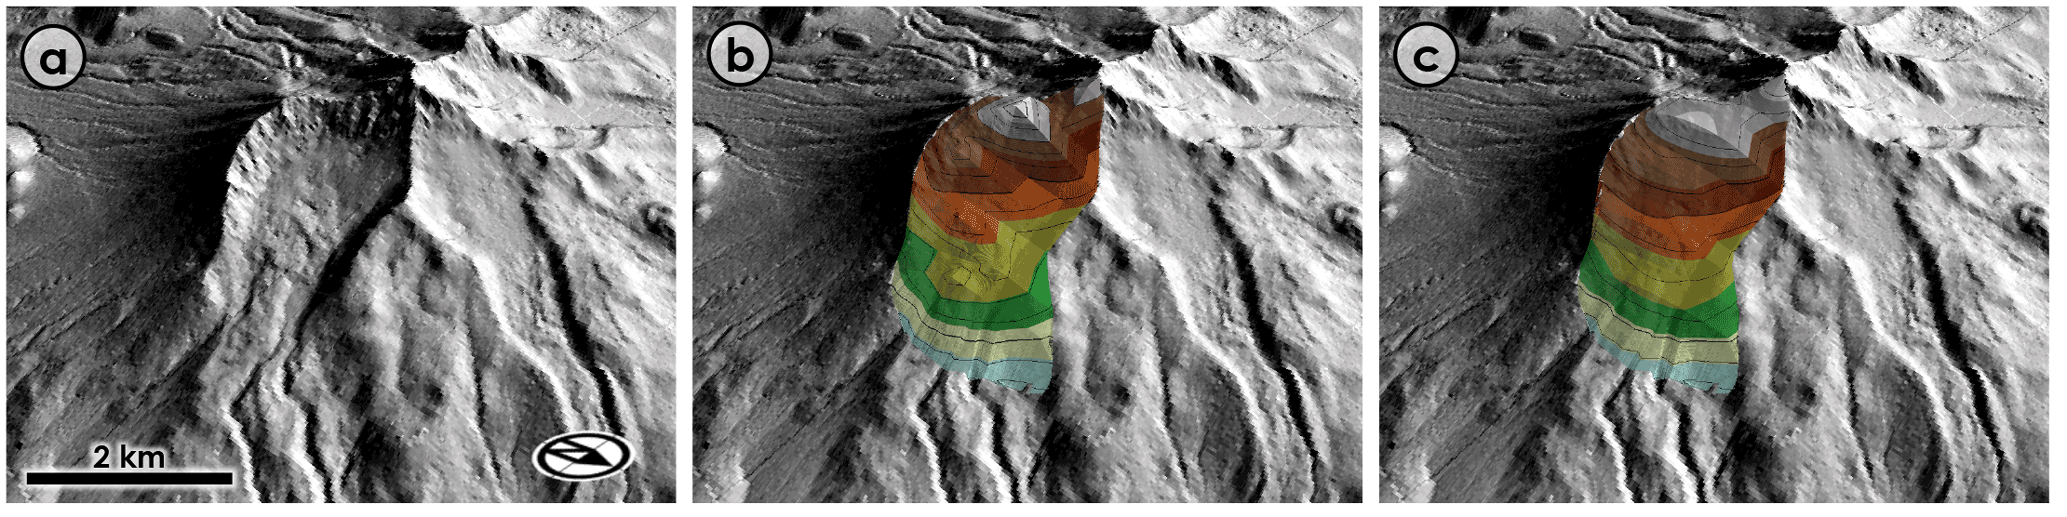
Figure 12Bird's eye view of the reconstructed source area of the sector collapse. (a) Present topography of the scar. (b) Three-dimensional TIN of the reconstructed surface of the original edifice by linear extrapolations. (c) Three-dimensional TIN of the reconstructed surface of the original edifice by Bézier curve fitting.
5.1 Characteristics of the debris avalanche inferred from the volume and thickness
Because of the expansion of the original mass and/or sediment entrainment during transport, the volume of DAD is greater than the source volume by 25–30 % (Siebert, 1984; Yoshida and Sugai, 2007a). Accounting for the estimated source volume of 9.6–11.5 × 10⁸ m3, the potential volume of the DAD would become 12–15 × 108 m3. This estimated volume is relatively larger than the average volume (ca. 5 × 10⁸ m3) of reported DADs in the Holocene and Pleistocene (Siebert, 1984) but falls within the range of 2–260 × 108 m3 (Siebert, 1984). If compared with the known cases, the estimated volume is comparable to the debris avalanche in the historical time period at Mt. Iriga in the Philippines, whose volume is known as 15 × 108 m3 (Aguila et al., 1986; Paguican et al., 2012), and more than half of that of the 25–28 × 108 m3 Mt. St. Helens case of 1980 (Voight et al., 1983; Siebert et al., 1987; Glicken, 1996). Also, the estimated volume of Erciyes is approximately 2 or 3 times that of the well-described case of the 4.9 × 10⁸ m3 volume avalanche on the northern flank of Mt. Bandai, Japan, in 1888 that was triggered by a phreatic eruption (Nakamura, 1978; Yonechi et al., 1988; Yonechi and Chiba, 1989; Yoshida, 2012) or the non-eruptive case of the Mt. Unzen Mayuyama sector collapse, Japan, in 1792 (4.4 × 10⁸ m3) (Inoue, 1999; Takarada and Melendez, 2006).
Although the exact extent of the DAD is difficult to confirm in this study, the rough estimation of the potential extent of the DAD in this study has an area of at least 20 × 109 m2, which is apparently larger than that (14 × 109 m2) previously mapped by Şen et al. (2003). Dividing the estimated source volume of the DAD, 12–15 × 108 m3, by the potential extent of the depositional area of 20 × 109 m2, the mean thickness of the DAD is ∼ 60–75 m. This thickness of DAD is much larger than those reported in the previous studies: for example, 25–30 m for Mt. Asama (Yoshida and Sugai, 2010) and 45 m for Mt. St. Helens (Voight et al., 1983). The area and volume of the DADs across the world summarized by Siebert (1984) also give an average thickness of 24 m with a range of 3–58 m; the thickness for the Mt. Erciyes DAD is out of the range of the reported ones. This supports that the extent of the depositional area of the DAD of Mt. Erciyes can be much larger than 20 × 109 m2, potentially 2 to 3 times that of the identified area. Based on these analyses, it is reasonable to say that Erciyes debris avalanche deposits could have flowed out of the gorge farther downstream and spread over the relatively flat terrain 18 000 m from the summit (E in Fig. 1).
5.2 Debris avalanche and formation of hummocks
Based on the plots in Fig. 10, the distance–size relationship for Erciyes may be comparable to the case of the Onuma avalanche on the Komagatake volcano, the Ofujisan avalanche on the Nasu volcano, or the Gotemba debris avalanche on Mt. Fuji (Yoshida et al., 2012). However, unlike the other cases, the Erciyes hummocks are densely found only in a limited area (11–13 000 m from the source). The distance–size relationship of hummocks cannot be directly compared to the other cases (Siebert, 1984; Yoshida et al., 2012) in which hummocks are more evenly distributed without significant topographic barriers.
In turn, the absence of hummocks in both upstream and downstream zones indicate a different pattern of debris avalanche flow for this particular case of Mt. Erciyes. In general, hummocks in DADs are primarily formed due to the initial stage of sliding of the original sector of the edifice, with some blocks preserving the original structure that appears as secondary hummocks by floating on the surface of DADs in the later stage (Paguican et al., 2014). In the upstream zone of the present hummocks of Mt. Erciyes, the absence of such primary hummocks in the 0–11 000 m area from the source may indicate either that hummocks are not formed due to the high fracturing of DADs or that hummocks are formed but buried by subsequent sediment covering the DAD.
On the one hand, such high fracturing of the Erciyes DAD is feasible because the debris avalanche could have had low viscosity with high water content and a sufficient amount of ice of glaciers on the original mountain in the glacial period, likely under the cool and wet climate in the late Pleistocene (Sarıkaya et al., 2009; Bayer Altin et al., 2015). It should also be noted that the debris avalanche flow was affected by the preexisting topography of the former caldera (Fig. 1). The debris avalanche is supposed to have initially flowed to the east, and, after being blocked by the former caldera wall located in the east, the debris avalanche changed its direction to the north (Fig. 1). If the debris avalanche is well fractured, the flow could have shallowly spread over the flat area within the caldera without forming primary hummocks.
On the other hand, even if some small primary hummocks were formed at the initial stage, they could have been hidden by post-collapse modifications and surficial sediment deposition in this upstream area of the DAD (Yoshida and Sugai, 2007a), as indicated by the presence of convex-up cross profiles at an elevation of 2800–2300 m (Fig. 9, or around the letter B in Fig. 1). Although no significant eruptive activity producing thick tephra or pyroclastic flows has been recognized in the volcanic stratigraphy (Şen et al., 2003), post-collapse eruptive activities might have occurred on a more local scale to cover the upper portion of the DAD. Loose materials including volcanic colluvial or alluvial deposits on the surrounding slopes could also have been reworked to contribute to covering the DAD. However, the thickness of such surficial sediment remains to be examined.
In the downstream zone of the present hummocks, the stream gradient is high and the valley width is narrow, forming a knickzone (Figs. 8, 9). This topographic feature could have existed before the sector collapse because this location corresponds to the intersection of the north-oriented valley, which seems to follow the mapped fault line as discussed later, and the former caldera wall of the pre-Erciyes volcanic activity (Fig. 1). The debris avalanche went over the wall at this preexisting narrow outlet valley in the north. At the entrance of this narrow outlet valley, however, the flow might be slower as it enters the valley over the caldera. The secondary hummocks that are presently observed could have been placed around this terminal portion of the caldera floor due to the confinement of the sliding materials. The flow could then have gained speed when flowing through the steepened knickzone. The bimodal distribution of the displacement angle of hummocks supports this hypothesis (Fig. 7b). As suggested by the displacement angles, some hummocks with displaced orientations indicate a partial compressional regime of the debris avalanche: the sliding materials are confined, and hummocks are emplaced with their major axis perpendicular to the flow direction (Paguican et al., 2014; Yoshida, 2014). In contrast, the other hummocks without large displacements indicate an extensional regime of the debris avalanche due to the rapid northward flow through the valley: the stretch of the materials forced some of the hummocks to align to the flow direction (Paguican et al., 2014; Yoshida, 2014). Such a change in the flow regime of the debris avalanche can also be supported by progressive changes in flow materials (Clavero et al., 2002). In this case, since the debris avalanche flowed in the caldera, the increase in water content of the avalanche bottom is feasible if there was a caldera lake or rivers prior to the collapse. The lowering of friction at the bottom flow could have enhanced the rapid passage through the valley, while the avalanche surface remained dry enough to emplace the hummocks.
The debris avalanche materials which went over the gorge could have been further deformed and shallowly spread over the relatively flat area after reaching downstream of the knickzone (Figs. 8, 9). Hummocks may no longer be formed in such highly fractured materials of the debris avalanche. No data on the detailed geological structure in the downstream areas are available, and it is hard to find the extent of the DAD. Further careful investigations regarding the remnant of this DAD would be required to clarify the actual impact of the debris avalanche in this region. Future studies should therefore include field-based verification of the deposits such as borehole core drilling. Moreover, such a complex case of a debris avalanche with both topographic barriers (caldera wall) and passage (valley) has not been frequently reported in the previous studies, except for a few cases (Francis et al., 1985; Glicken, 1996; Yoshida and Sugai, 2007b). The case of Erciyes highlights the need for the consideration of complex topographic constraints for the prediction of flow dynamics of debris avalanches.
5.3 Potential effects of fault lines on the debris avalanche
The presence of the strike-slip Erciyes Fault (Fig. 1) may have influenced the generation and emplacement of the DAD. Although the exact age and intensity of the fault activity are unknown, and the presence of the fault itself also needs further careful assessments (Okumura et al., 2016), the regional stress field related to this fault group could have affected the occurrence and the direction of the sector collapse of Mt. Erciyes. In general, sector collapses often occur in the direction perpendicular to the major horizontal compression by faulting beneath the volcano (Moriya, 1980; Siebert, 1984; Vidal and Merle, 2000; Tibaldi et al., 2008) or in parallel to the fault directions (Lagmay et al., 2000; Yokoyama and Nakagaki, 2003; Wooler et al., 2009). At Mt. Erciyes, the major horizontal compression by the strike-slip faults in the north–south direction could have caused the sector collapse toward the east. Furthermore, the northward valley seems to have been formed along the fault line cutting the caldera wall. The debris avalanche, which flowed to the north after being blocked by the preexisting caldera wall, could have spread far downstream by overpassing the former caldera wall along the preexisting valley. In such a case, the existence of local faults has a dual significance – in the occurrence of sector collapse itself and in the directionality of the debris avalanche. Although further examination of this issue is out of the scope of this study, detailed surveys of the active faults and stress field in this region are also highly significant in predicting the future sector collapse of the volcano (Tibaldi et al. 2008; Wooler et al., 2009).
In this study, we utilized the RPAS-based SfM–MVS photogrammetry to map the topography of Mt. Erciyes DAD. Detailed outlines of hummocks were extracted from the high-definition land surface data. Despite the limited availability of high-definition aerial or satellite images, rapid on-site acquisition by RPAS-based SfM–MVS photogrammetry enabled us to obtain new insights regarding the formation of hummocks and DAD at Mt. Erciyes. The volume of the sector collapse was estimated by reconstructing the original topography of the source area. Although the precise extent of the DAD is difficult to trace, the estimated volume of ∼ 12–15 × 108 m3 suggests that a considerable amount of sediment could have spread downstream over the observed limit of the DAD. Morphological analysis of the extracted hummocks suggests that the geometry of the hummocks in this study area is characterized by preexisting topographic constraints, which significantly controlled dynamics of the debris avalanche emplacement and formation of hummocks. In particular, former caldera walls had a strong effect on the flow direction of the debris avalanche as it confined the flow. The presence of a strike-slip fault can also have considerable effects on both the occurrence of the sector collapse and the flow path of the debris avalanche. Such factors as preexisting topographic and tectonic characteristics should carefully be considered for the hazard estimation of sector collapses, which can occur in many places around the world.
The study area is one of the potentially hazardous areas in the East Anatolian Fault zone with densely distributed volcanoes and faults (Koçyiğit and Erol, 2001; Korkmaz, 2009; Okumura et al., 2016). Such activities of active faults (earthquakes) and volcanoes themselves are hazardous, and they can trigger sector collapses and subsequent debris avalanches in the area. The detailed map of the DAD should be incorporated into a regional geomorphological map to further examine other geomorphological features including fluvial valleys, terraces, lakes, and active faults (Erol, 1999). In particular, the insights inferred from this study highlight the need for the assessment of potential debris avalanche paths. As noted, the studied debris avalanche had been significantly affected by topographic constraints, and the flow path was relatively limited following the preexisting topographic slot across the caldera. This means that the hazardous areas affected by the debris avalanche are rather limited, regardless of the direction of the initial collapse of the edifice. Further investigations such as numerical modeling of the debris avalanche flow based on the present topography are expected to be carried out. At the very least, several scenarios of the potential sector collapse of the present edifice should be proposed in the future studies.
In addition, although the age of the sector collapse is relatively old (possibly 20–80 ka; Şen et al., 2003; Sarıkaya et al., 2009), subsequent sediment supply from the DAD could also have affected ancient human activities in the Holocene period in the downstream basin areas. Since a lot of archaeological sites are found and investigated in the area (Kontani et al., 2014; Yener et al., 2015), the assessments of the relationships between DAD and surrounding paleoenvironments including human activities will provide further insights for the potential disaster and its mitigation in the study area, such as floods, volcanism, landslides, and fault-induced earthquakes.
The RPAS-derived topographic datasets of debris avalanche deposits with hummocks, as well as the reconstructed source areas of the avalanche, are available at Mendeley Data (https://doi.org/10.17632/js324r65y9.1, Hayakawa, 2018).
The authors declare that they have no conflict of interest.
This article is part of the special issue “The use of remotely piloted aircraft systems (RPAS) in monitoring applications and management of natural hazards”. It is a result of the EGU General Assembly 2016, Vienna, Austria, 17–22 April 2016.
We would like to thank Fikri Kulakoğlu for his fundamental
assistance throughout the field work. We also appreciate the Editor Paolo
Tarolli and anonymous referees whose constructive comments greatly improved
the manuscript. This work is supported by JSPS KAKENHI grant number
JP26560153, JP25702014, JP17H02031, and JP16KK0012, as well as by JSPS Bilateral
Programs Joint Research Projects. This work is a part of Joint Research by
CSIS, The University of Tokyo.
Edited by:
Paolo Tarolli
Reviewed by: three anonymous referees
Aguila, L. C., Newhall, C. G., Miller, C. D., and Listanco, E. L.: Reconnaissance geology of a large debris avalanche from Iriga volcano, Philippines, Philipp. J. Volcanol., 3, 54–72, 1986.
Aramaki, S.: Geology of Asama volcano, J. Fac. Sci. Univ. Tokyo, Sect. II, 14, 229–443, 1963.
Bayer Altin, T., El Ouahabi, M., and Fagel, N.: Environmental and climatic changes during the Pleistocene–Holocene in the Bor Plain, Central Anatolia, Turkey, Palaeogeogr. Palaeoclimatol. Palaeoecol., 440, 564–578, https://doi.org/10.1016/j.palaeo.2015.09.011, 2015.
Bernard, B., van Wyk de Vries, B., Barba, D., Leyrit, H., Robin, C., Alcaraz, S., and Samaniego, P.: The Chimborazo sector collapse and debris avalanche: Deposit characteristics as evidence of emplacement mechanisms, J. Volcanol. Geotherm. Res., 176, 36–43, https://doi.org/10.1016/j.jvolgeores.2008.03.012, 2008.
Clavero, J., Sparks, R., Huppert, H., and Dade, W.: Geological constraints on the emplacement mechanism of the Parinacota debris avalanche, Northern Chile, Bull. Volcanol., 64, 40–54, https://doi.org/10.1007/s00445-001-0183-0, 2002.
Dufresne, A. and Davies, T. R.: Longitudinal ridges in mass movement deposits, Geomorphology, 105, 171–181, https://doi.org/10.1016/j.geomorph.2008.09.009, 2009.
Emre, Ö., Duman, T. Y., Özalp, S., Elmaci, H., and Olgun, S.: 1:250,000 Scale Active Fault Map Series of Turkey, Kayseri (NJ36-8) Quadrange, Ankara, 2011.
Erol, O.: A geomorphological study of the Sultansazligi lake, central Anatolia, Quat. Sci. Rev., 18, 647–657, https://doi.org/10.1016/S0277-3791(98)00102-4, 1999.
Evans, S. G. and DeGraff, J. V.: Catastrophic Landslides: Effects, Occurrence, and Mechanisms, Geological Society of America, Boulder, 2002.
Fonstad, M. A., Dietrich, J. T., Courville, B. C., Jensen, J. L., and Carbonneau, P. E.: Topographic structure from motion: a new development in photogrammetric measurement, Earth Surf. Proc. Land, 38, 421–430, https://doi.org/10.1002/esp.3366, 2013.
Francis, P. W., Gardeweg, M., Ramirez, C. F., and Rothery, D. A.: Catastrophic debris avalanche deposit of Socompa volcano, northern Chile, Geology, 13, 600–603, https://doi.org/10.1130/0091-7613(1985)13<600:CDADOS>2.0.CO;2, 1985.
Glicken, H.: Rockslide-debris avalanche of may 18, 1980, Mount St. Helens volcano, Washington, 1996.
Habib, A., Akdim, N., El Ghandour, F., Labbassi, K., Khoshelham, K., and Menenti, M.: Extraction and accuracy assessment of high-resolution DEM and derived orthoimages from ALOS-PRISM data over Sahel-Doukkala (Morocco), Earth Sci. Inform., 10, 197–217, https://doi.org/10.1007/s12145-017-0287-5, 2017.
Hashimoto, N., Isoyama, K., Kuboki, J., Okumi, S., and Ozawa, A.: A geomorphological study of Iwaki volcano – particularly on the Akakurazawa mudflow hills, Bull. Geol. Surv. Japan, 30, 369–377, 1979 (in Japanese with English abstract).
Hayakawa, Y.: Topographic datasets of hummocks, debris avalanche deposits, and their source areas around Mt. Erciyes, Mendeley Data, v1, availabe at: https://doi.org/10.17632/js324r65y9.1, last access: 5 February 2018.
Hayakawa, Y. S. and Oguchi, T.: DEM-based identification of fluvial knickzones and its application to Japanese mountain rivers, Geomorphology, 78, 90–106, https://doi.org/10.1016/j.geomorph.2006.01.018, 2006.
Hayakawa, Y. S., Obanawa, H., Saito, H., and Uchiyama, S.: Geomorphological applications of Structure-from-Motion Multi-View Stereo photogrammetry: A review, Trans. Japanese Geomorphol. Union, 37, 321–343, 2016 (in Japanese with English abstract).
Hayakawa, Y. S., Yoshida, H., Dragut, L., and Oguchi, T.: Automated extraction of hummocks in debris avalanche deposits using DEMs: A case study at Mt. Gassan, northwest Japan, Zeitschrift für Geomorphol., Supplementary Issues, 61, 199–212, https://doi.org/10.1127/zfg_suppl/2017/0361, 2017.
Innocenti, F., Mazzuoli, R., Pasquarè, G., Radicati Di Brozolo, F., and Villari, L.: The Neogene calcalkaline volcanism of Central Anatolia: geochronological data on Kayseri – Nigde area, Geol. Mag., 112, 349, https://doi.org/10.1017/S0016756800046744, 1975.
Inoue, K.: Shimabara-Shigatusaku earthquake and topographic changes by Shimabara catastrophe in 1792, J. Japan Soc. Eros. Control Eng., 52, 59–69, 1999 (in Japanese with English abstract).
Jenson, S. K. and Domingue, J. O.: Extracting topographic structure from digital elevation data for geographic information system analysis, Photogramm. Eng. Rem. S., 54, 1593–1600, 1988.
Koarai, M., Sato, H. P., Araiba, K., Osanai, N., and Itoh, H.: Geomorphological study of the Leyte debris avalanche using satellite imagery remote sensing, J. Japan Landslide Soc., 45, 106–117, 2008 (in Japanese with English abstract).
Koçyiğit, A. and Erol, O.: A tectonic escape structure: Erciyes pull-apart basin, Kayseri, central Anatolia, Turkey, Geodin. Acta, 14, 133–145, https://doi.org/10.1080/09853111.2001.11432439, 2001.
Kontani, R., Sudo, H., Yamaguchi, Y., Hayakawa, Y. S., and Odaka, T.: An Archaeological Survey in the Vicinity of Kültepe, Kayseri Province, Turkey, in: Current Research at Kültepe-Kanesh: An Interdisciplinary and Integrative Approach to Trade Networks, Internationalism, and Identity, edited by: Atici, L., Kulakoğlu, F., Barjamovic, G., and Fairbairn, A., 95–106, Lockwood Press, Atlanta, 2014.
Korkmaz, K. A.: Earthquake disaster risk assessment and evaluation for Turkey, Env. Geol, 57, 307–320, https://doi.org/10.1007/s00254-008-1439-1, 2009.
Kuzucuoglu, C., Bertaux, J., Black, S., Denefle, M., Fontugne, M., Karabiyikoglu, M., Kashima, K., Limondin-Lozouet, N., Mouralis, D., and Orth, P.: Reconstruction of climatic changes during the Late Pleistocene, based on sediment records from the Konya Basin (Central Anatolia, Turkey), Geol. J., 34, 175–198, https://doi.org/10.1002/(sici)1099-1034(199901/06)34:1/2<175::aid-gj820>3.3.co;2-d, 1999.
Lagmay, A. M. F., van Wyk de Vries, B., Kerle, N., and Pyle, D. M.: Volcano instability induced by strike-slip faulting, Bull. Volcanol., 62, 331–346, https://doi.org/10.1007/s004450000103, 2000.
Mizuno, Y.: Geomorphology of Okinajima mud flow area, special reference to mud flow hills, Ann. Tohoku Geogr. Assoc., 11, 22–24, 1958 (in Japanese).
Moriya, I.: “Bandaian Eruption” and landforms associated with it, in Collection of articles in memory of retirement of Prof. K. Nishimura from Tohoku Univ., 214–219, 1980 (in Japanese with English abstract).
Moriya, I.: Geomorphological development of Bandai volcano, J. Geogr. (Chigaku Zasshi), 97, 293–300, https://doi.org/10.5026/jgeography.97.4_293, 1988 (in Japanese with English abstract).
Nakamura, Y.: Geology and petrology of Bandai and Nekoma volcanoes, Sci. Reports, Tohoku University, 3, 67–119, 1978.
Obanawa, H., Hayakawa, Y., Saito, H., and Gomez, C.: Comparison of DSMs derived from UAV-SfM method and terrestrial laser scanning, J. Japan Soc. Photogramm. Remote Sens., 53, 67–74, https://doi.org/10.4287/jsprs.53.67, 2014 (in Japanese with English abstract).
Okumura, K., Hayakawa, Y. S., Kontani, R., and Kulakoglu, F.: Quaternary activity of the Erciyes Fault southeast of the Kayseri Basin, Turkey, in: Abstracts, American Geophysical Union 2016 Fall Meeting, T41B–2918., 2016.
Orton, G. J.: Volcanic environments, in: Sedimentary environments, edited by: Reading, H. G., 485–567, Blackwell Science, 1996.
Paguican, E. M. R., van Wyk de Vries, B., and Lagmay, A. M. F.: Volcano-tectonic controls and emplacement kinematics of the Iriga debris avalanches (Philippines), Bull. Volcanol., 74, 2067–2081, https://doi.org/10.1007/s00445-012-0652-7, 2012.
Paguican, E. M. R., van Wyk de Vries, B., and Lagmay, A. M. F.: Hummocks: how they form and how they evolve in rockslide-debris avalanches, Landslides, 11, 67–80, https://doi.org/10.1007/s10346-012-0368-y, 2014.
Pickarski, N., Kwiecien, O., Djamali, M., and Litt, T.: Vegetation and environmental changes during the last interglacial in eastern Anatolia (Turkey): A new high-resolution pollen record from Lake Van, Palaeogeogr. Palaeoclimatol. Palaeoecol., 435, 145–158, https://doi.org/10.1016/j.palaeo.2015.06.015, 2015.
Sarıkaya, M. A., Zreda, M., and Çiner, A.: Glaciations and paleoclimate of Mount Erciyes, central Turkey, since the Last Glacial Maximum, inferred from 36Cl cosmogenic dating and glacier modeling, Quat. Sci. Rev., 28, 2326–2341, https://doi.org/10.1016/j.quascirev.2009.04.015, 2009.
Şen, E., Kürkcüoglu, B., Aydar, E., Gourgaud, A., and Vincent, P. M.: Volcanological evolution of Mount Erciyes stratovolcano and origin of the Valibaba Tepe ignimbrite (Central Anatolia, Turkey), J. Volcanol. Geotherm. Res., 125, 225–246, https://doi.org/10.1016/S0377-0273(03)00110-0, 2003.
Shea, T. and van Wyk de Vries, B.: Structural analysis and analogue modeling of the kinematics and dynamics of rockslide avalanches, Geosphere, 4, 657, https://doi.org/10.1130/GES00131.1, 2008.
Siebert, L.: Large volcanic debris avalanches: Characteristics of source areas, deposits, and associated eruptions, J. Volcanol. Geotherm. Res., 22, 163–197, https://doi.org/10.1016/0377-0273(84)90002-7, 1984.
Siebert, L.: Threats from debris avalanches, Nature, 356, 658–659, https://doi.org/10.1038/356658a0, 1992.
Siebert, L., Glicken, H., and Ui, T.: Volcanic hazards from Bezymianny- and Bandai-type eruptions, Bull. Volcanol., 49, 435–459, https://doi.org/10.1007/BF01046635, 1987.
Takaku, J. and Tadono, T.: DSM and ORI generation using PRISM, J. Remote Sens. Soc. Japan, 27, 372–385, 2007 (in Japanese with English abstract).
Takarada, S. and Melendez, C.: Depositional features and transport mechanism of debris avalanches: the 1980 Mount St. Helens, Usu Zenkoji, and 1792 Unzen Mayuyama Debris Avalanches, in: Abstract, 17th International Sedimentological Congress, edited by: Hoyanagi, K., Takano, O., and Kano, K., p. O–152, Fukuoka, 2006.
Tibaldi, A. and Vezzoli, L.: A new type of volcano flank failure: The resurgent caldera sector collapse, Ischia, Italy, Geophys. Res. Lett., 31, 2–5, https://doi.org/10.1029/2004GL020419, 2004.
Tibaldi, A., Corazzato, C., Kozhurin, A., Lagmay, A. F. M., Pasquarè, F. A., Ponomareva, V. V., Rust, D., Tormey, D., and Vezzoli, L.: Influence of substrate tectonic heritage on the evolution of composite volcanoes: Predicting sites of flank eruption, lateral collapse, and erosion, Glob. Planet. Change, 61, 151–174, https://doi.org/10.1016/j.gloplacha.2007.08.014, 2008.
Ui, T.: Origin of so-called “mud-flow deposit” at northwestern slope of Gassan Volcano, Bull. Volcanol. Soc. Japan Second Ser., 20, https://doi.org/10.18940/kazanc.20.2_110_2, 110, 1975 (in Japanese).
Ui, T.: Volcanic dry avalanche deposits – Identification and comparison with nonvolcanic debris stream deposits, J. Volcanol. Geotherm. Res., 18, 135–150, https://doi.org/10.1016/0377-0273(83)90006-9, 1983.
Ui, T., Yamamoto, H., and Suzuki-Kamata, K.: Characterization of debris avalanche deposits in Japan, J. Volcanol. Geotherm. Res., 29, 231–243, https://doi.org/10.1016/0377-0273(86)90046-6, 1986.
Ui, T., Takarada, S., and Yoshimoto, M.: Debris avalanches, in: Encyclopedia of Volcanoes, edited by: Sigurdsson, H., Houghton, B. F., McNutt, S. R., Rymer, H., and Stix, J., 617–626, Academic Press, San Diego, 2000.
Vallance, J. W. and Scott, K. M.: The Osceola Mudflow from Mount Rainier: Sedimentology and hazard implications of a huge clay-rich debris flow, Bull. Geol. Soc. Am., 109, 143–163, https://doi.org/10.1130/0016-7606(1997)109<0143:TOMFMR>2.3.CO;2, 1997.
Vallance, J. W., Siebert, L., Rose, W. I., Girón, J. R., and Banks, N. G.: Edifice collapse and related hazards in Guatemala, J. Volcanol. Geotherm. Res., 66, 337–355, https://doi.org/10.1016/0377-0273(94)00076-S, 1995.
Vidal, N. and Merle, O.: Reactivation of basement faults beneath volcanoes: A new model of flank collapse, J. Volcanol. Geotherm. Res., 99, 9–26, https://doi.org/10.1016/S0377-0273(99)00194-8, 2000.
Voight, B., Janda, R. J., Glicken, H., and Douglass, P. M.: Nature and mechanics of the Mount St Helens rockslide-avalanche of 18 May 1980, Géotechnique, 33, 243–273, https://doi.org/10.1680/geot.1983.33.3.243, 1983.
Westoby, M. J., Brasington, J., Glasser, N. F., Hambrey, M. J., and Reynolds, J. M.: “Structure-from-Motion” photogrammetry: A low-cost, effective tool for geoscience applications, Geomorphology, 179, 300–314, https://doi.org/10.1016/j.geomorph.2012.08.021, 2012.
Wooller, L., van Wyk de Vries, B., Cecchi, E., and Rymer, H.: Analogue models of the effect of long-term basement fault movement on volcanic edifices, Bull. Volcanol., 71, 1111–1131, https://doi.org/10.1007/s00445-009-0289-3, 2009.
Yener, K. A. A., Kulakoğlu, F., Yazgan, E., Kontani, R., Hayakawa, Y. S., Joseph, W., Dardeniz, G., Öztürk, G., Johnson, M., Kaptan, E., Hacar, A., Yener, K. A. A., Kulako, F., Yazgan, E., Kontani, R., Hayakawa, Y. S., Lehner, J. W., Dardeniz, G., Johnson, M., Kaptan, E., Hacar, A., Kulakoglu, F., Yazgan, E., Kontani, R., Hayakawa, Y. S., Lehner, J. W., Dardeniz, G., Öztürk, G., Johnson, M., Kaptan, E., and Hacar, A.: New tin mines and production sites near Kültepe in Turkey: a third-millennium BC highland production model, Antiquity, 89, 596–612, https://doi.org/10.15184/aqy.2015.30, 2015.
Yokoyama, S. and Nakagaki, Y.: Directional relation between large-scale slope failures of volcanic edifices and regional stress field, J. Japan Landslide Soc., 40, 39–45, 2003 (in Japanese with English abstract).
Yonechi, F. and Chiba, N.: Volume of slope failure by Mt. Bandai eruption in 1888 and burial of Ura-Bandai area, Trans. Japanese Geomorphol. Union, 10, 72, 1989 (in Japanese).
Yonechi, F., Chiba, N., Ozawa, A., and Ishimaru, S.: Large scale slope failure caused by Mt. Bandai's eruption in 1888, in: Abstracts of the 27th Annual Meeting of the Japan Landslide Society, 20–21, 1988 (in Japanese).
Yoshida, H.: Evaluation of sector-collapse volume of Bandai Volcano in 1888, Japan, in terms of size-distance distribution pattern of debris avalanche hummocks, Trans. – Japanese Geomorphol. Union, 33, 45–60, 2012 (in Japanese with English abstract).
Yoshida, H.: Decrease of size of hummocks with downstream distance in the rockslide-debris avalanche deposit at Iriga volcano, Philippines: similarities with Japanese avalanches, Landslides, 10, 665–672, https://doi.org/10.1007/s10346-013-0414-4, 2013.
Yoshida, H.: Hummock alignment in Japanese volcanic debris avalanches controlled by pre-avalanche slope of depositional area, Geomorphology, 223, 67–80, https://doi.org/10.1016/j.geomorph.2014.06.024, 2014.
Yoshida, H. and Sugai, T.: Morphological characteristics of hummocks originating from the 24ka sector collapse event of Asama Volcano, Central Japan, J. Geogr. (Chigaku Zasshi), 115, 638–646, https://doi.org/10.5026/jgeography.115.5_638, 2006 (in Japanese with English abstract).
Yoshida, H. and Sugai, T.: Magnitude of the sediment transport event due to the Late Pleistocene sector collapse of Asama volcano, central Japan, Geomorphology, 86, 61–72, https://doi.org/10.1016/j.geomorph.2006.08.006, 2007a.
Yoshida, H. and Sugai, T.: Topographical control of large-scale sediment transport by a river valley during the 24 ka sector collapse of Asama volcano, Japan, Géomorphologie Reli. Process. Environ., 13, 217–224, https://doi.org/10.4000/geomorphologie.3702, 2007b.
Yoshida, H. and Sugai, T.: Quantitative Examination of Hummock Alignment in Debris Avalanche Deposits: Zenkoji Debris Avalanche, Usu Volcano, Japan, Geogr. Rev. Japan Ser. B, 83, 64–72, https://doi.org/10.4157/geogrevjapanb.83.64, 2010.
Yoshida, H., Sugai, T., and Ohmori, H.: Size–distance relationships for hummocks on volcanic rockslide-debris avalanche deposits in Japan, Geomorphology, 136, 76–87, https://doi.org/10.1016/j.geomorph.2011.04.044, 2012.
Zernack, A. V., Procter, J. N., and Cronin, S. J.: Sedimentary signatures of cyclic growth and destruction of stratovolcanoes: A case study from Mt. Taranaki, New Zealand, Sediment. Geol., 220, 288–305, https://doi.org/10.1016/j.sedgeo.2009.04.024, 2009.