the Creative Commons Attribution 4.0 License.
the Creative Commons Attribution 4.0 License.
 | 30 Nov 2018
Towards a comprehensive view of dust events from multiple satellite and ground measurements: exemplified by the May 2017 East Asian dust storm
Jie Guang
Yahui Che
Cheng Fan
Ying Li
Yanqing Xie
One or several aspects of the source, distribution, transport, and optical properties of airborne dust have been characterized using different types of satellite and ground measurements, each with unique advantages. In this study, a dust event that occurred over the East Asia area in May 2017 was exemplified to demonstrate how all the above-mentioned aspects of a dust event can be pictured by combining the advantages of different satellite and ground measurements. The data used included the Himawari-8 satellite Advanced Himawari Imager (AHI) true-colour images, the Cloud-Aerosol Lidar and Infrared Pathfinder Satellite Observation (CALIPSO) Cloud-Aerosol Lidar with Orthogonal Polarization (CALIOP) aerosol vertical profiles, the Aura satellite Ozone Monitoring Instrument (OMI) aerosol index images, and the ground-based Aerosol Robotic Network (AERONET) aerosol properties and the ground station particulate matter (PM) measurements. From the multi-satellite/sensor (AHI, CALIOP, and OMI) time series observations, the dust storm was found to originate from the Gobi Desert on the morning of 3 May 2017 and transport north-eastward to the Bering Sea, eastward to the Korean Peninsula and Japan, and southward to south-central China. The air quality in China deteriorated drastically: the PM10 (PM < 10 µm in aerodynamic diameter) concentrations measured at some air quality stations located in northern China reached 4333 µg m−3. At the AOE_Baotou, Beijing, Xuzhou-CUMT, and Ussuriysk AERONET sites, the maximum aerosol optical depth values reached 2.96, 2.13, 2.87, and 0.65 and the extinction Ångström exponent dropped to 0.023, 0.068, 0.03, and 0.097, respectively. The dust storm also induced unusual aerosol spectral single-scattering albedo and volume size distribution.
- Article
(28048 KB) - Full-text XML
- BibTeX
- EndNote


Large amounts of dust particles are emitted from the deserts in western/northern China and southern Mongolia every year, especially in spring (Shao et al., 2011). The annual dust emissions of East Asia reach approximately 25 % of the total global dust emissions (Ginoux et al., 2004). These massive emissions produce significant influences on the Earth's radiation balance, climate, ambient air quality, and human health (Goudie, 2009; Shao et al., 2011; Rodríguez et al., 2012). Dust aerosols exert both direct and indirect effects on the climate system. Dust can directly scatter and absorb solar radiation over ultraviolet, visible, and infrared wavelengths, resulting in positive or negative forcing (Rosenfeld et al., 2001; Tegen, 2003). Dust is also involved in cloud formation and precipitation processes and can alter the albedo of snow and ice surfaces, thereby causing indirect effects on the Earth's energy budget (Rodríguez et al., 2012; Rosenfeld et al., 2001; Bangert et al., 2012).
Due to the long-distance transport of dust plumes (Zhu et al., 2007), dust particles can alter the atmospheric conditions on regional and even global scale (Goudie, 2009). The dust aerosols from the Taklimakan and Gobi deserts can travel thousands of miles, thereby affecting large areas of China (Wang et al., 2013; Lee et al., 2010; Chen et al., 2015; Tan et al., 2012), South Korea, and Japan (Mikami et al., 2006), and even the North Pacific Ocean and North America (Fairlie et al., 2007; Creamean and Prather, 2013; Guo et al., 2017). Dust storms can cause poor air quality and low visibility and have severe effects on human health and the environment (Goudie, 2009; Lee et al., 2010). Desert dust is the main contributor to aerosol loading and particulate matter (PM) mass concentrations in China during the spring season (Wang et al., 2013). During heavy dust outbreaks, PM10 (PM less than 10 µm in aerodynamic diameter) mass concentrations can even exceed the internationally recommended limit value in northern China by 20 times. Moreover, dust particles can interact with anthropogenic pollution and smoke, causing air conditions with greater complexity (Dall'Osto et al., 2010).
Many research works have studied desert dust from different perspectives using different satellite data, ground-based observations, and model simulations (Badarinath et al., 2010; Wang et al., 2013; Teixeira et al., 2016). For example, some analysed the dust chemical composition and dust radiative effects, i.e. dust optical and microphysical properties (Alam et al., 2014; Basha et al., 2015; Srivastava et al., 2014). The others focused on the long-distance transport of dust plumes using satellite observations and/or model simulations (Huang et al., 2008; Guo et al., 2017; Athanasopoulou et al., 2016). However, few studies have been carried out to fully examine the source, distribution, transport, and optical properties of dust storms. This is possibly because each observation system can only characterize one or several of these aspects.
This study tried to picture a comprehensive view of dust events using different satellite and ground measurements, with a recent heavy dust storm over northern China and southern Mongolia in May 2017 as an example. Satellite time series observations (the Himawari-8 satellite Advanced Himawari Imager (AHI) true-colour images and the Ozone Monitoring Instrument (OMI) aerosol index (AI) images) were used to capture the dust transport. The OMI AI was also used to provide information about the absorbing aerosol distribution. Cloud-Aerosol Lidar and Infrared Pathfinder Satellite Observation (CALIPSO) data were used to monitor the dust aerosol type and vertical distribution. The Air Resources Laboratory's HYbrid Single-Particle Lagrangian Integrated Trajectory (HYSPLIT) model was used to generate back trajectories to identify the dust sources. Ground-based measurements form both Aerosol Robotic Network (AERONET) and air quality stations were used to analyse the variations in aerosol properties caused by the dust storm. The connections and correspondences among different observations are briefly analysed.
2.1 General description of the dust event
Figure 1 shows the affected area and transport directions of the study dust storm event that occurred from 3 to 8 May 2017. The dust originated from the deserts in China and Mongolia, where an abundance of dust events occur, constituting the second-largest dust source in the world. During the spring, the Gobi region is affected by the Mongolian cyclone, which is the main factor of severe Asian dust storms (Shao et al., 2011). The dust storm spread with wind across south-eastern Russia and even reached the Bering Sea (Fig. 1) on 7–8 May 2017.

Figure 1Illustration of the May 2017 dust event. The white circles with black points represent four AERONET stations and the arrows show the dust transport directions.
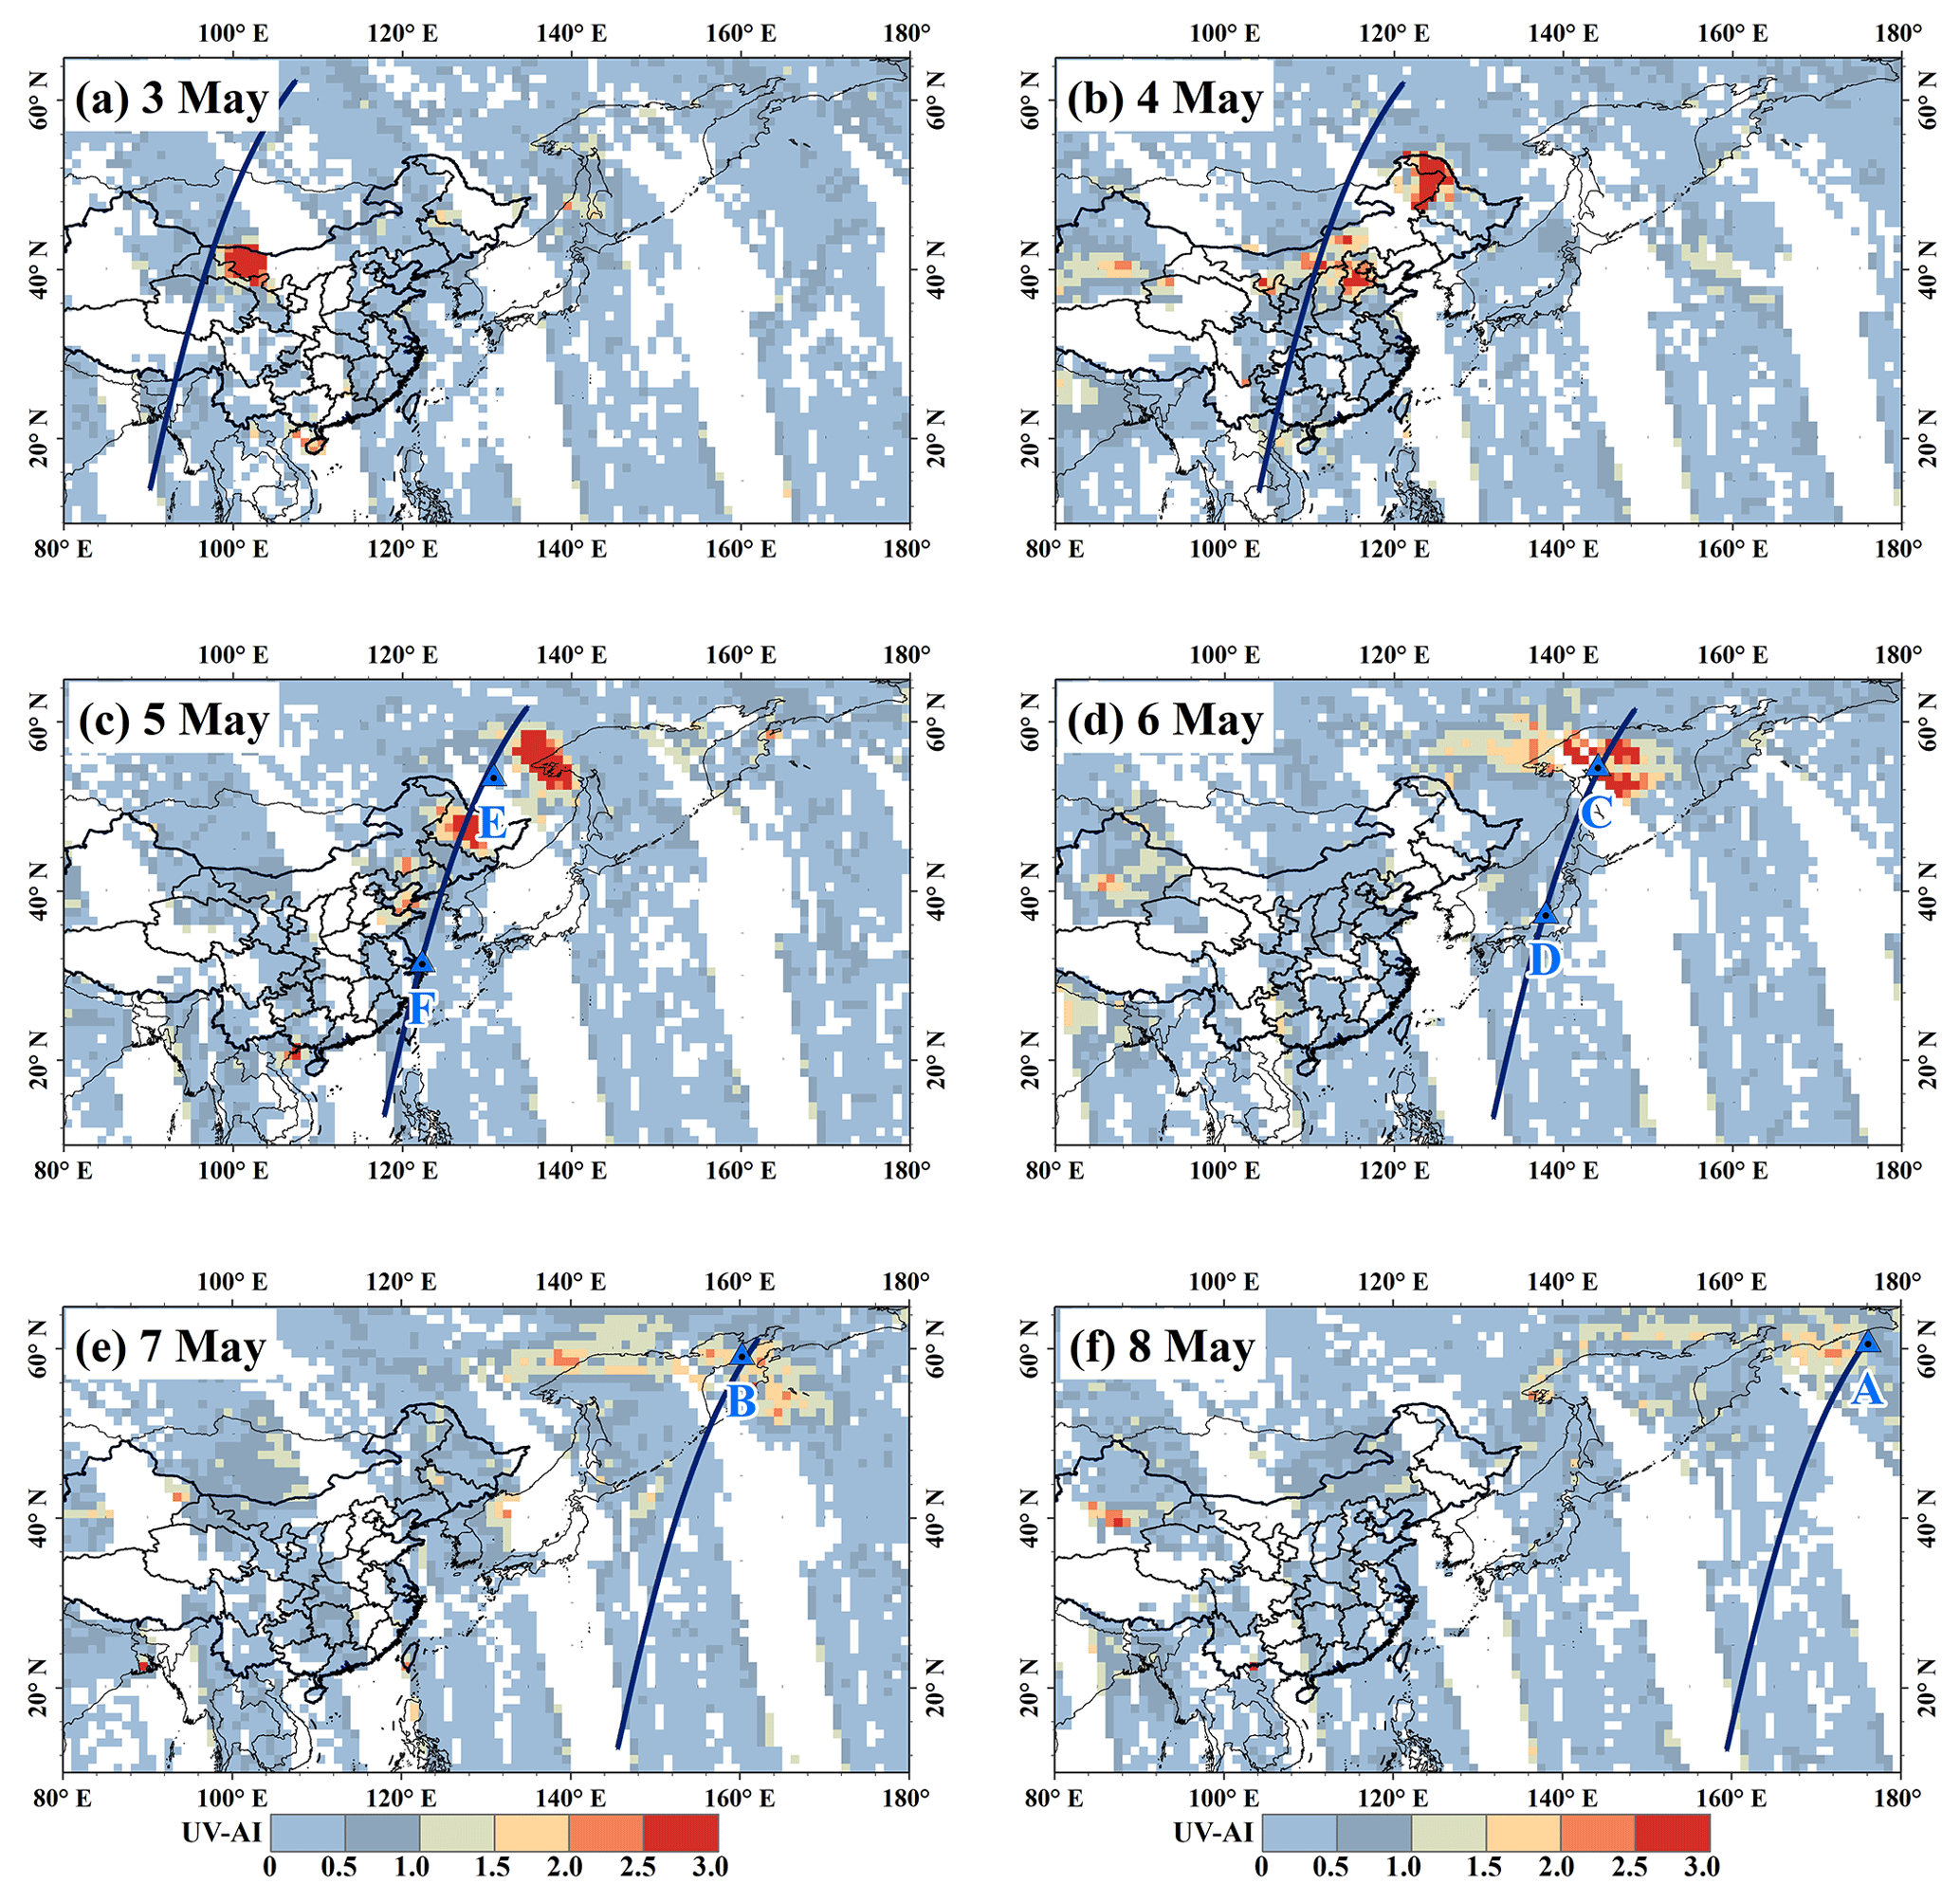
Figure 2(a)–(f) Spatial distributions of the OMI UV-AI from 3 to 8 May 2017. The deep blue lines are the overpass trajectories of the CALIPSO observations used on that day. The blue triangles are the end points of the HYSPLIT computation.
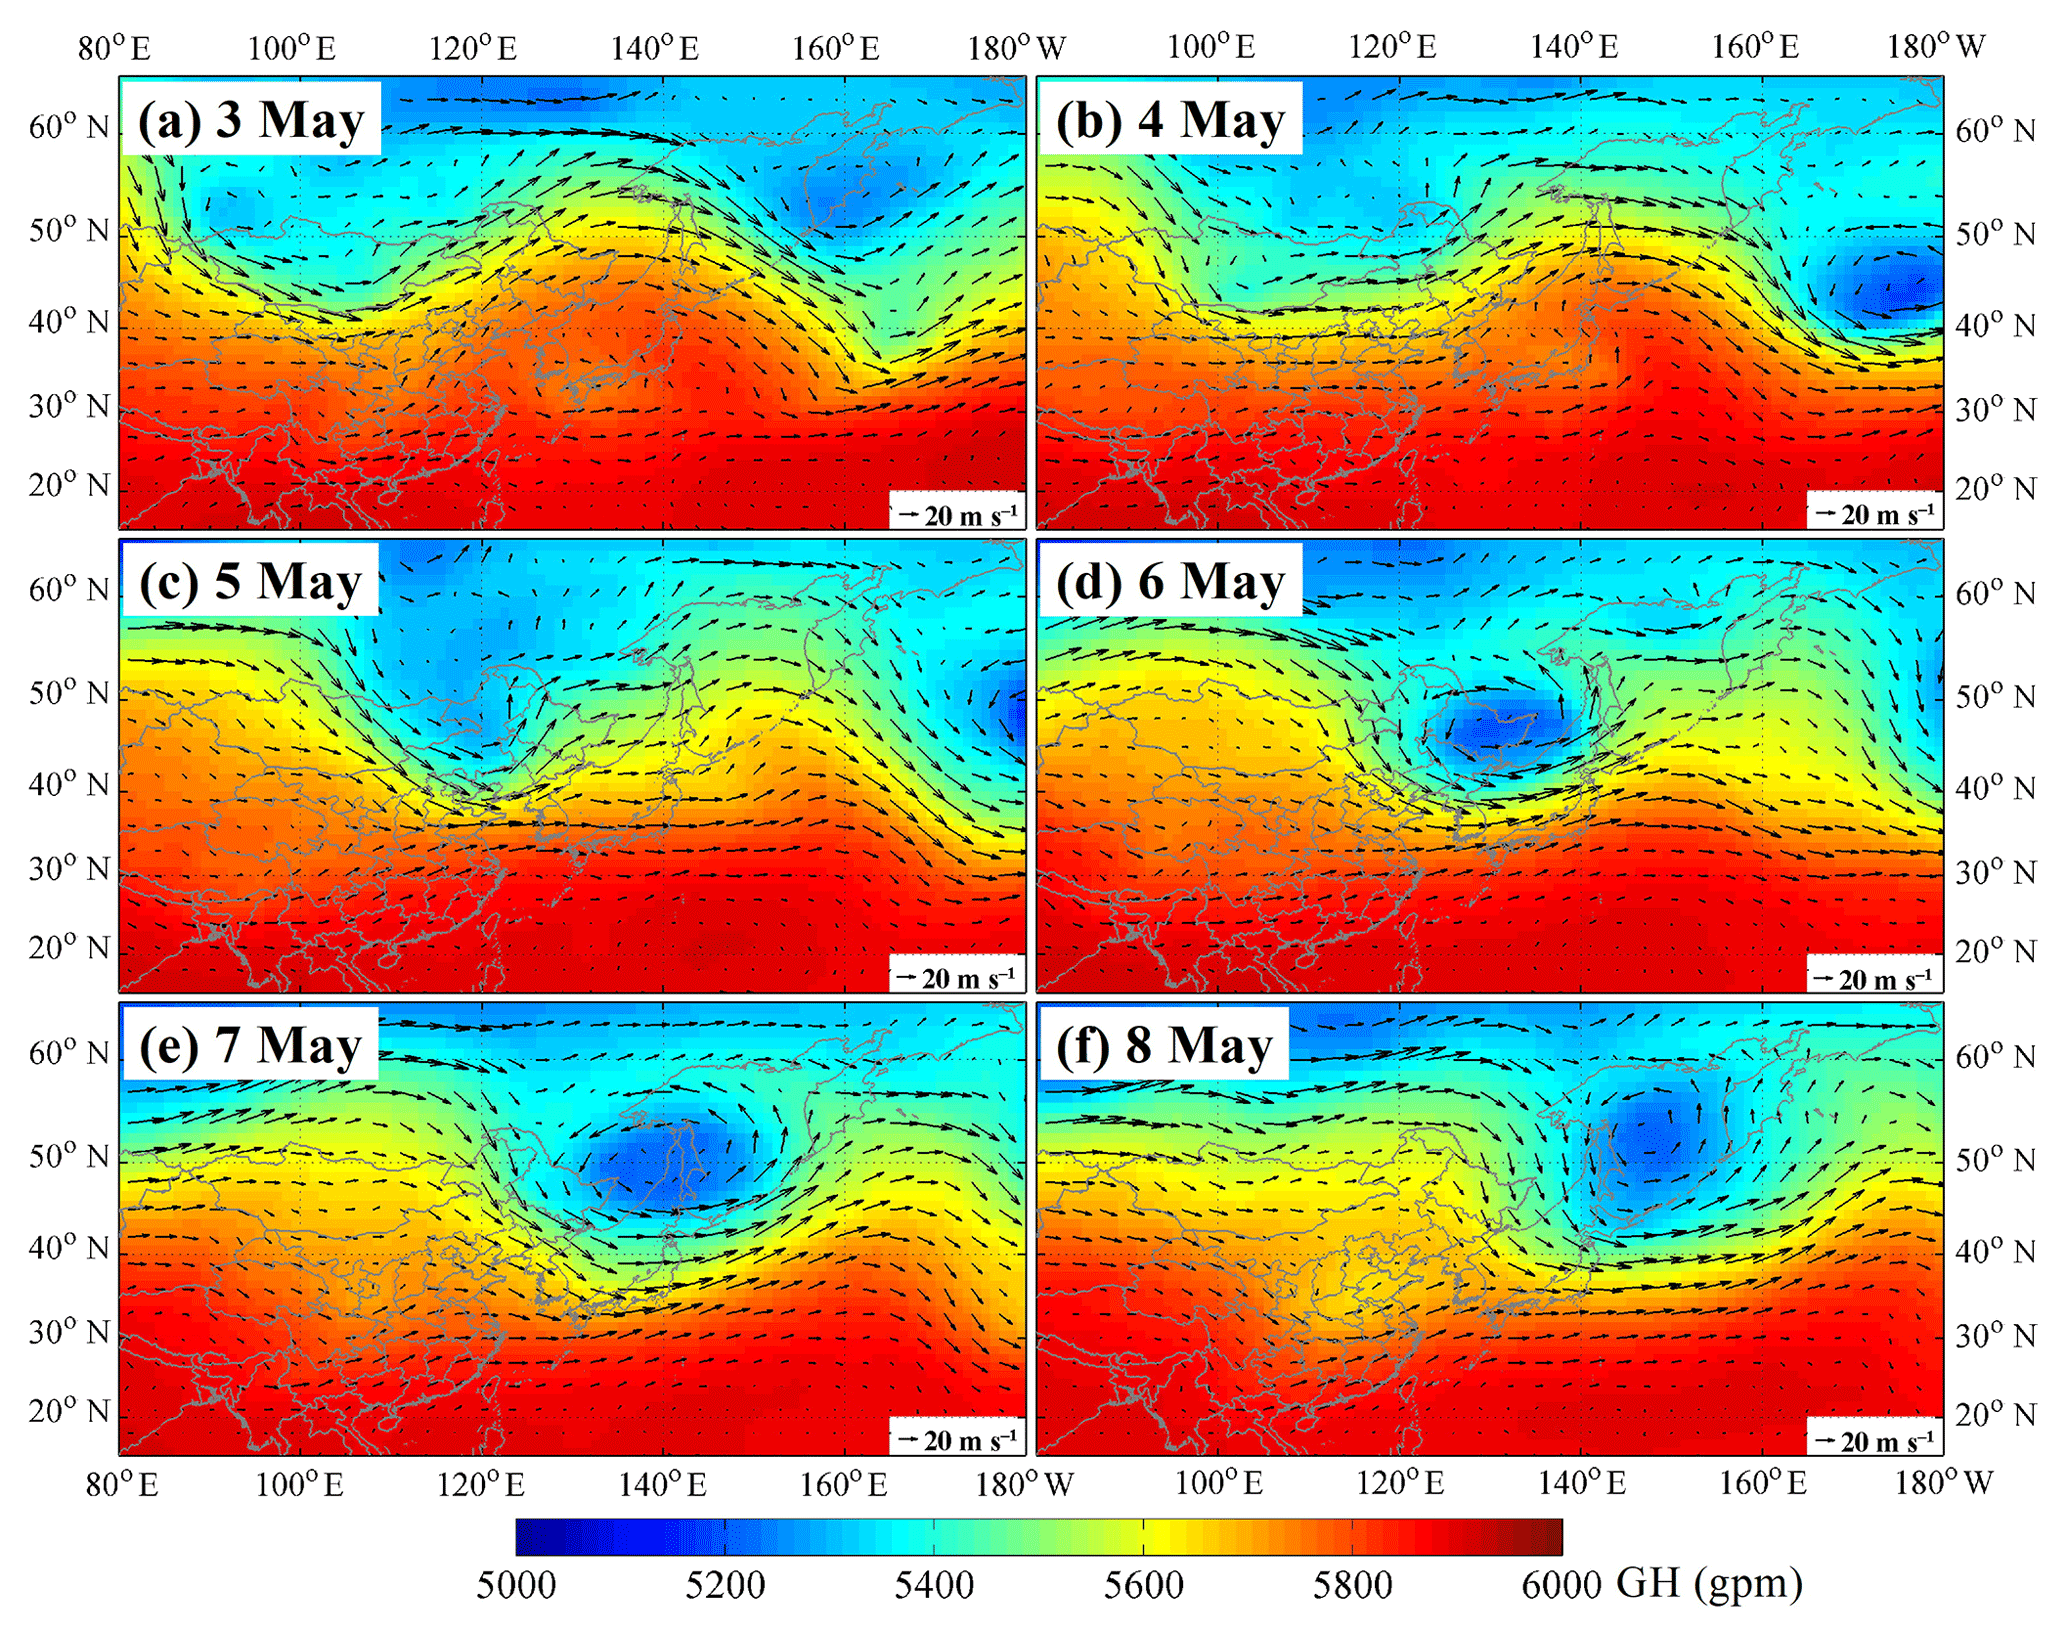
Figure 3(a)–(f) Spatial distribution of wind vectors and geopotential height (GH) at the 500 hPa level at 06:00 UTC during 3–8 May. The GH and wind vectors were derived from the ECMWF ERA-Interim reanalysis dataset.
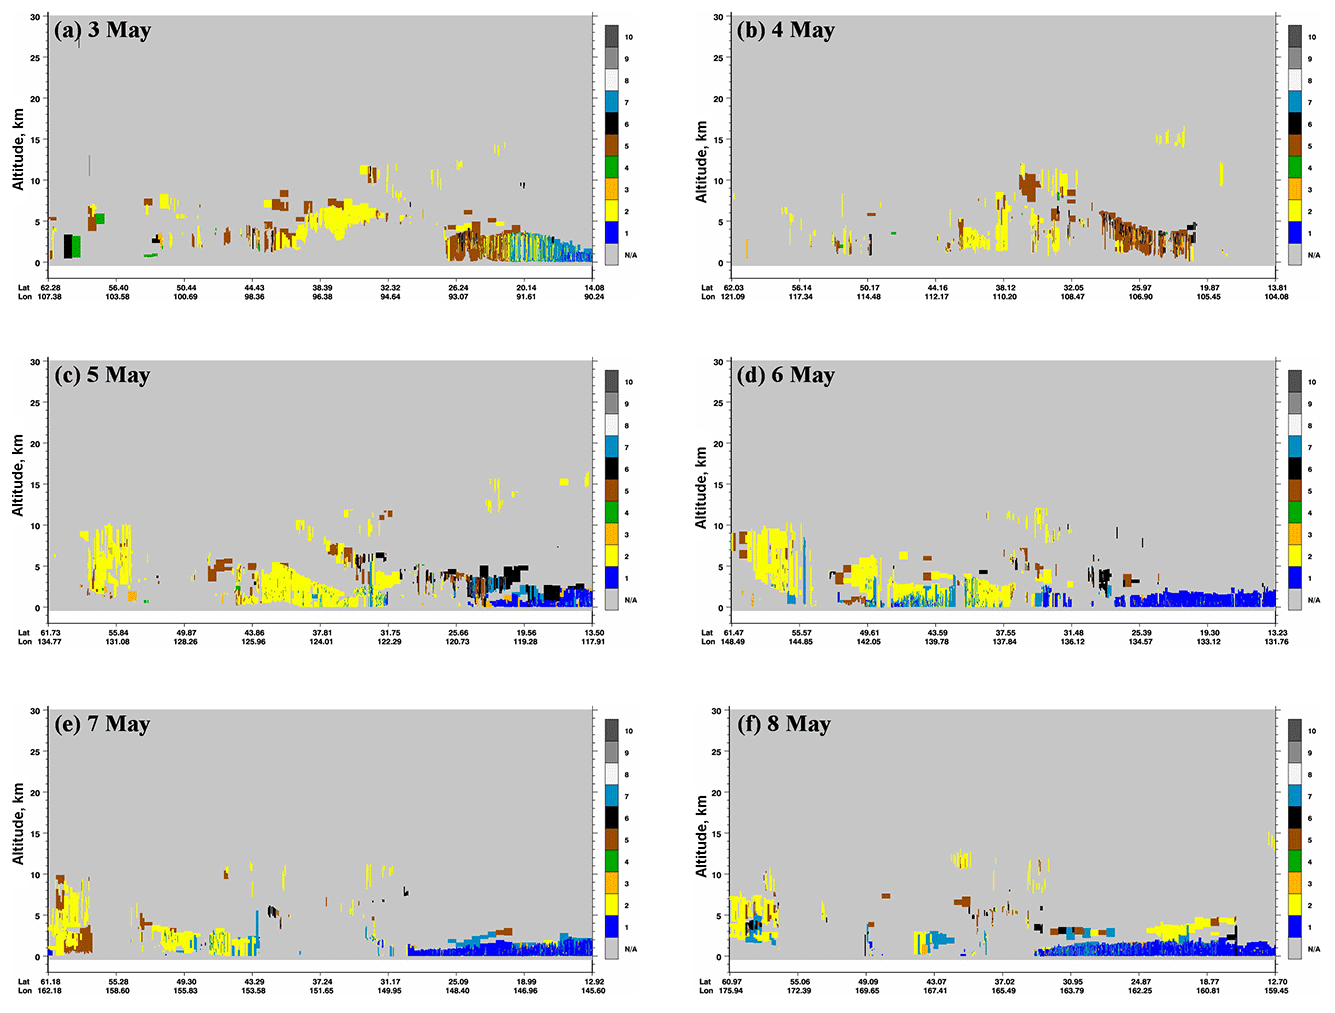
Figure 4(a)–(f) CALIPSO aerosol subtypes on 3–8 May 2017, corresponding to the overpass trajectories shown in Fig. 2. The dust aerosol is shown in yellow. The 10 aerosol subtypes are 1, marine, 2, dust, 3, polluted continental/smoke, 4, clean continental, 5, polluted dust, 6, elevated smoke, 7, dusty marine, 8, polar stratospheric cloud (PSC) aerosol, 9, volcanic ash, and 10, sulfate/other.
2.2 AHI/Himawari-8
The Himawari-8 (H8) satellite was launched on 7 October 2014 by the Japan Meteorological Agency (JMA). It started operation on 7 July 2015. The Advanced Himawari Imager (AHI) on board H8 can provide multi-spectral observations with a high spatial resolution and high temporal frequency. It has 16 channels with a spatial resolution of 0.5–2 km. The AHI level 2 calibrated data provided by JMA have a spatial coverage of 120∘ by 120∘, centred at 0∘ N, 140∘ E, and the observation area includes most of East Asia, Australia, and the Pacific Ocean. In addition, the AHI provides full-disk observations every 10 min. AHI level 2 calibrated data provided by the JMA and downloaded from the Japan Aerospace Exploration Agency (JAXA) Earth Observation Research Center (EORC) were used (http://www.eorc.jaxa.jp/ptree/terms.html, last access: 17 January 2018).
2.3 OMI/Aura
The OMI sensor aboard the Aura satellite measures the Earth in the ultraviolet (UV) and visible spectra (270–550 nm) with a wide swath. The OMI provides a parameter called the UV aerosol index (UV-AI), which is a qualitative parameter that detects UV-absorbing aerosols. The UV-AI is sensitive to absorbing aerosols, including mineral dust, black carbon, and biomass burning aerosols (Eck et al., 2001). Therefore, the UV-AI can be used to identify aerosol types through positive values for dust and biomass burning particles and near-zero or small positive values for clouds and weakly absorbing aerosols (Torres et al., 2007). In addition, the UV-AI can be obtained under both cloudy and cloudless conditions. The surface reflectance also has no impact on the UV-AI, which makes it capable of detecting absorption by aerosols over highly reflective surfaces (Torres et al., 2007). Since this dust event occurred in May, a high UV-AI can be a good indicator of high dust aerosol loading when combined with CALIPSO observations, as Aura and CALIPSO have similar equatorial crossing times. Here, level 3 OMI UV-AI data were used with a spatial resolution.
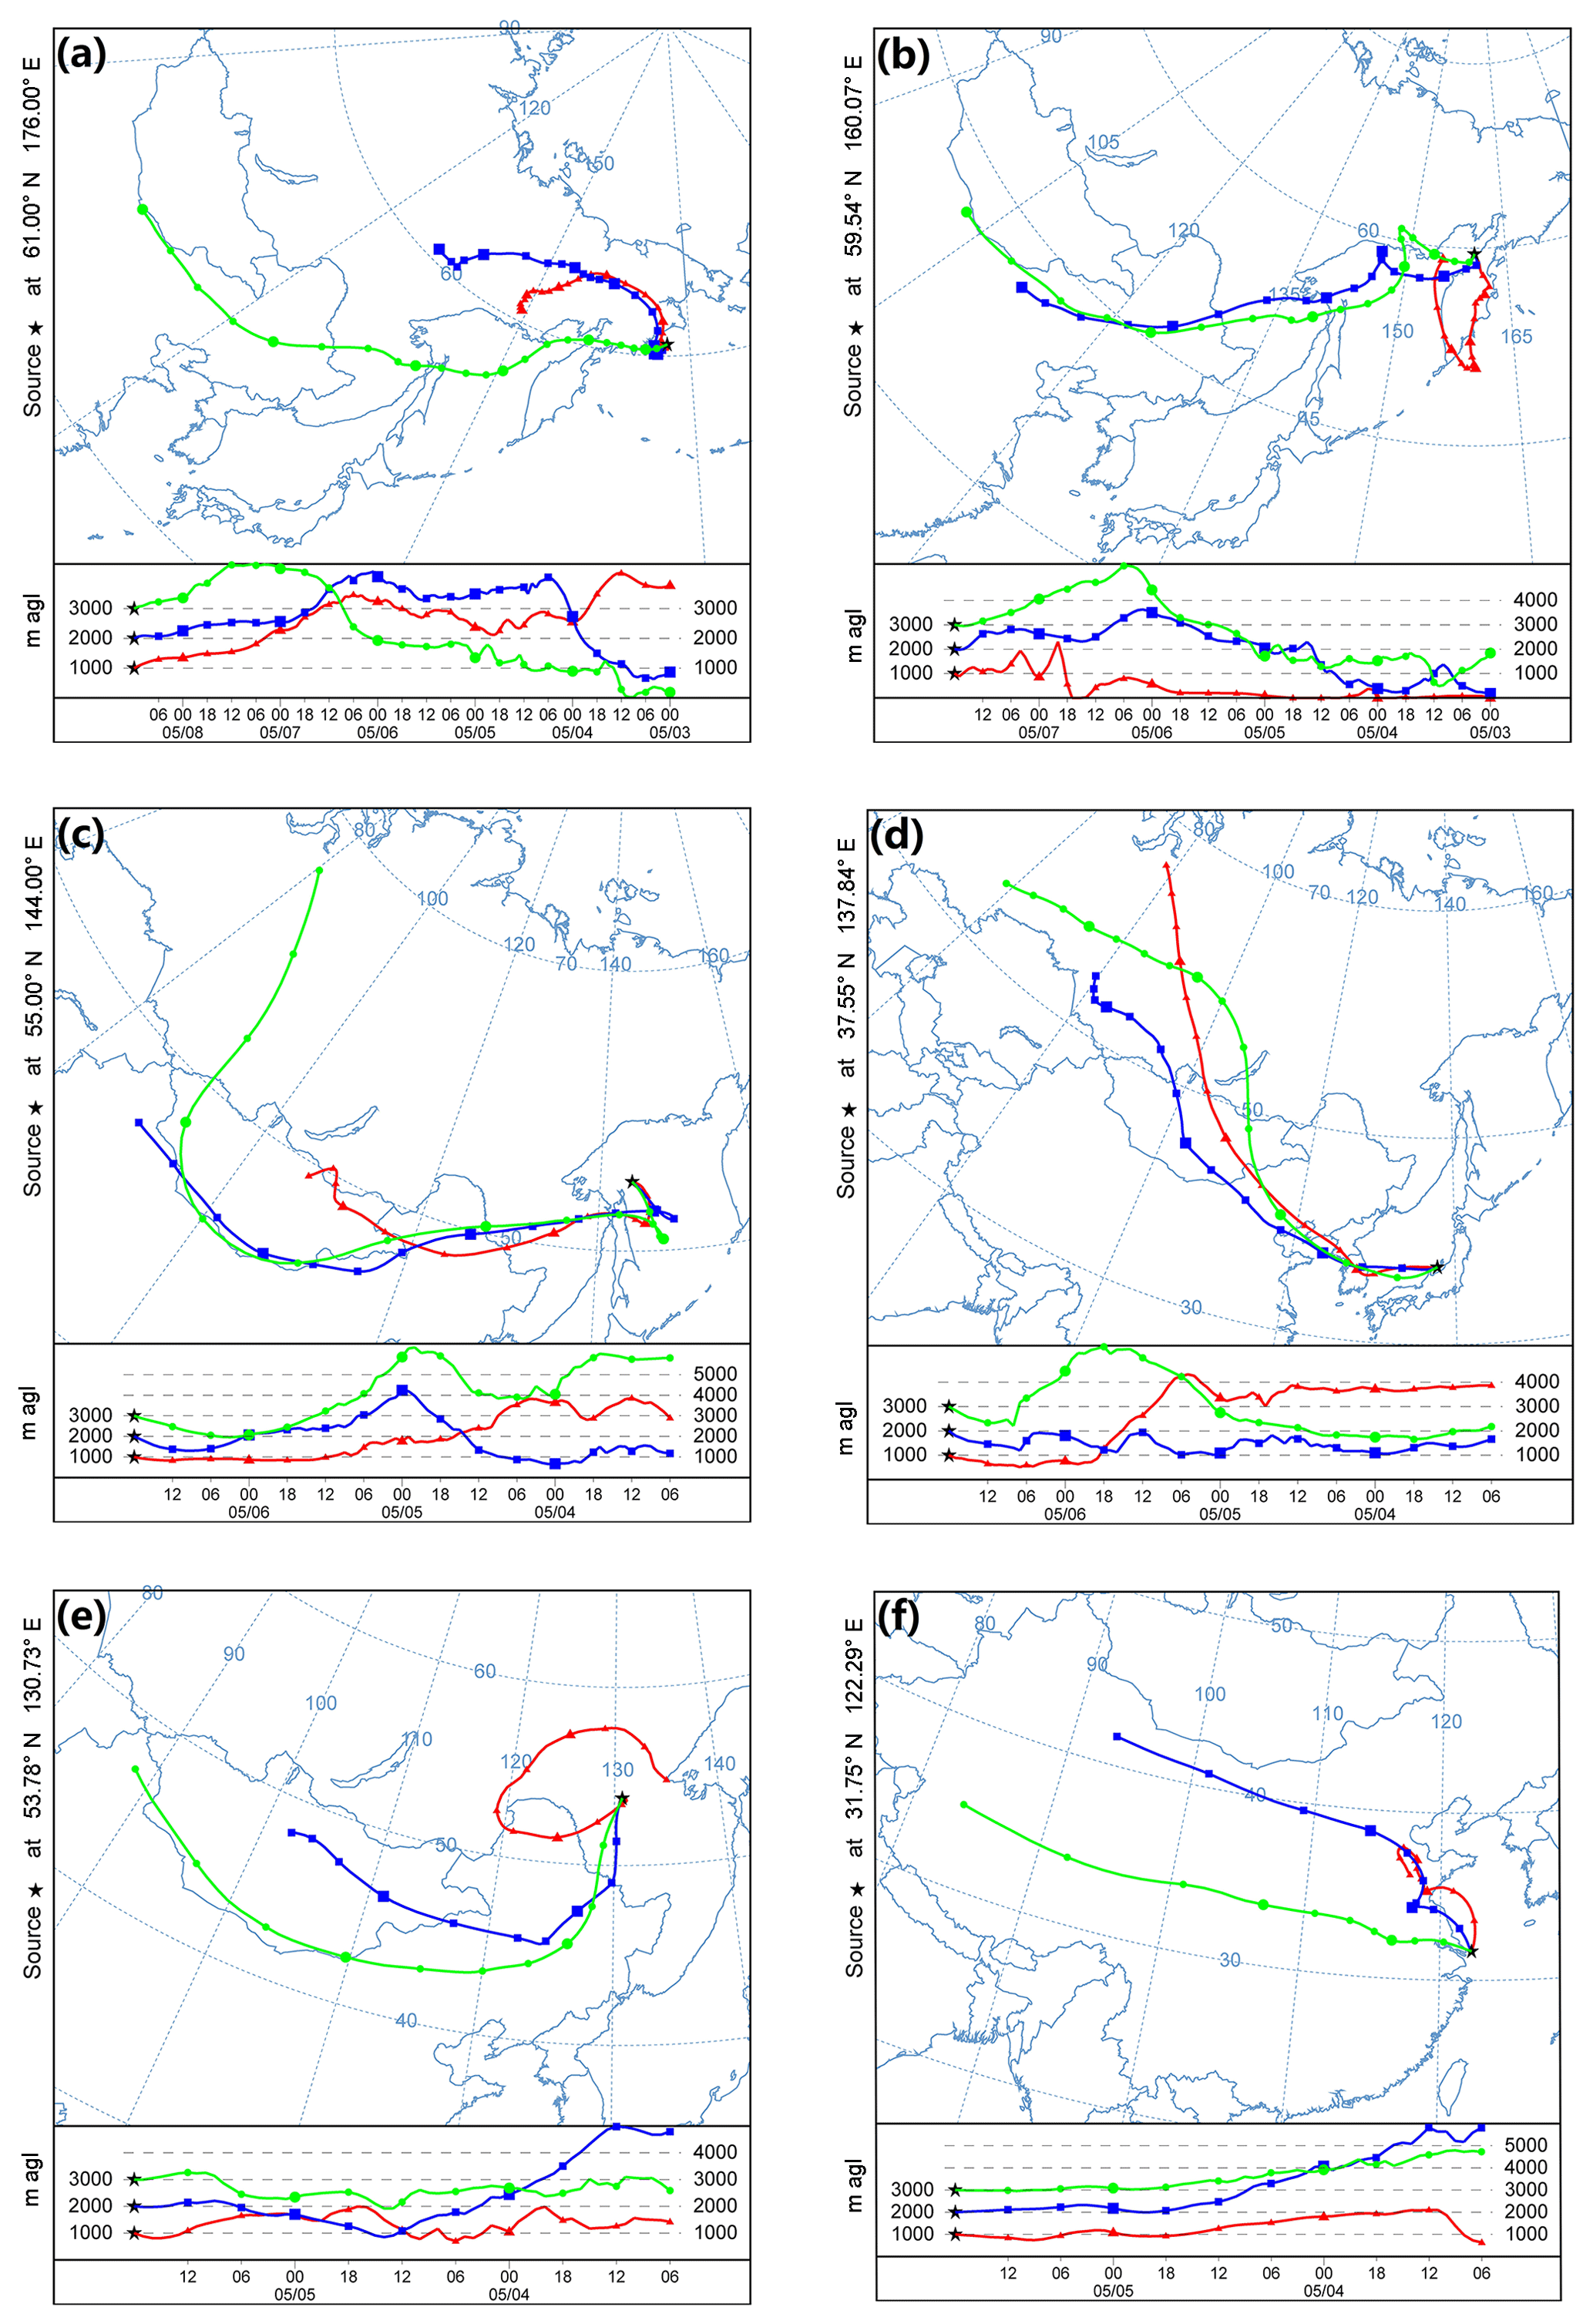
Figure 5Backward trajectories derived from the HYSPLIT model at different locations during 5–8 May 2017: (a) 132 h back trajectories ending at the Bering Sea on 8 May, (b) 108 h back trajectories ending at the Kamchatka Peninsula on 7 May, (c, d) 84 h back trajectories ending at the Sea of Okhotsk and the Sea of Japan on 6 May, respectively, and (e, f) 60 h back trajectories ending at south-eastern Russia and the Yangtze River estuary region on 5 May, respectively.

Figure 6True-colour composite AHI images of mainland China from AHI data from 03:00 to 09:00 UTC on 3 May 2017: (a) 03:00, (b) 06:00, and (c) 09:00. The red polygons in (b) are dust clusters. The arrows in (c) represent the dust transport directions.
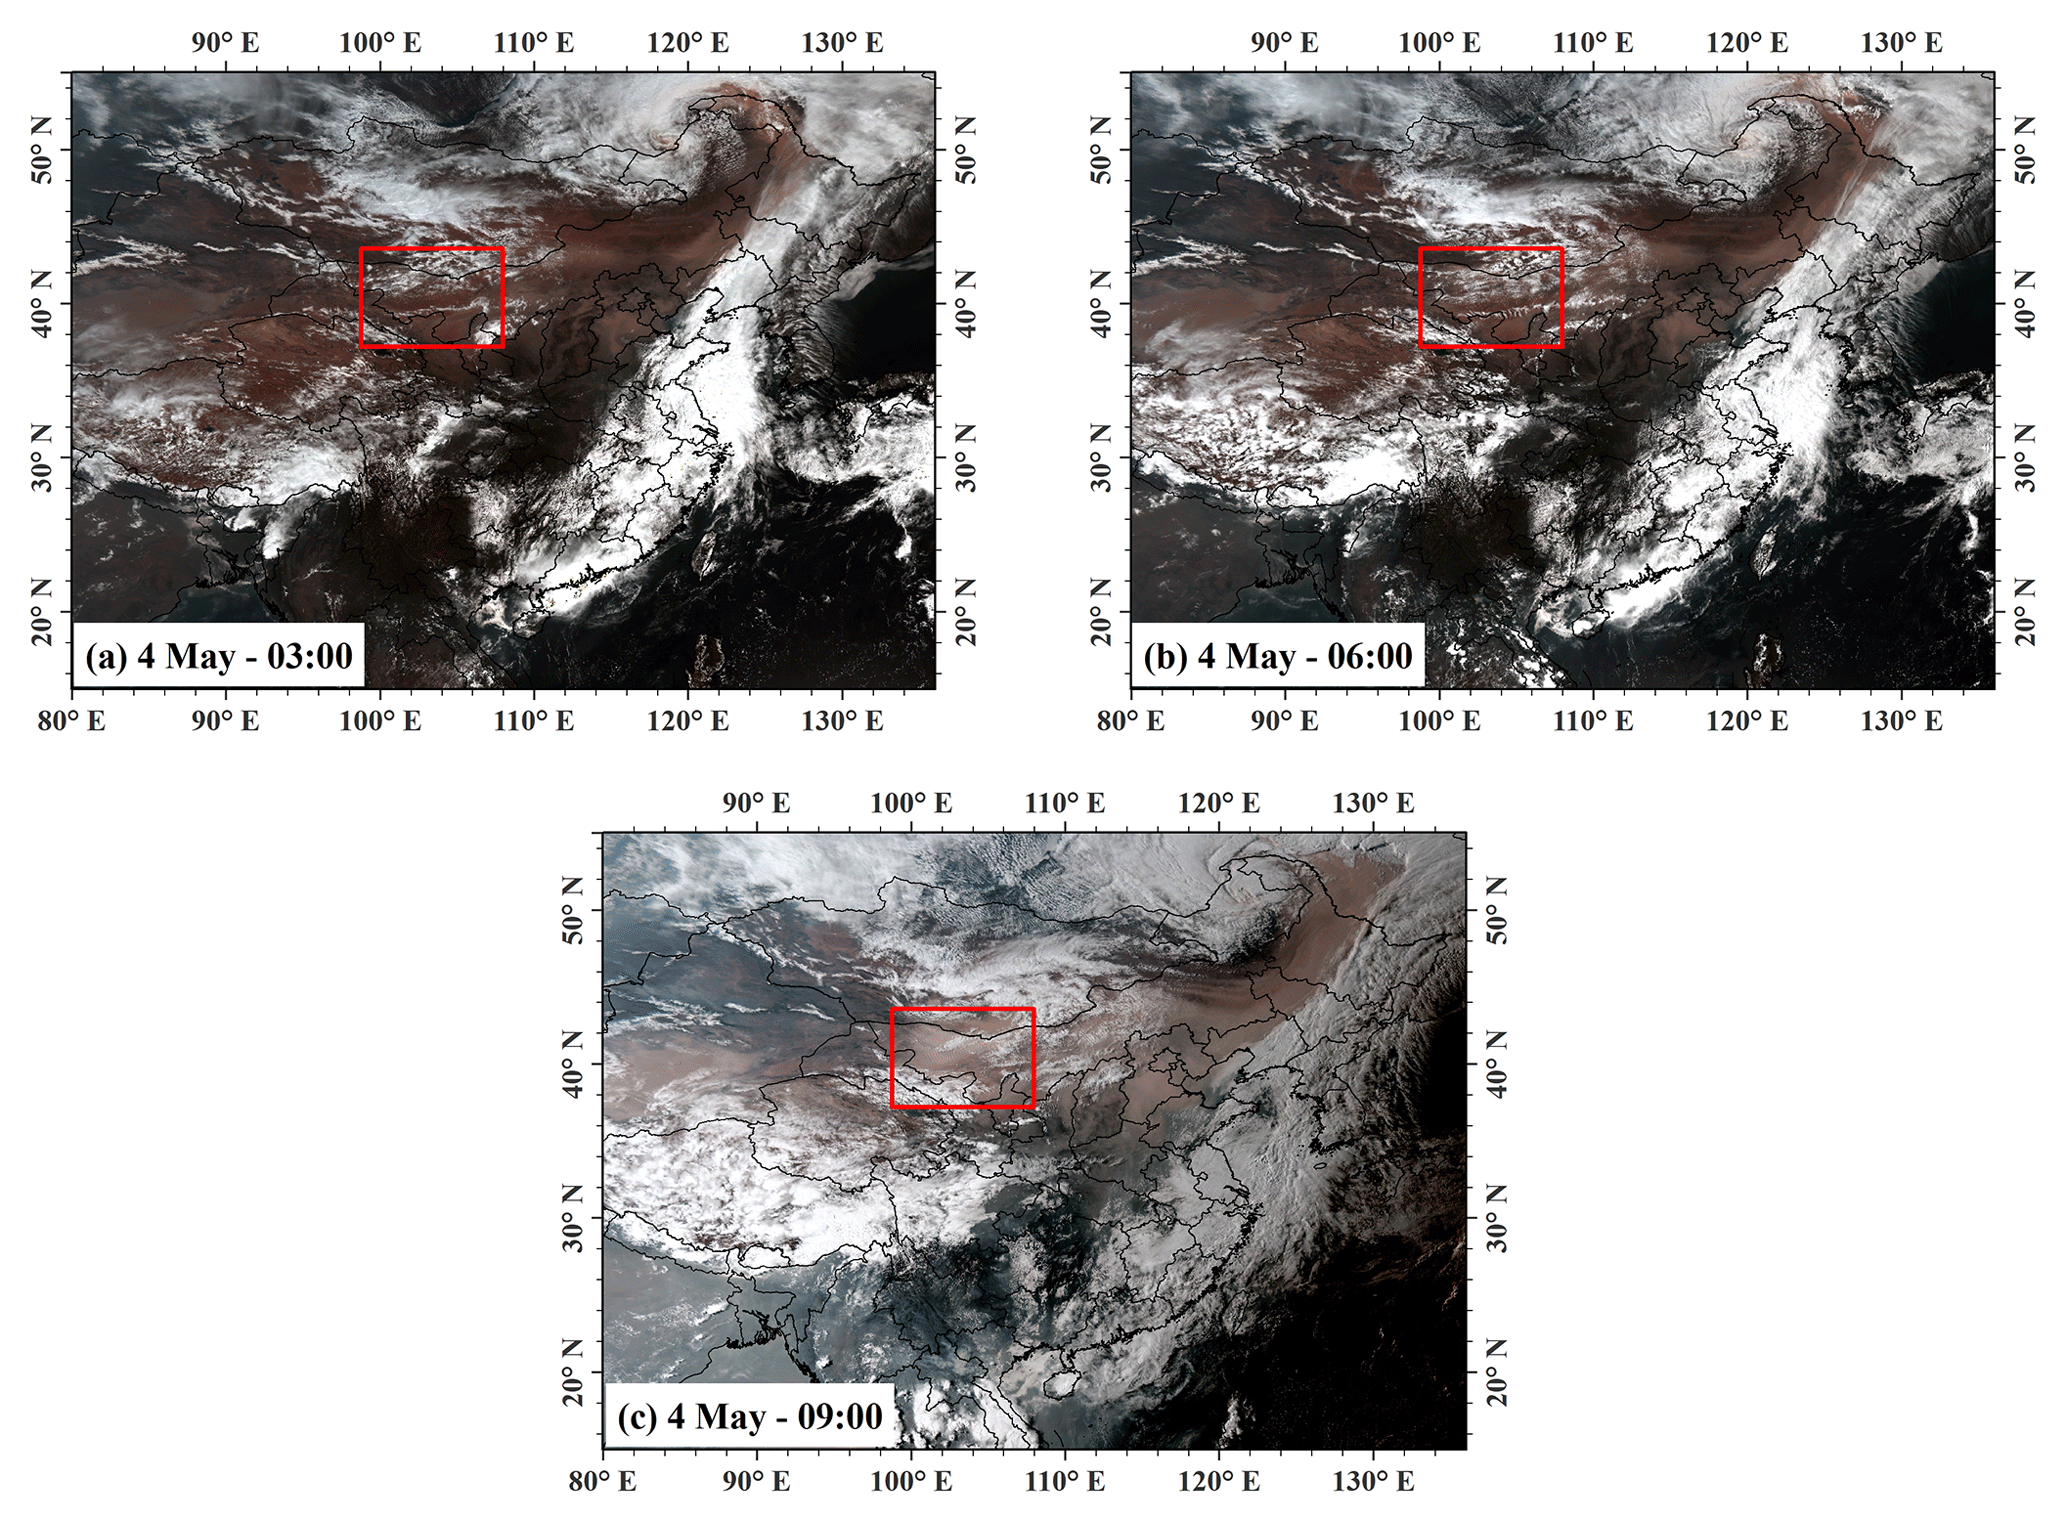
Figure 7True-colour composite AHI images of mainland China over a 3 h interval from 03:00 to 09:00 UTC on 4 May 2017: (a) 03:00, (b) 06:00, and (c) 09:00. The red rectangles mark the area where another dust plume originated in the afternoon of 4 May.
2.4 CALIOP/CALIPSO
The Cloud-Aerosol Lidar with Orthogonal Polarization (CALIOP) instrument on board the CALIPSO satellite provides vertical profiles of the elastic backscatter at two wavelengths (532 and 1064 nm) during both the day and the night. The CALIOP payload also provides linear depolarization at 532 nm that can be used to identify dust aerosols since dust aerosols have a high linear depolarization ratio due to their non-sphericity. Aerosol types are also provided in the CALIPSO aerosol product. The CALIPSO algorithm defines six aerosol types, including smoke, dust, polluted dust, clean continental, polluted continental, and marine (Omar et al., 2009, 2013). It has been evaluated that the CALIPSO aerosol classification works well in most cases (Wu et al., 2014). It should be noted that the accuracy of aerosol detection is decreased over highly reflected land surfaces such as deserts and snow-covered regions. Here, CALIPSO level 2 vertical feature mask (VFM) aerosol layer products were used to provide independent information about dust aerosols, especially for the night-time, as the signal-to-noise ratio during the night-time is better than that during the daytime for CALIPSO (Liu et al., 2009). The VFM products have a vertical resolution of 30 m below 8.2 km, 60 m for 8.2–20.2 km, and 180 m for 20.2–30.1 km (Winker et al., 2007). The dust vertical distribution and dust layer height were analysed using CALIPSO VFM data.
2.5 AERONET data
AERONET is a ground-based remote sensing aerosol network (Holben et al., 1998) that provides spectral aerosol optical depth (AOD) and inversion products derived from direct and diffuse radiation measurements by Cimel sun/sky radiometers (Dubovik et al., 2006). The inversion products include both microphysical parameters (e.g. the size distribution and complex refractive index) and radiative properties (e.g. the single-scattering albedo and phase function) (Dubovik et al., 2006).
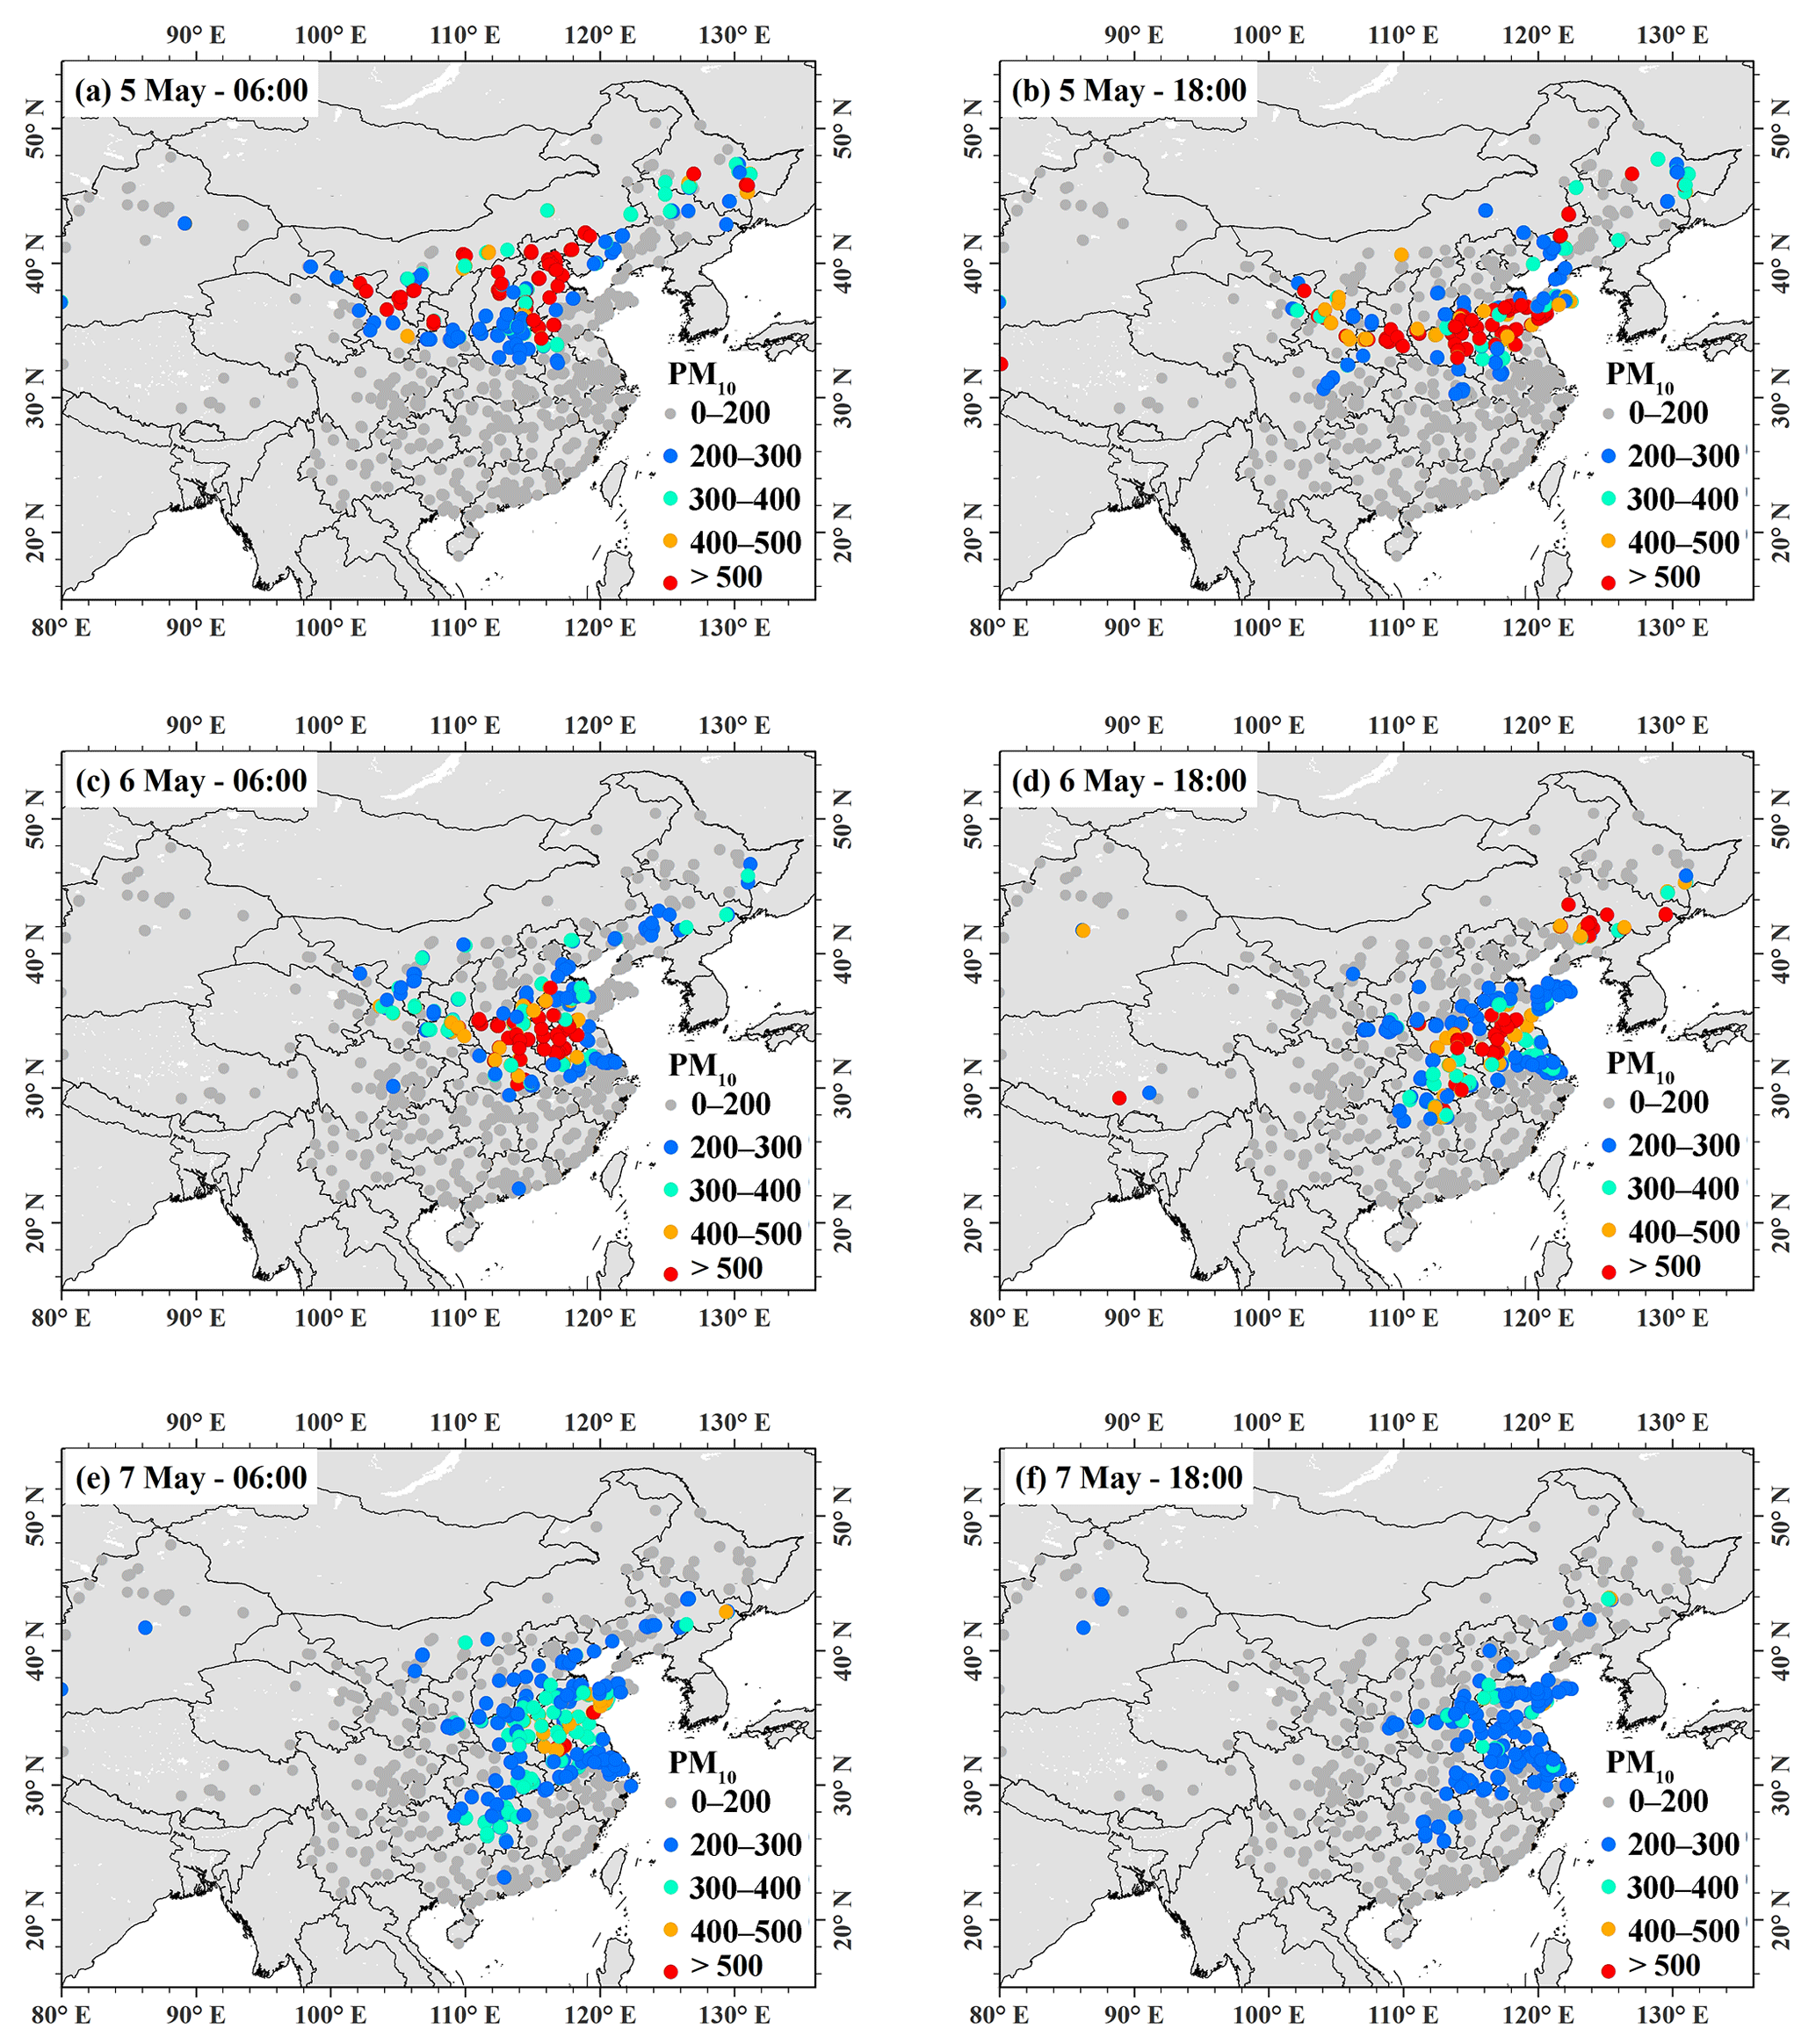
Figure 8PM10 mass concentrations measured by ground-based air quality stations in mainland China over a 12 h interval from 06:00 to 18:00 during 5–7 May.
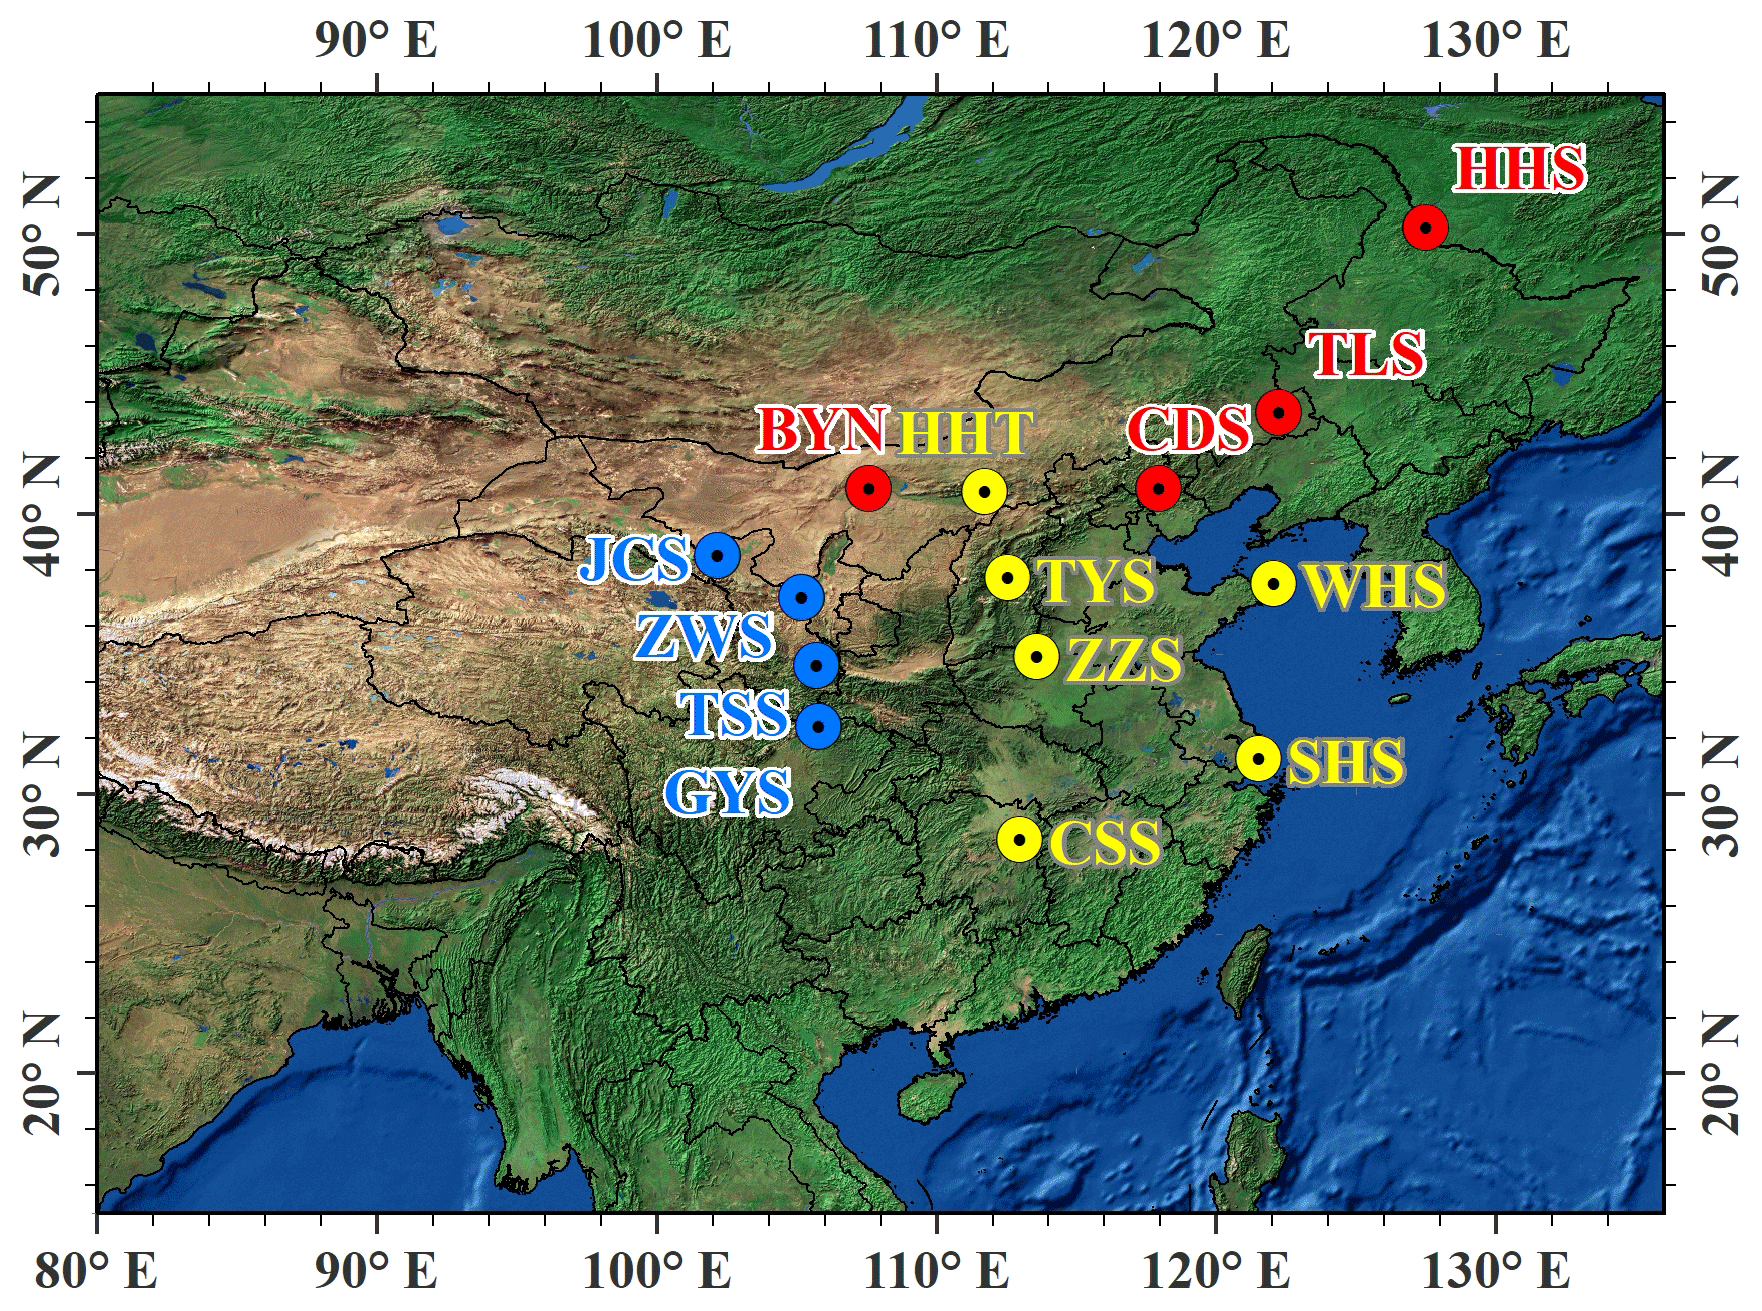
Figure 9The locations of the 14 air quality stations. Different colours represent different dust transport directions denoted by sequencing site names in chronological order of when the dust passes: the north-east direction of BYN–CDS–TLS–HHS, and the two south directions of JCS–ZWS–TSS–GYS and HHT–TYS–ZZS–CSS. Note the east direction travelling to the Sea of Japan is not shown as most of its path is over the sea without air quality stations.
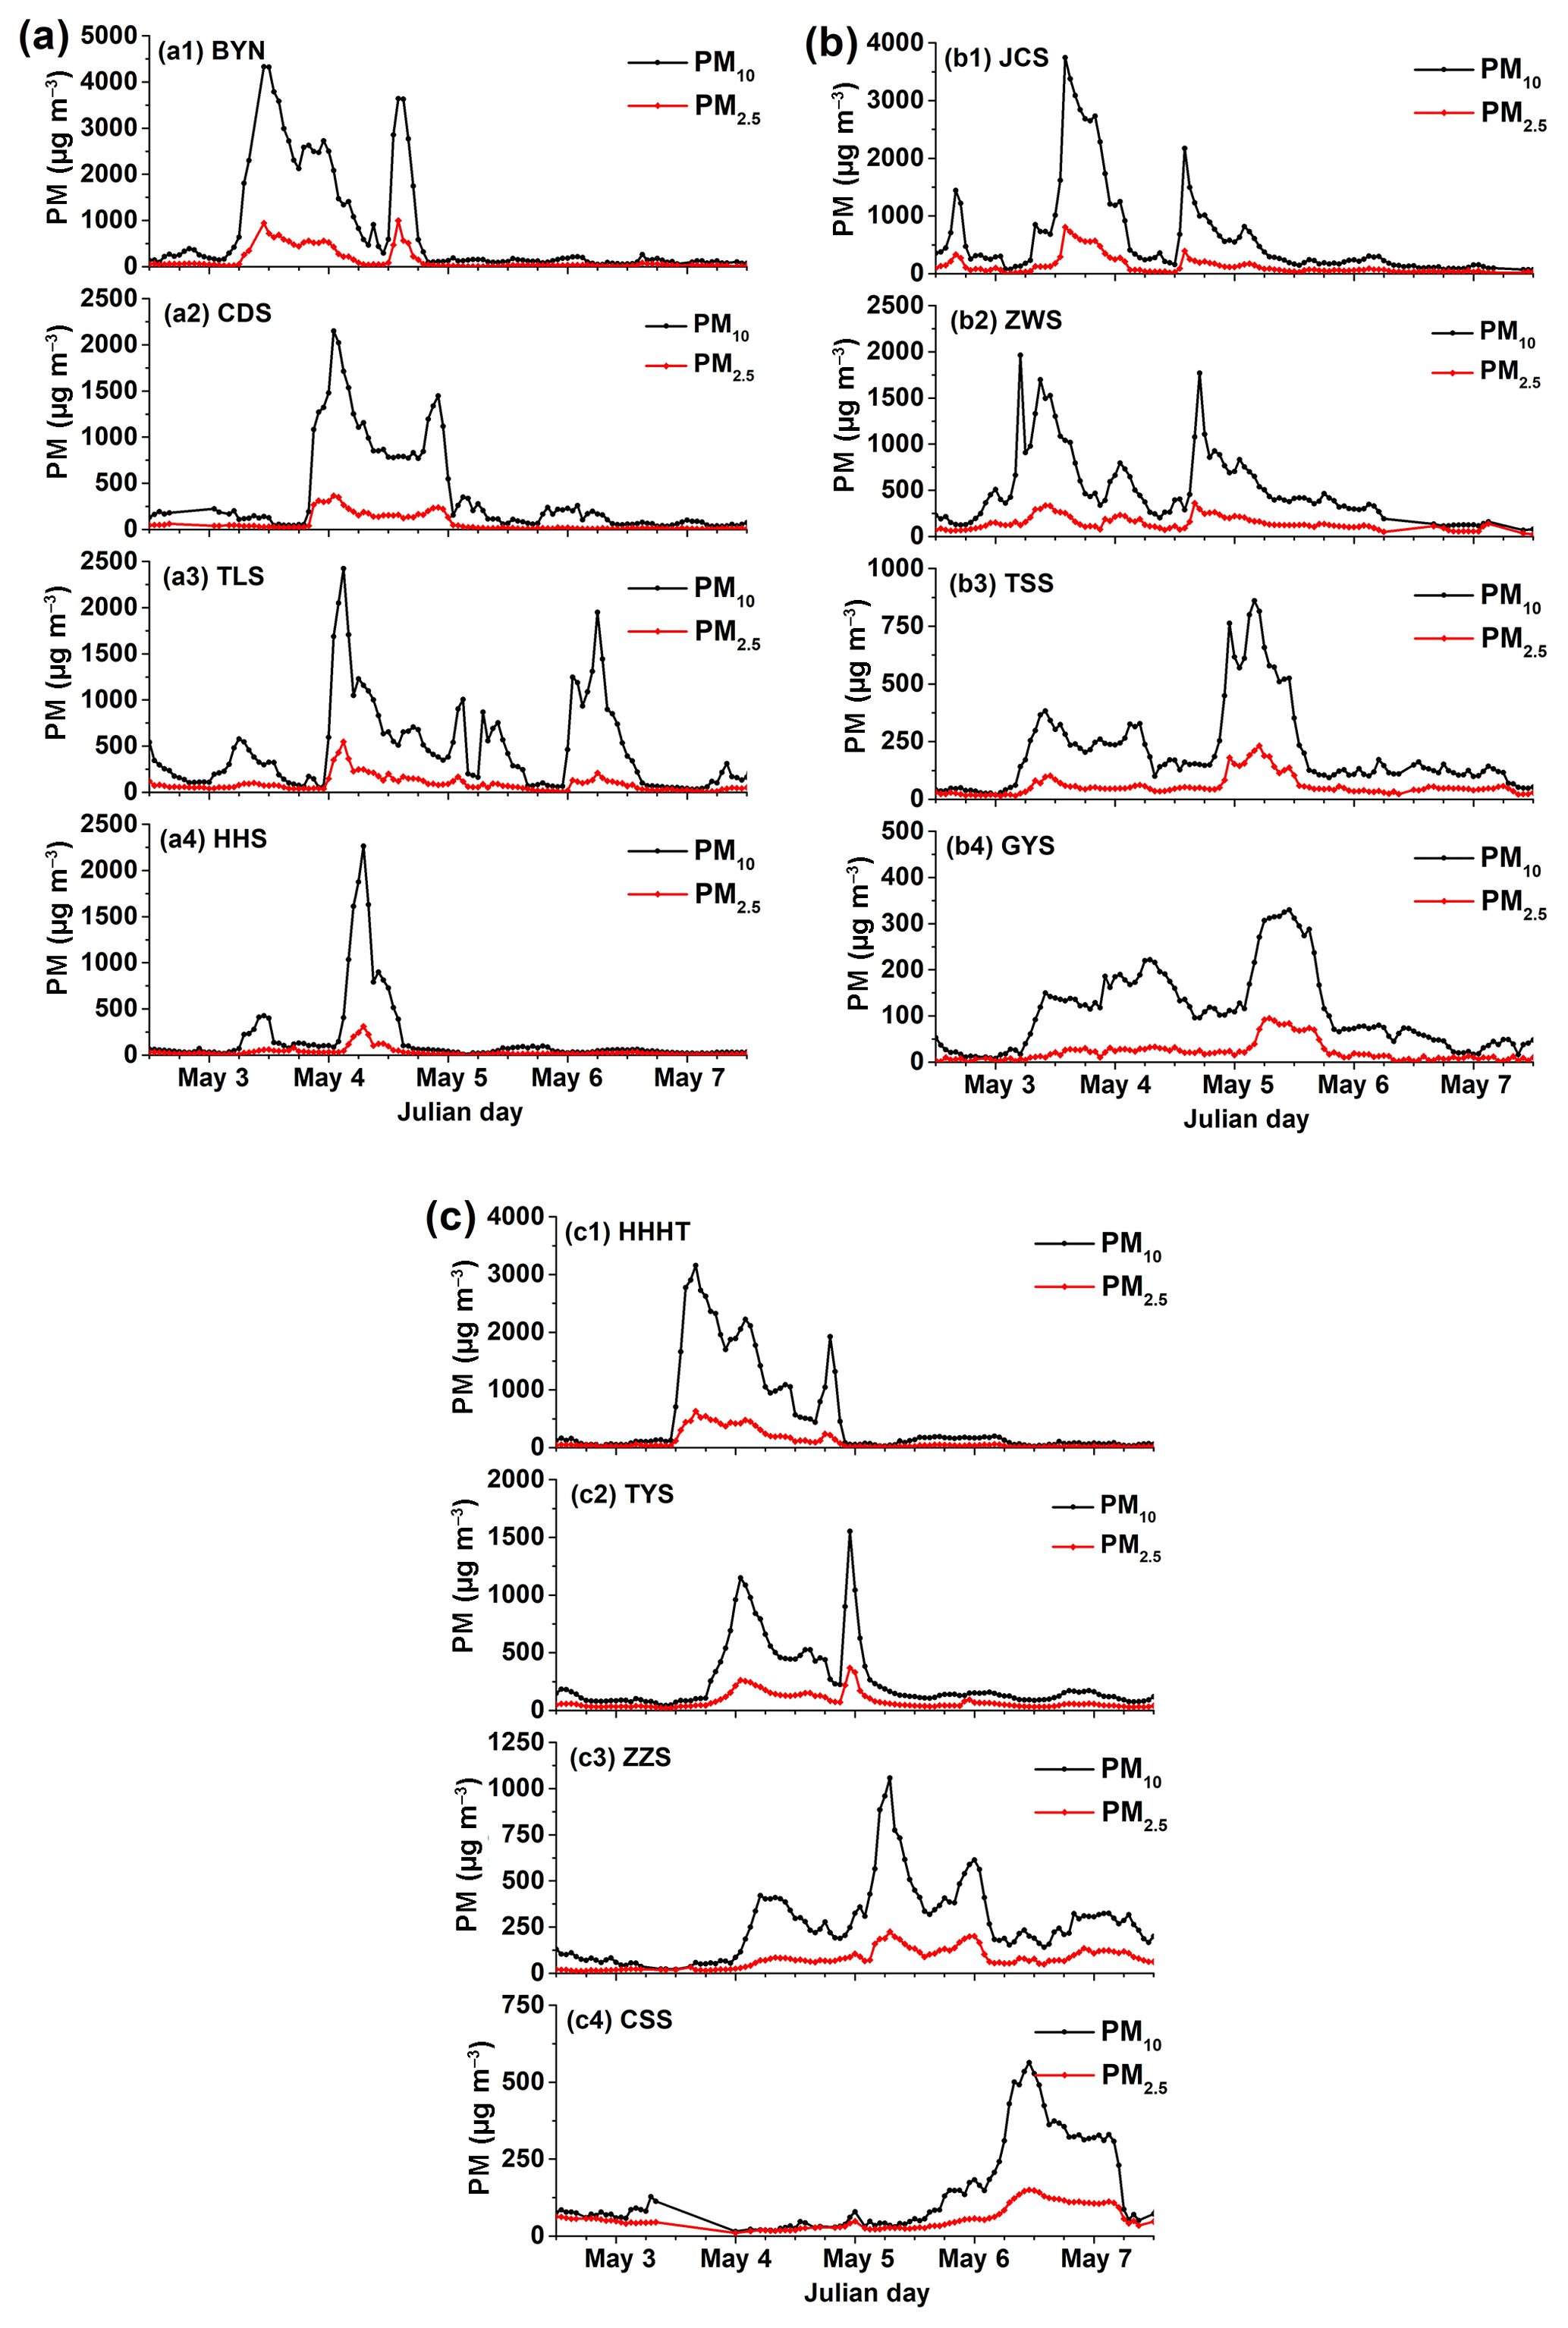
Figure 10Time series of the PM2.5 (red curves) and PM10 concentrations (black curves) during 2–7 May at 14 air quality stations in three directions: (a) north-eastward propagation, including (a1) BYN, (a2) CDS, (a3) TLS, and (a4) HHS, (b) southward propagation, including (b1) JCS, (b2) BYS, (b3) TSS, and (b4) GYS, and (c) south-eastward propagation, including (c1) HHT, (c2) TYS, (c3) ZZS, and (c4) CSS.
In this study, Level 1.5 cloud screened data including both sun direct data (Version 2 and Version 3) and Inversion data (Version 2) from four AERONET sites in the study area were used to analyse the temporal variations in aerosol properties, including the AOD, the extinction Ångström exponent (EAE), volume size distribution (VSD), and single-scattering albedo (SSA). Figure 1 shows the locations of the four sites (white circles), namely, AOE_Baotou, Beijing, Xuzhou-CUMT, and Ussuriysk.
2.6 PM measurements
There are thousands of air quality stations over China that can provide hourly PM measurements during both daytime and night-time. In addition, the measurements are free from the influences of clouds, making them a perfect complement to AERONET observations and satellite observations. Ground-based measurements of the PM mass concentration over the Chinese mainland were collected to evaluate the dust-affected areas and to further analyse the transport of the dust plume. Furthermore, the temporal variations in the PM concentrations at 14 typical stations were analysed in detail to examine the propagation of dust particles in different directions. Detailed information about these 14 air quality stations is given in Table 1.
Table 1The cities and locations of the 14 air quality stations to examine the propagation of dust particles.
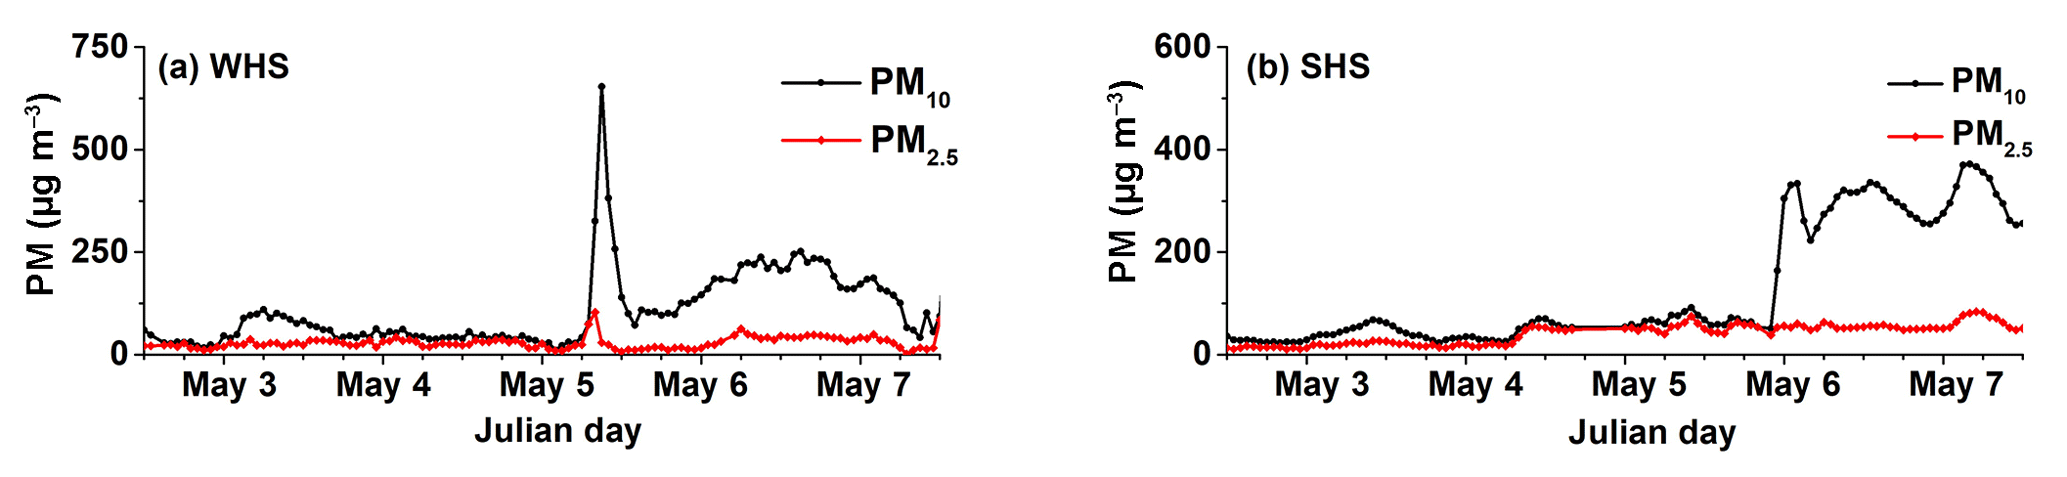
Figure 11Time series of the PM2.5 (red curves) and PM10 concentrations (black curves) during 2–7 May at (a) WHS and (b) SHS.
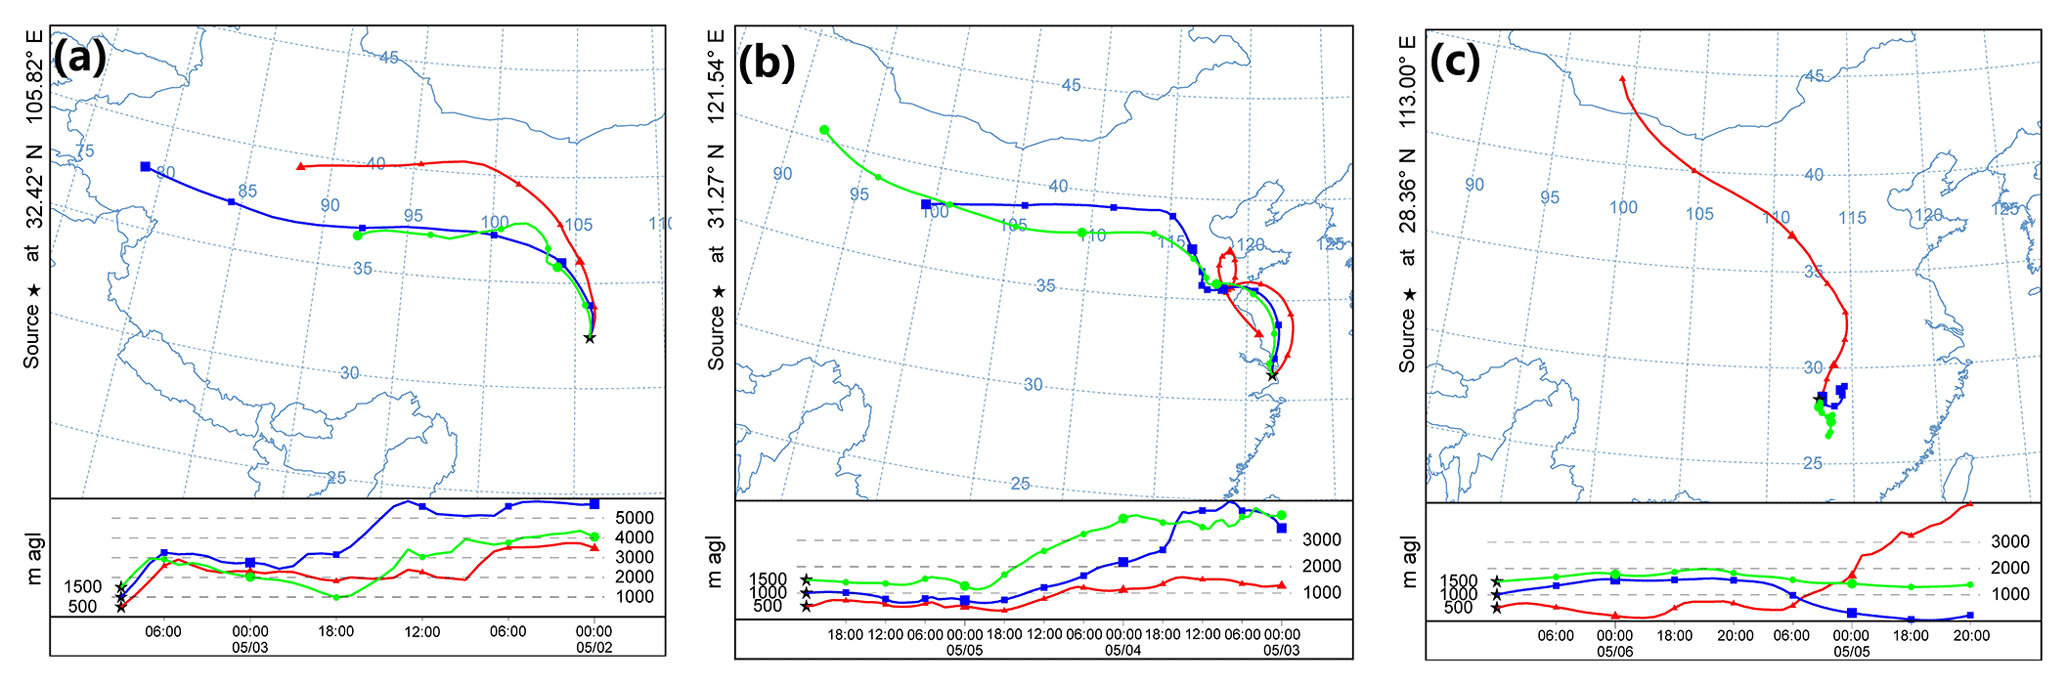
Figure 12Backward trajectories derived from the HYSPLIT model at different altitude levels (500, 1000, and 1500 m) at (a) GYS on 3 May, (b) SHS on 6 May, and (c) CSS on 6 May 2017.
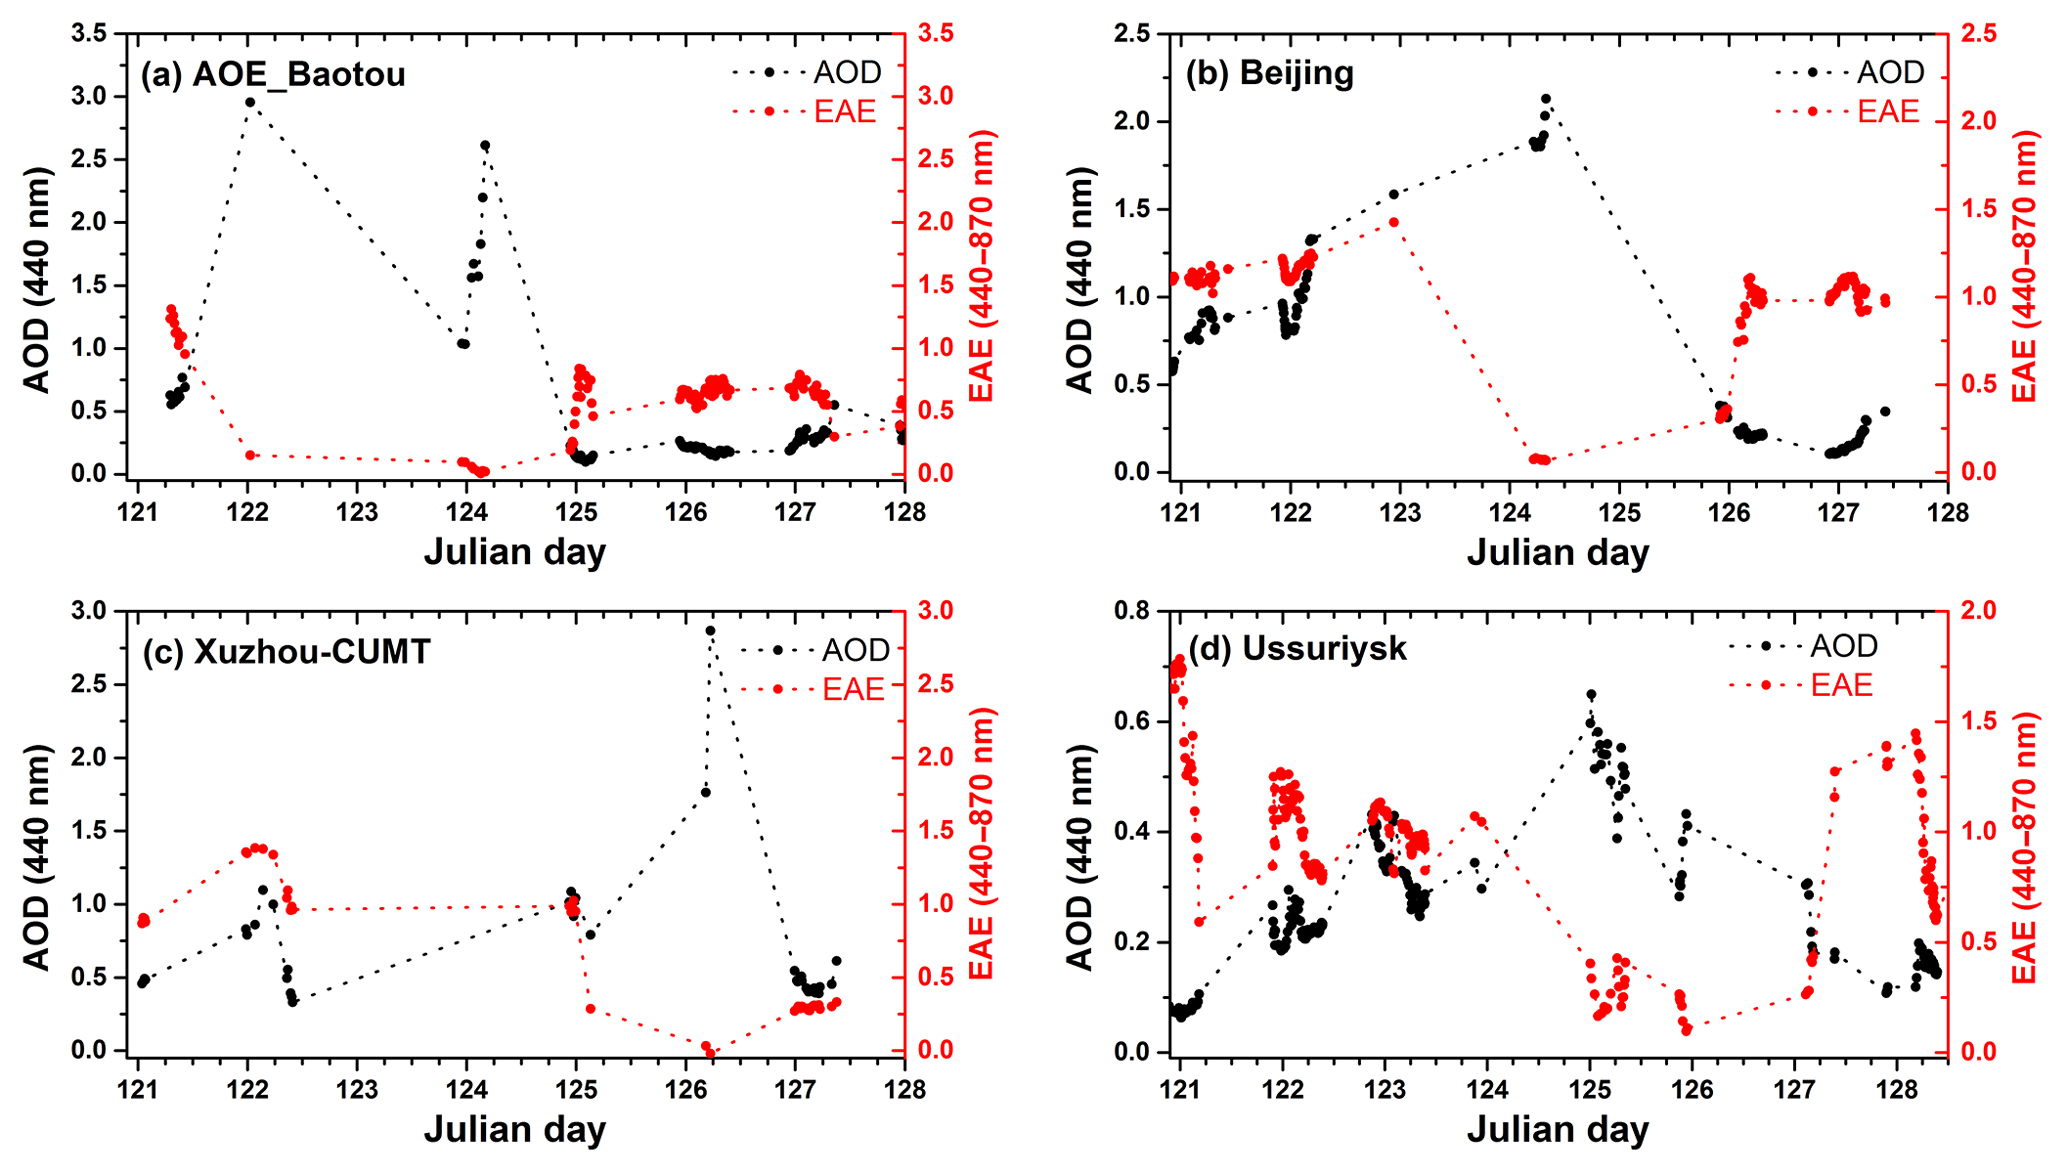
Figure 13Variations in the AOD (440 nm) and Ångström exponent (440–870 nm) at (a) AOE_Baotou, (b) Beijing, (c) Xuzhou-CUMT, and (d) Ussuriysk during 1–8 May 2017.
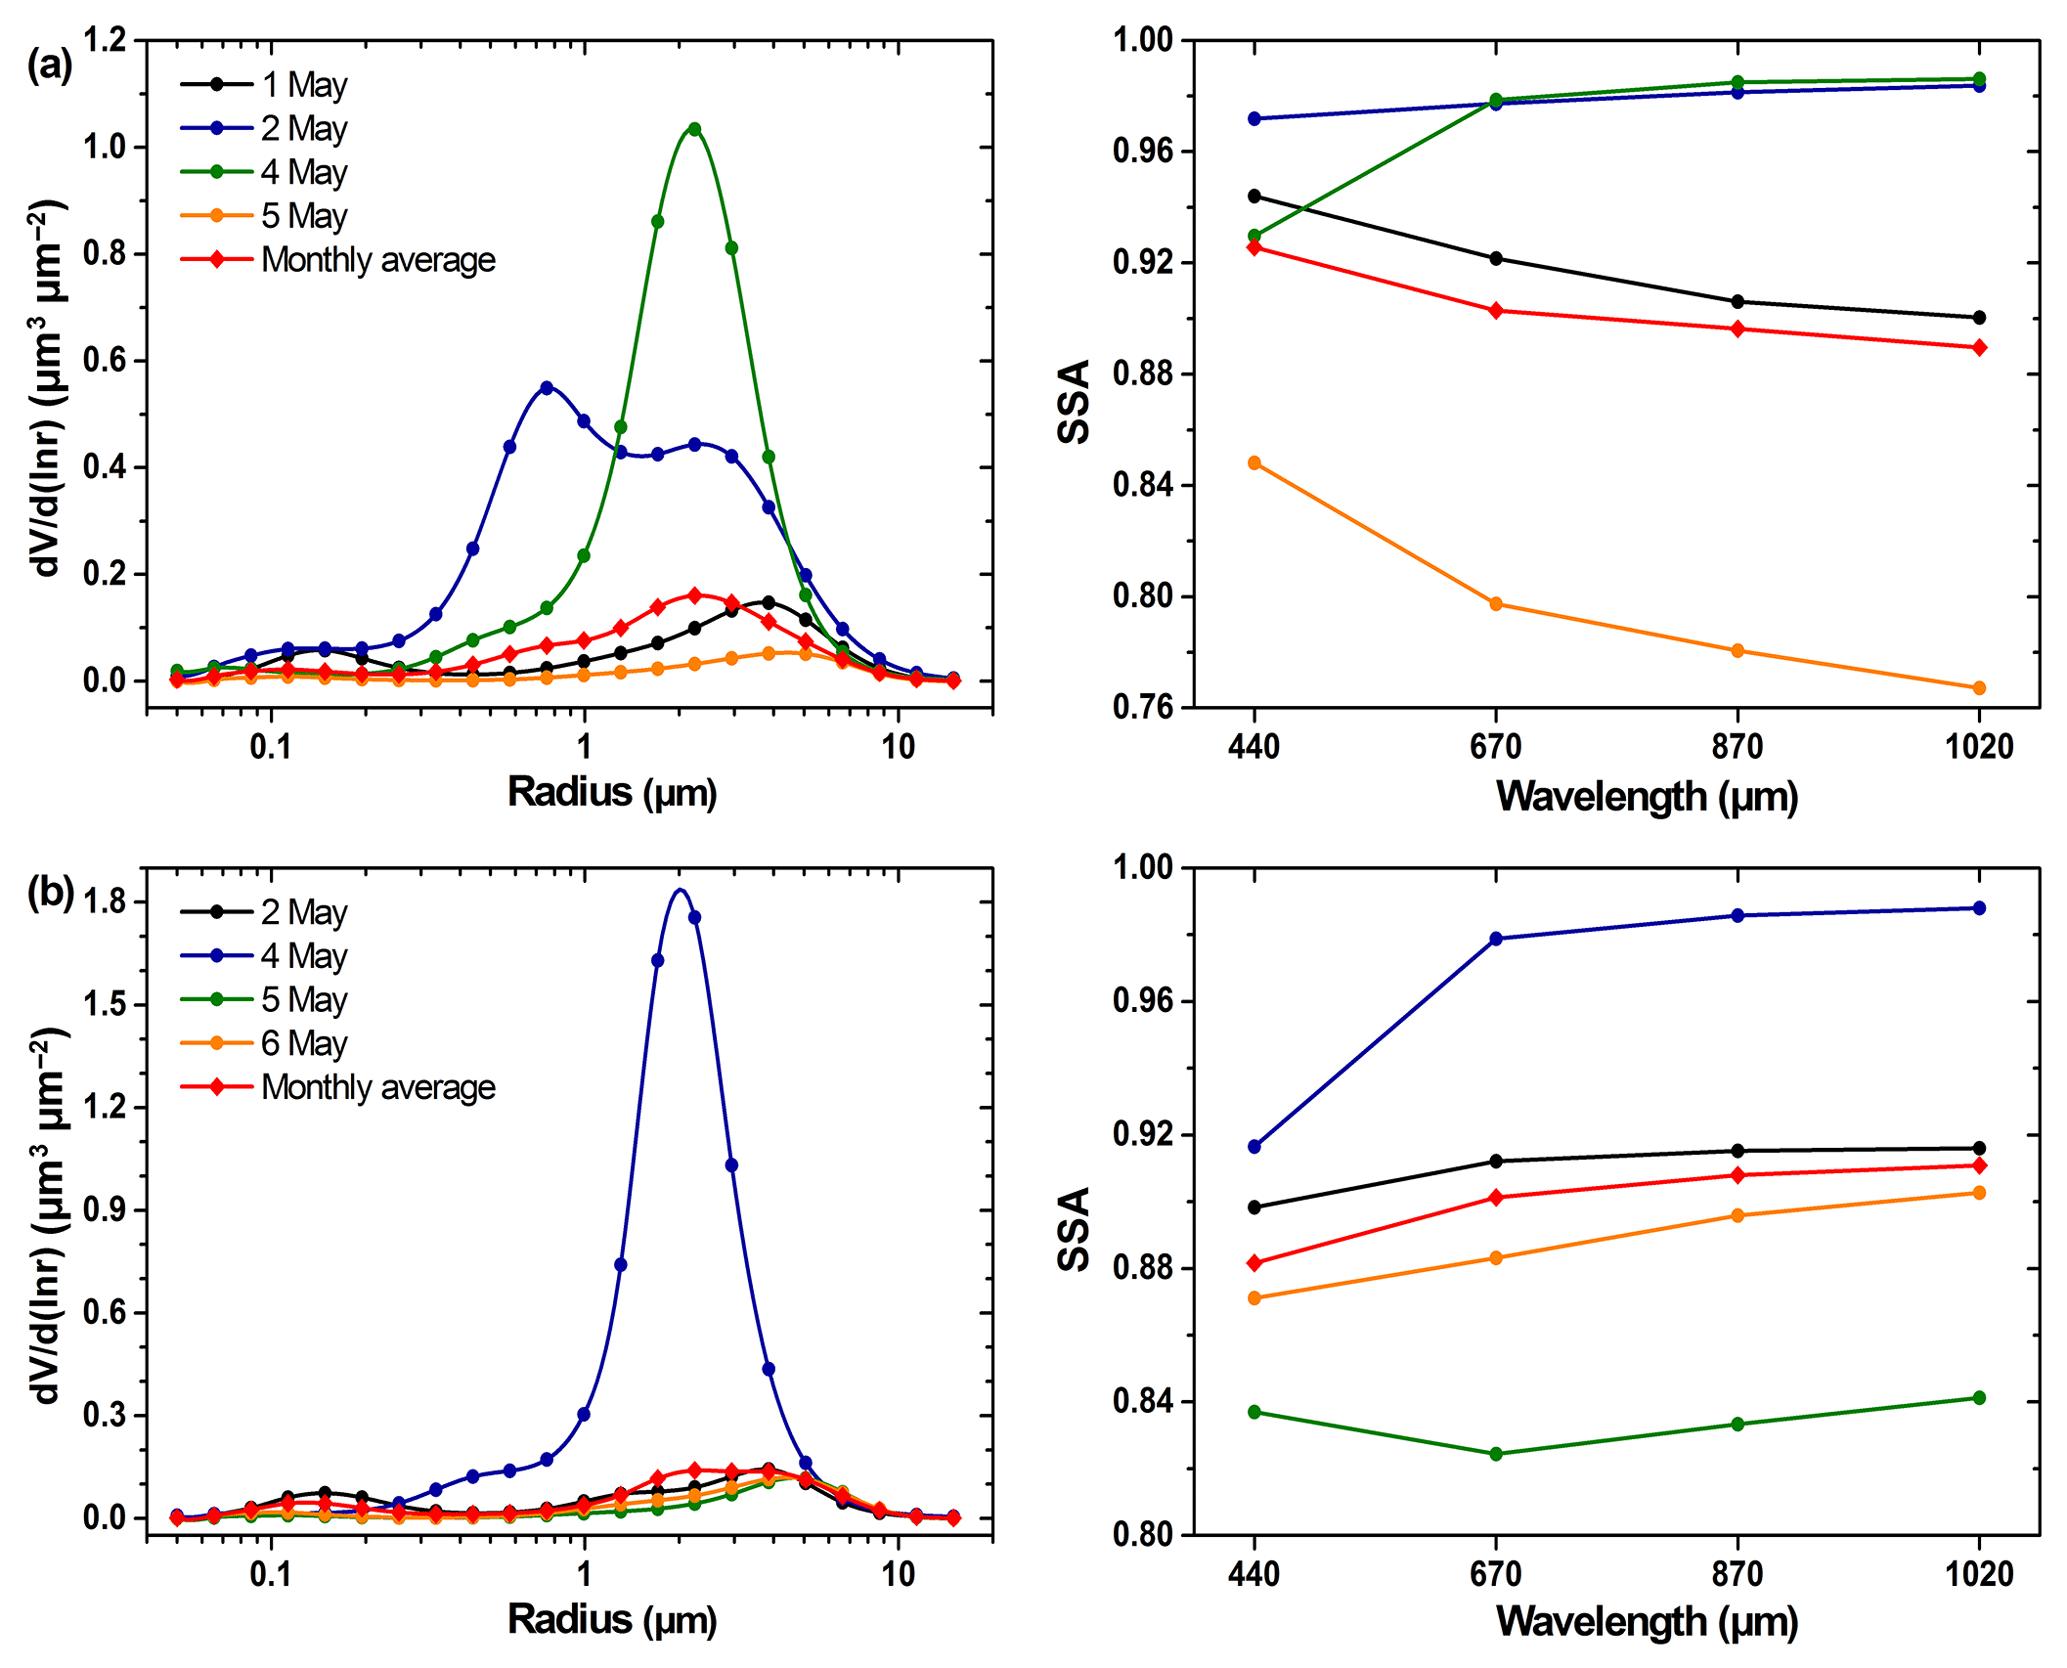
Figure 14Variations in the daily aerosol volume size distribution and spectral SSA during the dust event at (a) AOE_Baotou and (b) Beijing. Different colours represent different days, and the red curves represent the average VSD and SSA in May 2017. There was no VSD and SSA inversion product for Xuzhou-CUMT and Ussuriysk sites during 3–8 May 2017.
2.7 HYSPLIT trajectories and meteorological data
The HYSPLIT model developed by NOAA's Air Resources Laboratory was employed (https://www.arl.noaa.gov/hysplit/hysplit/, last access: 17 January 2018). It is widely used for computing air mass forward and backward trajectories to analyse the transport of air and pollution parcels. The start and end point as well as the time of the HYSPLIT computation can be customized. Here, HYSPLIT was used to generate air mass backward trajectories to trace the air movement. The data from Global Data Assimilation System (GDAS) with a spatial resolution of 0.5∘ were used as meteorology input. The backward trajectories ending at nine selected points were calculated for determining the dust source.
The meteorological data including wind vectors and geopotential height (GH) from the ECMWF ERA-Interim reanalysis dataset were also used (http://apps.ecmwf.int/datasets/data/interim-full-daily/levtype=pl/, last access: 17 January 2018). The distribution of the wind direction, wind speed, and GH with a spatial resolution of 1∘ during 3–8 May 2017 was analysed to understand the origin and transport of the dust storm.
3.1 Source and transport of the dust event
Figure 2 shows the spatial distribution of the UV-AI over East Asia from 3 to 8 May 2017 obtained from the OMI-Aura observations. High AI values (> 2.0) can be observed over northern China, especially over Inner Mongolia on 3 May, north-eastern China on 4–5 May, and south-eastern Russia on 5–6 May. The OMI-AI time series revealed one of the long-distance transport paths of the strong absorbing aerosols that originated from the Gobi Desert, i.e. moving towards the east and then north-east (hereafter referred to as the north-east direction for simplicity). This can be explained by the strong west and south-west wind evident in Fig. 3, which shows the spatial distribution of the wind vectors and geopotential height field at 500 hPa level at 06:00 UTC during 3–8 May. The dust storm initially developed over western Inner Mongolia (∼ 40∘ N, 100∘ E) on 3 May 2017 (see Fig. 2a) and then swept through the North China Plain and reached north-eastern China (∼ 50∘ N, 125∘ E) on 4 May 2017 due to a strong west wind (Figs. 2b and 3). On 5 May, the dust plume was transported to the western Sea of Okhotsk (∼ 56∘ N, 140∘ E). For the next 2 days, the elevated dust plume travelled across the Sea of Okhotsk and finally reached the Bering Sea (see Fig. 2e and f). Furthermore, there is a small portion of the high AI values in the Sea of Japan on 7 May (Fig. 2e), indicating that there is a second dust transport path all the way to the east, and the Korean Peninsula and Japan were affected. This is because the wind field diverged into two directions at the North China Plain, i.e. towards north-east and towards east (Fig. 3).
To confirm that the high AI values were caused by dust aerosols, CALIPSO observations that passed through the high AI value regions during the night-time were employed to provide aerosol type and vertical distribution information. Figure 4 depicts the vertical distributions of the aerosol types for six overpass trajectories shown in Fig. 2 (the deep blue lines). The dust aerosol (subtype 2 and in yellow) in Fig. 4 corresponded well to the high AI value region in Fig. 2. Furthermore, the dust layer was thick and was distributed from the surface to a height of 10 km. Moreover, part of the aerosol layer was marked as the polluted dust subtype (subtype 5 and in brown) over central China on 4 May and over northern China on 5 May. This may be explained by the mixture of dust and anthropogenic pollution.
Figure 5 shows the backward trajectories at six different sources (the six blue triangles in Fig. 2) during 5–8 May 2017. The trajectories are computed at three different altitudes (1000, 2000, and 3000 m). The HYSPLIT backward trajectory analysis revealed that the air masses that reached the Bering Sea (Fig. 5a), the Kamchatka Peninsula (Fig. 5b), the Sea of Okhotsk (Fig. 5c), and the Sea of Japan (Fig. 5d) originated from the Gobi Desert. This result is consistent with that from the OMI-AI and CALIPSO aerosol type information.
For a better view of the dust plume transport, the high-temporal-resolution observations from the Himawari-8/AHI true-colour composite images on 3 May (Fig. 6) and 4 May (Fig. 7) are shown. The results in Fig. 6 suggest that the strong dust storm originated from the western part of the Gobi Desert and was formed by several distinct dust clusters (Fig. 6b). In the morning of 3 May, only a small area was covered by a dust plume in the Gobi Desert (Fig. 6a), as the dust storm continuously increased and quickly moved. Part of the dust plume over south-western Inner Mongolia moved along the edge of the Qinghai–Tibet Plateau and then finally reached the northern Sichuan Basin (Fig. 6c), revealing the third path of the dust transport. This path of the dust transport is not revealed in the OMI AI time series maps, possibly because the dust in this path is not very severe. On the other hand, a thick dust plume travelled along the China–Mongolia border with continually increasing dust intensity and moved quickly towards the north-east and east. In addition, in the late afternoon of 4 May 2017 (Fig. 7), another thick dust plume was found that originated from northern Inner Mongolia (Fig. 7c) that was quickly transported eastward due to strong westerly winds. High-frequency observations from the AHI presented more information about this severe dust storm, revealing multi-plume propagation and several different transport directions, including south-eastward, eastward, and north-eastward. The longest distance transport occurred in the north-eastward direction, as OMI-AI and CALIPSO-VFM illustrated in the previous section, and finally arrived at the Bering Sea.
3.2 PM characterization in China during the dust event
In this section, the temporal variations in the PM2.5 (PM < 2.5 µm in aerodynamic diameter) and PM10 mass concentrations over mainland China were analysed and the third path of the dust transport, i.e. towards south-east, is obvious. Figure 8 depicts the hourly PM10 concentration distribution over mainland China over a 12 h interval from 06:00 to 18:00 during 5–7 May (Beijing time) using a total of 1350 stations; the PM values are real-time measurements per hour. The PM concentration values less than 200 are shown in grey. Interestingly, south-eastward transport was revealed through the intensive PM concentration measurements, which was almost missed by most of the satellite observations because central and eastern China were covered by cloud during 5–7 May. The high PM10 concentration was mostly distributed over 35–40∘ N at 06:00 on 5 May (Fig. 8a). After 12 h, the dust plume moved to the Shandong Peninsula (eastern China close to the Yellow Sea) and further affected central China on 6 May (Fig. 8c and d). On 7 May the dust events were found in most stations of eastern and central China (Fig. 8e and f). The southward propagation of the dust plume caused a high PM10 concentration (> 500) in south-central China (∼ 28∘ N, 118∘ E) as well as the eastern coastal areas including the Shandong Peninsula (eastern China close to the Yellow Sea) and the Yangtze River Delta.
To obtain better insight into the dust evolution, measurements from 14 typical air quality stations (the colour circles in Fig. 9) situated within the source and transport areas of the dust were analysed in detail. As the PM concentration was measured during both the daytime and night-time, the data can provide much more information about this continuous dust plume. Figure 10 shows the PM temporal variations along three different dust transport directions during 2–7 May, including the north-eastward propagation (a), southward propagation (b), and south-eastward propagation (c). It is clearly observed that both the PM2.5 and the PM10 increased dramatically, and the PM10 showed much larger increments than the PM2.5 during this dust event from all three figures.
As Fig. 10a illustrates, the sharp increase in the PM mass concentration was first observed at BYN station on the morning of 3 May, followed by the CDS (23:00 UTC on 3 May) and TLS (08:00 UTC on 4 May), and reached the north-easternmost city, namely, Heihe (HHS) (06:00 UTC on 4 May). The maximum value of PM10 concentration at BYN reached 4333 µg m−3 on 4 May. High PM10 concentrations occurred successively at those sites. These drastic changes in the PM10 are in agreement with the dust movements revealed from the satellite observations.
PM measurements at four stations distributed along the eastern edge of the Qinghai–Tibet Plateau, including JCS, ZWS, TSS, and GYS, are shown in Fig. 10b. Within 1 day, the dust plume was transported across Gansu and reached GYS, which is located in the Sichuan Basin. This transport was also revealed by the high-frequency AHI observations (Fig. 6c), although it is not as noticeable.
Figure 10c displays the PM concentration variations over the cities located in central China, including Taiyuan (TYS), Zhengzhou (ZZS), and Changsha (CSS). In addition, high PM concentrations were observed in the coastal areas of eastern China, as shown in Fig. 11. Note that the increases of PM10 are much larger than the increments of PM2.5 in these stations, suggesting that the dust particles were transported to southern and eastern China.
To confirm this southward propagation of dust, the backward trajectories ending at GYS, CSS, and SHS were analysed by HYSPLIT, as shown in Fig. 12. The trajectories are computed at three different altitudes (500, 1000, and 1500 m). The north-western air masses at all three locations originated from sources in the Gobi Desert. Thus, dust could be the main reason for the sudden increase in the PM concentrations.
3.3 Aerosol property variations during the dust event
In order to understand the effects of dust storm on aerosol properties, the changes in the aerosol properties at four typical AERONET stations located in the study area were investigated. The longitudes of AOE_Baotou, Beijing, and Ussuriysk increase from west to east, and the latitudes of AOE_Baotou, Beijing, and Xuzhou-CUMT decrease from north to south (Fig. 1). Several key aerosol properties, including the AOD, EAE, SSA, and aerosol VSD, were analysed in detail.
The temporal variations in the daily AOD (440 nm) and EAE (440–870 nm) at the four AERONET sites during dusty and non-dusty days are plotted in Fig. 13. The maximum AODs at 440 nm caused by the dust storm were 2.96, 2.13, 2.87, and 0.65 at AOE_Baotou, Beijing, Xuzhou-CUMT, and Ussuriysk, respectively. The maximum AOD at Baotou (the westernmost station) was recorded on 2 May 2017 and became lower afterwards. Then, the dust storm moved eastward, and the highest AOD value of 2.13 was observed over Beijing on 4 May 2017. As the dust storm travelled north-eastward, Ussuriysk, located in southern Russia, was affected with a slight increase in the AOD (from ∼ 0.25 to ∼ 0.65) and a sharp decrease in the EAE (from ∼ 1 to ∼ 0.1) on 5 May 2017. Xuzhou-CUMT, which is located in south-central China, was also severely affected by the strong dust on 4–5 May. The maximum AODs occurred at different times at the four sites due to the movement of the dust storm. In addition, there are obvious negative correlations between the AOD and EAE during the dust event. The dust storm brought numerous large particles, causing the low EAE and high extinction properties.
The SSA is strongly related to absorption and scattering characteristics. Figure 14 shows the variability of the spectral SSA before, during, and after this dust event, and the monthly average as a benchmark. The SSA at longer wavelengths (e.g. 675, 870, and 1020 nm) at AOE_Baotou varied from ∼ 0.8 to ∼ 0.9 during non-dusty days (1 May), and was very similar to the SSA monthly average over May 2017. In contrast, the SSA675 nm increased to 0.97–0.98 during dust days (2 and 4 May). In addition, the spectral behaviour of the SSA showed significant differences. The SSA increased with wavelength on 2 May and 4 May. Especially on 4 May, the SSA largely increased from 440 to 675 nm (from 0.93 to 0.98), and the dSSA (dSSA = SSA870 nm−SSA440 nm) also increased to 0.07. According to Dubovik et al. (2002), mineral dust aerosols tend toward a dSSA value greater than 0.05. In contrast, the monthly average of the spectral SSA as well as the spectral SSA during non-dusty days obviously decreased with the increase in wavelength. The high SSA and increasing spectral behaviour indicate that aerosol particles are dominated by large particles with strong scattering.
Similar properties can be observed over Beijing, as the dusts over both Baotou and Beijing have similar sources. However, there are still a few differences. The monthly average of the spectral SSA in Beijing was lower than that in AOE_Baotou, and an opposite spectral dependence was observed between these two sites. Baotou was affected by a greater quantity of industry emissions than Beijing, as it is a heavy industry city.
The VSD variation showed a more obvious distinction between dusty and non-dusty days. As Fig. 14 illustrates, the particle volumes of fine-mode aerosols are comparable with those of coarse-mode aerosols in Beijing and Baotou during non-dusty days. The strong dust storm caused a dramatic increase in coarse-mode particles. The volume median radius also showed differences between dusty and non-dusty days. The VSD peaks occurred at radii of ∼ 2 µm, with peak values of 1.05 and 1.8 on 4 May at Baotou and Beijing, respectively. Meanwhile, no significant variation was observed for fine-mode particles. It is observed that the volumes of both fine- and coarse-mode particles were large at AOE_Baotou on 2 May due to the combination of fine-mode aerosols with dust particles. This also explains the spectral SSA behaviour on that day.
In this study, we described a strong dust storm that occurred in northern China and Mongolia in early May 2017. The source and transport were investigated using multi-satellite data (including OMI, CALIPSO, and AHI), ground-based measurements (including PM measurements and AERONET observations), and HYSPLIT model computations. Benefiting from the high frequency of geostationary satellite observations, the rapid spatial–temporal variations in the dust plume were captured, including the continuous dust storms originating from the Gobi Desert region and different transport directions. The OMI-AI and CALIPSO observations during the night-time provided more comprehensive information with larger coverage for the large-scale transport and vertical distribution of the dust plume. Intensive measurements (in both time and space) of the PM mass concentration revealed additional details when the region was covered by thick clouds and CALIPSO covered limited observation areas. The backward trajectories computed from the HYSPLIT model also confirmed the dust transport directions. From the combined observations, this severe dust storm was found to originate from the Gobi Desert, and travel to three different directions affecting large areas of China, including northern China, south-east China, and even central China. In addition, southern and eastern Russia and the Bering Sea were influenced by the long-distance transport of the strong dust plume. The aerosol properties (EAE, SSA, and VSD) changed greatly during the dusty days as numerous large particles contributed to strong scattering and extinction. Overall, the combined observations of satellite and ground-based data contributed to the comprehensive monitoring of the source and long-distance transport of the dust storms, providing complete information on the spatial–temporal distribution.
All data are publicly accessible via the URLs given in the text.
LS undertook the work and wrote the manuscript under the supervision of YX, JG was involved with writing of the paper and analysis of the data, and YC, CF, YL, and YX helped with data collection and analysis.
The authors declare that they have no conflict of interest.
This work was supported in part by the China–Arab Countries (Oman)
Water-saving Equipment Technology Transfer Industrialization Supporting
Technology Research and Development under grant no. 2017001. We gratefully
acknowledge the support from the National Natural Science Foundation of China
(NSFC) under grant nos. 41590853, 41471306, and 41871260, the Ministry of
Science and Technology (MOST) of China under grant no. 2016YFC0200500, and
the Open Fund of State Key Laboratory of Remote Sensing Science (grant
no. OFSLRSS201703). The OMI and CALIOP data were obtained from NASA. The AHI
data were supplied by the P-Tree System, Japan Aerospace Exploration Agency
(JAXA) (http://www.eorc.jaxa.jp/ptree/terms.html, last access:
17 January 2018). The PM data used in this work were acquired from the China
Meteorological Administration. Many thanks are due to the principal
investigators of the AERONET sites used in this paper for maintaining their
sites and making their data publicly available. We would also like to thank
the anonymous reviewers for their valuable comments, which greatly improved
the quality of this paper.
Edited by:
Vassiliki Kotroni
Reviewed by: four anonymous referees
Alam, K., Trautmann, T., Blaschke, T., and Subhan, F.: Changes in aerosol optical properties due to dust storms in the Middle East and Southwest Asia, Remote Sens. Environ., 143, 216–227, https://doi.org/10.1016/j.rse.2013.12.021, 2014.
Athanasopoulou, E., Protonotariou, A., Papangelis, G., Tombrou, M., Mihalopoulos, N., and Gerasopoulos, E.: Long-range transport of Saharan dust and chemical transformations over the Eastern Mediterranean, Atmos. Environ., 140, 592–604, https://doi.org/10.1016/j.atmosenv.2016.06.041, 2016.
Badarinath, K. V. S., Kharol, S. K., Kaskaoutis, D. G., Sharma, A. R., Ramaswamy, V., and Kambezidis, H. D.: Long-range transport of dust aerosols over the Arabian Sea and Indian region – A case study using satellite data and ground-based measurements, Global Planet. Change, 72, 164–181, https://doi.org/10.1016/j.gloplacha.2010.02.003, 2010.
Bangert, M., Nenes, A., Vogel, B., Vogel, H., Barahona, D., Karydis, V. A., Kumar, P., Kottmeier, C., and Blahak, U.: Saharan dust event impacts on cloud formation and radiation over Western Europe, Atmos. Chem. Phys., 12, 4045–4063, https://doi.org/10.5194/acp-12-4045-2012, 2012.
Basha, G., Phanikumar, D. V., Kumar, K. N., Ouarda, T. B. M. J., and Marpu, P. R.: Investigation of aerosol optical, physical, and radiative characteristics of a severe dust storm observed over UAE, Remote Sens. Environ., 169, 404–417, https://doi.org/10.1016/j.rse.2015.08.033, 2015.
Chen, Y., Luo, B., and Xie, S.-D.: Characteristics of the long-range transport dust events in Chengdu, Southwest China, Atmos. Environ., 122, 713–722, https://doi.org/10.1016/j.atmosenv.2015.10.045, 2015.
Creamean, J. M. and Prather, K. A.: Dust and Biological Aerosols from the Sahara and Asia Influence Precipitation in the Western U.S, Science, 339, 1572–1578, 2013.
Dall'Osto, M., Harrison, R. M., Highwood, E. J., O'Dowd, C., Ceburnis, D., Querol, X., and Achterberg, E. P.: Variation of the mixing state of Saharan dust particles with atmospheric transport, Atmos. Environ., 44, 3135–3146, 2010.
Dubovik, O., Sinyuk, A., Lapyonok, T., Holben, B. N., Mishchenko, M., Yang, P., Eck, T. F., Volten, H., Muñoz, O., Veihelmann, B., van der Zande, W. J., Leon, J.-F., Sorokin, M., and Slutsker, I.: Application of spheroid models to account for aerosol particle nonsphericity in remote sensing of desert dust, J. Geophys. Res., 111, D11208, https://doi.org/10.1029/2005jd006619, 2006.
Eck, T. F., Holben, B. N., Ward, D. E., Dubovik, O., Reid, J. S., Smirnov, A., Mukelabai, M. M., Hsu, N. C., O'Neill, N. T., and Slutsker, I.: Characterization of the optical properties of biomass burning aerosols in Zambia during the 1997 ZIBBEE field campaign, J. Geophys. Res.-Atmos., 106, 3425–3448, https://doi.org/10.1029/2000jd900555, 2001.
Fairlie, T. D., Jacob, D. J., and Park, R. J.: The impact of transpacific transport of mineral dust in the United States, Atmos. Environ., 41, 1251–1266, 2007.
Ginoux, P., Prospero, J. M., Torres, O., and Chin, M.: Long-term simulation of global dust distribution with the GOCART model: correlation with North Atlantic Oscillation, Environmental Model. Soft., 19, 113–128, 2004.
Goudie, A. S.: Dust storms: recent developments, J. Environ. Manage., 90, 89–94, 2009.
Guo, J., Lou, M., Miao, Y., Wang, Y., Zeng, Z., Liu, H., He, J., Xu, H., Wang, F., Min, M., and Zhai, P.: Trans-Pacific transport of dust aerosols from East Asia: Insights gained from multiple observations and modeling, Environ. Pollut., 230, 1030–1039, https://doi.org/10.1016/j.envpol.2017.07.062, 2017.
Holben, B. N., Eck, T. F., Slutsker, I., Tanre, D., Buis, J. P., Setzer, A., Vermote, E., Reagan, J. A., Kaufman, Y. J., Nakajima, T., Lavenu, F., Jankowiak, I., and Smirnov, A.: AERONET – A federated instrument network and data archive for aerosol characterization, Remote Sens. Environ., 66, 1–16, https://doi.org/10.1016/s0034-4257(98)00031-5, 1998.
Huang, J., Patrick, M., Chen, B., Huang, Z., Liu, Z., Zhao, Q., Yi, Y., and Kirk, A. J.: Long-range transport and vertical structure of Asian dust from CALIPSO and surface measurements during PACDEX, J. Geophys. Res.-Atmos., 113, D23212, https://doi.org/10.1029/2008JD010620, 2008.
Lee, Y. C., Yang, X., and Wenig, M.: Transport of dusts from East Asian and non-East Asian sources to Hong Kong during dust storm related events 1996–2007, Atmos. Environ., 44, 3728–3738, https://doi.org/10.1016/j.atmosenv.2010.03.034, 2010.
Liu, Z., Vaughan, M., Winker, D., Kittaka, C., Getzewich, B., Kuehn, R., Omar, A., Powell, K., Trepte, C., and Hostetler, C.: The CALIPSO Lidar Cloud and Aerosol Discrimination: Version 2 Algorithm and Initial Assessment of Performance, J. Atmos. Ocean. Tech., 26, 1198–1213, 2009.
Mikami, M., Shi, G. Y., Uno, I., Yabuki, S., Iwasaka, Y., Yasui, M., Aoki, T., Tanaka, T. Y., Kurosaki, Y., Masuda, K., Uchiyama, A., Matsuki, A., Sakai, T., Takemi, T., Nakawo, M., Seino, N., Ishizuka, M., Satake, S., Fujita, K., Hara, Y., Kai, K., Kanayama, S., Hayashi, M., Du, M., Kanai, Y., Yamada, Y., Zhang, X. Y., Shen, Z., Zhou, H., Abe, O., Nagai, T., Tsutsumi, Y., Chiba, M., and Suzuki, J.: Aeolian dust experiment on climate impact: An overview of Japan–China joint project ADEC, Global Planet. Change, 52, 142–172, https://doi.org/10.1016/j.gloplacha.2006.03.001, 2006.
Omar, A. H., Winker, D. M., Vaughan, M. A., Hu, Y., Trepte, C. R., Ferrare, R. A., Lee, K.-P., Hostetler, C. A., Kittaka, C., Rogers, R. R., Kuehn, R. E., and Liu, Z.: The CALIPSO Automated Aerosol Classification and Lidar Ratio Selection Algorithm, J. Atmos. Ocean. Tech., 26, 1994–2014, https://doi.org/10.1175/2009jtecha1231.1, 2009.
Omar, A. H., Winker, D. M., Tackett, J. L., Giles, D. M., Kar, J., Liu, Z., Vaughan, M. A., Powell, K. A., and Trepte, C. R.: CALIOP and AERONET aerosol optical depth comparisons: One size fits none, J. Geophys. Res.-Atmos., 118, 4748–4766, https://doi.org/10.1002/jgrd.50330, 2013.
Rodríguez, S., Alastuey, A., and Querol, X.: A review of methods for long term in situ characterization of aerosol dust, Aeolian Res., 6, 55–74, https://doi.org/10.1016/j.aeolia.2012.07.004, 2012.
Rosenfeld, D., Rudich, Y., and Lahav, R.: Desert Dust Suppressing Precipitation: A Possible Desertification Feedback Loop, P. Natl. Acad. Sci. USA, 98, 5975–5980, 2001.
Shao, Y., Wyrwoll, K.-H., Chappell, A., Huang, J., Lin, Z., McTainsh, G. H., Mikami, M., Tanaka, T. Y., Wang, X., and Yoon, S.: Dust cycle: An emerging core theme in Earth system science, Aeolian Res., 2, 181–204, https://doi.org/10.1016/j.aeolia.2011.02.001, 2011.
Srivastava, A. K., Soni, V. K., Singh, S., Kanawade, V. P., Singh, N., Tiwari, S., and Attri, S. D.: An early South Asian dust storm during March 2012 and its impacts on Indian Himalayan foothills: a case study, Sci. Total Environ., 493, 526–534, https://doi.org/10.1016/j.scitotenv.2014.06.024, 2014.
Tan, S.-C., Shi, G.-Y., and Wang, H.: Long-range transport of spring dust storms in Inner Mongolia and impact on the China seas, Atmos. Environ., 46, 299–308, https://doi.org/10.1016/j.atmosenv.2011.09.058, 2012.
Tegen, I.: Modeling the mineral dust aerosol cycle in the climate system, Quaternary Sci. Rev., 22, 1821–1834, 2003.
Teixeira, J. C., Carvalho, A. C., Tuccella, P., Curci, G., and Rocha, A.: WRF-chem sensitivity to vertical resolution during a saharan dust event, Phys. Chem. Earth, 94, 188–195, https://doi.org/10.1016/j.pce.2015.04.002, 2016.
Torres, O., Tanskanen, A., Veihelmann, B., Ahn, C., Braak, R., Bhartia, P. K., Veefkind, P., and Levelt, P.: Aerosols and surface UV products from Ozone Monitoring Instrument observations: An overview, J. Geophys. Res., 112, D24S47, https://doi.org/10.1029/2007jd008809, 2007.
Wang, H., Zhang, L., Cao, X., Zhang, Z., and Liang, J.: A-Train satellite measurements of dust aerosol distributions over northern China, J. Quant. Spectrosc. Ra., 122, 170–179, https://doi.org/10.1016/j.jqsrt.2012.08.011, 2013.
Winker, D. M., Hunt, W. H., and Mcgill, M. J.: Initial performance assessment of CALIOP, Geophys. Res. Lett., 34, 228–262, 2007.
Wu, Y., Cordero, L., Gross, B., Moshary, F., and Ahmed, S.: Assessment of CALIPSO attenuated backscatter and aerosol retrievals with a combined ground-based multi-wavelength lidar and sunphotometer measurement, Atmos. Environ., 84, 44–53, 2014.
Zhu, A., Ramanathan, V., Li, F., and Kim, D.: Dust plumes over the Pacific, Indian, and Atlantic oceans: Climatology and radiative impact, J. Geophys. Res.-Atmos., 112, D16208, https://doi.org/10.1029/2007JD008427, 2007.