the Creative Commons Attribution 4.0 License.
the Creative Commons Attribution 4.0 License.
 | 07 Nov 2018
The role of synoptic processes in mudflow formation in the piedmont areas of Uzbekistan
Simon Wild
Michael A. Walz
Gregor C. Leckebusch
The purpose of this study is to understand atmospheric factors, which cause mudflow variability on interannual and longer timescales, from local to synoptic scales. In a first step, historical data of mudflow occurrences in Uzbekistan provided by the Centre of Hydrometeorological Service of the Republic of Uzbekistan (Uzhydromet) for more than 140 years were analysed. During the investigation period a total of about 3000 mudflow events were observed with about 21 events per year on average. The majority of mudflows occur during the advection of westerly airflow when moist air from central and southern Europe reaches Uzbekistan. This synoptic weather type (SWT) can be related to one of the 15 primary synoptic circulation types over central Asia (CA) and Uzbekistan, which were subjectively derived by Bugayev and Giorgio in the 1930s and 1940s. To understand the main atmospheric regimes steering the variability in mudflow occurrences, we additionally applied an objective classification following the circulation weather type (CWT) approach. By means of the CWT approach, we found that on mudflow days the frequencies of cyclonic (C), westerly (W), south-westerly (SW) and north-westerly (NW) stream flows are increased in comparison to the climatological frequency of the occurrence of these circulation weather patterns. Results confirm that CWT westerly airflow initiates relatively more mudflow events comparing to other CWTs in the study area. An integrated approach of the CWT classification and an antecedent daily rainfall model are combined together in logistic regression analysis to construct a mudflow-triggering precipitation threshold for every CWT class. In general W, SW and C weather types require less antecedent rainfall to trigger mudflow occurrences in the study area. This technique is thus shown to be applicable to coarse-resolution climate model diagnostics.
- Article
(5873 KB) - Full-text XML
- BibTeX
- EndNote


Mudflows are amongst the most damaging and deadly natural hazards in Uzbekistan. Data from the Centre of Hydrometeorological Service of the Republic of Uzbekistan (Uzhydromet) suggest that mudflows were responsible for over 38 deaths and damaged approximately 3000 households and 5000 ha of agricultural crops over the decade (2005–2014) in Uzbekistan (Table A1 in the Appendix). However, the incidence of damage may be much larger as these events commonly occur in mountainous areas, in incised valleys and in areas of otherwise low relief.
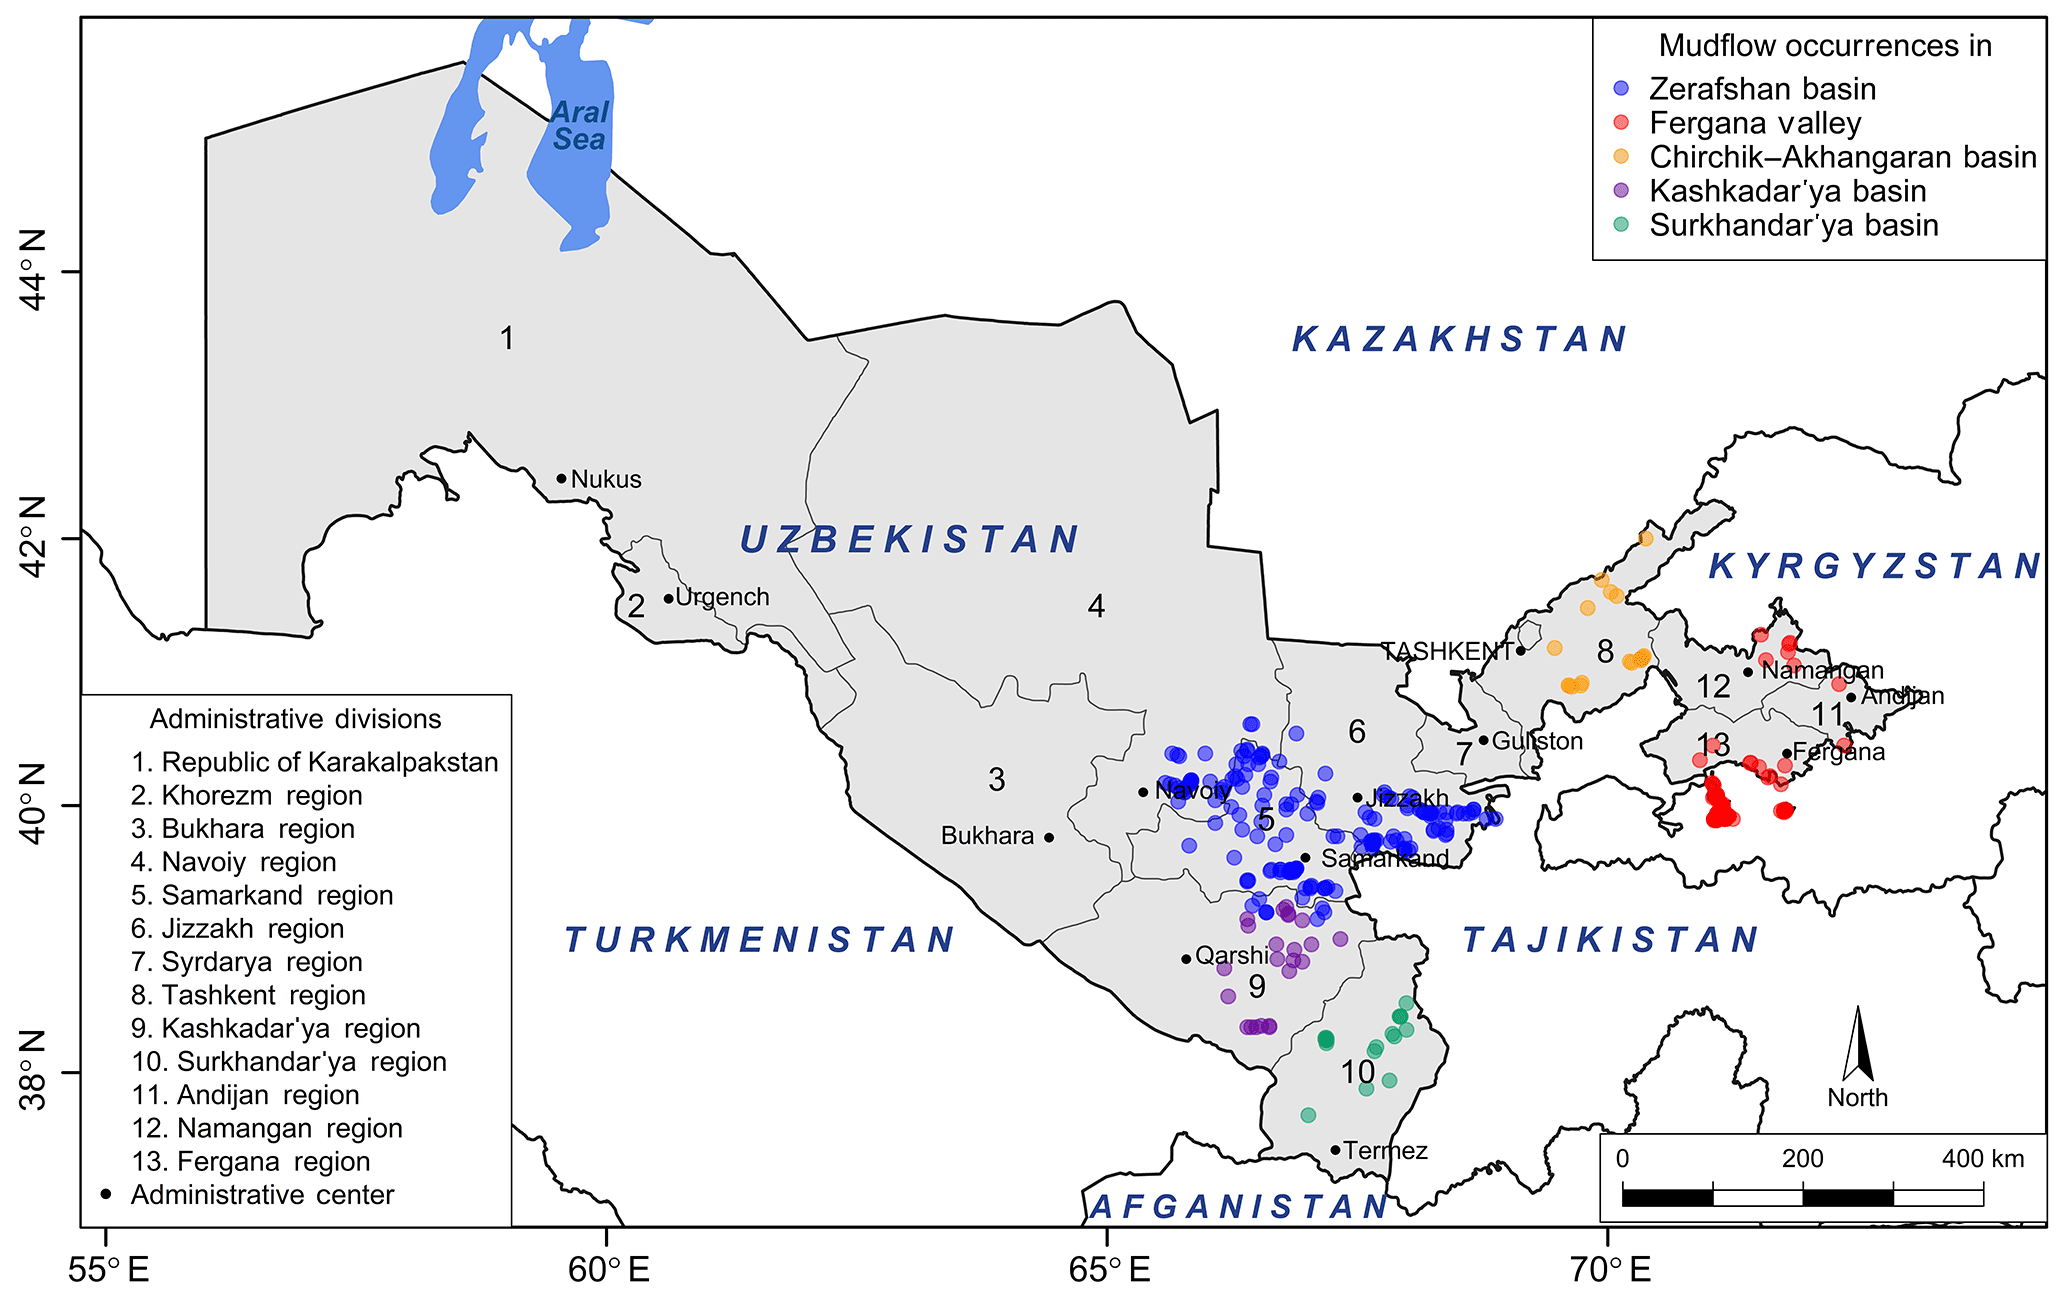
Figure 1Mudflow occurrences for the years 2005–2014 in areas with a high probability of mudflow passage in Uzbekistan include the following: Zerafshan basin (blue dots) in the central part of the country; Fergana Valley (red dots) in the east; Chirchik–Akhangaran basin (orange) in the north-east; Surkhandar'ya (green) and Kashkadar'ya (violet) river basins in the south of Uzbekistan. The map also represents political administrative divisions and administrative centres/cities of the country.
Hungr et al. (2014) suggest the term mudflow as a very rapid, sometimes extremely rapid, surging flow of saturated plastic soil in a steep channel involving significantly greater water content relative to the source material. In the river basins of Uzbekistan, mudflows generally occur during periods of intense rainfall or rapid snowmelt. The consistency of the mudflow is mainly water and mud (liquidity index >0.5; e.g. Hungr et al., 2001) with loose rock and other fragments, which flows down the hills and through the mountain streams. The destructive power of a mudflow can be greatly increased moving downhill due to the accumulation of water and rocky mud. It can destroy riverbeds and banks of rivers, floodplains and even low terraces above the floodplain and other objects in its path (Chub et al., 2007).
The period of historically documented mudflow events confirms that the areas with a high passage of mudflow occurrences in Uzbekistan can be divided into five regions: Fergana Valley, the Zerafshan basin included in Zerafshan Valley, and the Surkhandar'ya, Kashkadar'ya and Chirchik–Akhangaran river basins (Fig. 1). From a geological point of view, mountain ranges (western part of the Pamir–Alai mountain system and western Tien Shan) of the study area are mainly composed of Palaeozoic limestones, granites, schists, marbles, sandstones, conglomerates and partly igneous rocks (Petrov et al., 2017) as well as shale and loess deposits forming weak surfaces of the low-relief hillslopes, especially in Fergana Valley, that are frequently prone to sliding due to the interaction with water.
Precipitation is an important mudflow trigger (Huggel et al., 2012) in Uzbekistan; however, snow cover and glaciers in mountain regions (Petrov et al., 2017), slope instability and temperature (Huggel et al., 2010) are additional factors. Other main factors such as antecedent rainfall (Glade et al., 2000; Sidle and Ochiai, 2006) and rapid snowmelt (Kim et al., 2004) may further reduce the slope stability, thereby enhancing potential of mud and debris flow occurrences.
Rainfall records in high mountain regions are limited, reflecting the limited number of meteorological stations in Uzbekistan; thus there are gaps in the rainfall and mudflow data due to missing spatial and temporal information. Furthermore, orographic effects on precipitation may not be captured adequately by a single (or a few) rain gauge (Huggel et al., 2012). In the Alps, precipitation is generally observed in mid- to high-elevation areas (Buzzi et al., 1998; Huggel et al., 2012), similar to the mountain ranges (Tien Shan, Alai and Pamir) in central Asia (CA); however, mudflows usually occur in lower to intermediate elevations. Reviews on precipitation thresholds triggering landslides indicate the magnitude of an extreme event (Glade, 1998; Guzzetti et al., 2008) depends on the rainfall intensity and duration (Caine, 1980), the local climate and orographic precipitation (Buzzi et al., 1998; Gheusi and Davies, 2004), the geomorphologic structure of the area (Rosi et al., 2016), soil characteristics (Yamao et al., 2016), and land use (Sidle and Ochiai, 2006; Gravina et al., 2017).
Seasonal variations in precipitation and an earlier snowmelt are assumed to be the main factors for changes in the seasonality of mudflow occurrences in Uzbekistan. On this basis, the goals of this paper are
- a.
to assess the link between the potential effects of synoptic conditions and the occurrence of extreme hydro-meteorological mudflow episodes in Uzbekistan;
- b.
to establish an objective method for airflow classification of synoptic conditions that will be applicable to a large set of atmosphere–ocean general circulation model (AOGCM) and regional climate model (RCM) members to investigate key factors of climate change impact on precipitation over Uzbekistan and CA;
- c.
to compare and validate this with pre-existing subjective classification approaches;
- d.
to identify thresholds of mudflow triggers taking into account the antecedent precipitation;
- e.
and to validate the streamflow dependencies of these thresholds.
Section 2 describes available climatological data as well as the methodology of this paper. The main results presented in Sect. 3 focus on climatological and statistical characteristics of mudflow occurrences recorded for more than 140 years in Uzbekistan, thus making these data accessible for the international scientific community for the first time. As an analysis of mudflow conditions in Uzbekistan is widely missing in scientific peer-reviewed international literature, this paper starts with a respective overview of local observational data and peer-reviewed material from non-English literature. Further, we introduce a subjective method to classify synoptic conditions of CA and Uzbekistan as well as an objective approach known as circulation weather types (CWTs) to identify the major weather types leading to the formation of mudflows in the study area in Sect. 4. Precipitation thresholds triggering mudflow occurrences in Uzbekistan are quantified and discussed in Sect. 5. The main conclusions and discussion are summarized in Sect. 6.
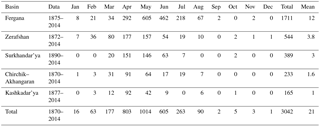
Table 1Monthly distribution of mudflow events in five regions in Uzbekistan.
The research approach consists of a five-step strategy, which is described in Fig. 2. The first component involves examining the historical data of mudflow occurrences in Uzbekistan and their characteristics on a longer timescale. Secondly, empirically developed local synoptic weather types (SWTs) are manually assigned to the observed mudflow occurrences. The objective CWT approach is therefore used to identify the atmospheric circulation and its relationship with the observed precipitation and their joint impact on mudflow occurrences in the study area. The fourth step is to evaluate the precipitation threshold triggering mudflow events in Uzbekistan using an empirical–statistical antecedent daily rainfall model (ADRM) (Glade et al., 2000). A detailed description of this approach as well as the datasets used for this component are given in the methods and Sect. 5 of this paper. Finally, the objective CWT method and the statistical ADRM are combined to estimate weather types which are most likely to trigger mudflow occurrences in the study area.
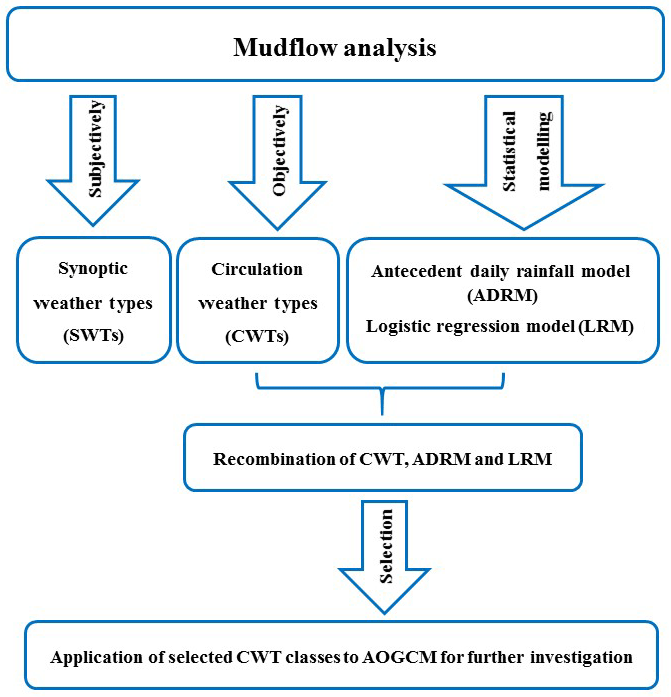
The desired outcome of this study is to eventually select representative weather types which can then be applied to AOGCM and RCM. That way the influence of precipitation patterns on mudflow occurrences can be studied under climate change scenarios across Uzbekistan and CA in further studies.
2.1 Data
The investigation is based upon two categories of datasets: ground observation and reanalysis. Observed daily meteorological variables recorded by Uzhydromet, such as precipitation and temperature from the four meteorological stations (Gallyaaral, So'x, Chimgan and Mingchukur) located in the mountains and the foothills with high mudflow passages were used to produce respective climatologies (Table 2).
In addition, historical data of Uzhydromet regarding mudflow occurrences in Uzbekistan over the period 1870–2014 were analysed. The national-scale mudflow database includes information such as the name of the water stream, location, date of passage, the potential reason for the formation of the mudflow, a rough estimate of the volume and major damages.
Data of the daily mean synoptic situation or local classification of synoptic weather types (SWTs), which are available at Library Services and the Archive Department of Uzhydromet as catalogues of six-hourly (00:00, 06:00, 12:00, 18:00 GMT) data manually derived from synoptic charts, were calculated to produce relative outputs regarding mudflow-inducing weather situations. The period considered in this study is the warm seasons (March–August) of 1984–2013.
In order to assess potential climatic drivers over Uzbekistan, daily mean lower atmospheric flow in 700 hPa geopotential height (GPH) fields by the European Centre for Medium-Range Weather Forecasts (ECMWF) ERA-Interim reanalysis (Dee et al., 2011), spanning the period of 1984–2013, was used to estimate large-scale atmospheric circulation. This gridded dataset has 0.75∘ spatial resolution.
2.2 Methods
2.2.1 Stations and mudflow event selection
We select the stations Gallyaaral (574 m a.s.l.) located in the Zerafshan basin, So'x (1200 m a.s.l.) in Fergana Valley, Chimgan (1620 m a.s.l.) in the Chirchik–Akhangaran basin and Mingchukur (2132 m a.s.l.) representing both the Kashkadar'ya and Surkhandar'ya basins (Fig. 9b, c, Table 2) in order to investigate regional and local characteristics of the rainfall over each basin with high mudflow passages and its adjustment areas. The investigation area is limited to rain gauges located in the mountain areas, based on the assumption that each station represents hydro-climatologic conditions of the basin well, and at the same time station data on the rainfall accumulation process can capture mudflows within the radius of roughly 100 km. Regional and local mudflow data were extracted from the national-scale database for the warm seasons (March–August) of 1984–2013 to evaluate the relationship between mudflows and synoptic- and large-scale meteorological patterns. There were more than 300 days with mudflow episodes during the investigation period. Each mudflow event was placed within five areas based on information regarding the geographical name of the evidence.
2.2.2 Synoptic weather types (SWTs)
Investigation of atmospheric circulation over CA first started in 1921 in the Turkestan synoptic-meteorological institute in Tashkent (Aksarin and Inagamova, 1993). The complexity and diversity of the regional atmospheric circulation was identified soon after Bugayev and Giorgio developed and simplified a model of airflow advection to explain synoptic differences in the 1930s and 1940s (Giorgio and Bugayev, 1936; Bugayev et al., 1957; Aksarin and Inagamova, 1993). The founders of the Central Asian Tashkent Institute of Weather Forecasters, Bugayev and Giorgio, had supervised research on synoptic meteorology and the impact of orographic factors on CA's climate for many years. In 1947 scientists published the first findings of the statistical characteristics of synoptic situations over the region for the cold period in the newsletters published by the USSR Academy of Science (Sarimsakov et al., 1947). After a decade, researchers summarized the studies on the atmospheric circulation classification scheme for CA and published it as a fundamental monograph, describing the main atmospheric patterns as 11 SWTs over CA (Bugayev et al., 1957). This monograph is still being used as the main literature and guidelines on synoptic conditions in CA countries mainly in Uzbekistan (Gavkhar Mamadjanova's personal experience, Aizen et al., 2004). Figure 3 provides a basic illustrative view of SWTs classified by Bugayev et al. (1957) emphasizing the air mass source regions and their path to CA. In the early 1960s, researchers at the Scientific Institute of Hydrometeorological Service of Uzbek SSR (known today as Uzbekistan) updated Bugayev and Giorgio's classification from 11 to 15 types by including additional weather classes. Subjectively classified weather types for all the years, except 2013–2014, over CA and Uzbekistan have been published as registers of the daily sequence of SWTs in Ilinova (1968), Voynova and Inagamova (1982), and Inagamova (1993, 2013). Table A2 provides comprehensive information for these 15 primary SWTs, describing weather conditions on a synoptic scale in CA and particularly in Uzbekistan. Figure 4 shows the long-term seasonal distribution (1935–2014) of SWTs within CA and Uzbekistan.
Table 2The main characteristics of the meteorological stations in Uzbekistan used in this study (source: Uzhydromet)
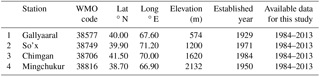
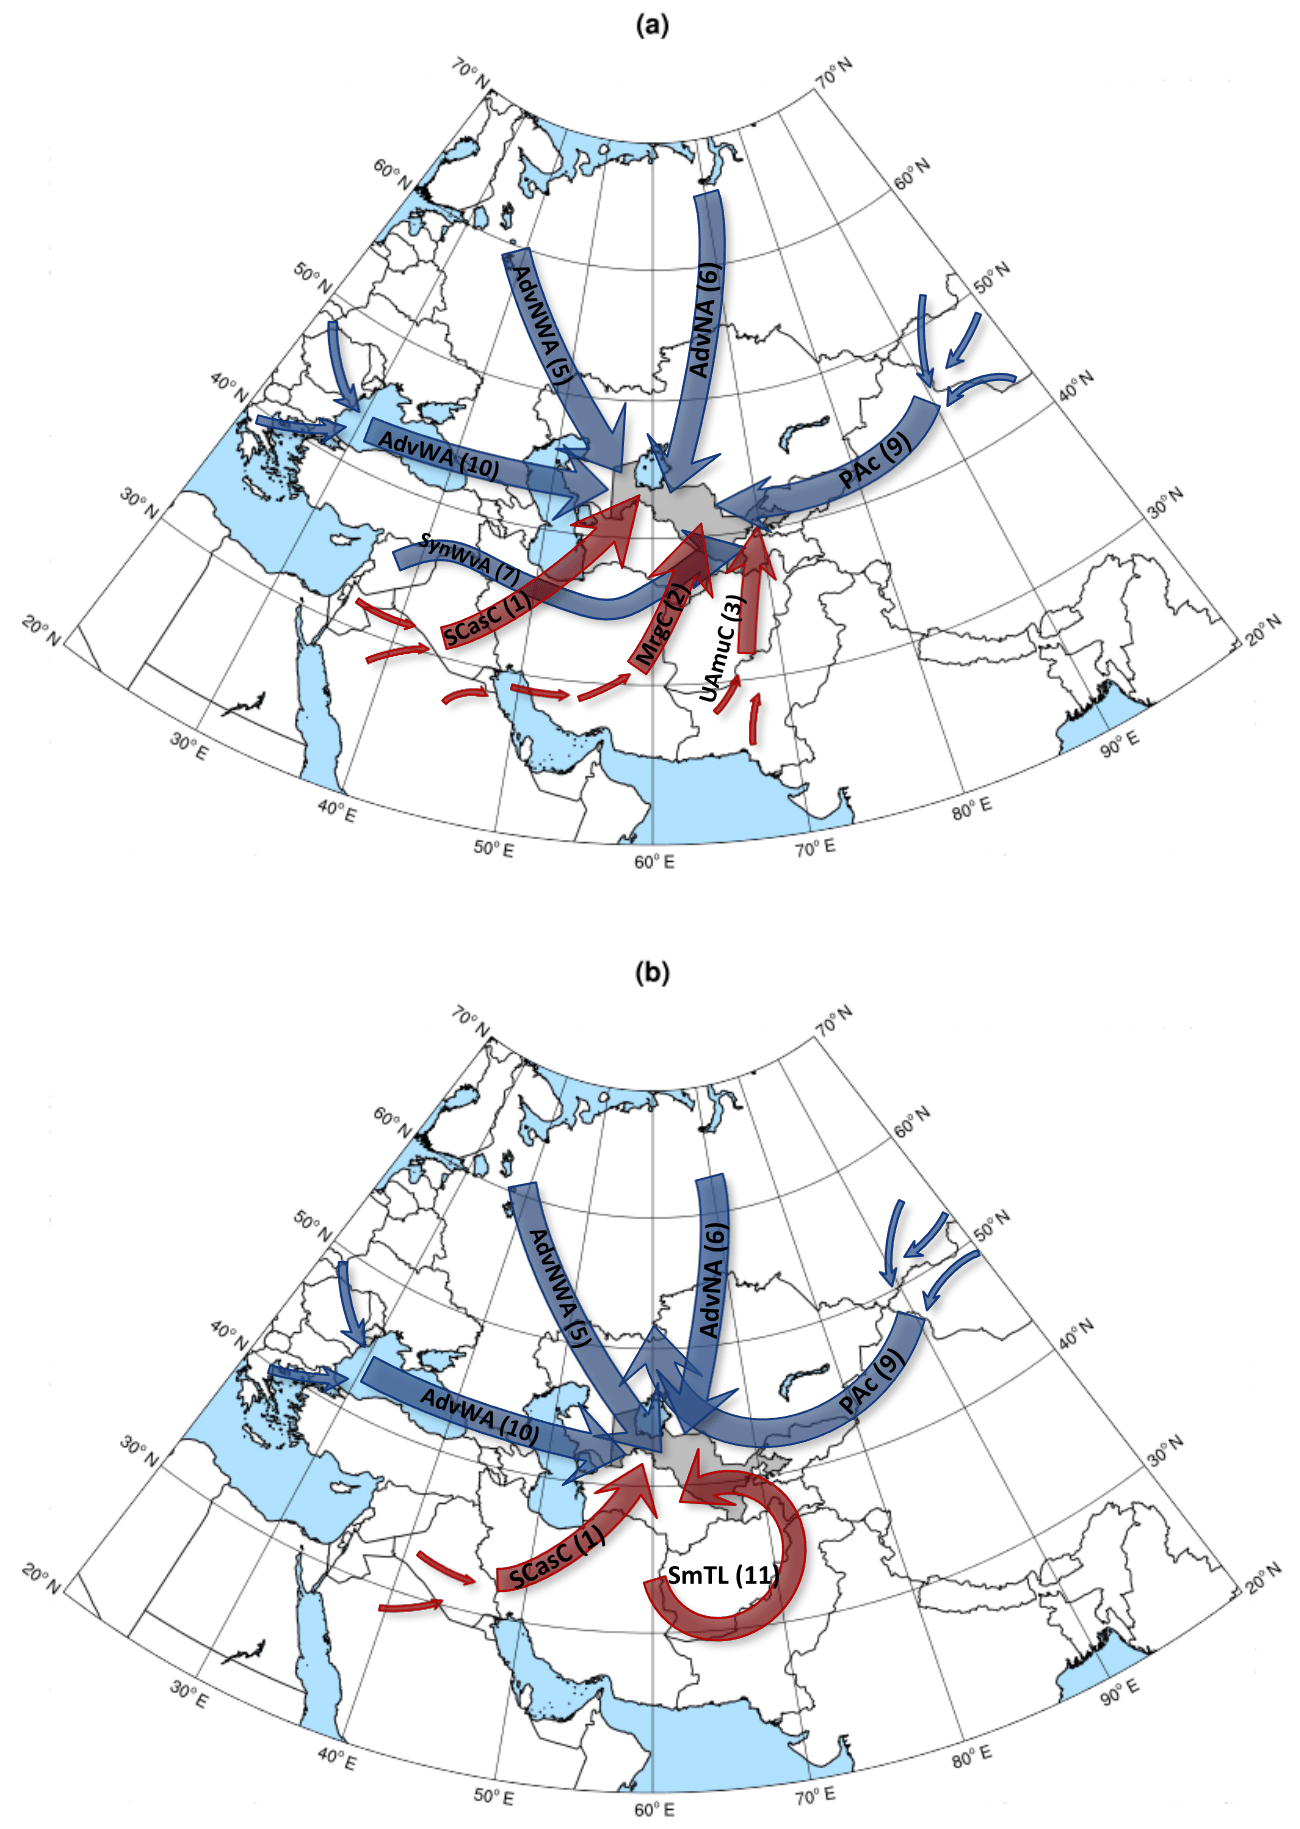
Figure 3Scheme of synoptic weather types in central Asia and Uzbekistan during the cold (a) and warm seasons (b) of the year (after Inagamova et al., 2002). Blue and red arrows indicate relatively cold and warm air trajectories approaching the investigation area (grey background). Abbreviations and numbers of each weather type are explained in Table A2.
We have used this subjective scheme in order to manually evaluate the relationship between synoptic weather patterns and recorded mudflow occurrences in five areas with high mudflow passages in Uzbekistan. Therefore, a SWT database was created based on SWT daily sequence sources contained in the previously published literature. In addition, the daily mean SWT sequence for summer (March–August) of 1984–2013 was extracted from the database to assess the association between mudflow days and frequency of synoptic-scale circulation.
2.2.3 Circulation weather types (CWTs)
The classification of daily flow patterns was carried out using the CWT approach. It was developed by Jenkinson and Collison (Jones et al., 1993) based on the original Lamb weather types for the British Isles (Lamb, 1972). The basic method and details of the scheme were provided by Jones et al. (1993). The objective CWT scheme makes use of three basic variables that define the circulation features at the surface over the study region: direction of mean flow (D), the strength of mean flow (F) and the vorticity (Z). This basic method can be applied to any region with the latitude of ∼30∘–70∘ (Jones et al., 2013). For each day, the direction of the atmospheric flow is determined by considering pressure values at 16 points around the central point at 40∘ N–67.5∘ E (Fig. 9a) and is marked as one of 10 CWTs: north-east (NE), east (E), south-east (SE), south (S), south-west (SW), west (W), north-west (NW), north (N), cyclonic (C) and anticyclonic (A).
This objective approach was successfully applied mainly in Europe (Trigo and DaCamara, 2000; Donat et al., 2010; Jones et al., 2013; Ramos et al., 2015), as well as other parts of the world, e.g. in Armenia (Gevorgyan, 2013) and in Saudi Arabia (Kenawy et al., 2014). Recently, this method was used by Reyers et al. (2013) to determine present-day and future high-resolution rainfall distributions in the Aksu River basin (on the southern slopes of the Tien Shan, CA). To our knowledge this study is the first one that has applied the CWT approach to the territory of Uzbekistan. The aim of applying this method is to estimate the impact of airflow on precipitation patterns and its association with extreme mudflow episodes in Uzbekistan. Furthermore, the CWT scheme allows us to define atmospheric flow regimes objectively for application to Coupled Model Intercomparison Project Phase 5 (CMIP5) model data.
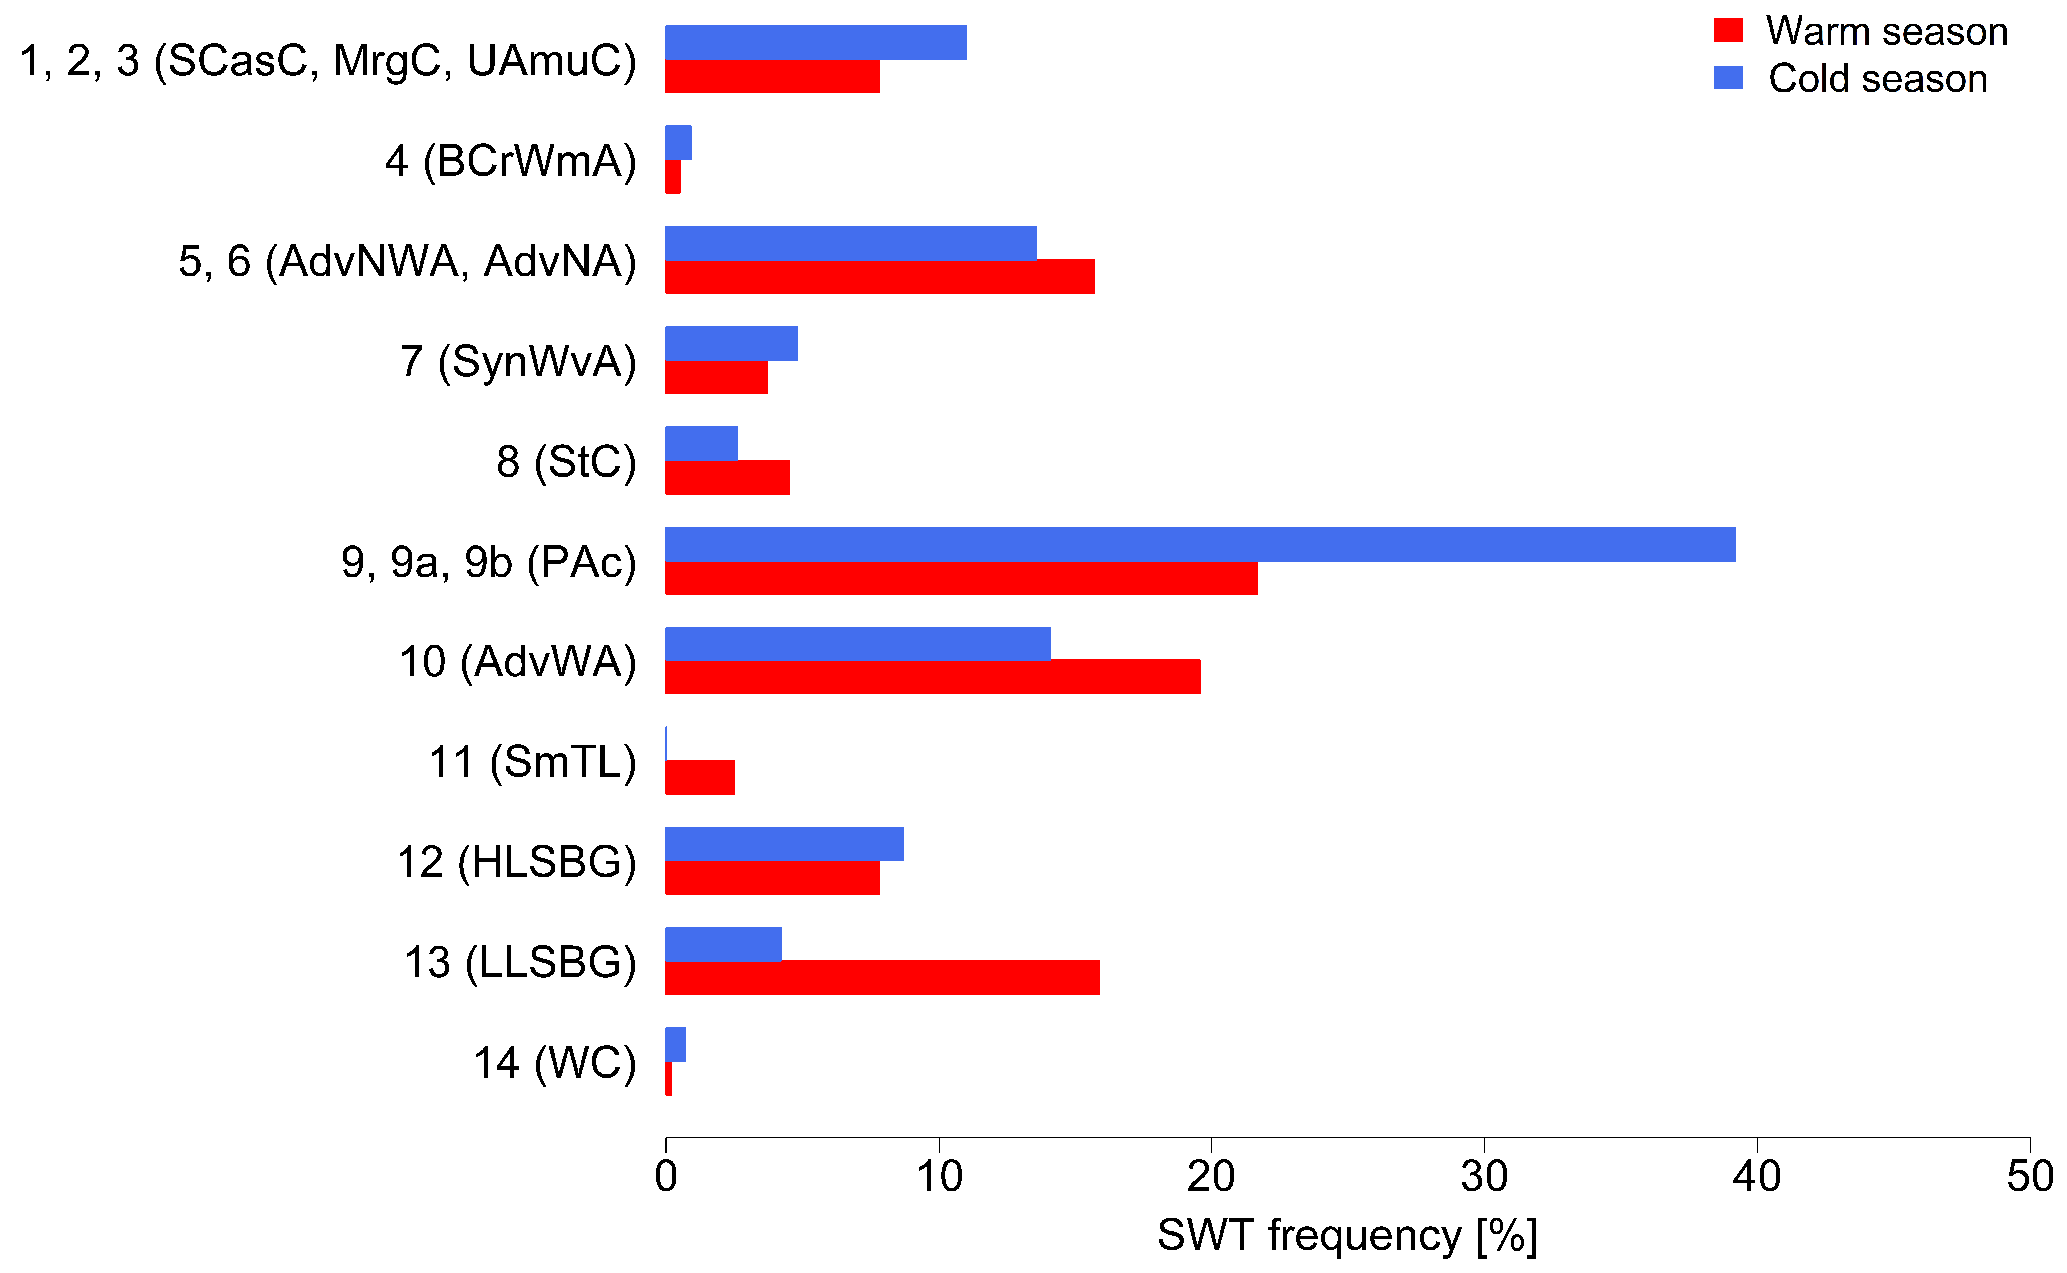
Figure 4Frequency distributions of daily synoptic weather types by Bugayev's classification during the cold (September–February) and warm (March–August) seasons in the period of 1935–2014 years. Definitions of SWTs can be seen in Table A2.
2.2.4 Application of antecedent daily rainfall model (ADRM)
In order to estimate the precipitation threshold causing mudflow events in the study area, a combination of an empirical and a statistical model has been applied: (1) ADRM as the relationship between antecedent rainfall conditions prior to an actual “rainstorm event” and the rainstorm magnitude itself (Glade et al., 2000); (2) a logistic regression model (LRM) as the relationship between an outcome (dependent or response) variable and a set of independent (predictor or explanatory) variables (Hosmer and Lemeshow, 2000).
The ADRM introduced by Crozier and Eyles (1980) defines landslide-triggering rainfall conditions for the Otago Peninsula during 1977–1978. This model was applied in many parts of the world to obtain the threshold probabilities of landslide occurrences on the basis of precipitation conditions (e.g. for New Zealand by Glade et al., 2000; for Portugal by Zêzere and Rodrigues, 2002, and Zêzere et al., 2005; for São Miguel Island (Azores) by Marques et al., 2008; for Bangladesh by Khan et al., 2012; for China by Bai et al., 2014). The advantage of this model lays in the substitution of soil moisture storage levels by daily precipitation data. In the absence of real-time soil moisture measurements, this model allows the prediction of the probability of landslides (Glade et al., 2000). The ADRM (Crozier and Eyles, 1980) is expressed by the following formula:
where ra0 is the antecedent daily rainfall for day 0, r1 is the rainfall on the day before day 0, rn is the rainfall on the nth day before day 0 and k is a constant <1.0. According to Davydov et al. (1973) and Bykov and Vasil'yev (1977) the k parameter depends on the river morphometry and it varies from 0.7 to 0.9, and 0.5 in the case of a slack current. Crozier and Eyles (1980), following Bruce and Clark (1966), used a value of 0.84 for the k factor, which is close to that used in hydrological studies in North America, more precisely Ottawa (Canada) streamflow data (Glade et al., 2000). Due to missing data on regional hydrograph recession curves in the study area, the constant decay factor, k, in this research was assumed to be 0.84 based on Crozier and Eyles (1980) and Crozier (1986). It was also suggested by specialists at Uzhydromet (Gulnoza Khamdamova, personal communication, 2017) that k≥0.8 can be used for this study as it is used in the river catchments in the mountain areas of Uzbekistan. Setting k=0.84 worked satisfactorily in the ADRM to assess the triggering thresholds and mudflow probability in the study area.
In the first step, daily rainfall totals of 30 years (1984–2013) recorded in four representative stations (Gallyaaral, Chimgan, Mingchukur and So'x) were used to assess the average probability of mudflow-triggering thresholds. The empirical model analysis consists of calculating the antecedent precipitation for 10 consecutive days. Daily rainfall observations provided by Uzhydromet were used in this study and a period of 24 h was taken between 08:00 of the previous day to 08:00 LT (GMT + 5) of the present day.
In the next step, a LRM was developed in order to estimate the relationship among mudflow occurrences and daily rainfall and antecedent rainfall value. The LRM was run in the freely available and open-source R software environment (Elsner and Jagger, 2013; R Core Team, 2017). Mudflow occurrence was treated as a dependent variable and 10 days of antecedent rainfall index and the rainfall value on the day with the mudflow event were used as independent variables. The values of the variables were the input data for the LRM algorithm to calculate the precipitation threshold equation and plot probability (P) curves for P=0.1, P=0.5 and P=0.9. This approach is analogous to the one presented in Glade et al. (2000).
Finally, we integrated the results from the two different investigation strands to estimate each weather type as a proxy for the triggering mudflows by applying a combination of CWT, ADRM and LRM to produce the precipitation threshold for each CWT class.
3.1 General climate conditions
In general, the climate in Uzbekistan is continental and semi-arid with hot and dry summers and cold winters, sometimes severe with snowfall. Due to its geographic location (between 37∘ and 45∘ N and between 56∘ and 73∘ E), Uzbekistan has three main climate zones: a zone of deserts and dry steppes occupying about 79 % of the territory, the foothills or piedmont zone, and the area of high mountains extending over the remaining 21 % (Chub, 2007).
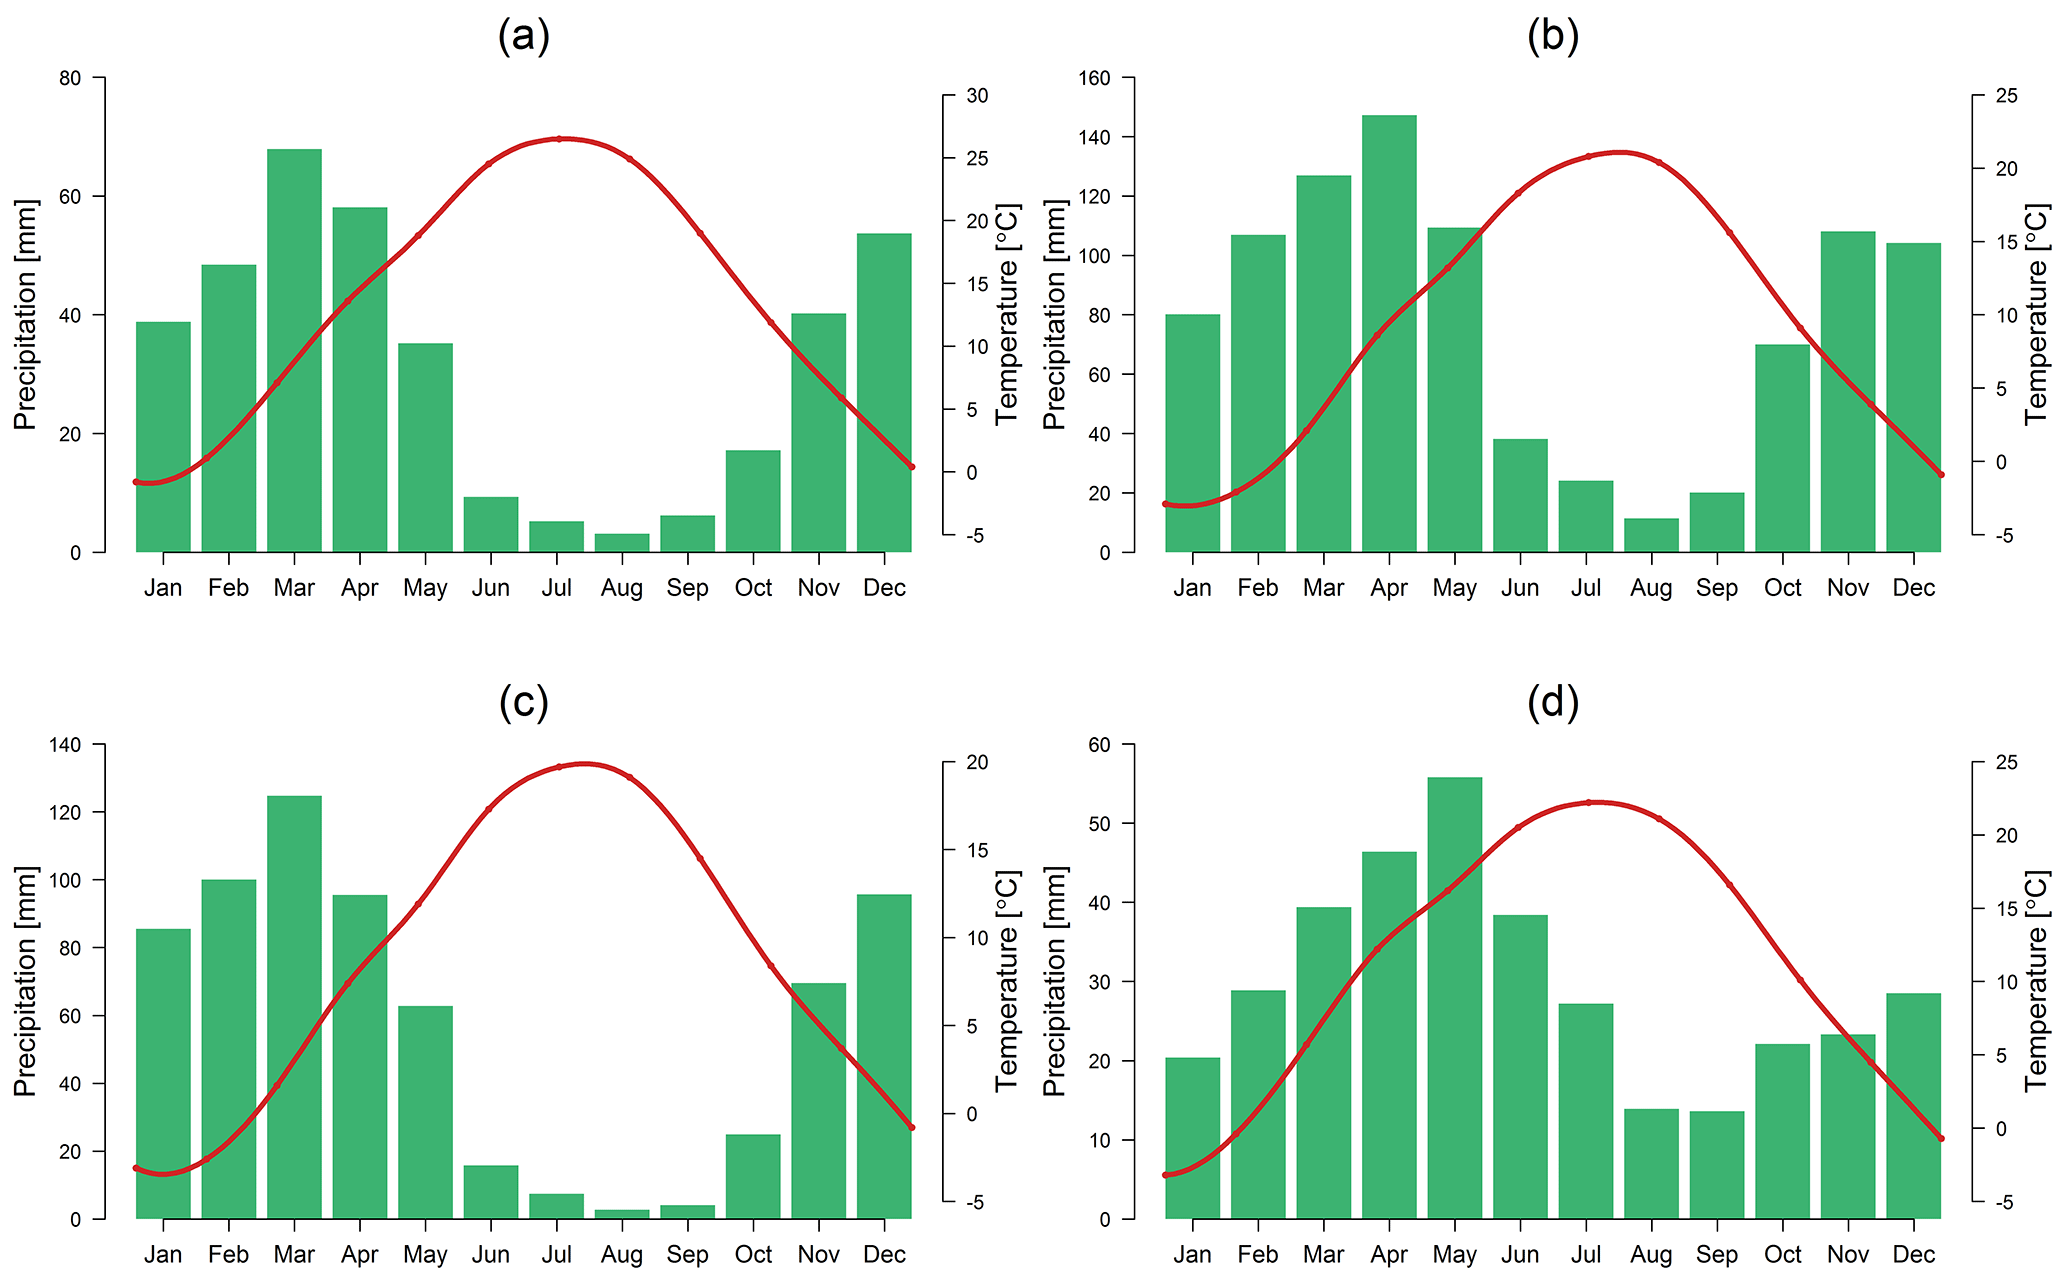
Figure 5The 30-year means (1984–2013) of monthly temperature (∘C, red line) and precipitation (mm, green bars) at four selected stations, namely Gallyaaral in the Zerafshan basin (a), Chimgan in the Chirchik–Akhangaran basin (b), Mingchukur representing the Kashkadar'ya and Surkhandar'ya basins (c), and So'x in Fergana Valley (d), with high occurrences of mudflow in Uzbekistan. The graphs have different scales.
Chub (2007) confirms that the long-term climatology based on 50 stations' data (some series reach back to 1881) in Uzbekistan shows that the mean air temperature in July varies from 26 ∘C in a greater part of the lowlands to 30 ∘C in the south and desert areas, making it the hottest month of the year. The maximum values can reach up to 45 ∘C in the southern part of Uzbekistan. The record temperature of 50 ∘C occurred in Termez and the Kyzylkum Desert. The coldest month is January when the mean air temperature drops to 0 ∘C in the south and can go below −8 ∘C in the north of the country. The minimum temperature can be well below −40 ∘C over the Ustyurt Plateau in extremely cold years.
The air temperature in the piedmont areas at an altitude from 300–400 to 600–1000 m is notably warmer during the cold season of the year and cooler in summers than the plain areas of the country. With increasing altitude in the mountainous regions, the air temperature drops 0.6 ∘C per 100 m on average. This is associated with the complex relief of the study area, e.g. cold airflow over low elevation, radiative cooling and wind speed (Bugayev, 1946; Chub, 2007; Kurbatkin, 2009). However, the temperature may be colder in the bottom of the valleys and intermountain basins due to frequent temperature inversions (Chub, 2007). Figure 5 characterizes monthly mean temperature patterns and the precipitation regime covering the 30-year period of January 1984–December 2013 inclusive, in four representative stations: Gallyaaral (574 m), Chimgan (1620 m), Mingchukur (2132 m) and So'x (1200 m), located in piedmont and mountain areas in Uzbekistan.
The amount and distribution of precipitation, as well as its seasonal variability, greatly depends on the geographical location of the area, topographic features and the general characteristics of the atmospheric circulation. In fact, several authors have identified moist air from the Atlantic Ocean, the Mediterranean Sea and the Persian Gulf as the main large-scale or regional climate factor for the precipitation regime in the country (Bugayev, 1946; Small et al., 1999; Inagamova et al., 2002; Chub, 2007; Schiemann et al., 2008).
The average precipitation distribution in Uzbekistan has a sharp contrast between the plain and mountain areas. Mean annual precipitation in major parts of the plains or deserts and dry steppes (Ustyurt Plateau, Kyzylkum Desert, Karshi, Dalverzin and Golodnaya steppes) is about 80–200 mm. However, precipitation can be significantly greater in some piedmont areas and the mountains, particularly in the north-east and the south-east of the country. In fact, precipitation in areas with an elevation between 600 and 1000 m or piedmont areas (Tien Shan and Gissar–Alai mountain ranges) can reach up to 500 mm; above 1000 m elevation the annual totals may exceed 500 mm. On some hillsides, especially the western slopes of the Tien Shan, it may even be greater than 2000 mm (Chub, 2007).
Generally, the precipitation regime in Uzbekistan reveals a seasonal character with wet conditions from October to May and a dry season with little or almost no rainfall during the summer (Fig. 5). Heavy precipitation events frequently occur during the rainy season, especially in March and April. August represents the driest month with the minimum amount of rainfall throughout the year.
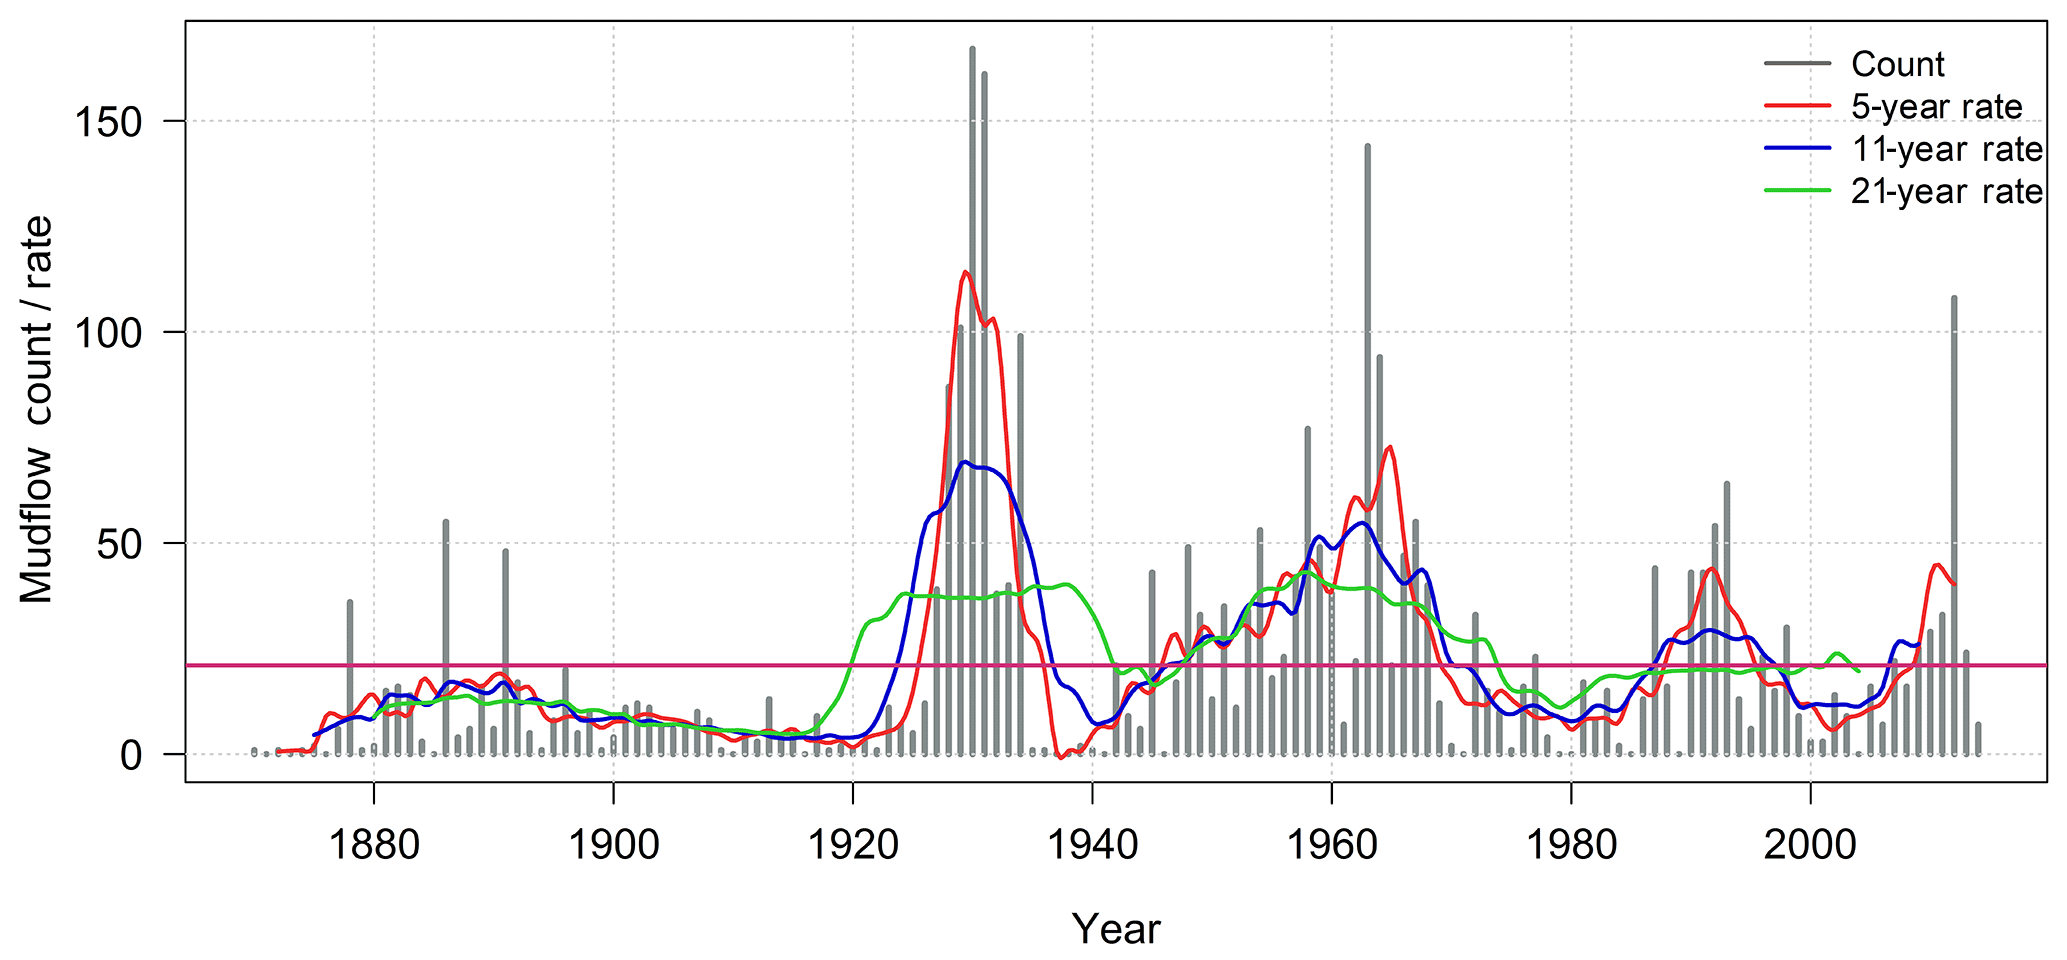
Figure 6Variability in mudflow events in Uzbekistan (1870–2014). Vertical bars present the mudflow observations for each year. The mean annual mudflow count (21) is indicated in a solid continuous horizontal line (pink). Curves (red, blue, green) have been fitted to the distribution for illustrative purposes and denote the 5-, 11- and 21-year rates of mudflow occurrences.
3.2 Mudflows in Uzbekistan
The earliest mudflow event induced by snowmelt and avalanches in the Akhangaran River basin was recorded in March 1870 (Lyakhovskaya, 1989; Chub et al., 2007). The archive data of mudflow occurrences in Uzbekistan since then, the Soviet period and after have been collected and published as catalogues by Uzhydromet.
In this study, we investigated century-long time series of the annual distribution of mudflows to identify key factors contributing to extreme mudflow occurrences. During the observation period (1870–2014) more than 3000 mudflow events have been identified in the river basins in the piedmont areas of Uzbekistan. Table 1 provides comprehensive information on the monthly distribution of mudflows in five regions of the country.
Mudflows with various magnitudes developing on the slopes of the study area appear several times during the year with an average number of 21 extremes per year (Table 1). The highest number of events was observed in 1930 with 167 mudflows followed by 161 mudflows in 1931, 144 episodes in 1963 and 108 events in 2012 (Fig. 6). An interesting point is that the 5-, 11- and 21-year moving averages of mudflow events features a periodicity of approximately 30 years, which repeated the highest peaks in the 1930s, 1960s and 1990s (Fig. 6). The last peak period of mudflow activity occurred in the 2010s. This signature of potential natural variability will pose an additional challenge for investigation of mudflow cycles and their variability under climate change conditions. However, according to Chub (2007), apart from the natural causes the number of recorded mudflows can increase due to several factors which often interact to generate mudflow occurrences in Uzbekistan. Socio-economic factors such as residential and industrial activities below unstable hillslopes accelerate soil creep, and accumulated materials in channels decrease the roughness condition by overloading with fills, which can potentially increase the probability and impact of mudflows.
More than 90 % of all recorded mudflows were associated with extreme precipitation events, hail and sleet, whereas 6 % of mudflow episodes were observed during intensive snowmelt events induced by respective temperature and precipitation changes (Chub et al., 2007). Glaciers melting due to increasing temperatures and mountain lake outbursts (Petrov et al., 2017) and dam failures has been suggested as a possible trigger of further minor mudflows (1.4 %) in the study area. Approximately 80 % of all recorded mudflow episodes with different origins occurred during the period of April–June (Fig. 7).
Records confirm that mudflow events often affected the Fergana Valley, indicating the highest event frequency during the investigation period of 12 mudflow occurrences per year on average (see Table 1). Salikhova (1975) and Lyakhovskaya (1989) interpreted that due to its topographic feature, the Fergana Valley was susceptible to constant mudflow passages. Geologically the uplands in the Fergana Valley are mostly covered with loess loam, which minimizes water infiltration and makes it receptive for even a small surface runoff to flush off the soil easily. This process contributes to soil erosion, which ends with the formation of mudflow episodes almost every year from March until August in the valley. In contrast to the Fergana Valley, the geological structure of the mountain areas for the following regions, namely the Zerafshan, Surkhandar'ya and Kashkadar'ya basins, is formed of effusive or volcanic rocks of the Palaeozoic age, which may cause more debris flows rather than mudflow events. Geomorphologic factors can be useful to determine the general susceptibility of various lithologies to landsliding in specific region (Sidle and Ochiai, 2006).
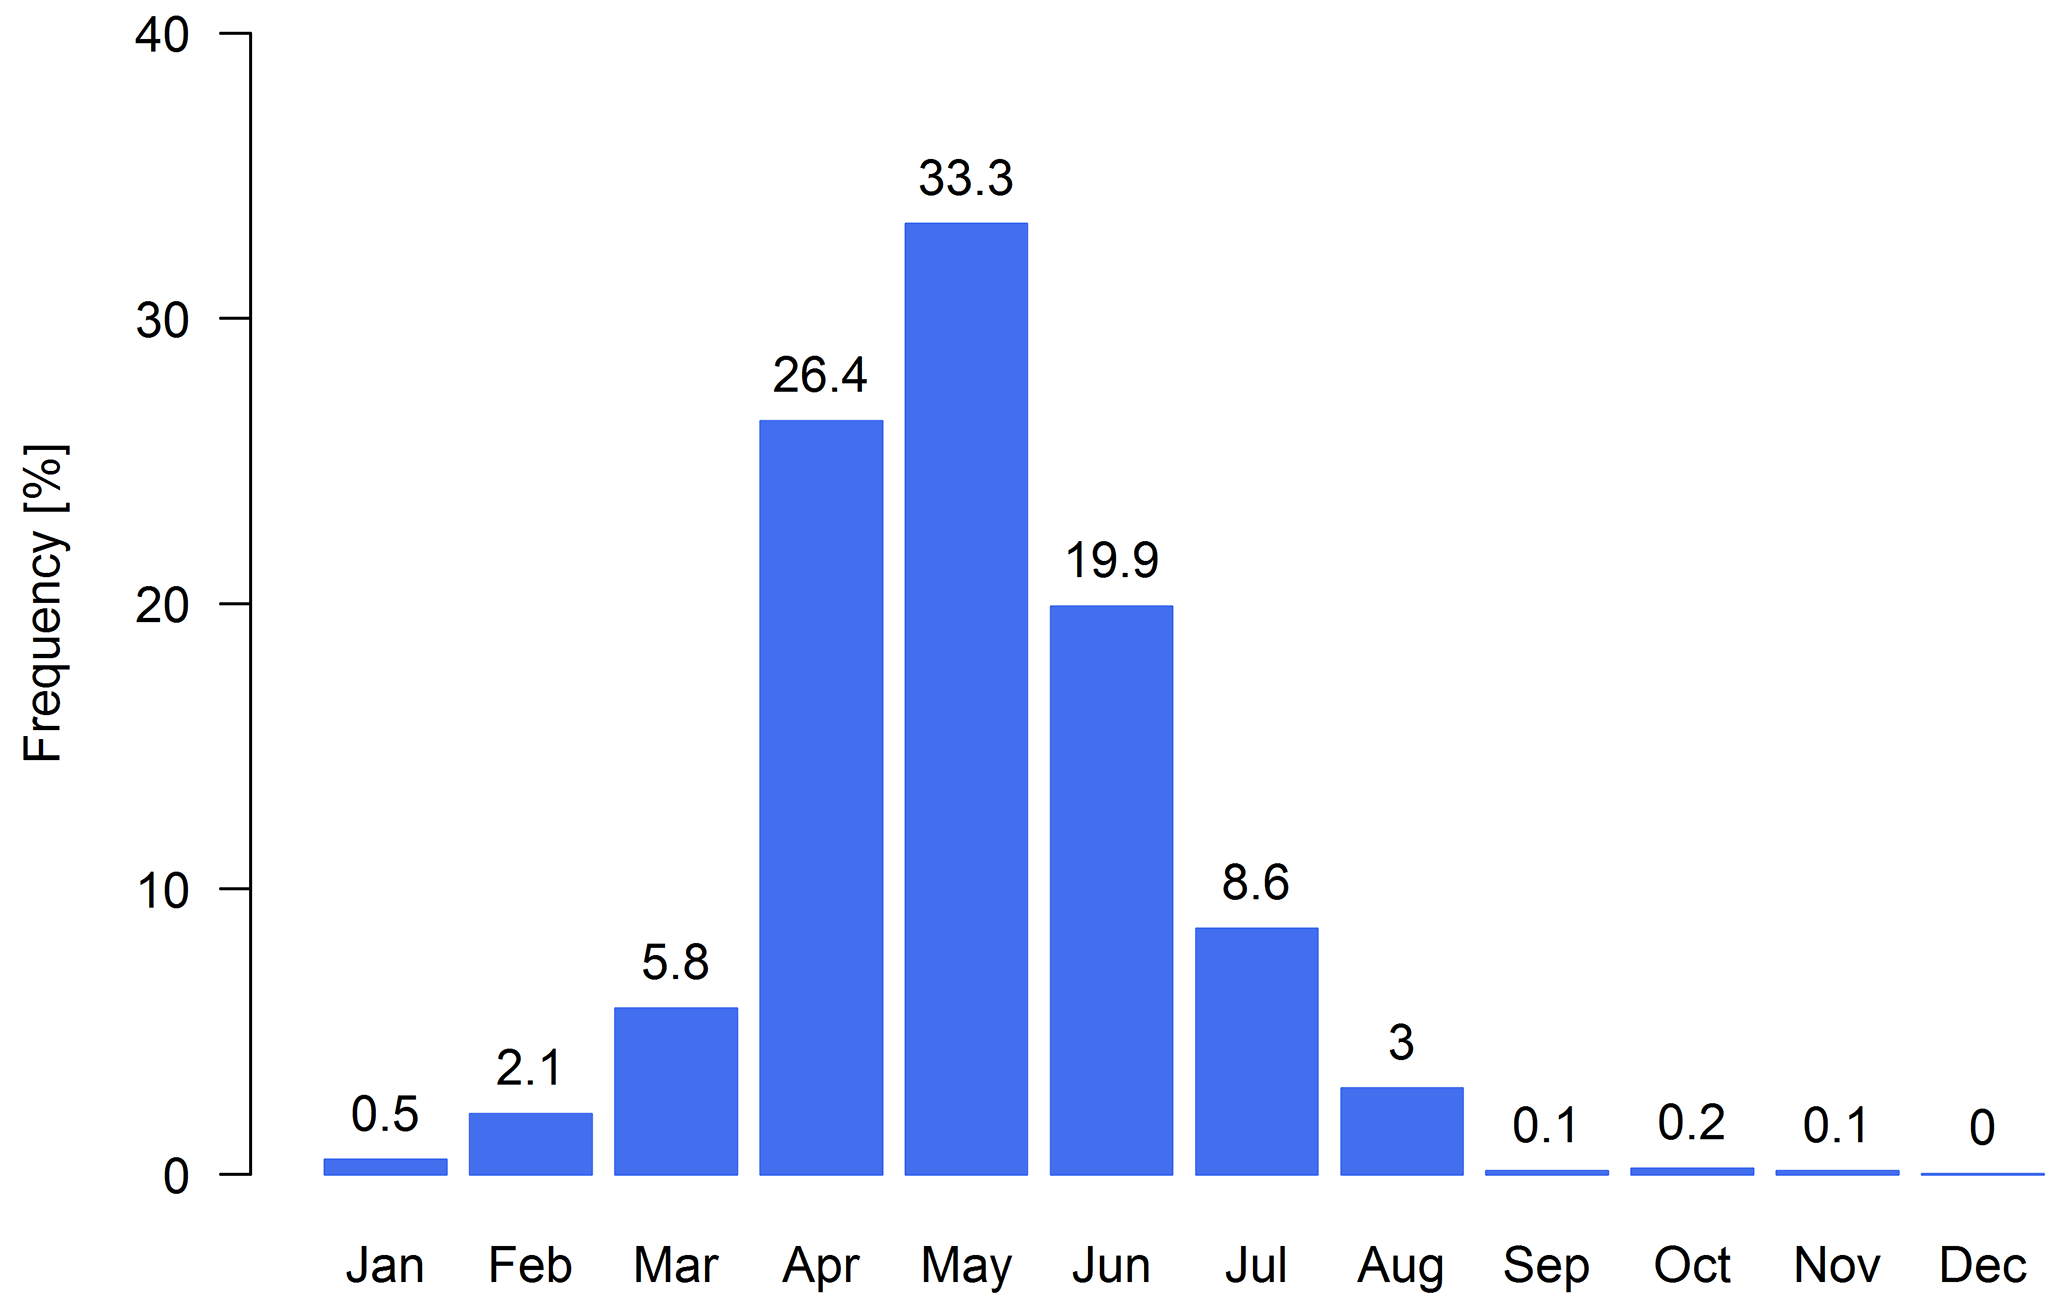
Figure 7Monthly mudflow frequencies (bars) for the years 1870–2014. Values over the bars indicate the percentage of mudflow occurrences in a given month.
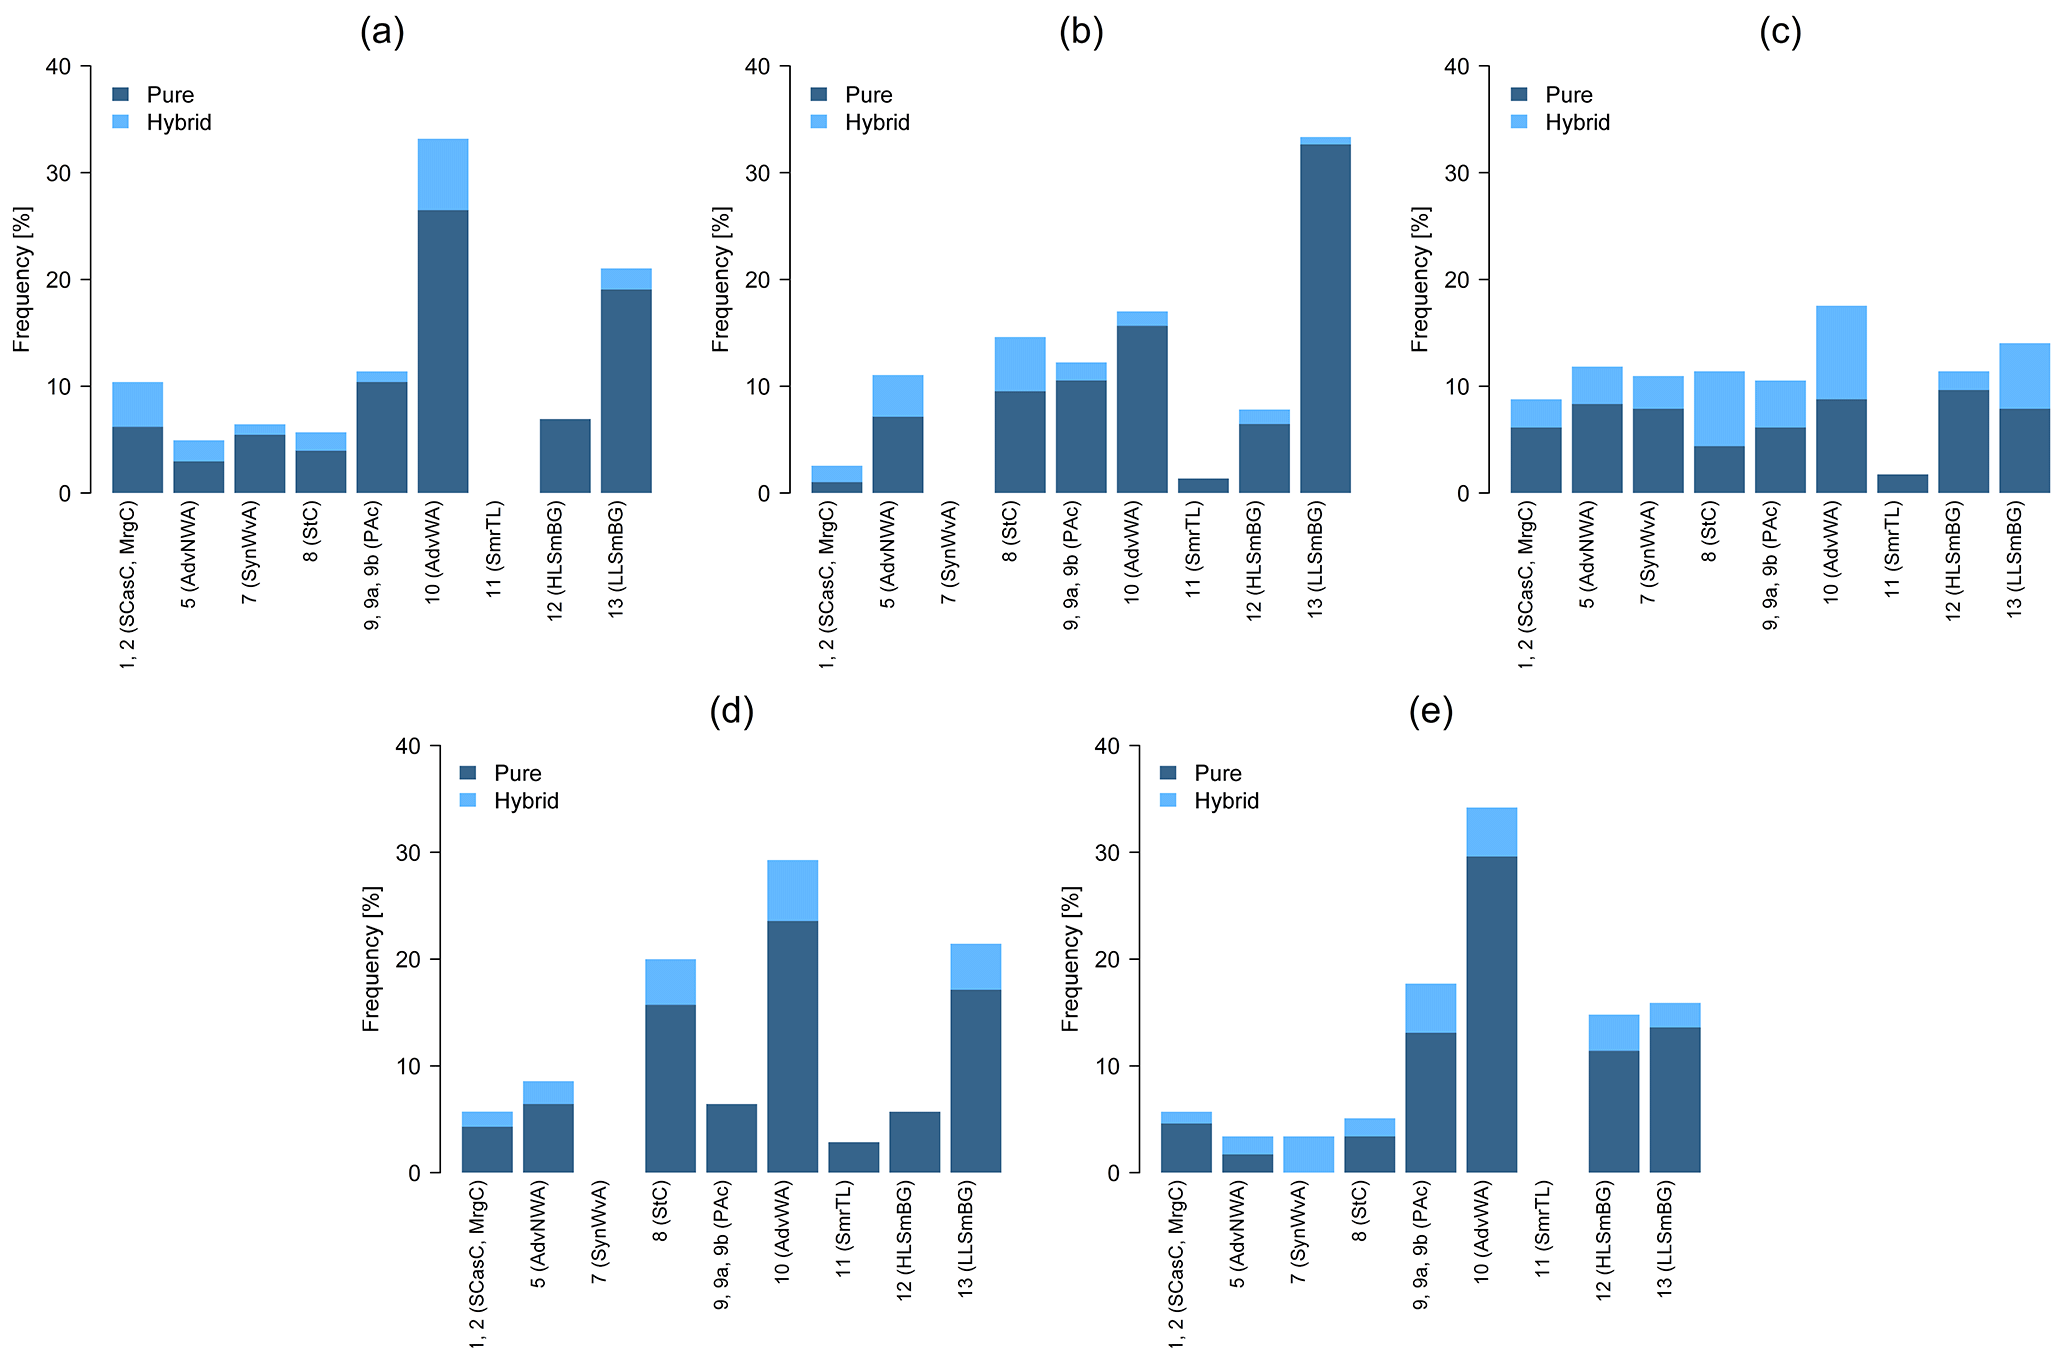
Figure 8Frequency of mudflows under the synoptic weather types (SWTs) over Uzbekistan during 1984–2013 (March–August): (a) Zerafshan basin (101 days); (b) Fergana Valley (147 days); (c) Chirchik–Akhangaran river basin (57 days); (d) Kashkadar'ya basin (35 days); (e) Surkhandar'ya basin (44 days). The definitions of SWT can be seen in Table A2.
There are more than 450 streams located in the river basins in the mountain and foothill areas in Uzbekistan and it is fairly common to observe extreme mudflow occurrences in multiple streams on the same day (Chub et al., 2007). For instance, on 15 April 1964 only in the Samarkand province (Zerafshan Valley) were 22 mudflow episodes recorded in a single day (Lyakhovskaya, 1989). During the period spanning from 1870 to 2014 up to 24 passages of flows were observed on 18 May 1991 in many parts of the country.

Figure 9(a) Location of the study domain together with the 16 grid points and central grid point (40∘ N–67.5∘ E, red circle) used in the automated weather circulation type. (b) Investigation area shown in the rectangle and location of selected stations (black triangles) around the central grid point 40.0∘ N–67.5∘ E (red circle) of the CWT objective method. Stations include Gallyaaral (40.02∘ N–67.60∘ E), Chimgan (41.57∘ N–70.00∘ E), So'x (39.97∘ N–71.13∘ E) and Mingchukur (38.70∘ N–66.90∘ E). (c) ERA-Interim orography map and the location of the central grid point (red circle) together with the representative four stations (black triangles).
4.1 Synoptic weather types (SWTs) and mudflows
During the investigation period between 1984 and 2013, there were more than 300 days with mudflow occurrences in Uzbekistan. Figure 8 shows the frequencies of mudflow days for each SWT in five regions (Zerafshan, Fergana, Chirchik–Akhangaran, Kashkadar'ya and Surkhandar'ya) with high mudflow passage. According to the results, the majority of mudflows occur during the advection of airflow from the west (SWT 10) and a low level of small barometric gradient (SWT 13) in the study area. However, SWT 13 is the most frequent weather type in Fergana Valley (Fig. 8b) as the interaction of frontal circulation with orography as well as the associated effects of condensation and evaporation are assumed to determine the formation of low-level fronts and small-scale rainbands (Buzzi et al., 1998; Inagamova et al., 2002) there. The stationary cyclone type (SWT 8) is the second most frequent SWT triggering mudflow events, although in some regions it is not as prominent. Purely anticyclonic weather types (SWT 9, 9a, 9b) constitute less than 15 % of all events (Fig. 8) even though this weather type is the most frequent per year on average (Fig. 4). Cyclones propagating from the south-west (SWTs 1 and 2) towards the study area, advection from the north and north-west (SWTs 6 and 5), a high level of small barometric gradient (SWT 12) and synoptic wave activity on a cold front (SWT 7) also contribute to significantly unstable weather conditions inducing mud and debris flows (Fig. 8). While the majority of SWTs were associated with regional- or local-scale precipitation patterns, the summer thermal low (SWT 11) was not (Fig. 8b, c, d). Observations confirmed this SWT has triggered mudflows with origins of snow and glaciers melting due to increasing surface temperatures.
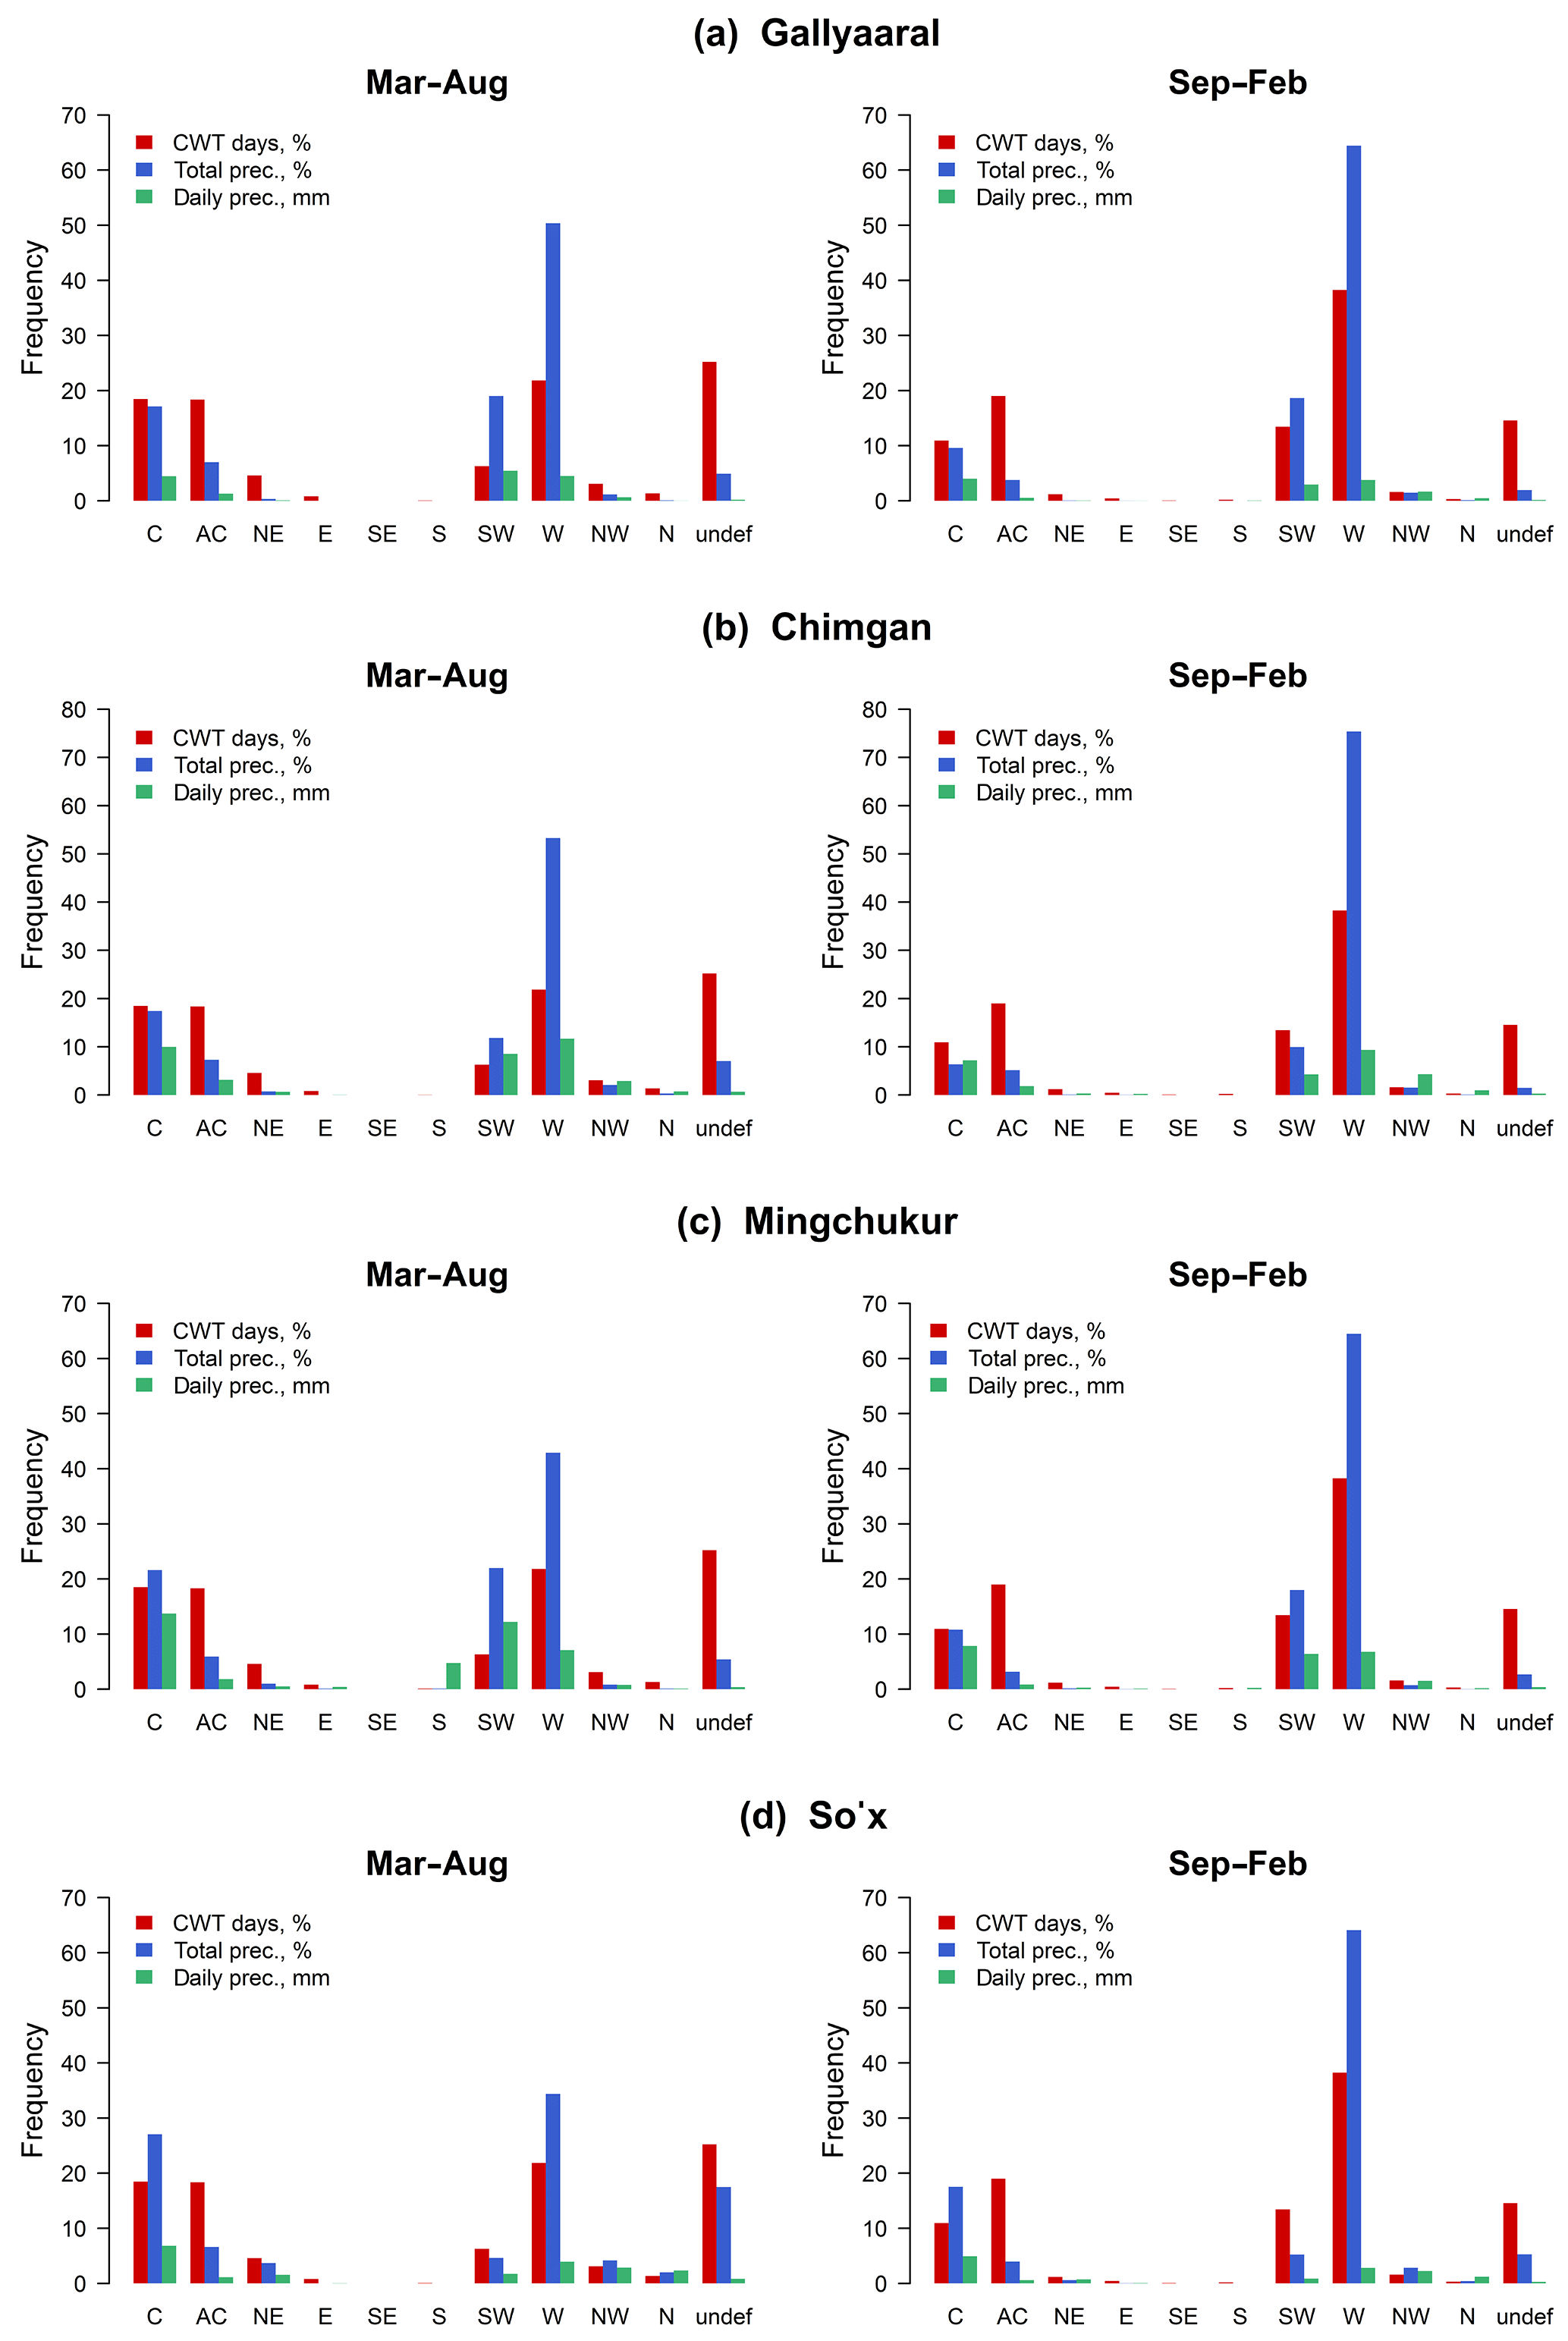
Figure 10Contribution of CWT classes to the observed precipitation over the stations Gallyaaral in the Zerafshan basin (a), Chimgan in the Chirchik–Akhangaran basin (b), Mingchukur representing the Kashkadar'ya and Surkhandar'ya basins (c) and So'x in Fergana Valley (d) for warm (March–August) and cold (September–February) seasons for the years 1984–2013. CWT days – frequency of each class in percentage; % total precipitation – contribution of each class to the overall precipitation; mm day−1 – daily average precipitation for each CWT. The panels have different scales.
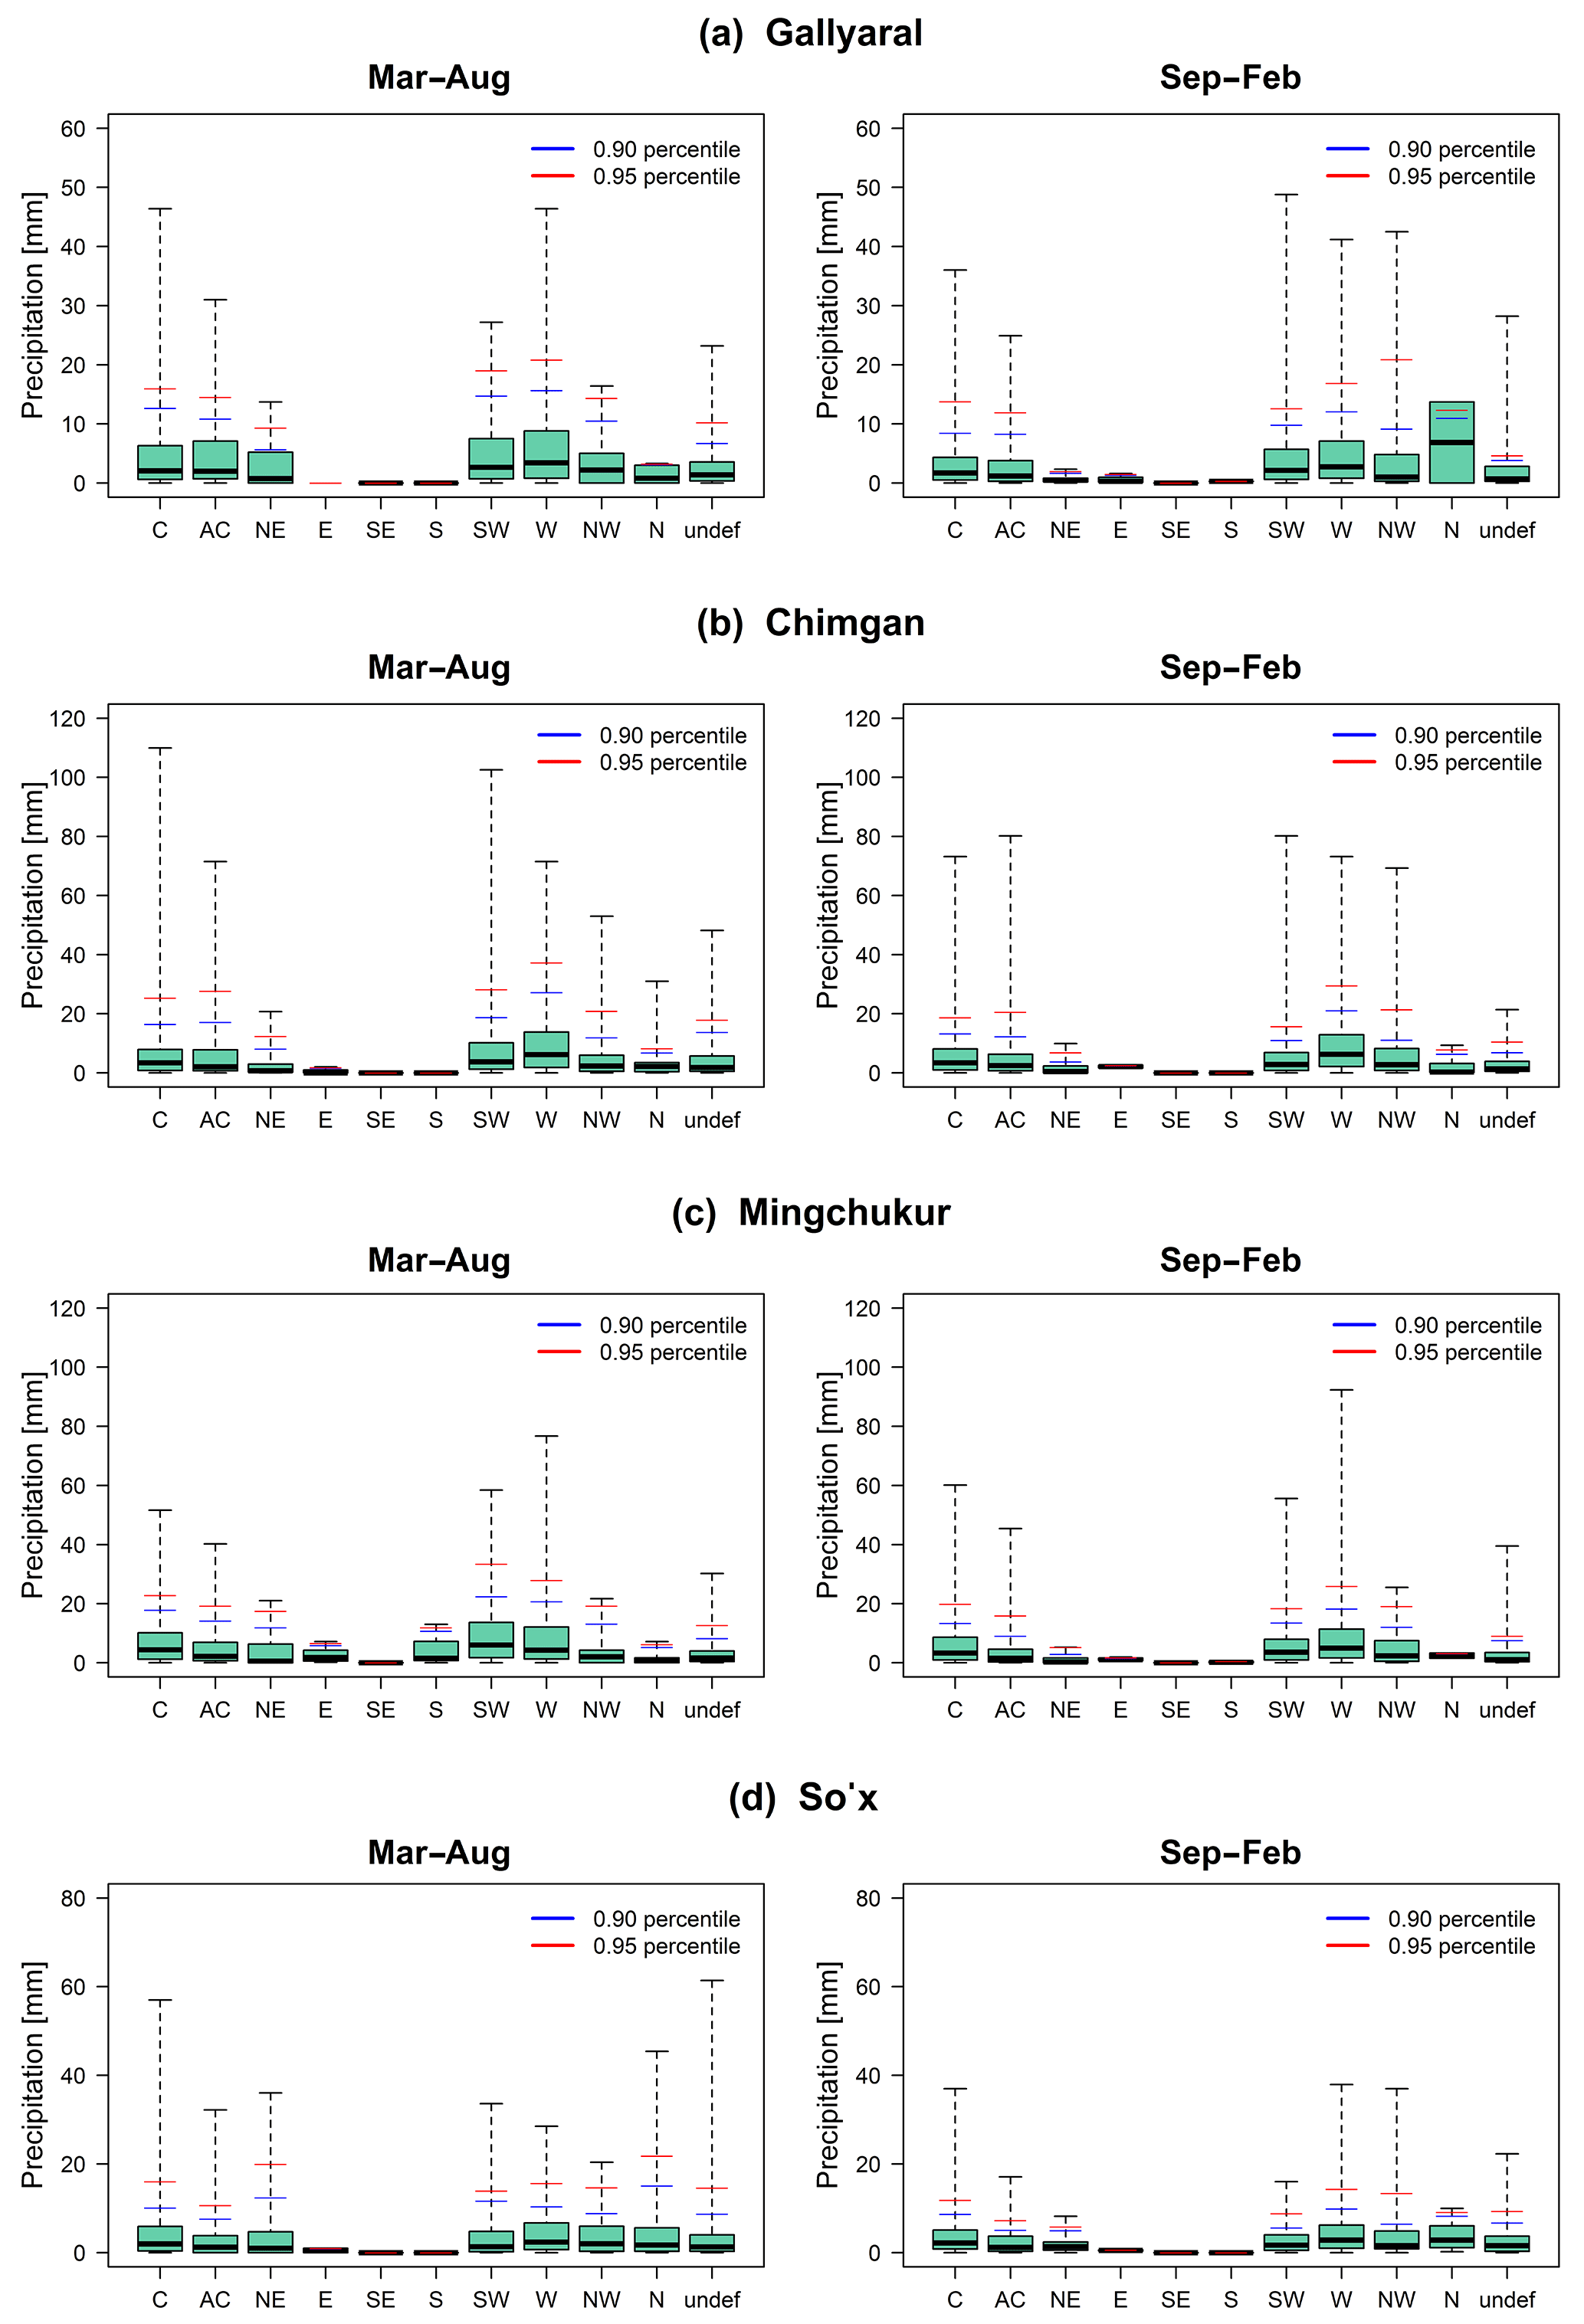
Figure 11Box plots show daily precipitation (1984–2013) for each CWT class at four representative stations, namely Gallyaaral (Zerafshan basin), Chimgan (Chirchik–Akhangaran basin), Mingchukur (Kashkadar'ya and Surkhandar'ya basins) and So'x (Fergana Valley). The blue and red lines represent percentiles 0.90 and 0.95 of the precipitation for each class. The panels have different scales.
4.2 Circulation weather type (CWT) approach
4.2.1 CWT and precipitation climatology
In order to assess the impact of each CWT class on mudflow-triggering precipitation regimes, long-term daily circulation types and the corresponding daily values of precipitation were analysed.
Figures 10 and 11 show the seasonal distribution of the relative frequency of the number of days and precipitation values for each CWT class during 1984–2013 for the four stations in total. The column graphs in Fig. 10 highlight the frequency of each weather class (CWT days, %) as well as the relative contribution of each weather type to the total recorded rainfall values (total precipitation, %) and the average daily precipitation for each CWT (mm day−1). The box plots in Fig. 11 indicate the seasonal rainfall statistics including the 90th and 95th percentiles of precipitation value within each CWT class.
It is worth noting that on average the large-scale atmospheric circulation over Uzbekistan and central Asia is mainly dominated by the W weather type throughout the year (Fig. 10). The frequencies of the W type show the highest value between 22 % and 38 %, depending on the season. The percentage of precipitation during the W days ranges from 35 % to 75 % of the total annual precipitation for each station. The spatial distribution of daily average precipitation up to 3–7 mm day−1 was associated with the W flow for nearly all the stations (9–12 mm in Chimgan, Fig. 10b).
C and A weather types feature almost similar frequencies (18 %) in summer; however, C flow contributes roughly 4 times more of the annual precipitation (up to 27 %) and daily rainfall values (13 mm day−1) compared to the A class. Even though A circulation has a higher number of the circulation days in contrast to the C type, in the winter half of the year the C days still indicate higher values of precipitation, which makes this CWT one of the wettest airflows. The 90th and 95th percentiles of the precipitation totals confirm this (Fig. 11).
SW flow occurs from 6 % to 13 % during the year and contributes 10 %–22 % of the precipitation totals (5 % in Fergana Valley). Seasonal distribution of weather types associated with E, SE and S flows is up to 1.3 % per season and fairly variable throughout the year and produces little or almost no rainfall, i.e. 0.2 %–0.5 % or less than 1 mm day−1. Another minor occurrence associated with NW circulation (1 %–3 %) contributed approximately 3 % of the precipitation totals and 4 mm of daily rainfall on average depending on the area and the rain gauge data.
In comparison to other stations, the NE and N weather types have different precipitation patterns at So'x station, Fergana Valley, during the warm season of the year (Figs. 10d and 11d). This is due to the location and orographic pattern of the area (Fig. 9c), which makes these weather types some of the wettest airflows throughout the year with frequent floods and mudflow occurrences.
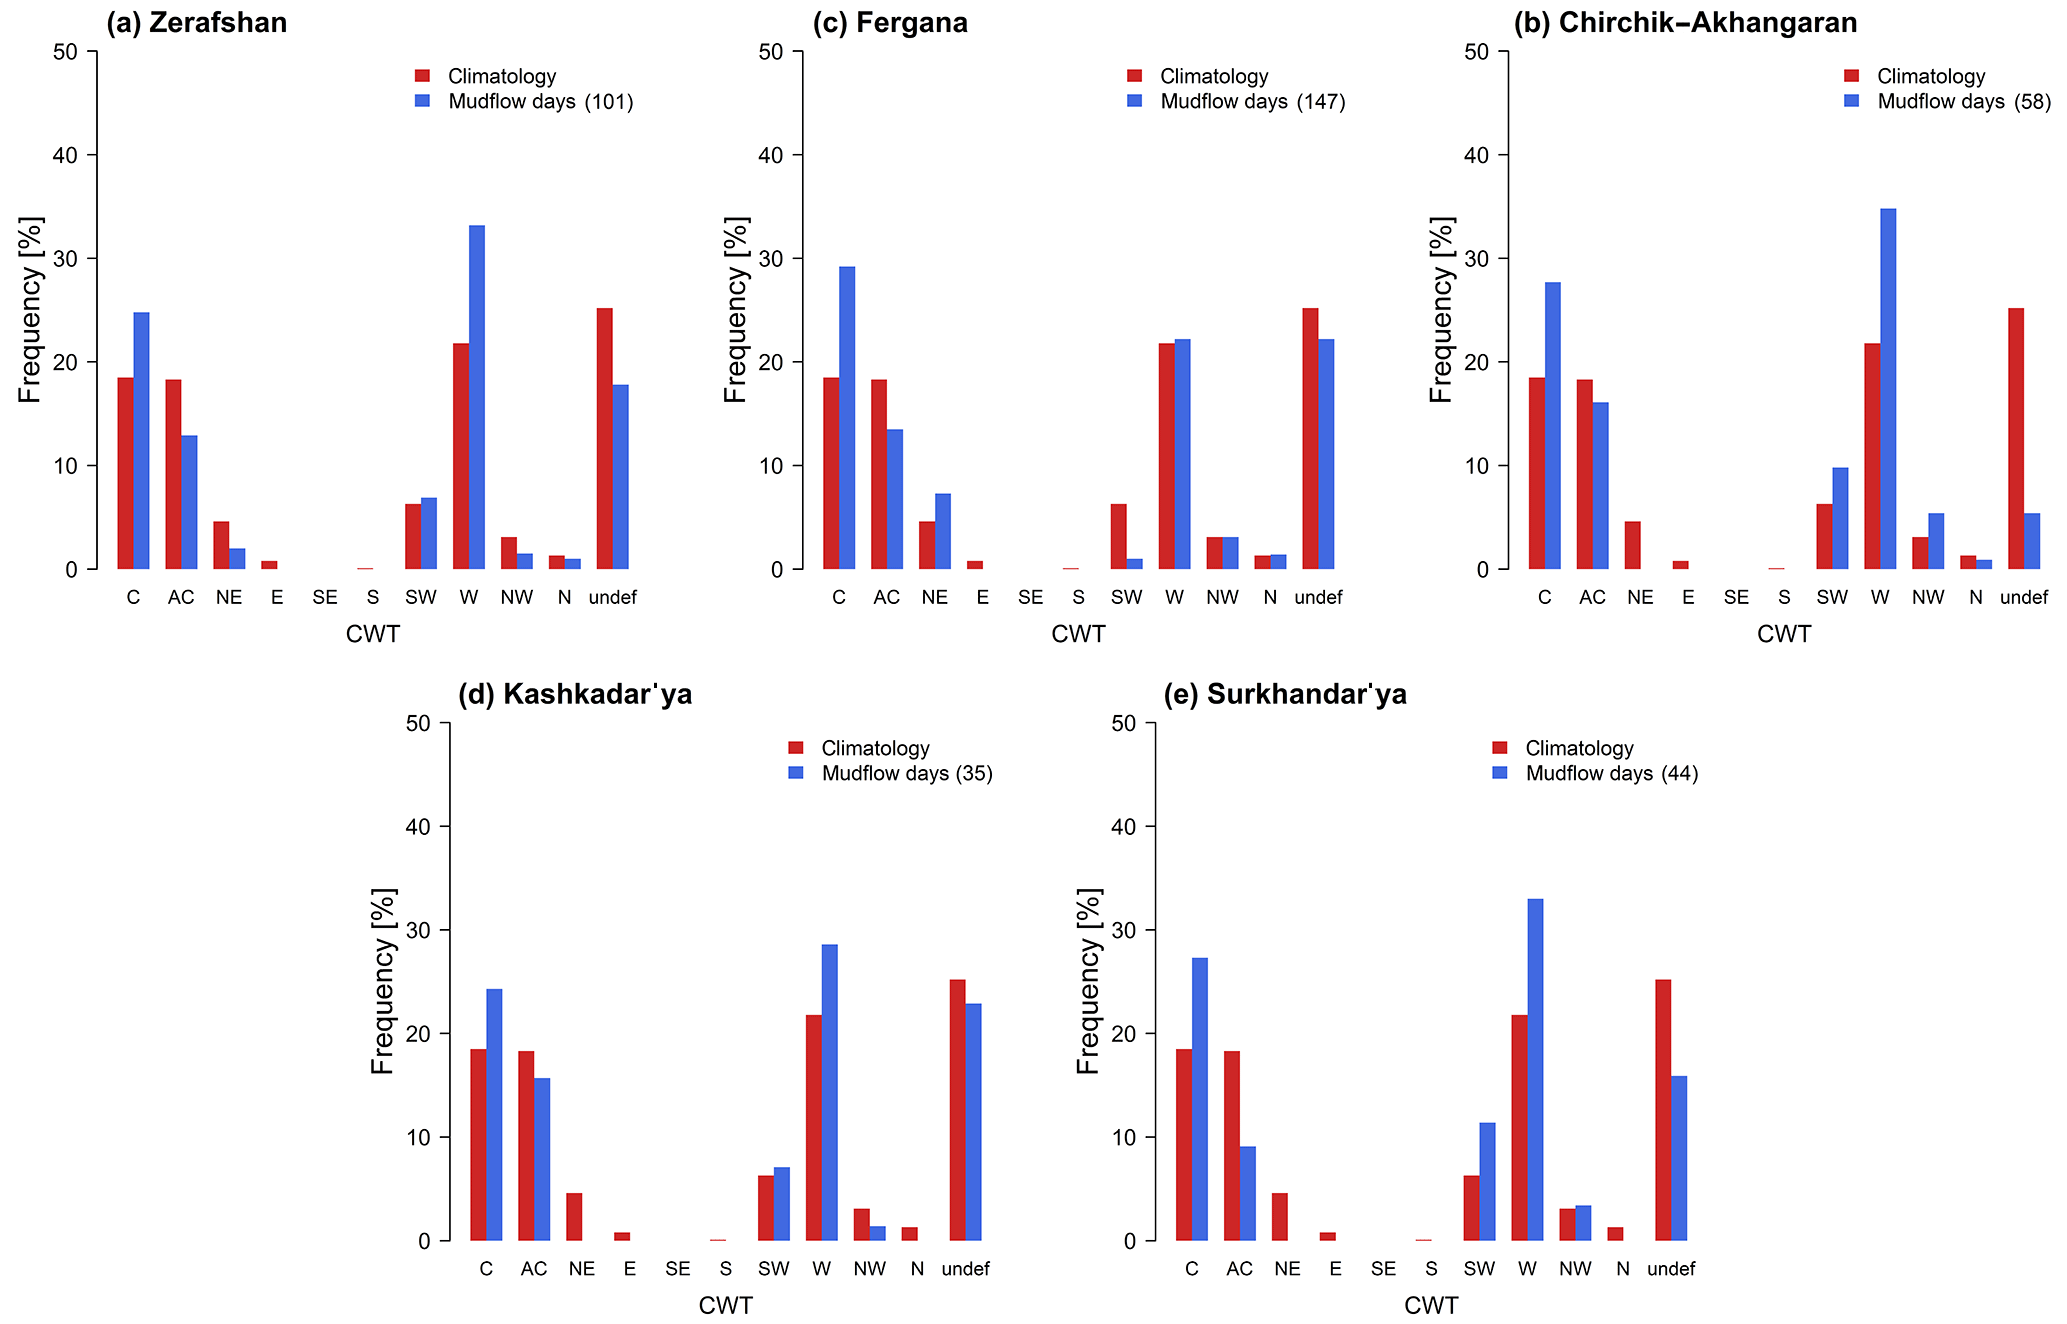
Figure 12Frequency of CWT (700 GPH) climatology for the period March–August, 1984–2013 (red bars), and mudflow days (blue bars) that occurred in the Zerafshan basin (a), Fergana Valley (b) and the Chirchik–Akhangaran (c), Kashkadar'ya (d) and Surkhandar'ya (e) basins in Uzbekistan. The central grid point is 40.0∘ N–67.5∘ E.
The impact of small-scale orographic features on weather types and rainfall distribution is assumed to be one of the reasons for the notable seasonal variabilities in the undefined weather type throughout the year. For illustrative purposes, an ERA-Interim orography map confirming this has been included (Fig. 9c). An important inclusion in this study was the CWT evaluation, which highlighted the spatial distribution of precipitation in Uzbekistan on a synoptic scale.
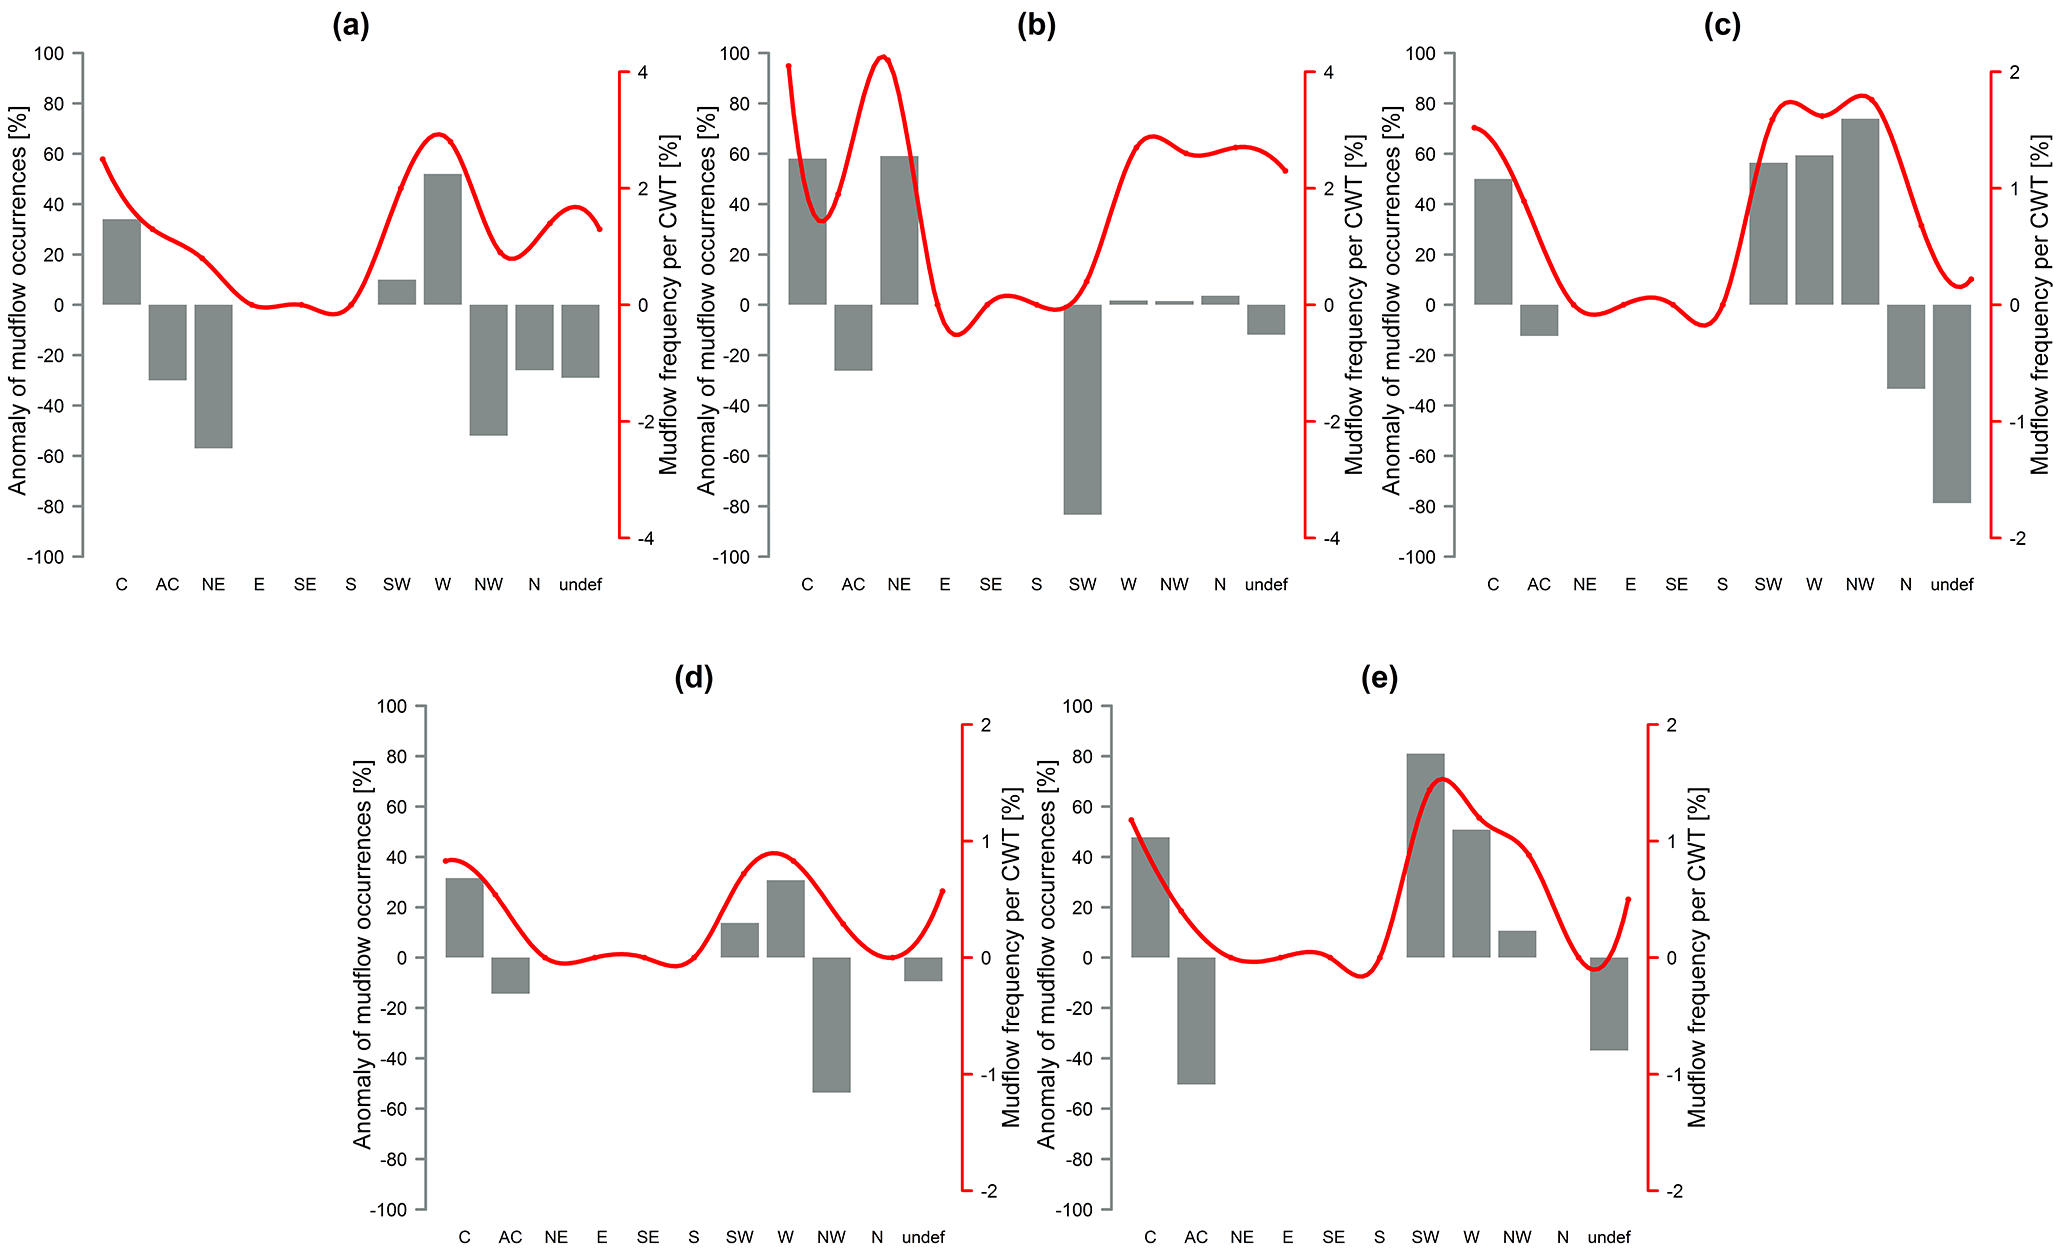
Figure 13Anomaly of mudflow days for every CWT class (grey bars, grey axis, %) and CWT classes for mudflow days (red line, red axis, %) for the March–August period between 1984 and 2013 in five regions: (a) Zerafshan basin (101 days), (b) Fergana Valley (147 days), (c) Chirchik–Akhangaran river basin (57 days), (d) Kashkadar'ya basin (35 days), (e) Surkhandar'ya basin (44 days). The panels have different scales.
4.2.2 CWT and mudflows
This section presents the analysis of the relationship between CWT classes and mudflow occurrences in the investigation regions of Uzbekistan. Figure 12 shows a comparison between mudflow events with CWT daily frequencies in March–August, 1984–2013. For consistency, the central grid point (40∘ N–67.5∘ E) was selected for investigation of 101 days of induced mudflow occurrences in the Zerafshan basin, 147 days in Fergana Valley, 57 days in the Chirchik–Akhangaran basin, 35 days in the Kashkadar'ya basin and 44 days in the Surkhandar'ya basin observed in the warm season during the period 1984–2013 (Fig. 12). Interestingly, the Zerafshan (a), Chirchik (c), Kashkadar'ya (d) and Surkhandar'ya (e) regions have similar patterns (Fig. 12). However, complex orography and complicated topography affect the weather systems, and precipitation distribution is assumed to produce slightly different results for Fergana Valley (Fig. 12b). The frequencies of the W, SW and C weather types are considered a “rainy” group with increased mudflow episodes compared to the rest of the CWTs in all five regions. There is also a considerable amount of the NW circulation type associated with extreme mudflow events in the Chirchik and Surkhandar'ya basins (Fig. 12c, e). However, NE days trigger more mudflows in contrast to SW flow, which reveals a decrease in Fergana Valley (Fig. 12b).
Figure 13 confirms that anomalies compared to the average occurrence of mudflow days for the C, W and SW class are higher in comparison to normal CWT climatology during the warm phases of 1984–2013. The A weather pattern has a noticeable decline of mudflow frequencies compared to the climatological mean for each CWT class. NW flow is also attributed to the mudflow trigger weather class as it was accompanied by heavy rainfall induced extreme mudflow events, particularly in the Chirchik–Akhangaran and Surkhandar'ya basins and slightly in Fergana Valley. During the investigation period, mudflow events in the study area were found to be highly unlikely for E, SE and S, thus representing missing values in the figure.

Figure 14An antecedent daily rainfall model applied to the representative stations Gallyaaral (a), Chimgan (b), Mingchukur (c) and So'x (d) for the period 1984–2013. Red lines and curves indicate the 0.1, 0.5 and 0.9 probability threshold triggering mudflow occurrences. Equations from Table 4 were used for calculation of the probability lines at selected stations.
It is noteworthy here that the variability in C, W, SW and NW days in comparison to all CWT days again shows increased trends in mudflow probability and corroborated all results mentioned above. Therefore, it can be concluded that appreciable weather classes (C, W, SW and NW) are the main contributors to observed mudflow occurrences for the study area and are in agreement with the recorded precipitation distribution patterns.
5.1 Application of ADRM for station data
The model results (Fig. 14) show that minimum and maximum threshold boundaries with different probabilities of occurrence exist, but not all rainfall values among the thresholds are associated with mudflow episodes. A daily rainfall value ≥0.1 mm, from March until August (1984–2013), was selected for plots presented in Fig. 14. Following Glade et al. (2000), all rainfall days were divided into three categories: days associated with mud and debris flows, days with no recorded mudflows and days with probable mudflow episodes. Events in the third category were not recorded in historical data. Thus, it could not be assumed that there were no mudflows on those days as the rainfall value was similar to or exceeded the precipitation levels of days with recorded debris and mudflows. However, the summary of the daily precipitation value, which is recorded from 08:00 until 08:00 LT (GMT + 5) of the next day, might not tally with the day of the mudflow occurrences. Therefore, mudflow passages were also assumed to be a probable variable as we did not have the information regarding the exact time of the mudflow occurrence. Additionally, the air temperature patterns in March–May were analysed for some meteorological stations, for example, Chimgan located at more than 1600 m in altitude, which led to the conclusion that the high-precipitation events recorded were likely snowfall periods, which leaves very little possibility of mudflow passage. Hence, a probable mudslide event was not analysed for high-altitude areas, even though high precipitation values existed.
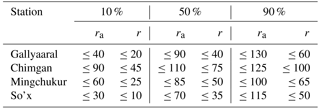
According to Fig. 14, there is a 10 % probability of mudflow events if the antecedent rainfall value reaches 40 mm at the Gallyaaral station, approximately 60 mm at Mingchukur and 90 mm at Chimgan (Table 3). Interestingly, there is always a chance that a rainfall event of sufficient magnitude could induce mudflows, even when the antecedent index is lower than the levels above. The results indicate that a weather type with a high level of relative moisture may provide sufficient rainfall to trigger floods and mudslides even when the cumulative rainfall value is close to 0 or soil moisture storage is in deficit. In contrast, after a long period of accumulation of antecedent rainfall, which weakens the slope gradually, the slope becomes more susceptible to the lower value of rainfall on a given day and this could trigger a mudflow event.
Table 3Threshold probabilities (10 %, 50 % and 90 %) inducing mudflow events at four stations (Gallyaaral, Chimgan, Mingchukur and So'x); ra – antecedent rainfall index (mm); r – daily rainfall value (mm).
Some mudflow events were recorded when the rainfall level and antecedent rainfall index showed less than 10 mm. This could possibly be induced by snowmelt due to a joint occurrence of sudden temperature rises and rainfall. Conversely, local heavy rainfall events in the areas adjacent to the stations could induce flows and mudslides in the river catchment and hilly areas.
Figure 14d shows that the So'x station area located in the Fergana Valley is more susceptible to extreme mudflow events, indicating that mudflow events are also influenced by the geomorphologic structure of the area. The 0.1 probability threshold indicates that 10 mm of rainfall with antecedent conditions of less than 30 mm can trigger flash floods or mudflows in So'x. This means that the threshold varies in space and it is important to consider the regional characteristics of the research area whilst applying the ADRM.
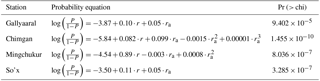
Table 4 provides logistic regression equations for the data from the four stations, which can be used to estimate the rainfall thresholds with different probabilities of mudflow occurrences. For Chimgan station a cubic regression and for Mingchukur a quadratic equation with probability curves proved to be the best fit; however, probability envelopes of the linear regression worked satisfactorily for the data of the other stations, namely Gallyaaral and So'x. Associated values of a chi-squared test represented in Table 4 show the significance of model fitting for the station data.
5.2 Application of ADRM for each CWT
In this section, the ADRM fit for each CWT class is examined in order to identify precipitation thresholds triggering mudflow events under each weather type for the four stations (Gallyaaral, Chimgan, Mingchukur and So'x) located in areas with a high probability of mudflow events in Uzbekistan. For this purpose, all rainfall days with an amount of ≥0.1 mm and the calibrated antecedent rainfall were divided into each weather type. Observed mudflow events in areas were marked with the weather type. Data for the summer periods (March–August) of 1984–2013 by using CWT and ADRM together with LRM were used to construct mudflow-triggering precipitation thresholds for each CWT class (Fig. 15).
Table 4Rainfall threshold probability equations of mudflow occurrences in selected areas (P – probability, r – daily rainfall, ra – antecedent rainfall, Pr (> chi) – chi-squared results for the regions).
The probability envelopes on C, W and SW days at all stations show consistently positive results, each resembling a regional overlaid threshold to trigger an extreme mudflow event. Following the above airflows, the antecedent rainfall index associated with the A circulation has a sufficient magnitude to trigger mudflows even when the antecedent index and the rainfall value are less than the regional threshold for the Gallyaaral, Chimgan and So'x stations (Fig. 15). It is assumed that the A hybrids, mainly anticyclonic westerly (ACW) and anticyclonic south-westerly (ACSW), initiate significantly more mudflow probability than purely A flow. Another interesting observation is that the overlaid threshold probabilities for mudflow events under the NW airflow in Chimgan, So'x and Mingchukur indicate that similar or lower values of antecedent and daily rainfall records of regional probability can trigger mudflow occurrence there. The NE (except in Fergana Valley, Fig. 15), E, SE and S flows had little or no precipitation to affect mudflow in the study area. Threshold probability tests computed for rainfall data for each CWT for four individual stations over the period from 1984 to 2013 are given in Table A3.
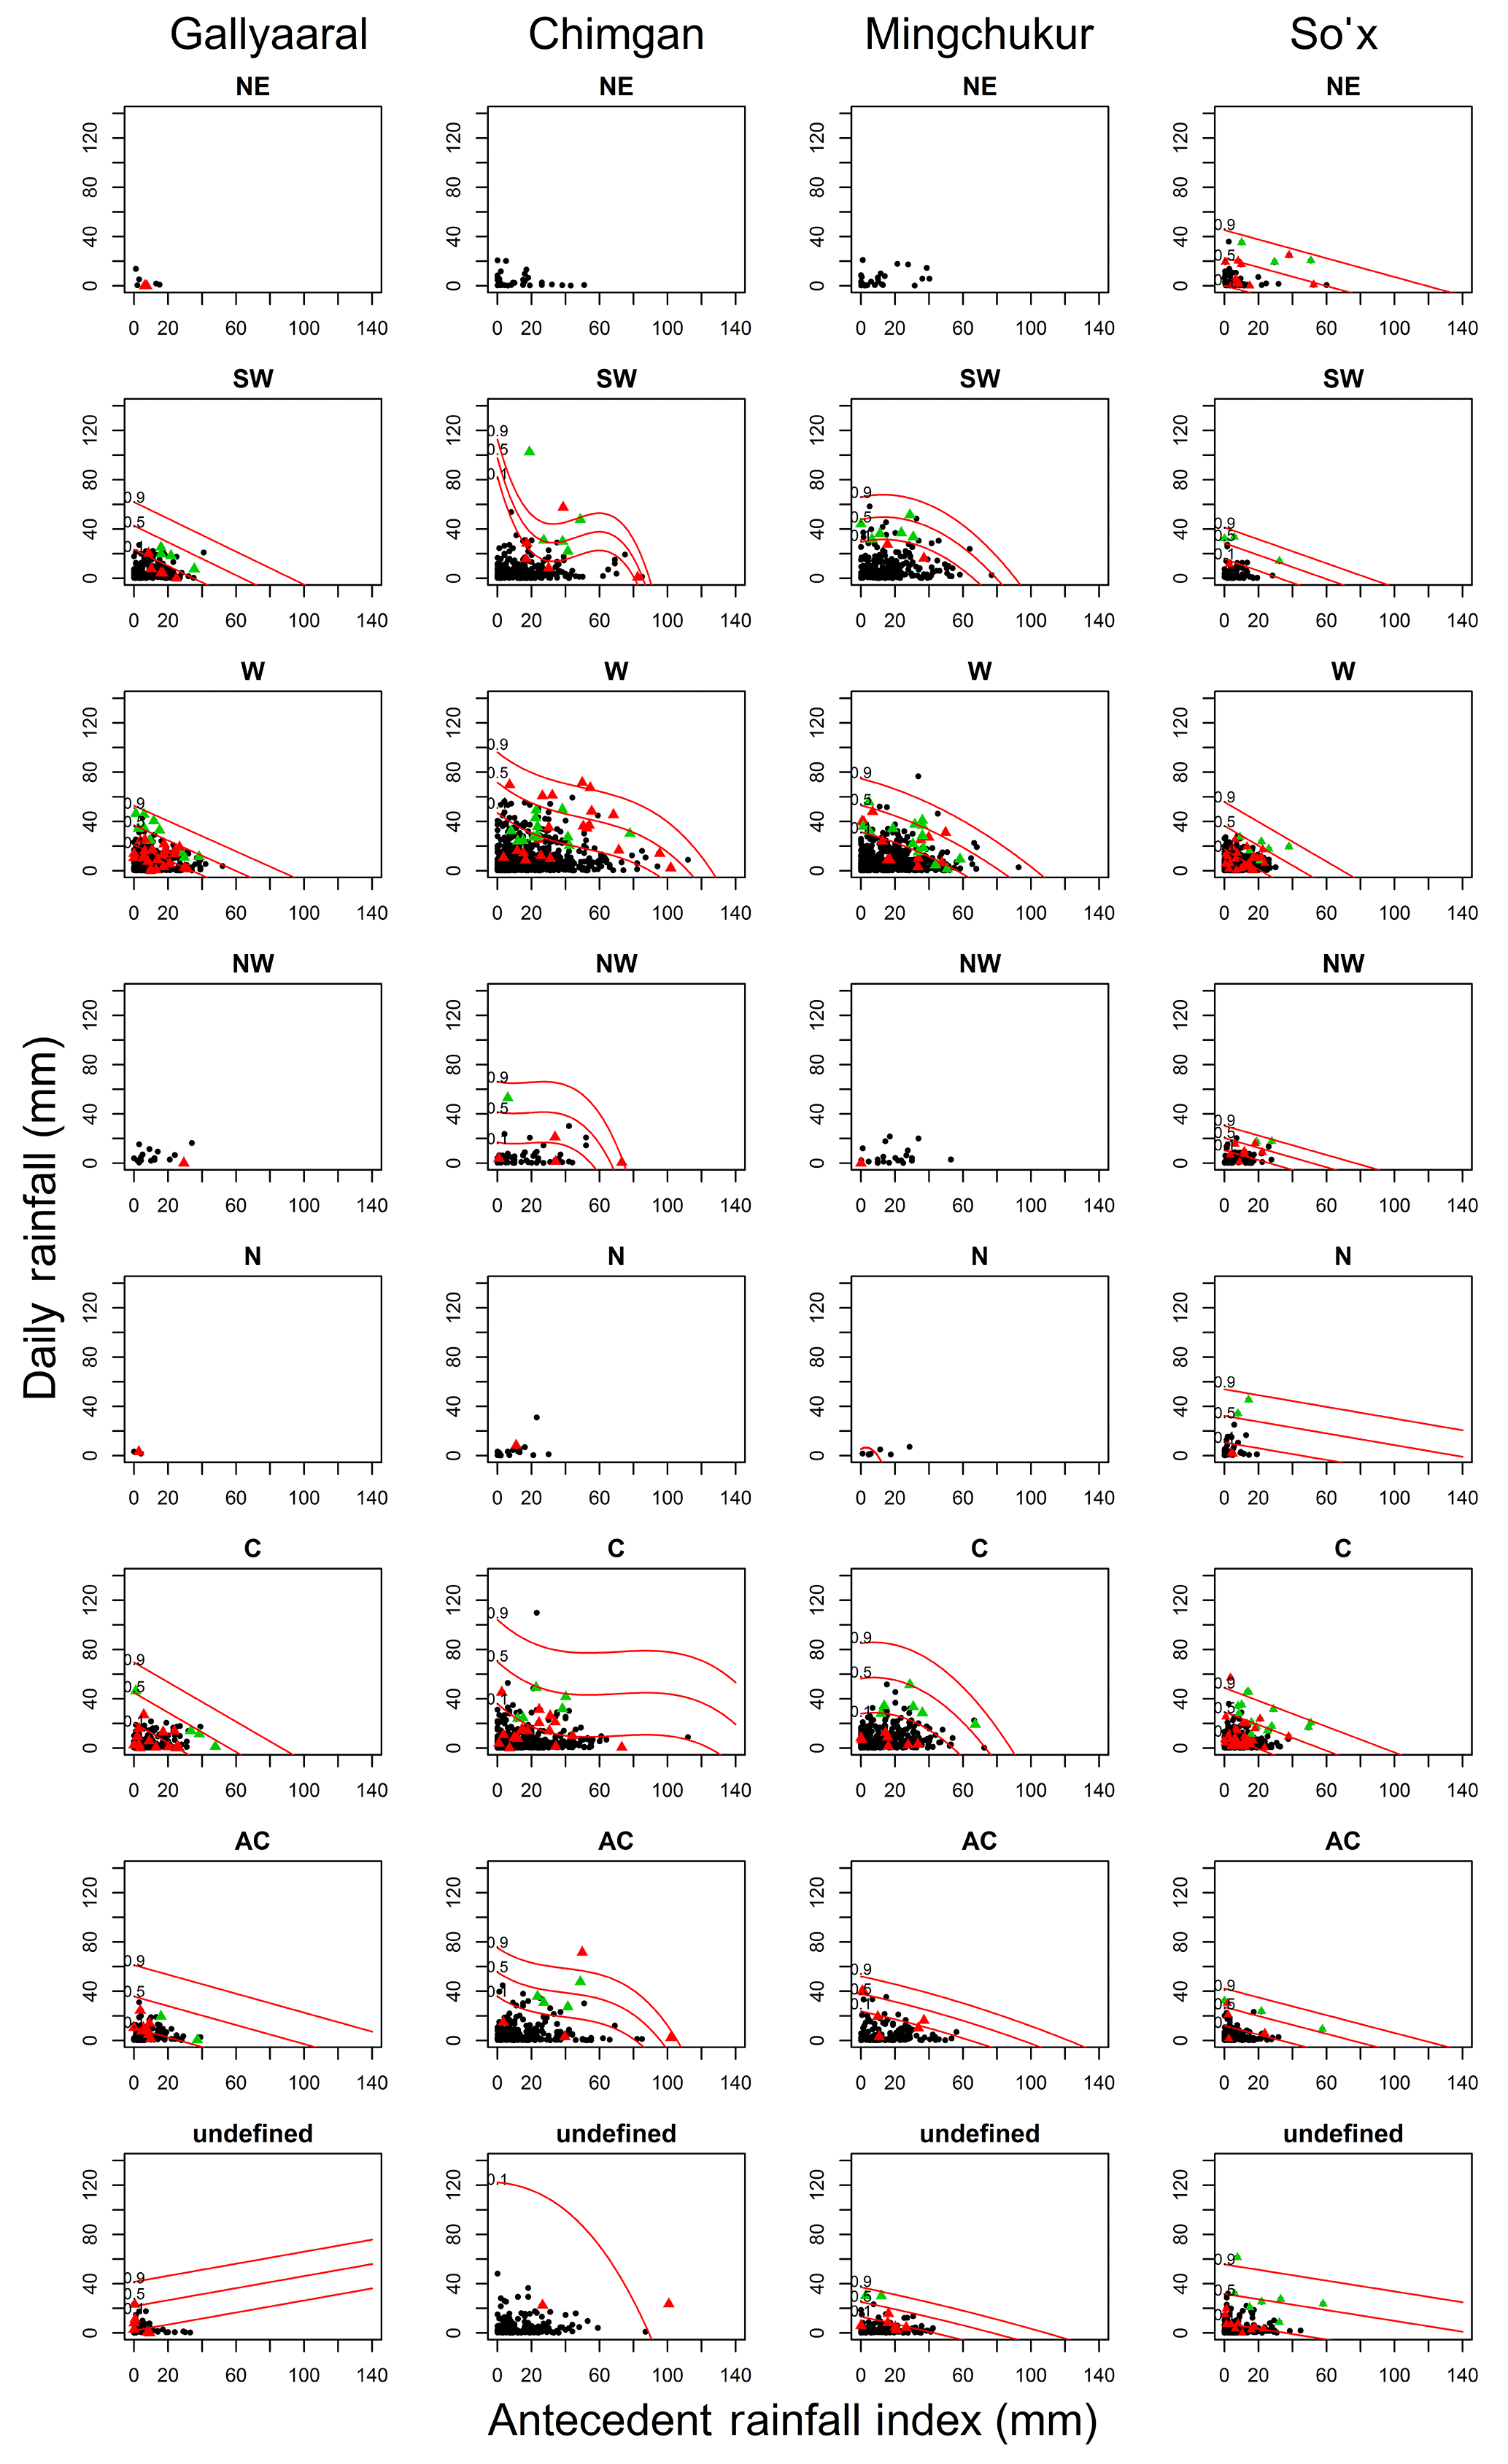
Figure 15Threshold probabilities initiating mudflow occurrences for each CWT class at the stations Gallyaaral, Chimgan, Mingchukur and So'x (panel columns) for the period of March–April 1984–2013. The black dots are days without mudflow, the green triangles are days with probable mudflow and the red triangles are days with initiated mudflow occurrences in the study area. Red lines and curves indicate the 0.1, 0.5 and 0.9 probability thresholds triggering mudflow occurrences for each CWT class.
This study attempts to identify more sensitive weather types that trigger mudflow events in Uzbekistan, using the CWT approach and an ADRM. The relative importance of each CWT to induce mudflows varies considerably and includes antecedent rainfall index and the daily precipitation value. Results from this study confirm that W, SW, C, NW and the A hybrids (associated with W and SW flows) are the main drivers of the interannual variability in precipitation patterns and are responsible for the rainfall-induced mudflow cases, depending on the region, in Uzbekistan on a synoptic scale. This confirms the core findings of the synoptic classification by Bugayev. The CWT objective approach proves to be a useful tool to address questions of anthropogenic climate change with model data.
Extreme precipitation events in Uzbekistan are responsible for about 90 % of documented historical mudflows, especially in the warm season (March–August), for the years 1870–2014. What are the main precipitation-supporting weather types inducing mudflows in the study area? In the present study, mudflows and their relationship with precipitation and weather types were investigated using multiple and coherent systematic approaches for Uzbekistan. This is especially important as only a few studies have investigated atmospheric circulation conditions and precipitation variability on different spatial scales over Uzbekistan. The principal findings of this study are as follows.
-
Advection of moist and relatively cold air from the west, as classified in the SWT classification by Bugayev et al. (1957), was revealed as the dominant synoptic situation inducing mudflows. This result is consistent with the findings of Aizen et al. (2004), thus confirming that westerly advection is the predominant synoptic-scale driver for precipitation climatology in central Asia. This analysis was performed by adopting a manual assessment methodology of mudflow-generating weather conditions on a synoptic scale based on SWT catalogues. Historical synoptic charts have not yet been fully digitized by Uzhydromet; thus manual assessment was the preferred methodology.
Even though assessment of weather situations by means of SWT may identify plausible synoptic-scale flow characteristics triggering mudflows, this subjective approach does not consider any mesoscale conditions over the study area. Therefore, additional information of smaller-scale features such as terrain-induced flow modulations (Stucki et al., 2012) merits further analysis.
-
The relationships and related variables explaining the spatial distribution of precipitation, obtained with an objective CWT approach, defined the four weather classes west (W), south-west (SW), cyclonic (C) and north-west (NW) as the main drivers of precipitation characteristics on a regional scale. This allows a positive evaluation of the CWT method in principle.
Furthermore, CWT findings are in line with results from Reyers et al. (2013), who evaluated spatial patterns and annual cycles of precipitation using the CWT scheme for CA. Interestingly, the westerly airflow in Reyers et al. (2013) was split into two subgroups, as W1 (distinct zonal flow) and W2 (negative 700 hPa GPH gradient). NE and E as well as SE and S were combined. In general, it was found that probability of precipitation was much higher for C, CWT W2, N and SW airflows during the summer. However, the highest rainfall probability and precipitation amount was attributed to the rare CWT NE–E weather type (Reyers et al., 2013). In our study as well, NE weather type, despite its low frequency for the selected grid point, revealed a high probability of precipitation patterns that could trigger mudflow events in Fergana Valley (Figs. 10–11d, 12b, 13b, 15). Fergana Valley, which has a better representation of topography, presumably makes a case of particular interest with the findings in previous studies. According to Schiemann et al. (2008) it can be assumed that on smaller spatial scales, the influence of topography on precipitation climatology over CA is paramount. Small et al. (1999) and Reyers et al. (2013) both confirm this.
In general, the ability of CWT to describe the large-scale circulations in the lower troposphere over Uzbekistan was satisfactory. However, it produces a fairly high frequency of undefined weather classes showing a strong seasonality and, particularly during summer, relatively large amounts of precipitation. It could possibly be attributed to the impact of mesoscale features such as orographically induced lifting and frontogenesis and thus variations in atmospheric dynamics (Buzzi et al., 1998). Gevorgyan (2013) argued that the objective circulation classification scheme does not always identify frontal processes over mountain regions correctly, which makes the objective scheme less suitable to classify differences in the atmospheric circulation in areas with complex topography or when the sub-synoptic scale is effected by the orography in elevated areas, even though the scheme is suitable for large-scale circulation patterns.
-
By means of the antecedent rainfall model, we could identify regional differences in the probabilities of precipitation thresholds causing mudflow events. However, sparse data on actual mudflows and uncertainty over probable mudflow occurrences could be the main factors regarding the uncertainty in model building (Glade et al., 2000). Nevertheless, our identified thresholds deliver reasonable and well-justified results and form a benchmark for any further study for this region. Our antecedent daily rainfall model (ADRM) results further corroborate findings by Trofimov (2006), who used Pearson correlations to calculate rainfall thresholds for triggering mudflows in Fergana Valley. For the So'x area, he suggested a 0.5 probability of mudflow events in the case that daily precipitation reaches 22.3 mm. This value falls in the lower envelope of the 0.5 probability threshold identified for Fergana Valley in our study (Fig. 14). However, regional thresholds cannot be applied easily to neighbouring areas due to additional natural variables influencing mudflows such as geologic, geomorphologic and hydrologic factors as well as slope aspect and land use.
-
A combination of three statistical approaches (CWT, ADRM and LRM) revealed that when the W, C and SW directional flow classes occurred over Uzbekistan, the higher precipitation amount (a characteristic of these directional flows) and antecedent rainfall could trigger mudflow episodes and increase their magnitude and probability.
Thus, it can be concluded that the CWT approach and ADRM produced robust results, despite the orographic influence on the study area and the limited data on mudflow timing and precipitation intensity. Future investigation will focus on regional downscaled seasonal and annual precipitation, with observed data for each CWT, preferably W, C, SW and NW stream flows, to identify key factors of future precipitation distributions and to discover how this will affect mudflow occurrences on a longer timescale and how it will be impacted by climate change.
For access and general information on the reanalysis dataset used in this study see https://www.ecmwf.int/en/computing/access-computing-facilities (last access: 29 October 2018, Dee et al., 2011).
Table A1Mudflow disasters causing fatalities and other relative damages over the period of 2005–2014 in Uzbekistan (data source: Uzhydromet)
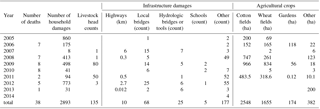
Table A2Synoptic weather types (SWTs) of central Asia and general weather characteristics over the region and in Uzbekistan. SWTs 1–9, 9a and 10–11 were classified by Bugayev et al. (1957); types 9b and 12–15 were added later by the researchers of the Hydrometeorological Scientific Institute in Uzbekistan.
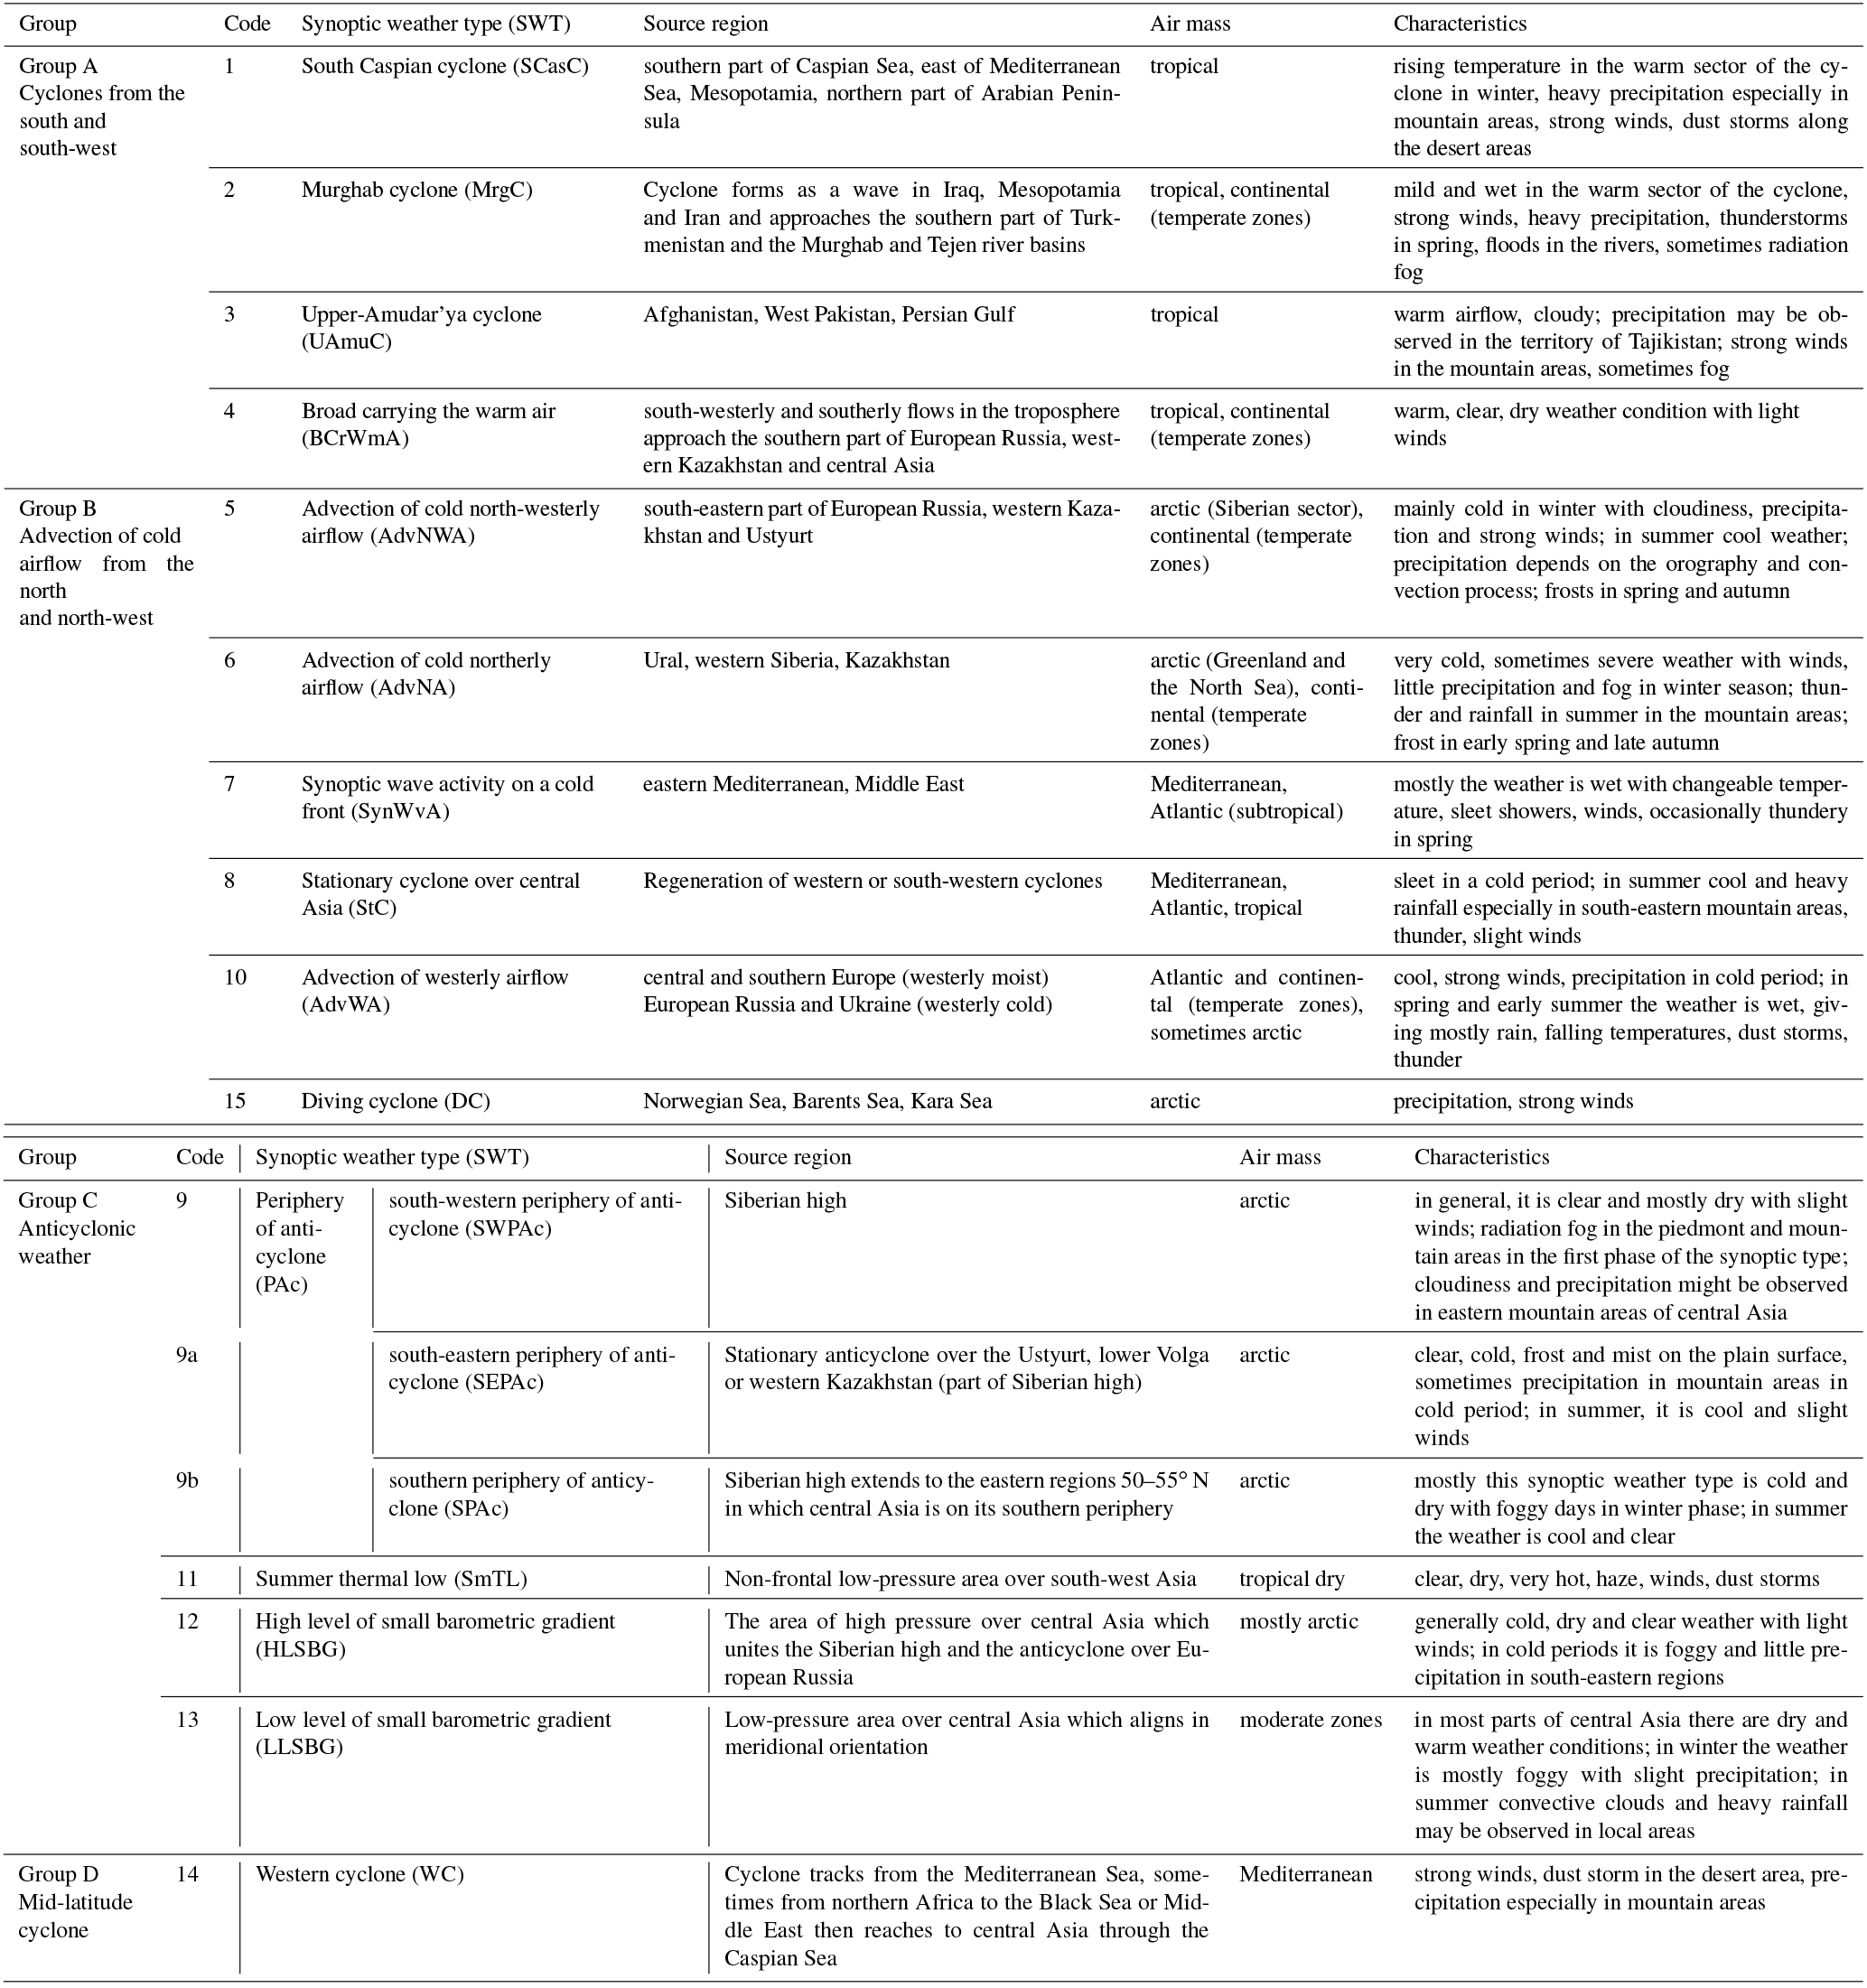
Table A3Threshold probability (10 %, 50 % and 90 %) values initiating mudflow episodes for each CWT for individual stations in Uzbekistan; ra – antecedent rainfall index (mm), r – daily rainfall value (mm).
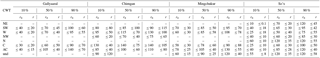
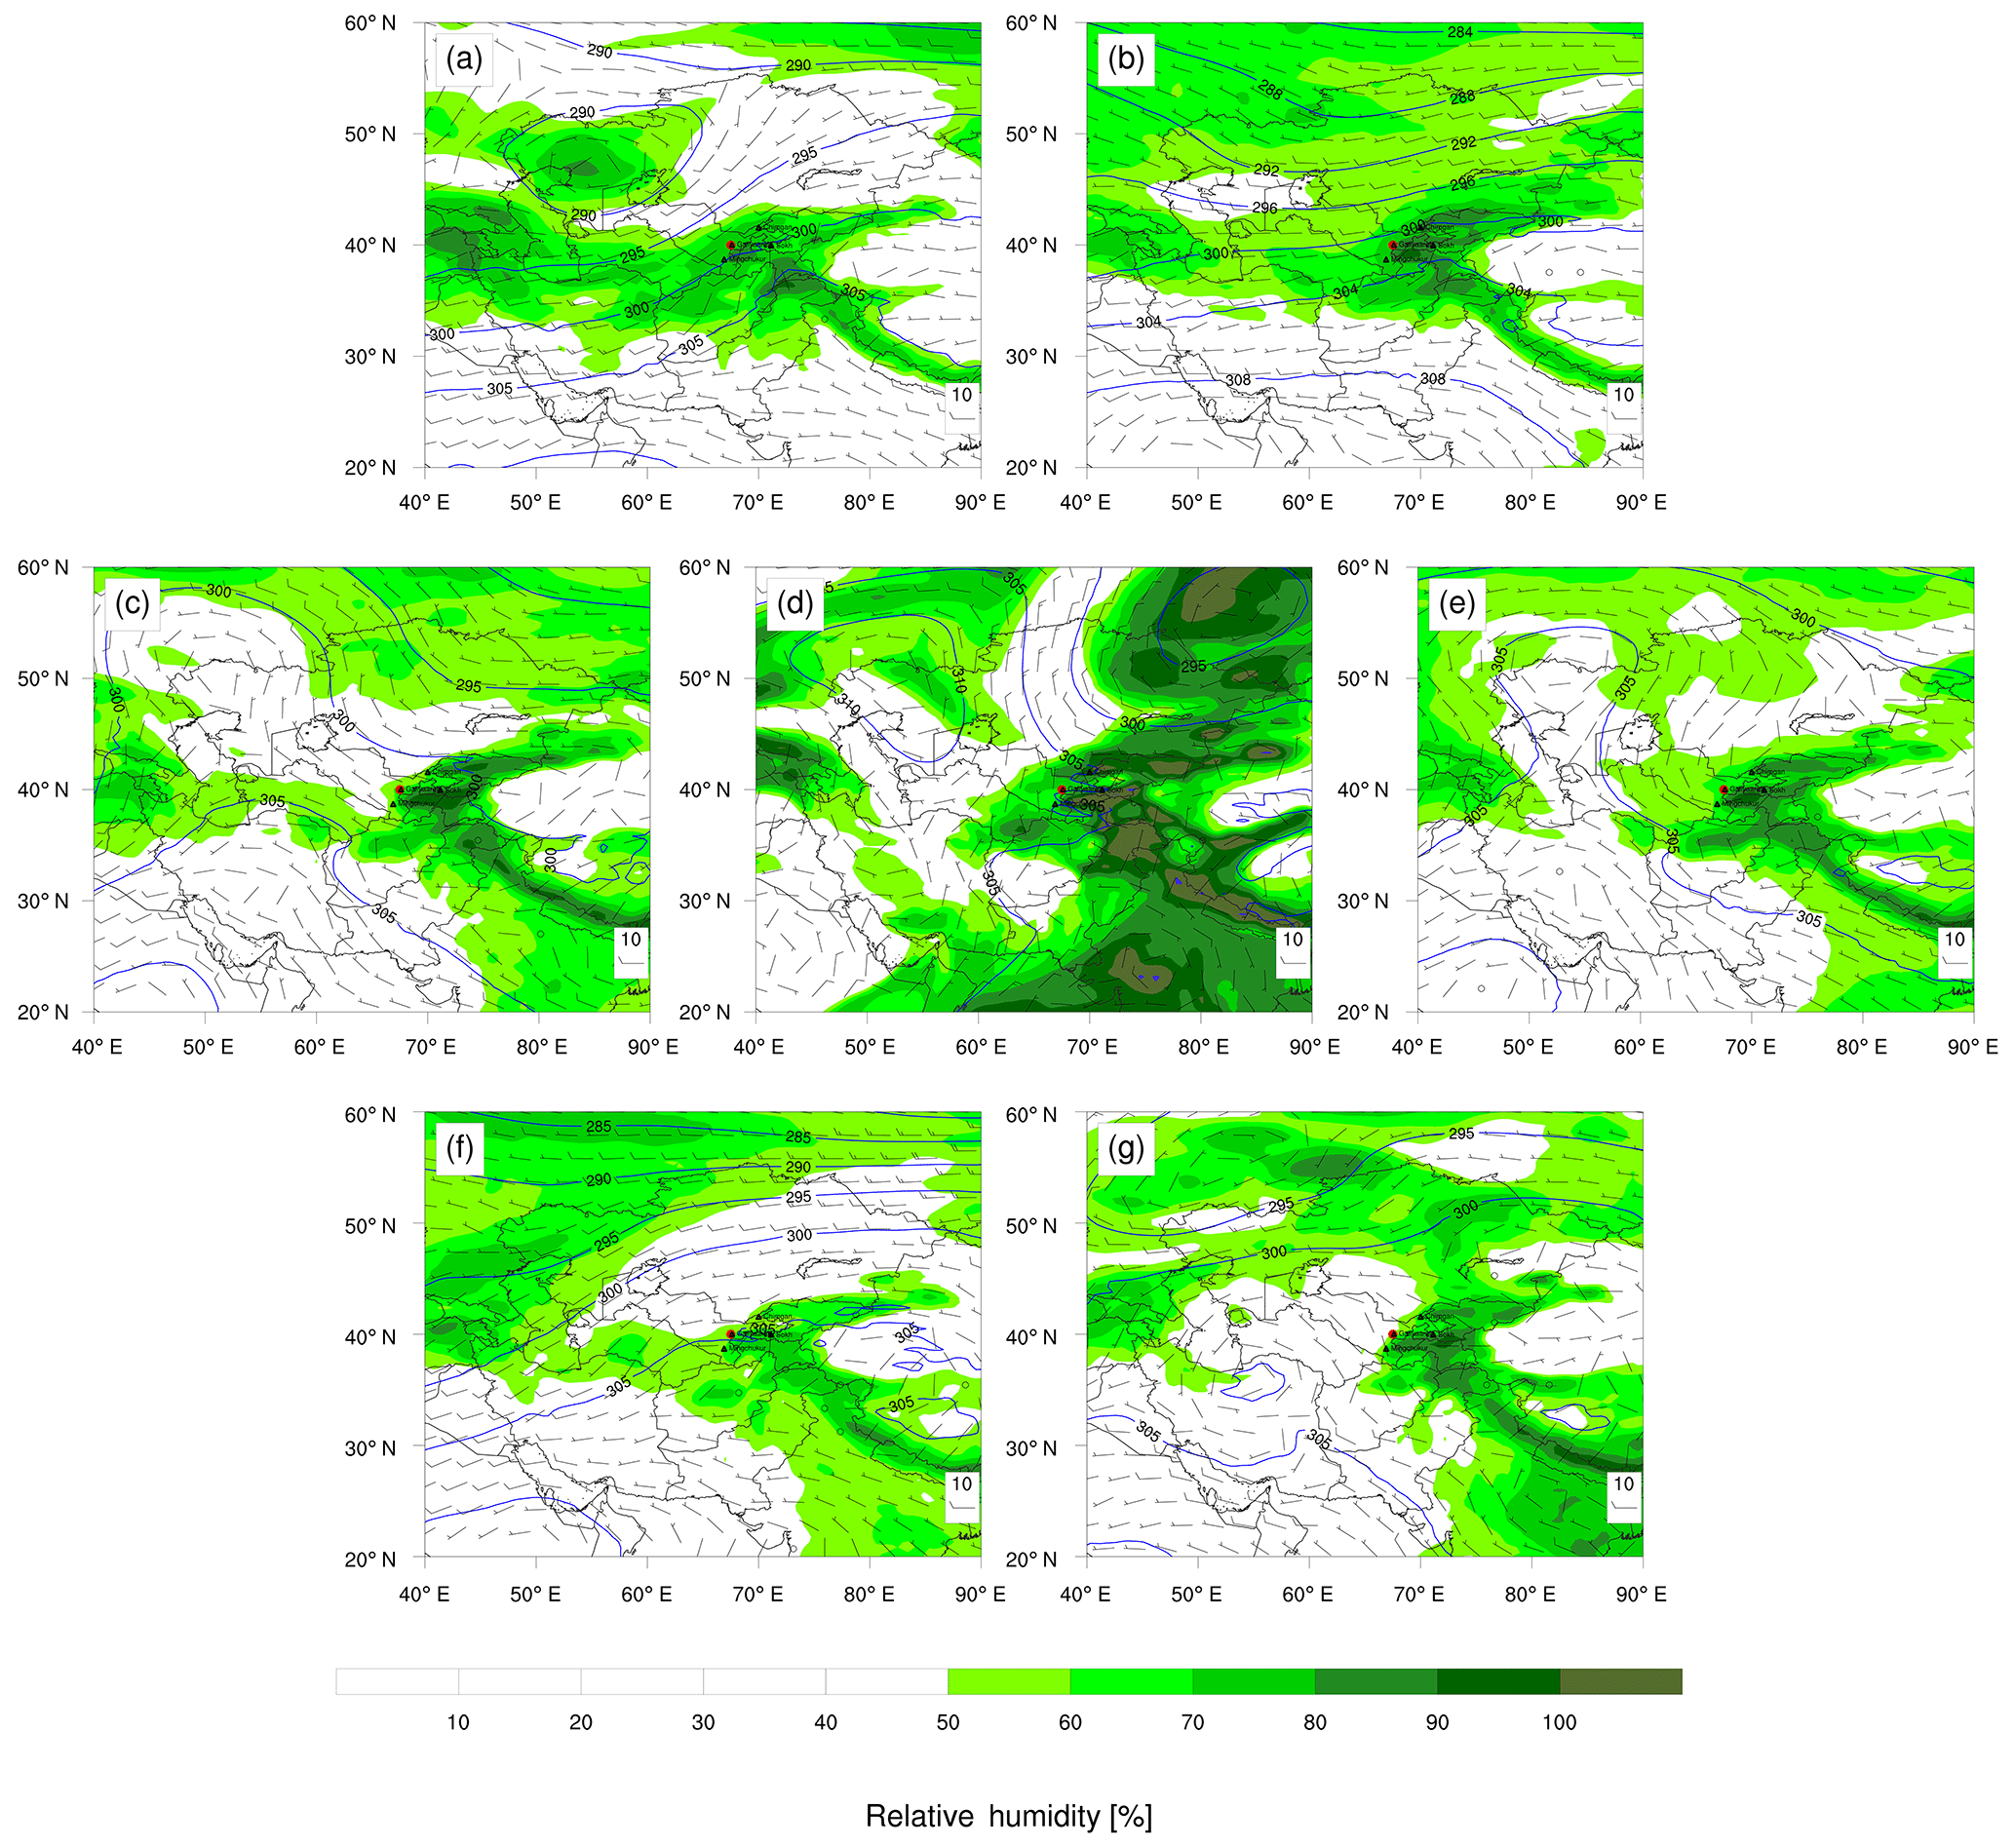
Figure A1CWT south-west (a), west (b), north-west (c), north (d), cyclonic (e), anticyclonic (f) and undefined (g) weather type characteristics on the mudflow days occurring in the Chirchik–Akhangaran basin for the period of 1984–2013. ERA-Interim 700 hPa geopotential height, relative humidity and wind component were used to produce this figure.
The research objective was proposed by GCL and GM. GM performed all data analysis and visualization and wrote the initial manuscript with input from all authors. SW contributed to the CWT algorithm and computational experiments. MAW constructed the LRM algorithm and edited the paper. GCL supervised and directed the research and contributed to the analysis and design of the findings of this work and participated in the revision process of the paper.
The authors declare that they have no conflict of interest.
We are grateful to Uzhydromet for sharing the mudflow and daily
meteorological data. We are also grateful to ECMWF for granting access to the
ERA-Interim reanalysis data. Gavkhar Mamadjanova expresses her gratitude to
Islamic Development Bank (IDB) for awarding her with a PhD scholarship.
Sections 3 and 4.1 of this paper are fragments from the MSc thesis of Gavkhar
Mamadjanova at the National University of Uzbekistan (NUUz). Gavkhar
Mamadjanova expresses her sincere gratitude to the late Professor Gennady N.
Trofimov at the Department of Geography, NUUz, and to Boris K. Tsarev at
Uzhydromet for their guidance and encouragement throughout and after her MSc
program. Gavkhar Mamadjanova also sincerely appreciates Irina B. Zaytseva,
Gulnoza Khamdamova and Natalya Panteeva from Uzhydromet for their timely
inputs with regards to data clarification. Gavkhar Mamadjanova's special
thanks are extended to Nicolas Kirchner Bossi and Mohammad Alharbi
(University of Birmingham) for their assistance with programming. The authors
would like to thank the two anonymous reviewers for their insightful and
constructive comments, which greatly improved the quality of the
article.
Edited by: Ricardo
Trigo
Reviewed by: two anonymous referees
Aizen, V. B., Aizen, E. M., Melack, J. M., Kreutz, K. J., and Cecil, L. D.: Association between atmospheric circulation patterns and firn-ice core records from the Inilchek glacierized area, central Tien Shan, Asia, J. Geophys. Res.-Atmos., 109, D08304, https://doi.org/10.1029/2003JD003894, 2004.
Aksarin, S. I. and Inagamova, S. I.: Sketches of Hydrometeorology in Central Asia, Gidrometeoizdat, Saint-Petersburg, 440 pp., 1993 (in Russian).
Bai, S., Wang, J., Thiebes, B., Cheng, C., and Yang, Y.: Analysis of the relationship of landslide occurrence with rainfall: a case study of Wudu County, China, Arab. J. Geosci., 7, 1277–1285, https://doi.org/10.1007/s12517-013-0939-9, 2014.
Bruce, J. P. and Clark, R. H.: Introduction to Hydrometeorology, Pergamon Press, 319pp., 1966.
Bugayev, V. A.: Climate in Central Asia and Kazakhstan, Academy of Sciense of the Uzbek SSR, Tashkent, 24 pp., 1946 (in Russian).
Bugayev, V. A., Giorgio, V. A., Kozik, E. M., Petrosyants, M. A., Pshenichniy, A. Y., Romanov, N. N., and Chernisheva, O. N.: Synoptic processes of Central Asia, Academy of Science of Uzbek SSR, Tashkent, 477 pp., 1957 (in Russian).
Buzzi, A., Tartaglione, N., and Malguzzi, P.: Numerical Simulations of the 1994 Piedmont Flood: Role of Orography and Moist Processes, Mon. Weather Rev., 126, 2369–2383, https://doi.org/10.1175/1520-0493(1998)126<2369:nsotpf>2.0.co;2, 1998.
Bykov, V. D. and Vasil'yev, A. V.: Hydrometry, Gidrometeoizdat, Leningrad, 448 pp., 1977 (in Russian).
Caine, N.: The Rainfall Intensity: Duration Control of Shallow Landslides and Debris Flows, Geogr. Ann. A., 62, 23–27, https://doi.org/10.2307/520449, 1980.
Chub, V. Y.: Climate change impacts on hydrometeorological processes, agro climatic and water resources of the Republic of Uzbekistan, Voris Nashriyot, Tashkent, 133 pp., 2007 (in Russian).
Chub, V. Y., Trofimov, G. N., and Merkushkin, A. S.: Mudflows in Uzbekistan, Uzhydromet, Tashkent, 109 pp., 2007 (in Russian).
Crozier, M. J.: Landslides: Causes, Consequences and Environment, CROOM HELM, London, 252 pp., 1986.
Crozier, M. J. and Eyles, R. J.: Assessing the probability of rapid mass movement, Third Australia – New Zealand Conference on Geomechanics, Wellington, 1980.
Davydov, L. K., Dmitriyeva, A. A., and Konkina, N. G.: General Hydrology, 2nd edn., Gidrometeoizdat, Leningrad, 1973 (in Russian).
Dee, D. P., Uppala, S. M., Simmons, A. J., Berrisford, P., Poli, P., Kobayashi, S., Andrae, U., Balmaseda, M. A., Balsamo, G., Bauer, P., Bechtold, P., Beljaars, A. C. M., van de Berg, L., Bidlot, J., Bormann, N., Delsol, C., Dragani, R., Fuentes, M., Geer, A. J., Haimberger, L., Healy, S. B., Hersbach, H., Hólm, E. V., Isaksen, L., Kållberg, P., Köhler, M., Matricardi, M., McNally, A. P., Monge-Sanz, B. M., Morcrette, J.-J., Park, B.-K., Peubey, C., de Rosnay, P., Tavolato, C., Thépaut, J.-N., and Vitart, F.: The ERA-Interim reanalysis: configuration and performance of the data assimilation system, Q. J. Roy. Meteor. Soc., 137, 553–597, https://doi.org/10.1002/qj.828, 2011.
Donat, M. G., Leckebusch, G. C., Pinto, J. G., and Ulbrich, U.: European storminess and associated circulation weather types: future changes deduced from a multi-model ensemble of GCM simulations, Clim. Res., 42, 27–43, https://doi.org/10.3354/cr00853, 2010.
Elsner, J. B. and Jagger, T. H.: Hurricane Climatology. A Modern Statistical Guide Using R, Oxford University Press, New-York, 373 pp., 2013.
Gevorgyan, A.: Main types of synoptic processes and circulation types generating heavy precipitation events in Armenia, Meteorol. Atmos. Phys., 122, 91–102, https://doi.org/10.1007/s00703-013-0270-8, 2013.
Gheusi, F. and Davies, H. C.: Autumnal precipitation distribution on the southern flank of the Alps: A numerical-model study of the mechanisms, Q. J. Roy. Meteor. Soc., 130, 2125–2152, https://doi.org/10.1256/qj.03.06, 2004.
Giorgio, V. A. and Bugayev, V. A.: Classification of the atmospheric circulation in Central Asia, Meteorology and Hydrology, 6, 72–74, 1936 (in Russian).
Glade, T.: Establishing the frequency and magnitude of landslide-triggering rainstorm events in New Zealand, Environ. Geol., 35, 160–174, https://doi.org/10.1007/s002540050302, 1998.
Glade, T., Crozier, M., and Smith, P.: Applying Probability Determination to Refine Landslide-triggering Rainfall Thresholds Using an Empirical “Antecedent Daily Rainfall Model”, Pure Appl. Geophys., 157, 1059–1079, https://doi.org/10.1007/s000240050017, 2000.
Gravina, T., Figliozzi, E., Mari, N., and De Luca Tupputi Schinosa, F.: Landslide risk perception in Frosinone (Lazio, Central Italy), Landslides, 14, 1419–1429, https://doi.org/10.1007/s10346-016-0787-2, 2017.
Guzzetti, F., Peruccacci, S., Rossi, M., and Stark, C. P.: The rainfall intensity–duration control of shallow landslides and debris flows: an update, Landslides, 5, 3–17, https://doi.org/10.1007/s10346-007-0112-1, 2008.
Hosmer, D. and Lemeshow, S.: Applied Logistic Regression, 2nd edn., John Wiley & Sons, Inc., New York, 375 pp., 2000.
Huggel, C., Salzmann, N., Allen, S., Caplan-Auerbach, J., Fischer, L., Haeberli, W., Larsen, C., Schneider, D., and Wessels, R.: Recent and future warm extreme events and high-mountain slope stability, Philos. T. R. Soc. A, 368, 2435–2459, https://doi.org/10.1098/rsta.2010.0078, 2010.
Huggel, C., Khabarov, N., Korup, O., and Obersteiner, M.: Physical impacts of climate change on landslide occurrence and related adaptation, in: Landslides, Types, Mechanisms and Modelling, edited by: Clague, J. J. and Stead, D., Cambridge University Press, Cambridge UK, 121–133, 2012.
Hungr, O., Evans, S. G., Bovis, M. J., and Hutchinson, J. N.: A review of the classification of landslides of the flow type, Environ. Eng. Geosci., 7, 221–238, https://doi.org/10.2113/gseegeosci.7.3.221, 2001.
Hungr, O., Leroueil, S., and Picarelli, L.: The Varnes classification of landslide types, an update, Landslides, 11, 167–194, https://doi.org/10.1007/s10346-013-0436-y, 2014.
Ilinova, E. S.: A register of synoptic processes over Central Asia, 1935–1967, Central Asian Hydrometeorological Scientific Research Institute, Tashkent, 138 pp., 1968 (in Russian).
Inagamova, S. I.: A register of synoptic processes over Central Asia, 1979–1991, Central Asian Hydrometeorological Scientific Research Institute, Tashkent, 56 pp., 1993 (in Russian).
Inagamova, S. I.: A register of synoptic processes over Central Asia, 1992–2012, Uzhydromet, Tashkent, 89 pp., 2013 (in Russian).
Inagamova, S. I., Mukhtarov, T. M., and Mukhtarov, S. T.: General features of synoptic processes of Central Asia, Central Asian Hydrometeorological Scientific Research Institute, Tashkent, 476 pp., 2002 (in Russian).
Jones, P. D., Hulme, M., and Briffa, K. R.: A comparison of Lamb circulation types with an objective classification scheme, Int. J. Climatol., 13, 655–663, 1993.
Jones, P. D., Harpham, C., and Briffa, K. R.: Lamb weather types derived from reanalysis products, Int. J. Climatol., 33, 1129–1139, https://doi.org/10.1002/joc.3498, 2013.
Kenawy, A. M., McCabe, M. F., Stenchikov, G., and Raj, J.: Multi-Decadal Classification of Synoptic Weather Types, Observed Trends and Links to Rainfall Characteristics over Saudi Arabia, Frontiers in Environmental Science, 2, 37, https://doi.org/10.3389/fenvs.2014.00037, 2014.
Khan, Y. A., Lateh, H., Baten, M. A., and Kamil, A. A.: Critical antecedent rainfall conditions for shallow landslides in Chittagong City of Bangladesh, Environ. Earth Sci., 67, 97–106, https://doi.org/10.1007/s12665-011-1483-0, 2012.
Kim, H. J., Sidle, R. C., Moore, R. D., and Hudson, R.: Throughflow variability during snowmelt in a forested mountain catchment, coastal British Columbia, Canada, Hydrol. Process., 18, 1219–1236, https://doi.org/10.1002/hyp.1396, 2004.
Kurbatkin, V. P.: The Role of the geographical features of Central Asia for the formation of precipitation processes, Uzhymet, Tashkent, 128 pp., 2009 (in Russian).
Lamb, H. H.: British Isles Weather Types and a Register of the Daily Sequence of Circulation Patterns, 1861–1971, Geophysics Memoirs, London HMSO, 85 pp., 1972.
Lyakhovskaya, L. F.: Mudflow hazards and its short-term forecasting in the piedmont areas of Uzbekistan, Dissertation on the candidate of Geographical Sciences, Central Asian Hydrometeorological Scientific Research Institute, Tashkent, 190 pp., 1989 (in Russian).
Marques, R., Zêzere, J., Trigo, R., Gaspar, J., and Trigo, I.: Rainfall patterns and critical values associated with landslides in Povoação County (São Miguel Island, Azores): relationships with the North Atlantic Oscillation, Hydrol. Process., 22, 478–494, https://doi.org/10.1002/hyp.6879, 2008.
Petrov, M. A., Sabitov, T. Y., Tomashevskaya, I. G., Glazirin, G. E., Chernomorets, S. S., Savernyuk, E. A., Tutubalina, O. V., Petrakov, D. A., Sokolov, L. S., Dokukin, M. D., Mountrakis, G., Ruiz-Villanueva, V., and Stoffel, M.: Glacial lake inventory and lake outburst potential in Uzbekistan, Sci. Total Environ., 592, 228–242, https://doi.org/10.1016/j.scitotenv.2017.03.068, 2017.
R Core Team: R: A language and environment for statistical computing. R Foundation for Statistical Computing, Vienna, Austria, 2017.
Ramos, A. M., Barriopedro, D., and Dutra, E.: Circulation Weather types as a tool in atmospheric, climate and environmental research, Frontiers in Environmental Science, 3, 44, https://doi.org/10.3389/fenvs.2015.00044, 2015.
Reyers, M., Pinto, J. G., and Paeth, H.: Statistical–dynamical downscaling of present day and future precipitation regimes in the Aksu river catchment in Central Asia, Global Planet. Change, 107, 36–49, https://doi.org/10.1016/j.gloplacha.2013.04.003, 2013.
Rosi, A., Peternel, T., Jemec-Auflič, M., Komac, M., Segoni, S., and Casagli, N.: Rainfall thresholds for rainfall-induced landslides in Slovenia, Landslides, 13, 1571–1577, https://doi.org/10.1007/s10346-016-0733-3, 2016.
Salikhova, D. H.: Aero synoptic conditions of trigerring floods in mountain rivers and prediction the floods for Fergana Valley and Kashkadarya Basin, Dissertation on the candidate of Geographical Sciences, Central Asian Hydrometeorological Scientific Research Institute, Tashkent, 132 pp., 1975 (in Russian).
Sarimsakov, T. A., Giorgio, V. A., and Bugayev, V. A.: Statistical characteristics of synoptic situations for the cold period over the Central Asia, Newsletter of USSR Academy of Science, 6, 451–464, 1947 (in Russian).
Schiemann, R., Lüthi, D., Vidale, P. L., and Schär, C.: The precipitation climate of Central Asia – intercomparison of observational and numerical data sources in a remote semiarid region, Int. J. Climatol., 28, 295–314, https://doi.org/10.1002/joc.1532, 2008.
Sidle, R. C. and Ochiai, H.: Landslides: processes, prediction, and land use, American Geophysical Union, Washington, DC, 312 pp., 2006.
Small, E. E., Giorgi, F., and Sloan, L. C.: Regional climate model simulation of precipitation in central Asia: Mean and interannual variability, J. Geophys. Res.-Atmos., 104, 6563–6582, https://doi.org/10.1029/98JD02501, 1999.
Stucki, P., Rickli, R., Brönnimann, S., Martius, O., Wanner, H., Grebner, D., and Luterbacher, J.: Weather patterns and hydro-climatological precursors of extreme floods in Switzerland since 1868, Meteorol. Z., 21, 531–550, https://doi.org/10.1127/0941-2948/2012/368, 2012.
Trigo, R. M. and DaCamara, C. C.: Circulation weather types and their influence on the precipitation regime in Portugal, Int. J. Climatol., 20, 1559–1581, https://doi.org/10.1002/1097-0088(20001115)20:13<1559::AID-JOC555>3.0.CO;2-5, 2000.
Trofimov, G. N.: Mudflows in Uzbekistan, prediction of catastrophic failure and repeatability of mudflows in the region under climate changes and adaptation measures, National University of Uzbekistan, Tashkent, 32 pp., 2006 (in Russian).
Voynova, T. A. and Inagamova, S. I.: A register of synoptic processes over Central Asia, 1968–1978, Central Asian Hydrometeorological Scientific Research Institute, Tashkent, 49 pp., 1982 (in Russian).
Yamao, M., Sidle, R. C., Gomi, T., and Imaizumi, F.: Characteristics of landslides in unwelded pyroclastic flow deposits, southern Kyushu, Japan, Nat. Hazards Earth Syst. Sci., 16, 617–627, https://doi.org/10.5194/nhess-16-617-2016, 2016.
Zêzere, J. and Rodrigues, M.: Rainfall thresholds for landsliding in Lisbon Area (Portugal), edited by: Rybar, J., Stemberk, J., and Wagner, P., Proceedings of the First European Conference on Landslides, Prague, Czech Republic, 24–26 June, Landslides, 333–338, 2002.
Zêzere, J. L., Trigo, R. M., and Trigo, I. F.: Shallow and deep landslides induced by rainfall in the Lisbon region (Portugal): assessment of relationships with the North Atlantic Oscillation, Nat. Hazards Earth Syst. Sci., 5, 331–344, https://doi.org/10.5194/nhess-5-331-2005, 2005.
- Abstract
- Introduction
- Research approach, data and methods
- Climatic conditions and mudflows in Uzbekistan
- Atmospheric circulation over central Asia and Uzbekistan
- Statistical modelling of precipitation thresholds for triggering mudflows
- Summary and discussion
- Data availability
- Appendix A
- Author contributions
- Competing interests
- Acknowledgements
- References