the Creative Commons Attribution 4.0 License.
the Creative Commons Attribution 4.0 License.
 | 10 Aug 2018
Understanding epistemic uncertainty in large-scale coastal flood risk assessment for present and future climates
Michalis I. Vousdoukas
Dimitrios Bouziotas
Alessio Giardino
Laurens M. Bouwer
Lorenzo Mentaschi
Evangelos Voukouvalas
Luc Feyen
An upscaling of flood risk assessment frameworks beyond regional and national scales has taken place during recent years, with a number of large-scale models emerging as tools for hotspot identification, support for international policymaking, and harmonization of climate change adaptation strategies. There is, however, limited insight into the scaling effects and structural limitations of flood risk models and, therefore, the underlying uncertainty. In light of this, we examine key sources of epistemic uncertainty in the coastal flood risk (CFR) modelling chain: (i) the inclusion and interaction of different hydraulic components leading to extreme sea level (ESL), (ii) the underlying uncertainty in the digital elevation model (DEM), (iii) flood defence information, (iv) the assumptions behind the use of depth–damage functions that express vulnerability, and (v) different climate change projections. The impact of these uncertainties on estimated expected annual damage (EAD) for present and future climates is evaluated in a dual case study in Faro, Portugal, and on the Iberian Peninsula. The ranking of the uncertainty factors varies among the different case studies, baseline CFR estimates, and their absolute and relative changes. We find that uncertainty from ESL contributions, and in particular the way waves are treated, can be higher than the uncertainty of the two greenhouse gas emission projections and six climate models that are used. Of comparable importance is the quality of information on coastal protection levels and DEM information. In the absence of large datasets with sufficient resolution and accuracy, the latter two factors are the main bottlenecks in terms of large-scale CFR assessment quality.
- Article
(7144 KB) - Full-text XML
- BibTeX
- EndNote


Large-scale flood risk assessments have emerged during the last decade, with multiple continental or global studies focussing on fluvial risks (Winsemius et al., 2016; Alfieri et al., 2016, 2017; Dottori et al., 2016b, 2017) and fewer on coastal losses (Hinkel et al., 2014; Hallegatte et al., 2013; Vousdoukas et al., 2018a). The emergence of these assessments comes as a response to the growing demand for up-scaled flood risk estimation under present and future scenarios. Such analyses can support, among others, adaptation planning, policymaking, and applied engineering activities. Despite the eminent usefulness and promising nature of large-scale flood risk modelling frameworks, they are characterized by a certain degree of simplification, which is the result of methodological limitations, computational restrictions, and lack of consistent datasets across these scales. All the above introduce significant uncertainties, affecting the accuracy of the findings.
Of the large-scale fluvial frameworks, notable discussions on model uncertainty appear in the work of Winsemius et al. (2013), who discuss in detail, mainly qualitatively, aspects of climate input and hydrological uncertainty, as well as in the work of Ward et al. (2013), who include a sensitivity analysis to the climatic input and the assumed flood protection standards. Other studies discuss uncertainties related to the extreme value analysis (Wahl et al., 2017; Apel et al., 2008). Some coastal studies discuss the effect of DEM corrections for spatial variations in the mean sea level (Muis et al., 2017) and the inundation modelling approach (Vousdoukas et al., 2016; Breilh et al., 2013; Seenath et al., 2016). However, many of the above factors still remain not fully quantified, especially in a unified framework which would allow the assessment of their relative importance.
Flood risk estimation exhibits methodological differences depending on the scale of application (Apel et al., 2009; Ferreira et al., 2017; de Moel et al., 2015). Local studies benefit from high-quality digital elevation models (DEMs) (Vousdoukas et al., 2012) and exposure data (Christie et al., 2017), as well as detailed numerical models, resolving several scales (Bertin et al., 2014; Giardino et al., 2018) and including complex processes like dune or dike breaching (Plomaritis et al., 2017; de Moel et al., 2012). Large-scale assessments, however, are based on lower-resolution DEMs and exposure data and more abstract conceptualizations of physical processes: principally the hydrology and hydraulics, as well as flood damage processes. In addition, vulnerability information is often limited. At best, quantitative data exist in the form of depth–damage curves (Ward et al., 2013; Hallegatte et al., 2013), but often they are omitted with some studies estimating potential exposure instead of actual quantitative risks (Neumann et al., 2015; Jongman et al., 2012b). Data scarcity is also apparent in the assumptions behind flood management and adaptation options, commonly expressed as flood protection levels. Efforts to present consistent flood protection information for large scales have appeared only recently and are limited to fluvial cases (Scussolini et al., 2016). In coastal settings, information on flood protection remains sparse and heterogeneous, despite recent contributions in multi-case data collection (Jonkman et al., 2013; Vousdoukas et al., 2018a).
In the light of this background, we develop an analytical framework that treats multiple sources of epistemic uncertainty within a large-scale coastal flood risk (CFR), LISCoAsT: a modular, integrated coastal flood risk assessment framework developed by the Joint Research Centre of the European Commission (Vousdoukas et al., 2018a). The analysed factors include (i) the components contributing to extreme sea levels (ESLs), presently focussing on waves and tides; (ii) different algorithms for inundation mapping; (iii) digital elevation model (DEM) data; (iv) coastal flood protection information; (v) vulnerability assumptions; and (vi) different climate change projections. For each one of these sources, variability in CFR estimates is tested through sensitivity analyses among different conceptualizations, ranges of variables, and datasets. The analytical framework is applied for both baseline climate and under future concentration pathways, allowing the assessment of model uncertainty propagation in future CFR projections.
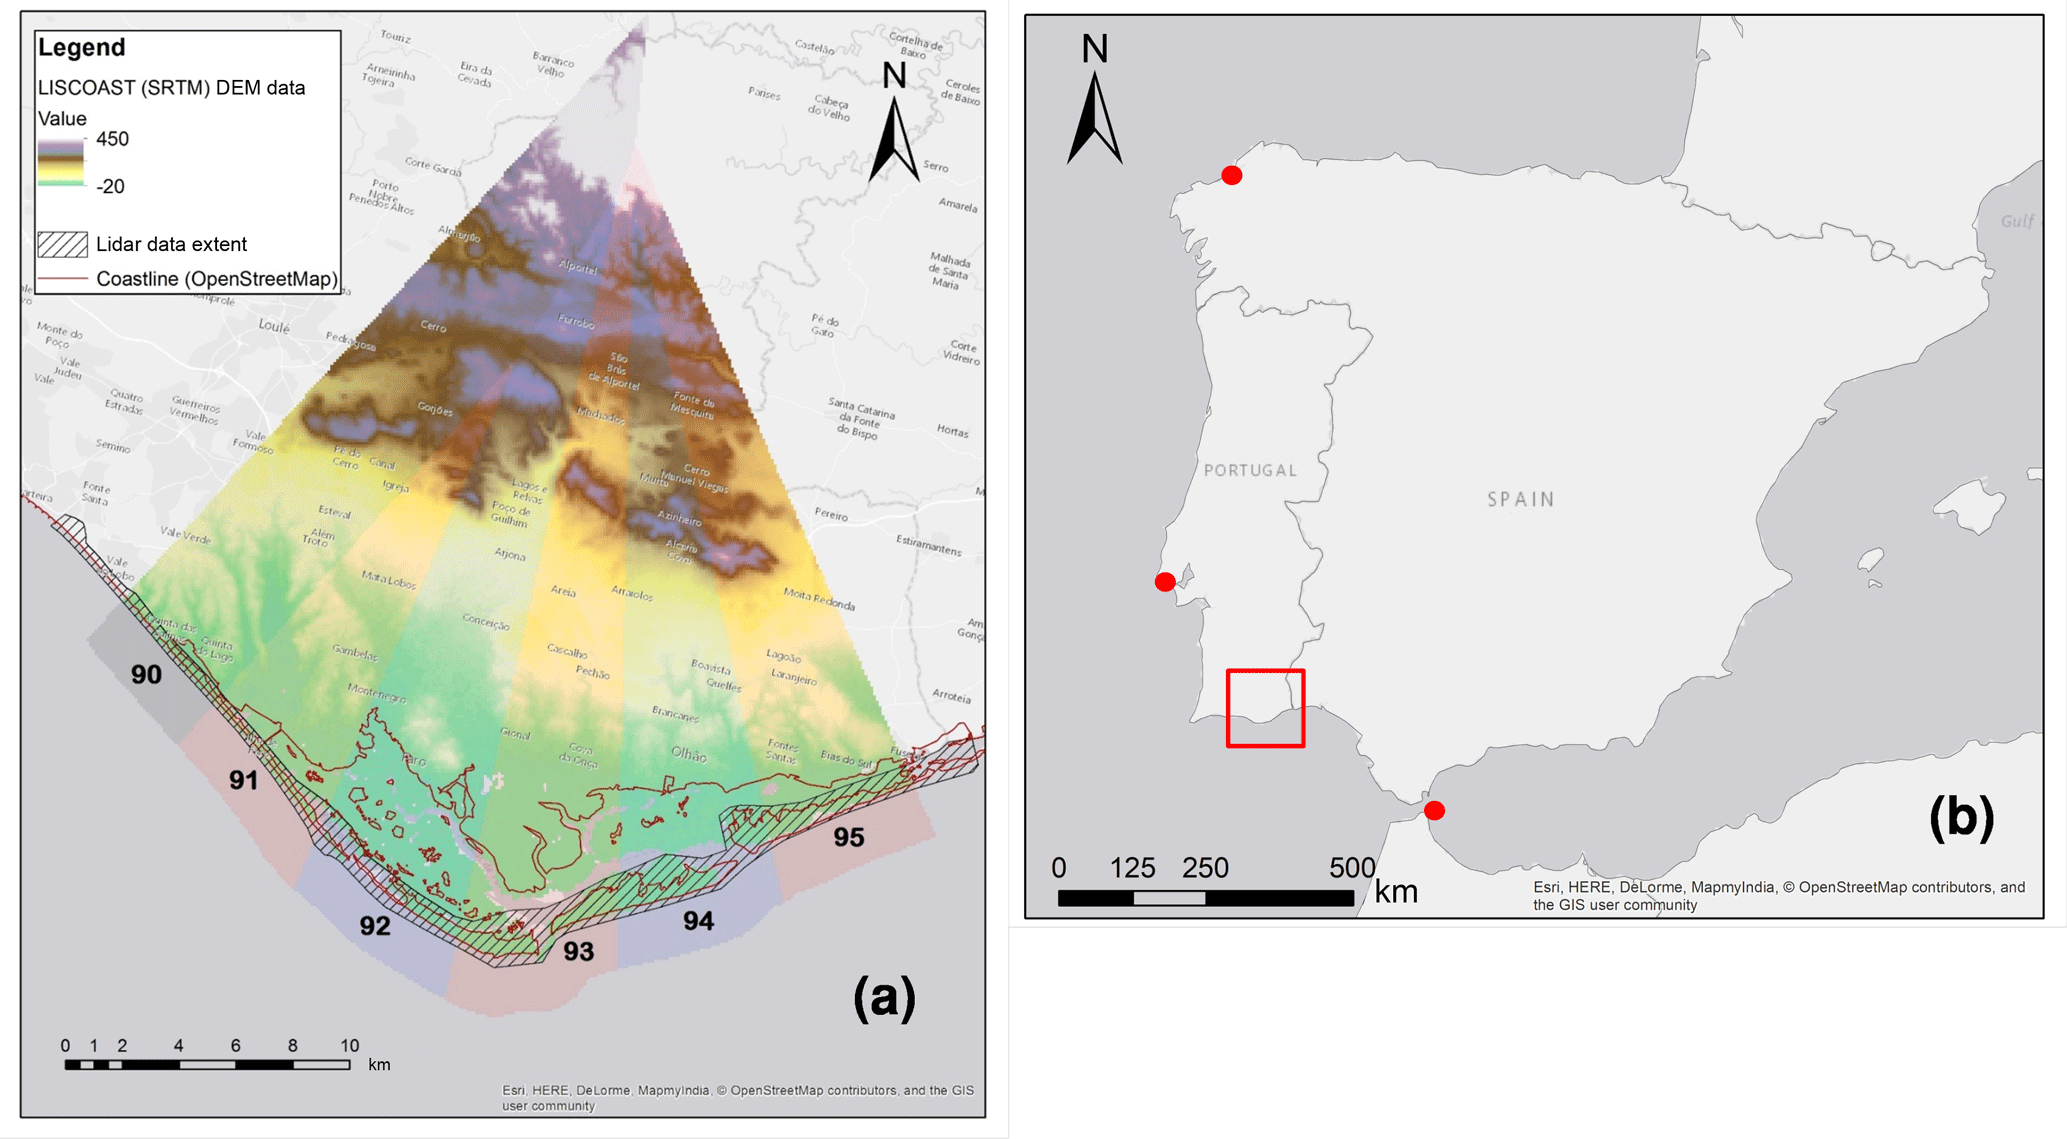
Figure 1Case study areas: (a) Ria Formosa, Algarve, and Portugal. The alternating blue and red areas, numbered 90 to 95, show the basic coastal segments considered in LISCoAsT, while the striped black overlay shows the lidar data extent; (b) the Iberian Peninsula, with Ria Formosa highlighted.
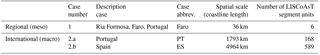
The developed framework is applied in a dual case study that spans two spatial scales and consists of (i) a local application in Ria Formosa, Algarve, Portugal, a coastal stretch of approximately 36 km, and (ii) a regional application along the Iberian Peninsula coastline, including Portugal and Spain, with a total coastal length of 6767 km (Fig. 1 and Table 1).
Iberia is selected as an interesting macro-scale study, featuring an extended coastline, with varying environments, like the wave- and tidally dominated northeast Atlantic and the micro-tidal, less energetic Mediterranean Sea. The coastline features extensive tourist and recreational uses and a large number of exposed assets, contributing around 10 % of the total flood damage for Europe (Vousdoukas et al., 2018a).
The local case study consists of the tidal lagoon and barrier island system of Ria Formosa in Faro, Portugal. It combines oceanic waves and a tidal range of up to 3 m (Vousdoukas, 2014). Apart from the complex topography (Vousdoukas, 2012), it faces socio-economic challenges, with dense infrastructure and conflicting uses, such as an airport and tourist and wildlife areas. Ria Formosa also provides a test bed for sensitivity analysis due to the availability of a variety of in situ measurements, including high-resolution topographic data from a lidar survey.
To optimize the calculations, the study areas are divided into segments with a length of 25 km along the coastline. This results in six segments for Ria Formosa and over 700 segments for the Iberian Peninsula (Fig. 1, Table 1).
3.1 The LISCoAsT methodology
The present analysis is based on the CFR model LISCoAsT (Large scale Integrated Sea-level and Coastal Assessment Tool; Fig. 2). The modular framework aims to assess weather-related impacts in coastal areas in present and future climates by combining state-of-the-art large-scale modelling and datasets of hazard, exposure, and vulnerability (Fig. 1) (Vousdoukas et al., 2018a). The present application focusses on direct, tangible losses from flooding by seawater, which typically dominates total impacts when expressed in economic terms.
Table 2Overview of the considered climate change scenarios and return periods in the present study.
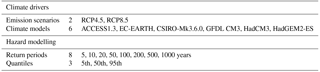
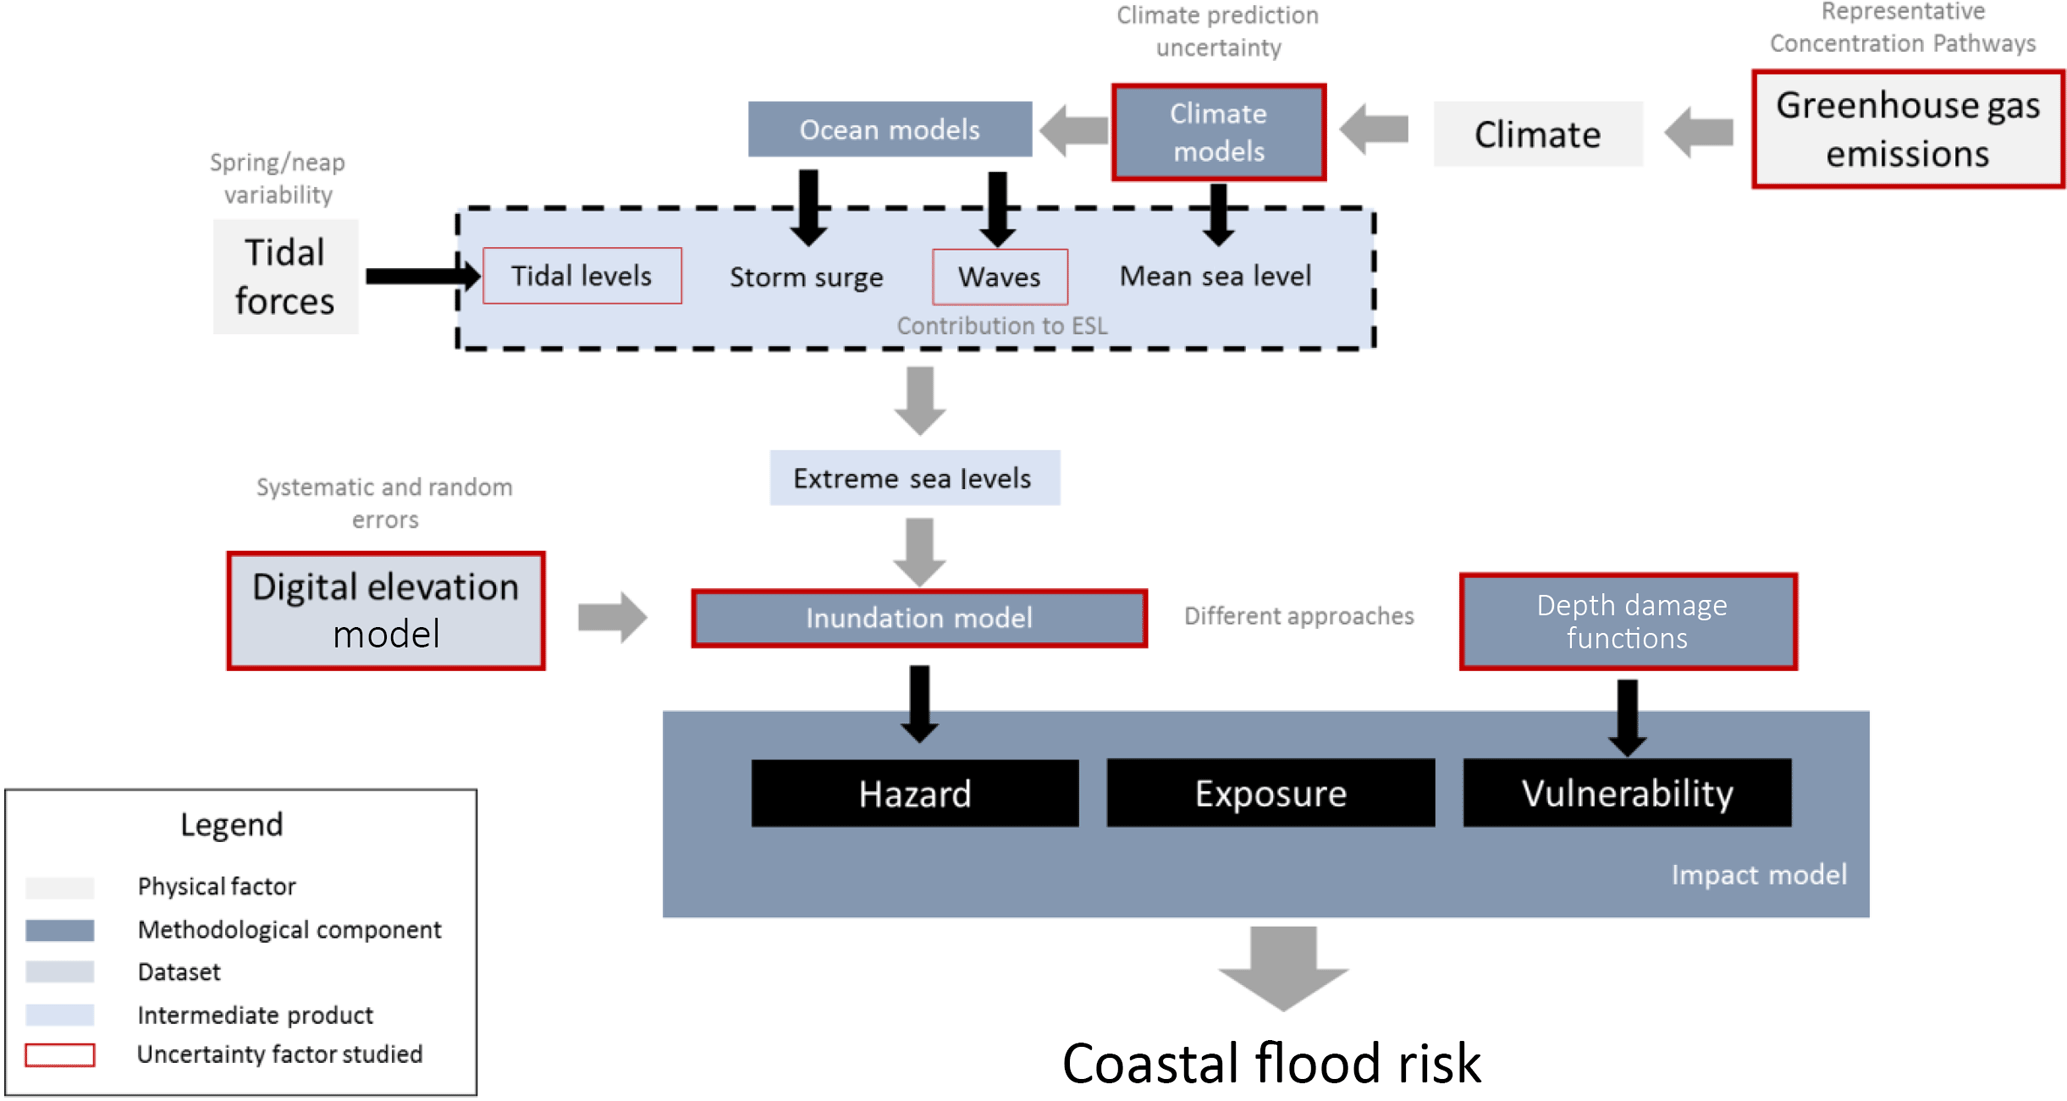
Figure 2The risk assessment chain of LISCoAsT with the studied sources of epistemic uncertainty highlighted in red.
3.2 Extreme sea levels
Coastal flood impacts are driven by nearshore ESLs. In this study they are available every 25 km along the European coastline and every 10 years during the present century for Representative Concentration Pathways (RCPs) scenarios RCP4.5 and RCP8.5 as simulated by six climate models (see Table 2), and for eight different return periods between 2 and 1000 years (Vousdoukas et al., 2017). ESLs are calculated by linearly adding the contributions of different components:
where
-
SLR is the sea level rise, obtained from a global climate model (GCM) ensemble combined with contributions from ice sheets and ice caps (Vousdoukas et al., 2017).
-
ηCE is the contribution from extreme wind and atmospheric pressure, driving waves, and storm surge and is obtained for present and future scenarios from dynamic ocean simulations (Mentaschi et al., 2017; Vousdoukas et al., 2017) and are available for the specified return periods T, after non-stationary extreme value analysis (Mentaschi et al., 2016). Given that waves are often omitted in large-scale impact assessments, we evaluate the resulting error from this assumption (see Sect. 3.2.1).
-
ηtide is the maximum tidal level.
3.2.1 Coastal inundation
ESLs are used as forcing for the inundation calculations at 100 m resolution and are based on land surface elevation data provided from the Shuttle Radar Topography Mission (SRTM) DEM (Reuter et al., 2007). The inundation calculations are limited to 50 km from the coastline. For the present study the following algorithms are considered (Vousdoukas et al., 2016):
A static, “bathtub” approach (SH), in which the inundation water depth in every raster cell is computed as the difference between the terrain elevation and the forcing ESL, as long as these cells are hydraulically connected to the sea.
A quasi-dynamic algorithm that takes into account the volume of water available for inundation (VI). This approach is presented as “SO” in Breilh et al. (2013) and assumes a design hydrograph driven by meteorological factors that is added to the high-tide water level to calculate the time-dependent total water level. The design storm surge hydrograph requires information about the extreme event duration DCE. This is obtained after analysing the hydrographs of all extreme events at each coastal point and correlating DCE with the peak ηCE through a linear function (Vousdoukas et al., 2016). ESL time series can thus be converted into flow discharge and whenever the ESL exceeds the flood protection elevation, inundation initiates. Since the flood duration is limited by the hydrograph, so is the effective flood water volume VIeffective. The final step is to apply the SH method but incrementally increasing the forcing water level until the inundation volume is equal to VIeffective.
In all cases, inundation maps per segment overlap to take into account propagation of the flood field into neighbouring segments. Therefore, the final inundation maps are generated based on the maximum flood depth estimated for each 100 m cell.
3.2.2 Impact assessment
The resulting inundation maps are combined with exposure and vulnerability information to estimate direct flood damages (Vousdoukas et al., 2018a). Exposure is available from the refined CORINE Land Cover (CLC) dataset at 100 m resolution, featuring 44 different land use classes (Batista e Silva et al., 2012). The vulnerability to coastal flooding of coastal infrastructure, societies, and ecosystems is expressed through depth–damage functions (DDFs) (Rojas et al., 2013; Alfieri et al., 2015). DDFs define for each of the 44 land use classes of the refined CLC the relation between flood inundation depth and direct damage. The country-specific DDFs were further rescaled at the NUTS3 level based on 2010 gross domestic product per capita to account for differences in the spatial distribution of wealth within countries. Areas that lie below the high-tide water level are considered to be fully damaged and the maximum loss according to the DDFs is applied. For areas inundated during extreme events, the damage is estimated by applying the DDFs combined with the simulated inundation depth for the respective events.
The impact assessment was performed at a 100 m spatial resolution and the year 2010 is considered to be a reference year with consequent time steps of 10 years until the end of the century. For each point in time the potential impacts are first estimated for each of the considered return periods. The expected annual damage (EAD) is then estimated by integrating the resulting damage probability curves.
3.3 Exploring uncertainties
3.3.1 Tidal contributions to ESLs
Equation (1) uses a single value for the tidal contribution to ESLs, i.e. equal to the maximum tidal amplitude ηtide. This assumes that all extreme weather events coincide with the highest possible tide, thus ignoring spring-neap tidal variability. To investigate the limitations of this modelling assumption, a ηtide modulation factor α is introduced in Eq. (1):
Given that extreme events normally last several hours, they coincide at least once with high tide, the height of which depends on spring-neap tidal variability. The valid range of α was estimated after exploring possible combinations of extreme events with tidal signals in a stochastic way through the following steps.
Historical tide gauge records obtained from the UHSLC global tide gauge database (http://uhslc.soest.hawaii.edu, last access: 29 April 2016) were used to provide time series of tidal elevations from one tidal gauge in Portugal and two in Spain, one in the Mediterranean and one in the Atlantic (see Fig. 1a). An annual slice with the lowest possible number of missing values (less than 3 % of the total tidal record) is then extracted and used in the following analysis.
Stochastic ηCE hydrographs as described in Sect. 3.1.2 are superimposed on the obtained tidal signals, based on a preset seasonal distribution typical of European coastal storms (Menéndez and Woodworth, 2010; see also approach of Lozano et al., 2004). This superimposition is considered a random event, assuming that the starting hour of the storm tstart is a random variable within the annual duration of the tidal signal that follows the aforementioned seasonal distribution. For each synthetic ηCE event, the maximum tidal amplitude that is observed during this event is isolated – as representative of the worst-case ηCE+ηtide combination and the factor α is calculated. A sample size of 104 events is chosen and a Monte Carlo analysis is performed, leading to the empirical distribution of the α factor, from which the mean value E(α) is retained as a representative single estimate.
The above analysis showed that a valid range for α was within . In order to estimate how the variability in α affects the estimated losses, we conducted the impact analysis increasing the parameter with an increment of dα=0.1.
3.3.2 Wave contributions to ESLs
Omitting contributions from waves to ESLs is a common abstraction in large-scale CFR assessments, even though wave contributions can be important depending on the nearshore wave climate (Serafin and Ruggiero, 2014; Vousdoukas et al., 2016; Melet et al., 2018). To investigate the effects of this omission we consider the wave set-up contributions to ESLs. These are estimated using the approximation of ηwave=0.2Hs (Camfield, 1991), with Hs being the significant offshore wave height, available from a global wave reanalysis (Mentaschi et al., 2017). The wave contribution is then added to the storm surge levels to produce new ηCE values contributing to ESLs through Eq. (1).
3.3.3 Inundation algorithms
This section relates to flood inundation modelling methodological simplifications and underlying assumptions detailed in Sect. 3.1.2. For the two different approaches presented (SH and VI) inundation maps are derived and used to estimate and compare EADs.
3.3.4 Digital elevation model
Global DEMs like the 100 m SRTM affect the quality of large-scale assessments by (i) simplifying the terrain relief, (ii) adding systematic bias, and (iii) not resolving natural or artificial coastal protection elements. To appraise the above uncertainties we use high-quality 0.5 m resolution lidar nearshore elevation data available for Faro Beach (Vousdoukas et al., 2012). In order to quantify the effect of DEM resolution on CFR assessment, we create four alternative DEMs by resampling the lidar dataset in 10, 20, 50, and 100 m resolution and we compare against the SRTM DEM in terms of both vertical elevation and the resulting EADs. Given that the computation cost of the inundation analysis increases exponentially with DEM resolution, in contrast with the other uncertainty factors, the comparison is restricted only to the median baseline scenario.
3.3.5 Coastal flood protection
Global DEMs lack the resolution to resolve coastal protection elements (see also Sect. 4.1), which is often treated as a sub-grid process and is explicitly parameterized either in the inundation (Vousdoukas et al., 2016) or in the impact assessment module (Alfieri et al., 2017). As is usually the case in large-scale impact assessments (Scussolini et al., 2016), a uniform crest level zcrest is considered along each coastal segment. Consequently, flooding is activated only when zcrest is exceeded by the forcing ESLs. Given that protection information is scarce and when available comes with low detail and accuracy, it is an important source of uncertainty. Therefore, a sensitivity analysis is performed increasing zcrest within a range from 0.0 to 2.0 m, with an increment of dz=0.5 m and the resulting EADs are compared. Similar to the tidal elevation uncertainty analysis (see Sect. 3.2.1), the range of the applied zcrest perturbation was based on the observed errors of reported flood protection levels against in situ measurements (Scussolini et al., 2016; Paprotny and Terefenko, 2017).
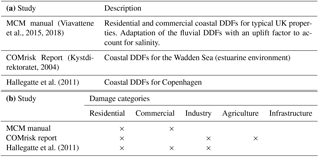
Table 3Information on previously reported DDFs developed for coastal applications (a) and land use classes which they consider (b).
3.3.6 Vulnerability
Vulnerability is expressed through DDFs (see Sect. 3.1.3) that were initially derived for fluvial flood risk (referred to as DDFL) estimation and as a result do not account for factors such as wave forces and salinity. The choice of the DDFs is justified by the fact that they have been calibrated and validated at a pan-European scale with satisfactory results (Jongman et al., 2012a). We formulate an alternative set of DDFs (DDFA) based on a number of smaller-scale coastal studies (Table 3). Among the five main land use categories of DDFL, we have compiled and produced updated DDFA information for four (residential, commercial, industrial, and agricultural), while for infrastructure no new DDFs could be derived due to a lack of data. We apply the same contribution of the main land use categories to the different CLC land use classes as for DDFL to arrive at the updated DDFA for each CLC land use class.
The functions in DDFA have a sharper concave form compared to DDFL, leading to a higher damage percentage for smaller depths (Fig. 3). Both vulnerability datasets are used to perform comparative runs in the studied cases and the resulting EAD is compared.
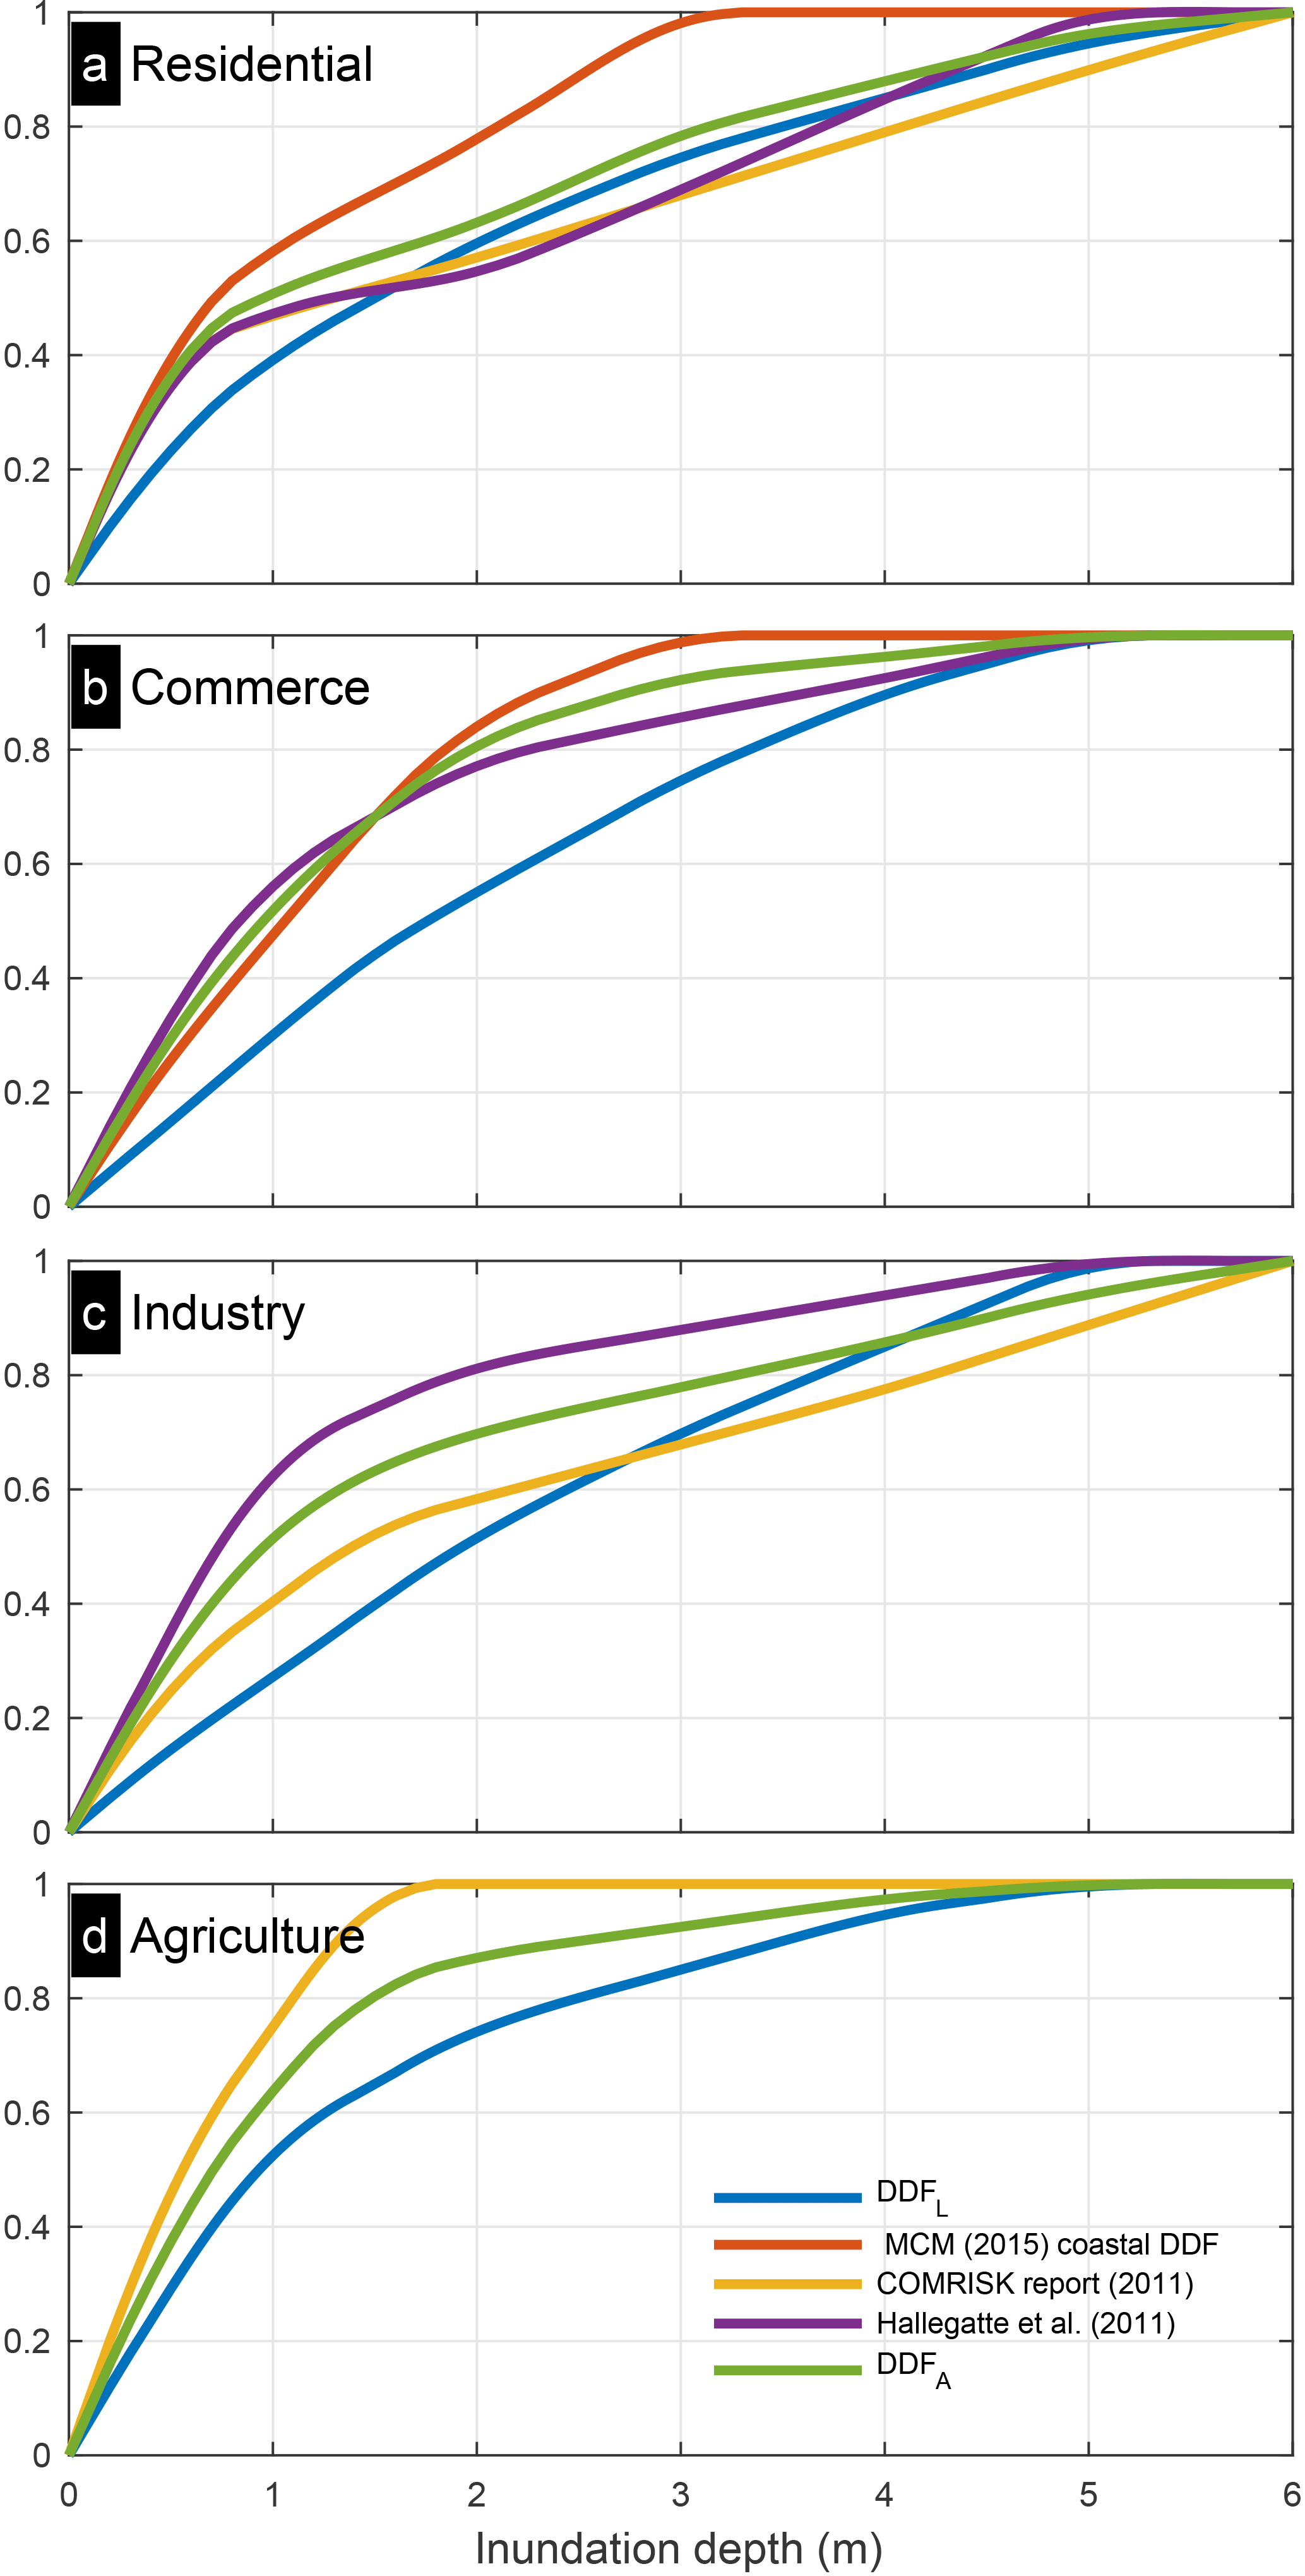
Figure 3Comparisons of the standard DDFs used in LISCoAsT (DDFL, averaged over Spain and Portugal) against the compiled ones from previous coastal applications (see also Table 3) and the final modified ones used for the sensitivity analysis (DDFA). Values in the vertical axis indicate the fraction of maximum damage.
3.3.7 Assessing the relative importance of the uncertainty factors
We consider the following set-up as the “default” one: ESLs considering the maximum tide and no waves, inundation maps estimated with VI, DEM derived from 100 m SRTM, flood protection from FLOPROS, and standard LISCoAsT DDFs (DDFL). Then we assess how varying each uncertainty factor separately affects the amplitude and temporal evolution of the estimated EAD for each study area. In order to focus only on the effect of the factor studied we average the median case from each RCP studied. In addition, we estimate the “very likely” range (5th–95th quantile) of the default set-up for each RCP to obtain an estimate of the uncertainty related to future greenhouse gas emissions and climate prediction.
To gain further insight into the relative importance of each uncertainty factor, we first consider only results for the baseline period. Varying one parameter at a time, we create groups of EAD estimates. The deviation of the median EAD of the group from the default set-up EAD expresses the effect of the uncertainty factor to the estimated losses, while the range of the EAD values expresses the introduced uncertainty. In addition we create similar groups but only for both the absolute (ΔEAD) and percentage change (ΔEAD %) towards the end of the century. The range of each group is considered to be a proxy of the uncertainty from each factor.
4.1 Digital elevation model
Considering the lidar DEM as ground truth, we assess the accuracy of the SRTM dataset along Ria Formosa (Fig. 4). Subsampling the lidar dataset at 100 m resolution, we find an average vertical bias of 1.20 m and RMSE of 2.15 m for SRTM. Such error is significant for the scope of the study but is lower compared to previously reported estimates (Rodríguez et al., 2006) since SRTM accuracy has improved since then. An important artefact introduced by the SRTM relates to the fact that the 100 m resolution does not resolve the dune profile; therefore the coastal protection in the study area is underestimated. This is similar for DEMs generated after subsampling the lidar dataset; in the case of Ria Formosa a resolution of a minimum of 20 m is needed to resolve the dune structure (Appendix A; Fig. A1). This highlights that for CFR studies considering such coarse resolutions, coastal protection should be dealt with as a sub-grid process that needs parameterization.
Results for DEMs of different resolutions confirm that the DEM's accuracy and abstraction substantially affect the estimated losses. In the case of Ria Formosa, reducing the DEM resolution appears to result in higher losses. However, this can be a site-specific effect of the local topography and demands further research before drawing more general conclusions. The EAD from the 100 m lidar DEM is more than double the one from SRTM and almost triple the 10 m lidar DEM (with parameterized coastal protection) (Fig. 4c). It is noteworthy that the 10 m lidar DEM is comparable with the EAD from SRTM, but this is only due to the site-specific calibration of the coastal protection based on previous studies (Vousdoukas et al., 2012). For most areas such datasets are not available and deviations in the estimated losses can be substantially higher.
4.2 Coastal protection
As expected, raising the flood defences reduces the estimated EAD (Figs. 5a, 6a). However, considering future CFR, the effect of higher protection on the projected EAD is non-linear, especially in the case of Ria Formosa (Fig. 5a). An additional 0.5 m of protection (Δzprotection) does not have any risk reduction effect. This is due to the low protection standards in place, as the area is known to experience damages almost annually (Almeida et al., 2011a, b), while the most frequent event analysed here has a return period of 5 years. Δzprotection=1 m results in lower EAD; however, after 2040 the damages tend to converge towards the default case, becoming equal after 2070. Apparently this “saturation” is a combined result of the small geographic extent of the Ria Formosa site, which can therefore be rather easily completely flooded, and the low-lying terrain. The case of Δzprotection=1.5 m is similar to Δzprotection=1 m with the difference that the initial EAD reduction is much higher and the convergence with the default case takes place only towards the end of the century. Finally, with coastal defences upgraded by 2 m, the EAD remains below baseline levels of the default case until 2050.
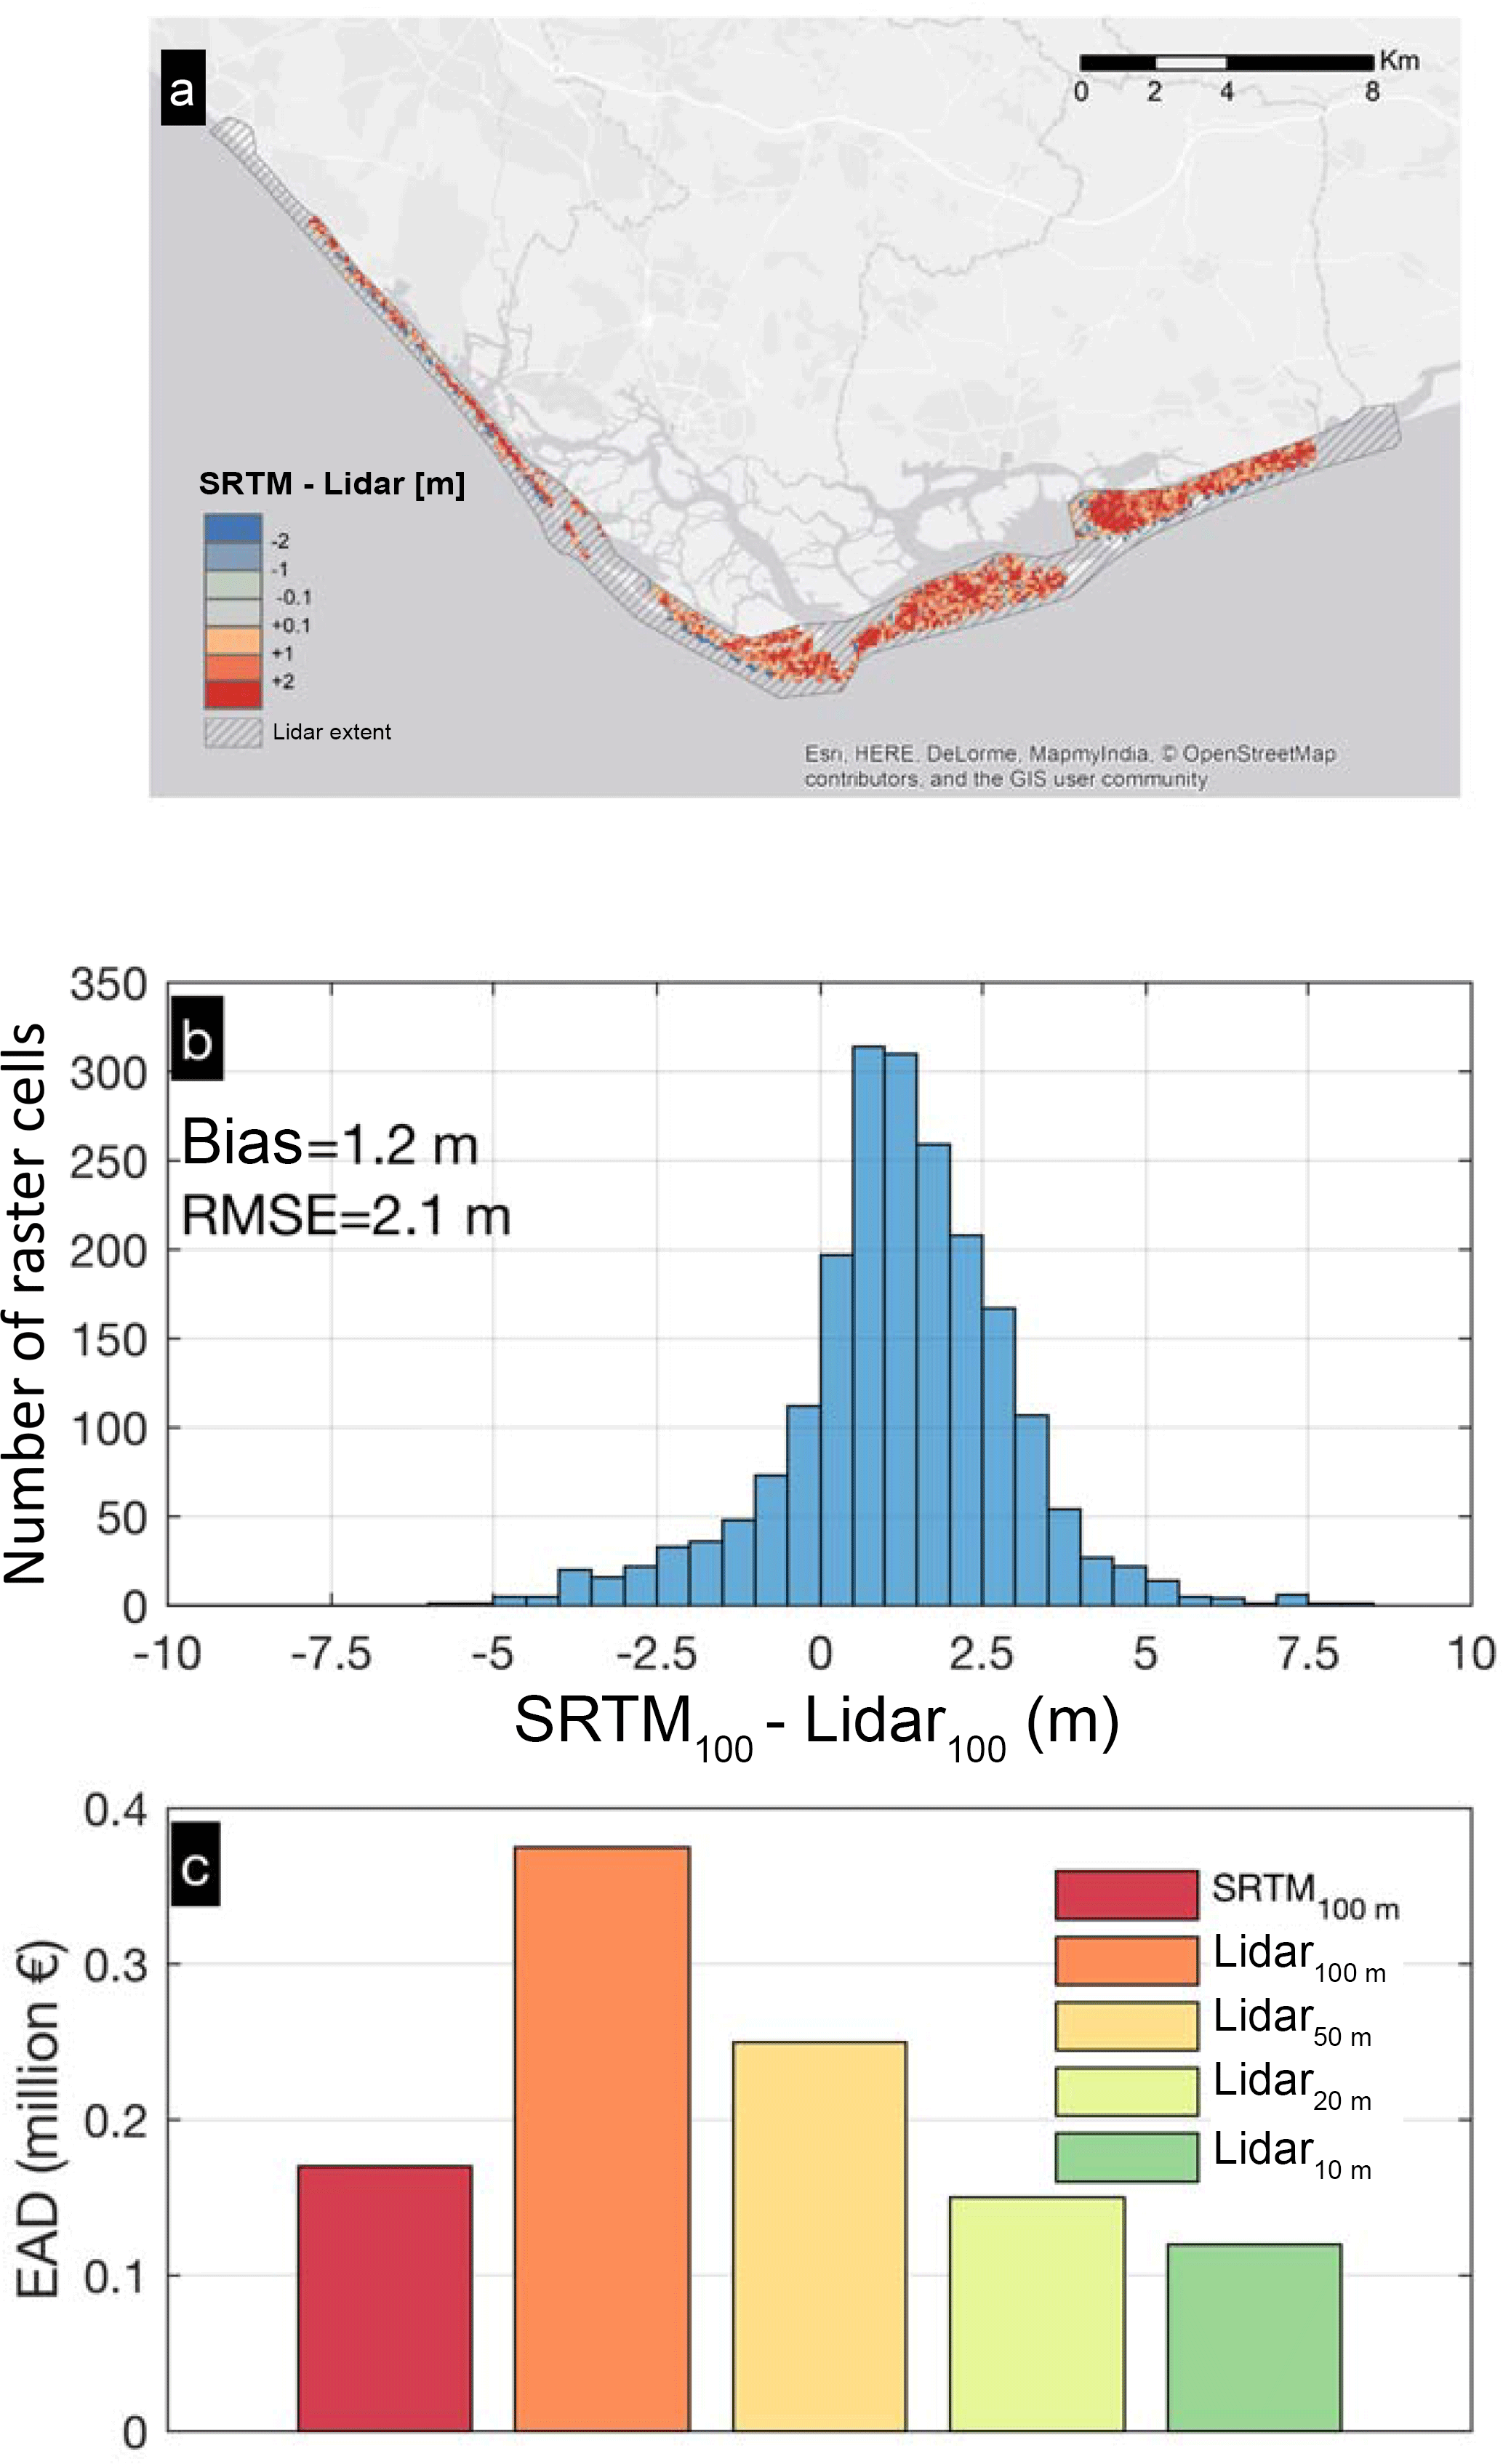
Figure 4Differences in elevation between the lidar and SRTM DEM (subsampled at 100 m) along Ria Formosa, Portugal, shown in a spatial map (a) and in a histogram (b). Effect on the DEM used to estimate the baseline expected annual damage along the same area (c): the bar plot shows results for SRTM and the lidar DEM subsampled at 10, 20, 50, and 100 m.
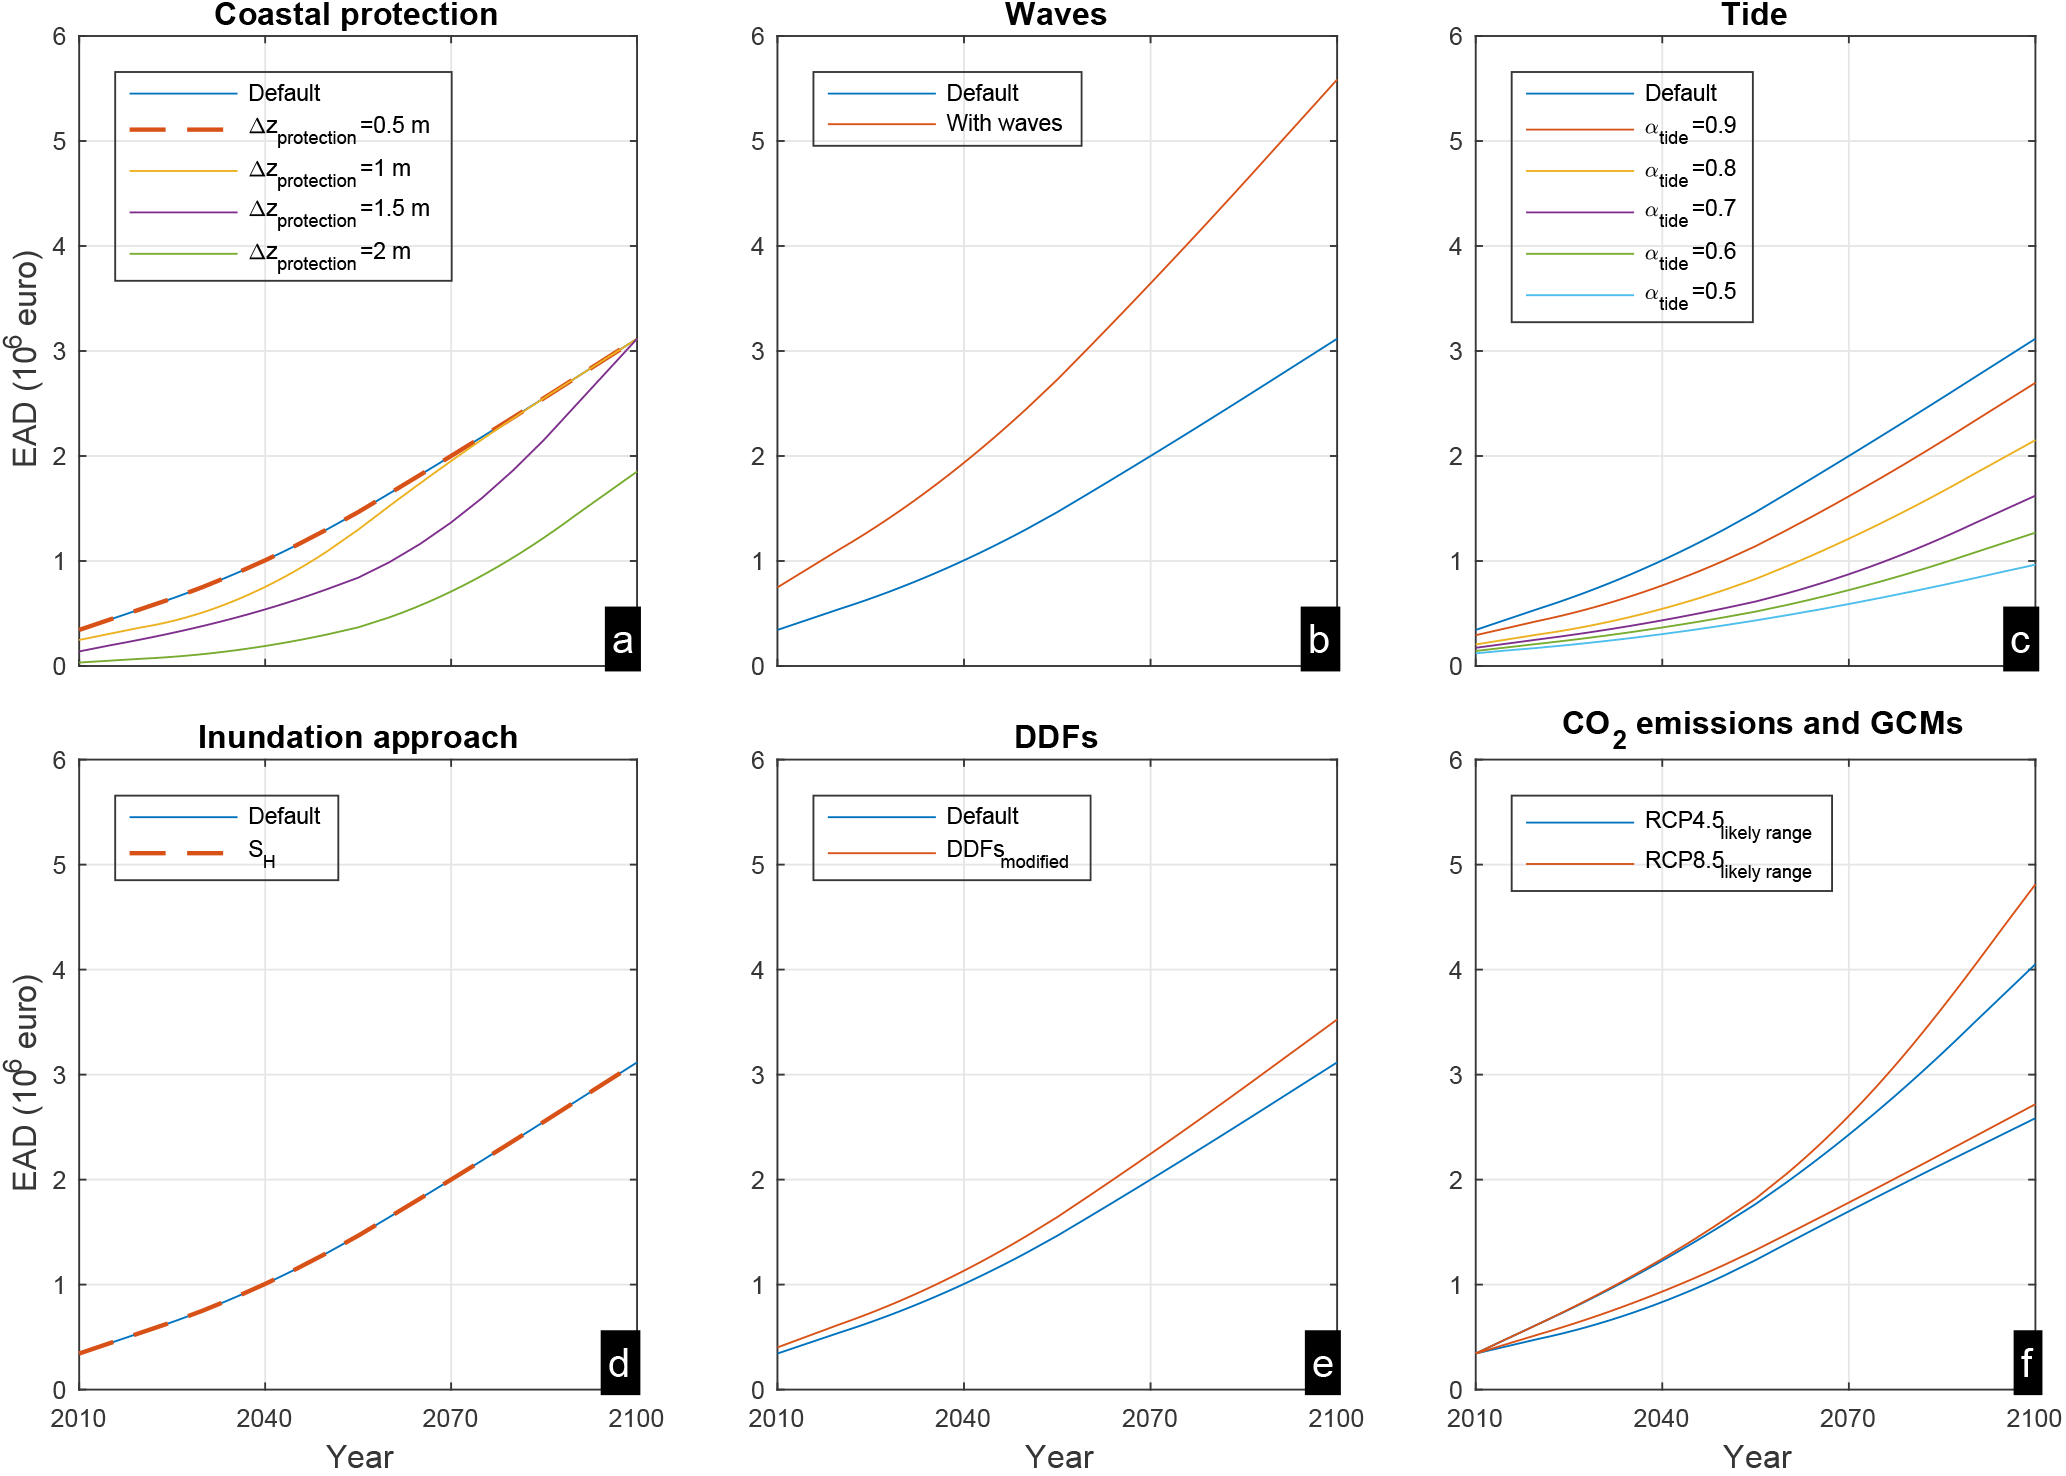
Figure 5Evolution of EAD during the present century for the Ria Formosa site under the different set-ups studied. The plots show expected annual damage in millions of euros for different scenarios of additional coastal protection (a), including wave contributions in the extreme sea levels (b), considering neap-spring tidal variability (c), and applying different inundation approaches (d) and different depth damage functions (DDFs, e). All values in (a)–(e) correspond to the median case, averaged between RCP4.5 and RCP8.5. In addition the very likely range (5th–95th quantile) of both RCPs is shown (f).
On the Iberian Peninsula additional protection appears to drive incremental increases in baseline and future EAD in all cases (Fig. 6a). Diversified behaviour is observed mainly for Δzprotection=1 m, the EAD of which is more similar to that of Δzprotection=0.5 m around the baseline and gradually converges towards that of Δzprotection=1.5 m. As a result of the above, the estimated damage reduction is higher compared to the Ria Formosa case, and especially towards the end of the century Δzprotection=2 m results in a 60 % EAD reduction (30 % in Ria Formosa). However, the EAD increase is projected to accelerate on the Iberian Peninsula, and even 2 m higher coastal defences are not sufficient to maintain the EAD below baseline levels after 2030.
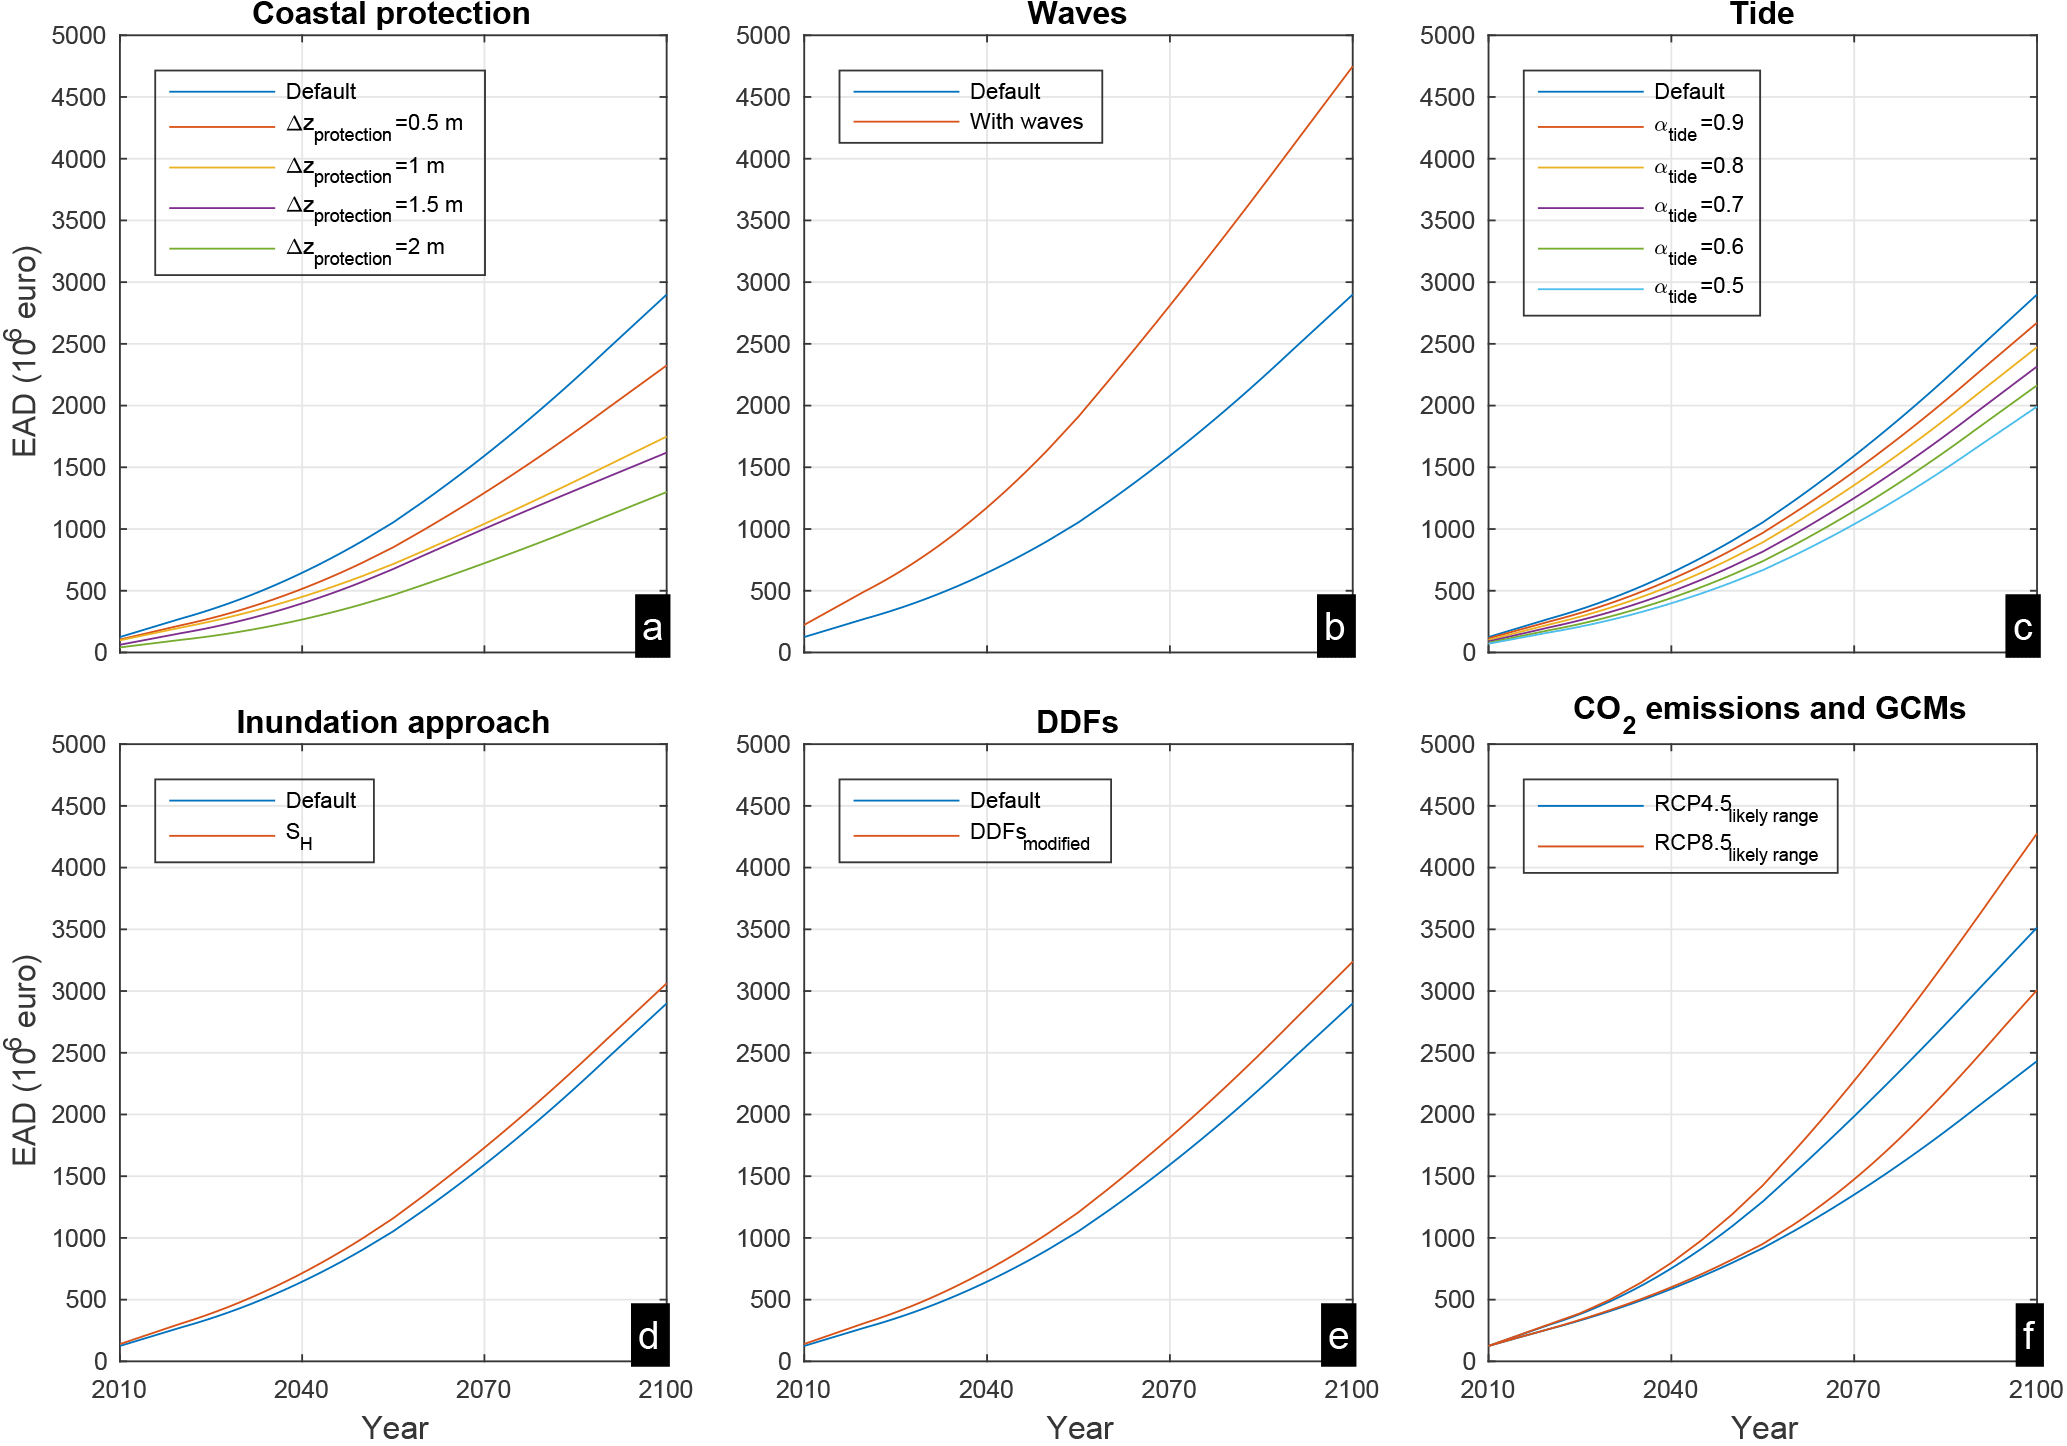
Figure 6Evolution of EAD during the present century for the Iberian Peninsula site under the different set-ups studied. The plots show expected annual damage in millions of euros for different scenarios of additional coastal protection (a), including wave contributions in the extreme sea levels (b), considering neap-spring tidal variability (c), and applying different inundation approaches (d) and different depth damage functions (DDFs, e). All values in (a)–(e) correspond to the median case, averaged between RCP4.5 and RCP8.5. In addition the very likely range (5th–95th quantile) of both RCPs is shown (f).
4.3 ESL contributions
In agreement with previous findings (Vousdoukas et al., 2016), our analysis shows that omitting wave contributions to ESLs results in substantial EAD underestimation (Figs. 5b and 6b). The baseline values can almost double after including wave set-up. The increase rate is also higher, yet the relative importance of the waves reduces with time due to the increasing dominance of SLR in the total flood damage. Considering spring-neap tidal variability through different α factors (see Sect. 3.2.1) tends to reduce EADs, especially at Ria Formosa, where α=0.5 results in a 66 % EAD reduction throughout the century. The tidal modulation effect is weaker on the Iberian Peninsula, reducing EAD by around 33 %. This is due to the fact that a significant part of the Iberian Peninsula consists of micro-tidal environments.
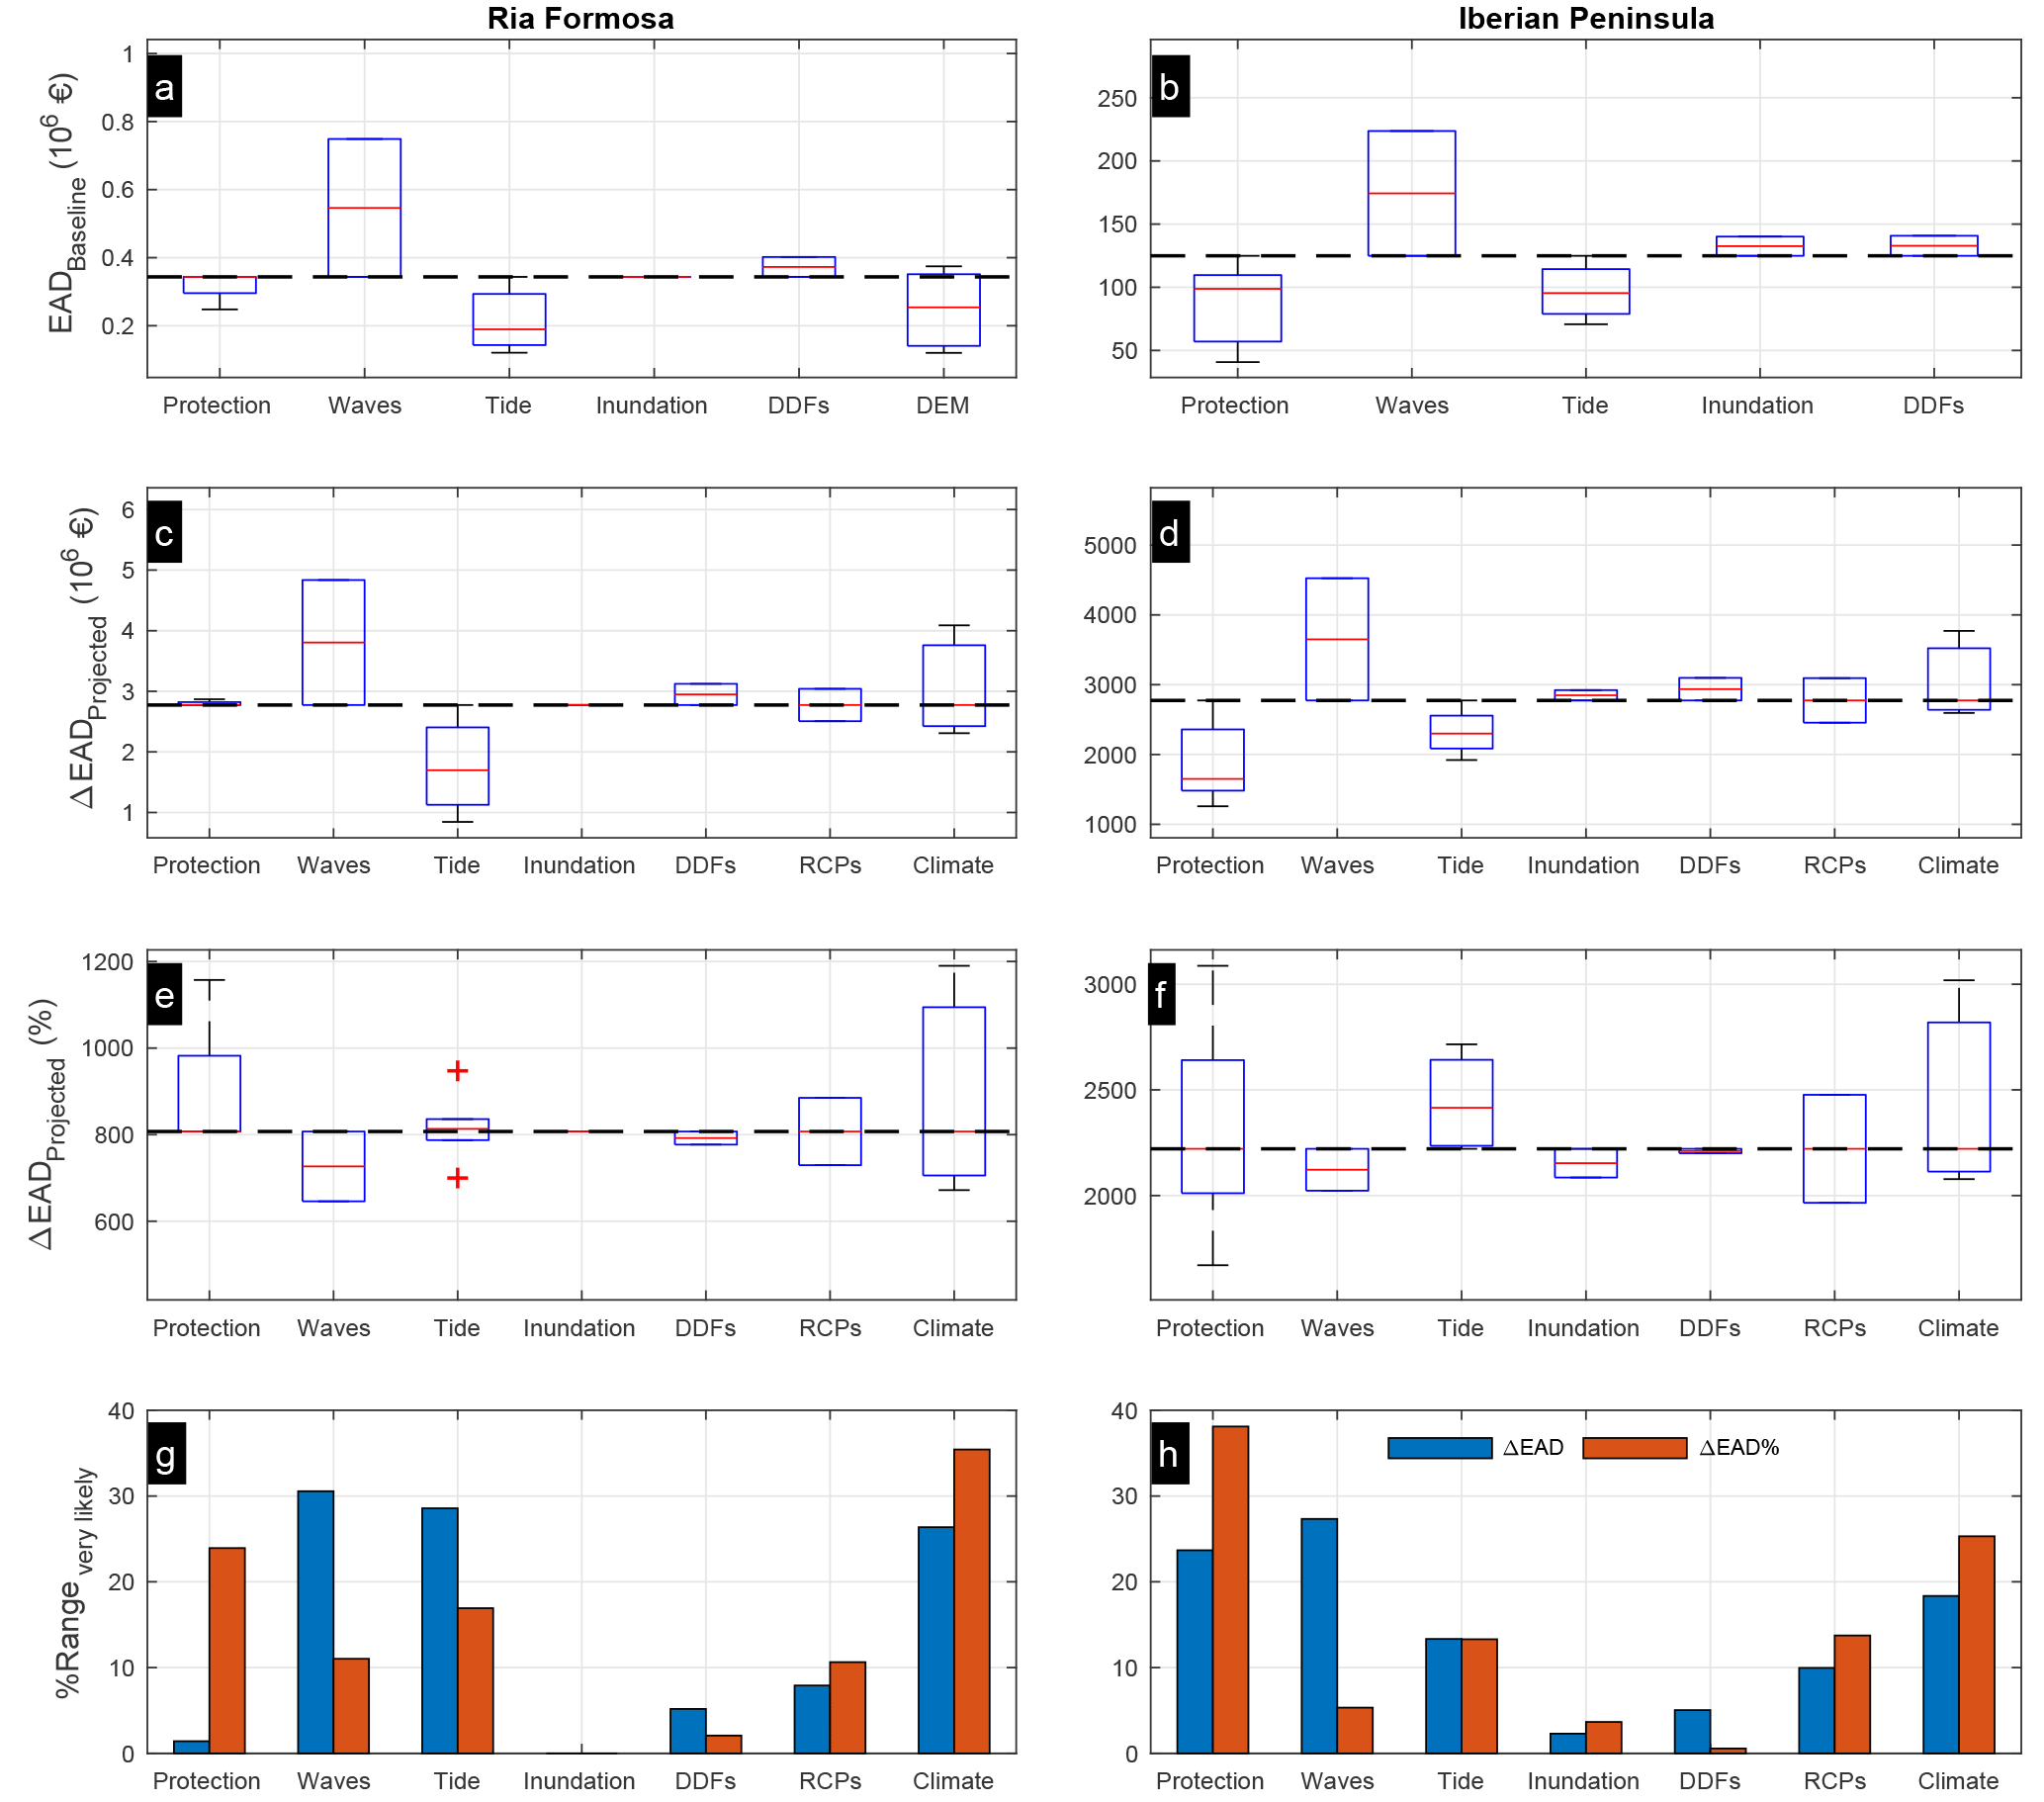
Figure 7Relative contributions to uncertainty in estimated EAD: variability in the baseline EAD among the studied factors (a, b), the absolute (ΔESL; c, d) and relative EAD change (ΔESL %; e, f) towards the end of the century, and very likely range (g–h). Comparisons are performed for Ria Formosa (a, c, e, g) and the Iberian Peninsula (b, d, f, h), and the horizontal dashed line shows the estimates for the default case (see Sect. 3.2).
4.4 Inundation algorithms
At Ria Formosa, SH and VI result in equal values (Fig. 5d), a result of the restricted domain, which means that the effective flood water volume estimated by VI is still sufficient to flood the entire area. VI results in lower EAD on the Iberian Peninsula, but the differences between the two approaches are small (<5 %; Fig. 6d). The small deviations are due to the fact that the Iberian coastline is steep, while the static approach tends to overestimate flood extents to a larger extent in mildly sloped terrains (Vousdoukas et al., 2016).
4.5 Vulnerability
The alternative DDFs show higher impacts for lower inundation depths compared to the default ones (Fig. 3), resulting in slightly higher EADs for both sites (Figs. 5e and 6e). The effect is more prominent at Ria Formosa where differences are within the 10 %–15 % range, compared to the Iberian Peninsula (<10 %). Overall, switching between the two tested DDFs appears to have a small effect on the estimated losses in the two case studies.
4.6 Relative importance of uncertainty factors
The comparison of the baseline EADs obtained from the analysis of each studied factor highlights that omitting wave contributions in ESLs is the strongest source of epistemic uncertainty in both studied cases (Fig. 7a, b). In addition, baseline EAD on the Iberian Peninsula appears to also be sensitive to coastal protection, followed by tidal modulation (Fig. 7b). The local analysis at Ria Formosa also shows that DEM errors can introduce substantial uncertainty (Fig. 7a).
Relative contributions in projected EAD changes vary depending on whether absolute (Fig. 7c–d) or relative changes are considered (Fig. 7e–f). The reason is that a factor which can increase both the baseline and future values (i.e. considering waves) may result in higher absolute ΔEAD but lower ΔEAD % due to the fact that in the latter the denominator is higher. Considering absolute changes, factors affecting ESLs (waves, tides) are the main source of uncertainty in Ria Formosa, almost comparable to the climate change uncertainty (Fig. 7c, g). Greenhouse gas emission uncertainty comes as the fourth ranked factor. When relative contributions are considered, climate projection uncertainty becomes prominent, followed by flood protection and tidal modulation. The epistemic uncertainty from including waves is similar to the one resulting from the greenhouse gas emission scenarios. The absolute contributions on the Iberian Peninsula are more balanced, with the following order: waves, flood protection, climate projection uncertainty, and tidal modulation (Fig. 7d, h). Again the uncertainty factor ranking changes when relative changes are considered, i.e. flood protection, climate uncertainty, greenhouse gas emission, and tidal modulation.
The present analysis, while perhaps not exhaustive, provides a very useful indication of uncertainties in large-scale coastal flood risk modelling and points to the challenges of gathering sufficiently reliable data. An important conclusion is also that the relative contributions of the uncertainty factors are not generally valid but depend on site-specific conditions, available data, and methods used, as shown here through the two case studies. Also, the considered range of the studied parameters (e.g. α, Δzprotection) has a direct effect on the resulting uncertainty; therefore it was carefully selected based on values observed after analysing existing data. Multiple sources of uncertainty have been examined, and this could provide the basis for a fully probabilistic uncertainty assessment framework in which Monte Carlo experiments on the input and alternative conceptualizations are performed (Purvis et al., 2008). However, combining the full parameter space in a probabilistic framework would imply prohibitive computational effort, and we feel that the present analysis remains informative. In addition, the current approach could be extended to the full geographical scale of LISCoAsT (Vousdoukas et al., 2018a, b). Finally, the selection of uncertainty sources can be deemed subjective, as with any non-exhaustive analysis (Uusitalo et al., 2015), and in the following paragraphs we try to underline the aspects which could be interesting for further investigation in future research.
The accuracy of ESL projections is affected by the atmospheric and ocean model resolution (Cavaleri and Bertotti, 2004; Calafat et al., 2014) as well as including (or not) non-linear interactions between ESL components (Arns et al., 2015) and waves in the analysis (Serafin and Ruggiero, 2014; Vitousek et al., 2017). Previous studies have further shown that ESLs can be over-predicted if the model does not consider shoreline retreat under SLR (Du et al., 2018; Idier et al., 2017; Pickering et al., 2017) or storm-induced inundation (Bertin et al., 2014). Wahl et al. (2017) quantified the uncertainties from the probability density function (PDF) type used in the extreme value analysis and from the use of different ESL datasets (see also Muis et al., 2017).
In the implementation of VI the storm hydrographs consider the temporal evolution of the meteorological tide during the event but not of the astronomical one. The coupling between tide and extreme weather is stochastic, and the tidal phase is unknown when events of specific return periods are studied. As a result, in the present analysis we assume that the peaks of the meteorological and astronomic tide will coincide, a factor which can potentially result in overestimations.
The present study does not include hydraulic models in the studied inundation approaches, as they are computationally expensive and complex to implement. Dynamic inundation simulations have been shown to be more reliable (Ramirez et al., 2016). However, Vousdoukas et al. (2016) have shown that VI can be a good surrogate when computational efficiency is the priority, as also demonstrated by Breilh et al. (2013). In flatter terrains, VI tends to be outperformed by hydraulic models, or other empirical approaches, such as the flood index method (Dottori et al., 2016a). In terms of more robust inundation modelling, smaller-scale studies have proven the validity of models which resolve nearshore waves, erosion, and dune overwash (McCall et al., 2010). Such detailed modelling, however, is not yet feasible beyond local scales due to the lack of data and computational resources.
The treatment of uncertainty in exposure is an aspect that has not been studied but that can have a strong effect on the estimated losses. This effect can be amplified for projections in coastal flood risk, given the large uncertainty in future exposure under the Shared Socio-economic Pathways (Jiang and O'Neill, 2017; Jones and O'Neill, 2016). Likewise, the alternative vulnerability set-up that was formulated is arguably limited due to a lack of coastal flood damage data and consequent absence of coastal vulnerability studies that could produce alternative DDFs. The use of alternative risk assessment methodologies (Hallegatte et al., 2013; Winsemius et al., 2013) can act as an additional source of epistemic uncertainty but is not presently addressed.
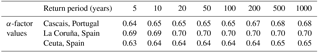
The present contribution assesses multiple sources of uncertainty, some of which have been seldom studied previously. It provides insights of their relative importance in terms of their effect on the estimated losses and can raise awareness in the coastal flood risk modelling community of the critical factors that need to be treated in future modelling attempts. For some of the above factors, recent advances have been made to improve CFR assessment. Recently, there has been an increase in the number of studies and datasets related to future wave conditions (Fan et al., 2014; Hemer et al., 2013; Mentaschi et al., 2017) that can support large-scale CFR assessments. The uncertainty related to tidal contributions can be constrained by estimating site-specific α-factor estimates (see Eq. 4). For example, the Monte Carlo simulations show that for the studied areas, confining the α factor within a range from 0.60 to 0.70 results in more realistic ESLs for all return periods (Table 4). Such a reduction of the α range reduces the related EAD uncertainty by nearly 50 %. An alternative but more computationally expensive approach is to explore the full range of uncertainty from all ESL components, expressing them first as PDFs and combining them through Monte Carlo simulations in order to generate probabilistic projections of ESLs (Vousdoukas et al., 2018b).
Table 4Results of the Monte Carlo analysis for the α ratio, for the three considered tide gauges.
The study comes in agreement with findings from Paprotny et al. (2018), who highlighted that the accuracy of DEM and coastal protection data apply strong control to flood mapping efforts. Such uncertainty factors are more challenging to deal with, despite their criticality. For example, the present findings show that the results are strongly affected by the DEM quality, and even if highly accurate DEM data are available, the estimated CFR is very sensitive to the spatial resolution at which the analysis is carried out. However, considering coarser resolutions is inevitable for large-scale analyses and further research is needed to understand how critical this effect can be.
Existing protection datasets suffer from multiple sources of errors such as (i) the fact that protection standards are often reported in return periods and conversion in ESLs can include artefacts, among others, from the components considered, the extreme value analysis, and model errors (Vousdoukas et al., 2018b); (ii) most datasets provide one value for extensive regions covering several kilometres along which protection levels can vary substantially; (iii) there is no centralized system to collect and update information on available coastal protection in most countries, not to mention at continental or global scales. Still, present and previous findings (Paprotny et al., 2018) highlight the urgent need to generate large-scale but highly detailed datasets of coastal protection standards, as the absence of such information introduces substantial uncertainty in any CFR analysis.
Last but not least come uncertainty factors related to human behaviour and societal patterns, which are very difficult to predict. For example, changes in exposure can be substantial under different political, social, and economic settings (O'Neill et al., 2014), while vulnerability can be reduced simply as a result of societies learning to live with flood hazards (Bouwer and Jonkman, 2018).
The present study reports results from an analysis of epistemic uncertainty in a large-scale assessment of present and future coastal flood risk (CFR). We use LISCoAsT, a modular, integrated framework developed by the Joint Research Centre of the European Commission to assess the relative importance of (i) the contributions of waves and tides to extreme sea levels (ESLs), (ii) digital elevation model (DEM) data, (iii) coastal flood protection information, (iv) vulnerability assumptions, and (v) different climate change projections.
The developed framework is applied in a dual case study that spans two spatial scales and consists of (i) a local application in Ria Formosa, Algarve, Portugal, a coastal stretch of approximately 36 km, and (ii) a regional application along the Iberian Peninsula coastline, including Portugal and Spain, with a total coastal length of 6767 km.
DEM data from SRTM are validated against lidar data from the regional study area, resulting in an average vertical bias of 1.20 m and RMSE of 2.15 m. We also find that reducing the DEM resolution from 10 to 100 m can change the estimated EAD by 200 %, while resolution coarser than 20 m fails to resolve the dune structure, which acts as natural flood protection at the study site.
Existing errors in flood defence height datasets can alter the EAD within the 30 %–60 % range.
ESLs are driven by the combination of changes in the mean sea level, storm surge, tides, and waves. We find that estimated EAD can almost double after including wave set-up, even though the latter is often neglected in CFR assessments. The spring-neap tidal variability is also often neglected, which can alter EAD estimates by between 33 % and 66 %.
Altering the vulnerability according to the range implied by previously used depth damage functions showed minor contributions to the overall uncertainty. Considering baseline CFR estimation, the way wave contributions to ESLs are treated appears to be the dominant source of epistemic uncertainty in both study areas. DEM quality and resolution is highlighted as the second most important factor in the local case study.
Uncertainty in projected CFR depends on whether absolute or relative CFR changes are studied. Absolute CFR changes in the regional case study are more sensitive to wave contributions to ESLs and the quality of coastal protection information. All the factors above dominate the uncertainty of climate change and greenhouse gas emission predictions. Relative changes in future CFR are more sensitive to the coastal protection information and the climate prediction skill, while tidal variability and greenhouse gas emissions show comparable uncertainty.
This work relied entirely on public data, which are available from the providers cited in Sect. 3, as input. Results of the work can be downloaded from the LISCoAsT data collection of the JRC data repository (http://data.jrc.ec.europa.eu/collection, last access: 23 July 2018).
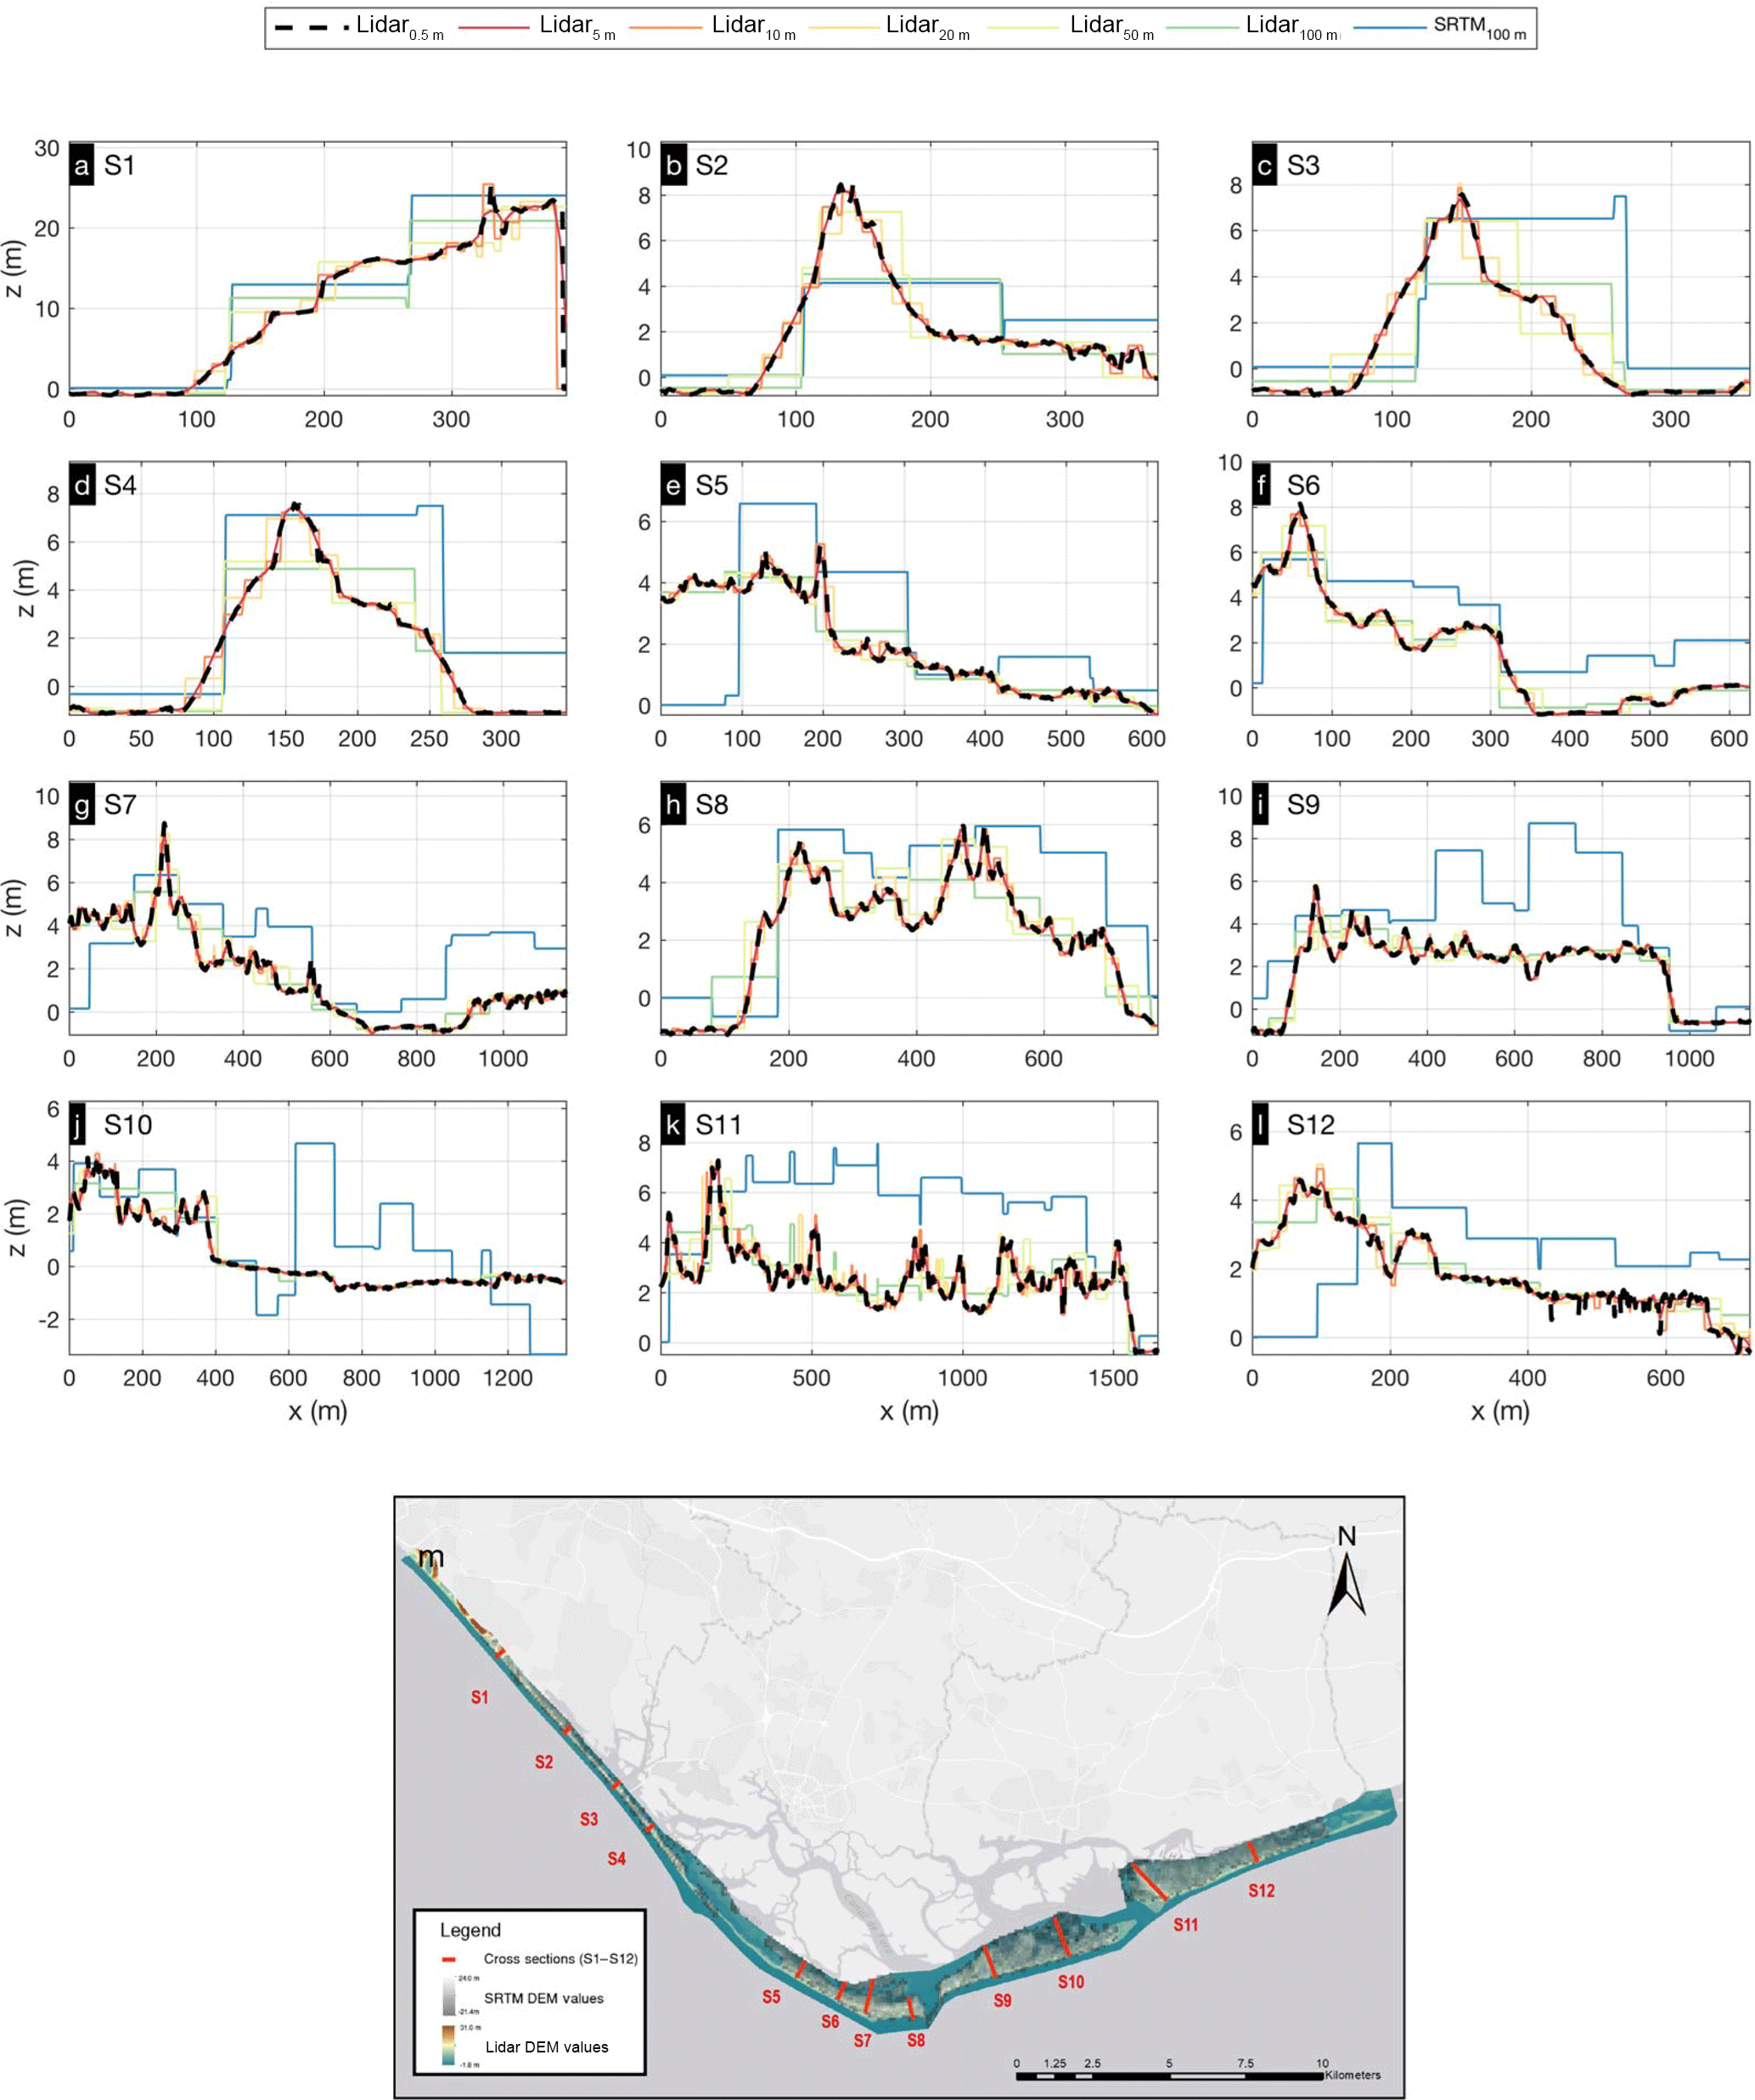
Figure A1Comparison of the SRTM DEM against the lidar at Ria Formosa, Portugal. The comparison takes place along 12 transects (a–l), which are shown in the map of the area above and includes the SRTM at 100 m and the lidar data at their original resolution of 0.5 m, as well as subsampled at 5, 10, 20, 50, and 100 m.
MIV, LB, AG, DB, and LF jointly conceived the study. LM contributed with the wave data and the extreme value analysis. MIV and EV contributed with the storm surge data. DB and MIV analyzed the data and prepared the paper, with all authors discussing results and implications and commenting on the paper at all stages.
The authors declare that they have no conflict of interest.
This article is part of the special issue “Global- and continental-scale risk assessment for natural hazards: methods and practice”. It is a result of the European Geosciences Union General Assembly 2018, Vienna, Austria, 8–13 April 2018.
The research leading to these results has received funding from the EU
Seventh Framework Programme FP7/2007–2013 under grant agreement no. 603864
(HELIX: “High-End cLimate Impacts and eXtremes”;
http://www.helixclimate.eu, last access: 23 July 2018).
Alessandra Bianchi is gratefully acknowledged for her help in producing some
of the maps shown in the illustrations.
Edited
by: Hessel Winsemius
Reviewed by: two anonymous referees
Alfieri, L., Burek, P., Feyen, L., and Forzieri, G.: Global warming increases the frequency of river floods in Europe, Hydrol. Earth Syst. Sci., 19, 2247–2260, https://doi.org/10.5194/hess-19-2247-2015, 2015.
Alfieri, L., Feyen, L., Salamon, P., Thielen, J., Bianchi, A., Dottori, F., and Burek, P.: Modelling the socio-economic impact of river floods in Europe, Nat. Hazards Earth Syst. Sci., 16, 1401–1411, https://doi.org/10.5194/nhess-16-1401-2016, 2016.
Alfieri, L., Bisselink, B., Dottori, F., Naumann, G., de Roo, A., Salamon, P., Wyser, K., and Feyen, L.: Global projections of river flood risk in a warmer world, Earth's Future, 5, 171–182, https://doi.org/10.1002/2016EF000485, 2017.
Almeida, L. P., Ferreira, Ó., and Pacheco, A.: Thresholds for morphological changes on an exposed sandy beach as a function of wave height, Earth Surf. Proc. Land., 36, 523–532, 2011a.
Almeida, L. P., Ferreira, Ó., Vousdoukas, M. I., and Dodet, G.: Historical variation and trends in storminess along the Portuguese South Coast, Nat. Hazards Earth Syst. Sci., 11, 2407–2417, https://doi.org/10.5194/nhess-11-2407-2011, 2011b.
Apel, H., Merz, B., and Thieken, A. H.: Quantification of uncertainties in flood risk assessments, International Journal of River Basin Management, 6, 149–162, https://doi.org/10.1080/15715124.2008.9635344, 2008.
Apel, H., Aronica, G. T., Kreibich, H., and Thieken, A. H.: Flood risk analyses – how detailed do we need to be?, Nat. Hazards, 49, 79–98, https://doi.org/10.1007/s11069-008-9277-8, 2009.
Arns, A., Wahl, T., Dangendorf, S., and Jensen, J.: The impact of sea level rise on storm surge water levels in the northern part of the German Bight, Coast. Eng., 96, 118–131, https://doi.org/10.1016/j.coastaleng.2014.12.002, 2015.
Batista e Silva, F., Lavalle, C., and Koomen, E.: A procedure to obtain a refined European land use/cover map, J. Land Use Sci., 8, 255–283, https://doi.org/10.1080/1747423X.2012.667450, 2012.
Bertin, X., Li, K., Roland, A., Zhang, Y. J., Breilh, J. F., and Chaumillon, E.: A modeling-based analysis of the flooding associated with Xynthia, central Bay of Biscay, Coast. Eng., 94, 80–89, https://doi.org/10.1016/j.coastaleng.2014.08.013, 2014.
Bouwer, L. M. and Jonkman, S. N.: Global mortality from storm surges is decreasing, Environ. Res. Lett., 13, 014008, https://doi.org/10.1088/1748-9326/aa98a3, 2018.
Breilh, J. F., Chaumillon, E., Bertin, X., and Gravelle, M.: Assessment of static flood modeling techniques: application to contrasting marshes flooded during Xynthia (western France), Nat. Hazards Earth Syst. Sci., 13, 1595–1612, https://doi.org/10.5194/nhess-13-1595-2013, 2013.
Calafat, F. M., Avgoustoglou, E., Jordà, G., Flocas, H., Zodiatis, G., Tsimplis, M. N., and Kouroutzoglou, J.: The ability of a barotropic model to simulate sea level extremes of meteorological origin in the Mediterranean Sea, including those caused by explosive cyclones, J. Geophys. Res.-Oceans, 119, 7840–7853, https://doi.org/10.1002/2014JC010360, 2014.
Camfield, F. E.: Wave Forces on Wall, J. Waterw. Port C., 117, 76–79, https://doi.org/10.1061/(ASCE)0733-950X(1991)117:1(76), 1991.
Cavaleri, L. and Bertotti, L.: Accuracy of the modelled wind and wave fields in enclosed seas, Tellus A, 56, 167–175, https://doi.org/10.3402/tellusa.v56i2.14398, 2004.
Christie, E. K., Spencer, T., Owen, D., McIvor, A. L., Möller, I., and Viavattene, C.: Regional coastal flood risk assessment for a tidally dominant, natural coastal setting: North Norfolk, southern North Sea, Coast. Eng., 134, 177–190, https://doi.org/10.1016/j.coastaleng.2017.05.003, 2017.
de Moel, H., Asselman, N. E. M., and Aerts, J. C. J. H.: Uncertainty and sensitivity analysis of coastal flood damage estimates in the west of the Netherlands, Nat. Hazards Earth Syst. Sci., 12, 1045–1058, https://doi.org/10.5194/nhess-12-1045-2012, 2012.
de Moel, H., Jongman, B., Kreibich, H., Merz, B., Penning-Rowsell, E., and Ward, P. J.: Flood risk assessments at different spatial scales, Mitig. Adapt. Strat. Gl., 20, 865–890, https://doi.org/10.1007/s11027-015-9654-z, 2015.
Dottori, F., Martina, M. L. V., and Figueiredo, R.: A methodology for flood susceptibility and vulnerability analysis in complex flood scenarios, J. Flood Risk Manag., 11, S632–S645, https://doi.org/10.1111/jfr3.12234, 2016a.
Dottori, F., Salamon, P., Bianchi, A., Alfieri, L., Hirpa, F. A., and Feyen, L.: Development and evaluation of a framework for global flood hazard mapping, Adv. Water Resour., 94, 87–102, https://doi.org/10.1016/j.advwatres.2016.05.002, 2016b.
Dottori, F., Kalas, M., Salamon, P., Bianchi, A., Alfieri, L., and Feyen, L.: An operational procedure for rapid flood risk assessment in Europe, Nat. Hazards Earth Syst. Sci., 17, 1111–1126, https://doi.org/10.5194/nhess-17-1111-2017, 2017.
Du, J., Shen, J., Zhang, Y. J., Ye, F., Liu, Z., Wang, Z., Wang, Y. P., Yu, X., Sisson, M., and Wang, H. V.: Tidal Response to Sea-Level Rise in Different Types of Estuaries: The Importance of Length, Bathymetry, and Geometry, Geophys. Res. Lett., 45, 227–235, https://doi.org/10.1002/2017GL075963, 2018.
Fan, Y., Lin, S.-J., Griffies, S. M., and Hemer, M. A.: Simulated Global Swell and Wind-Sea Climate and Their Responses to Anthropogenic Climate Change at the End of the Twenty-First Century, J. Climate, 27, 3516–3536, https://doi.org/10.1175/JCLI-D-13-00198.1, 2014.
Ferreira, O., Viavattene, C., Jiménez, J. A., Bolle, A., das Neves, L., Plomaritis, T. A., McCall, R., and van Dongeren, A. R.: Storm-induced risk assessment: Evaluation of two tools at the regional and hotspot scale, Coast. Eng., 134, 241–253, https://doi.org/10.1016/j.coastaleng.2017.10.005, 2017.
Giardino, A., Nederhoff, C., and Vousdoukas, M. I.: Coastal hazard risk assessment for small islands: assessing the impact of climate change and disaster reduction measures on Ebeye (Marshall Islands), Reg. Environ. Change, 1–12, https://doi.org/10.1007/s10113-018-1353-3, 2018.
Hallegatte, S., Ranger, N., Mestre, O., Dumas, P., Corfee-Morlot, J., Herweijer, C., and Wood, R. M.: Assessing climate change impacts, sea level rise and storm surge risk in port cities: a case study on Copenhagen, Climatic Change, 104, 113–137, https://doi.org/10.1007/s10584-010-9978-3, 2011.
Hallegatte, S., Green, C., Nicholls, R. J., and Corfee-Morlot, J.: Future flood losses in major coastal cities, Nat. Clim. Change, 3, 802–806, https://doi.org/10.1038/nclimate1979, 2013.
Hemer, M. A., Fan, Y., Mori, N., Semedo, A., and Wang, X. L.: Projected changes in wave climate from a multi-model ensemble, Nat. Clim. Change, 3, 471–476, https://doi.org/10.1038/nclimate1791, 2013.
Hinkel, J., Lincke, D., Vafeidis, A. T., Perrette, M., Nicholls, R. J., Tol, R. S. J., Marzeion, B., Fettweis, X., Ionescu, C., and Levermann, A.: Coastal flood damage and adaptation costs under 21st century sea-level rise, P. Natl. Acad. Sci. USA, 111, 3292–3297, https://doi.org/10.1073/pnas.1222469111, 2014.
Idier, D., Paris, F., Cozannet, G. L., Boulahya, F., and Dumas, F.: Sea-level rise impacts on the tides of the European Shelf, Cont. Shelf Res., 137, 56–71, https://doi.org/10.1016/j.csr.2017.01.007, 2017.
Jiang, L. and O'Neill, B. C.: Global urbanization projections for the Shared Socioeconomic Pathways, Global Environ. Chang., 42, 193–199, https://doi.org/10.1016/j.gloenvcha.2015.03.008, 2017.
Jones, B. and O'Neill, B. C.: Spatially explicit global population scenarios consistent with the Shared Socioeconomic Pathways, Environ. Res. Lett., 11, 084003, https://doi.org/10.1088/1748-9326/11/8/084003, 2016.
Jongman, B., Kreibich, H., Apel, H., Barredo, J. I., Bates, P. D., Feyen, L., Gericke, A., Neal, J., Aerts, J. C. J. H., and Ward, P. J.: Comparative flood damage model assessment: towards a European approach, Nat. Hazards Earth Syst. Sci., 12, 3733–3752, https://doi.org/10.5194/nhess-12-3733-2012, 2012a.
Jongman, B., Ward, P. J., and Aerts, J. C. J. H.: Global exposure to river and coastal flooding: Long term trends and changes, Global Environ. Chang., 22, 823–835, https://doi.org/10.1016/j.gloenvcha.2012.07.004, 2012b.
Jonkman, S. N., Hillen, M. M., Nicholls, R. J., Kanning, W., and Ledden, M. V.: Costs of Adapting Coastal Defences to Sea-Level Rise – New Estimates and Their Implications, J. Coast. Res., 29, 1212–1226, https://doi.org/10.2112/jcoastres-d-12-00230.1, 2013.
Kystdirektoratet: COMRISK SP7 Report – Risk Assessment of the Wadden Sea, 2004.
Lozano, I., Devoy, R. J. N., May, W., and Andersen, U.: Storminess and vulnerability along the Atlantic coastlines of Europe: analysis of storm records and of a greenhouse gases induced climate scenario, Mar. Geol., 210, 205–225, https://doi.org/10.1016/j.margeo.2004.05.026, 2004.
McCall, R. T., Van Thiel de Vries, J. S. M., Plant, N. G., Van Dongeren, A. R., Roelvink, J. A., Thompson, D. M., and Reniers, A. J. H. M.: Two-dimensional time dependent hurricane overwash and erosion modeling at Santa Rosa Island, Coast. Eng., 57, 668–683, https://doi.org/10.1016/j.coastaleng.2010.02.006, 2010.
Melet, A., Meyssignac, B., Almar, R., and Le Cozannet, G.: Under-estimated wave contribution to coastal sea-level rise, Nat. Clim. Change, 8, 234–239, https://doi.org/10.1038/s41558-018-0088-y, 2018.
Menéndez, M. and Woodworth, P. L.: Changes in extreme high water levels based on a quasi-global tide-gauge data set, J. Geophys. Res.-Oceans, 115, C10011, https://doi.org/10.1029/2009JC005997, 2010.
Mentaschi, L., Vousdoukas, M., Voukouvalas, E., Sartini, L., Feyen, L., Besio, G., and Alfieri, L.: The transformed-stationary approach: a generic and simplified methodology for non-stationary extreme value analysis, Hydrol. Earth Syst. Sci., 20, 3527–3547, https://doi.org/10.5194/hess-20-3527-2016, 2016.
Mentaschi, L., Vousdoukas, M. I., Voukouvalas, E., Dosio, A., and Feyen, L.: Global changes of extreme coastal wave energy fluxes triggered by intensified teleconnection patterns, Geophys. Res. Lett., 44, 2416–2426, https://doi.org/10.1002/2016GL072488, 2017.
Muis, S., Verlaan, M., Nicholls, R. J., Brown, S., Hinkel, J., Lincke, D., Vafeidis, A. T., Scussolini, P., Winsemius, H. C., and Ward, P. J.: A comparison of two global datasets of extreme sea levels and resulting flood exposure, Earth's Future, 5, 379–392, https://doi.org/10.1002/2016EF000430, 2017.
Neumann, B., Vafeidis, A. T., Zimmermann, J., and Nicholls, R. J.: Future Coastal Population Growth and Exposure to Sea-Level Rise and Coastal Flooding – A Global Assessment, PLOS ONE, 10, e0118571, https://doi.org/10.1371/journal.pone.0118571, 2015.
O'Neill, B. C., Kriegler, E., Riahi, K., Ebi, K. L., Hallegatte, S., Carter, T. R., Mathur, R., and van Vuuren, D. P.: A new scenario framework for climate change research: the concept of shared socioeconomic pathways, Climatic Change, 122, 387–400, https://doi.org/10.1007/s10584-013-0905-2, 2014.
Paprotny, D. and Terefenko, P.: New estimates of potential impacts of sea level rise and coastal floods in Poland, Nat. Hazards, 85, 1249–1277, https://doi.org/10.1007/s11069-016-2619-z, 2017.
Paprotny, D., Morales-Nápoles, O., Vousdoukas, M. I., Jonkman, S. N., and Nikulin, G.: Accuracy of pan-European coastal flood mapping, J. Flood Risk Manag., https://doi.org/10.1111/jfr3.12459, online first, 2018.
Pickering, M. D., Horsburgh, K. J., Blundell, J. R., Hirschi, J. J. M., Nicholls, R. J., Verlaan, M., and Wells, N. C.: The impact of future sea-level rise on the global tides, Cont. Shelf Res., 142, 50–68, https://doi.org/10.1016/j.csr.2017.02.004, 2017.
Plomaritis, T. A., Ferreira, Ó., and Costas, S.: Regional assessment of storm related overwash and breaching hazards on coastal barriers, Coast. Eng., https://doi.org/10.1016/j.coastaleng.2017.09.003, 2017.
Purvis, M. J., Bates, P. D., and Hayes, C. M.: A probabilistic methodology to estimate future coastal flood risk due to sea level rise, Coast. Eng., 55, 1062–1073, https://doi.org/10.1016/j.coastaleng.2008.04.008, 2008.
Ramirez, J. A., Lichter, M., Coulthard, T. J., and Skinner, C.: Hyper-resolution mapping of regional storm surge and tide flooding: comparison of static and dynamic models, Nat. Hazards, 82, 571–590, https://doi.org/10.1007/s11069-016-2198-z, 2016.
Reuter, H. I., Nelson, A., and Jarvis, A.: An evaluation of void-filling interpolation methods for SRTM data, Int. J. Geogr. Inf. Sci., 21, 983–1008, https://doi.org/10.1080/13658810601169899, 2007.
Rodríguez, E., Morris, C. S., and Belz, J. E.: A Global Assessment of the SRTM Performance, Photogramm. Eng. Rem. Sens., 72, 249–260, https://doi.org/10.14358/PERS.72.3.249, 2006.
Rojas, R., Feyen, L., and Watkiss, P.: Climate change and river floods in the European Union: Socio-economic consequences and the costs and benefits of adaptation, Global Environ. Chang., 23, 1737–1751, https://doi.org/10.1016/j.gloenvcha.2013.08.006, 2013.
Scussolini, P., Aerts, J. C. J. H., Jongman, B., Bouwer, L. M., Winsemius, H. C., de Moel, H., and Ward, P. J.: FLOPROS: an evolving global database of flood protection standards, Nat. Hazards Earth Syst. Sci., 16, 1049–1061, https://doi.org/10.5194/nhess-16-1049-2016, 2016.
Seenath, A., Wilson, M., and Miller, K.: Hydrodynamic versus GIS modelling for coastal flood vulnerability assessment: Which is better for guiding coastal management?, Ocean Coast. Manage., 120, 99–109, https://doi.org/10.1016/j.ocecoaman.2015.11.019, 2016.
Serafin, K. A. and Ruggiero, P.: Simulating extreme total water levels using a time-dependent, extreme value approach, J. Geophys. Res.-Oceans, 119, 6305–6329, https://doi.org/10.1002/2014JC010093, 2014.
Uusitalo, L., Lehikoinen, A., Helle, I., and Myrberg, K.: An overview of methods to evaluate uncertainty of deterministic models in decision support, Environ. Modell. Softw., 63, 24–31, https://doi.org/10.1016/j.envsoft.2014.09.017, 2015.
Viavattene, C., Micou, A. P., Owen, D., Priest, S., and Parker, D.: RISC-KIT Documentation – Deliverable D2.2 – Coastal Vulnerability Indicator Library, available at: http://www.risckit.eu/np4/file/383/RISC_KIT_D.2.2_CVIL_Guidance_Document.pdf (last access: 8 August 2018), 2015.
Viavattene, C., Jiménez, J. A., Ferreira, O., Priest, S., Owen, D., and McCall, R.: Selecting coastal hotspots to storm impacts at the regional scale: a Coastal Risk Assessment Framework, Coast. Eng., 134, 33–47, https://doi.org/10.1016/j.coastaleng.2017.09.002, 2018.
Vitousek, S., Barnard, P. L., Fletcher, C. H., Frazer, N., Erikson, L., and Storlazzi, C. D.: Doubling of coastal flooding frequency within decades due to sea-level rise, Sci. Rep.-UK, 7, 1399, https://doi.org/10.1038/s41598-017-01362-7, 2017.
Vousdoukas, M. I.: Erosion/accretion and multiple beach cusp systems on a meso-tidal, steeply-sloping beach, Geomorphology, 141–142, 34–46, https://doi.org/10.1016/j.geomorph.2011.12.003, 2012.
Vousdoukas, M. I.: Observations of wave run-up and groundwater seepage line motions on a reflective-to-intermediate, meso-tidal beach, Mar. Geol., 350, 52–70, https://doi.org/10.1016/j.margeo.2014.02.005, 2014.
Vousdoukas, M. I., Wziatek, D., and Almeida, L. P.: Coastal vulnerability assessment based on video wave run-up observations at a mesotidal, steep-sloped beach, Ocean Dynam., 62, 123–137, https://doi.org/10.1007/s10236-011-0480-x, 2012.
Vousdoukas, M. I., Voukouvalas, E., Mentaschi, L., Dottori, F., Giardino, A., Bouziotas, D., Bianchi, A., Salamon, P., and Feyen, L.: Developments in large-scale coastal flood hazard mapping, Nat. Hazards Earth Syst. Sci., 16, 1841–1853, https://doi.org/10.5194/nhess-16-1841-2016, 2016.
Vousdoukas, M. I., Mentaschi, L., Voukouvalas, E., Verlaan, M., and Feyen, L.: Extreme sea levels on the rise along Europe's coasts, Earths Future, 5, 304–323, https://doi.org/10.1002/2016EF000505, 2017.
Vousdoukas, M. I., Mentaschi, L., Voukouvalas, E., Alessandra, B., Francesco, D., and Feyen, L.: Climatic and socioeconomic controls of future coastal flood risk in Europe, Nat. Clim. Change, https://doi.org/10.1038/s41558-018-0260-4, accepted, 2018a.
Vousdoukas, M. I., Mentaschi, L., Voukouvalas, E., Verlaan, M., Jevrejeva, S., Jackson, L., and Feyen, L.: Global probabilistic projections of extreme sea levels show intensification of coastal flood hazard, Nat. Commun., 9, 2360, https://doi.org/10.1038/s41467-018-04692-w, 2018b.
Wahl, T., Haigh, I. D., Nicholls, R. J., Arns, A., Dangendorf, S., Hinkel, J., and Slangen, A. B. A.: Understanding extreme sea levels for broad-scale coastal impact and adaptation analysis, Nat. Commun., 8, 16075, https://doi.org/10.1038/ncomms16075, 2017.
Ward, P. J., Brenden, J., Frederiek Sperna, W., Arno, B., Rens van, B., Marc, F. P. B., Willem, L., and Hessel, C. W.: Assessing flood risk at the global scale: model setup, results, and sensitivity, Environ. Res. Lett., 8, 044019, https://doi.org/10.1088/1748-9326/8/4/044019, 2013.
Winsemius, H. C., Van Beek, L. P. H., Jongman, B., Ward, P. J., and Bouwman, A.: A framework for global river flood risk assessments, Hydrol. Earth Syst. Sci., 17, 1871–1892, https://doi.org/10.5194/hess-17-1871-2013, 2013.
Winsemius, H. C., Aerts, J. C. J. H., van Beek, L. P. H., Bierkens, M. F. P., Bouwman, A., Jongman, B., Kwadijk, J. C. J., Ligtvoet, W., Lucas, P. L., van Vuuren, D. P., and Ward, P. J.: Global drivers of future river flood risk, Nat. Clim. Change, 6, 381–385, https://doi.org/10.1038/nclimate2893, 2016.