the Creative Commons Attribution 4.0 License.
the Creative Commons Attribution 4.0 License.
 | 08 Aug 2018
Development of fragility curves for road bridges exposed to volcanic lahars
Joaquín Dagá
Alondra Chamorro
Hernán de Solminihac
Tomás Echaveguren
One of the main volcanic processes affecting road bridges are lahars, which are flows of water and volcanic material running down the slopes of a volcano and river valleys. Several studies have evidenced the effects of other volcanic processes on road infrastructure; however, limited information is available about the effects of lahars on bridges. In this paper, bridge failure models due to lahars are proposed and, based on these, fragility curves are developed. Failure models consider the limit state of pier and abutment overturning, and deck sliding caused by lahars. Existing physical models are used to stochastically characterize lahar loads and overturning momentum on bridges. Monte Carlo simulations are applied to quantify the probability of bridge failure given by different lahar depths. Fragility curves of bridges are finally parameterized by maximum likelihood estimation, assuming a cumulative log-normal distribution. Bridge failure models are empirically evaluated using data on 15 bridges that were affected by lahars in the last 50 years. Developed models suggest that decks fail mainly due to pier and/or abutment overturning, rather than deck-sliding forces. Moreover, it is concluded that bridges with piers are more vulnerable to lahars than bridges without piers. Further research is being conducted to develop an application tool to simulate the effects of expected lahars on exposed bridges of a road network.
- Article
(1886 KB) - Full-text XML
- BibTeX
- EndNote


Volcanic eruptions produce operational restrictions and physical damage to road infrastructure. The level of damage depends on the infrastructure's exposure and vulnerability as well as the type of volcanic event, namely pyroclastic fall, pyroclastic flow, lava flow and lahar. Consequences related to pyroclastic fall, specifically tephra, are temporal road closures caused by visibility limitations on drivers and reduced friction between the pavement and tyres (Nairn, 2002; Leonard et al., 2005; Wilson et al., 2012).
Lava and pyroclastic flows may destroy road infrastructure, but the probability of occurrence of these events is low and exposed areas are limited (Wilson et al., 2014). Considering that risk is a function of the hazard, exposure and vulnerability (UNISDR, 2009), a lower risk of lava and pyroclastic flows on road infrastructure is consequently expected. Lahars are flows of water, rock fragments and debris that descend from the slopes of volcanoes and river valleys. Road infrastructure reached by lahars are damaged physically and operationally (Smith and Fritz, 1989). Volcanic debris and sediments transported by lahars make these flows especially destructive. Lahar flows also scour the riverbed, permanently affecting in the foundations of the exposed infrastructure (Vallance and Iverson, 2015; Muñoz-Salinas et al., 2007; Nairn, 2002). Wilson et al. (2014) demonstrated that bridges and culverts are the road infrastructure elements most exposed and vulnerable to lahars. Blong (1984) and Wilson et al. (2014) reported that 300 km of roads were damaged and 48 bridges were affected because of Mount St Helens (USA) eruption in 1980. Moreover, the eruption of Villarrica and Calbuco volcanoes, which occurred in Chile in 2015, collapsed four of six bridges reached by lahars (MOP, 2015a, b).
Fragility curves are commonly integrated in available risk modelling tools. For example, in the United States, the Federal Emergency Management Agency (FEMA) developed HAZUS-MH tool for risk management of structures and infrastructure. This GIS-based software covers three natural hazards, earthquakes, floods and hurricanes, excluding the volcanic hazard from the analysis (FEMA, 2011). Likewise, the RiskScape software developed by the National Institute of Water and Atmospheric Research (NIWA) of New Zealand included the effects of earthquakes, tsunamis, floods, hurricanes and volcanic eruptions on assets such as buildings, roads and power lines. Nevertheless, the effects of volcanoes are only accounted for in terms of ash fall and the temporary interruption of infrastructure operation (Kaye, 2008). Fragility curves have been developed for some infrastructure and utilities exposed to volcanic hazard, such as buildings and electric transmission systems (Spence et al., 2005, 2007; Jenkins and Spence, 2009; Zuccaro and De Gregorio, 2013). In particular, Wilson et al. (2017) developed fragility curves for road infrastructure exposed to tephra fall. However, fragility curves for road infrastructure exposed to lahars have not been developed regardless of empirical evidence on their destructive effects (Wilson et al., 2014).
From the available literature and current state of practice, it is concluded that no bridge fragility curves exposed to lahar flows have been developed. To characterize bridge fragility to lahars, failure probability of primary structural elements is required, namely substructure (i.e. piers and abutments) and deck. Piers are columns designed to act as interior support for a bridge superstructure; abutments are the end support for a bridge superstructure; and deck is the component that supports wheel loads directly and is supported by other components (AASHTO, 2012).
The main objective of this study is to propose simplified bridge failure models and fragility curves by considering pier and abutment overturning, as well as deck sliding caused by lahars. The research starts with the characterization of the lahar process and the physical effects on bridges. From this analysis lahar depth was identified as a critical stochastic variable that is representative of the hazard intensity. Failure models are then proposed, considering the limit state of pier and abutment overturning due to lahar demanding forces and reduced supply moment caused by scour. In the case of bridge deck, the limit state is analysed by considering lahar tangential force and supplied deck friction. Monte Carlo simulations are applied to estimate the bridge failure probability by considering different lahar depths, allowing the fragility curves to be calibrated. The analysis is performed by considering one-span and multiple-span bridges.
Best-fit probability functions are finally proposed by considering cumulative log-normal distribution and their corresponding parameters from maximum likelihood analysis. Limited historical data are available to empirically validate the proposed fragility curves, but models were compared with post-event data from 15 bridges, being in all cases consistent with developed models. Future research should be conducted to statistically validate developed fragility curves with reliable empirical data.
2.1 Physical description of lahar flows
Lahars are high-velocity flow containing a mix of volcanic debris and water, travelling through ravines and riverbeds (Pierson et al., 2009). Lahar flows originated from an abrupt melting of snow and/or ice caused by the heat flow derived from lavas or pyroclastic flows issued during a volcanic event or by avalanches of non-consolidated volcanic material during intense rainfall or rupture of a lake or pond (Waitt, 2013). Lahars are categorized according to their sediment ∕ water ratio into debris flows and Hyperconcentrated flows (Smith and Fritz, 1989). Debris flows are highly viscous slurries of sediment and water. Debris flows are capable of transporting gravel-sized debris in suspension, and their concentration of solid particles ranges between 75 % and 80 % in weight or 55 % and 60 % in volume. Hyperconcentrated flows have high-suspended fine contents, predominantly due to fluid motion and properties. The solid concentrations of Hyperconcentrated flows can represent up to 55 % to 60 % of the total weight and 35 % to 40 % of the total volume (Pierson et al., 2009). Thus, the variability of the lahar density and rheology should be considered in the development of a risk model of this hazard.
The flow of lahars is guided by gravity and is capable of impacting elements located tens of kilometres away from the crater of the volcano (Parfitt and Wilson, 2008). Furthermore, lahars can reach velocities up to 140 km h−1 as observed in Mount St Helens in the United States in 1980 (Pierson, 1985). The velocity and composition of lahars make them highly destructive.
According to Vallance and Iverson (2015) and Bono (2014), the most important processes of a lahar are the erosion of the steep slopes and the scouring of beds and fluvial terraces. Even more significant is the erosion observed in steeper river valleys with weaker beds. Watery sediment floods are more erosive than sediment-rich flows. The scour of the riverbed drags material blocks, revetment and vegetation. Thus, most of the bridges affected by lahars are located in valleys in volcanic areas. The erosion and the associated loads of high velocity lahars, and the impact of debris travelling with them, may cause the collapse or permanent deterioration of bridges (Nairn, 2002). This explains, in part, the high vulnerability of bridges to lahar flows.
Relevant drivers of the destructive potential of a lahar affecting a bridge are the bed material, the slope, the season in which the lahar occurs, the existence of a glacier, rainfall and the prevailing temperatures during winter. The destructive potential of a lahar increases when the eruption occurs at the end of the winter, since in this season there is more accumulated snow compacted in layers and more volume of ice melting. This condition is enhanced if winter temperatures are low, because greater volumes of ice and snow melting in shorter lapses of time may increase the intensity of lahars (Moreno, 2015).
2.2 Bridge fragility curves for lahar risk modelling
In order to incorporate the uncertainty of the characteristics of lahar flows and the bridge engineering design (X), the use of fragility curves to quantify the probability of bridge failure due to lahars is proposed. Fragility curves express the probability that the damage state (DS) of a system exceeds different levels (dsi= slight, moderate, extensive or complete), given a certain hazard intensity (IM) (See Eq. 1). The fragility curves allow the failure probability of a system to be quantified due to an event of a specific intensity (Rossetto et al., 2013), representing the system vulnerability to a natural hazard. In this study, bridge fragility curves for a complete damage state level are developed.
Schulz et al. (2010) define four approaches for developing a system's fragility curves. First, there is the empirical approach, which is based on historical data and/or experiments. Second, fragility curves can be based on expert opinions as well. Third, fragility curves can also be developed using an analytical approach through models that characterize the limit state of the element, based on probabilistic and deterministic variables defining the system. Finally, a hybrid method can be used, which combines two or more of the approaches described above.
Since there are no existing models addressing lahar risk on bridges, a challenge for the development of bridge fragility curves consists of defining a unified lahar hazard intensity (IM). In general, the flow depth is a measure of hazard intensity of natural events that involve liquid flows. In the flood module of the HAZUS-MH software, the Federal Emergency Management Agency developed fragility curves using flow depth to quantify the hazard intensity (FEMA, 2011). Tsubaki et al. (2016) use the same variable (flow depth) for measuring the flood intensity when developing embankment fragility curves. Wilson et al. (2014) propose flow depth as one of the potential intensity measures for developing fragility curves related to lahar flows. In this paper lahar depth was used as the lahar hazard intensity, because this variable is correlated to other lahar flow characteristics, such as velocity and scour demand (Arneson et al., 2012).
3.1 Conceptual model
In order to model bridge fragility due to lahars, the analytical approach is based on reliability principles. The assessment of the bridge reliability can be considered a supply and demand problem associated with a bridge–lahar system defined by its basic variables vector (X). The supply function (S(X)) of the bridge corresponds to its capacity to resist the loads of the lahar. It is directly related to the design of the structural element. The demand function (D(X)) represents the load applied by the lahar on the bridge. The limit state function (g(X)) of the bridge–lahar system is given by the difference between the supply and demand functions (). If g(X) is lower than zero, the lahar loads on the structure are greater than the bridge capacity and hence, the bridge will fail.
With the purpose of conceptualizing the loads applied by the lahar flow on the bridge components, a bridge–lahar model was developed, which is shown in the free-body diagram in Fig. 1. It shows the generic cross section of a bridge and the main physical loads applied by the lahar on the bridge. The cross section of the bridge in Fig. 1 is composed by the substructure (pier/abutment) and the superstructure (deck and beams). The proposed failure models can be adapted to different bridge design criteria. In this paper, the Chilean design standards are considered for the fragility curve calibration. Thus, the proposed models assume that the foundation has no piles. This assumption is based on the fact that 88 % of the bridges exposed to the volcanic hazard from the Villarrica and Calbuco volcanoes do not have piles (Moreno, 1999, 2000). Additionally, it assumes a simple support of the superstructure on the piers and abutments, because this is the most common support mechanism in Chilean bridges.
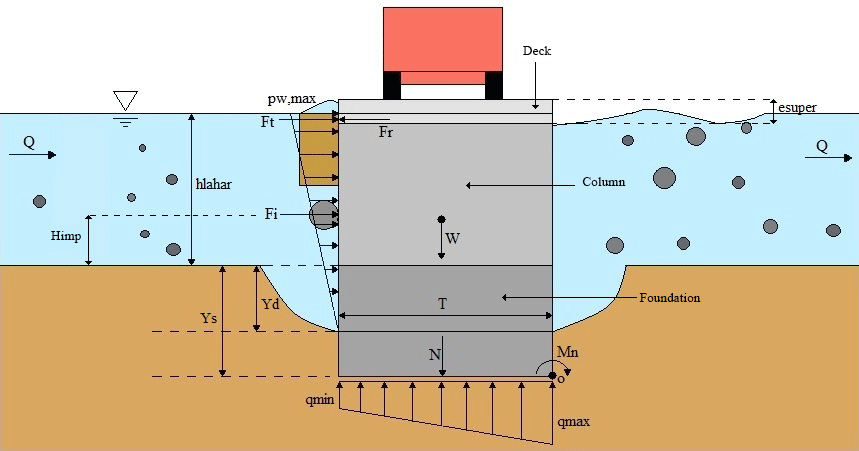
Figure 1Free-body diagram of bridge resisting and demanding forces and moments in the presence of a lahar.
Figure 1 shows a lahar with depth hLahar acting on a bridge of width T. Each pier or abutment of the bridge has a weight W. The foundation of the bridge's substructure (pier/abutment) was designed with a depth Ys, which represents the supply or capacity of the bridge to resist scour. The lahar flow demands a scour Yd on the bed around the foundation. The modelled lahar generates a hydrodynamic pressure pw, which acts perpendicular to the bridge. This pressure produces a resulting hydrodynamic tangential force Fwi on the piers and abutments, and a force Fws on the bridge superstructure. Furthermore, the debris transported by the lahar colliding with the bridge impacts the structure with a force Fi. The tangential force Ft corresponds to the sum of the hydrodynamic force and the debris impact force applied to the superstructure. The deck of the bridge resists the sliding caused by the lahar tangential force Ft with a friction force Fr. All the forces applied to the substructure produce a net resulting moment Mn on the lower-right vortex of the foundation. The net moment Mn is equal to the difference between the overturning moment (Mv) generated by the hydrodynamic force (Fwi) and the debris impact (Fi), and the resistant moment (Mr) produced by the weight W of the bridge.
3.2 Bridge failure mechanisms due to lahars
The hydrodynamic pressure of the lahar flow (pw) and the impact force of the debris (Fi) can cause the overturning of bridge piers and abutments. This is further enhanced by the scour that these flows generate around the foundations. The hydrodynamic pressure of the lahars, together with the potential impact of debris, can cause deck sliding.
With the aim of analysing the effects of lahars on bridges, failure mechanisms associated with three bridge components are defined: pier overturning, abutment overturning and sliding of the bridge superstructure. In addition to these failure mechanisms, the access embankment of the bridge may collapse. However, this component is not included in the modelling due to its lower replacement cost in relation to other bridge components. All these failure mechanisms are consistent with the postulates of Wilson et al. (2014) and the records of the lahar effects as a result of the eruptions of the Villarrica volcano and the Calbuco volcano in 2015 (MOP, 2015a, b). Images in Fig. 2a and b show the Río Blanco Bridge (Chile) before and after a lahar flow following the eruption of Calbuco volcano in 2015. Figure 2 shows the structural collapse of the bridge due to the overturning of the pier and subsequent sliding of the deck.
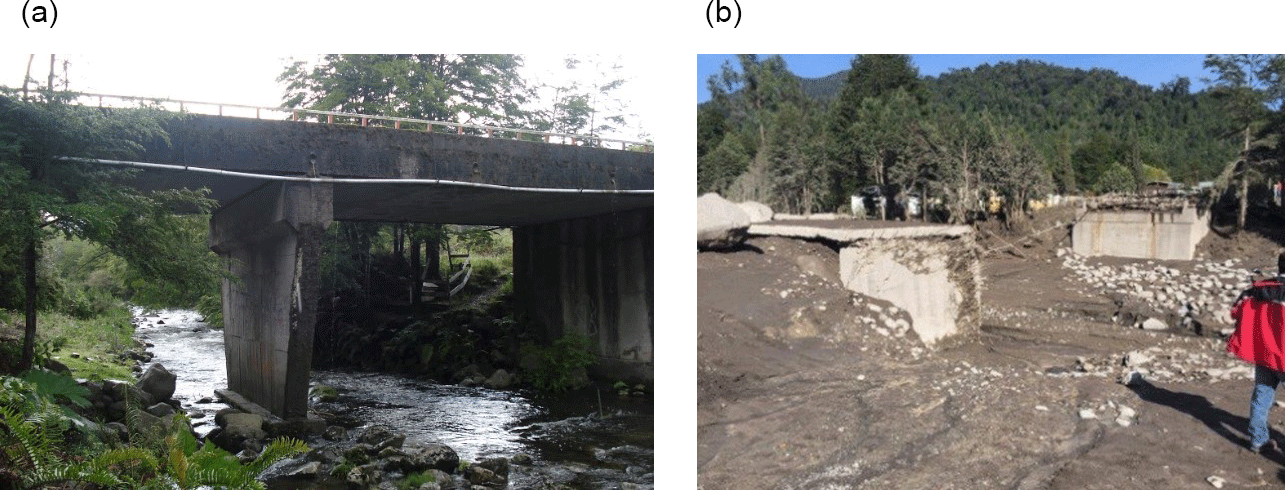
Figure 2(a) Original Río Blanco Bridge (Chile) (MOP, 2015b). (b) Río Blanco Bridge (Chile) after lahar flow of the Calbuco volcano eruption in 2015 (MOP, 2015b).
3.2.1 Substructure overturning (piers and abutments)
Both piers and abutments are components susceptible to overturning due to lahars. These dense and fast-travelling flows generate a resulting hydrodynamic force (Fwi) on the bridge substructure, which entails an overturning moment (Mwi). The impact force (Fi) of the debris on piers and abutments produces the overturning moment (Mi). The bridge weight W generates a moment (Mr) resisting the substructure overturning.
Through equilibrium of moments, considering the turning point O located in the vertex of the foundation, it is possible to evaluate the stability of the bridge piers and abutments in the presence of a lahar flow of a specific intensity. The overturning of piers and abutments is produced if the overturning moment () caused by the lahar on the component is greater than the resistant moment (Mr). In other words, the overturning is produced when the net moment (Mn) is less than zero.
A lahar can also cause the overturning of piers and abutments when the depth of the scour generated by the flow on the bed Yd(X) is greater than the design scour of the substructure Ys(X).
The above allows us to establish the limit state function gSO(X) related to the overturning of piers and abutments due to lahars. This function allows the overturning probability of the substructure to be quantified considering the parameters (X) of the system and the lahar intensity hLahar:
This function indicates that, given a lahar with height hLahar, the substructure will overturn if the overturning moment Mv is greater than the resistant moment Mr and/or the lahar scour demand Yd is higher than the design scour of the bridge Ys.
The scour caused by lahar flows near the foundations contributes to a greater vulnerability of these bridge components, since the lahars produce destabilization and weakening around the foundation of piers and abutments. If there is scour in the bed, the foundation of the pier or abutment will be exposed to a higher hydrodynamic pressure. This load is higher in the case of lahars, given their greater density and velocity in relation to normal floods. A greater scour demand will imply a larger surface affected by the hydrodynamic pressure. In turn, this means a greater resulting hydrodynamic force (Fwi) and, therefore, a greater moment associated with this force (Mwi).
3.2.2 Deck sliding
In the case where the lahar height exceeds the bridge clearance, the lahar flow will exert a hydrodynamic pressure on the bridge superstructure. There is also the possibility that the debris transported by the lahar flow impacts the bridge deck. This debris impact force (Fis), together with the hydrodynamic force (Fws), can cause failure due to deck sliding. The presence of microscopic imperfections between the contact surfaces of the superstructure (beams) and the substructure (piers and abutments) produces a static friction force (Fr) that opposes the start of the deck sliding.
Through the equilibrium of forces it can be inferred that the deck of a bridge subjected to a lahar will slide if the resulting tangential force () is higher than the static friction force (Fr) between the substructure and the superstructure. It should be highlighted that this force is zero if the lahar height is lower than the bridge clearance.
This allows the limit state function gDS(X) to be established. It is associated with the superstructure failure due to its potential sliding:
The limit state function defined in Eq. (5) implies that, under attribute X, if the friction force is lower than the tangential force produced by the lahar, the failure mechanism associated with sliding will be activated.
4.1 Physical models to estimate limit state functions
Once the limit state functions have been analytically defined, the loads presented in the free-body diagram have to be quantified. Therefore, physical existing models are used and integrated.
4.1.1 Lahar hydraulic attributes
First, the lahar mean velocity (vLahar) is quantified with Eq. (6), suggested by Chen (1983, 1985) for a fully dynamic debris flow in a channel with an arbitrary geometric shape. In this study, a rectangular shape is assumed. This formula incorporates the rheology of the lahar through the consistency index (μLahar), which was quantified by Laenen and Hansen (1988) for the case of lahars. The slope of the bed around the bridge (i) was measured by Bono (2014) to model the hydraulic behaviour of the main lahars of the Villarrica volcano. According to the measurements of Bono (2014), the range of the riverbed slope is limited, so there is a strong relationship between lahar depth and velocity.
The lahar hydrodynamic pressure (pw) is estimated with the AASHTO model (2012). This model considers a triangular distribution of this pressure, taking a value of zero in the deepest point and a maximum value in the flow surface. The hydrodynamic pressure is a function of the specific weight of the flow (γLahar), its velocity (vLahar) and the drag coefficient (CD).
4.1.2 Scour models
The lahar scour demand is based on the empirical equation proposed by Arneson et al. (2012). Müller (1996) compared 22 equations proposed in the literature to estimate scour; he used empirical data from 384 field measurements of 56 bridges. The conclusion of Müller (1996) was that the equation proposed by Arneson et al. (2012) in the Hydraulic Engineering Circular No. 18 (HEC-18) was suitable for quantifying the scour depth.
Debris transported by the flows accumulates in the bridge piers, creating an additional obstruction to the flow. To incorporate the debris accumulation, the scour demand on the piers (Yd−p) is modelled with Eqs. (8) and (9) of the NCHRP (2010). The equations proposed by the NCHRP adjust the scour model proposed by the HEC-18 to estimate the scour generated by debris flows and lahars. The adjusted model considers a triangular or rectangular debris accumulation (shape factor KE) with height Hd and width Wd to estimate an effective widening () of the pier with width b (See Eq. 9). It should be noted that factors K1, K2 and K3 are correction factors of the pier shape, the flow angle and the bed condition, respectively.
According to the HEC-18, the scour demand on the abutments (Yd−a) is based on the flow depth (hLahar), the flow width (bFlow), the bridge length (LBridge) and a bed condition amplification factor (α).
The scour supply is estimated with models adapted from bridge design manuals. For example, Breusers et al. (1977) stipulate that Eqs. (11) and (12) assess the design scour of piers (Ys−p) and abutments (Ys−a). These equations include variables such as design height (hDesign), pier width (b) and correction factors by flow angle, pier shape, among others. For the design of bridge foundations, the Highway Manual of the Ministry of Public Works (MOP, 2016) suggests considering a depth equal to 2.0 m below the scour level. The design height of the flow (hDesign) is considered equal to the bridge vertical clearance minus the distance between the design water depth and the lowest level of the superstructure, which is equal to 1.0 m according to the Highway Manual (MOP, 2016).
4.1.3 Substructure overturning moment and deck tangential force
The overturning moment (Mv) produced by lahars on the bridge substructure is given by the sum of the hydrodynamic moment (Mwi) and the debris impact moment (Mi). The tangential force (Ft) on the deck corresponds to the sum of the resulting force from the hydrodynamic pressure on the deck (Fws) and the debris impact force (Fis). Considering the pressure model showed in Eq. (7), the hydrodynamic moment generated by the lahar on the substructure (Mwi) can be estimated. In the case of substructure, the hydrodynamic moment is separated into two parts: the foundation and the column. This separation is supported by the fact that these elements have different geometry and that the pressure has a triangular distribution over the foundation and trapezoidal distribution over the column (Fig. 1).
The resulting hydrodynamic force exerted by the lahar on the foundation (Fw, found) and the height at which this force acts with respect to the turning axis (yw, found) are given by Eqs. (14) and (15), where the variable T corresponds to the bridge width:
The hydrodynamic force on the column (Fw, column) and its application point (yw, column) depend on whether the height of the lahar exceeds the height of the column or not. To incorporate this, the variable h* was defined, which is given by the minimum between the lahar height (hLahar) and the column height (hDesign).
In order to quantify the hydrodynamic force of the lahar on the deck (Fws), three criteria should be met: (1) the lahar height is lower than the bridge clearance, (2) the lahar height is greater than the clearance but lower than the roadway level, (3) the lahar height is greater than the roadway level. In the model, the roadway level is given by the sum of the substructure height (hDesign), and the superstructure thickness (eSuper).
To quantify the impact of debris on the bridge, the model of Haehnel and Daly (2004) is used. This model assesses the impact force through a one-degree-of-freedom system assuming a rigid structure. Thus, the impact force of gravel transported by a lahar on the bridge is based on the flow velocity (vLahar), the specific weight of the gravel (γGravel), the gravel diameter (DGravel) and the contact stiffness of collision (). Debris impact force on the deck (Fis) is given by Eq. (19).
The moment of debris impact (Mi) on the substructure with respect to the rotation axis is shown in Eq. (20). This indicates that if the impact height (himp) is greater than the substructure (hDesign), the associated moment is zero. For the impact height, a triangular distribution with the mode equal to the lahar height is assumed, considering that the debris tends to collect in the flow surface (Zevenbergen et al., 2007).
4.1.4 Substructure resistant moment and deck friction force
The substructure capacity to oppose overturning depends on the design and condition of the bridge elements, including the bridge geometry, materials and the scour design (Ys−p and Ys−a). Thus, the lahar loads on the bridge and the scour are considered only in the demand function (overturning moment Mv). The resistant moment (Mr) of the substructure to lahars is given by the weight (W) of the pier or abutment and the elements that are supported on it. Among the elements supported by the substructure, the superstructure and the soil on the abutment foundations must be considered. The weight of the piers and abutments without considering the soil and the superstructure are as follows:
The weight of the soil on the abutment foundation in the access to the bridge is given by Eq. (22).
The model considers that the weight of the superstructure is distributed uniformly in all its supports (NA). Thus, the force exerted by the superstructure on each foundation is as follows:
Since the elements of the modelled bridge are symmetrical with respect to the vertical axis, the weight acts at a distance T∕2 from the overturning point. Thus, the resistant moment of the substructure is given by the following expression:
Finally, the force that opposes the deck sliding corresponds to the friction between the superstructure and the substructure. This force is given by Eq. (25):
4.2 Values of the variables involved in the limit state functions
In order to quantify the independent variables of the limit state function, the first step is to define the nature of the variables, based on their degree of uncertainty. The system bridge–lahar presents random variables associated with lahar hazard, such as lahar density and debris accumulation. To quantify these variables, probability distribution functions are used, based on studies prepared by the Chilean National Geology and Mining Service (Sernageomin) (Castruccio et al., 2010; Bono, 2014) and the United States Geological Survey (Pierson et al., 2009; Vallance and Iverson, 2015).
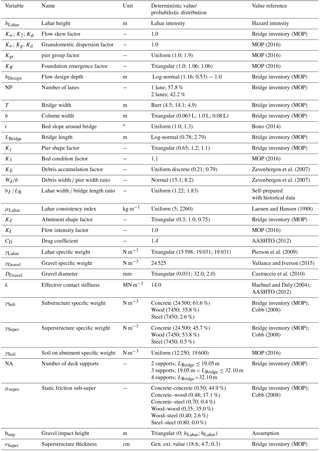
Furthermore, regarding variables associated with the bridges' capacity to resist lahars, random variables are also considered due to the uncertainty in the bridge design. Goodness of fit tests were undertaken to determine the probability functions and the parameters of these variables using the information from the Chilean bridge inventory and the Highway Manual of the Ministry of Public Works (MOP, 2016). Table 1 summarizes the values of the variables involved in the limit state functions.
5.1 Monte Carlo simulations for fragility curve calibration
Reliability analysis comprises analytical solution methods and numerical solution methods. Analytical solution methods feature the first-order second-moment (FOSM) method, the first-order reliability method (FORM) and the second-order reliability method (SORM). Numerical solution methods include the Monte Carlo simulation (MCS) and the response surface method (RSM). The MCS method is used to develop bridge fragility curves due to lahars. The choice of the MCS as the solution method is based on the limitations of the analytical solution methods with regard to the probability distributions of the random variables (Schultz et al., 2010). MCS allows us to incorporate the uncertainty of the characteristics of lahars and the structure in the quantification of the bridge failure probability, without the mentioned limitation.
With the limit state functions and variables already defined, the Monte Carlo simulations can be performed. Therefore, a fixed intensity lahar h1 is considered. The probability distributions of the system's random variables imply the obtainment of different values of limit state functions g(X). If this function is less than zero in a specific simulation, it means that in this simulation the bridge fails due to a lahar with intensity h1. The bridge failure probability due to a lahar of intensity h1 is equal to the sum of the number of simulations where function g(X) is negative, divided by the number of total simulations with this intensity (NS) (Vorogushyn et al., 2009).
Simulations with fixed intensity h1 allow the failure probability of the fragility curve at the abscissa h1 to be quantified. This experiment is carried out repeatedly for several intensity levels, to obtain the complete fragility curve for each failure mechanism identified. Specifically, 10 000 simulations were performed for each intensity level. The failure probability is quantified for lahar heights discretized every 0.25 m.
5.2 Calibrated bridge fragility curves due to lahars
5.2.1 Fragility curves by bridge failure mechanism
Once the supply and demand functions of the failure mechanisms are defined together with their variables, simulations are run for a fixed lahar height level h1. The percentage of simulations where function gSO(X) is less than zero is equivalent to the overturning probability of the substructure in the presence of a lahar of h1. After doing this for different lahar height levels, the overturning fragility curves of the piers and abutments are obtained. The same experiment was performed for the function gDS(X) to calibrate the deck-sliding fragility curve. Figure 3 shows the fragility curves by bridge failure mechanism.
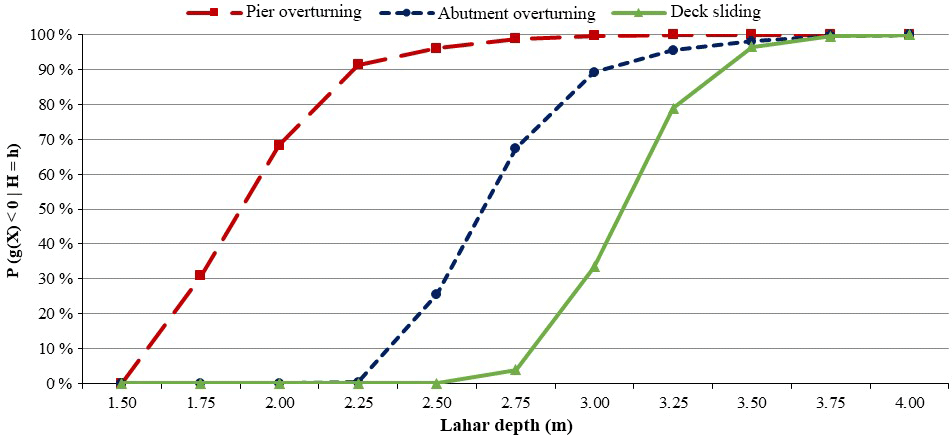
Figure 3Fragility curves for bridge substructure overturning and deck sliding due to lahars.
The analysis of substructure overturning fragility curves allows us to conclude that, when impacted by lahar flows, piers are more susceptible to overturn than the abutments. Given any intensity level of the hazard, piers have a greater probability of overturning than abutments. The functional shape of the overturning fragility curves shows that, regarding the abutments; the maximum failure probability increase is achieved when the intensity grows from 2.5 to 2.75 m, where the failure probability increases by 41.8 percentage points. In the case of piers, the maximum growth of the probability of failure is reached between 1.75 and 2.0 m increasing the overturning probability by 37.4 percentage points.
When analysing the deck-sliding fragility curve, the deck failure probability is zero if the lahar intensity is less than or equal to 2.50 m. This is mainly due to the fact that a low-height lahar does not reach the bridge clearance and, consequently, the flow does not affect the superstructure. Nevertheless, if the intensity of the lahar exceeds this level, the failure probability increases rapidly. The growth rate of this fragility curve also has a maximum, which is reached when the lahar arrives at 3.25 m, particularly if the lahar increases from 3.0 to 3.25 m and the sliding probability of the deck increases by 45.5 percentage points. This is mainly due to the fact that if the lahar reaches 3.50 m, it already touches the road elevation of most bridges of the inventory.
5.2.2 Fragility curves by bridge categories
The previous analysis allows us to conclude that a relevant factor in a bridge failure due to a lahar is the presence of piers. Therefore, two bridge categories were defined: bridges with one span (C1) and bridges with multiple spans (C2). Category C1 corresponds to bridges with substructure composed only of abutments and category C2 represents bridges with one or more piers.
To obtain the fragility curves for these two bridge categories, each simulation considered that the failure of the bridge occurs when at least one of its components fails. For example, a bridge of category C1 fails when the abutment overturns and/or when the deck slides. A category C2 bridge fails when the pier or abutment overturns and/or the deck slides. The fragility curves of C1 and C2 bridges are developed using the same failure models for the abutments and the deck. Figure 4 shows the fragility curves for both bridge categories, in addition to the failure probability of each component in a histogram.
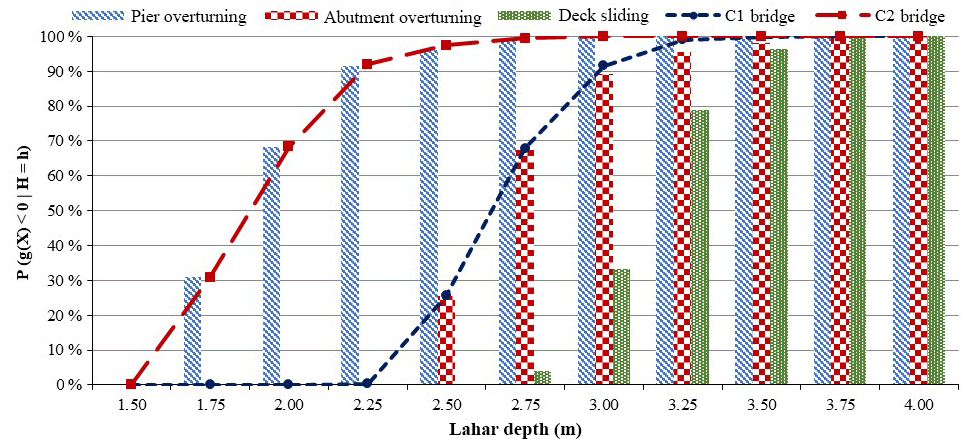
Figure 4 allows us to conclude that bridges with one span (C1) are stronger than bridges with two or more spans (C2) in the presence of lahar flows. The reason is that piers are more susceptible to overturn than abutments. The failure of bridges with one span is guided by the abutments overturning, while in the bridges with multiple spans, the failure is guided by the piers overturning. The deck sliding is not a triggering factor of bridge failures due to lahars generated by the Villarrica and Calbuco volcanoes.
5.3 Parameterization of bridge fragility curves due to lahars
When considering risk management from a strategic point of view, the parameterization of bridge fragility curves due to lahars entails a series of advantages. It allows us to directly estimate the failure or collapse probability of each bridge category based on the lahar depth. Moreover, it allows the failure probability to be continuously quantified, that is, not every 25 cm of lahar.
For the parameterization of fragility curves, a cumulative log-normal distribution is considered. When assessing parameters μ and β of the cumulative log-normal distribution reflecting the fragility curve, the bridge failure probability associated with a lahar of intensity hi can be estimated through the following equation:
The method of maximum likelihood estimation (MLE) was used for fragility curve parameterization. This tool allows the distribution parameters that maximize the occurrence probability of data obtained in the Monte Carlo simulations to be determined. In this case, the objective of the MLE is to determine the value of the bridge failure probability (pi) due to a lahar of intensity hi that maximizes the probability of obtaining the pairs (ni, Ni) associated with the simulations of all lahar intensity levels hi. This is obtained by maximizing the likelihood function, which is equal to the product of the binomial probabilities for each height level hi.
Considering a fragility curve with cumulative log-normal distribution, pi is replaced by the cumulative log-normal function, and parameters μ and β are estimated. In this case, it is best to maximize the likelihood logarithm instead of the likelihood function. Thus, parameters of the cumulative log-normal distribution are obtained through the following expression proposed by Lallemant et al. (2015):
Parameters μ and β were obtained by iterating their values and finding the combination that maximizes Eq. (30). The process was carried out for bridges with one span (C1) and bridges with multiple spans (C2). For bridges without piers (C1), the result was that the likelihood function is maximized with μ equal to 0.98 and β equal to 0.08. In this manner, we conclude that the failure height of bridges with one span (C1) due to lahars can be modelled with a cumulative log-normal distribution (μ=0.98; β=0.08). Regarding the bridges with two or more spans (C2), collapse height due to lahars could be represented by a cumulative log-normal distribution with μ equal to 0.63 and β equal to 0.13. Figure 5 shows both analytical fragility curve and parameterized fragility curve of bridges with one span (C1) and with two or more spans (C2).
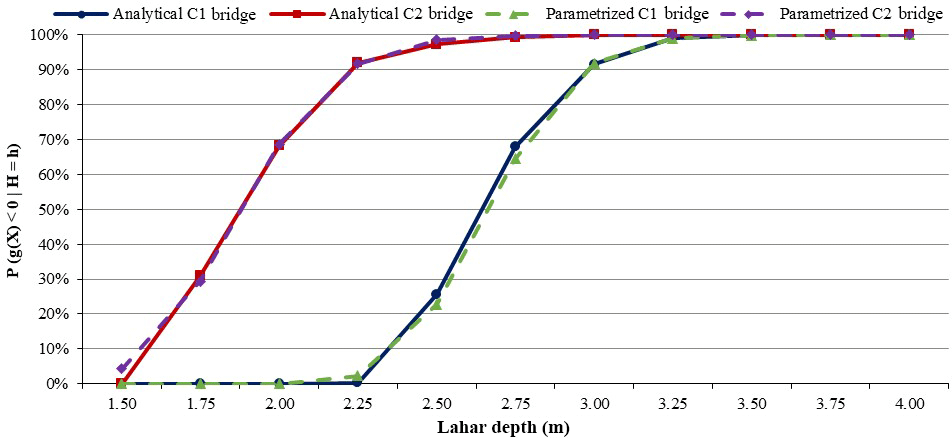
Figure 5Analytical and parameterized fragility curves for one-span bridges (C1) and multiple-spans bridges (C2).
The bridge failure models presented in Sect. 4 are based on physical models and expressions recommended in the literature; for example, this includes the equations given by the Highway Manual of the Chilean Ministry of Public Works (MOP, 2016) for estimating the scour supply in order to design bridges as well as the expressions of HEC-18 (Arneson et al., 2012) for quantifying the scour demand of the flows. All this requires an empirical evaluation of the developed analytical failure models.
The bridge failure models are evaluated empirically using data from historical lahars of Chile. Considering the attributes of the historical lahars and bridges that were affected, the models quantify the net moment (Mn) and net force (Fn) exerted by the flow on the bridge. If the demand moment or force exceeds that of supply, the models indicate that the analysed bridge failed due to that historical lahar. The model's result for each bridge (failure/not failure) is compared with that indicated in the damage reports. For the evaluation, the damage attributes and records of lahars produced during the eruptions of the Villarrica volcano in 1964, 1971 and 2015, and the Calbuco volcano in 1961 and 2015 were used. The historical information was compiled from Klohn (1963), Naranjo and Moreno (2004), Moreno et al. (2006), MOP (2015a, b) and Flores (2016). The results of the bridge failure models after empirical evaluation are shown in Table 2.
Table 2Results of the bridge failure models after empirical evaluation using field records.
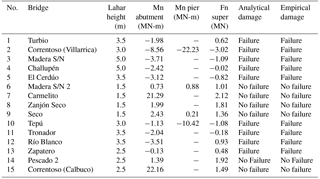
The 15 historical cases evaluated analytically with the failure models, considering the specific inputs of the system, have the same state of damage (failure/no failure) as that reported experimentally by the agencies. The historical data of Table 2 consider lahars from 1.5 to 5.0 m of depth, covering the entire range of hazard intensity of developed fragility curves (1.5 to 4.0 m). The density of the evaluated lahars ranges from 16 000 to 19 000 N m−3, the slope from 1.0 to 1.2∘, the bridge length from 11.3 to 72.5 m, the bridge width from 3.9 to 8.3 m, the bridge height from 2.5 to 5.5 m, the number of deck support from 0 to 5, the bridge height from 2.5 to 8.3 m, the number of deck support from 0 to 5; the bridge materials are concrete and wood, the number of bridge lanes are 1 and 2. Thus, the evaluated empirical data demonstrate representativeness of the range of the basic variables of the analytical models (Table 1).
Through this satisfactory evaluation we conclude that the existing models integrated in the limit state functions and the values of the used variables reflect the stability of the bridge due to a lahar flow. This allows us to infer that the developed failure models represent the fragility of their components in the presence of these flows.
The analysis of the models and equations used in the limit state functions demonstrates that the lahar depth is the main variable in the quantification of lahar loads and bridge capacity to response to these flows. The lahar velocity, the scour demand, the hydrodynamic pressure and the height of the debris impact depend on the flow height. Thus, it is concluded that this variable can be used to represent the hazard intensity in the fragility curves associated with lahars.
In order to validate parameterized fragility curves, the analytical bridge failure probability (pa) for a lahar intensity hLahar should be statistically compared with the empirical failure probability (pe) for the same lahar intensity. The empirical failure probability pe can be estimated as the proportion of bridges reached by historical lahars with intensity hLahar that were destroyed. However, there is insufficient empirical data to provide a statistical validation of the bridge fragility curves. There are only 15 empirical points (hLahar, pe) to validate two fragility curves (C1 bridges and C2 bridges). Thus, a deficiency of empirical data on impacts of lahars on bridges is identified.
Regarding the simulations of calibrated fragility curves for the overturning of piers and abutments, it is worth noting the greater contribution of the moment associated with the hydrodynamic pressure than the debris impact. The average impact moment does not exceed 0.21 % of the hydrodynamic moment in the case of piers and 0.39 % for abutments. Moreover, it should be noted that the contribution percentage of the impact moment decreases as the lahar height increases.
Concerning the deck sliding, it is important to indicate that the net force is kept relatively constant when the lahar depth is lower than or equal to 2.5 m. This is because the tangential force of the lahar on the superstructure is null. Afterwards, when the lahar reaches the beams and decks, the average, minimum and maximum net forces obtained in the simulations start to decrease. For example, the average net force is negative when the lahar height is higher than or equal to 3.25 m, where the failure probability is 78.9 %. Moreover, if the lahar intensity is higher than or equal to 4.0 m, the deck has a 100 % probability of sliding, because the maximum net force obtained in the simulations is negative.
Furthermore, the results showed that the contribution of the force of the debris impact on the superstructure is lower in relation to the hydrodynamic force. In this particular case, the maximum average impact force represents 0.68 % of the hydrodynamic force. The reason is that the impact of debris on the superstructure is infrequent, since it requires the height of the impact to be higher than the height of the substructure but lower than the road elevation. Nevertheless, if such an impact should occur, the impact force would be high.
Regarding the fragility curves by bridge categories, the failures of bridges from category C2 is mainly due to the overturning of piers. In fact, when the lahar height is less than or equal to 2.0 m, the pier is the only triggering component, because the other ones have no failure probability. The failure probability of the abutments is greater than zero when the lahar intensity is greater than or equal to 2.25 m. At that intensity level, the pier already has a failure probability of 91.4 %, which means that the influence of the abutment on the bridge failure is lower. That is why the fragility curve of C2 bridges is similar to that of the piers overturning.
Something similar occurs in one-span bridges (C1). In this case, the triggering component is the abutment, because it is more vulnerable to lahars than the deck. When the flow depth is higher than 2.25 m and lower than 2.5 m, the C1 bridges can fail only if the abutments overturn, since the sliding probability of the deck is zero. The deck-sliding probability is no longer null at 2.75 m but reaches a sliding probability of just 3.9 % compared with an abutment overturning probability of 67.4 %. Therefore, the abutment is always the main failure factor in this type of bridge.
In this paper, bridge failure models and bridge fragility curves due to lahars are proposed, considering pier and abutment overturning as well as deck sliding. The model development considers the calibration and parameterization of bridge fragility curves due to lahars based on limit state models. Two types of bridges were considered in the analysis: one-span and multiple-span bridges. Monte Carlo simulations were applied to estimate the failure probability given by different lahar depths. Fragility curves of bridges were parameterized by maximum likelihood estimation, using a cumulative log-normal distribution. Through the satisfactory empirical evaluation of the failure models, we concluded that the models included in the limit state functions and the proposed values to characterize lahar flows are representative of prevailing loads and bridge capacity. The empirical data deficiency demonstrate the need to develop more effective protocols to report damage from volcanic events on bridges. With this, the empirical validation of developed fragility curves is a source of future research.
The analysis of the fragility curves demonstrated that decks fail due to substructure overturning prior to sliding. The likelihood of deck-sliding failure below a 2.75 m lahar height is zero because decks are above that height. In the presence of a lahar of 2.75 m height, the pier and abutment overturning probabilities are 98.9 % and 67.4 %, respectively. This implies that the probability that the deck fails and the substructure does not fail is 0.01 %, considering that these are independent events. In addition, the research concluded that bridges with multiple spans are more vulnerable to lahar flows compared to bridges with one span. The most evident difference between these bridges was obtained in the lahars of height 2.25 m. Given this intensity, bridges with one span (C1) have a 0.3 % probability of failure, while those with multiple spans (C2) have a 92.0 % probability of failure. This result was expected because, when impacted by lahars, piers are more susceptible to overturn than abutments.
With the developed fragility curves, agencies can determine the failure probability of bridges due to a lahar presenting a specific depth. The proposed failure models can be adapted and calibrated to bridge designs that are different from the structures accounted for in the article. When required, the supply function considered in the models can be conditioned to local bridge design standards and adjusted accordingly.
For the application of these models, it is recommended that expected hazard scenarios, in terms of recurrence and intensity, should be first simulated. The resulting hazard intensity can then be estimated for the affected road network, in particular exposed bridges, and their failure probability can consequently be calculated. Further research is being conducted in this regard; that is a computational platform is being developed for the consistent application of the developed fragility curves for the exposed networks. With this, local authorities can review their road and bridge designs and existing infrastructure in order to assess and apply mitigation strategies prior to the occurrence of a volcanic event.
The data used in the failure models are available in AASHTO (2012), Arneson et al. (2012) and MOP (2016). Other details of the analytical scour models are provided in NCHRP (2010) and can be provided on demand.
The authors declare that they have no conflict of interest.
The authors thank the National Commission for Scientific and Technological
Research (CONICYT), which has financed the FONDEF Project ID14I10309
Research and Development of Models to Quantify and Mitigate the Risk of
Natural Hazards in the National Road Network. Likewise, we express our
gratitude to the institutions that participated and contributed to this
research project, especially to the Research Center for Integrated Disaster
Risk Management CONICYT/FONDAP/15110017 (CIGIDEN), the Highways Department
of the Chilean Ministry of Public Works and the National Geology and Mining
Service of the Chilean Ministry of Mining, the National Emergency Office of
the Ministry of Interior and Public Security (ONEMI) and the Chilean
Association of Concessionaires (COPSA).
Edited by: Thom Bogaard
Reviewed by: two anonymous referees
AASHTO: American Association of State Highway and Transportation Officials: LRFD bridge design specifications, AASHTO, Washington D.C., USA, 2012.
Arneson, L., Zevenbergen, L., Lagasse, P., and Clopper, P.: Evaluating scour at bridges: Hydraulic Engineering Circular No. 18, Federal Highway Administration Publications, Washington D.C., USA, 2012.
Blong, R. J.: Volcanic hazards: a sourcebook on the effects of eruptions, Academic Press, Sidney, Australia, 1984.
Bono, L.: Modelación de los lahares del Volcán Villarrica en el sector de Pucón, Región de la Araucanía, Memoria de Título, Universidad de Chile, Santiago, Chile, 2014.
Breusers, H., Nicollet, G., and Shen, H.: Local scour around cylindrical piers, J. Hydraul. Res., 15, 211–252, 1977.
Castruccio, A., Clavero, J., and Rivera, A.: Comparative study of lahars generated by the 1961 and 1971 eruptions of Calbuco and Villarrica volcanoes, Southern Andes of Chile, J. Volcanol. Geoth. Res., 190, 297–311, 2010.
Chen, C.: On frontier between rheology and mudflow mechanics, in: Proceedings of the Conference on Frontiers in Hydraulic Engineering, ASCE/M.I.T., Cambridge, MA, 9–12 August 1983, 113–118, 1983.
Chen, C.: Hydraulic concepts in debris flow simulation, in: Proceeding specialty conference delineation of landslides, flash flood, and debris flow hazards in Utah, Utah State University, Logan, Utah, 236–259, 1985.
Cobb, F.: Structural engineers pocket book, British Standard Edition, CRC Press: Taylor & Francis Group, London, UK, 2008.
FEMA: Federal Emergency Management Agency: Flood model: HAZUS-MH MR3 technical manual, FEMA, Washington D.C., USA, 2011.
Flores, F.: Dynamics of 2015 Villarrica and Calbuco lahar flows, in: Cities on Volcanoes 9, Servicio Nacional de Gelogía y Minería, Puerto Varas, Chile, 2016.
Haehnel, R. and Daly, S.: Maximum impact force of woody debris on floodplain structures, J. Hydraul. Eng., 130, 112–120, 2004.
Jenkins, S. and Spence, R.: Vulnerability curves for buildings and agriculture, in: Technical Report D4.D for EU FP7-ENV project MIA-VITA, European Commission, Paris, France, 2009.
Kaye, G. D.: Volcanic hazard risk assessment for the RiskScape program, with test application in Rotorua, New Zealand, and Mammoth Lakes, USA, PhD thesis, University of Canterbury, Christchurch, New Zealand, 2008.
Klohn, E.: The february 1961 eruption of Calbuco volcano, B. Seismol. Soc. Am., 53, 1435–1436, 1963.
Laenen, A. and Hansen, R. P.: Simulation of three lahars in the Mount St. Helens area, Washington, using a one-dimensional unsteady state streamflow model, U.S. Geological Survey, Portland, USA, 1988.
Lallemant, D., Kiremidjian, A., and Burton, H.: Statistical procedures for developing earthquake damage fragility curves, Earthq. Eng. Struct. D., 44, 1373–1389, 2015.
Leonard, G. S., Johnston, D. M., Williams, S., Cole, J. W., Finnis, K., and Barnard, S.: Impacts and management of recent volcanic eruptions in Ecuador: lessons for New Zealand, GNS Science Report 2005/20, Institute of Geological & Nuclear Sciences, Lower Hutt, New Zealand, 2005.
MOP: Ministerio de Obras Públicas: Minuta emergencia Volcán Villarrica: Región de La Araucanía, in: Emergencia Volcán Villarrica 2015, Temuco, Chile, April 2015, Dirección de Vialidad, Santiago, Chile, 2015a.
MOP: Ministerio de Obras Públicas: Minuta emergencia Volcán Calbuco: Región de Los Lagos, in: Emergencia Volcán Calbuco 2015, Puerto Montt, Chile, June 2015, Dirección de Vialidad, Santiago, Chile, 2015b.
MOP: Ministerio de Obras Públicas: Instrucciones y criterios de diseño, in: Manual de Carreteras, Ministerio de Obras Públicas, Vol. 3, Santiago, Chile, 2016.
Moreno, H.: Mapa de peligros del volcán Calbuco, Región de Los Lagos, Servicio Nacional de Geología y Minería, Documento de Trabajo No. 12, map scale 1 : 75 000, Santiago, Chile, 1999.
Moreno, H.: Mapa de peligros del volcán Villarrica, Regiones de la Araucanía y de Los Lagos, Servicio Nacional de Geología y Minería, Documento de Trabajo No. 17, map scale 1 : 75 000, Santiago, Chile, 2000.
Moreno, H.: El Volcán Villarrica y su actividad, Servicio Nacional de Geología y Minería, Pucón, Chile, 2015.
Moreno, H., Naranjo, J., and Clavero, J.: Generación de lahares calientes en el volcán Calbuco, in: XI Congreso Geológico Chileno, Universidad Católica del Norte, Antofagasta, Chile, 7–11 August 2006, 513–516, 2006.
Muñoz-Salinas, E., Manea, V. C., Palacios, D., and Castillo-Rodríguez, M.: Estimation of lahar flow velocity on Popocatepetl volcano (Mexico), Geomorphology, 92, 91–99, 2007.
Müller, D.: Local scour at bridge piers in nonuniform sediment under dynamic conditions, PhD thesis, Colorado State University, Colorado, USA, 1996.
Nairn, I. A.: The effects of volcanic ash fall (tephra) on road and airport surfaces, Institute of Geological & Nuclear Sciences, Lower Hutt, New Zealand, 2002.
Naranjo, J. A. and Moreno, H.: Laharic debris-flows from Villarrica volcano, in: Boletìn Servicio Nacional de Geologìa y Minerìa, 61, Santiago, Chile, 28–38, 2004.
NCHRP: National Cooperative Highway Research Program: NCHRP Report 653: Effects of debris on bridge pier scour, Transportation Research Board, Washington D.C., USA, 2010.
Parfitt, E. A. and Wilson, L.: Fundamentals of physical volcanology, Blackwell Publishing, Massachusetts, USA, 2008.
Pierson, T.: Initiation and flow behavior of the 1980 Pine Creek and Muddy River lahars, Mount St Helens, Washington, Geol. Soc. Am. Bull., 96, 1056–1069, 1985.
Pierson, T., Scott, W., and Vallance, J.: Eruption-related lahars and sedimentation response downstream of Mount Hood: Field guide to volcaniclastic deposits alongthe Sandy River, Oregon, in: Volcanoes to Vineyards: Geologic Field Trips through the Dynamic Landscape of the Pacific Northwest, The Geological Society of America, Seattle, United States, 221–236, 2009.
Rossetto, T., Ioannou, I., and Grant, D. N.: Existing empirical vulnerability and fragility functions: compendium and guide for selection, GEM Technical Report 2013-X: GEM Foundations, Pavia, Italy, 2013.
Schultz, M. T., Gouldby, B. P., Simm, J. D., and Wibowo, J. L.: Beyond the factor of safety: developing fragility curves to characterize system reliability, U.S. Army Corps of Engineers (USACE): Engineer Research and Development Center (ERDC SR-10-1), Washington D.C., USA, 2010.
Smith, G. A. and Fritz, W. J.: Volcanic influences on terrestrial sedimentation, Geology, 17, 375–376, 1989.
Spence, R. J. S., Kelman, I., Baxter, P. J., Zuccaro, G., and Petrazzuoli, S.: Residential building and occupant vulnerability to tephra fall, Nat. Hazards Earth Syst. Sci., 5, 477–494, https://doi.org/10.5194/nhess-5-477-2005, 2005.
Spence, R., Kelman, I., Brown, A., Toyos, G., Purser, D., and Baxter, P.: Residential building and occupant vulnerability to pyroclastic density currents in explosive eruptions, Nat. Hazards Earth Syst. Sci., 7, 219–230, https://doi.org/10.5194/nhess-7-219-2007, 2007.
Tsubaki, R., Bricker, J. D., Ichii, K., and Kawahara, Y.: Development of fragility curves for railway embankment and ballast scour due to overtopping flood flow, Nat. Hazards Earth Syst. Sci., 16, 2455–2472, https://doi.org/10.5194/nhess-16-2455-2016, 2016.
UNISDR: UNISDR Terminology on Disaster Risk Reduction, United Nations, Geneva, Switzerland, 2009.
Vallance, J. and Iverson, R.: Lahars and their deposits, in: The Encyclopedia of Volcanoes, 2 edn., Elsevier, San Diego, USA, 649–664, 2015.
Vorogushyn, S., Merz, B., and Apel, H.: Development of dike fragility curves for piping and micro-instability breach mechanisms, Nat. Hazards Earth Syst. Sci., 9, 1383–1401, https://doi.org/10.5194/nhess-9-1383-2009, 2009.
Waitt, R. B.: Lahar, in: Encyclopedia of Natural Hazards, Springer, Dordrecht, the Netherlands, 579–580, 2013.
Wilson, T. M., Stewart, C., Sword-Daniels, V., Leonard, G., Johnston, D. M., Cole, J. W., Wardman, J., Wilson, G., and Barnard, S.: Volcanic ash impacts on critical infrastructure, Phys. Chem. Earth, 45, 5–23, 2012.
Wilson, G., Wilson, T., Deligne, N., and Cole, J.: Volcanic hazard impacts to critical infrastructure: A review, J. Volcanol. Geoth. Res., 286, 148–182, 2014.
Wilson, G., Wilson, T., Deligne, N., Blake, D., and Cole, J.: Framework for developing volcanic fragility and vulnerability functions for critical infrastructure, Journal of Applied Volcanology, 6, 1–24, 2017.
Zevenbergen, L., Lagasse, P., and Clooper, P.: Effects of debris on bridge pier scour, in: World Environmental and Water Resources Congress 2007: Restoring our Natural Habitat, Environmental and Water Resources Institute of ASCE, Tampa, USA, 15–19 May 2007, 2007.
Zuccaro, G. and De Gregorio, D.: Time and space dependency in impact damage evaluation of a sub-Plinian eruption at Mount Vesuvius, Nat. Hazards, 68, 1399–1423, 2013.
- Abstract
- Introduction
- Characterization of lahars for the development of fragility curves
- Development of failure models for bridge pier/abutment overturning and deck sliding due to lahars
- Proposal for modelling substructure overturning and deck sliding due to lahars
- Calibration and parameterization of bridge fragility curves due to lahars
- Evaluation of the bridge failure models against empirical data and analysis of results
- Conclusions and recommendations
- Data availability
- Competing interests
- Acknowledgements
- References