the Creative Commons Attribution 4.0 License.
the Creative Commons Attribution 4.0 License.
 | 08 Aug 2018
Natural hazard events affecting transportation networks in Switzerland from 2012 to 2016
Jérémie Voumard
Marc-Henri Derron
Michel Jaboyedoff
Switzerland is threatened by many natural hazards. Many events occur in built-up environments, affecting infrastructure, buildings, and transportation networks, occasionally producing expensive damages. This expense is why large landslides are generally well studied and monitored in Switzerland to reduce the financial and human risks. However, there is a lack of data on small events, which have recently affected roads and railways. Therefore, in this study, all of the reported natural hazard events that have affected Swiss transportation networks since 2012 were collected in a database. More than 800 events affecting roads and railways were recorded within in a 5-year period from 2012 to 2016. These events are classified into six classes: earth flow, debris flow, rockfall, flood, snow avalanche, and others.
Data from Swiss online press articles were sorted by Google Alerts. The search was based on more than 30 keywords in three languages (Italian, French, and German). After verification that the article was related to an actual event that affected a road or a railway track, it was studied in detail. We collected information on more than 170 attributes of events, such as the event date, event type, event localization, meteorological conditions, impacts and damages on the track, and human damages. From this database, a variety of trends over the 5-year period can be observed in the event attributes, particularly the spatial and temporal distributions of the events, and their consequences on traffic (closure duration, deviation, costs of direct damage).
The database is imperfect due to the short period of data collection, but it highlights the non-negligible impact of small natural hazard events on roads and railways in Switzerland at a national level. This database contributes to understanding and quantification of these types of events and better integration in risk assessment.
- Article
(12578 KB) - Full-text XML
-
Supplement
(7784 KB) - BibTeX
- EndNote


Natural hazards cause much damage to transportation networks worldwide (Nicholson and Du, 1997; Hungr et al., 1999; Dalziell and Nicholson, 2001; Karlaftis et al., 2007; Tatano and Tsuchiya, 2008; Erath et al., 2009; Muzira et al., 2010; Jelenius and Mattsson, 2012). Particularly in mountainous areas, floods, landslides (considered earth flows in this study), debris flows, rockfalls, and snow avalanches (called avalanches in this paper) can seriously affect the traffic on roads and railway tracks, isolating villages or regions and generating infrastructure and economic damages (Bunce et al., 1997; Budetta, 2004; Evans et al., 2005; Collins, 2008; Salcedo, 2009; Guemache et al., 2011; Jaiswal et al., 2011; Michoud et al., 2012; Laimer, 2017b).
Large natural hazard events affecting roads and railways are generally well studied and documented, e.g., the Séchilienne landslide (Kasperski et al., 2010), La Saxe landslide (Crosta et al., 2014) or La Frasse landslide (Noverraz and Parriaux, 1990), but this is not the case for minor and medium-sized events with deposit material on the track ranging from a few cubic decimetres to a few thousand cubic metres. They are numerous and often too small, making them difficult to detect and expensive to monitor (Jaboyedoff et al., 2016a).
Generally, disaster events or events with any high social impact (death, high cost, highlighting societal problems, etc.) are collected in a database. The criteria to be listed in the main global disaster databases (EMD-DAT, Swiss Re, Dartmouth) illustrate this because at least 10 casualties or other political or economic criteria are required (Guha-Sapir et al., 2015; Swiss Re, 2018; Dartmouth Flood Observatory, 2007). Insurance databases, such as the NatCat from Munich Re reinsurance, are more detailed; however, they are usually not publicly available (Tchögl et al., 2006; Below et al., 2009; Munich Re, 2011). At present, most worldwide, national, and regional databases do not generally include small events that are considered insignificant to experts (Guzzetti et al., 1994; Malamud et al., 2004; Petley et al., 2005; Devoli et al., 2007; Kirschbaum et al., 2010; Foster et al., 2012; Damm and Klose, 2014). There are also noteworthy exceptions such as the RUPOK database (Bíl et al., 2017), which collects information about the consequences of geohazards on transportation networks. The Swiss flood and landslide damage database (Hilker et al., 2009) contains small events, although events with direct damage costs of less than EUR 8500 are not considered. Moreover, there is no information about track and traffic effects.
Gall et al. (2009) highlighted that under-reporting of small events induces bias in data. The director of the Global Resource Information Database at the UNEP recognized a problem in evaluating the true impact of natural hazards because the EMD-DAT database only records events with estimated losses greater than USD 100 000 (Peduzzi et al., 2009). The head of the UNISDR, R. Glasser, notes that governments underestimate low-cost disasters that significantly affect societies (Rowling, 2016).
To fill a gap in the knowledge about small events, in this study, we focused on the impacts of natural hazards on roads and railway tracks, collecting as much information as possible on the events that affected the Swiss transportation network since 2012.
The goal of this database is to determine the main trends of these events and evaluate the relevance of concerns.
The study is applied to all of Switzerland, which has a surface area of 41 285 km2, with an elevation ranging from 193 m (Lake Maggiore) to 4634 m a.s.l. (Dufourspitze). The Swiss geography can be divided into three major geomorphologic-climatic regions: the Alps, the Plateau, and the Jura. The Alps cover 57 % of the Swiss territory (23 540 km2) with 48 summits over 4000 m a.s.l. and many inhabited valleys. The Plateau, located northwest of the Alps, covers 32 % of the territory (13 360 km2) at an average altitude of approximately 500 m a.s.l. and is partially flat with numerous hills. Two-thirds of the Swiss population lives on the Plateau (13 360 km2), which has a population density of 450 inhabitants per square kilometre. The Jura Mountains (11 % of the territory, 4385 km2) are a hilly and mountainous range situated on the northwestern border of the Plateau, with a top summit of 1679 m a.s.l. (Mont Tendre). The Swiss climate is a mix of oceanic, continental, and Mediterranean climates and varies greatly because of the relief. The average annual rainfall is approximately 900–1200 mm yr−1 on the Plateau, 1200–2000 mm yr−1 in the Jura Mountains, and 500 to 3000 mm yr−1 in the Alps (Bär, 1971). The Swiss average temperature is approximately 5.7 ∘C (MeteoSwiss, 2018).
A database was constructed for the 5-year period of 2012 to 2016 and 846 events were collected. The minimum threshold for inclusion in the database was a traffic disruption (for example, a large-velocity reduction) for at least 10 min following a natural hazard event that reached a transportation track.
We used online press channels as information sources because of the ratio of simplicity and efficiency. An online press review was made every working day from 2012 to 2014; in May 2014, GoogleTM Alerts (Google, 2018) was introduced with more than 50 keywords in German, French, and Italian (see Table S1 in the Supplement). These alerts (approximately 10 per day) allowed for the collection of events from the Swiss online press.
Each alert contained an average of two online press articles with one of the fifty keywords. Each article was verified to identify whether the related information concerned a natural hazard event that affected a transportation network. If not, it was disregarded.
Approximately 10 % of all these highlighted articles referred to a real natural hazard event. Approximately 800 articles were collected from mid-2014 until the end of 2016. The Swiss traffic information website was also periodically manually checked, as well as several social media pages that contained pictures of events, such as the official Facebook page of the commune of Montreux (Montreux, 2018). In addition, some events were collected directly in the field.
Table 1Attribute categories describing events in the database.
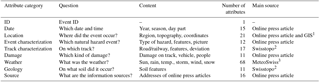
1 GIS: Geographic Information System. 2 Swisstopo: Swiss Federal Office of Topography. 3 MeteoSwiss: Swiss Federal Office of Meteorology and Climatology.
We classified natural hazards according to six categories:
-
static or dynamic flood with little sedimentation materials on the track, including a few hail events;
-
debris flow that is often not well described in the media and confounded with landslide or flood; it is often characterized using pictures from the press articles;
-
landslide, superficial or deep sliding of soil mass including shallow landslides;
-
rockfall referring to rock falls and rockslide;
-
avalanche referring to snow avalanches;
-
other, including snowdrifts (mainly during February 2015 in west Switzerland) and falling trees (mainly during windstorms).
A total of 172 attributes were used to describe the events (Table 1; Figs. S1 and S2 in the Supplement) and were subdivided into eight categories: date, location, event characterization, track characterization, damage, weather, geology, and sources. Data about the date, location, event characterization, and damage were obtained from online press articles. Attributes of the database are presented in Table 1.
Images from the press articles were used to estimate many attributes such as the event classification and volume estimation of the deposit material, if it was not estimated or noted in the press article.
The analyses were performed in a Geographic Information System (GIS) environment, for spatial data, or using standard statistical methods for non-spatial data. To extract the general trends of the 846 events collected from 2012 to 2016, the data were characterized by basic statistics descriptors and displayed in histograms and charts.
Weather data were obtained from 24 weather MeteoSwiss stations. For each event, the reported weather conditions were not always from the closest station; data were obtained from a station with a similar topo-climatic situation. The average distance between weather stations and events was 20 km (SD of 18 km) and the average absolute elevation difference was 200 m (SD of 366 m). The rainfall data were given for the event day, the previous 5 days, and the last 10 days to provide the antecedent situations.
The deviation lengths for roads were measured using ArcGIS. Density maps were prepared using the kernel density function in ArcGIS with a search radius of 10 km for the events map and 20 km for the road density map, with a 500 m output cell size for both. The results were classified into 10 classes using the Jenks natural breaks method in ArcGIS.
The damage levels were characterized by four levels, partially based on Bíl et al. (2014). The first damage level was “no closure or no track damage”. Events of this level generate only traffic slowdowns and small disruptions. They mainly comprise floods, often triggered by strong storms (vehicles can drive slowly on a flooded road without the need to close the track) (Fig. 6e). The reduction of the traffic velocity generally lasts less than 2 h. The second level refers to a complete or partial track closure because of material deposition on the track. If only one lane is closed, the second lane allows for alternated traffic moderated with temporary traffic lights or traffic regulators. Tracks with the second level of damage can reopen after evacuation work, without any repair work.
In addition to track closure, the third level, “partial damage”, requires superficial repairs and/or minor stabilization of the track embankments because the events resulted in small damage to the tracks. Finally, the “total destruction” level indicates that, in addition to track closure, the track embankment must be reconstructed, requiring significant repair work.
The costs per square metre were attributed for each damage class according to the event intensity (small, middle, and large) for both roads and railways. A surface area of deposit material on the track of 100 m2 is assumed to be a small event, 200 m2 is a medium event, and 300 m2 is a large event. The costs are given in euros, with the mid-January 2018 value of EUR 1 = CHF 1.17 = USD 1.23. On average, EUR 6 per square metre was estimated for the no closure class, EUR 230 for closure, EUR 400 for partial damage, EUR 1000 for total destruction, and EUR 230 for the unknown class (Table S2). Direct damage cost evaluation was based on road and railway reports (Canton de Vaud et du Valais, 2012; SBB CFF FFS, 2017) and on repair work cost provided by an experienced Swiss civil engineer. Direct damage costs are difficult to assess (even more so for indirect damage costs); thus the proposed methodology to determine them must be considered a tool to compare the costs of the different damage classes. The cost values should not be considered as the true costs for all events but as an order of magnitude of the costs (see Sect. 5.4).
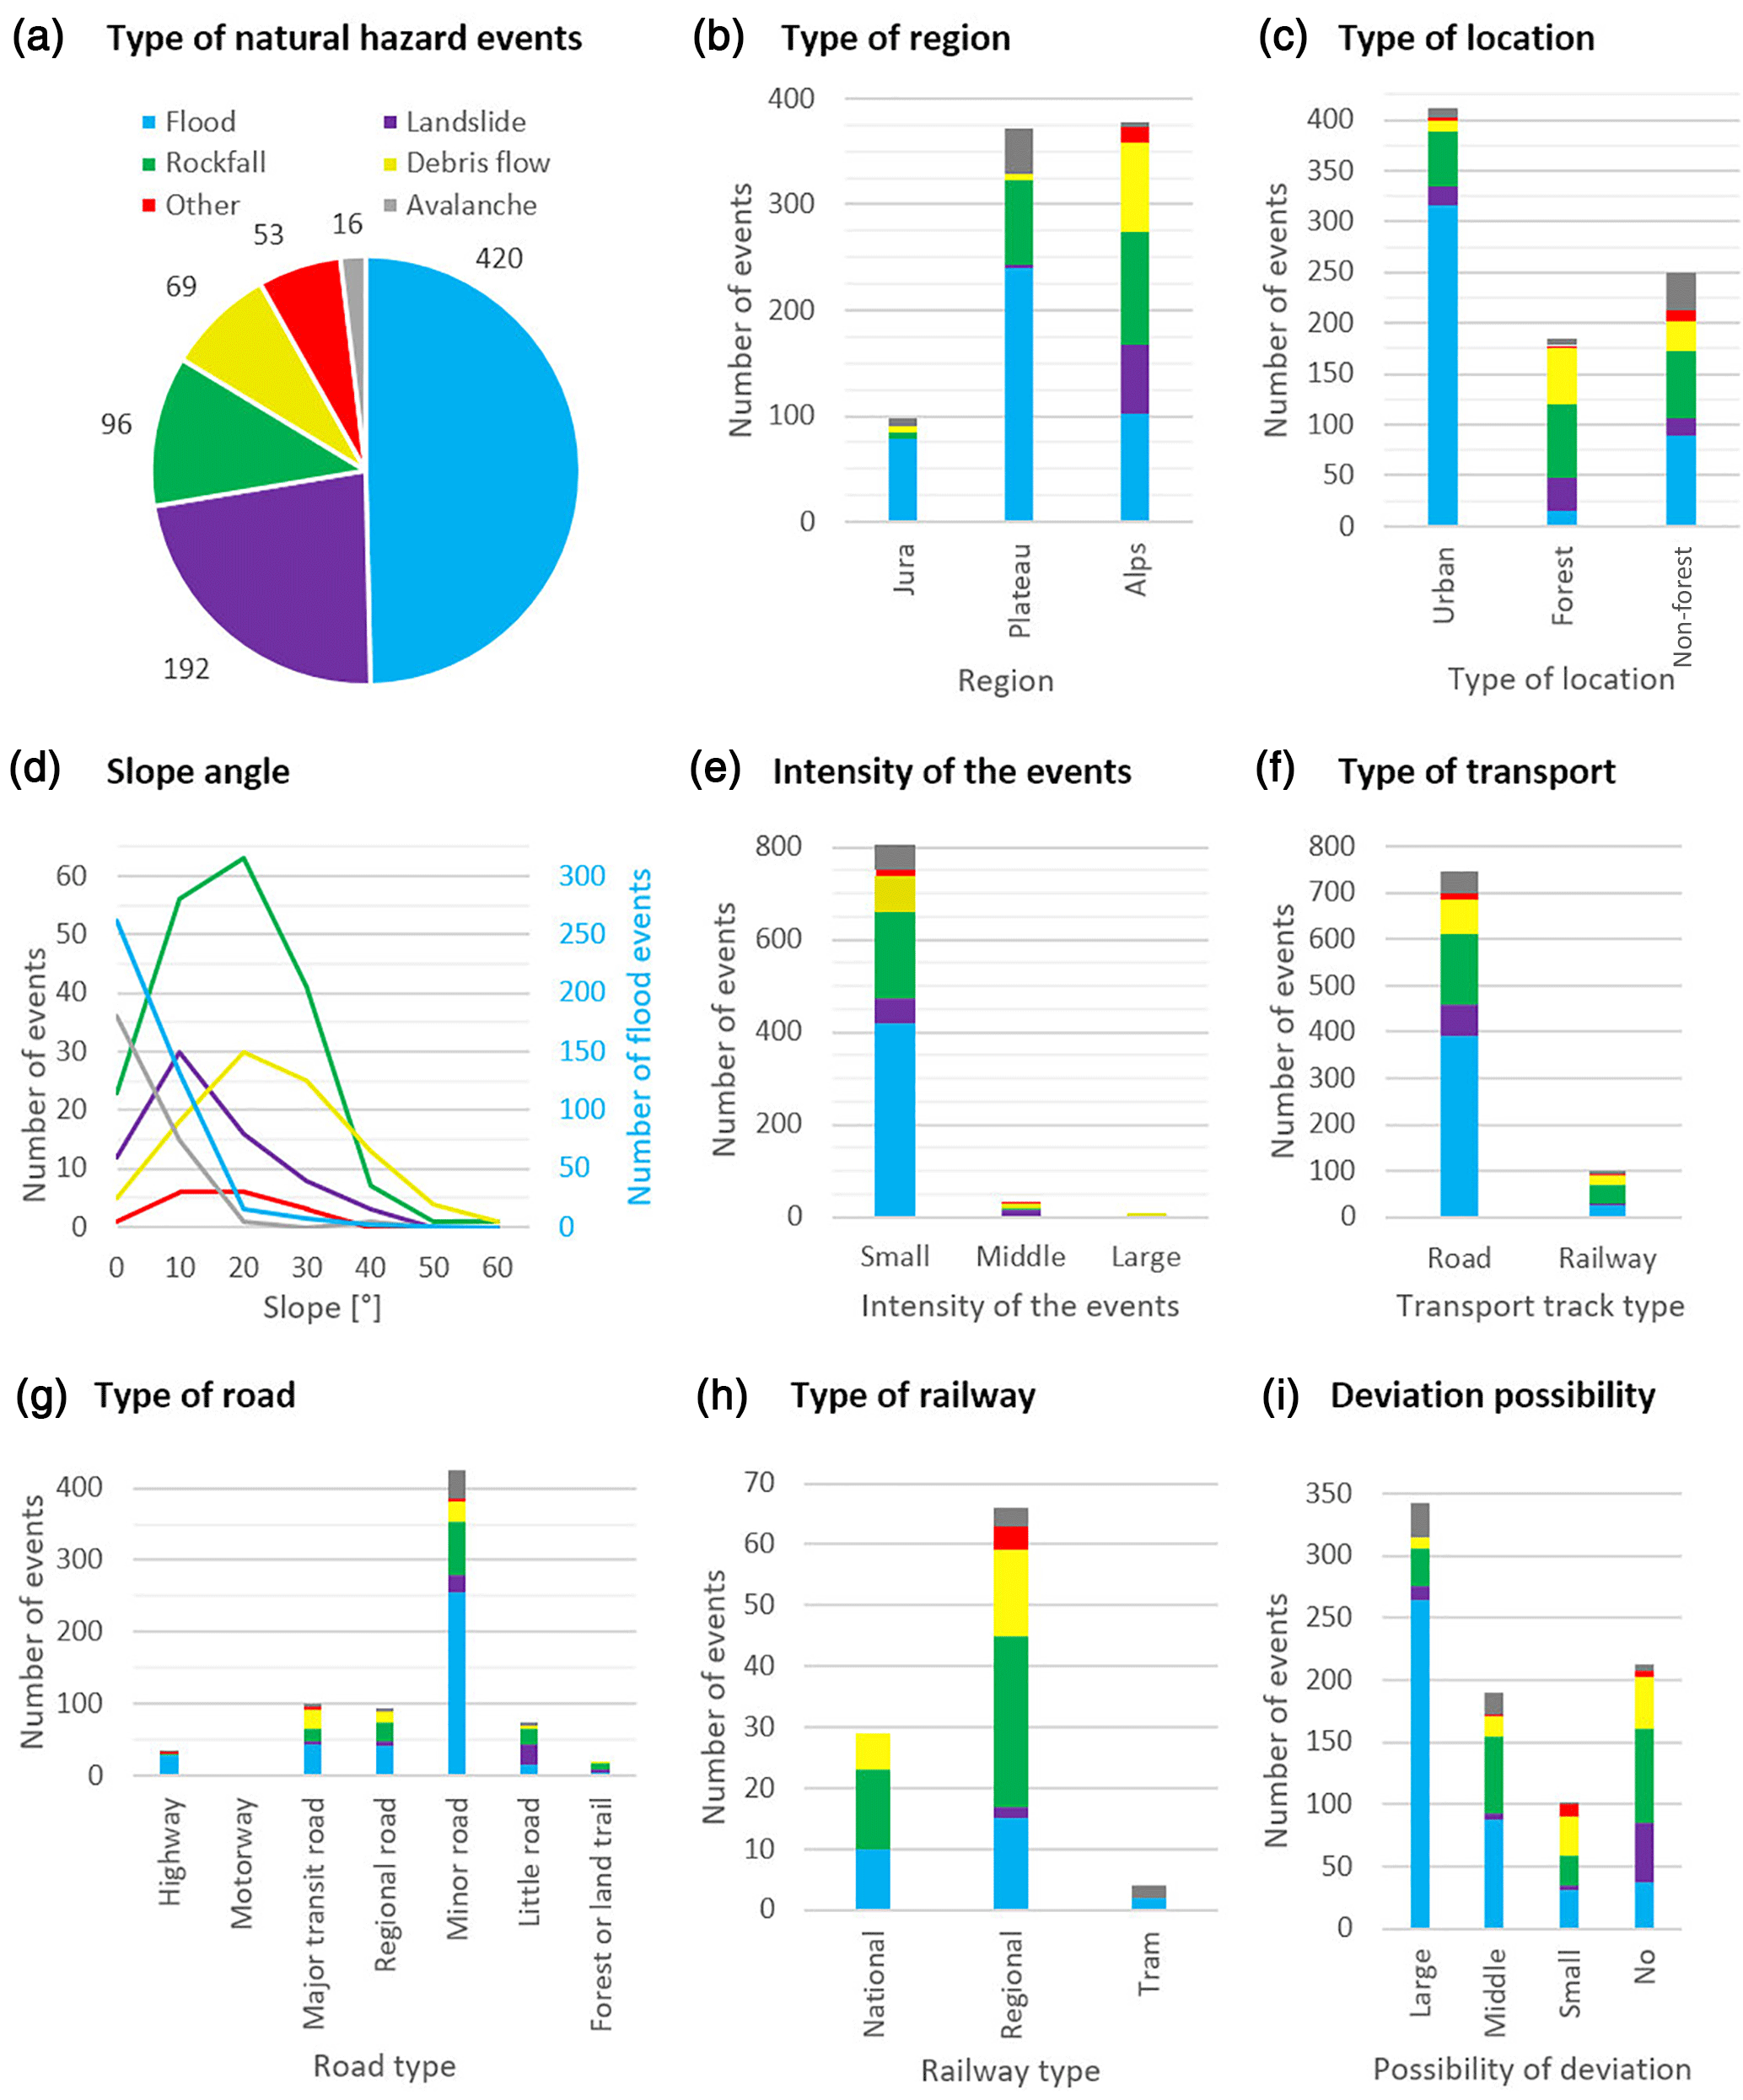
Figure 1(a) Number of natural hazard events on the Swiss transportation network from 2012 to 2016. (b) Distribution throughout the three large geomorphologic–climatic regions. (c) Distribution of the type of location. (d) Slope angle distribution. Flood events are on the secondary vertical axis. (e) Distribution of events according to intensity of the deposit material on the track. Small event: 0–10 m3; middle event: 10–2000 m3; large event: >2000 m3. (f) Transport mode distribution. (g) Road type distribution. (h) Railway type distribution. (i) Distribution of the possibility of deviation. Large possibility of deviations: >three possibilities; middle: two to three; small: one possibility; no: no possibility.
4.1 Types of natural hazard processes
Of the 846 collected events, 50 % (421 events) are floods, including 1 % (eight events) hail flooding events (Fig. 1a). The second most frequent process was landslides (23 %; 192 events), followed by rockfalls (11 %; 96) and debris flows (8 %; 68). The remaining were avalanches (2 %; 15) and other processes (6 %; 54) including snowdrifts (4.5 %; 40) and falling trees (1.5 %; 14). Snowdrifts mainly resulted from a unique event in February 2015.
4.2 Spatiotemporal conditions
4.2.1 Spatial distribution
Natural hazard events affecting the Swiss transportation network from 2012 to 2016 were equitably distributed over the geomorphologic–climatic regions of the Plateau and Alps (44 % each; 371 and 377 events, respectively). The remaining 12 % (98 events) occurred in the Jura area (Figs. 1b and 2 and Table S3). The spatial distribution of natural hazard events other than floods was proportional to the surface areas of Swiss regions: the Alps, with 60 % of the Swiss territory surface, account for 64 % of events except floods, the Plateau for 30 % and 31 %, and the Jura for 10 % and 5 %, respectively. The kernel density maps of all event types and the road density map are shown in Fig. S2.
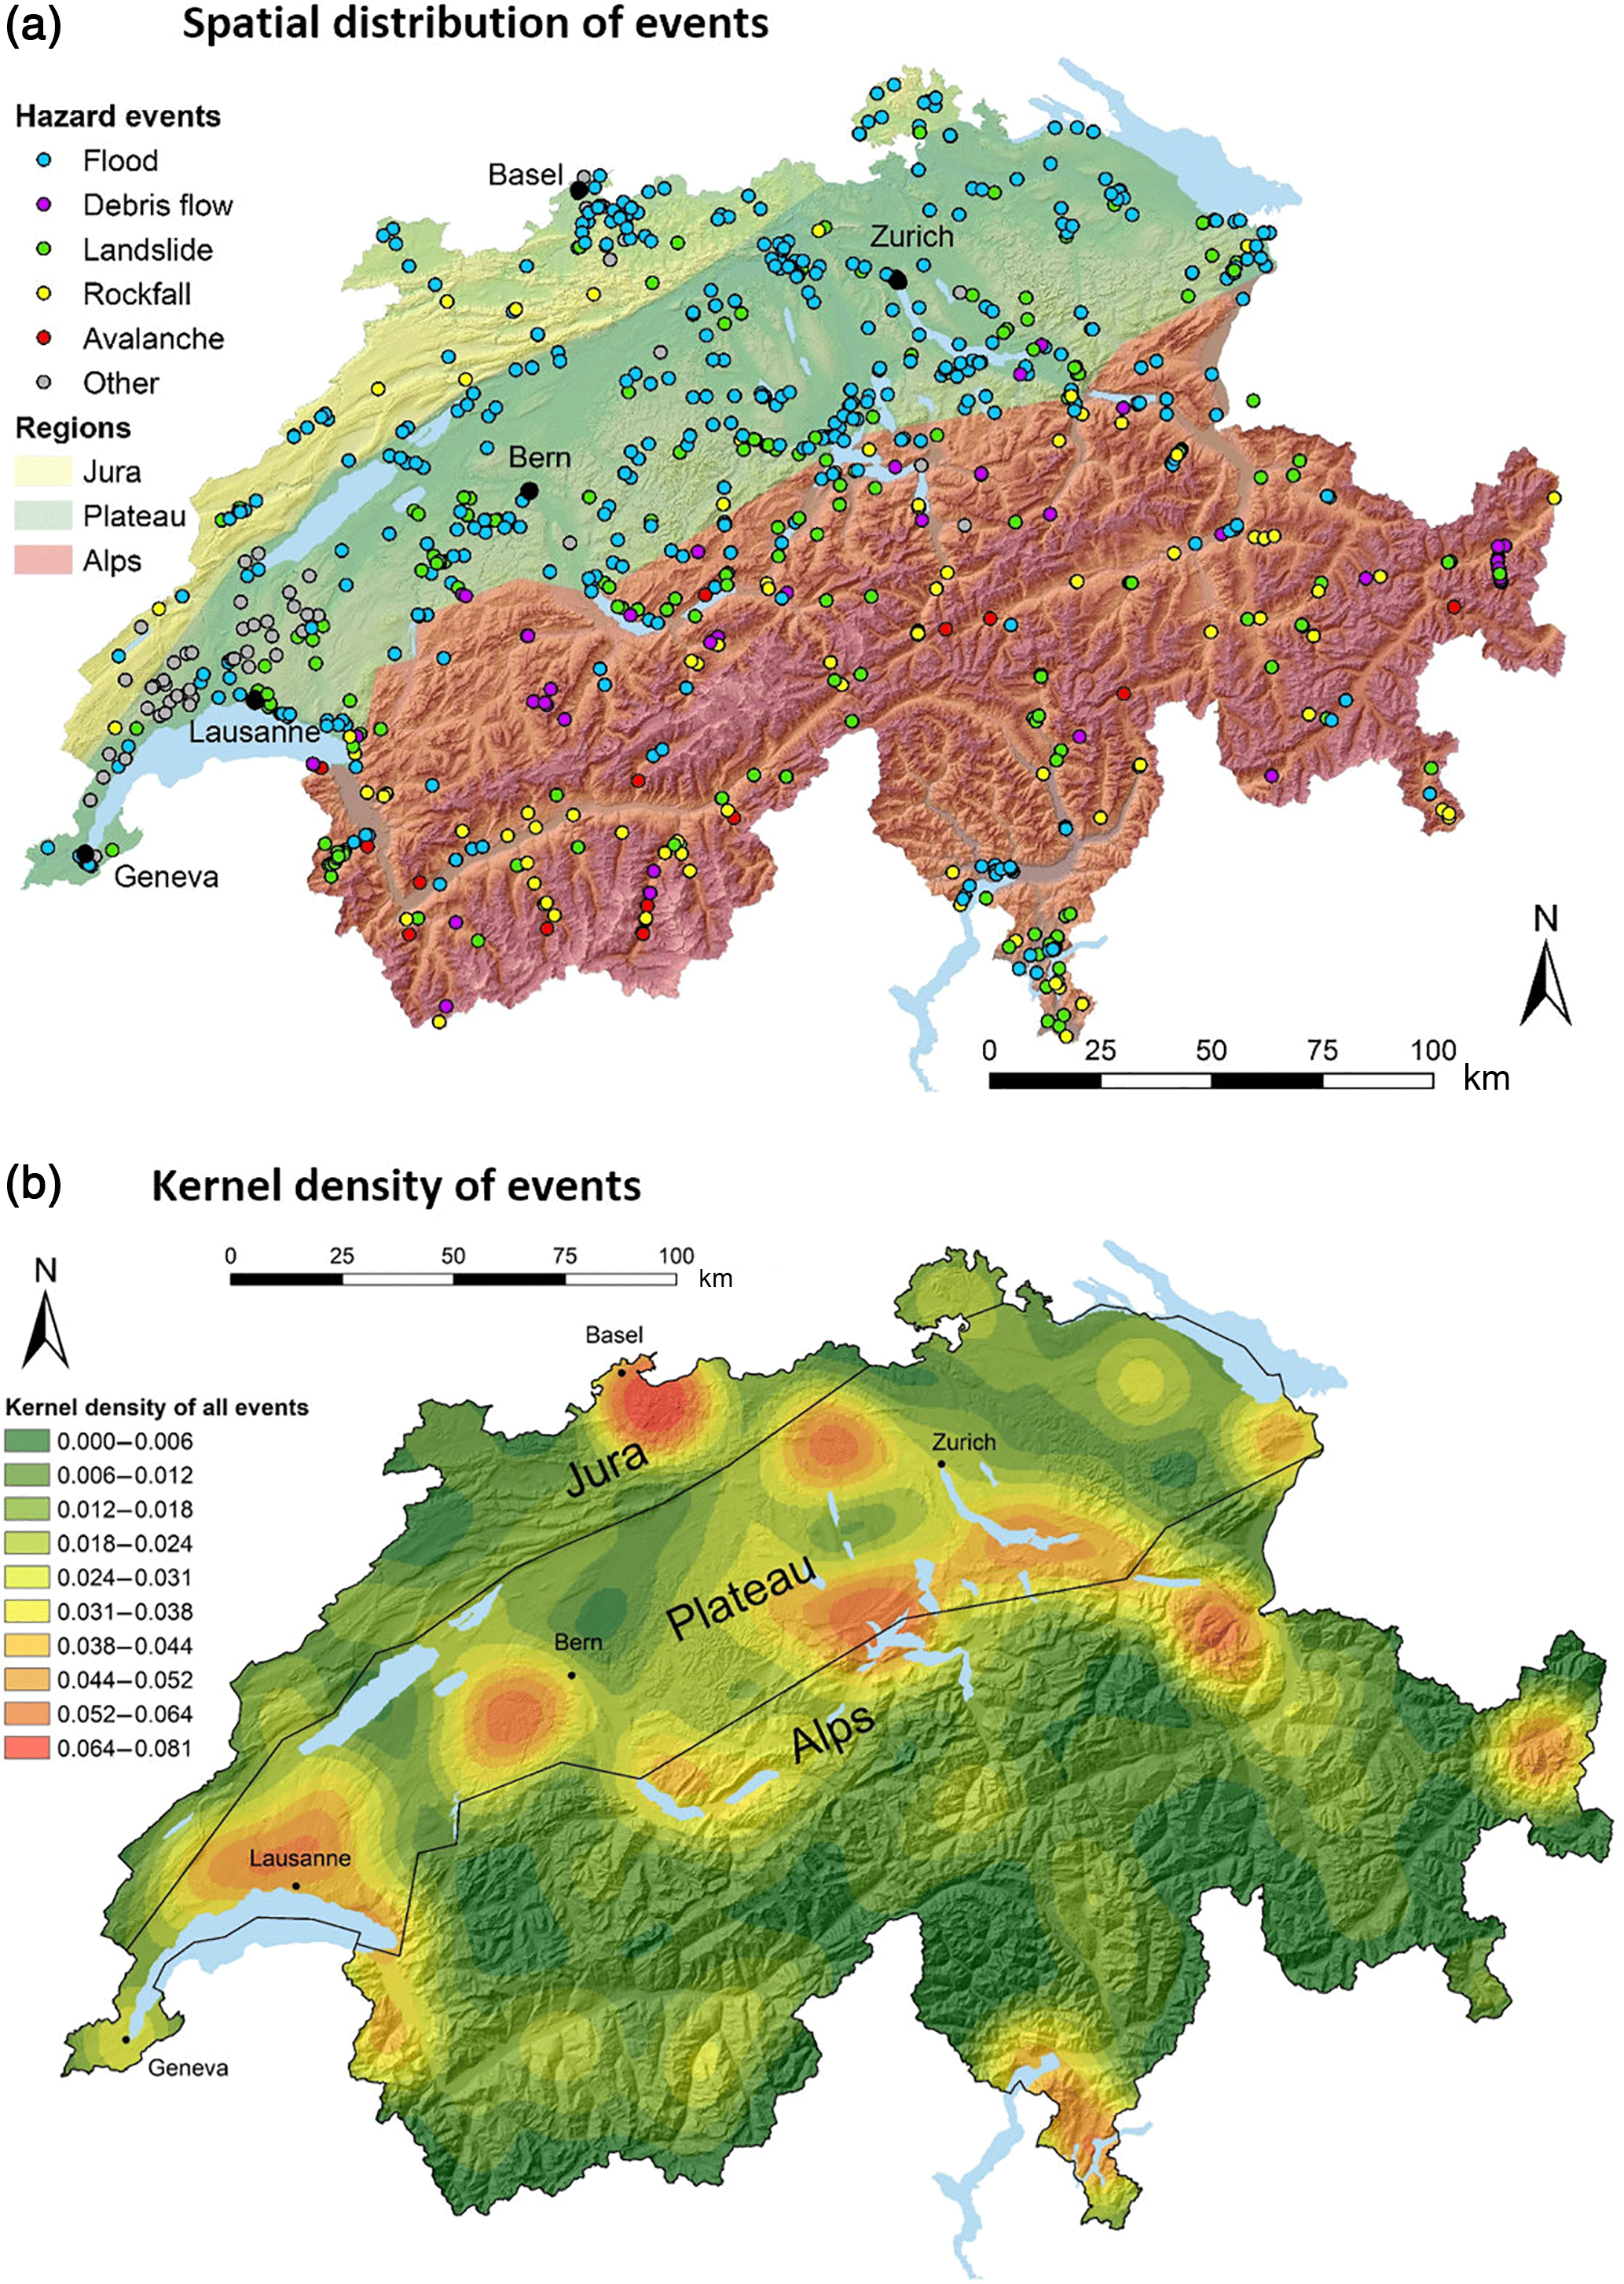
Figure 2(a) Spatial distribution of natural hazard events affecting roads and railways in Switzerland from 2012 to 2016. Map source: Swisstopo. (b) Kernel density of the events (20 km search radius and results classified using 10 classes with the Jenks natural breaks method) based on ArcGIS functions.
The majority of the floods (57 %; 239 events) occurred on the Plateau. Debris flows occurred mostly in the Alps (96 %; 66), as well as rockfalls (88 %; 84) and avalanches (100 %; 16), which is not surprising considering the presence of steep slopes. Landslides are more equally distributed, with only 55 % (107) in the Alps because they usually occur on moderate slopes (Stark and Guzzetti, 2009). The other events (snowdrift and falling trees) occurred mostly on the Plateau (41; 79 %).
Almost half of the events (49 %; 412 events) occurred in a built-up environment (towns, agglomerations, villages, and hamlets) and approximately half (51 %; 434) of events occurred in a natural environment (countryside: 25 %, 211; forest: 22 %, 185; and mountain above the forest limit: 4 %, 38) (Fig. 1c; Table S4).
In the risk ratios (Miettinen, 1972; Zhang and Kai, 1998; Spiegelman and Hertzmark, 2005) related to the surface of the regions, floods and other are over-represented in the Jura and on the Plateau whereas debris flows, avalanches, and rockfalls are over-represented in the Alps (Fig. 3a). The risk ratio related to the length of the roads of the three regions indicates that the Alps have over-represented debris flows, landslides, rockfalls, and avalanches (Fig. 3b)
The slope angle distribution (Fig. 1d; Table S5), extracted from a 25 m DEM (Swisstopo, 2018), indicates that 40 % (339 events) of all events affected tracks on slopes from 0 to 5∘ and that 30 % (257 events) occurred from 5 to 15∘. A total of 62 % (260 events) of floods affected tracks on an almost flat slope, from 0 to 5∘, and 43 % (30 events) of debris flows occurred on a 5–15∘ slope. A third of landslides (63 events) and a third of rockfalls (30 events) occurred on a 15–25∘ slope. Of avalanches, 76 % (12 events) crossed tracks at a slope angle of 10–30∘. Two-thirds (36 events) of other processes were observed on a 0 to 5∘ slope.
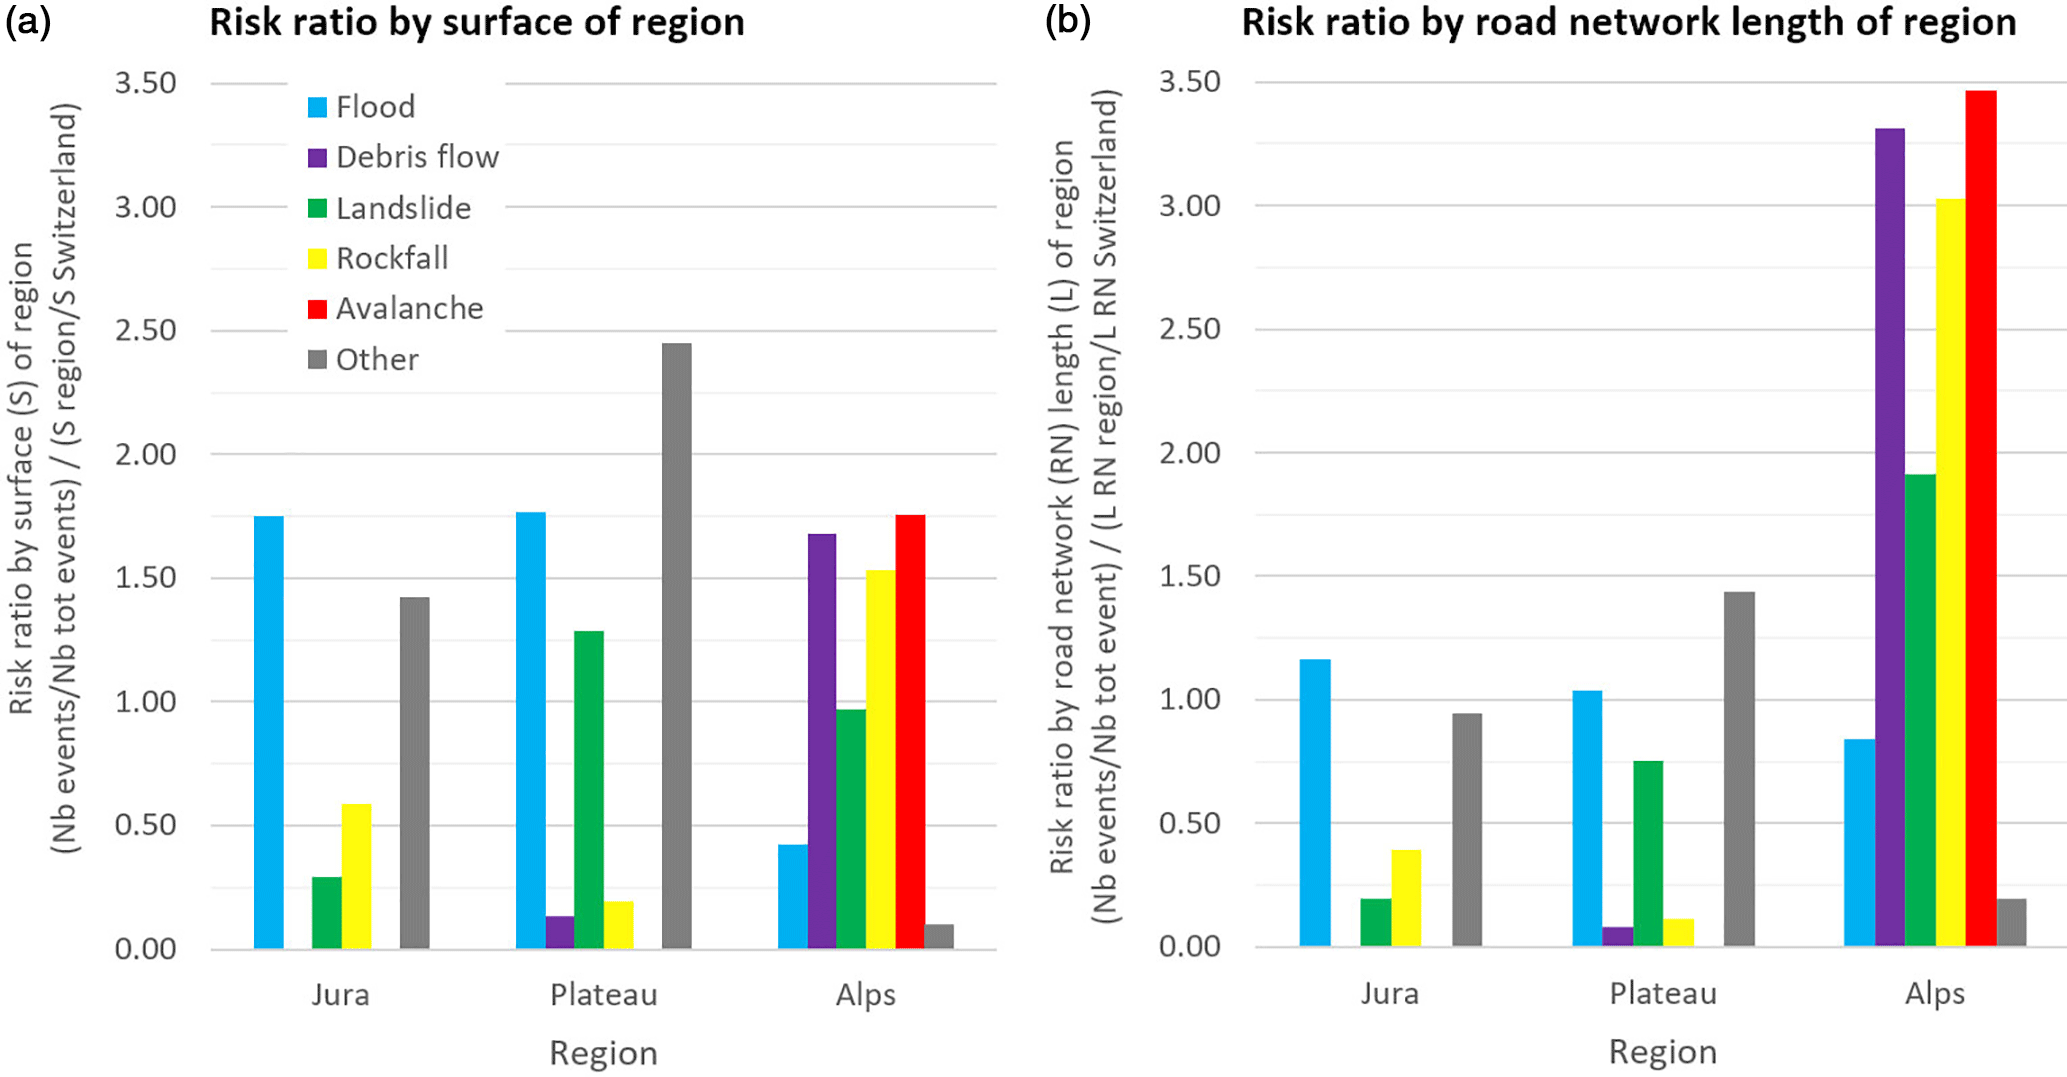
Figure 3(a) Risk ratio by surface of the three geomorphologic–climatic Swiss regions. (b) Risk ratio by the road network (RN) length of the three geomorphologic–climatic Swiss regions.
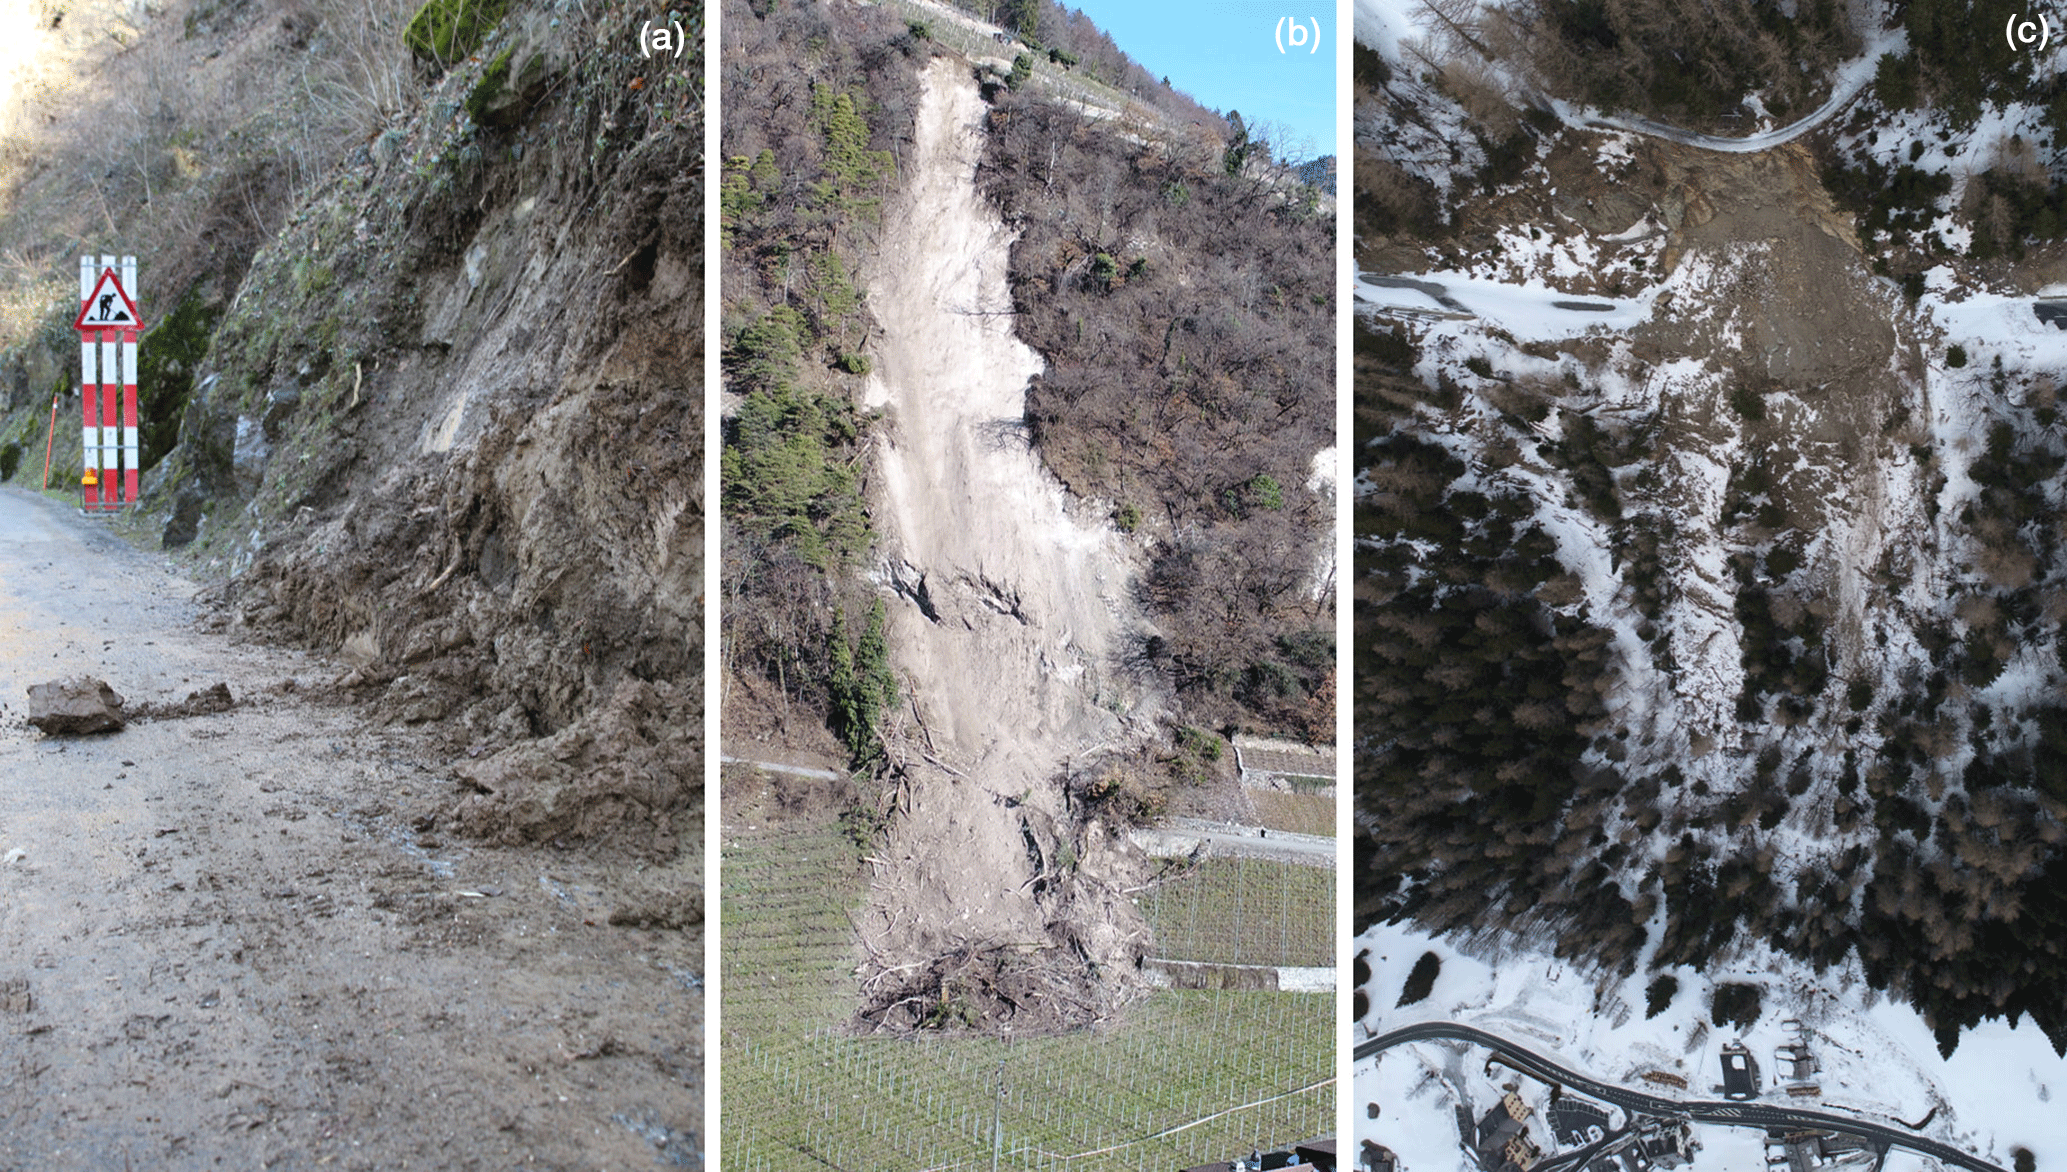
Figure 4Examples of events affecting roads. (a) Small event on the only road to the small village of Morcles (canton of Vaud). (b) Middle-sized event on a minor road in Ollon (canton of Vaud). (c) Large event with an estimated volume of 3500 m3 that cut a 50 m length on the international road between France and the canton of Valais near the Forclaz pass (Trient). The road closure was estimated at 6 weeks. Images taken on 24 January 2018 after a winter storm.
Based on the Swisstopo maps, eight slope orientations were estimated to account for 72 % (609 events) of the recorded events (Fig. S3). Slopes oriented to the south, southeast, and west accounted for 17 % (144 events) each. The over-representation of these orientations is caused by debris flows occurring on the western slopes (mainly due to debris flows that occurred in the S-Charl valley in 2015). Landslides appeared to occur more often on south- and west-oriented slopes.
4.2.2 Event intensity
The debris flow, landslide, rockfall, and avalanche events were classified into three intensity classes (Figs. 1e and 4; Table S6) defined by the volumes of deposit materials on the track:
-
small: less than 10 m3;
-
medium: from 10 to 2000 m3;
-
large: larger than 2000 m3.
With one exception (medium intensity), floods were classified based on the water level and flooded area as small-intensity events (419 floods). Other events (snowdrifts and falling trees) were also all categorized as small events (53 events). Of the events, 95 % (804 events) were classified as small, 4 % (33) were medium, and 1 % (nine) were large events. Note that a third (32) of rockfalls were large events.
Excluding floods, 39 % (146 events) of the event sources were located more than 50 m from the track, and 35 % (185) were located 0 to 50 m away (Table S7). A quarter (95) of the source locations are unknown. Almost all sources close to the tracks, representing 35 % (185) of all events, can be considered human-induced natural hazard events. The sources of debris flows and avalanches in the Alps are located far from the track and were of natural origin – 100 % (69) for debris flow and 94 % (15) for avalanche. Excluding floods, 80 % (339) of the sources were located above the track, 7 % (29) were below the track, and 14 % (58) were of unknown origin (Table S8).
4.2.3 Rainfall
The average rainfall during the day of an event was 17 mm (Fig. 5a; Table S9). On average, the amount of rain during the event day was 22, 17, 14, 5, and 4 mm for flood, landslide, debris flow, rockfall, and avalanches, respectively. The maximum precipitation recorded (154 mm) in the database occurred in the canton of Ticino in November 2014, which triggered a landslide.
The debris flows mostly occurred following strong convective summer storms after a quite sunny day. This means that the precipitation at the location of the debris flows may be higher than those recorded by the station. Landslides occurred after the highest amount of rainfall recorded in the last 10 days preceding the event. The debris flows occurred several minutes to a few hours after heavy precipitations, floods occurred after approximately 1 day of heavy rainfall, and landslides occurred up to several days after intense precipitations.
4.3 Temporal parameters
4.3.1 Clustering in time
Selected during the 5-year period were 14 long-lasting rainfalls for a total of 111 days (Table 2), with durations ranging from 2 to 14 days. A total of 60 % (511) of events occurred during those 111 days of long-lasting rainfalls. Those 111 days correspond to 6 % of the total number of days over the 5-year period. This highlights the negative impact of long-lasting rainfalls, which generated an average of 4.6 events per day. A third of these 511 events were among the 50 major loss events worldwide, according to Munich Re Topic Geo annual reports.
4.3.2 Monthly distribution
The monthly distribution of events indicates an average of 71 events per month, with a median value of 32. It ranged from nine events in December to 253 events in July (Fig. 5b; Table S10). Two-thirds of all events (68 %; 570 events) occurred during the three months of May (13 %; 107), June (30 %; 253), and July (25 %; 210).
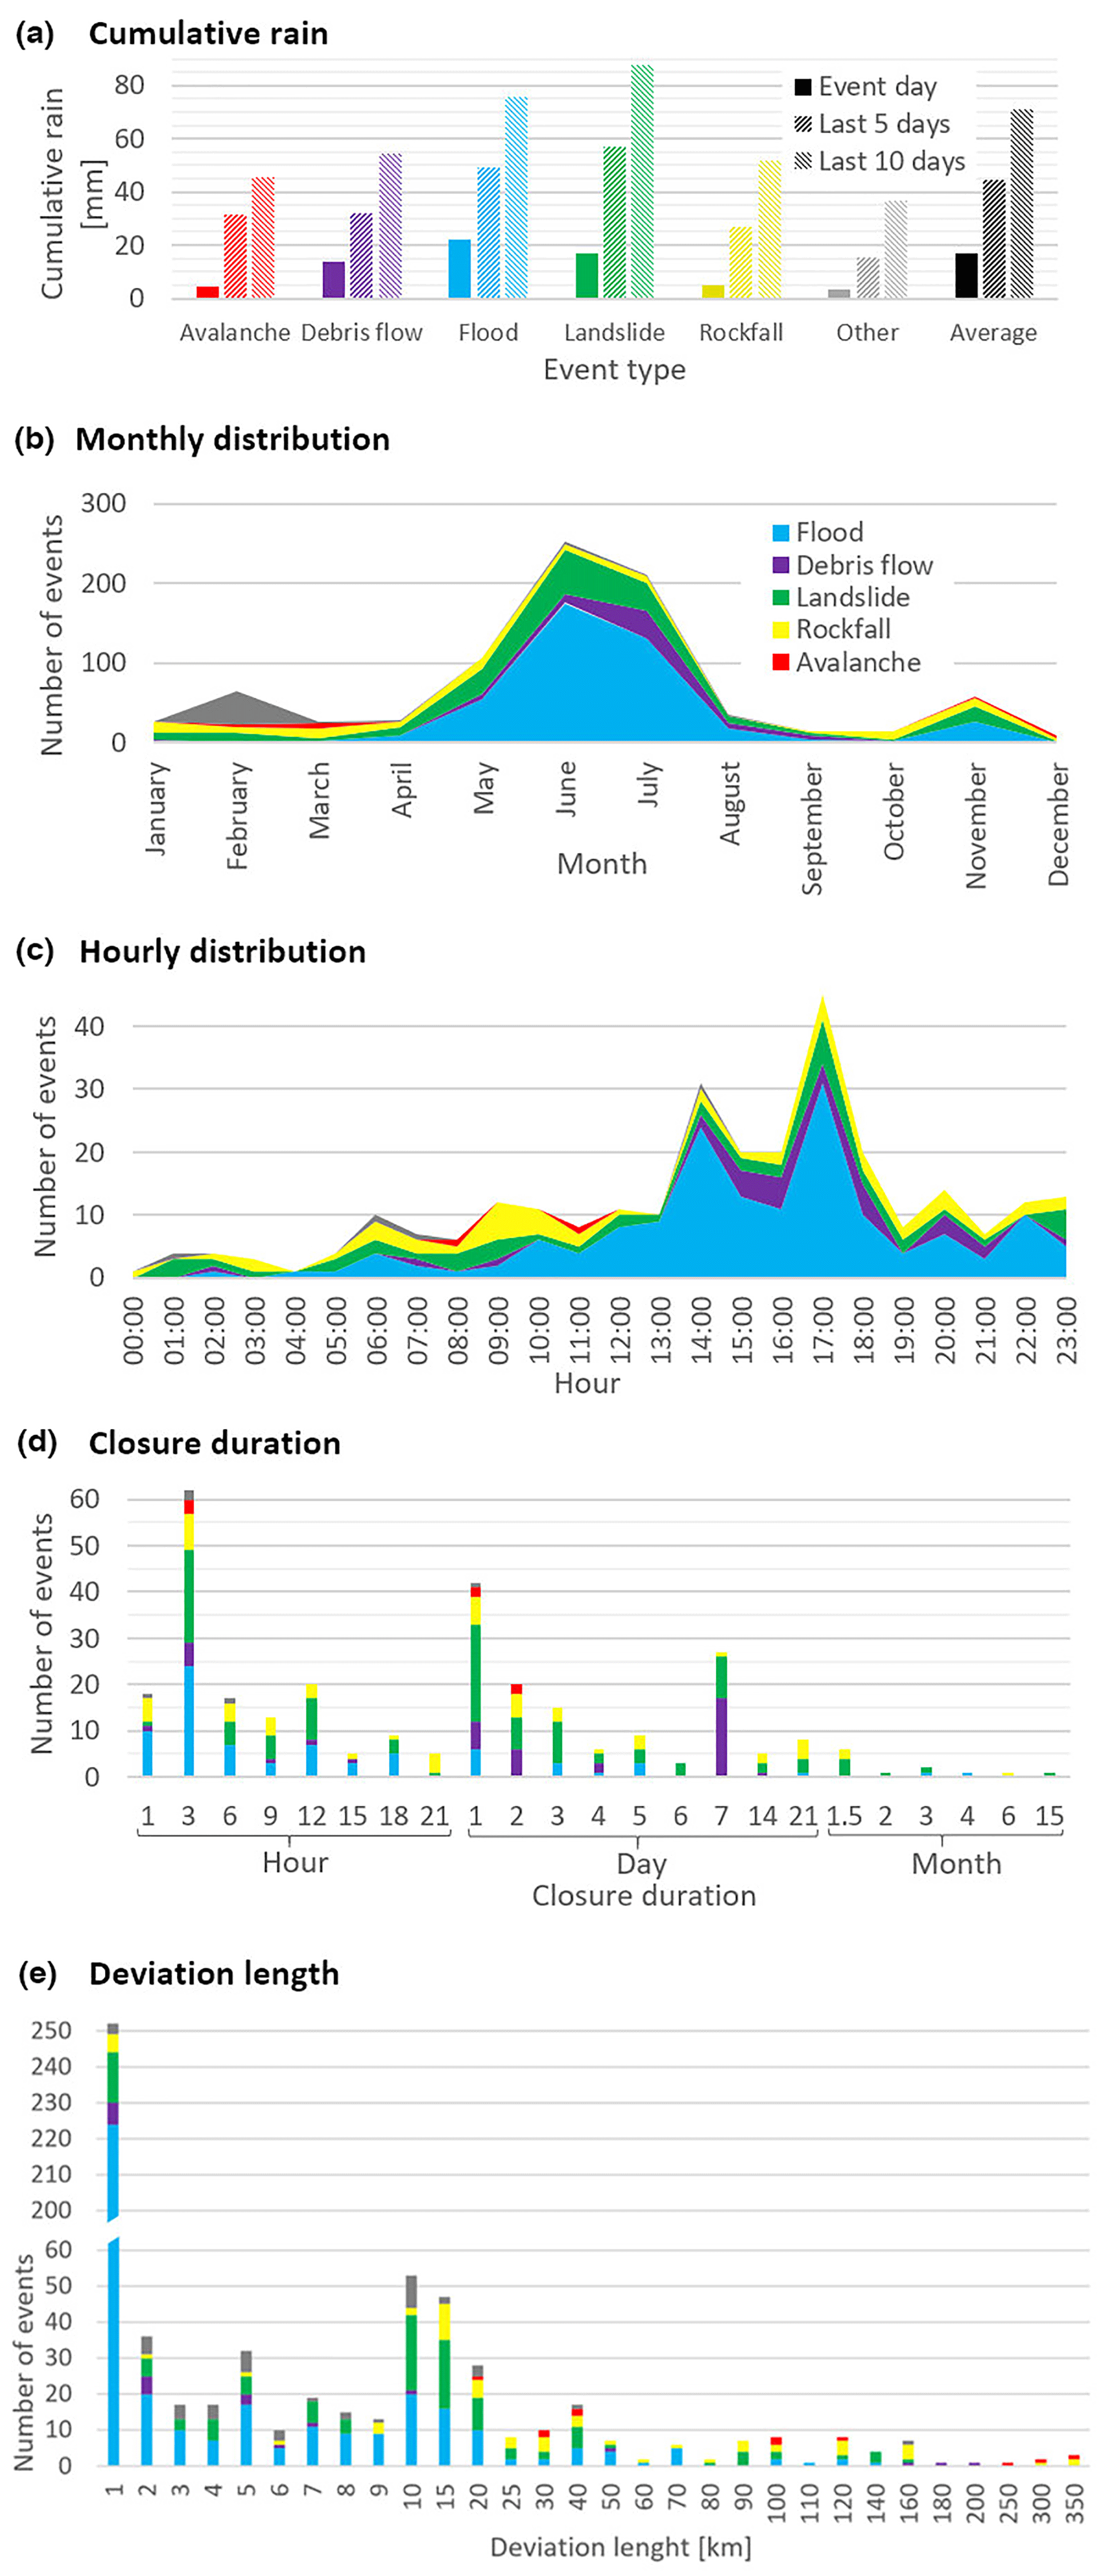
Figure 5(a) Cumulative rain (mm) distribution on the day of natural hazard events and previous 5 and 10 days. (b) Monthly distribution. (c) Hourly distribution. (d) Closure duration distribution. (e) Shorter deviation length distribution of road closures. The vertical axis shows values from 60 to 200.
Table 2Long-lasting rainfalls resulting in 61 % of the collected natural hazard events on the Swiss transportation network from 2012 to 2016.
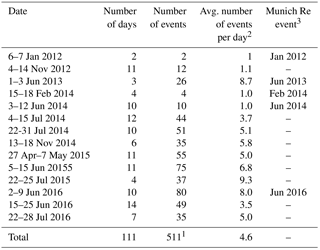
1 Total of 60 % of all events. 2 Event number ∕ number of days. 3 Sources: Munich Re (2013, 2014, 2015, 2017).
A total of 85 % (357 events) of floods and 64 % (123) of landslides occurred from May to July. Of debris flows, 89 % (61) occurred from May to August. Of rockfalls, 64 % (61) occurred during the months of January, March, May, October, and November. Of avalanches, 50 % (eight) occurred in March. A total of 81 % (43) other events occurred in February.
4.3.3 Time of day and hourly distribution
The hour of occurrence was included for 33 % (281) of the events (Fig. 5c). Of floods with a known hour of occurrence, 57 % (89) occurred between 14:00 and 19:00 LT; 61 % (17) of debris flows occurred between 15:00 and 19:00 LT. Landslides and rockfalls were fairly well distributed during a day; 23 % (10) of rockfalls occurred between 09:00 and 11:00 LT.
4.4 Infrastructure parameters
4.4.1 Types of tracks
A total of 88 % (747 events) of events affected road tracks and 12 % (99) affected railway tracks (Fig. 1f; Table S11). Among the events affecting roads, 53 % (393) were floods, 20 % (151) were landslides, 10 % (76) were rockfalls, 9 % (67) were debris flows, and 8 % (48) were other events. For the railway tracks, 42 % (41) were landslides, followed by 27 % (27) floods, 20 % (20) rockfalls, 5 % (five) other, 4 % (four) avalanches, and 2 % (two) debris flows. A total of 79 % (668) of all events occurred on minor roads or minor railway tracks and 21 % (178) occurred on major roads or major railway tracks.
The risk ratio of the number of events by transportation network type (roads or railways, related to their respective lengths) indicates that events on railway tracks are over-represented (risk ratio of 1.67) and under-represented on roads (0.95 risk ratio).
4.4.2 Roads
The Swiss road network length is approximately 72 000 km, with 1850 km managed by the Swiss Confederation, among which 1450 km is highways and motorways, 25 000 km is major (cantonal) roads and regional roads, and approximately 45 000 km of roads is managed at the municipal level (Federal Statistical Office, 2018).
Swiss roads are classified into seven categories, according to the Swiss Federal Office of Topography (Fig. 1g: Table S12). Highways have separated traffic and a speed limit of 120 km h−1 and motorways have a 100 km h−1 speed limit. Both account for 3 % of the road network length, accounting for 5 % (36 events) of all events that affected roads. Major transit roads with a high traffic load (12 % of the road network length) were affected by 13 % (99) of the events. Roads of regional importance (22 % of the road network length) accounted for 12 % (94) of the events with a lower traffic load, both have a maximum speed of 80 km h−1. The three remaining road classes (63 % of the road network length) are based on the width of the road and are related to small roads with low traffic. A total of 69 % (518) of events that affected the road network were on this type of road.
Proportionate to the length of the different road types, the event frequency corresponds to one event per 200 km per year for highways and motorways and one event per 440, 860 and 440 km per year for major, regional, and minor roads, respectively. On average, roads were affected by one event per 480 km per year.
4.4.3 Railways
The Swiss railway network is 5400 km long, including 130 km of cogwheel train track and 202 km of tram track (Federal Statistical Office, 2018).
Railway tracks are classified into three classes: major (34 % of the railway network; 1850 km), minor (62 %; 3350 km), and tram lines (4 %) (CFF, 2018; Federal Statistical Office, 2018) (Fig. 1h; Table S13). The major tracks usually have two lanes, linking the main Swiss cities or crossing the Alps, and accounted for 29 % (29 events) of railway events. The minor tracks, often with one lane, were affected by two-thirds (67 %; 66) of railway events. Tram tracks in or around towns were affected by 4 % (four) of railway events.
Proportionate to the length of the different track types, the event frequency along major railway tracks was one event per 320 km per year and the minor railway tracks and tram tracks were affected by one event per 250 km per year. On average, railway tracks were affected by one event per 275 km per year.
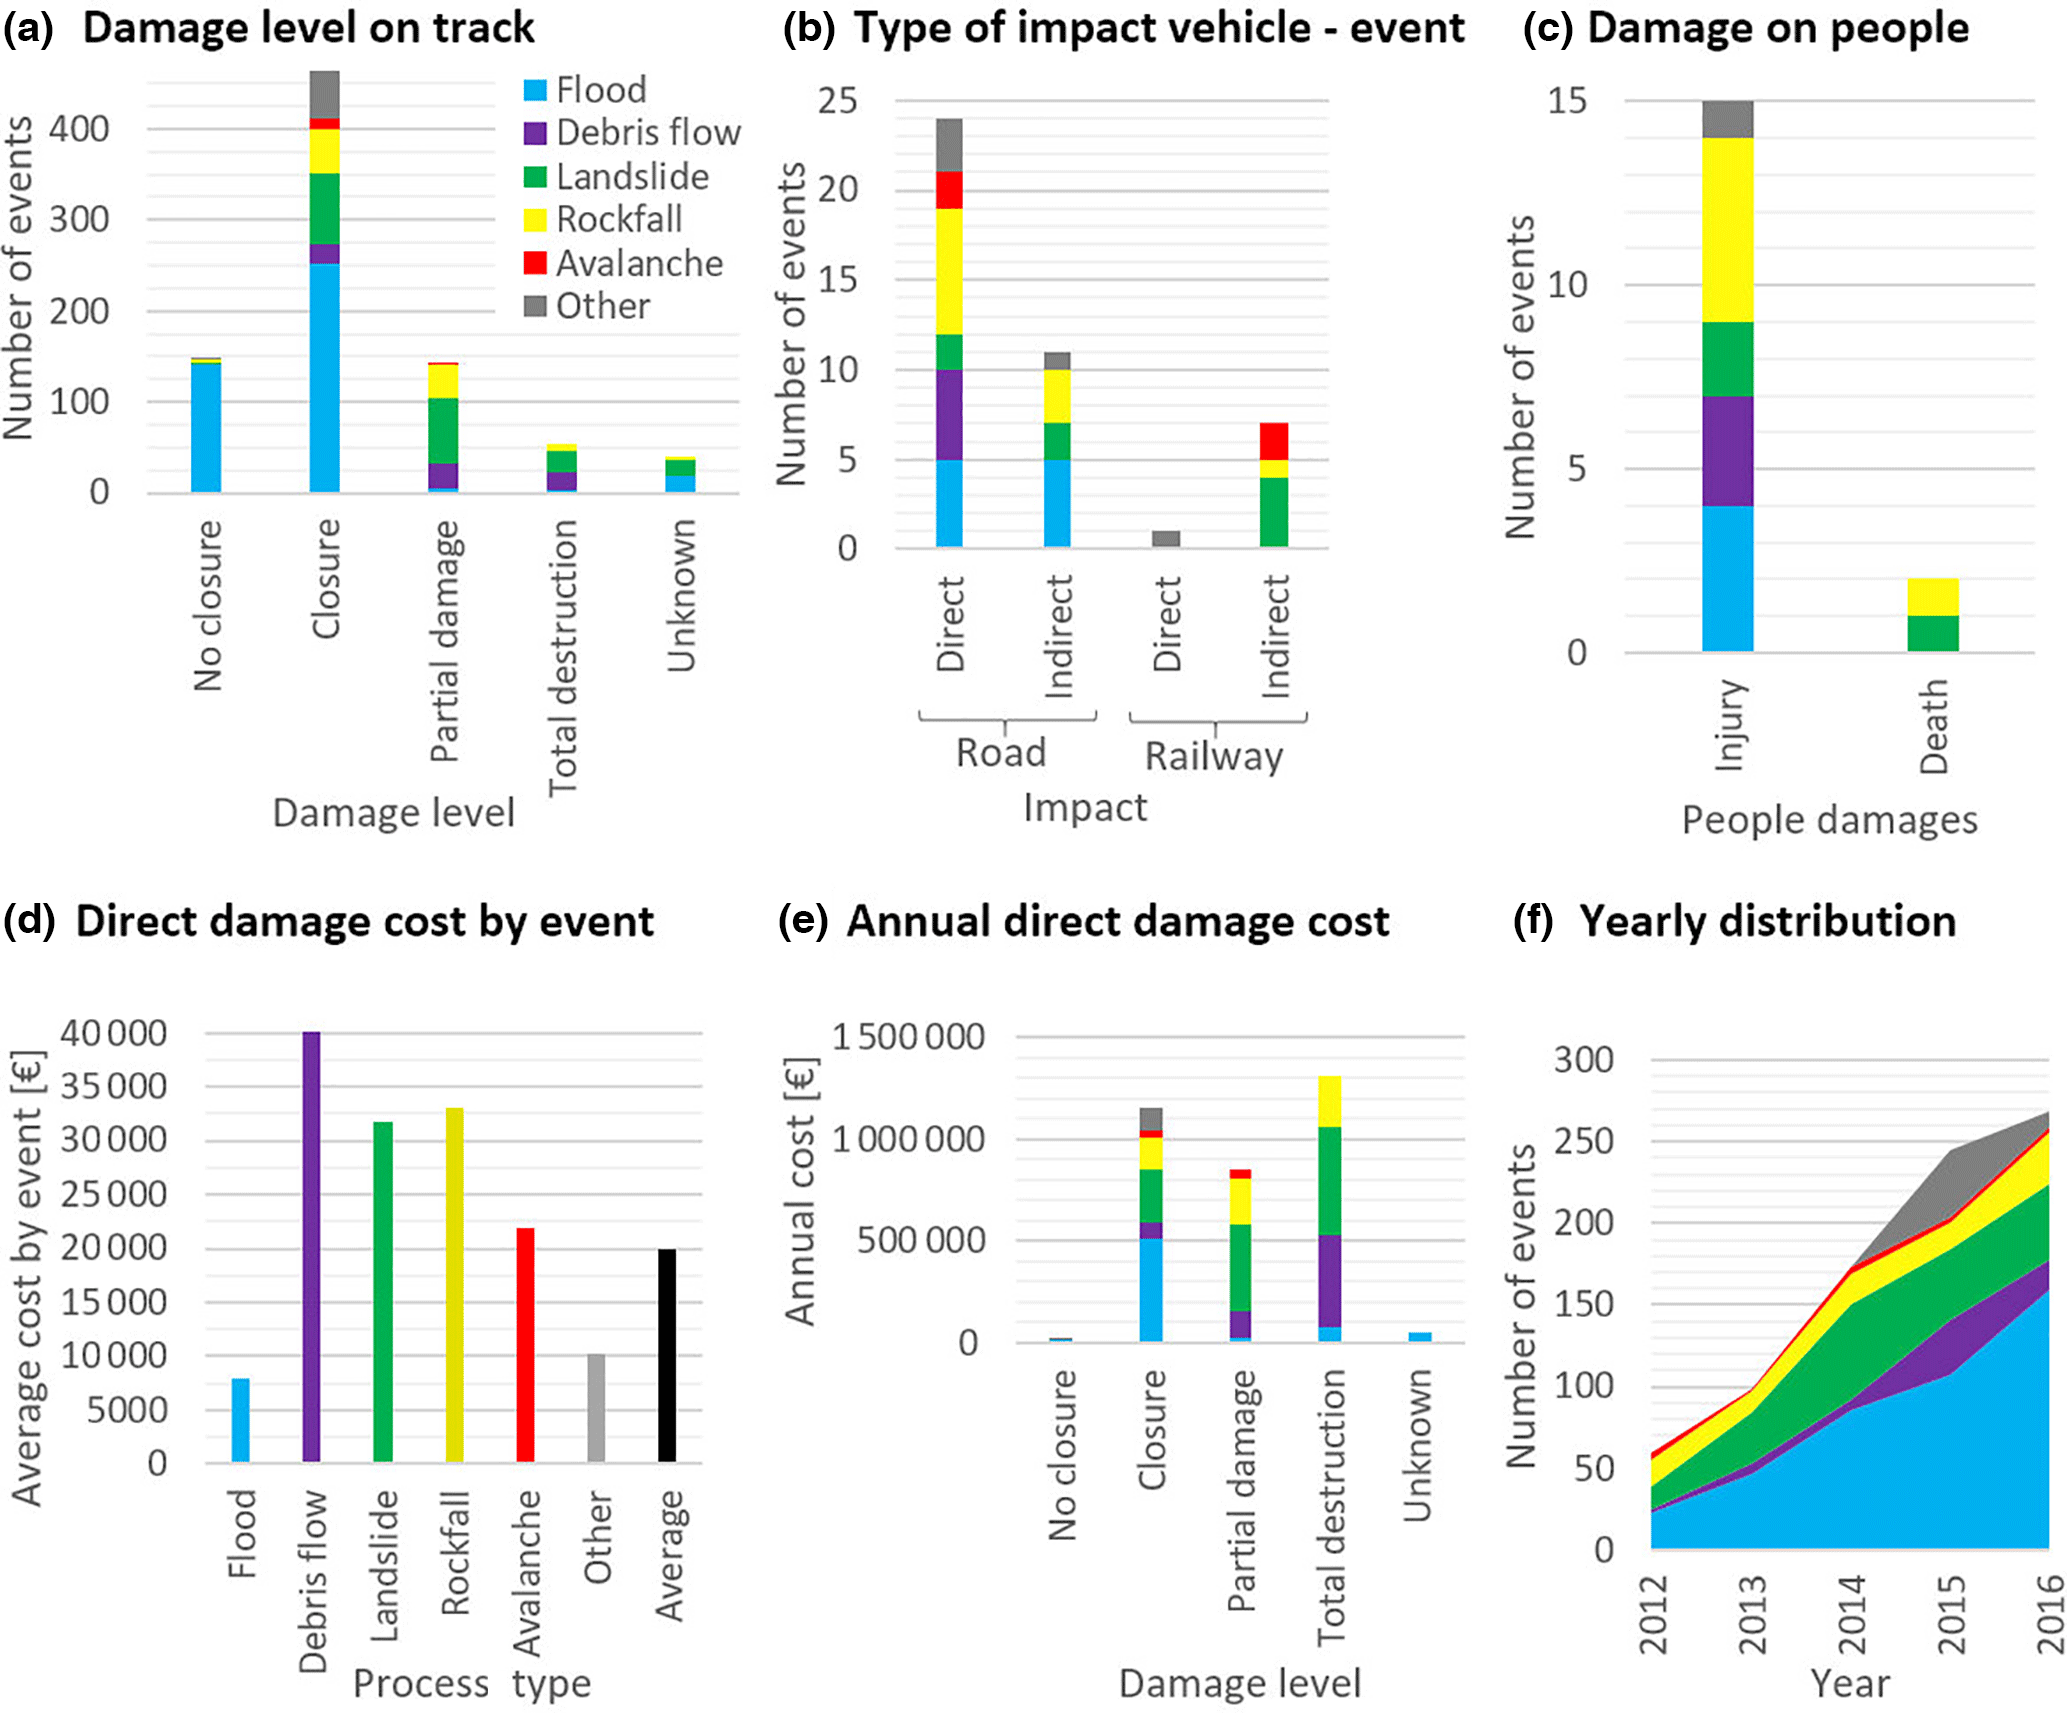
Figure 6(a) Damage distribution. (b) Distribution of impact types for vehicles on roads or railways and natural hazard events. (c) Distribution of injuries and deaths. (d) Distribution of the average event direct cost. (e) Distribution of the annual direct cost. (f) Annual distribution.
4.4.4 Possibility of deviation
For each event, we determined how easy it was to find a deviation track (an alternate route to reach the next village that avoids the closure area) (Fig. 1i; Table S14). For 40 % (342 events) of the events, there were more than three possibilities of deviation. For 23 % (190), there were one to three deviation possibilities, and for 12 % (102) there was only one possibility. For 25 % (212) of events, it was not possible to take an alternative track to bypass the closure because they occurred in valleys with only one track.
A total of 91 % (383 events) of flood events and 90 % (48) of other events could be bypassed. There were no deviation possibilities for 70 % (48) of debris flows, 43 % (41) of rockfalls, and 40 % (77) of landslides. This indicates that it is often impossible to find a deviation path for numerous debris flows, landslides, rockfalls, and avalanches.
4.5 Impacts and damages
4.5.1 To track
A total of 80 % (679 events) of all events generated track damages (Fig. 6a and Table S15), and 18 % (149) generated no closure or no track damage; 142 of those events were floods. A total of 57 % (483) of events generated track closures because of material on the tracks. In addition to closure, 17 % of events (143) produced partial damage on the track (third damage level). The total destruction level accounted for 6 % of all events (53). For 2 % of events (18), direct damages could not be estimated.
A total of 35 % (142 events) of floods caused no track closure and 62 % (251) of floods generated only track closure. Floods generated the least damage. Many floods did not require track closure because vehicles or trains could pass through the water level. Of debris flows, 39 % (27) generated partial damages and 25 % (18) caused total destruction. Half (96) of landslides generated no track damages with a track closure and 39 % (72) of landslides resulted in partial damage to the tracks. Half (48) of rockfalls generated only track closures and 39 % (37) generated partial damages. A total of 81 % (13) of avalanches and 96 % (51) of other events generated track closures due to the high percentage of snowdrifts – 74 % (39) of other events were snowdrifts.
4.5.2 To vehicles
A total of 5 % (43 events) of all collected events generated damages to vehicles (Fig. 6b and Table S16), 3 % (25) of events included direct impacts on vehicles, and 2 % (18) caused indirect impacts on vehicles (when a vehicle collides with material on the track). Except for a falling tree, which affected a tram directly, all direct impacts concerned roads. Two trains were affected indirectly by avalanches, four trains by landslides, and one train by rockfalls. Only 1 % (1 event) of events affecting railways caused a direct impact whereas 7 % (seven) of events caused indirect impacts. Conversely, 3 % (24) of events affecting roads generated direct impacts and 1 % (11) caused indirect impacts.
4.5.3 To people
People are rarely directly affected by events. A total of 98.2 % (831 events) of events did not cause injuries and 1.8 % (15 events: 13 on roads and two on rail tracks) caused injuries (Fig. 6c and Table S17). A total of 5.2 % (five) and 4.3 % (three) of events resulted in injuries; rockfalls and debris flows generated the highest percentage of injuries. There were 20 injured persons identified, 10 of which were in a train derailment in the canton of Grisons due to a landslide in August 2014.
Two events (0.2 %) caused death: the abovementioned event in Grison and an event in which a coach without passengers was directly impacted by a rockfall, killing the driver instantly in March 2012 in Grisons. Only 0.1 % (one) of events on roads caused death and 1 % (one) of events killed people on railways.
4.5.4 Closure duration
The closure duration for 35 % of events (296 events) was collected from online press articles. Half of the closures (148) lasted less than 1 day, and 41 % (121) lasted 1 day to 1 week. A total of 9 % (27) of events lasted over 1 week, with a maximum of 15 months (Fig. 5d). Thus, 87 % (65) of floods induced closure durations of 1 day or less. This percentage decreased to 71 % (five) for avalanches, 62 % (36) for rockfalls, 59 % (65) for landslides, and 37 % (15) for debris flows.
4.5.5 Deviation length for roads
For three-quarters (638 events) of the cases in which a deviation was possible, the lengths varied from 1 to 350 km (Fig. 5e and Table S18). Of all deviation track lengths, 40 % (255) were 1 km or less. One-quarter (159) of deviation lengths were 2 to 9 km, 16 % (100) of lengths were 10 to 19 km, and the remaining 19 % (124) of deviation paths were over 20 km. The average deviation length was 40 km in the Alps, 9 km in the Jura, and 7 km on the Plateau.
4.5.6 Direct damage costs
Direct damage costs include all costs directly related to the repair of the track to ensure normal traffic service, including the full repair costs of the tracks. They are difficult or almost impossible to assess; however, direct damage costs are important to determine the order of magnitude of the costs that are directly induced after a natural hazard event affecting a transportation track.
From 2012 to 2016, the annual direct damage costs for the Swiss transportation track was estimated at EUR 3.4 million. For one event, the average direct cost was EUR 19 900. On average, it was EUR 8000 for floods, EUR 47 800 for debris flows, EUR 31 700 for landslides, EUR 33 100 for rockfalls, EUR 21 900 for avalanches, and EUR 10 200 for other events (Fig. 6d and Table S19). The annual costs correspond to EUR 1.3 million for total destruction, EUR 1.2 million for closure, and EUR 0.8 million for partial damage (Fig. 6e). On average, a “small” event costed EUR 15 800 and “medium” and a “large” events costed EUR 76 200 and 175 700, respectively.
Small events (95 % of all events; 804 events) represented 76 % (EUR 2.6 million) of the total direct damage costs, middle events (4 %; 33) represented 15 % (EUR 0.5 million) of the costs, and large events (1 %; nine) represented 9 % (EUR 0.3 million) of the costs. Roads (93 % of the total transportation network length) represented 73 % (EUR 2.5 million) of the total cost and railway tracks (7 % of all Swiss tracks) represented 27 % (EUR 0.9 million) of all direct damage costs.
5.1 Completeness of the database
The quality of the presented database is affected by several factors. The online press articles, the main source of this database, did not report all natural hazard events affecting the Swiss transportation network. This is particularly the case for events of small intensity. Reporting of such events in articles depends on the number of casualties, the severity of the injuries, the resources available for creation of the article, the preventive or educational interest, and the presence of images. Article occurrence was theoretically higher in summer, when the news activity is lower because of quieter political activity. In some cases, the sensitivity increased, for example, after two tourists were killed on Gotthard highway in 2006 when a portion of the Eiger summit collapsed. This made journalists prone to focusing on slope mass movements (RTS, 2006a, b; Liniger and Bieri, 2006; Oppikofer et al., 2008). Conversely, when many events occur simultaneously during intense storms, only the most significant disasters are reported in the press. Event reporting likely depends on the perception linked to the region of occurrence and the type of transportation network. For instance, a 0.5 m3 rockfall on a railway track on the Plateau has more media impact than one occurring on an alpine road, where such events are more common and the consequences on the traffic are lower.
The events collected from 2012 to 2016 ranged from 60 to 269 events per year (Fig. 6f and Table S20). This may be biased because Google Alerts were only used after May 2014. Data collection was less systematic for 2012 and 2013, with 60 and 99 events, respectively. With Google Alerts, the number increased to 245 and 269 for 2015 and 2016, respectively. With 173 events, 2014 was a transitional year, with Google Alerts used for approximately half of the year. An advantage of Google Alerts is the variety of the online sources from almost all the available online newspapers, which is better than a single source (Badoux et al., 2014). Google Alerts allows us to improve the event collection for floods. Moreover, the total number of events increased yearly, even after the use of Google Alerts, due to the increase in flood disruptions (Fig. 6f). This shows that the use of Google Alerts is not fully responsible for the yearly increase in the number of events. These numbers depend strongly on the weather conditions that vary yearly. This demonstrates that the event distribution is strongly dependent on a limited number of meteorological events such as long rainfalls or severe storms.
Statistical predictions regarding a small sample of events are intrinsically imprecise (Davies, 2013). The annual cost of damages from natural hazards in Switzerland (Hilker et al., 2009) from 1972 to 2007 shows great damage disparities over the years because extreme rainfall events or successive storms greatly increase the number of events in 1 year.
From a geographic point of view, the collected data should be considered a snapshot of a short time period capturing the background of small-intensity events, representing 96 % of the total events and 76 % of the total direct damage costs.
Notably, a number of natural hazard events induce expensive maintenance operations without affecting the traffic, for example, by damaging protective infrastructure. Those events are not considered in this study because they do not generate traffic perturbation but they should be considered in risk management.
5.2 Event definition
The terminology of natural hazard events on roads and railways is partially inappropriate because, although the origin of the direct event is typically natural (e.g., rainfall), the indirect origin is often anthropic. The construction of a transportation network, its use, and maintenance induce severe changes or actions that potentially affect slope stability, according to the Terzaghi (1950) classification of the mechanism of landslides (Jaboyedoff et al., 2016a). These causes of destabilizations, such as slope re-profiling, groundwater flow perturbation, surface water overland flow modifications, land degradation, inappropriate artificial structures, traffic vibration, and ageing of infrastructure affect landslide occurrence (Larsen and Parks, 1997; Jaboyedoff et al., 2016b). Furthermore, new infrastructure around tracks often induces an under-sizing of the existing drainage systems, which can induce the concentration of the surface or groundwater flow and destabilize slopes. People are thereby very often responsible for aggravation of the hazard consequences for built-up areas without having sufficient knowledge of the natural hazards and associated risk. Laimer (2017b) indicated that, along Austrian railways, 72 % of events are human-induced.
5.3 Event trends
Minor and medium-sized natural hazard events are not well documented because their direct consequences are often rapidly fixed, i.e. when the road can be re-opened within a few hours of the event or is only partially closed.
The slope angle values are lower than common values for natural hazard slopes because they are not the slope angles at the event origin but at the end of the propagation, as tracks are generally located much lower than the sources of propagation.
Several factors must be considered in the slope distribution. One explanation for the lower number of events on north-facing slopes is that there are fewer tracks due to the lower number of buildings on these slopes. Furthermore, north-oriented slopes receive less solar heat than south-oriented slopes and thus have fewer freeze–thaw cycles. This can partially explain the high number of rockfalls on west-, south-, and east-oriented slopes.
The monthly distribution indicates that floods mostly depend on two meteorological conditions: thunderstorms and long-lasting rainfalls, which mainly occur in spring and summer, particularly in combination with snowmelt in summer. The near absence of floods in winter is the result of the Swiss winter climate, with a lack of long or brief but intense precipitations and precipitation in mountains falling as snow. However, exceptions are possible, such as floods caused by winter storms in January 2018 (RTS, 2018). Debris flows mostly occurred in summer as the result of powerful and stationary thunderstorms. Landslides mainly occurred in spring due to long-lasting rainfalls with melting snow, generating water, saturated soils, and low evaporation. Snowmelt is the second trigger of landslides after intense rainfalls on Austrian railway tracks for 2005–2015 (Laimer, 2017b). Laimer (2017b) has shown that intense precipitation is a trigger for 78 % of landslides on railway tracks in Austria from 2005 to 2015. Freeze–thaw cycles during the winter are also a strong trigger of rockfalls.
Rockfalls do not follow the trend of occurring mainly in spring and summer. They occur in every season, mainly in autumn, winter, and spring due to numerous freeze–thaw cycles during these seasons which weaken the cohesion of rocks. Unsurprisingly, avalanches occurred mostly in winter. They also occurred in autumn as the result of fresh avalanches on soils that are not yet covered with snow and non-effective winter track closures of roads in the Alps. The absence of avalanches in the spring is likely due to the presence of road winter closures.
Floods mostly occurred in the afternoon, probably after strong thunderstorms. Debris flows mostly occurred in the evening, probably after strong thunderstorms in the late afternoon or in the early evening. Landslide event triggers were not time dependent as the other event processes were. Rockfalls appear to be triggered during thawing, which occurs mostly in the morning. Snowdrifts from the other category began in the afternoon, after a few hours of strong wind. This is why the other category events are concentrated in the afternoon. Notably, the time of the event does not always match the actual event time, especially for events occurring during the night or on tracks with little traffic such as country roads.
The high proportion of landslides on train tracks can be explained by the presence of soil embankments or unsuitable filled material along railway tracks and due to their inclination limitations. In addition, despite more protections than average, highways are proportionally more vulnerable than other roads because of the alignment with many imposing cuts and fills. Similar to motorways, railway tracks require a balanced gradient ratio and thus must run along valley sides over far distances. This requires long and steep cut slopes (Laimer, 2017b).
Regional railway tracks may have suffered from a lack of maintenance on track embankments during recent decades, which caused landslides and rockfalls on old infrastructures that were built long before the basics of soil mechanics were understood (Terzaghi, 1925; Michoud et al., 2011; Laimer, 2017a, b).
The higher number of direct impacts (24) than indirect (11) impacts on roads shows that drivers can generally stop their vehicles before being affected by a fallen event, unlike trains, which cannot be stopped within a short distance and reach the fallen mass (seven indirect impacts and one direct impact). In addition, there is a much higher probability that a vehicle on a road would be directly impacted by an event than a train on a track because the road traffic is excessively denser than the railway traffic.
Deviation lengths for railways are difficult to evaluate. In the case of replacement buses, the distance of deviation is calculated using the distance of the replacement buses on the road. For 72 events on railways (75 % of all events on train tracks), there were no possibilities of deviations using other train tracks. In cases of no replacement service, the deviation length for the railway was the distance of train track between the two stations on both sides of the track closure. The average distance of deviation for this configuration was 65 km.
An example of an event from our database can be summarized as follows: a flood event occurred in June during the afternoon in the Plateau region on a small south-oriented slope with a minor road. It generated a road closure of several hours with a deviation distance of less than 1 km and caused no injuries or deaths. The possibility of road deviation is large. On the day of the event, the sun shined for half of the day, 10 mm of rain fell (20 mm during the previous 5 days and 35 mm during the last 10 days), and the average temperature during the event was 20 ∘C. There were approximately 1000 lightings around the event location on the event day and the wind speed was 7 km h−1 in a northeast direction.
5.4 Direct damage cost estimation
Direct damage costs include all costs directly related to the rehabilitation of the track to ensure traffic service. All repair costs of the tracks are included. The estimated direct costs did not consider indirect costs such as vehicle repairs (the repair of a train costs a lot), implementation of deviations, replacement buses in case of railway closure, costs generated due to the traffic restriction for road and railway users or mitigation work, and protective measures.
The estimation of direct damage costs depends on many factors that are difficult to estimate. The hour has an impact on the cost: repair work during the night or the weekend costs more than that during office hours. The event location also affects the costs; for example, costs in an alpine valley far from construction companies are higher than those in an agglomeration where construction machines and landfill for the excavated material are close by. The date also impacts the costs: an event occurring during a period when weather conditions are difficult will last longer. The emergency of the situation also influences the direct costs, as damage on a secondary road or a highway will be treated with a different emergency level. There were also influences from traffic, the presence of damaged retaining walls and protective measures, the slope angle, the financial situation of the administration responsible for the repair work, and the necessity of work on the slope or cliff above the track. Work on railways costs more than that on roads because the access is often more difficult and because contact lines and rail repairs can be more expensive.
An estimation of the direct costs of the small events is more credible than the costs of events of higher damages because the main work is to clear the road of fallen materials. Cost estimation for the middle and large events is more complicated because the repairs require large construction sites, which have their own characteristics that cannot be generalized.
The estimated costs must be considered as an order of magnitude of the direct costs generated by natural hazard events on the Swiss transportation network. These costs could be up to 10 times higher than the given cost estimation. However, the results are more refined than those of the previous study of Voumard et al. (2016), in which costs of events below EUR 8500 were not considered.
Compared to the annual direct damage cost estimation of EUR 3.4 million for natural hazards on the Swiss transportation network, annual damages caused by natural disasters in Switzerland for 1972–2011 are estimated at EUR 290 million per year (OFEV, 2013). Switzerland allocates EUR 2.5 billion each year for protection against natural hazards, which corresponds to 0.6 % of its GDP. A total of 21 % (EUR 0.5 billion) of this allocated amount concerns intervention and repair (OFEV/OFS, 2007, 2011).
5.5 General discussion of natural hazards and transportation networks
There are several methods to quantify the costs of track closures (Nicholson and Du, 1997; Erath et al., 2009). However, they are unsatisfactory because the quantification of costs, especially the indirect costs, is difficult and the resilience must be carefully considered, as people often find solutions to bypass the track closure (deferred travel, meeting realized with digital technologies, alternative sources of supply, etc.).
The closure costs due to natural hazards, such as traffic congestion costs, are not compensated for in Switzerland. However, models must include the potential loss of income in taxes if the economy of the region is slowed. In addition, there are several ways to replace a transportation route or means. For example, trains can be replaced by buses between two stations. Using other train routes can be very complicated and long. Road deviation is usually much easier; however, in some valleys in the Alps, the deviation lengths can reach hundreds of kilometres and there may be no possibility of deviation. Notably, the increase in the travel duration in the case of railway closures is more relevant for passengers than the distance of deviation.
The spatial distribution (Fig. 2) indicates a high density of events in populated areas, principally on the Plateau. This concentration of events around populated areas can be explained by various factors. First, when a meteorological event occurs in a densely populated area, it may primarily affect tracks because the transportation networks are dense in those areas. Conversely, a meteorological event that covers a similar surface but occurs in a sparsely populated area, for example, in an Alpine lateral valley, will affect few tracks. Second, the number of people impacted, the associated economic consequences, the population sensitivity, the number of journalists available, and the number of reporter-readers impact the media coverage of the natural hazard events. This leads to better media coverage of events in densely populated areas.
Davies (2013) notes the importance of the event in the context of the affected persons. A minor landslide that affects a person is unworthy of notice to the vast majority of the population but is considered momentarily catastrophic for the person, as they must reconsider their travel, find an alternative route, or cancel their appointment.
Information acquisition is challenging in the development of such a database because it depends on several people working in the field, such as road menders, railway maintenance workers, and forestry workers, who may have little time or interest in filling in the relevant attributes of the database. Hence, improvements to the database quality are possible using new tools such as offline collaborative WebGIS (Balram and Dragicevic, 2006; Pirotti et al., 2011; Aye et al., 2016; Olyazadeh et al., 2017), which can facilitate event data collection directly in the field using smartphones.
Furthermore, data acquisition and data analysis should distinguish the specific types of transportation networks. For instance, the sensibility to a natural hazard event on a railway track, where a 1 dm3 rock can derail a train, is different from the sensitivity of an alpine road to the same volume of rock. Similarly, a landslide generating a track gauge change of 1 cm can lead to a train derailment whereas a landslide-inducing track displacement of few tens of centimetres will probably not seriously affect the traffic of a mountain road. The liabilities in case of accidents on a railway track or road also differ. The railway manager and operator are responsible for the passengers' safety whereas the road manager allocates part of the responsibility to the driver. Therefore, compared to the road network, the railway network has a much higher sensitivity. The collection of the natural hazard events affecting roads and railways can be improved using different communication channels including social media such as the Facebook page of the Colorado Department of Transport (CDT) in the United States. This diffusion channel allows for the CDT to highlight natural hazard events that affect roads in Colorado, informing drivers of their travel impacts.
Using newspapers and Google Alerts, 846 natural hazard events that affected the Swiss transportation network from 2012 to 2016 were collected. They were characterized by 172 attributes, making them unique to Switzerland (Table 1). Our results highlight the impact of natural hazards on Swiss roads and railways, especially for small events with material deposits of less than 10 m3 on the track that are rarely collected. They represent 95 % of events in the database. The direct costs of all events were estimated at EUR 3.4 million per year with an average cost at EUR 19 900 per event. The direct costs of small events were estimated at EUR 2.5 million per year, which represents three-quarters of the total direct costs.
Because of the increase in extreme meteorological events such as severe storms, climate change, rapidly growing infrastructure, increased traffic, and the lack of funding for track maintenance, we expect increasing impacts of natural hazards on Swiss transportation networks. The key to reducing the natural hazard risk on tracks is financing.
The presented database and its event analysis can aid decision makers at the three Swiss political levels (the confederation, the cantons, and the municipalities) to plan and enforce protective measures in the case of observable hot spots in the database.
Risk management in Switzerland may be improved by the existence of such a database. For example, it shows the important alternative ways to bypass obstacles. We highlighted that there were no deviation routes for one-quarter of events. This proportion is high and must be considered by the authorities. The protection of all Swiss tracks against natural hazard processes would be too expensive. Thus, it is essential to ensure alternative tracks and fund protective measures according to the best ratio (cost ∕ risk reduction). Minor roads often belong to the municipalities, which do not have a great interest in maintaining them. The cantons and the confederation would be advised to participate in or take over the maintenance of some roads that can be vital during the closure of main roads or railway tracks. This is particularly appropriate in the transportation corridor, where the minor road is located on the opposite side of the valley from the major road. This database aids in understanding the risk of transportation networks at the national scale rather than a track scale.
For this purpose, we created open-access online maps of the events in Google Maps and ArcGIS Online (Figs. S5 and S6) to promote this problematic issue. Our analysis also helps to elucidate the impacts of low-intensity events that had been considered almost insignificant and were largely unrecognized.
The data used in this paper are available upon request.
The supplement related to this article is available online at: https://doi.org/10.5194/nhess-18-2093-2018-supplement.
JV has developed the database, has acquired the data, and has performed most of the analyses, which were supervised by MJ and MHD.
This article is part of the special issue “Landslide–road network interactions”. It does not belong to a conference.
The authors declare that they have no conflicts of interest.
The authors would like to thank Yann Christen (Mantegani & Wysseier
Ingenieure & Planer AG, Biel/Bienne, Switzerland) for their help in
estimating direct remediation costs. We are also very grateful to the
reviewers, especially to Hans Jörg Laimer (ÖBB, Salzburg, Austria) for their
reviews and valuable comments. The authors are also thankful to Nicolas Pollet
(ALTAMETRIS, Paris, France) for providing meaningful comments about the data
mining differences in railway and road networks. We also thank Andrea Pedrazzini
(Repubblica e Cantone Ticino) for his relevant and useful inputs about the
collected data. The English language of a previous version of this paper was corrected by the American Journal
Experts.
Edited by: Faith Taylor
Reviewed by: Hans Jörg Laimer and one anonymous referee
Aye, Z. C., Sprague, T., Cortes, V. J., Prenger-Berninghoff, K., Jaboyedoff, M., and Derron, M. H.: A collaborative (web-GIS) framework based on empirical data collected from three case studies in Europe for risk management of hydro-meteorological hazards, Int. J. Disast. Risk Reduct., 15, 10–23, https://doi.org/10.1016/j.ijdrr.2015.12.001, 2016.
Badoux, A., Andres, N., and Turowski, J.: Damage costs due to bedload transport processes in Switzerland, Nat. Hazards Earth Syst. Sci., 14, 279–294, https://doi.org/10.5194/nhess-14-279-2014, 2014.
Balram, S. and Dragicevic, S. (Eds.): Collaborative Geographic Information Systems, Idea Group Inc., New York, 2006.
Bär, O.: Geographie der Schweiz, Lehrmittelverlag des Kantons Zürich, Zürich, 1971.
Below, R., Wirtz, A., and Guha-Sapir, D.: Disaster category classification and peril terminology for operational purposes, Centre for Research on the Epidemiology of Disasters (CRED), Brussels, and Munich Reinsurance Company (Munich RE), Munich, p. 19, 2009.
Bíl, M., Kubeček, J., and Andrášik, R.: An epidemiological approach to determining the risk of road damage due to landslides, Nat. Hazards, 73, 1323–1335, 2014.
Bíl, M., Andrášik, R., Kubeček, J., Křivánková, Z., and Vodák, R.: RUPOK: An Online Landslide Risk Tool for Road Networks, in: Advancing Culture of Living with Landslides, WLF 2017, edited by: Mikoš, M., Vilímek, V., Yin, Y., and Sassa, K., Springer, Cham, https://doi.org/10.1007/978-3-319-53483-1_4, 2017.
Budetta, P.: Assessment of rockfall risk along roads, Nat. Hazards Earth Syst. Sci., 4, 71–81, https://doi.org/10.5194/nhess-4-71-2004, 2004.
Bunce, C. M., Cruden, D. M., and Morgenstern, N. R.: Assessment of the hazard from rock fall on a highway, Can. Geotech. J., 34, 344–356, 1997.
Canton du Valais et de Vaud: La construction de la route entre Rennaz (VD) et Les Evouettes (VS), available at: https://www.vd.ch/fileadmin/user_upload/themes/mobilite/routes/fichiers_pdf/H144_Plaquette.pdf (last access: 25 January 2018), 2012.
CFF: Infrastructures, available at: https://reporting.sbb.ch/fr/infrastructures?rows=2,3,4,5,6,7,8,9,10,11,12,14,15,16,17,18,19,20,21,22,23,24,25,26,27,28,29,30,31,32,33,34,35,36,37,38,39,40,41,44,45,46,47,48,49,50,51,52,53,54,55,56,57,60,61,62,63,64,65,66,67&years=0,1,4,5,6,7&scroll=0, last access: 2 May 2018.
Collins, T. K.: Debris flows caused by failure of fill slopes: early detection, warning, and loss prevention, Landslides, 5, 107–120, https://doi.org/10.1007/s10346-007-0107-y, 2008.
Crosta, G. B., di Prisco, C., Frattini, P., Frigerio, G., Castellanza, R., and Agliardi, F.: Chasing a complete understanding of the triggering mechanisms of a large rapidly evolving rockslide, Landslides, 11, 747–764, https://doi.org/10.1007/s10346-013-0433-1, 2014.
Dalziell, E. and Nicholson, A.: Risk and impact of natural hazards on a road network, J. Transport. Eng., 127, 159–166, https://doi.org/10.1061/(ASCE)0733-947X(2001)127:2(159), 2001.
Damm, B. and Klose, M.: Landslide database for the Federal Republic of Germany: a tool for analysis of mass movement processes, in: Landslide science for a safer geoenvironment, Springer International Publishing, Cham, 787–792, https://doi.org/10.1007/978-3-319-05050-8_121, 2014.
Dartmouth Flood Observatory: Global archive of large flood events- notes, available at: http://www.dartmouth.edu/~floods/Archives/ArchiveNotes.html (last access: 25 January 2018), 2007.
Davies, T. R. H.: Misconceptions About Natural Disasters, in: Encyclopedia of Natural Hazards, Encyclopedia of Earth Sciences Series, edited by: Bobrowsky, P. T., Springer, Dordrecht, 678–682, https://doi.org/10.1007/978-1-4020-4399-4_237, 2013.
Devoli, G., Strauch, W., Chávez, G., and Høeg, K.: A landslide database for Nicaragua: a tool for landslide – hazard management, Landslides, 4, 163–176, https://doi.org/10.1007/s10346-006-0074-8, 2007.
Erath, A., Birdsall, J., Axhausen, K., and Hajdin, R.: Vulnerability assessment methodology for Swiss road network, Transport. Res. Rec.: J. Transport. Res. Board, 2137, 118–126, https://doi.org/10.3141/2137-13, 2009.
Evans, S. G., Cruden, D. M., Bobrowsky, P. T., Guthrie, R. H., Keegan, T. R., Liverman, D. G. E., and Perret, D.: D: Landslide risk assessment in Canada; a review of recent developments, in: Landslide Risk Management: Proceedings of the International Conference on Landslide Risk Management, edited by: Hungr, O., Fell, R., Couture, R., and Eberhardt, E., AA Balkema Publishers/Taylor & Francis Group, Vancouver, 351–363, 2005.
Federal Statistical Office: Infrastructure et longueur des réseaux, available at: https://www.bfs.admin.ch/bfs/fr/home/statistiques/mobilite-transports/infrastructures-transport-vehicules/longueur-reseaux.html, last access: 25 January 2018.
Foster, C., Pennington, C. V. L., Culshaw, M. G., and Lawrie, K: The national landslide database of Great Britain: development, evolution and applications, Environ. Earth Sci., 66, 941–953, https://doi.org/10.1007/s12665-011-1304-5, 2012.
Gall, M., Borden, K. A., and Cutter, S. L.: When do losses count? Six fallacies of natural hazards loss data, B. Am. Meteorol. Soc., 90, 799–809, https://doi.org/10.1175/2008BAMS2721.1, 2009.
Google: Alerts, available at: https://www.google.com/alerts, last access: 2 May 2018.
Guemache, M. A., Chatelain, J.-L., Machane, D., Benahmed, S., and Djadia, L.: Failure of landslide stabilization measures: The Sidi Rached viaduct case (Constantine, Algeria), J. Afr. Earth Sci., 59, 349–358, https://doi.org/10.1016/j.jafrearsci.2011.01.005, 2011.
Guha-Sapir, D., Below, R., and Hoyois, P: EM-DAT: the CRED/OFDA International Disaster Database, Université catholique de Louvain, Brussels, Belgium, available at: http://www.emdat.be/database (last access: 25 January 2018), 2015.
Guzzetti, F., Cardinali, M., and Reichenbach, P.: The AVI project: A bibliographical and archive inventory of landslides and floods in Italy, Environ. Manage., 18, 623–633, https://doi.org/10.1007/BF02400865, 1994.
Hilker, N., Badoux, A., and Hegg, C.: The Swiss flood and landslide damage database 1972–2007, Nat. Hazards Earth Syst. Sci., 9, 913–225, https://doi.org/10.5194/nhess-9-913-2009, 2009.
Hungr, O., Evans, S. G., and Hazzard, J.: Magnitude and frequency of rock falls and rock slides along the main transportation corridors of southwestern British Columbia, Can. Geotech. J., 36, 224–238, https://doi.org/10.1139/t98-106, 1999.
Jaboyedoff, M., Horton, P., Derron, M.-H., Longchamp, C., and Michoud, C.: Monitoring natural hazards, in: Encyclopedia of Natural Hazards, Springer, Dordrecht, the Netherlands, 686–696, https://doi.org/10.1007/978-1-4020-4399-4_354, 2016a.
Jaboyedoff, M., Michoud, M., Derron, M.-H., Voumard, J., Leibundgut, G., Sudmeier-Rieux, K., Nadim, F., and Leroi, E.: Human-induced landslides: towards the analysis of anthropogenic changes of the slope environment, in: Landslides and Engineering Slopes – Experiences, Theory and practices, edited by: Avresa, S., Cascini, L., Picarelli, L., and Scavia, C., CRC Press, London, 217–232, https://doi.org/10.1201/b21520-20, 2016b.
Jaiswal, P., van Westen, C. J., and Jetten, V.: Quantitative assessment of landslide hazard along transportation lines using historical records, Landslides, 8, 279–291, https://doi.org/10.1007/s10346-011-0252-1, 2011.
Jenelius, E. and Mattsson, L. G.: Road network vulnerability analysis of area-covering disruptions: A grid-based approach with case study, Transport. Res. Pt. A, 46, 746–760, https://doi.org/10.1016/j.tra.2012.02.003, 2012.
Karlaftis, M. G., Kepaptsoglou, K. L., and Lambropoulos, S.: Fund allocation for transportation network recovery following natural disasters, J. Urban Plan. Dev., 133, 82–89, https://doi.org/10.1061/(ASCE)0733-9488(2007)133:1(82), 2007.
Kasperski, J., Delacourt, C., Allemand, P., Potherat, P., Jaud, M., and Varrel, E.: Application of a Terrestrial Laser Scanner (TLS) to the Study of the Séchilienne Landslide (Isère, France), Remote Sensing, 2, 2785–2802, https://doi.org/10.3390/rs122785, 2010.
Kirschbaum, D. B., Adler, R., Hong, Y., Hill, S., and Lerner-Lam, A.: A global landslide catalogue for hazard applications: method, the results, and limitations, Nat. Hazards, 52, 561–575, https://doi.org/10.1007/s11069-009-9401-4, 2010.
Laimer, H. J.: Large-scale engineering geomorphological mapping as an additional tool in the assessment of earthworks for transport infrastructure, Q. J. Eng. Geol. Hydrogeol., 5, 206–210, https://doi.org/10.1144/qjegh2016-135, 2017a.
Laimer, H. J.: Anthropogenically induced landslides – A challenge for railway infrastructure in mountainous regions, Eng. Geol., 222, 92–101, https://doi.org/10.1016/j.enggeo.2017.03.015, 2017b.
Larsen, M. C. and Parks, J. E.: How wide is a road? The association of roads and mass-wasting in a forested montane environment, Earth Surf. Proc. Land., 22, 835–848, 1997.
Liniger, M. and Bieri, D.: A2, Gothardautobahn, Felssturz Gurtnellen vom 31 Mai 2006, Buerteilung und Masnahmnen, Pub. Soc. Suisse Mécanique Sols Roches, 153, 81–86, 2006.
Malamud, B. D., Turcotte, D. L., Guzzetti, F., and Reichenbach, P.: Landslide inventories and their statistical properties, Earth Surf. Proc. Land., 29, 687–711, https://doi.org/10.1002/esp.1064, 2004.
MeteoSwiss: Data on the Swiss temperature mean, available at: http://www.meteoswiss.admin.ch/home/climate/swiss-climate-in-detail/Swiss-temperature-mean/Data-on-the-Swiss-temperature-mean.html, last access: 25 January 2018.
Michoud, C., Derron, M.-H., Horton, P., Jaboyedoff, M., Baillifard, F.-J., Loye, A., Nicolet, P., Pedrazzini, A., and Queyrel, A.: Rockfall hazard and risk assessments along roads at a regional scale: example in Swiss Alps, Nat. Hazards Earth Syst. Sci., 12, 615–629, https://doi.org/10.5194/nhess-12-615-2012, 2012.
Michoud, C., Jaboyedoff, M., Derron, M.-H., Nadim, F., and Leroi, E.: Classification of landslide-inducing anthropogenic activities, in: Proceedings 5th Canadian Conference on Geotechnique and Natural Hazards, 15–17 May 2011, Kelowna, Canadian Geotechnical Society, Richmond, BC, 2011.
Miettinen, O. S.: Standardization of risk ratios, Am. J. Epidemiol., 96, 383–388, 1972.
Montreux: Commune de Montreux – Officiel, Facebook, available at: https://www.facebook.com/CommunedeMontreux/posts/794678823903970, last access: 2 May 2018.
Munich Re: NatcatSERVICE: natural catastrophe know-how for risk management and research, Munich RE, available at: https://www.munichre.com/site/touch-publications/get/documents_E-1383948952/mr/assetpool.shared/Documents/5_Touch/_Publications/302-07225\textunderscore en.pdf (last access: 25 January 2018), 2011.
Munich Re: Topics Geo Natural catastrophes 2012 – Analyses, assessments, positions, Munich RE, Munich, Germany, available at: https://www.munichre.com/site/touch-publications/get/documents_E1431329566/mr/assetpool.shared/Documents/5_Touch/_Publications/302-07742_en.pdf (last access: 25 January 2018), 2013.
Munich Re: Topics Geo Natural catastrophes 2013 – Analyses, assessments, positions, Munich RE, Munich, Germany, available at: https://www.munichre.com/site/corporate/get/documents_E1043212252/mr/assetpool.shared/Documents/5_Touch/_Publicat1ions/302-08121_en.pdf (last access: 25 January 2018), 2014.
Munich Re: Topics Geo Natural catastrophes 2014 – Analyses, assessments, positions, Munich RE, Munich, Germany, available at: https://www.munichre.com/site/corporate/get/documents_E1018449711/mr/assetpool.shared/Documents/5_Touch/_Publications/302-08606_en.pdf (last access: 25 January 2018), 2015.
Munich Re: Topics Geo Natural catastrophes 2016 – Analyses, assessments, positions, Munich RE, Munich, Germany, available at: https://www.munichre.com/site/touch-publications/get/documents_E-271800065/mr/assetpool.shared/Documents/5_Touch/_Publications/TOPICS_GEO_2016-en.pdf (last access: 25 January 2018), 2017.
Muzira, S., Humphreys, M., and Wolfhart, P.: Geohazard management in the transport sector, Transport Notes Series 40, World Bank, Washington, D.C., USA, available at: https://openknowledge.worldbank.org/handle/10986/11708 (last access: 25 January 2018), 2010.
Nicholson, A. and Du, Z.-P.: Degradable transportation systems: an integrated equilibrium model, Transport. Res. Pt. B, 31, 209–223, https://doi.org/10.1016/S0191-2615(96)00022-7, 1997.
Noverraz, F. and Parriaux, A.: Evolution comparée des conditions hydrologiques et des mouvements du glissement de la Frasse (Alpes suisses occidentales), Hydrol. Mount. Reg. – Artific. Reserv. Water Slopes, 194, 355–364, 1990.
OFEV: Environnement Suisse 2013, Berne, p. 86, available at: https://www.bafu.admin.ch/bafu/fr/home/etat/publications-etat-de-l-environnement/environnement-suisse-2013.html (last access: 25 January 2018), 2013.
OFEV/OFS: Environnement Suisse 2007, Berne et Neuchâtel, p. 148, available at: https://www.bafu.admin.ch/bafu/fr/home/etat/publications-etat-de-l-environnement/environnement-suisse-2007.html (last access: 25 January 2018), 2007.
OFEV/OFS: Environnement Suisse 2011, Berne et Neuchâtel, p. 101, available at: https://www.bafu.admin.ch/bafu/fr/home/etat/publications-etat-de-l-environnement/environnement-suisse-2011.html (last access: 25 January 2018), 2011.
Olyazadeh, R., Sudmeier-Rieux, K., Jaboyedoff, M., Derron, M.-H., and Devkota, S.: An offline–online Web-GIS Android application for fast data acquisition of landslide hazard and risk, Nat. Hazards Earth Syst. Sci., 17, 549–561, https://doi.org/10.5194/nhess-17-549-2017, 2017.
Oppikofer, T., Jaboyedoff, M., and Keusen, H. R.: Collapse at the eastern Eiger flank in the Swiss Alps, Nat. Geosci., 1, 531–535, 2008.
Peduzzi, P., Dao, H., Herold, C., and Mouton, F.: Assessing global exposure and vulnerability towards natural hazards: the Disaster Risk Index, Nat. Hazards Earth Syst. Sci., 9, 1149–1159, https://doi.org/10.5194/nhess-9-1149-2009, 2009.
Petley, D. N., Dunning, S. A., and Rosser, N. J.: The analysis of global landslide risk through the creation of a database of worldwide landslide fatalities, in: Landslide Risk Management, edited by: Hungr, O., Fell, R., Couture, R., and Eberhardt E., A. A. Balkema Publisher, Taylor & Francis Group, London, 367–374, 2005.
Pirotti, F., Guarnieri, A., and Vettore, A.: Collaborative Web-GIS design: A case study for road risk analysis and monitoring, T. GIS, 15, 213–226, 2011.
Rowling, M: Interview – Stop ignoring costs of smaller disasters – UN risk chief, Thomson reuters foundation news, available at: http://news.trust.org/item/20160121081340-ha0a1/?source=hpDontmiss (last access: 25 January 2018), 2016.
RTS: Eiger: la masse rocheuse toujours menaçante, available at: https://www.rts.ch/info/suisse/1114685-eiger-la-masse-rocheuse-toujours-menacante.html (last access: 2 May 2018), 2006a.
RTS: Gothard fermé, chaos au San Bernardino, available at: https://www.rts.ch/info/suisse/1111731-gothard-ferme-chaos-au-san-bernardino.html (last access: 2 May 2018), 2006b.
RTS: Inondations et glissements de terrain frappent la Suisse romande, available at: https://www.rts.ch/info/regions/9219138-inondations, last access: 2 May 2018.
Salcedo, D. A.: Behaviour of a landslide prior to inducing a viaduct failure, Caracas – La Guaira highway, Venezuela, Eng. Geol., 109, 16–30, https://doi.org/10.1016/j.enggeo.2009.02.001, 2009.
SBB CFF FFS: Rapport annuel de synthèse 2016, available at: https://company.sbb.ch/content/dam/sbb/de/pdf/sbb-konzern/medien/publikationen/geschaefts-2016/Zusammenfassender_Jahresbericht_2016_FR.pdf (last access: 25 January 2018), 2017.
Spiegelman, D. and Hertzmark, E.: Easy SAS calculations for risk or prevalence ratios and differences, Am. J. Epidemiol., 162, 199–200, 2005.
Stark, C. P. amd Guzzetti, F.: Landslide rupture and the probability distribution of mobilized debris volumes, J. Geophys. Res.- Ea. Surf., 114, F00A02, https://doi.org/10.1029/2008JF001008, 2009.
Swiss Re: SIGMA, Swiss Reinsurance, Zurich, Switzerland, available at: http://institute.swissre.com/research/overview/sigma_data/, last access: 25 January 2018.
Swisstopo: DHM25, available at: https://shop.swisstopo.admin.ch/en/products/height_models/dhm25, last access: 2 May 2018.
Tatano, H. and Tsuchiya, S.: A framework for economic loss estimation due to seismic transportation network disruption: a spatial computable general equilibrium approach, Nat. Hazards, 44, 253–265, https://doi.org/10.1007/s11069-007-9151-0, 2008.
Tchögl, L., Below, R., and Guha-Sapir, D.: An analytical review of selected data sets on natural disasters and impacts, Université catholique de Louvain, Centre for Research on the Epidemiology of Disasters, Brussels, Belgium, 2006.
Terzaghi, K.: Erdbaumechanik auf bodenphysikalischer Grundlage, Deuticke, Leipzig, 1925.
Terzaghi, K.: Mechanism of Landslides, The Geological Society of America, Engineering Geology, Berkley, 83–123, 1950.
Voumard, J., Derron, M.-H., Jaboyedoff, M., and Andres, N.: Minor landslides and floods events affecting transportation network in Switzerland, preliminary results, in: Landslides and Engineering Slopes – Experiences, Theory and practices, edited by: Avresa, S., Cascini, L., Picarelli, L., and Scavia, C., CRC Press, London, 2023–2028, https://doi.org/10.1201/b21520-20, 2016.
Zhang, J. and Kai, F. Y.: What is the relative risk?: A method of correcting the odds ratio in cohort studies of common outcomes, J. Am. Med. Assoc., 280, 1690–1691, 1998.