the Creative Commons Attribution 4.0 License.
the Creative Commons Attribution 4.0 License.
 | 27 Apr 2018
The role of the reef–dune system in coastal protection in Puerto Morelos (Mexico)
Gemma L. Franklin
Alec Torres-Freyermuth
Gabriela Medellin
María Eugenia Allende-Arandia
Christian M. Appendini
Reefs and sand dunes are critical morphological features providing natural coastal protection. Reefs dissipate around 90 % of the incident wave energy through wave breaking, whereas sand dunes provide the final natural barrier against coastal flooding. The storm impact on coastal areas with these features depends on the relative elevation of the extreme water levels with respect to the sand dune morphology. However, despite the importance of barrier reefs and dunes in coastal protection, poor management practices have degraded these ecosystems, increasing their vulnerability to coastal flooding. The present study aims to theoretically investigate the role of the reef–dune system in coastal protection under current climatic conditions at Puerto Morelos, located in the Mexican Caribbean Sea, using a widely validated nonlinear non-hydrostatic numerical model (SWASH). Wave hindcast information, tidal level, and a measured beach profile of the reef–dune system in Puerto Morelos are employed to estimate extreme runup and the storm impact scale for current and theoretical scenarios. The numerical results show the importance of including the storm surge when predicting extreme water levels and also show that ecosystem degradation has important implications for coastal protection against storms with return periods of less than 10 years. The latter highlights the importance of conservation of the system as a mitigation measure to decrease coastal vulnerability and infrastructure losses in coastal areas in the short to medium term. Furthermore, the results are used to evaluate the applicability of runup parameterisations for beaches to reef environments. Numerical analysis of runup dynamics suggests that runup parameterisations for reef environments can be improved by including the fore reef slope. Therefore, future research to develop runup parameterisations incorporating reef geometry features (e.g. reef crest elevation, reef lagoon width, fore reef slope) is warranted.
- Article
(2595 KB) - Full-text XML
- BibTeX
- EndNote


Coral reefs protect coastal regions against the natural hazards associated with storm wave events, thereby protecting beaches against processes of erosion. Energy dissipation at the coast is increased by the presence of irregular reef surfaces, which are important in wave transformation (Lowe et al., 2005). These natural barriers can dissipate up to 97 % of the incoming wave energy, with the reef crest alone reducing wave height between 64 and 76 % (Lugo-Fernandez et al., 1998; Ferrario et al., 2014). This property becomes particularly important considering that approximately 850 million people (one-eighth of the world's population) reside within 100 km of a coral reef, with more than 275 million living less than 30 km from reefs, benefiting from the services they provide (Burke et al., 2011). While coral reefs protect the coasts from wave energy, wave-driven flooding along the coast can still occur under extreme events such as hurricanes.
Coral reefs have been degrading over the last four decades (Alvarez-Filip et al., 2009), as a result of a combination of factors including overfishing, coastal development, contamination and an excess of nutrients, as well as degradation by coral bleaching events due to increased temperatures. Eakin (1996) reported erosion rates of 0.19 kg CaCO3 for a Panama reef, equivalent to a vertical loss of approximately 6 mm yr−1 (Sheppard et al., 2005). Considering that reef degradation reduces the protective characteristics of coral reefs, there is an increase in coastal vulnerability towards extreme events.
The degradation of coral reefs affects wave runup due to modifications in the spatial gradient of wave dissipation, controlling both the incident swash and wave-induced setup. Nevertheless, the impact of a storm depends not only on the bathymetry and forcing parameters of the storm but also on the geometry of the coast, particularly its elevation (Sallenger, 2000). Sallenger (2000) proposed a scale that categorises storm-induced impacts and the magnitude of net erosion and accretion on barrier islands based on the elevation of extreme water levels relative to the elevation of geomorphic features. Thus, sand dunes play an important role as natural barriers against coastal flooding by attenuating wave energy and slowing inland water transfer (USACE, 2013). After a storm, the height and recovery of the dune are critical for determining the coast's vulnerability to changes in sea level and storms (Durán and Moore, 2013). Although a storm may cause a dune to erode, it provides a source of sediment into the littoral cell (USACE, 2013). This is not the case when the dune is removed by increased coastal development and excessive exploitation of natural resources, which puts these regions at greater risk from extreme events.
According to a recent report on the importance of coral reefs and dunes (Secaira-Fajardo et al., 2017), the Caribbean is the region that presents the greatest loss of dune vegetation, reducing dune stability (e.g. Silva et al., 2016) and hence its ability to provide natural coastal protection. For the case of Cancún, Quintana Roo (Mexico), since 1984 the beach has been receding by 2 m yr−1 as a result of the effects of hurricanes and coastal development (Silva et al., 2006). Construction on the dunes of the barrier island has restricted aeolic transport, thereby preventing the natural regeneration of the dunes (Silva et al., 2006). On the other hand, heights of 3–4 m have been observed for sand dunes in Puerto Morelos (Ruiz de Alegría-Arzaburu et al., 2013). Mariño-Tapia et al. (2014) pointed out that during the category 5 hurricane Wilma, in 2005, the combined presence of dunes, a coral reef, and sand transported from Cancún during the event protected the coast of Puerto Morelos. This suggests that the coast is less vulnerable to extreme events where the reef–dune system is conserved. Unfortunately, coastal dunes in Mexico are at risk due to coastal or agricultural development (Jiménez-Orocio et al., 2014). Therefore, an assessment of the implications of a reduction in natural coastal protection is required.
While there are a number of studies on the role of coral reef (e.g. Quataert et al., 2015) and sand dune (e.g. Sallenger, 2000) geometry in coastal protection, fewer look at their combined effect. Therefore, this study aims to investigate the role of both reef and dune degradation on the storm impact in Puerto Morelos (Mexico). The outline of the paper is as follows. Section 2 describes the study area and the data employed in this work. The numerical model is described in Sect. 3. Then, methods used in this study are described in Sect. 4, followed by the results (Sect. 5). A discussion on the applicability of current runup parameterisations to this environment is presented in Sect. 6. Finally, concluding remarks are provided in Sect. 7.
The Puerto Morelos fringing reef lagoon is located in the western Caribbean, approximately 25 km south of Cancún, on the northeast coast of the Yucatán Peninsula, Mexico (Fig. 1a). This area is of particular interest for several reasons, notably its economic importance for tourism and fisheries (10 fishing cooperatives operate in the area), and its ecological significance, forming a natural protected area.
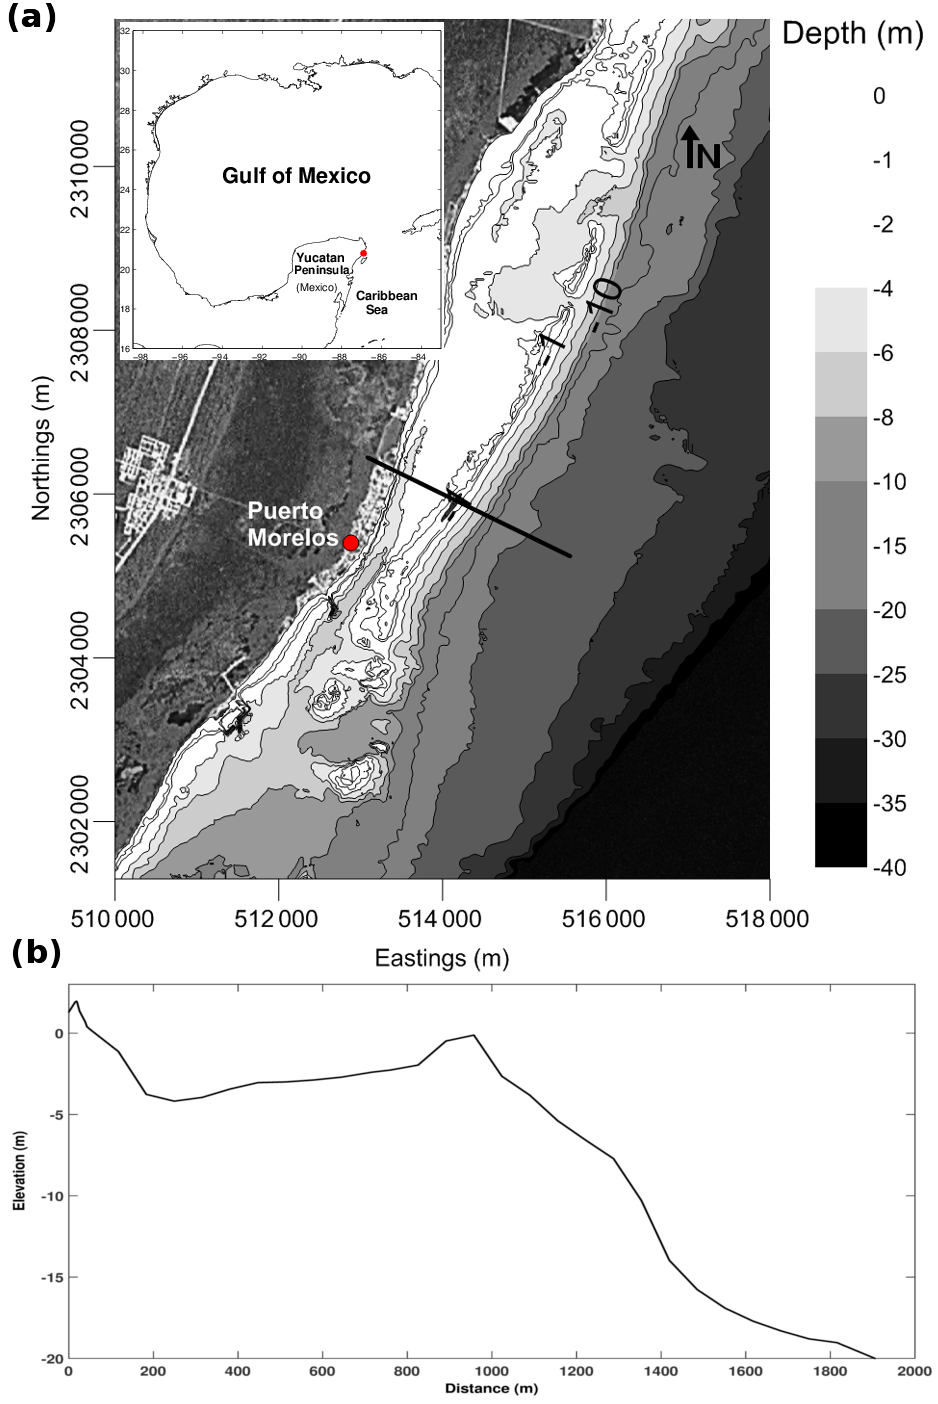
Figure 1(a) Map of the study area. The solid black line indicates the location of the bathymetric transect used in the numerical model. (b) Bathymetry obtained from the transect indicated on the map (bathymetry courtesy of CONABIO), including a beach profile surveyed in March 2014 (courtesy of CINVESTAV-Mérida).
Puerto Morelos is characterised by a semi-diurnal microtidal regime with a tidal range of less than 0.4 m (Parra et al., 2015). There is also evidence of a low-frequency, energetic oscillation (∼0.4 m), associated with the Yucatán Current and atmospheric pressure which has a period of ∼15 days (Coronado et al., 2007). The wave climate is dominated by wind waves from the Caribbean (south-southeast, SSE) generated by the trade winds. The waves have an average annual significant wave height, Hs, of 0.8 m and a dominant spectral peak period, Tp, between 6 and 8 s (Coronado et al., 2007; Parra et al., 2015). In this region, waves exceeding a height of 2 m are considered high-energy waves, which often occur during the northerlies season, locally known as “Nortes”, when anticyclonic cold fronts descend over the Gulf of Mexico into the Caribbean Sea during the winter months (Coronado et al., 2007; Mariño-Tapia et al., 2011; Appendini et al., 2013). Between June and October, tropical cyclones can occasionally generate large waves (Hs≈6–12 m; Tm≈6–12 s) (Mariño Tapia et al., 2008). One example of such a storm was Hurricane Wilma, which made landfall on 23 August 2005 with Hs>12 m and a Tp of 10–12 s (measured at a depth of 20 m) (Silva et al., 2012; Mariño Tapia et al., 2008).
The coastline in the study area is protected by a fringing reef which forms a relatively shallow lagoon of 3–4 m depth and a width that varies from 550 to 1500 m (Coronado et al., 2007). The reef has a well-developed back-reef and crest consisting of relatively shallow, submerged coral banks, which play an important role in dissipating wave energy through an active surf zone, thereby protecting the coast. The gently sloping fore-reef descends to an extensive sand platform at a depth of 20–25 m. The shelf edge is located at a depth of 40–60 m, followed by a subsequent drop-off at approximately 10 km from the coast to depths exceeding 600 m (Ruíz-Rentería et al., 1998).
The width of the beach is relatively stable, ranging between 85 and 90 m, with a dune of approximately 4 m in elevation, which has been degraded in many areas as a result of coastal development. The beach profile used in the present study for Puerto Morelos was measured using a differential global positioning system (DGPS) and was provided by CINVESTAV-Mérida. From the beach profile to a depth of 20 m, the bathymetry obtained from CONABIO (http://www.conabio.gob.mx/informacion/gis/, last access: 5 April 2017) was used (Fig. 1b). Wave information is available for a site located at a depth of approximately 20 m offshore of the study site from a 30-year hindcast (1979–2008) for the Gulf of Mexico and the western Caribbean Sea (Appendini et al., 2014). These data were estimated using the third-generation spectral wave model MIKE 21 SW (Sørensen et al., 2004) forced with wind data from the North American Regional Reanalysis (NARR) (Mesinger et al., 2006). The numerical model was validated/calibrated in deep waters with wave buoys and altimeter information (Appendini et al., 2013, 2014). The model performance was found to be satisfactory for the Caribbean Sea with an r2 of 0.87 (Appendini et al., 2014). The mean observed height (Hs) and peak period (Tp) were 1.22 m and 6.70 s, respectively, compared to the mean reanalysis/hindcast values of 1.31 m and 7.27 s (RMS of 0.33 m Hs and 1.59 s for Tp with correlation coefficients of 0.90 and 0.51, bias of 0.09 and 0.57, and scatter index of 0.27 and 0.24, respectively). Thus, this information is employed as a forcing boundary condition in the numerical model.
The Simulating WAves till Shore (SWASH) model, which is a phase-resolving nonlinear non-hydrostatic model (http://swash.sourceforge.net, last access: 20 January 2017) developed at Delft University of Technology (Zijlema et al., 2011), is used in depth-averaged mode in this study. This numerical model solves the nonlinear shallow water equations, including the terms for non-hydrostatic pressure, which make it suitable for simulating wave transformation as a result of nonlinear wave–wave interactions in the surf and swash regions. The model is also capable of simulating wave–current interaction, wave breaking (e.g. Smit et al., 2014; de Bakker et al., 2015), wave transformation on reefs (e.g. Torres-Freyermuth et al., 2012; Zijlema, 2012; Buckley et al., 2014), and wave runup (e.g. Brinkkemper et al., 2013; Ruju et al., 2014; Guimarães et al., 2015; Medellín et al., 2016). Therefore, this numerical model is suitable for conducting a numerical study on wave transformation and wave runup in the Puerto Morelos reef lagoon. For further model details, including model equations see Zijlema et al. (2011).
Consistent with prior studies, a wave-breaking parameter (α) of 0.6 was used for all simulations. A bottom friction coefficient (cf) of 0.014 (Manning) was used, which is equal to that reported previously for a study involving a fringing reef (Peláez et al., 2017) and is also similar to that reported by Yao et al. (2014, 2016) for a numerical study on a fringing reef (0.015). Although likely to be lower than values obtained in field studies, and being a constant value may result in under- or overestimation of roughness for the reef or beach, respectively, in the absence of measured values for the study site, this coefficient was used in the numerical simulations. Thus, this study focuses on the degradation of the reef–dune morphology. Reef roughness changes also play an important role in wave transformation (Franklin et al., 2013; Buckley et al., 2016). However, the study of these effects is beyond the scope of the present work.
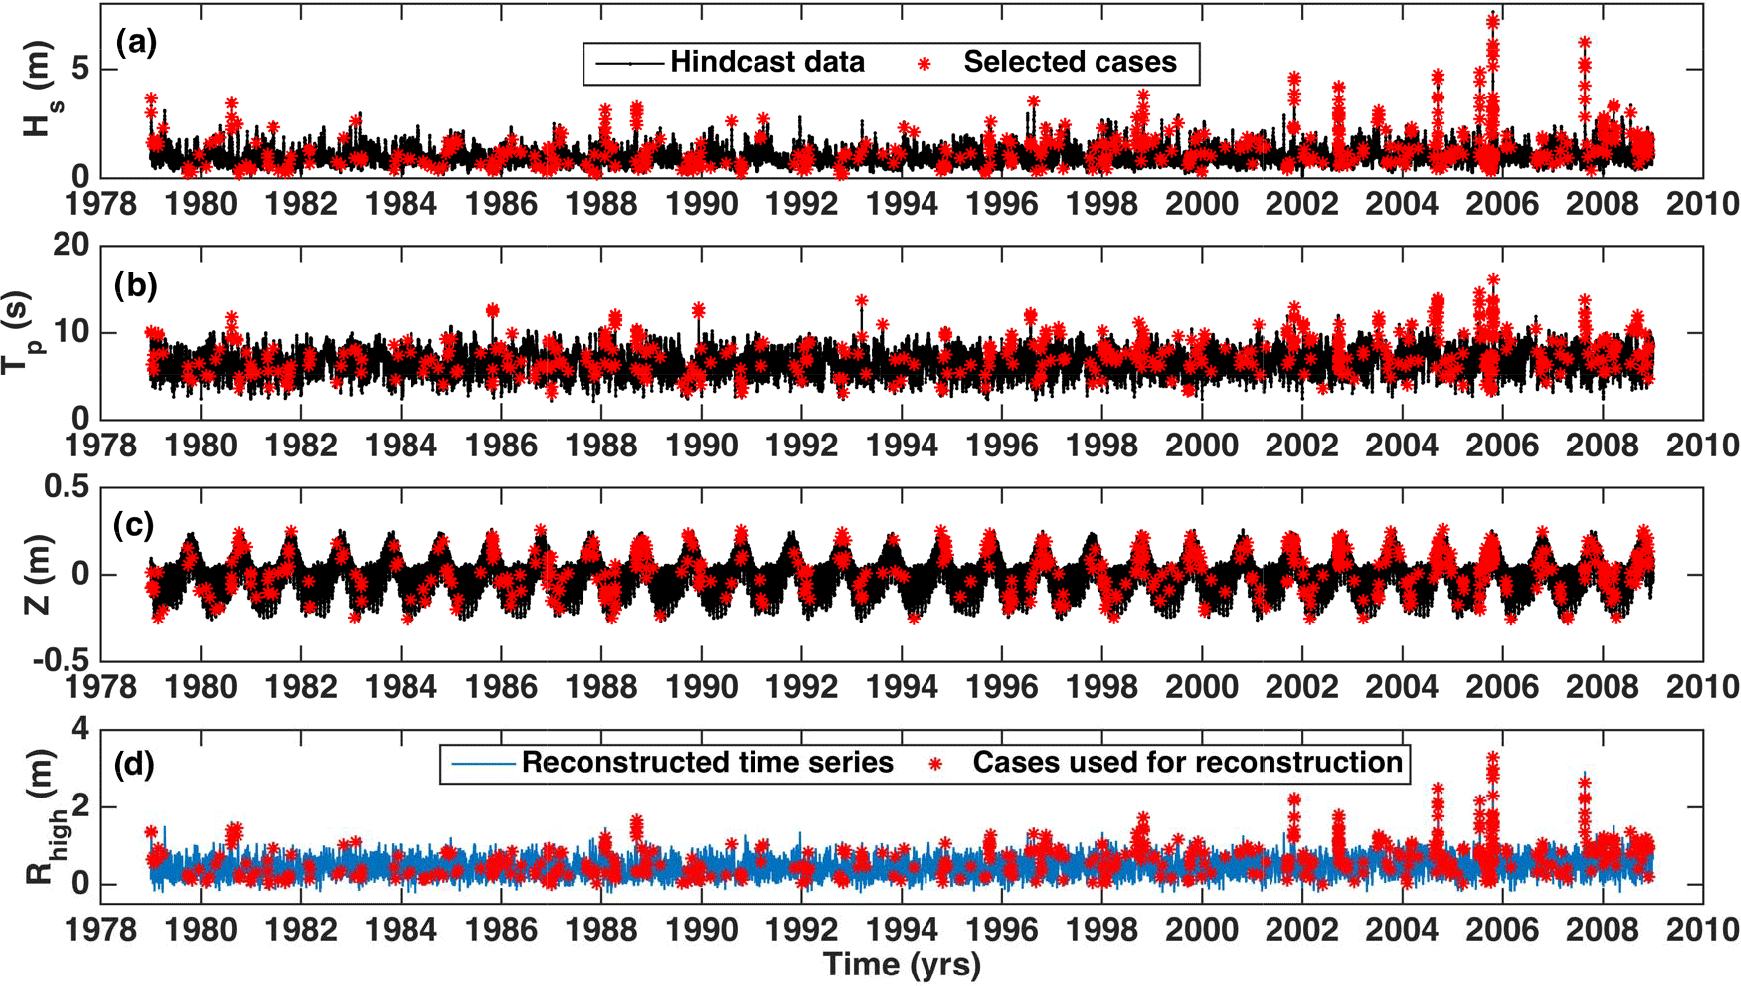
Figure 2Reconstructed time series, including the extreme water level, Rhigh, for the current reef profile using the 30-year hindcast wave conditions (wave height and period; Hs and Tp) and sea level (astronomical tide without storm surge) (Z). (a–c) Black lines indicate available hindcast data and red stars indicate the selected cases used to represent the complete time series. (d) Blue line represents time series reconstructed from the simulated results. Red stars indicate the cases used for reconstruction. .
The methodology used in this study is as follows. Firstly, a subset of wave conditions at a water depth of 20 m was selected from the 3-hourly 30-year wave hindcast. Selected wave conditions were propagated along non-degraded and degraded beach profiles, with the corresponding tidal level, from a depth of 20 m to the shore using the SWASH model. Subsequently, the extreme runup R2 % and setup <η> were calculated from the water elevation time series, corresponding to each simulated case, and were further employed to re-construct the 30-year extreme water level hindcast using an interpolation technique. Finally, the storm impact was obtained for different return periods and different scenarios of reef and dune degradation by coupling the extreme water level and dune morphology.
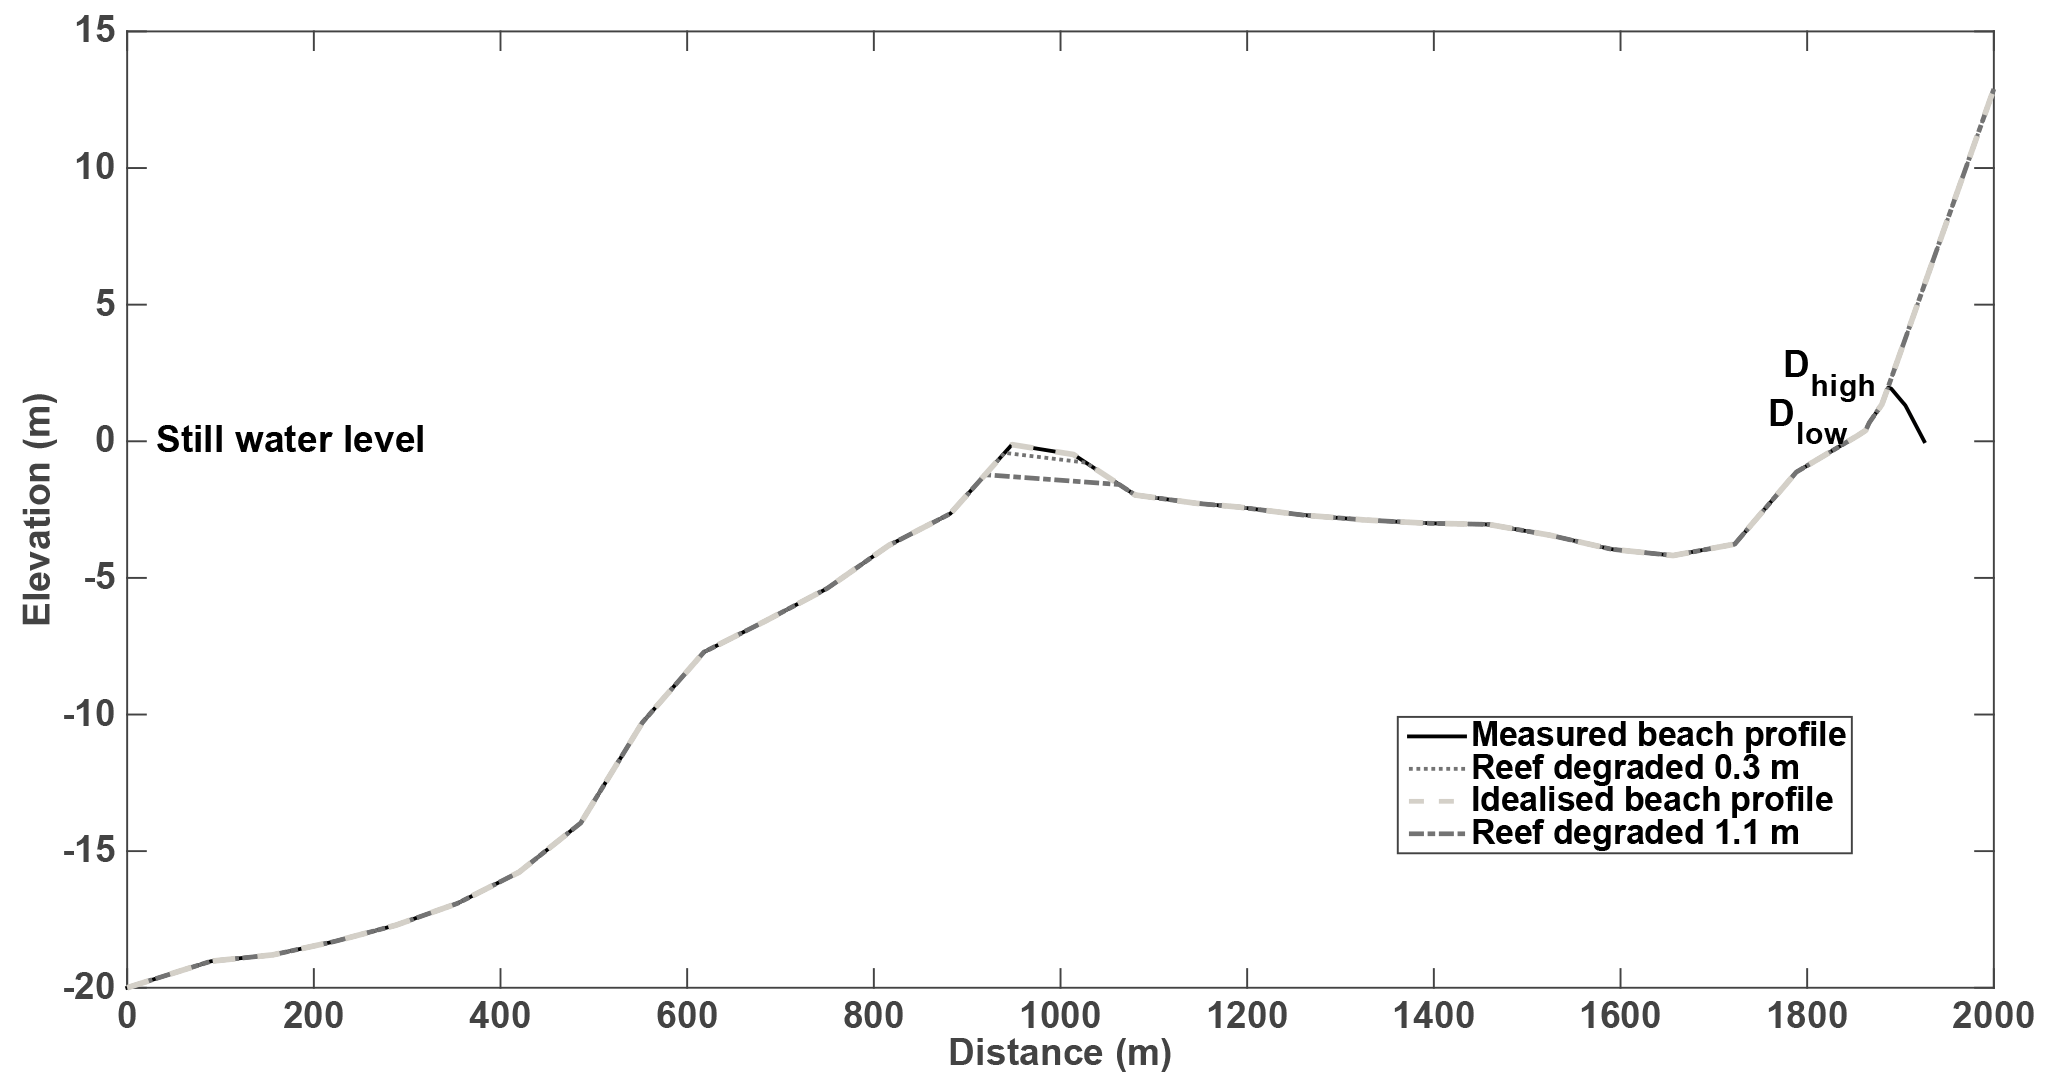
Figure 3Measured beach profile (solid black line) and idealised profile with beach extended beyond the dune (dashed grey line). Dhigh represents the dune crest and Dlow the foot of the dune. The degraded profiles (0.3 and 1.1 m) are indicated by the dotted dark grey and dashed black lines, respectively.
4.1 Simulated cases
A total of 87 664 sea states (Hs, Tp and θ), one every 3 h, comprise the available 30-year wave hindcast (Appendini et al., 2014). Due to the computational effort involved in simulating the entire data set, a subset of 600 cases was selected, following the method presented by Camus et al. (2011b) and applied in Medellín et al. (2016). This method employs the maximum dissimilarity algorithm (MDA) to obtain a subset of wave conditions representative of a variety of sea states (see references for further details). In the present study, the multivariate data included peak period (Tp), significant wave height (Hs), and mean sea level (tide + storm surge) (Z). The wave parameters were obtained from the wave hindcast and when storm surge is neglected the Z time series corresponds to the astronomical tide prediction for the same period and location (http://predmar.cicese.mx/, last access: 8 August 2016). In accordance with Camus et al. (2011a), the deep-water multivariate data are defined as
where N refers to the total sea states obtained from the wave hindcast. The vector components were normalised in order to assign them even weightings for the similarity criterion defined by the Euclidean distance, and hence the dimensionless vectors are defined as (e.g. Camus et al., 2011a)
The MDA is used to select a subset of M vectors (D1…DM) from the sample data. First, one vector is transferred to the subset from the data sample. Subsequently the dissimilarity between each of the remaining elements in the data sample and those in the subset is calculated and the most dissimilar element is transferred to the subset. This is repeated iteratively until M elements have been selected. The dissimilarity between vector i of the data sample and vectors j of the subset R is determined by
Subsequently, the dissimilarity between vector i and the subset R, is obtained using
Once the N−R dissimilarities have been calculated, the next data to be selected have the maximum di,subset. The Euclidean distance was calculated (Fasshauer, 2007; Medellín et al., 2016) as
Finally, the subset was denormalised using
The 600 selected sea states were found to adequately represent the whole sample, and were well distributed throughout the time series of sea level and wave parameters (Fig. 2a–c), consistent with prior studies (e.g. Guanche et al., 2013; Medellín et al., 2016). In the model runs the dune profile was extended beyond the crest, assuming a continuation of the slope measured in the profile, to complete the model domain and to enable the effect of reducing the dune crest values to be inferred (Fig. 3). The model was run with the original profile, which included the back of the dune, and with the extended dune to test whether this affected the wave statistics, and no significant differences were found.
4.2 Extreme water level calculation
Waves were propagated from a depth of 20 m using SWASH (Zijlema et al., 2011). The SWASH domain extends from a water depth of 20 m to the shoreline (a distance of 2 km) with a uniform mesh size of 0.1 m. The numerical model was forced using a JONSWAP spectrum at the offshore boundary derived from the Hs and Tp corresponding to the 600 selected cases from the 30-year wave hindcast and the corresponding sea level according to the astronomical tide. The initial time step was 0.025 s and simulations were sampled for 2700 s, after 500 s of spin-up time.
For each sea state propagated in SWASH, the height of the bottom profile at the wet–dry interface was used to extract the water elevation, η(t), relative to mean sea level (Medellín et al., 2016). To obtain a continuous time series, this location was tracked as the first grid point where water depth was less than 0.01 m. Extreme runup (R2 %), corresponding to the 2 % exceedance value in accordance with Stockdon et al. (2006), was calculated for each run (see Fig. 4). Furthermore, the maximum wave setup at the shoreline, which is the super-elevation of the mean water level due to waves (Longuet-Higgins and Stewart, 1964), was computed as the mean of the wave runup time series (<η>). Subsequently, the extreme water levels and were calculated for each case in accordance with Sallenger (2000) and Stockdon et al. (2007). Rlow represents the low extreme sea level resulting from the setup, tidal level and storm surge contributions (where applicable), consistent with Sallenger (2000).
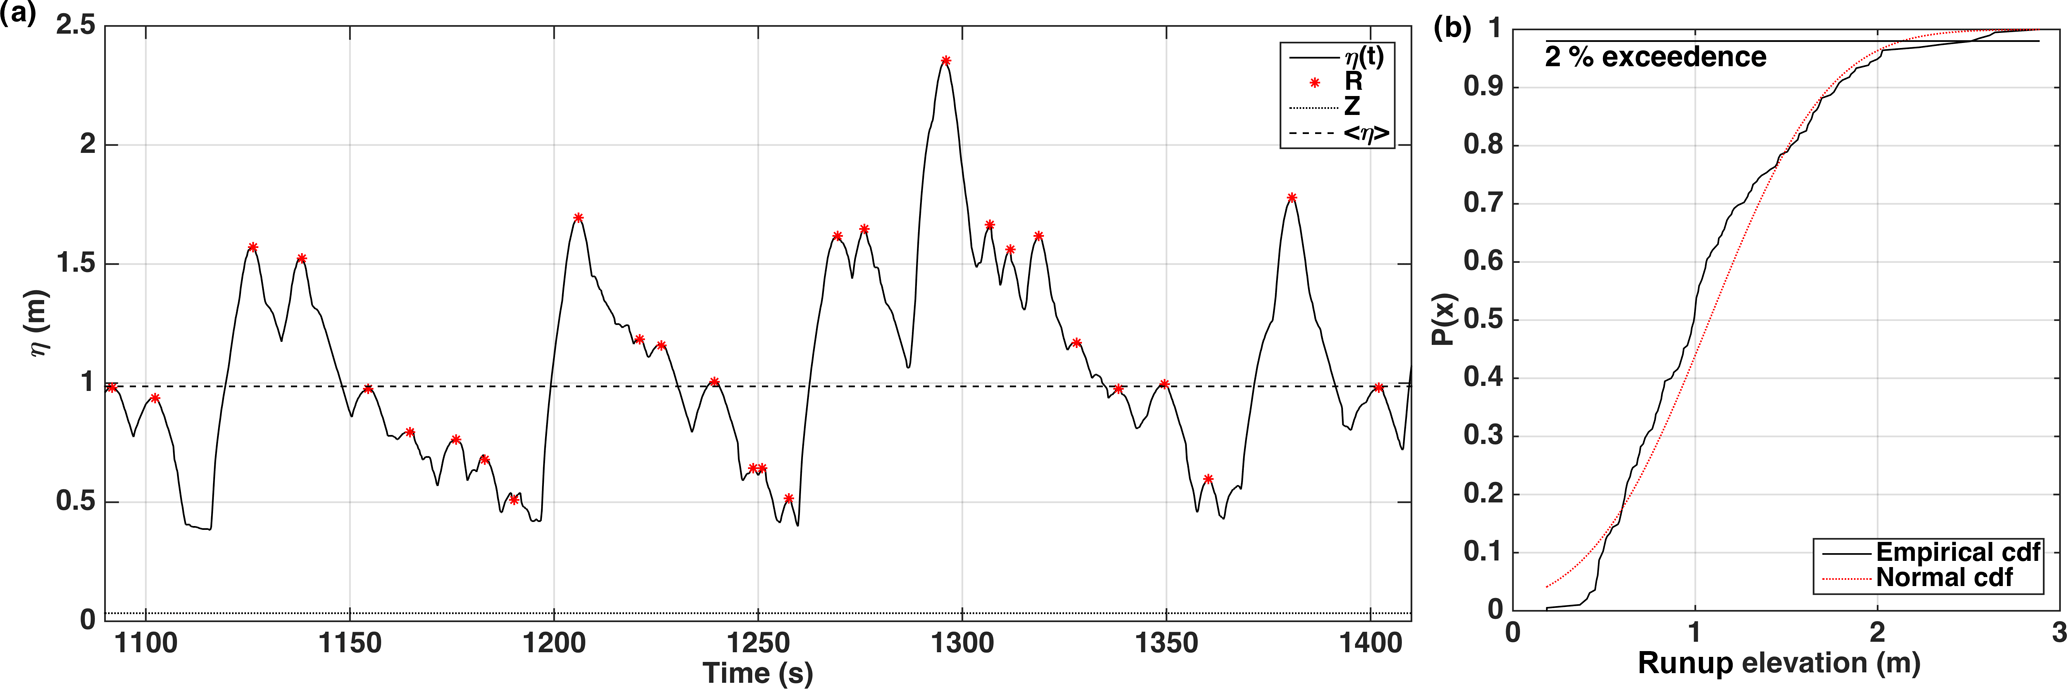
Figure 4(a) Example of a section of the water level elevation time series η(t) extracted from the wet–dry boundary of the SWASH simulations, showing sea level (astronomical tide without storm surge), Z, runup maxima, R, and setup at the shoreline <η>. (b) The 2 % exceedance value was extracted from the cumulative distribution function (cdf) of the R values and subtracting Z.
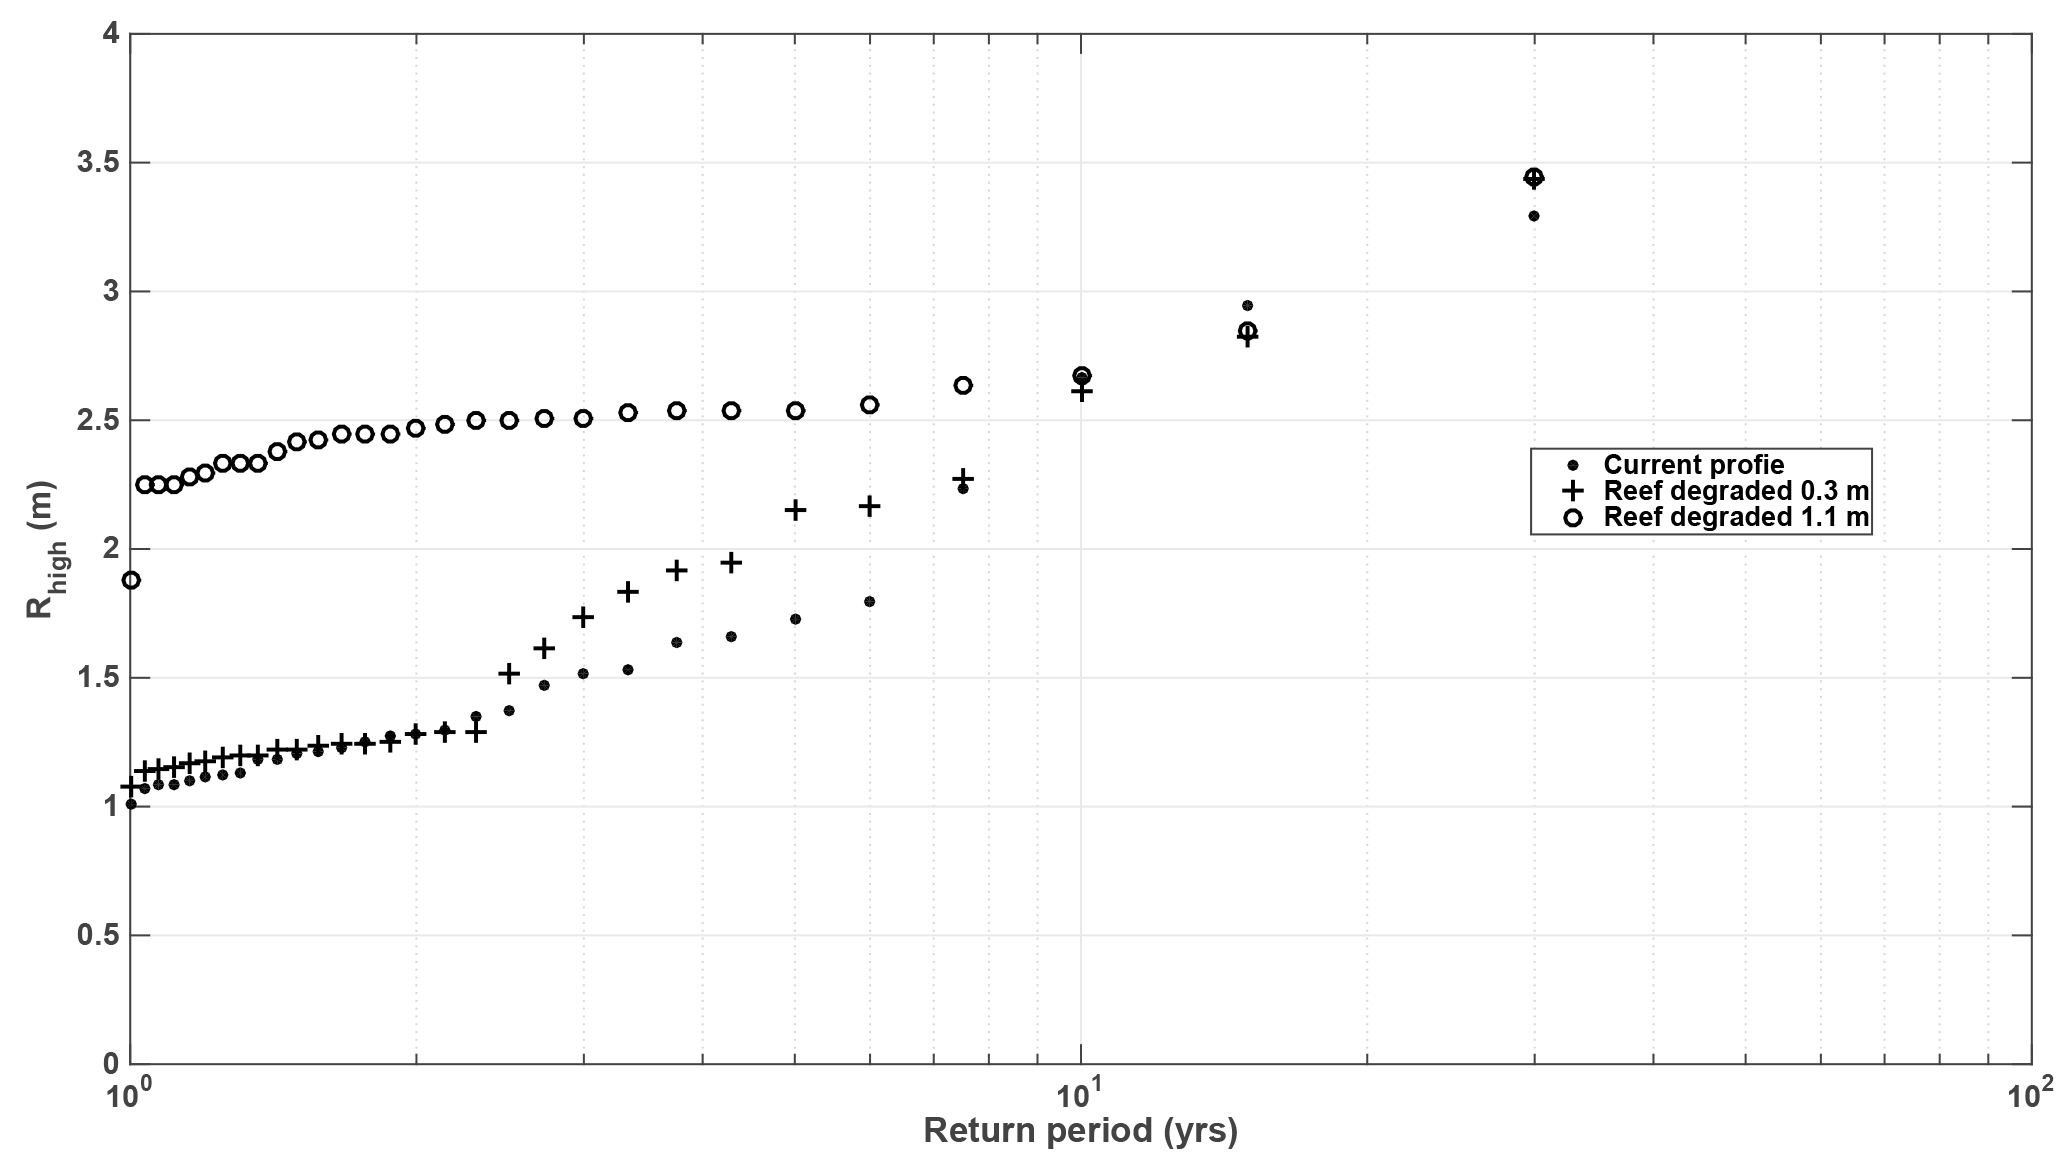
Figure 5Return value of Rhigh for the current reef profile (triangles), the reef degraded by 0.3 m (crosses), and for the profile with the reef degraded by 1.1 m (open circles).
The 30-year-long time series was reconstructed based on the extreme water levels from the 600 selected sea states. The time series of extreme water levels were reconstructed using an interpolation method based on a radial basis function (RBF). Previous studies have identified this method as one of the most suitable for interpolating multivariate scattered data (Franke, 1982) and it has been used to reconstruct time series of wave parameters in coastal waters (e.g. Camus et al., 2011a; Guanche et al., 2013; Medellín et al., 2016). The difference in the present study is that wave direction is not included. The interpolation function is
where ; represents each of the sea states in the 30-year time series; ; represents each of the M=600 cases selected; ; indicates the Euclidean norm; and Φ is the radial basis function (see Camus et al., 2011b). The RBF interpolation was carried out as described in Medellín et al. (2016) using an algorithm developed by Fasshauer (2007). Therefore, the RBF was used to reconstruct the Rhigh and Rlow 30-year time series for all bathymetric profiles studied.
The 30-year reconstructed time series of Rhigh (see blue line in Fig. 2d) and Rlow (not shown) were used to assess beach vulnerability under current beach profile conditions (Fig. 3). The return period for both the 30-year Rhigh and Rlow time series was calculated as the inverse of the probability of a given Rhigh or Rlow value using the annual maxima data from the re-constructed 30-year time series. Figure 5 shows the return value for Rhigh for the simulations conducted with the current scenario and considering reef degradation scenarios based on 50-year projections of reef erosion values (see Sect. 4.3) reported in the literature (Fig. 3).
4.3 Storm impact scale for different scenarios
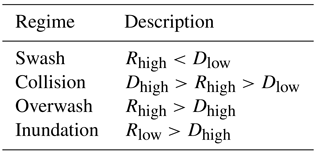
The storm impact scale proposed by Sallenger (2000) for barrier islands was used to illustrate the implication of changes in either reef or beach morphology (reef crest height and dune elevation) with respect to storm-induced water levels. The scale includes four storm impact regimes (Table 1), which depend on the storm-induced water levels and dune elevation, defined as Rlow (the astronomical tide, wave setup, and storm surge, where included), Rhigh (the sum of the astronomical tide, R2 %, and storm surge, where included), Dhigh (dune crest height), and Dlow (dune toe height). These regimes were calculated for three different reef crest conditions: (i) present condition, (ii) degraded by 0.3 m, and (iii) degraded by 1.1 m (see Fig. 3). These scenarios were selected based on 50-year projections of reported reef erosion values. For instance, the vertical loss of 6 mm yr−1 reported by Sheppard et al. (2005) was used for scenario (ii), whereas the value of 22 mm yr−1 reported by Eakin (1996) was used for scenario (iii).
The erosion values reported in prior studies are a result of el Niño and bleaching events, which resulted in massive coral mortality and the subsequent erosion of the remaining limestone structure (Sheppard et al., 2005). In recent decades, mass coral bleaching has increased in intensity and frequency (Hoegh-Guldberg, 1999), preventing shallow corals from recovering and leading to their gradual disintegration (Sheppard et al., 2005). This is primarily associated with increased temperature, ocean acidification and sea level rise (Hoegh-Guldberg, 1999, 2005; Hoegh-Guldberg et al., 2007; Pickering et al., 2017). Hence, a projection of the above values was used assuming that reefs will continue to erode at similar rates.
5.1 Present conditions
The Rhigh and Rlow values associated with different (1-, 3-, 5-, 7.5-, 10-, 15-, and 30-year) return periods were used together with the beach morphology (Dhigh and Dlow) to estimate the storm impact regimes proposed by Sallenger (2000) for the present conditions (Table 2). Based on the return values of Rhigh and Rlow, the storm impact regime associated with a yearly return period was “swash”, where the maximum runup is less than the height of the foot of the dune (Rhigh<Dlow). For return periods of 3–5 years, the storm impact regime was “collision”, where the maximum runup collides with the foot of the dune but falls below the dune crest (). For a return period of 7.5 years, the storm impact increases to “overwash”, where runup overtops the dune crest and the sand transported landward is lost from the system and does not return to the beach after the storm (Rhigh>Dhigh). For return periods of 10 years or greater, the storm impact is “inundation” where the sea level is sufficient that it completely submerges the dune.
Table 2Storm impact regime for the 1-, 3-, 5-, 7.5-, 10-, 15-, and 30-year return periods, considering a Dhigh and Dlow of 1.9 and 1.3 m, respectively, for different degrees of reef degradation (0.3 and 1.1 m).
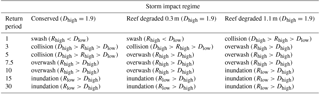
Table 3Storm impact regime for the 1-, 3-, 5-, 7.5-, 10-, 15-, and 30-year return periods, considering a Dhigh and Dlow of 1.3 m, for different degrees of dune and reef degradation.
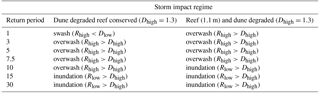
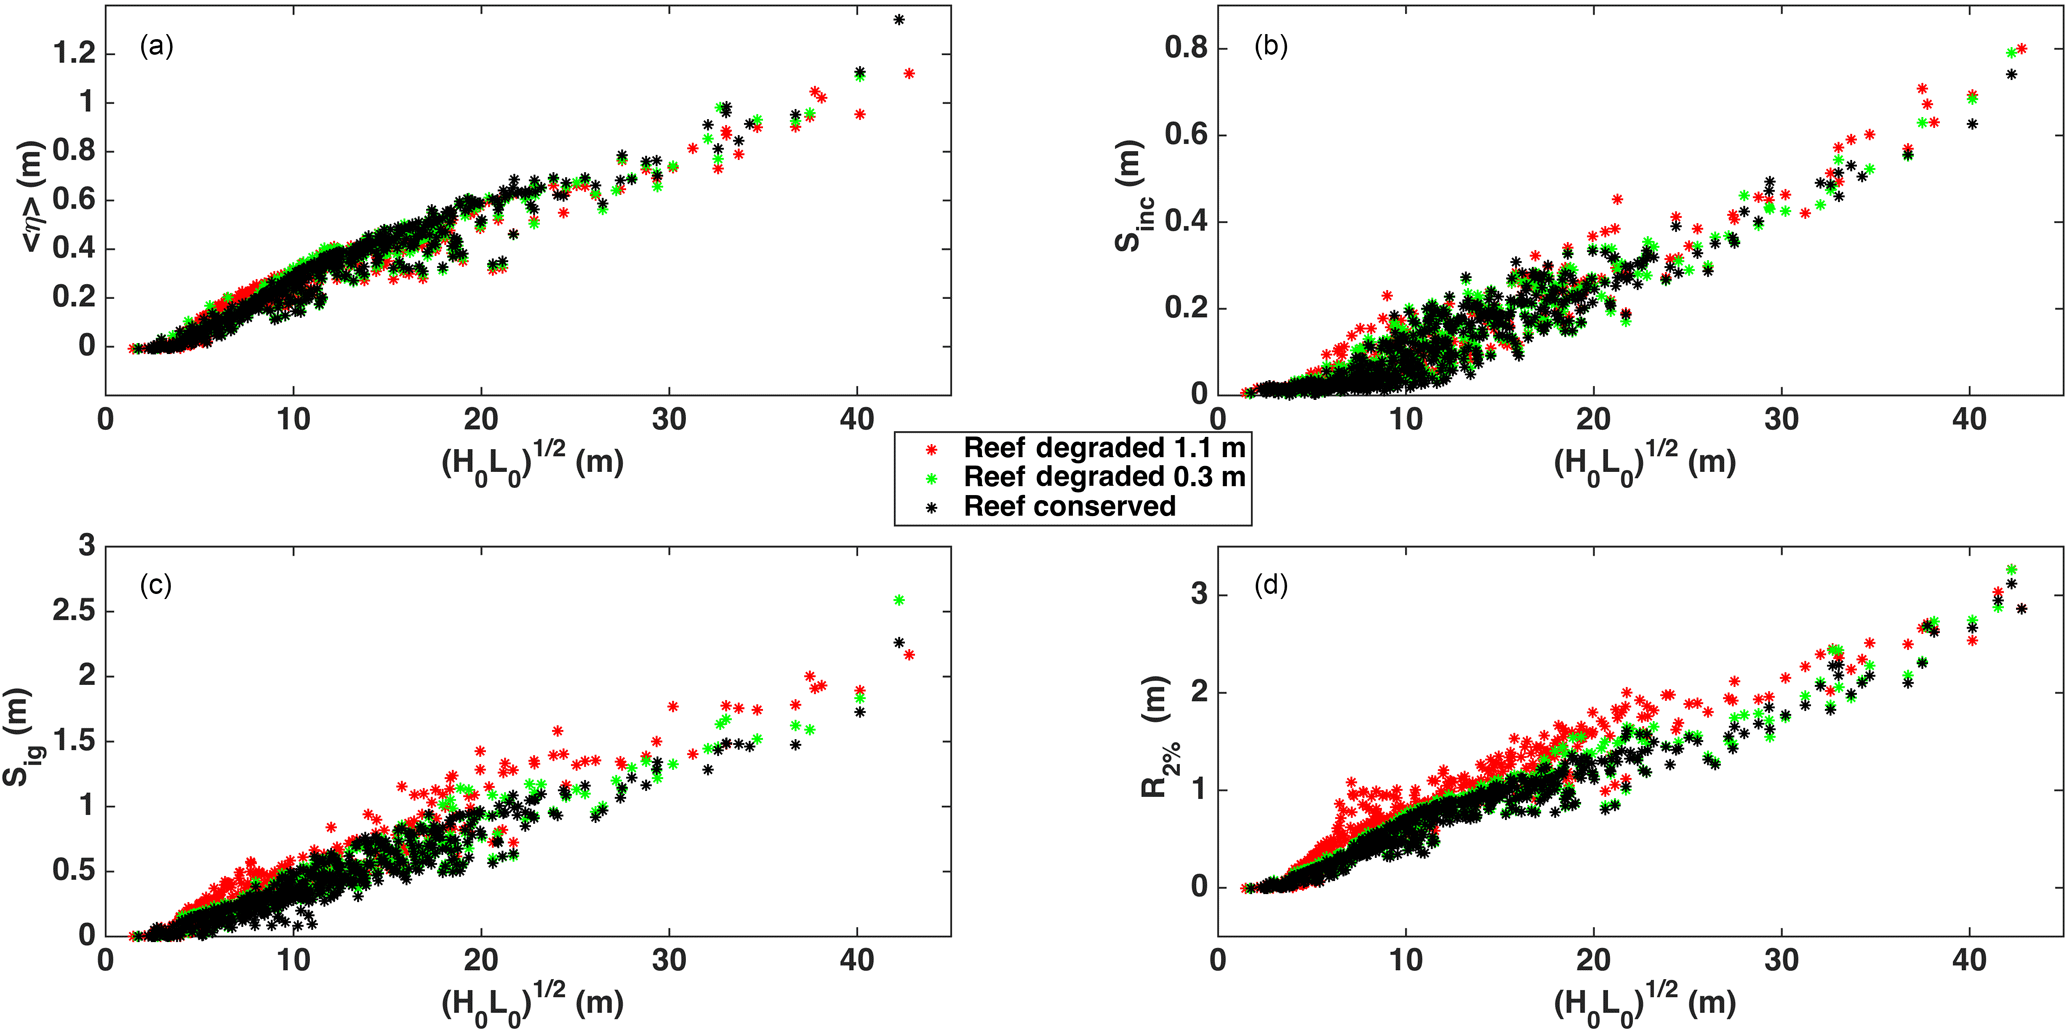
Figure 6(a) Wave setup, <η>, (b) incident swash (Sinc), (c) infragravity swash (Sig), and (d) extreme runup (R2 %) against incident wave conditions. Black dots represent the data for the conserved reef profile, green the values for the reef degraded by 0.3 m, and red those associated with the reef degraded by 1.1 m.
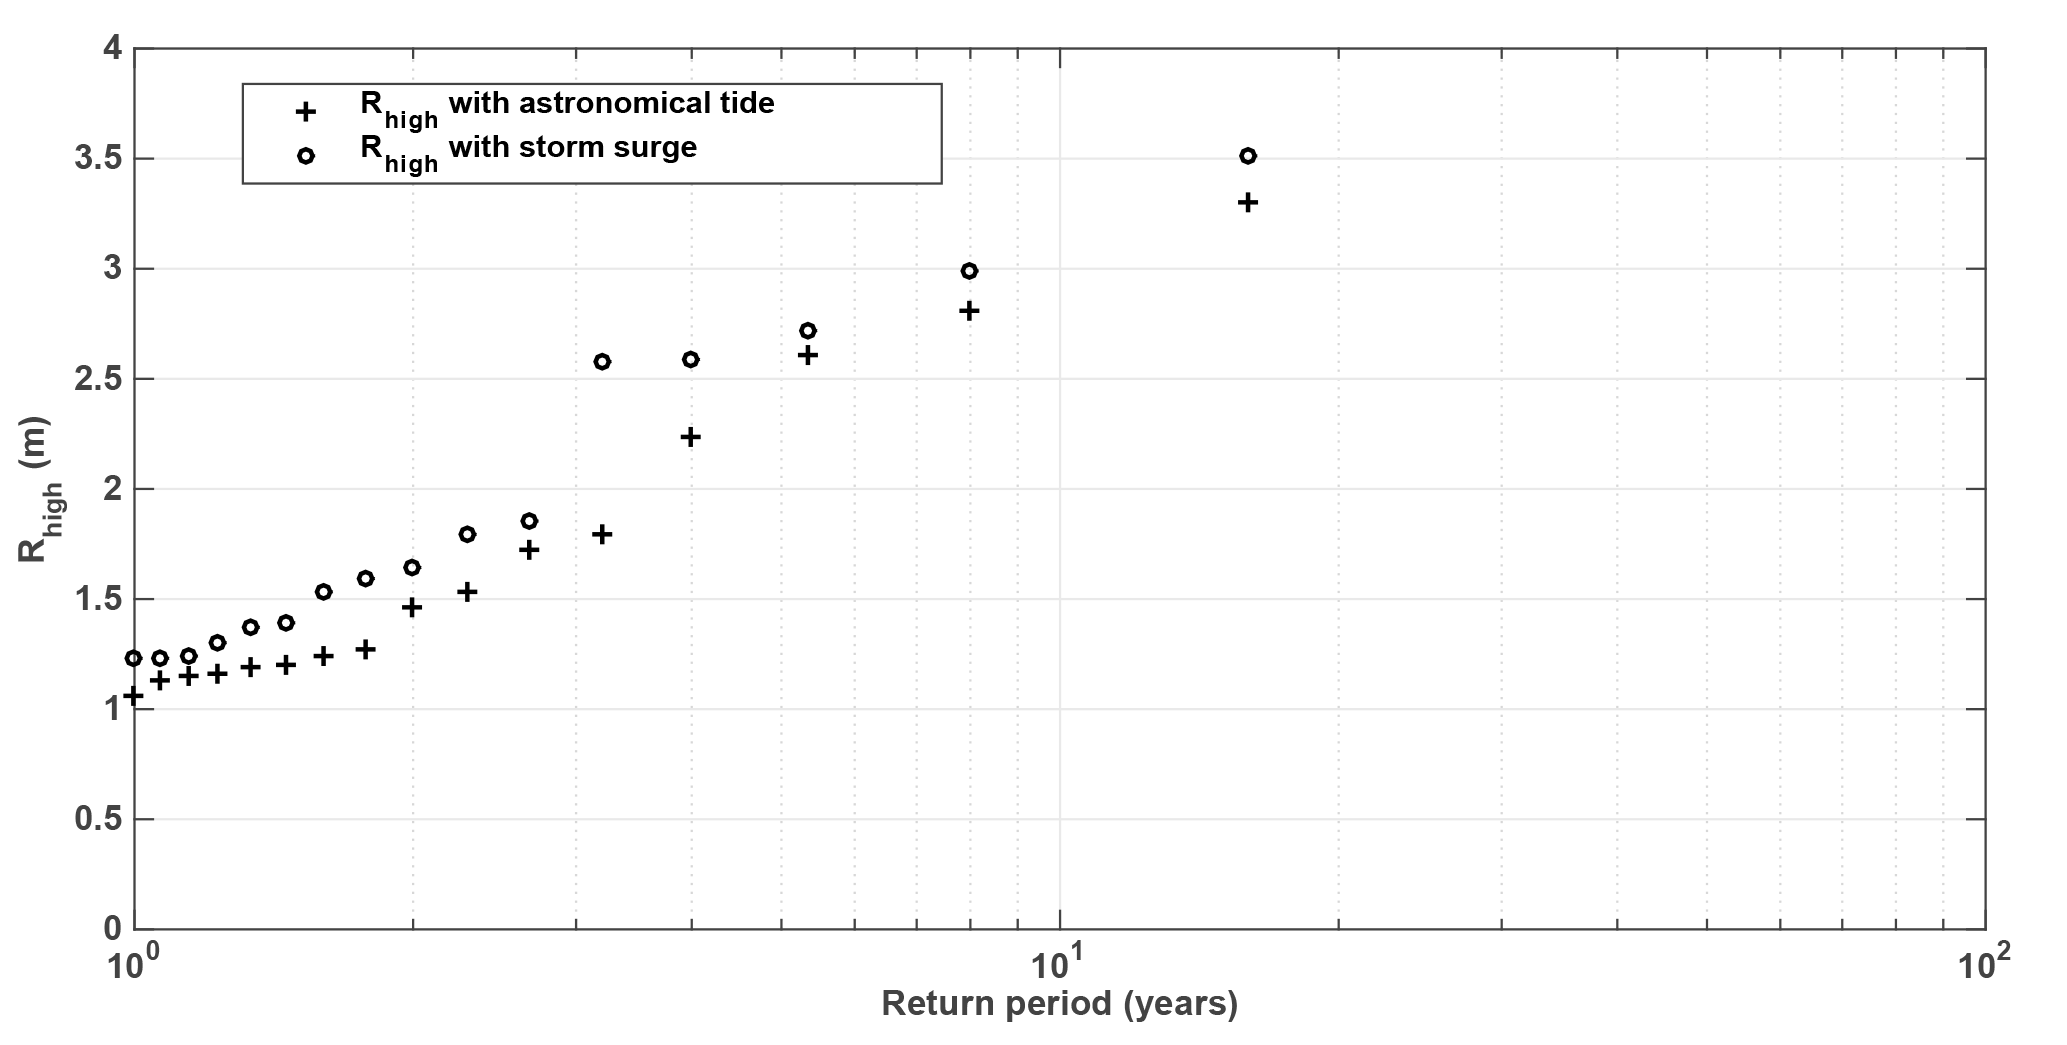
Figure 7Return value of Rhigh for the model run with the storm surge (open circles) and without (crosses) for the time period of 1993–2008.
5.2 Role of reef degradation
To investigate the role of reef degradation in the reduction of coastal protection the current situation was compared with the scenarios of 0.3 and 1.1 m degradation of the reef crest (see Sect. 4.3). It is important to note that in the present study, reef roughness is constant in all three scenarios to focus only on the effect of the vertical degradation of the reef, although in reality this would likely be accompanied by a loss of roughness. Numerical results show a slight increase in R2 % when the reef is degraded by 0.3 m, whereas there is a significant increase in R2 % when the reef is degraded by 1.1 m. The Rhigh results and the storm impact regimes for the different scenarios support these findings (see Fig. 5 and Table 3).
The effect of reef degradation varies depending on the intensity of the storm. For instance, for storms with return periods of approximately 1–2 years, the increase in Rhigh when the reef is degraded by 1.1 m is almost 2-fold, whereas the reef degradation of 0.3 m has no visible effect on Rhigh for such return periods (Fig. 5). However, for return periods of 2.5–7.5 years, there is a notable increase in Rhigh for the 0.3 m degraded reef (up to 30 %) compared to the conserved scenario (current reef). This is particularly important since most people living on the coast are more likely to experience these storms several times in their lifetimes and relying on the protection provided by the reef will not suffice under a degraded scenario. For storms with a return period of >10 years the Rhigh values are similar for degraded and non-degraded scenarios. The behaviour of Rhigh for larger wave heights is related to the role played by the reef in wave breaking. Under small wave heights, the reef plays an important role in this process; however, as waves become larger they break further offshore than the location of the reef crest, and hence the reef no longer plays such an important role. This seems to occur for return periods of approximately 10 years or greater. Furthermore, the larger the waves, the more the water depth will increase due to wave setup, making the differences in Rhigh due to reef degradation less noticeable
In order to explain the observed differences in Rhigh at larger wave heights, the runup was separated into the incident () and infragravity () swash frequencies (Fig. 6b and c) and setup (Fig. 6a). Furthermore, setup, swash and runup data were analysed in further detail. The change in the importance of the reef crest in the wave-breaking process seems to take place for m (Fig. 6). Prior to this point there is a clear dominance in Sig and R2 % for the 1.1 m degraded scenario. This is particularly notable in Fig. 6d, as demonstrated by the consistently larger values of R2 % for 1.1 m degraded scenario and m, after which there is greater overlap in the values for all three scenarios. For intermediate and large wave conditions, wave setup (Fig. 6a) seems to be slightly greater for the non-degraded scenario as a result of the more intense wave breaking occurring over the reef crest compared to the degraded scenario. However, for the degraded scenario the infragravity contribution is generally greater (Fig. 6c). The clear increase in R2 % for the degraded scenario demonstrated by Fig. 6d reiterates the importance of the reef in protecting the coast from flooding.
Regarding the storm impact regime (Table 2), for a return period of 5 years, there is an increase from a collision regime to an overwash regime when the reef is degraded by 0.3 m. The importance of the reef in protecting the coast becomes more obvious in the scenario where the reef is degraded by 1.1 m, showing an increase in the storm impact. Based on the results, the degraded 1.1 m scenario will result in the net erosion of the dune (i.e. collision regime) even for a storm with a yearly return period, whereas inundation will occur for a return period of 7.5 years.
5.3 Role of dune degradation
The dune crest elevation is a relevant parameter in coastal protection against extreme water levels. Therefore, the implications of dune degradation can be theoretically investigated by considering a smaller crest elevation (Dhigh < 1.9 m) while estimating the storm impact scale. Model results show that for return periods of 3–10 years the dune degradation by 0.6 m (Table 3) plays a more important role in coastal protection than the reef crest when degraded 0.3 m (Table 2). Moreover, moderate reef degradation and dune degradation together can be more important than the extreme reef degradation of 1.1 m (see Table 3). Therefore, results show the combined importance of conserving the reef–dune system in order to naturally protect the coast from storm conditions. This is consistent with the results of Guannel et al. (2016), who found that the greatest nature-based coastal protection is offered when several habitats are considered.
5.4 Role of storm surge
To investigate the storm surge contribution, sea level data were obtained from the HYbrid Coordinate Ocean Model (HYCOM; Halliwell Jr., 1998; Bleck, 2002) for the Gulf of Mexico (GoM) (https://hycom.org/data/goml0pt04, last access: 12 October 2017) for the dates that coincide with the available wave hindcast information (1993–2008). For the GoM, HYCOM has a 1/25∘ or 0.04∘ equatorial and latitudinal resolution (∼3.5 km) for each variable at mid-latitudes. The version of HYCOM used is 2.2.77. Both Hs and Tp from the Hindcast data were interpolated to the same time vector as that of the GoM sea level data. A total of 300 representative cases were simulated for the 16-year period (using the same methodology as for the 30-year hindcast), using (i) the sea surface height obtained from HYCOM (mean sea level including storm surge and astronomical tide) or (ii) the astronomical tide. Figure 7 shows Rhigh as a function of the return period while considering the two different scenarios. An increase in Rhigh is observed when storm surge is included. This increase is important since it acts as a proxy for reef degradation. Neglecting the storm surge contribution results in an underestimate of the effects of reef degradation on runup and hence coastal flooding. However, the effect of the storm surge (for the time period available) was smaller than the effect of the reef degrading by 1.1 m but slightly greater than the reef degrading by 0.3 m, particularly for return periods of less than 3 years (Fig. 7).
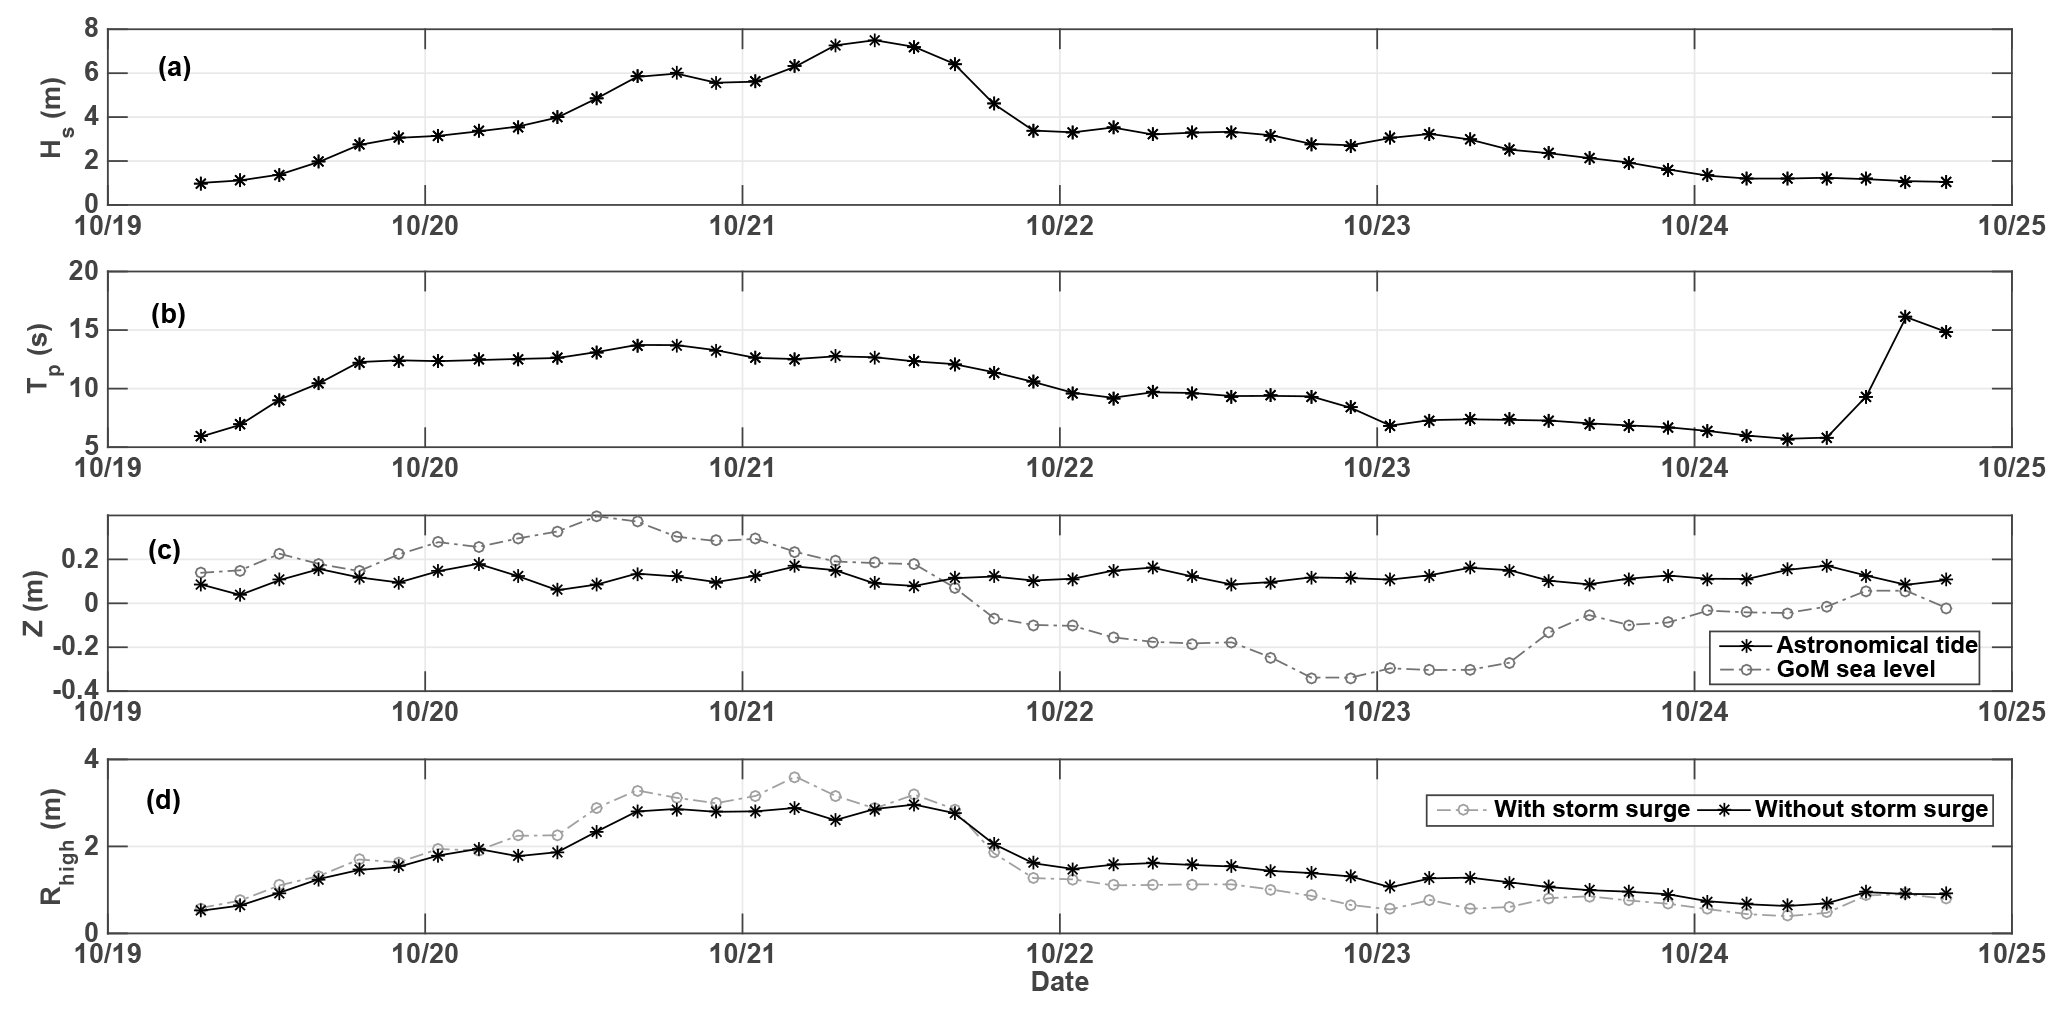
Figure 8(a) Significant wave height (Hs), (b) peak period (Tp), (c) sea level (Z) (black: astronomical tide; grey: GoM sea level) and (d) Rhigh (black: without the storm surge; grey: with storm surge) during the pass of Hurricane Wilma (2005).
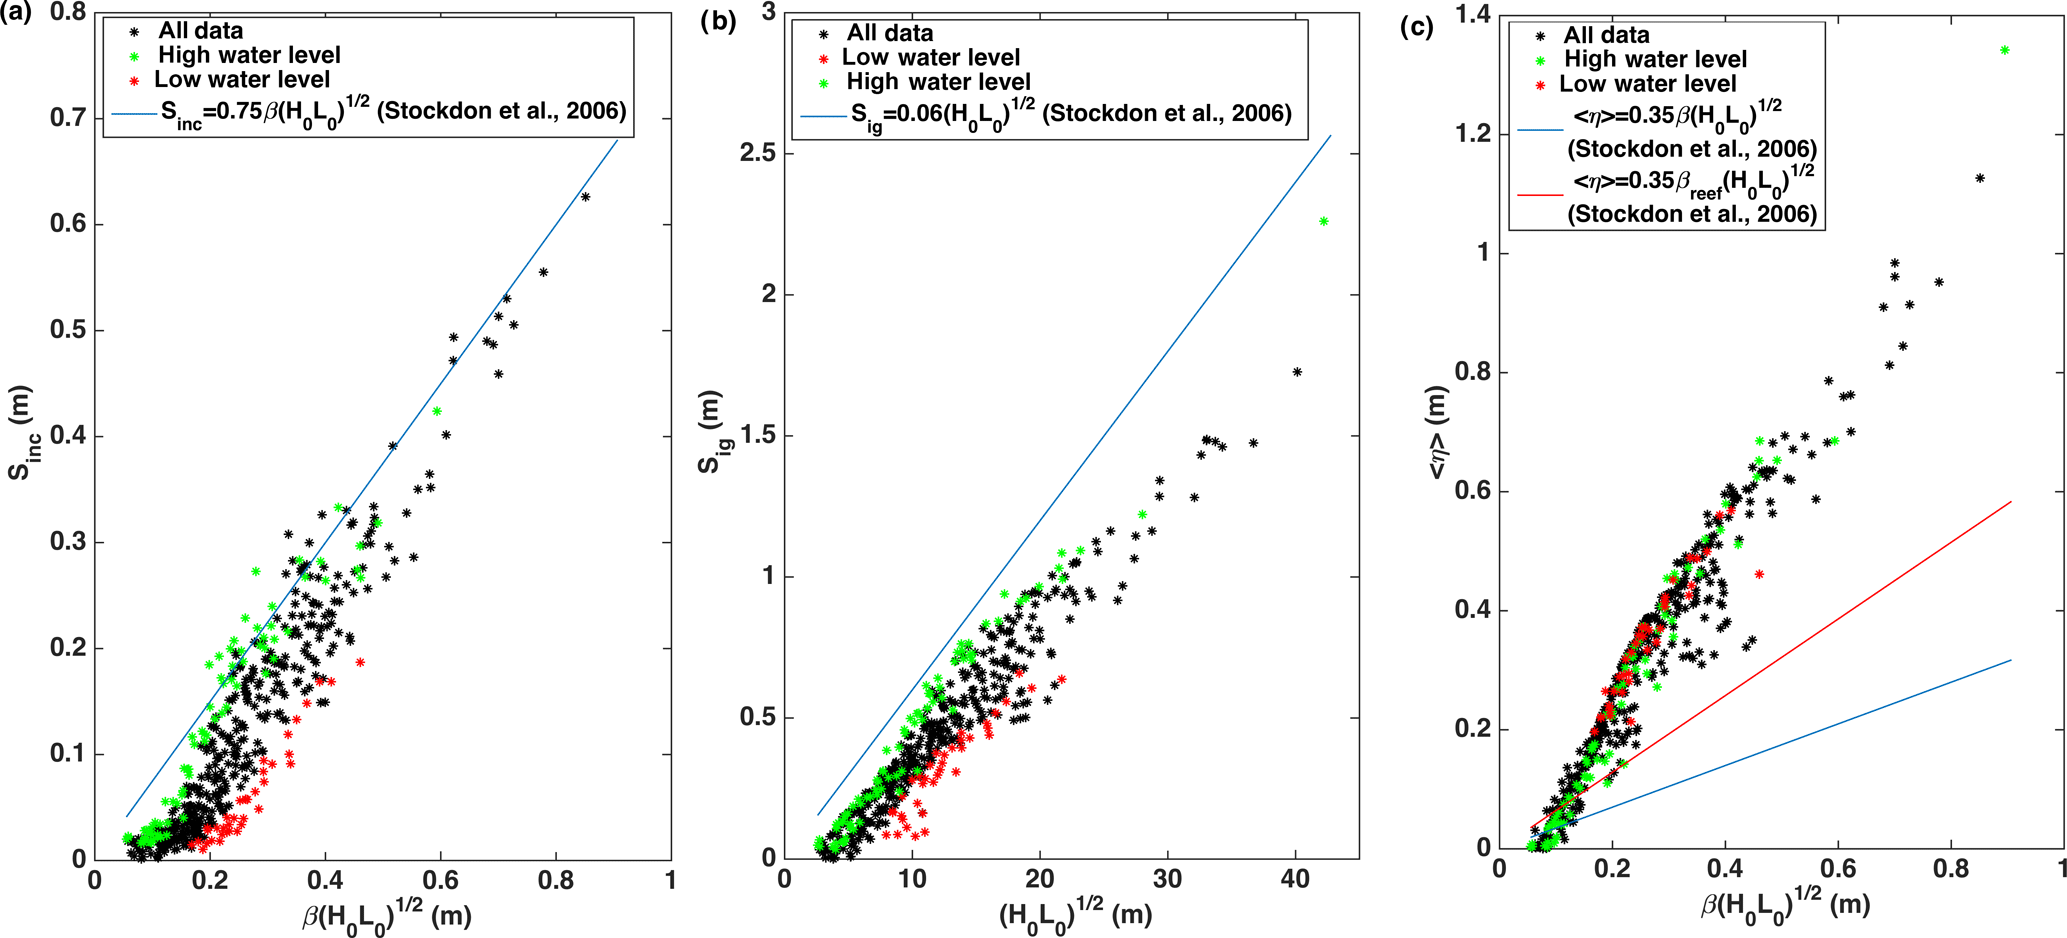
Figure 9(a) Incident swash, (b) infragravity swash and (c) wave setup parameterised in a dimensional form of the Iribarren equation and in comparison to Stockdon et al. (2006) (blue lines) and a modified form for wave setup, which includes the reef face slope (red line). Black dots represent the selected hindcast cases, green the values associated with high water levels ( m), and red those associated with low water levels ( m).
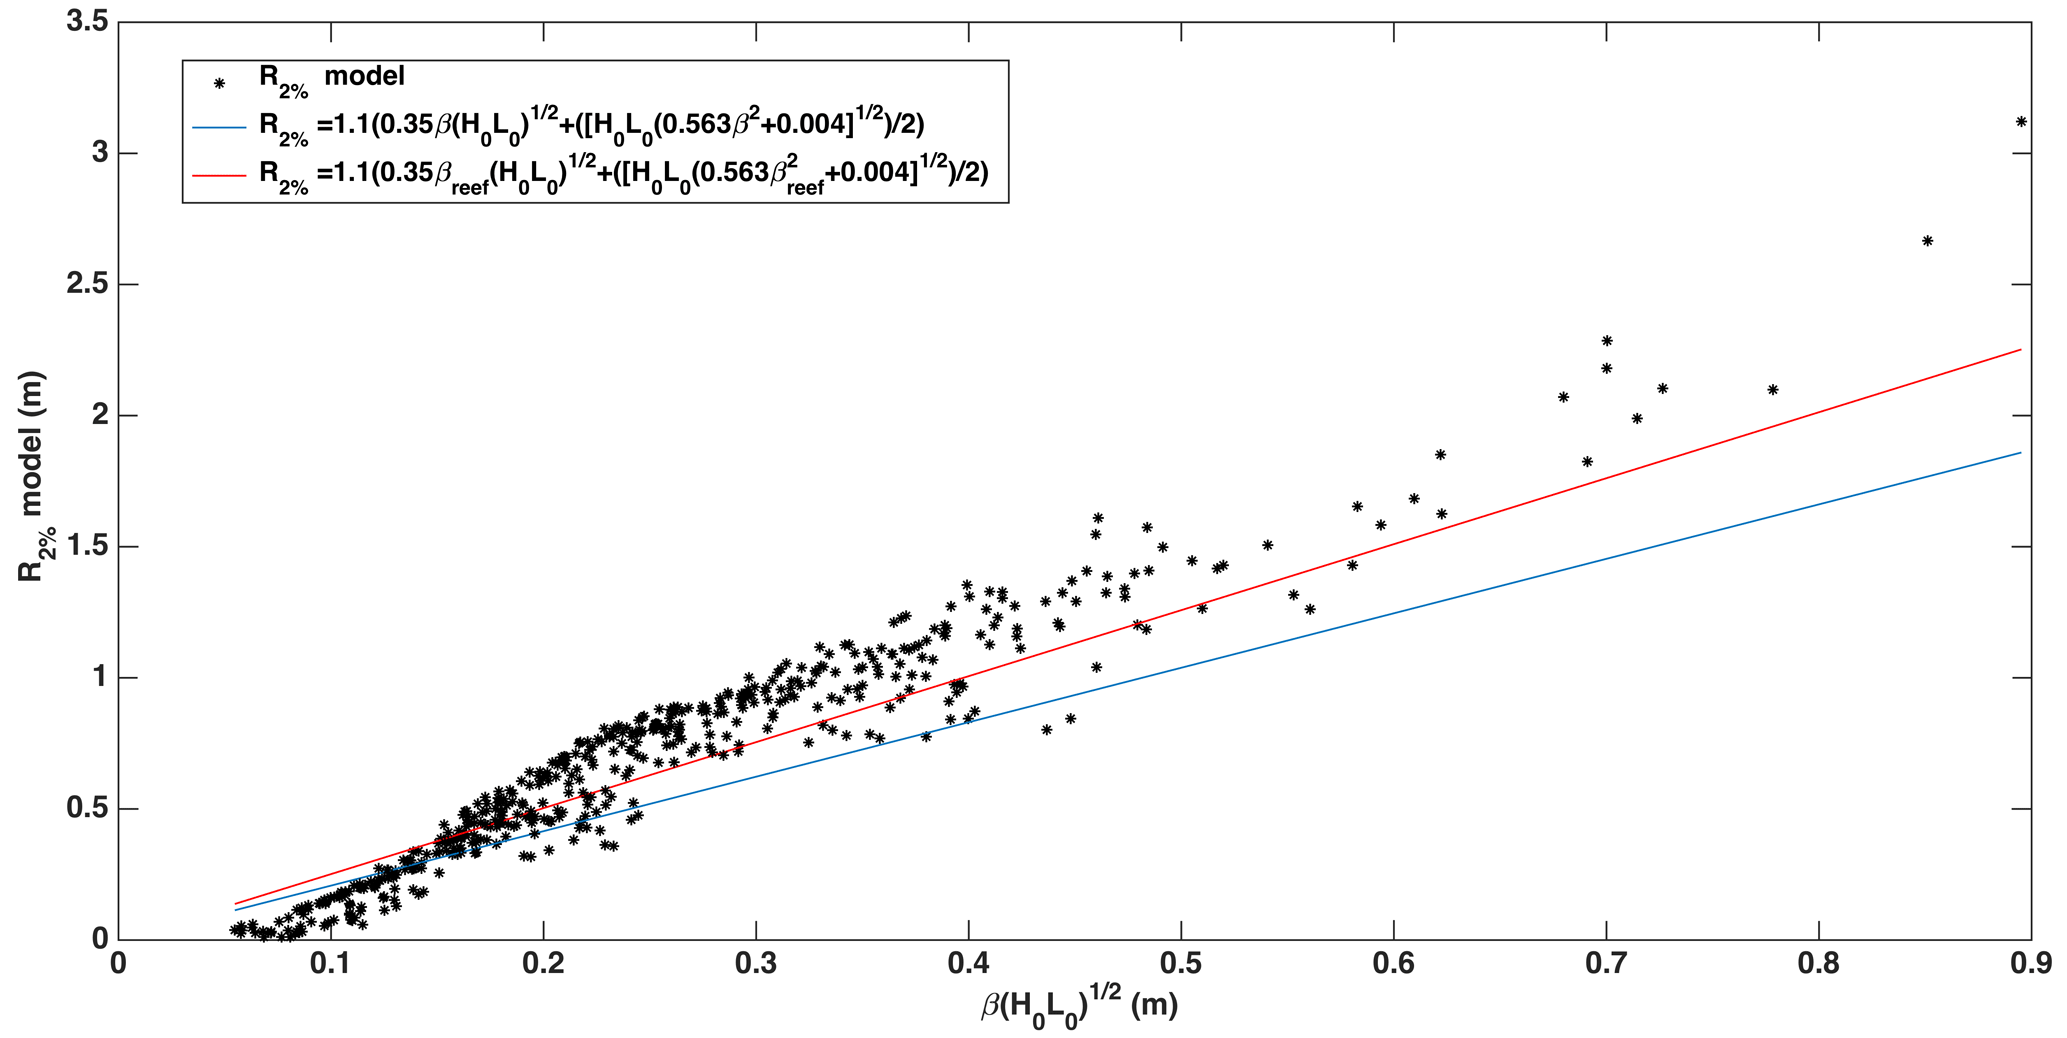
Figure 10Extreme runup values (R2 %) for the selected 30-year hindcast data (black dots) and the complete parameterisation suggested by Stockdon et al. (2006) with the beach face slope (blue line) and reef face slope (red line).
In order to study the effects of the storm surge on extreme water levels for the specific case of a hurricane event, wave parameters were selected from the hindcast data between 19 and 25 October (Fig. 8a and b), corresponding to Hurricane Wilma, a category 5 hurricane, which reached the Yucatán Peninsula on 20–21 October 2005. The maximum Rhigh values are higher and the minimum values are lower owing to the storm surge contribution during the hurricane passage. In terms of reef degradation and the effects of the storm surge during the hurricane, the Rhigh values are generally greater for the degraded profiles throughout the 5 days presented, except around the peak of the hurricane (results not shown). This might be ascribed to waves breaking further offshore of the reef crest. Therefore, the storm impact during more extreme conditions appears to be less sensitive to reef crest degradation than during moderate storm conditions, further supporting the reef degradation results presented in Sect. 5.2. It is also important to note that during an extreme event, such as Hurricane Wilma, the reef can act as a barrier against sediment transport, further reducing the storm impact on the coast by retaining sand in the lagoon and on the beach. However, this is not taken into account in the present study, nor is the effect of changes in reef roughness associated with degradation, which have been shown to have important implications in wave transformation (Buckley et al., 2016) and wave runup (Osorio-Cano et al., 2017) but are not the focus of the present study. Furthermore, it is likely that by treating the dune as a non-erodible feature, overtopping is underestimated.
The calculation of extreme runup is necessary to estimate the storm impact in coastal areas. Under certain combinations of energetic wave conditions on fringing reefs, the steep reef face has been shown to facilitate the liberation of fluctuations with infragravity periods, which can pass into the lagoon with little energy loss and exacerbate the effect of the storm (Roeber and Bricker, 2015). The importance of these long-wave motions inside the lagoon has been previously demonstrated by Van Dongeren et al. (2013). The above phenomenon can be intensified if the reef lagoon resonates with the wave period, amplifying the peak energy of the surf beat (Torres-Freyermuth et al., 2012; Roeber and Bricker, 2015). The results of the current study show the dominance of infragravity swash contributions. In order to look at this further, Sinc vs. Sig variance was plotted against the Iribarren number (not shown), showing a clear dominance of Sig contributions under practically all wave conditions, reiterating the importance of infragravity contributions in these environments.
With regards to the effect of habitat degradation, the results show an increase in runup and hence storm impact with degradation, particularly for storm periods of <10 years. Since the results show that sand dunes also play an important role in coastal protection, in locations where the presence of significant sand dunes along reef fringed coastlines is rare (e.g. Pacific Islands; Kirkpatrick et al., 1981), an increase in runup as a result of reef degradation will be even more detrimental. This becomes particularly important as more people are exposed to sea level rise and coastal hazards (e.g. erosion, flooding, and hurricanes) due to coastal population growth (Neumann et al., 2005).
Runup parameterisations provide a rapid assessment of coastal vulnerability and hence deserve further investigation. Therefore, runup dynamics and the validity of applying parameterisations used for beaches in reef environments are investigated here. Incident and infragravity swash height have been analysed for the conserved scenario using the parameterisations proposed by Stockdon et al. (2006), where the swash height was calculated as follows:
where Sinc and Sig are significant swash height in the incident and infragravity frequencies, respectively. For beaches, Stockdon et al. (2006) found incident swash height (Sinc) to be best parameterised by a dimensional version of an Iribarren-type relationship, , where β is the beach face slope and H0 and L0 incident wave height and length, respectively. Figure 9a shows the incident swash height for the 600 cases simulated in the present study (high and low water contributions are presented in green and red, respectively). As shown in the figure, Stockdon's parameterisation (blue solid line) works fairly well for Sinc, particularly for high water levels, although it slightly overpredicts the numerical results. Figure 9b shows the parameterisation for infragravity swash height (Sig), excluding beach slope in the parameterisation as suggested by Stockdon et al. (2006), which also works satisfactorily for the high-water level, although it is less applicable for more energetic waves.
With regards to wave setup <η>, the parameterisations presented by Stockdon et al. (2006) significantly underestimate wave setup in the study area (Fig. 9c). The effects of the relative contributions of high and low water to wave setup are less obvious for this profile than for sandy beaches (e.g. Medellín et al., 2016). When the slope of the reef face is used instead of the beach face slope, the parameterisation improves (red vs. blue line Fig. 9c), although it still underestimates the setup values.
Finally, when analysing R2 % and comparing it to the complete parameterisation by Stockdon et al. (2006) for beaches, the fit improves considerably when the reef face slope is used instead of the beach face (Fig. 10). However, the runup parameterisations fail to predict the runup during extreme wave conditions. This is mainly attributed to the underestimation of wave setup. However it is worth noting that the good fit of the R2 % parameterisation is ascribed to a combination of the over-prediction of S and under-prediction of setup. Therefore, future work should be devoted to improving such parameterisations by incorporating the reef geometry characteristics in the formulations.
A numerical model was employed for the theoretical study of the role of the reef–dune system in coastal protection against extreme wave events in Puerto Morelos (Mexico). The storm impact scale proposed by Sallenger (2000) shows that ecosystem degradation enhances beach vulnerability, particularly for storms with return periods smaller than 10 years. The combined degradation of both the dune and reef further increases the vulnerability, so that the conservation of the system as a whole is important for coastal protection. This implies that the environmental service of coastal protection by coral reefs and dunes is critical in the short term regarding infrastructure losses in coastal areas. Neglecting the storm surge contribution significantly underestimated the storm impact scale, particularly for return periods of less than 3 years. For the reef setting studied here, both the infragravity swash and the wave-induced setup play an important role when parameterising runup. The inclusion of the reef slope improves the model fit to numerical data, suggesting that the equations used for beach environments need to incorporate reef geometry characteristics. However, the main drawback in the present study is that it does not consider the dune or the beach as erodible features. Both play an important role in energy dissipation and hence further research is warranted to investigate their effect on increasing/decreasing the storm impact during extreme events. Furthermore, the role of reef roughness and two-dimensional horizontal processes needs to be addressed for a more comprehensive study on the implication of reef degradation in such environments.
The numerical results and data employed in this work can be obtained on request from the author.
GF carried out all the numerical simulations and data analysis and helped to design the numerical tests. ATF led and supervised this work and designed the numerical experiments. GM developed the scripts for downscaling the wave hindcast data and reconstructing the runup time series. MEAA compiled and helped implement the numerical models in the cluster. CA generated the wave hindcast information employed in this work. GF prepared the manuscript with contribution from all co-authors.
The authors declare that they have no conflict of interest.
The first author is funded by a postdoctoral scholarship awarded by the
Programa de Becas Posdoctorales UNAM-DGAPA. Financial support for this study
was provided by the National Council of Science and Technology CONACyT
through the National Coastal Resilience Laboratory (LANRESC), CB-2016-01
(project 284430), and the Institute of Engineering UNAM. Alec
Torres-Freyermuth, Gabriela Medellín, and Ma. Eugenia Allende-Arandia
acknowledge support provided by Cátedras CONACYT project 1146. Many
thanks to Gonzalo Martín Ruiz and José López González for
technical support, to CINVESTAV-Mérida for providing the beach profile,
and to CONABIO for the bathymetry. Jeff Hansen and two anonymous reviewers helped to significantly improve the manuscript. Finally, we acknowledge Delft University of Technology for making the development of SWASH possible.
Edited by: Oded
Katz
Reviewed by: Jeff Hansen and two anonymous referees
Alvarez-Filip, L., Dulvy, N. K., Gill, J. A., Côté, I. M., and Watkinson, A. R.: Flattening of Caribbean coral reefs: region-wide declines in architectural complexity. Proc. Roy. Soc. Lond. B Bio., 276, 3019–3025, 2009. a
Appendini, C. M., Torres-Freyermuth, A., Oropeza, F., Salles, P., Lopez, J., and Mendoza, E. T.: Wave modeling performance in the Gulf of Mexico and Western Caribbean: Wind reanalyses assessment, Appl. Ocean Res., 39, 20–30, https://doi.org/10.1016/j.apor.2012.09.004, 2013. a, b
Appendini, C. M., Torres-Freyermuth, A., Salles, P., Lopez, J., and Mendoza, E. T.: Wave Climate and Trends for the Gulf of Mexico: A 30-Yr Wave Hindcast, J. Climate, 27, 1619–1632, https://doi.org/10.1175/JCLI-D-13-00206.1, 2014. a, b, c, d
Bleck, R.: An oceanic general circulation model framed in hybrid isopycnic-Cartesian coordinates, Ocean Model., 4, 55–88, 2002. a
Brinkkemper, J. A., Torres-Freyermuth, A., Mendoza, E. T., and Ruessink, B. G.: Parameterization of wave run-up on beaches in Yucatan, Mexico: A numerical study, Coast. Dynam., 225–234, 2013. a
Buckley, M., Lowe, R., and Hansen, J.: Evaluation of nearshore wave models in steep reef environments. Ocean Dynam., 64, 847–862, https://doi.org/10.1007/s10236-014-0713-x, 2014. a
Buckley, M., Lowe, R., Hansen, J., and van Dongeren, A.: Wave setup over a fringing reef with large bottom roughness. J. Oceanogr., 46, 2317–2333, 2016. a, b
Burke, L., K. Reytar, M. Spalding, and Perry, A.: Reefs at Risk Revisited, World Resources Institute (WRI), The Nature Conservancy, WorldFish Center, International Coral Reef Action Network, UNEP World Conservation Monitoring Centre and Global Coral Reef Monitoring Network, Washington, D.C., 114 pp., 2011. a
Camus, P., Mendez, F. J., and Medina, R.: A hybrid efficient method to downscale wave climate to coastal areas, Coast. Eng., 58, 851–862, https://doi.org/10.1016/j.coastaleng.2011.05.007, 2011a. a, b, c
Camus, P., Mendez, F. J., Medina, R., and Cofiño, A. S.: Analysis of clustering and selection algorithms for the study of multivariate wave climate, Coast. Eng., 58, 453–462, https://doi.org/10.1016/j.coastaleng.2011.02.003, 2011b. a, b
Coronado, C., Candela, J., Iglesias-Prieto, R., Sheinbaum, J., López, M., and Ocampo-Torres, F. J.: On the circulation in the Puerto Morelos fringing reef lagoon, Coral Reefs, 26, 149–163, 2007. a, b, c, d
de Bakker, A. T. M., Herbers, T. H. C., Smit, P. B., Tissier, M. F. S., and Ruessink, B. G.: Nonlinear infragravity-wave interactions on a gently sloping laboratory beach. J. Phys. Oceanogr., 45, 589–605, 2015. a
Durán, O. and Moore, L. J.: Vegetation controls on the maximum size of coastal dunes. P. Natl. Acad. Sci. USA, 110, 17217–17222, https://doi.org/10.1073/pnas.1307580110, 2013. a
Eakin, C. M.: Where have all the carbonates gone? A model comparison of calcium carbonate budgets before and after the 1982–1983 El Niño at Uva Island in the Eastern Pacific, Coral Reefs, 15, 109e119, https://doi.org/10.1007/BF01771900, 1996. a, b
Fasshauer, G. F.: Meshfree Approximation Methods with MAT-LAB, World Scientific Publishing Co., Inc., River Edge, NJ, USA, 2007. a, b
Ferrario, F., Beck, M. W., Storlazzi, C. D., Micheli, F., Shepard, C. C., and Airoldi, L.: The effectiveness of coral reefs for coastal hazard risk reduction and adaptation, Nat. Commun., 5, 3794, https://doi.org/10.1038/ncomms4794, 2014. a
Franke, R.: Scattered data interpolation: test of some methods, Math. Comput., 38, 181–200, 1982. a
Franklin, G., Mariño-Tapia, I., and Torres-Freyermuth, A.: Effects of reef roughness on wave setup and surf zone currents. J. Coastal Res., 65, 2005–2010, https://doi.org/10.2112/SI65-339.1, 2013. a
Guanche, Y., Camus, P., Guanche, R., Mendez, F. J., and Medina, R.: A simplified method to downscale wave dynamics on vertical breakwaters, Coast. Eng., 71, 68–77, https://doi.org/10.1016/j.coastaleng.2012.08.001, 2013. a, b
Guannel, G., Arkema, K., Ruggiero, P., and Verutes, G.: The Power of Three: Coral Reefs, Seagrasses and Mangroves Protect Coastal Regions and Increase Their Resilience, PLoS One 11, e0158094. https://doi.org/10.1371/journal.pone.0158094, 2016. a
Guimarães, P. V., Farina, L., Toldo, E., Diaz-Hernandez, G., and Akhmatskaya, E.: Numerical simulation of extreme wave runup during storm events in Tramanda Beach, Rio Grande do Sul, Brazil, Coast. Eng., 95, 171–180, 2015. a
Halliwell Jr., G. R.: Simulation of North Atlantic decadal/multidecadal winter SST anomalies driven by basin-scale atmospheric circulation anomalies, J. Phys. Oceanogr., 28, 5–21, 1998. a
Hoegh-Guldberg, O.: Climate change, coral bleaching and the future of the world's coral reefs, Mar. Freshwater Res., 50, 839–866, 1999. a, b
Hoegh-Guldberg, O.: Low coral cover in a high-CO2 world, J. Geophys. Res.-Oceans, 110, C09S06, https://doi.org/10.1029/2004JC002528, 2005. a
Hoegh-Guldberg, O., Mumby, P. J., Hooten, A. J., Steneck, R. S., Greenfield, P., Gomez, E., Harvell, C. D., Sale, P. F., Edwards, A. J., Caldeira, K., Knowlton, N., Eakin, C. M., Iglesias-Prieto, R., Muthiga, N., Bradbury, R. H., Dubi, A., and Hatziolos, M. E.: Coral reefs under rapid climate change and ocean acidification, Science, 318, 1737–1742, 2007. a
Jiménez-Orocio, O., Espejel, I., and Martínez, M. L.: La investigación científica sobre dunas costeras de México: origen, evolución y retos, Rev. Mex. Biodivers., 86, 486–507, 2014. a
Kirkpatrick, J. B. and Hassall, D. C.: Vegetation of the Sigatoka sand dunes, Fiji. N. Z. J. Bot., 19, 285–297, 1981. a
Longuet-Higgins, M. S. and Stewart, R.: Radiation stress in water waves: a physical discussion with applications, Deep-Sea Res., 11, 529–562, 1964. a
Lowe, R. J., Falter, J. L., Bandet, M. D., Pawlak, G., Atkinson, M. J., Monismith, S. G., and Koseff, J. R.: Spectral wave dissipation over a barrier reef, J. Geophys. Res.-Oceans. 110, 1–16, 2005. a
Lugo-Fernandez, A., Roberts, H. H., and Suhayda, J. N.: Wave transformations across a Caribbean fringing-barrier coral reef, Cont. Shelf Res., 18, 1099–1124, 1998. a
Mariño Tapia, I., Silva, R., Enriquez Ortiz, C., Mendoza Baldwin, E., Escalante Mancera, E., and Ruiz Renteria, F.: Extreme conditions induced by Hurricane Wilma in inter-mediate water depth at Puerto Morelos, Quintana Roo, Mexico, in: Proceedings 31st International Conference on Coastal Engineering, 573–583, 2008. a, b
Mariño-Tapia, I., Silva, R., Enriquez, C., Mendoza-Baldwin, E., Escalante-Mancera, E., and Ruiz-Rentería, F.: Wave transformation and wave-driven circulation on natural reefs under extreme hurricane conditions, Coastal Engineering Proceedings 1, 32, https://doi.org/10.9753/icce.v32.waves.28, 2011. a
Mariño-Tapia, I., C. Enriquez, E. Mendoza-Baldwin, E. M. Escalante, and Ruiz-Rentería, F.: Comparative morphodynamics between exposed and reef protected beaches under hurricane conditions, Coast. Eng., 1, 1–9, 2014. a
Medellín, G., Brinkkemper, J. A., Torres-Freyermuth, A., Appendini, C. M., Mendoza, E. T., and Salles, P.: Run-up parameterization and beach vulnerability assessment on a barrier island: a downscaling approach, Nat. Hazards Earth Syst. Sci., 16, 167–180, https://doi.org/10.5194/nhess-16-167-2016, 2016. a, b, c, d, e, f, g, h
Mesinger, F., DiMego, G., Kalnay, E., Mitchell, K., Shafran, P., Ebisuzaki, W., Jovic, D., Woollen, J., Rogers, E., Berbery, E., Ek, M., Fan, Y., Grumbine, R., Higgins, W., Li, H., Lin, Y., Manikin, G., Parrish, D., and Shi, W.: North American regional reanalysis, B. Am. Meteorol. Soc., 87, 343–360, https://doi.org/10.1175/BAMS-87-3-343, 2006. a
Neumann, B., Vafeidis, A. T., Zimmerman, J., and Nicholls, R. J.: Future coastal population growth and exposure to sea-level rise and coastal flooding – a global assessment, PLoS One, 10, e0118571, https://doi.org/10.1371/journal.pone.0118571, 2005. a
Osorio-Cano, J. D., Osorio, A. F., and Peláez-Zapata, D. S.: Ecosystem management tools to study natural habitats as wave damping structures and coastal protection mechanisms, J. D. Ecol. Eng., in press, 2017. a
Parra, S. M., Valle-Levinson, A., Mariño-Tapia, I., and Enriquez, C.: Salt intrusion at a submarine spring in a fringing reef lagoon. J. Geophys. Res., 120, 2736–2750, 2015. a, b
Peláez, S. D., Montoya, R. D., and Osorio, A. F.: Numerical study of run-up oscillations over fringing reefs, J. Coastal. Res., http://www.jcronline.org/doi/abs/10.2112/JCOASTRES-D-17-00057.1?code=cerf-site (last access: 22 April 2018), 2017. a
Pickering, M. D., Horsburgh, K. J., Blundell, J. R., Hirschi, J. J.-M., Nicholls, R. J., Verlaan, M., and Wells, N. C.: The impact of future sea-level rise on the global tides, Cont. Shelf Res., 142, 50–68, 2017. a
Quataert, E., Storlazzi, C., van Rooijen, A., Cheriton, O., and van Dongeren, A.: The influence of coral reefs and climate change on wave-driven flooding of tropical coastlines, Geophys. Res. Lett. 42, 6407–6415, 2015. a
Rippa, S.: An algorithm for selecting a good value for the parameter c in radial basin function interpolation, Adv. Comput. Math., 11, 193–210, 1999.
Roeber, V. and Bricker, J. D.: Destructive tsunami-like wave generated by surf beat over a coral reef during Typhoon Haiyan, Nat. Commun., 6, 7854, 193–210, https://doi.org/10.1038/ncomms8854, 2015. a, b
Ruiz de Alegría-Arzaburu, A., Mariño-Tapia, I., Enriquez, C., Silva, R., and González-Leija, M.: The role of fringing coral reefs on beach morphodynamics, Geomorphology, 198, 69–83, 2013. a
Ruíz-Rentería, F., vanTussenbroek, B. I., and Jordán-Dahlgren, E.: CARICOMP Caribbean coral reef, seagrass and mangrove sites: Puerto Morelos, Quintana Roo, Mexico, Coastal Regions and small island papers, UNESCO, Paris, 1998. a
Ruju, A., Lara, J. L., and Losada, I. J.: Numerical analysis of run-up oscillations under dissipative conditions, Coast. Eng., 86, 45–56, https://doi.org/10.1016/j.coastaleng.2014.01.010, 2014. a
Sallenger, A. H.: Storm impact scale for barrier islands, J. Coastal. Res., 16, 890–895, https://doi.org/10.1002/2014JC010093, 2000. a, b, c, d, e, f, g, h
Secaira-Fajardo, F., Reguero, B. G., and Acevedo-Ramírez, C. A.: Importance of reefs and dunes In the protectIon of the coast-summary. Technical series: The role of natural systems in coastal dynamics in the Mexican Caribbean and the impact of human activities in its current condition, The Nature Conservancy, Mexico, 2017. a
Sheppard, C., Dixon, D. J., Gourlay, M., Sheppard, A., and Payet, R.: Coral mortality increases wave energy reaching shores protected by reef flats: examples from the Seychelles. Estuar. Coast. Shelf Sci., 64, 223–234, https://doi.org/10.1016/j.ecss.2005.02.016, 2005. a, b, c, d
Silva, R., Marino-Tapia, I., Enríquez-Ortiz, C., Mendoza-Baldwin, E., Escalante-Mancera, E., and Ruiz-Rentería, F.: Monitoring shoreline changes at Cancun beach, Mexico: effects of Hurricane Wilma, in: Proceedings of the 30th International Conference on Coastal Engineering, 3491–3503, 2006. a, b
Silva, R., Ruiz, G., Mariño-Tapia, I., Posada, G., Mendoza, E., and Escalante, E.: Man-made vulnerability of the Cancun beach system: The case of hurricane Wilma, Clean-Soil, Air, Water, 40, 911–919, 2012. a
Silva, R., Martínez, M. L., Odériz, I., Mendoza, E., and Feagin, R. A.: Response of vegetated dune-beach systems to storm conditions, Coast. Eng., 109, 53–62, 2016. a
Smit, P., Janssen, T., Holthuijsen, L., and Smith, J.: Non-hydrostatic modeling of surf zone wave dynamics, Coast. Eng., 83, 36–48, 2014. a
Sørensen, O. R., Kofoed-Hansen, H., Rugbjerg, M., and Sørensen, L. S.: A third-generation spectral wave model using an unstructured finite volume technique, in: Proc. 29th Intl. Conf. on Coastal Engineering, Lisbon, Portugal, ASCE, 894–906, 2004. a
Stockdon, H. F., Holman, R. A., Howd, P. A., and Sallenger, A. H.: Empirical parameterization of setup, swash, and runup, Coast. Eng., 53, 573–588, https://doi.org/10.1016/j.coastaleng.2005.12.005, 2006. a, b, c, d, e, f
Stockdon, H. F., Sallenger Jr., A. H., Holman, R. A., and Howd, P. A.: A simple model for the spatially-variable coastal response to hurricanes, Mar. Geol., 238, 1–20, https://doi.org/10.1016/j.margeo.2006.11.004, 2007. a
Torres-Freyermuth, A., Mariño-Tapia, I., Coronado, C., Salles, P., Medellín, G., Pedrozo-Acuña, A., Silva, R., Candela, J., and Iglesias-Prieto, R.: Wave-induced extreme water levels in the Puerto Morelos fringing reef lagoon, Nat. Hazards Earth Syst. Sci., 12, 3765–3773, https://doi.org/10.5194/nhess-12-3765-2012, 2012. a, b
US Army Corps of Engineers: Coastal Risk Reduction and Resilience, CWTS 2013-3, DC, Directorate of Civil Works, US Army Corps of Engineers, Washington, 2013. a, b
Van Dongeren, A., Lowe, R., Pomeroy, A., Trang, D. M., Roelvink, D., Symonds, G., and Ranasinghe, R.: Numerical modeling of low-frequency wave dynamics over a fringing coral reef, Coast. Eng., 73, 178–190, https://doi.org/10.1016/j.coastaleng.2012.11.004, 2013. a
Yao, Y., Becker, J. M., and Merrifield, M.A: Boussinesq modeling of wave transformation over fringing reefs: two case studies of field observations, Ocean Sci. Meeting 2014, Honolulu, Hawaii, USA (OS014-14397), 2014. a
Yao, Y., Becker, J. M., Ford, M. R., and Merrifield, M. A.: Modeling wave processes over fringing reefs with an excavation pit, Coast. Eng., 109, 9–19, 2016. a
Zijlema, M.: Modeling Wave Transformation Across a Fringing Reef using SWASH, Coastal Engineering Proceedings, 1, 33, https://doi.org/10.9753/icce.v33.currents.26, 2012. a
Zijlema, M., Stelling, G., and Smit, P.: SWASH: An operational public domain code for simulating wave fields and rapidly varied flows in coastal waters, Coast. Eng., 58, 992–1012, https://doi.org/10.1016/j.coastaleng.2011.05.015, 2011. a, b, c