the Creative Commons Attribution 4.0 License.
the Creative Commons Attribution 4.0 License.
 | 25 Feb 2025
Compound winter low-wind and cold events impacting the French electricity system: observed evolution and role of large-scale circulation
Margot Bador
Julien Boé
Laurent Dubus
Bénédicte Jourdier
To reach climate mitigation goals, the share of wind power in electricity production is set to increase substantially in France. In winter, low-wind days are challenging for the electricity system when compounded with cold days that are associated with peak electricity demand. The scope of this study is to characterize the evolution of compound low-wind and cold events in winter over the 1950–2022 period in France. Compound events are identified at the daily scale using a bottom-up approach based on two indices relevant to the French energy sector, derived from temperature and wind observations. The frequency of compound events shows high interannual variability, with some winters having no event and others having up to 13. Over the 1950–2022 period, the frequency of compound events decreased, which is likely due to a decrease in the frequency of cold days. Based on a k-means unsupervised classification technique, four weather types are identified, highlighting the diversity of synoptic situations that lead to the occurrence of compound events. The weather type associated with the highest frequency of compound events presents pronounced positive mean sea-level pressure anomalies over Iceland and negative anomalies west of Portugal, limiting the entrance of the westerlies and inducing a north-easterly flow that brings cold air over France and Europe generally. We further show that the atmospheric circulation and its internal variability likely play a role in the observed reduction in cold days, suggesting that this negative trend may not be entirely driven by anthropogenic forcings. However, it is more difficult to reach a conclusion on the role of the atmospheric circulation in the observed decrease in compound events.
- Article
(5902 KB) - Full-text XML
-
Supplement
(576 KB) - BibTeX
- EndNote


The transition of the energy system, including the reinforced integration of renewable energy, is necessary to reduce greenhouse gas emissions in accordance with the Paris Agreement. A recent report from the French electricity transmission system operator (Réseau de Transport d'Électricité, 2023; hereafter referred to as RTE) shows that France's energy transition will rely on widespread electrification of residential heating, transport, and industry, along with an improvement in energy efficiency (e.g. thermal renovation of buildings). Therefore, the electricity demand is projected to increase from 475 TW h in 2019 to 580–640 TW h in 2035, according to scenarios in which France meets its energy transition goals (see scenarios A in RTE, 2023). In light of the future electricity demand, France has expressed its intention to significantly expand its wind energy capacity in the coming decades. Onshore wind power capacity is planned to increase from 20 GW in 2022 to 30–39 GW by 2035, and substantial additional offshore wind farms are also planned, with a total projected capacity of 18 GW by 2035 compared to 0.5 GW in 2022 (RTE, 2023).
Electricity production and demand can be affected by a range of climate conditions. Regarding electricity demand during winter, France is known to be one of the most temperature-sensitive among European countries (Bloomfield et al., 2020). This is mainly explained by the high use of electricity for residential heating, which is expected to increase over the next decades (RTE, 2023). Hence, cold events will likely continue to be associated with peak electricity demand based on the projections of the future French electricity system (RTE, 2023). Besides, part of the electricity production in France relies on renewable energies that are sensitive to climate conditions including wind speed, solar radiation, and river flows. As the proportion of renewable energy in the French electricity mix rises, its electricity production will be more influenced by climate variability. In particular, it is anticipated that a higher proportion of wind power in the electricity mix may lead to higher risks to the electricity production, especially during low-wind events. This is especially the case in winter when solar generation represents a smaller share of the electricity production (Grams et al., 2017; Otero et al., 2022b). Hence, in France, it can be challenging to ensure adequate electricity production to meet demand due to the occurrence of multivariate compound events (Zscheischler et al., 2020), such as low-wind and cold events, which can create stressful situations. This study aims to characterize compound low-wind and cold events in France.
Overall, there is little information in the literature on the observed evolution of compound low-wind and cold events in France and Europe. A body of studies focus on related events using electricity production and demand data. For instance, an electricity supply drought is defined by a sequence of days with low renewable electricity production and high electricity demand (Raynaud et al., 2018). Most of these studies focus on the characterization of the statistical properties of these events (Otero et al., 2022a, b; Raynaud et al., 2018; Tedesco et al., 2023) or their drivers (Bloomfield et al., 2020; Ravestein et al., 2018; Thornton et al., 2017; van der Wiel et al., 2019a, b). Only a limited number of these studies focus on their temporal evolution in the context of climate change. It is shown by van der Wiel et al. (2019a), using projections from two global climate models, that the frequency of electricity supply droughts in Europe is reduced in a 2 °C warmer world compared to present-day conditions. Although there is a gap in the understanding of the past evolution of compound low-wind and cold events, changes in low-wind or cold events have been investigated independently. Rapella et al. (2023) showed that the frequency of low-wind events decreased in the ERA5 reanalysis over the 1950–2022 period. However, they focus only on offshore regions such as the Bay of Biscay, the North Sea, and the English Channel, in summer and at the annual scale. Focusing on cold temperature conditions in winter, the frequency and intensity of cold spells have decreased over recent decades in Europe (Cattiaux et al., 2010; Seneviratne et al., 2021; Van Oldenborgh et al., 2019). While there is clear evidence that climate change has led to a reduction in cold events, there are still major uncertainties regarding low-wind events. It is therefore difficult to anticipate how compound low-wind and cold events may change in the coming decades as there is a lack of understanding of their past evolution. An objective of this study is to assess the evolution of these compound events in the observational record.
This work also focuses on the influence of large-scale atmospheric circulation on the occurrence and evolution of compound low-wind and cold events. Atmospheric circulation is an important driver of temperature variability (e.g. Plaut and Simonnet, 2001) and wind speed variability (e.g. Najac et al., 2009) in France, and here we aim to further assess its influence on compound events in winter. In the literature, different approaches are used to explore the influence of atmospheric circulation and its variability in favouring particular meteorological situations that affect the electricity sector. This includes identifying weather regimes of interest (Otero et al., 2022b; van der Wiel et al., 2019b; Tedesco et al., 2023), targeted circulation types (Bloomfield et al., 2020), and circulation regimes based on large-scale conditions leading to critical situations for the electricity system such as days with extremely high electricity demand (Thornton et al., 2017).
Finally, we investigate to what extent large-scale atmospheric circulation and its variability contribute to the past evolution of compound low-wind and cold events in France. Several studies have found that recent changes in large-scale circulation play a role in the winter trend in mean temperature across Europe (Deser and Phillips, 2023; Sippel et al., 2020; Saffioti et al., 2016) and in the decreasing occurrence and intensity of cold extremes (Horton et al., 2015; Terray, 2021). Using a dynamical adjustment approach based on observations (Terray, 2021), we explore the role of the changes in large-scale circulation in the observed trend in compound low-wind and cold events in France.
This paper is organized as follows: Sect. 2 presents the data and the method used, Sect. 3 presents the main results, and Sect. 4 includes a conclusion and discussion of the findings.
In this study, we identify compound low-wind and cold events based on a wind capacity factor index and a temperature index. These indices capture the sensitivity of the French wind power production to wind speed conditions and the sensitivity of the French electricity demand to temperature conditions, respectively. Thus, compound events as defined in this study correspond to days when the French power system is challenged by both wind and temperature conditions. In this section, we first introduce the data and methodology used to define the wind capacity factor and temperature indices. Then we introduce the methodology used to identify compound low-wind and cold events. Finally, the methods used to identify weather types and to assess the role of large-scale circulation in the evolution of compound events are detailed.
2.1 Observations and reanalyses of atmospheric variables
The ERA5 reanalysis data (Hersbach et al., 2020) are used over the period of 1950–2022. ERA5 is available on a regular grid with a resolution of about 30 km in Europe. In particular, the hourly wind speed (at 100 m) and the daily near-surface air temperature (at 2 m) are used for the calculation of the wind capacity factor and temperature indices, respectively (Sect. 2.3 and 2.4). Daily mean sea-level pressure is also used for the classification of the large-scale circulation into weather types (see Sect. 2.6) and dynamical adjustment (Sect. 2.7). In addition to the ERA5 reanalysis, wind and temperature data from the MERRA-2 reanalysis (Gelaro et al., 2017) are considered. MERRA-2 is available at a horizontal resolution of about 60 km over Europe over the 1980–2022 period. Hourly near-surface air temperature and wind speed (at 50 m) are used. We also consider in situ temperature observations from the gridded E-OBS dataset (Cornes et al., 2018) over the 1950–2022 period, available on a regular grid with a horizontal resolution of about 30 km in Europe.
This study is mainly focused on an extended winter period, from November to March, when compound low-wind and cold events occur in France. By convention, hereafter, winter 1951 corresponds to the period from November 1950 to February 1951 and similarly for other years.
2.2 Observations of the wind power production and electricity demand in France
The hourly observed data for the wind power production and electricity demand in France are taken from the éCO2mix dataset (https://odre.opendatasoft.com/explore/dataset/eco2mix-national-cons-def/information/?disjunctive.nature, last access: 21 November 2022) over the 2012–2020 period. The French wind power installed capacity is available at 3-monthly time intervals over the 2012–2020 period at https://www.statistiques.developpement-durable.gouv.fr/publicationweb/549 (last access: 21 November 2022). The hourly observed wind capacity factor is calculated using the hourly observed wind power production from éCO2mix, which is divided by the wind power installed capacity in France of the corresponding 3-monthly interval.
2.3 Wind capacity factor index
Several studies (Bloomfield et al., 2022; Jourdier, 2020; Olauson, 2018; Staffell and Pfenninger, 2016) have demonstrated that it is possible to calculate the hourly wind capacity factor at the country scale with good accuracy using wind speed from reanalysis data in Europe. Here, we use a similar approach to calculate the French wind capacity factor index over the 1951–2022 period.
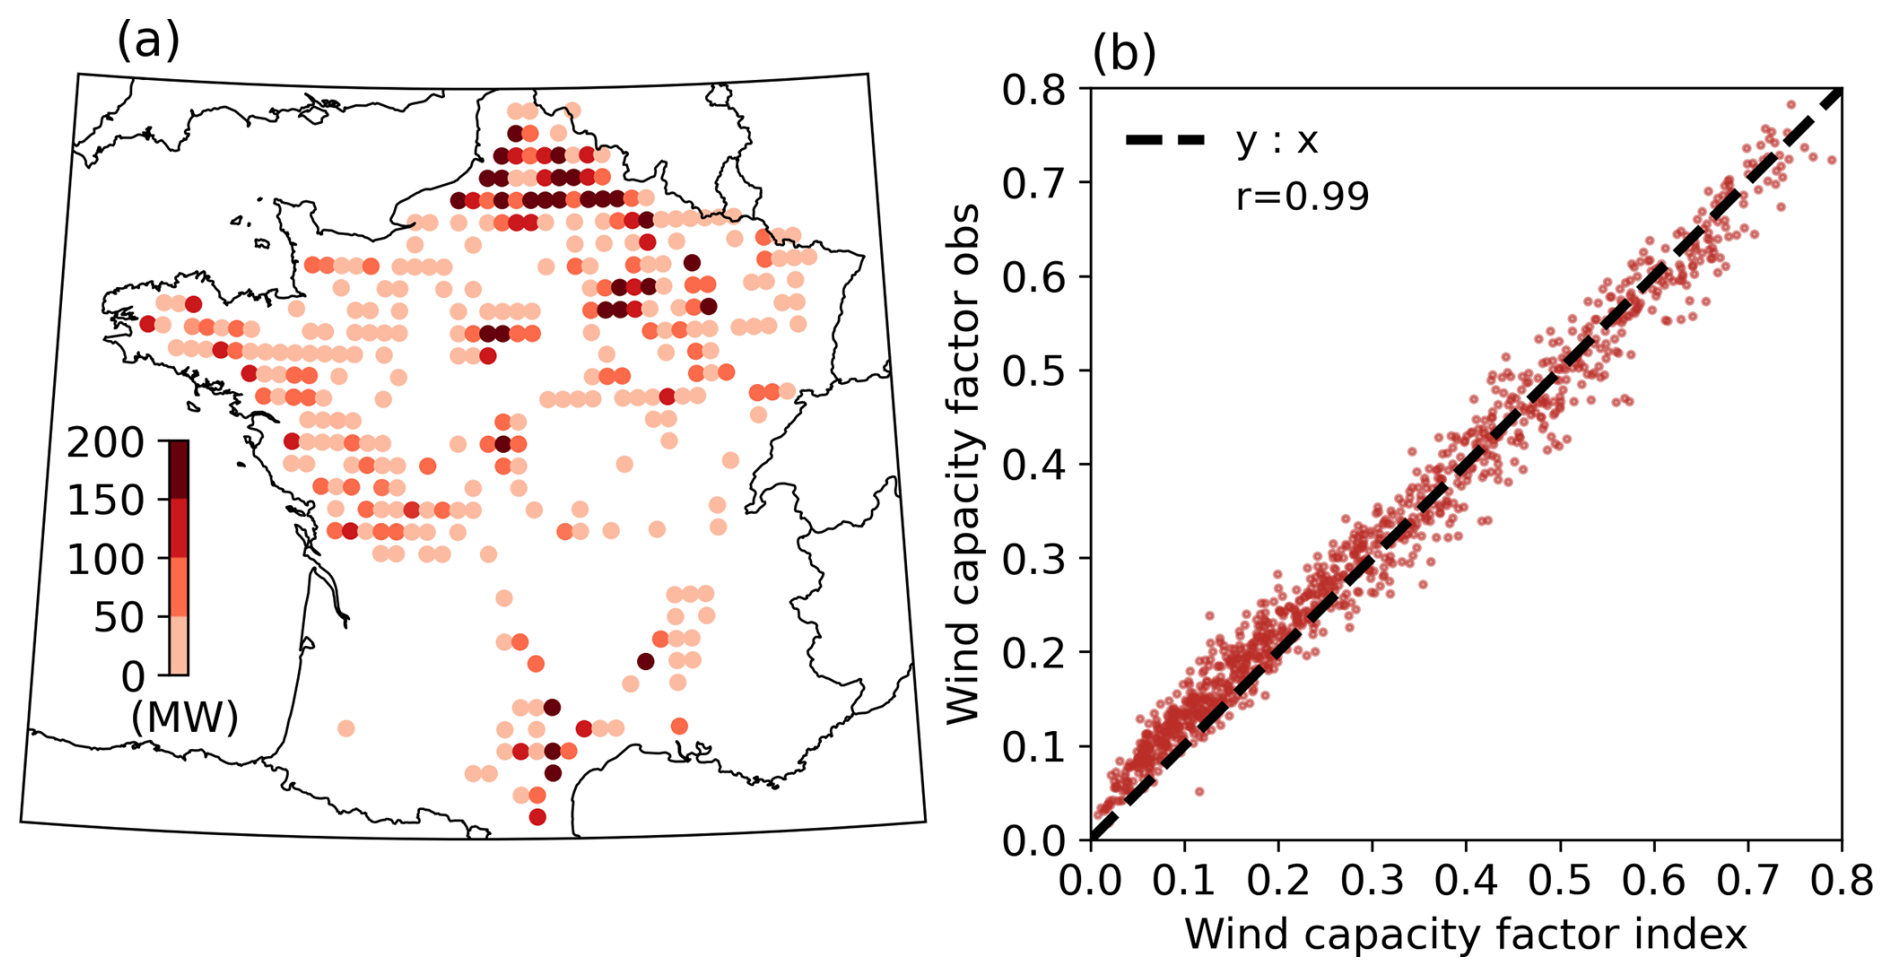
Figure 1(a) Spatial distribution of the wind power installed capacity (MW) in France in 2021 from the The Wind Power dataset used for the calculation of the wind capacity factor index. (b) French wind capacity factor index as calculated with ERA5 (no unit; x axis) versus observations (no unit; y axis) in winter over the 2012–2020 period. The correlation coefficient is given in the top-left corner, and the dashed black line represents the y:x function.
This approach requires the location, rated power, hub height, and power curves of wind turbines at each wind farm site, which are taken from The Wind Power database (https://www.thewindpower.net/, last access: 11 June 2022). Only wind farms operational in 2021 are used (i.e. those with an “in production” status). This represents a total number of 1661 wind farms and a total installed capacity of 19 GW. Wind farms and related wind power installed capacity are concentrated in the north-east of France (Fig. 1a). While the installed wind power capacity is fairly well accounted for in this database, there are a substantial number of missing data regarding the hub heights and the power curves (∼ 29 % and ∼ 7 % of wind farms, respectively). Missing data are filled in following the methodology introduced in Jourdier (2020), which broadly consists in taking characteristics from wind farms identified as similar in terms of rated power, rated diameter, rated wind speed, and cut-in and cut-off wind speed.
To calculate the wind capacity factor, ERA5 hourly wind speed at 100 m is first interpolated to each wind farm site using a nearest-neighbour interpolation scheme. The wind speed is then extrapolated at hub height using a power law (α= 0.14; Manwell, 2010; van der Wiel et al., 2019a). Then, using the power curve of each wind farm, wind speed at the hub height is converted into power production. Finally, the hourly wind capacity factor over France is estimated by summing the power production from all wind farms and dividing this total power production by the total installed capacity. Finally, hourly wind capacity factors are averaged to daily values to further identify low-wind days (Sect. 2.5).
The daily wind capacity factor index computed with this approach is extremely well correlated with observations over their nine common winters (r= 0.99, Fig. 1b), highlighting the relevance of using ERA5 data in this context.
2.4 Temperature index representative of the electricity demand
The temperature index is defined following an approach used operationally by RTE that consists in calculating a weighted average of temperature data from 32 cities in France (Fig. 2a) that is representative of the electricity demand in France. First, the near-surface air temperature in ERA5 at the grid cell closest to each city location is selected. Then the temperature is corrected based on the difference between the elevation of the grid cell and the elevation of the in situ station for each city, assuming a vertical gradient of temperature of −6.5 °C km−1. Finally, the weighted average of the temperature at the 32 locations is calculated over the 1950–2022 period.

Figure 2(a) Location of the 32 French cities and associated weights (no unit) used for the calculation of the temperature index. (b) Temperature index as calculated in ERA5 (°C; x axis) versus observations of the electricity demand (GW; y axis) in winter over the 2012–2020 period, excluding weekends and bank holidays. The correlation coefficient is given in the top-right corner. The linear regression between the temperature index and the electricity demand observations is shown by the dashed black line. The corresponding linear regression equation, in the form y=y (15 °C) + a ⋅ (15 °C − x), where 15 °C is the threshold of residential heating and a the thermosensitivity of the electricity demand, is shown in the top-right corner.
A strong anti-correlation of −0.87 is found between the temperature index and the observed electricity demand in winter (Fig. 2b). This highlights the relevance of the temperature index as a proxy for French electricity demand.
2.5 Identification of low-wind days, cold days, and associated compound events
In this study, compound events are defined as days when a low wind capacity factor and cold temperature co-occur (green points in Fig. 3). Days of a low wind capacity factor (yellow points in Fig. 3) are defined as days with an observed wind capacity factor below 0.15, corresponding to the 23rd percentile of its distribution in winter. This sample of low-wind-capacity-factor days only captures days with low values of 100 m wind speed over France (see Fig. S1 in the Supplement). Thus, these events are referred to as low-wind days. Cold days are defined as days with a temperature index below 0 °C, corresponding to the 5th percentile of its distribution in winter (blue points in Fig. 3). In this study, we chose to set a more extreme threshold for the temperature index compared to the wind capacity factor index because risks to the French power system have historically been primarily related to the occurrence of cold waves in winter (Añel et al., 2017). However, depending on future levels of wind power installed capacity and demand patterns, the sensitivity of the power system to these thresholds might change. Sensitivity tests exploring different thresholds for both indices are therefore included in the Supplement. These tests show limited sensitivity to thresholds for the definition of compound events, except for the long-term trend in the observed occurrence of compound events over the 1951–2022 period.
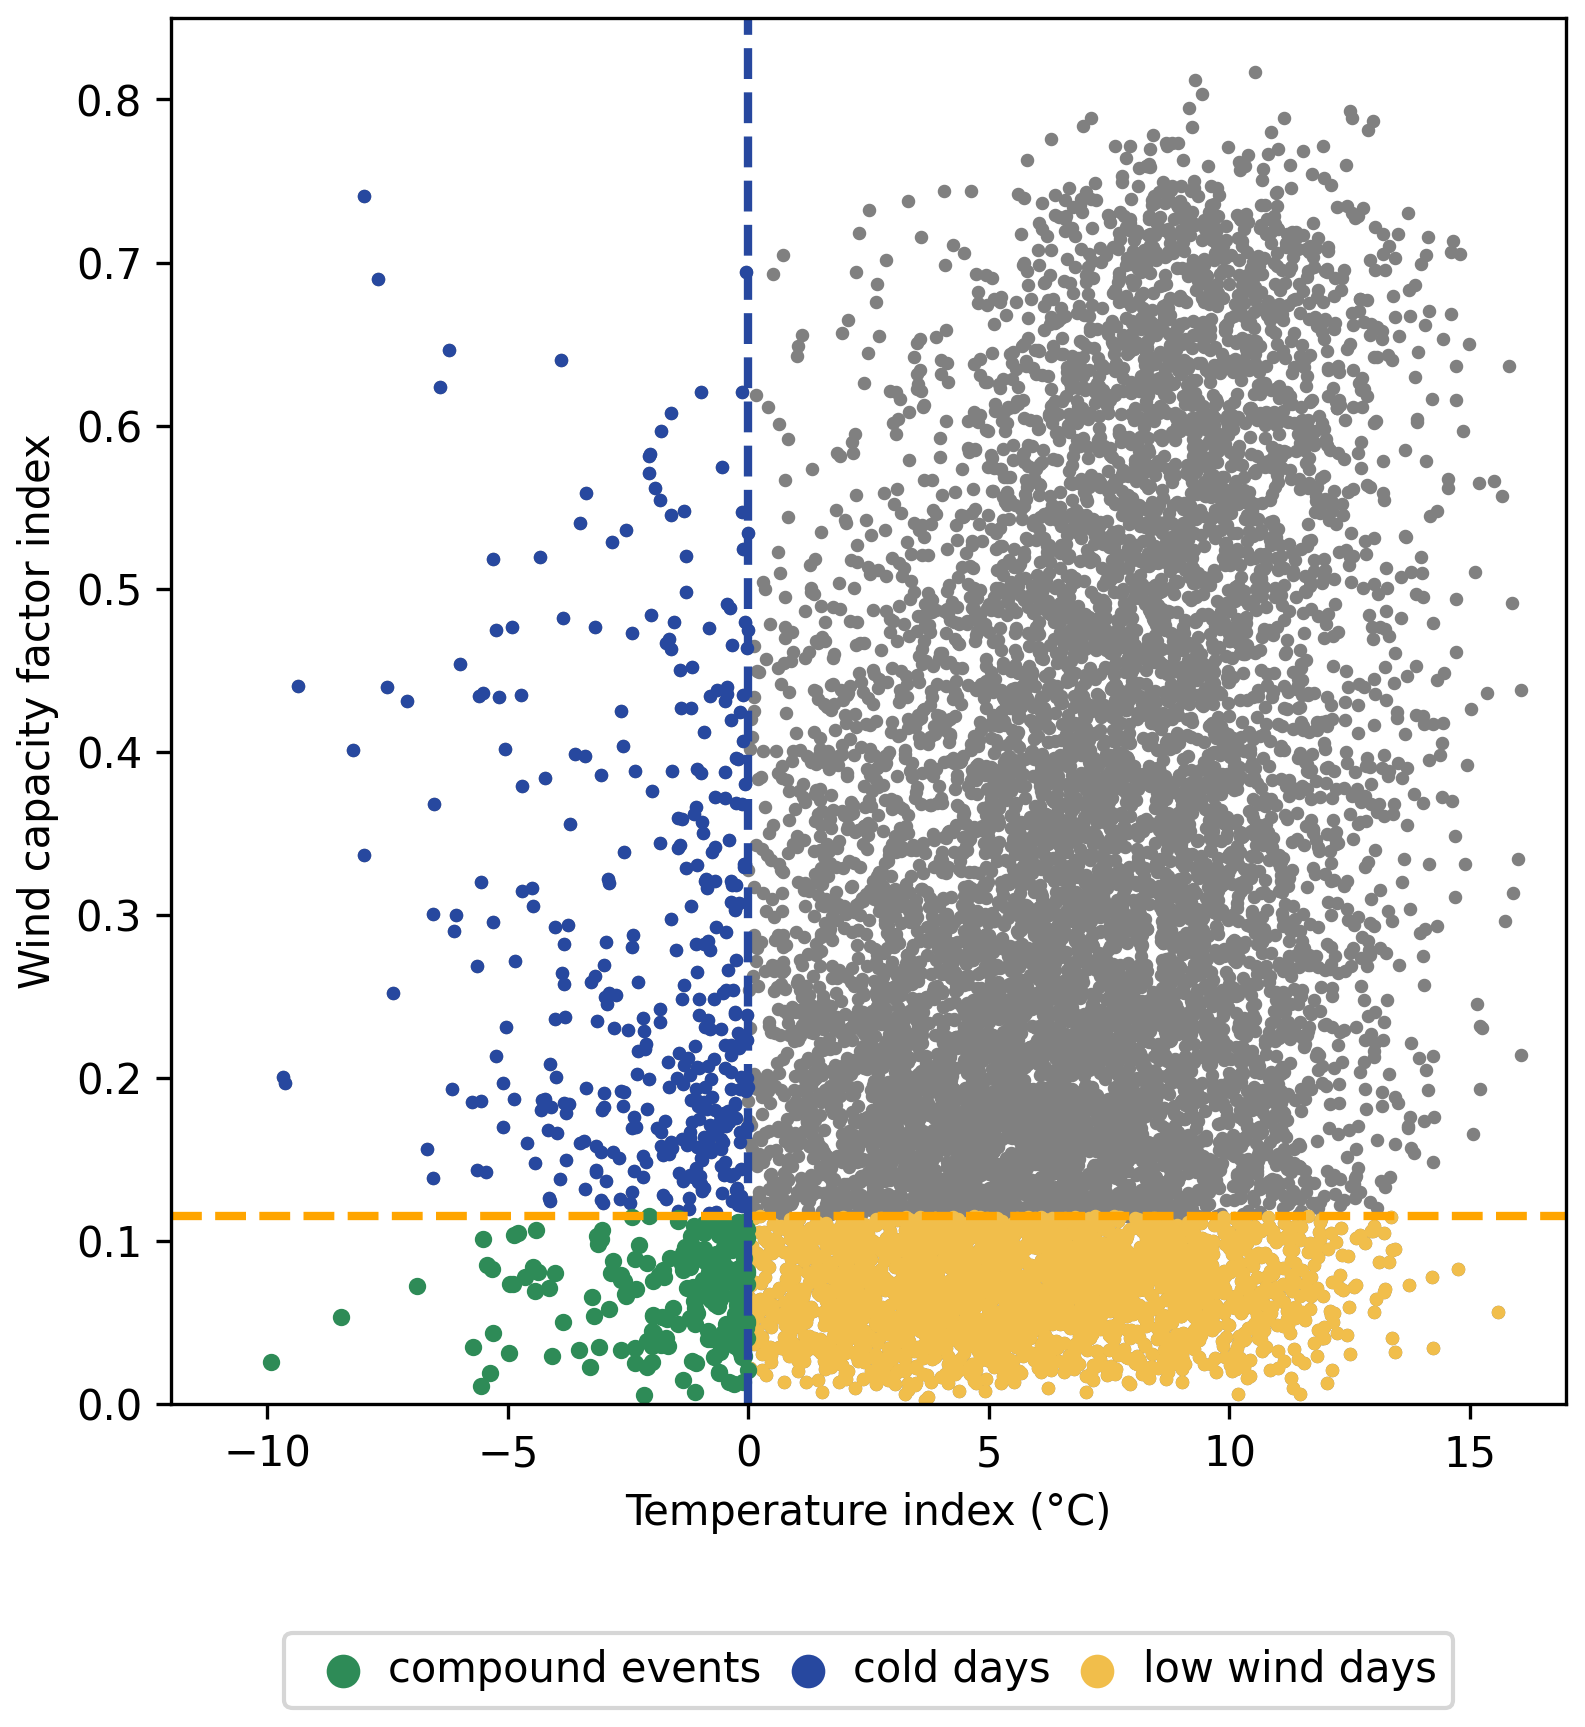
Figure 3Wind capacity factor index (no units; y axis) and temperature index (°C; x axis) calculated with ERA5 for each winter day over the 1951–2022 period. Dashed yellow and blue lines show the thresholds used to identify low-wind days and cold days (yellow and blue points, respectively). Compound low-wind and cold events are identified by the green dots.
2.6 Weather types of low-wind days
A classification of mean sea-level pressure fields on low-wind days (i.e. low-wind-capacity-factor day) is conducted using the k-means unsupervised classification method (e.g. Cassou, 2008; Falkena et al., 2020). This allows the classification of daily synoptic conditions into different large-scale atmospheric circulation types or weather types. Here, solely low-wind days are considered for the classification instead of compound low-wind and cold events because the corresponding sample size is larger (2549 d compared to 182 d; see Figs. 3 and 4b and further discussions in Sect. 3). In other words, the weather types represent clusters of low-wind days with similar large-scale circulation patterns. In a second phase, we examine how cold days are distributed across these different weather types. Finally, we can thus assess the number of compound events for each identified weather type.
This classification algorithm is first applied repeatedly for different domains and cluster numbers. The objective is to minimize locally the ratio of intra-type to inter-type variance of the temperature index while keeping a reasonable number of weather types. Thanks to this procedure, the classification of low-wind days that allows for the best differentiation of the temperature index is chosen. This procedure leads to a domain whose limits are [30° W–30° E, 33° S–70° N], which covers the north-western European region, and to a total number of four clusters.
2.7 Dynamical adjustment
The main objective of dynamical adjustment is to derive an estimate of the contribution of large-scale atmospheric circulation to the variations in a variable of interest (Terray, 2021; Deser et al., 2016; Sippel et al., 2019). In this study, we use dynamical adjustment to estimate the contribution of large-scale circulation to the variations in cold days, low-wind days, and compound events.
First, we estimate the contribution of large-scale circulation to the wind capacity factor and temperature indices, hereafter referred to as their dynamic component. To that purpose, the constructed analogue approach is used (Terray, 2021; Boé et al., 2023; Deser et al., 2016). Following Lorenz (1969), analogues are defined as days with very similar large-scale circulation. As finding genuinely good analogues in a finite database could be difficult, synthetic analogues can be constructed through the linear combination of large-scale circulation corresponding to a large number of more or less good analogues (Van Den Dool, 1994).
First, for each target day of the winters 1951–2022, the 400 closest analogues are searched for in winter using the Euclidean distance calculated with ERA5 mean sea-level pressure interpolated on a 2° × 2° grid on the north-western European domain (Sect. 2.6). The winter of the target day is excluded from the search pool. Then for each target day, a subset of 200 analogues is randomly selected from the 400 analogues, and the optimal linear combination of this subset of 200 analogues that best matches the mean sea level pressure of the target day is calculated. This allows for the obtaining of a constructed analogue for the target day. This procedure is repeated 200 times to obtain 200 constructed analogues for each target day and the corresponding 200 sets of optimal weights. While the 200 constructed analogues of each target day have very similar large-scale circulation to the target day, this procedure, together with the large number of analogues used, allows us to sample different land surface and ocean conditions that might otherwise influence the estimate of the dynamic components (Terray, 2021).
For each target day, the wind capacity factor and the temperature indices are then reconstructed by applying the same set of optimal linear weights to the corresponding wind capacity factor index and detrended anomalies of the temperature index, respectively. There are 200 reconstructions of the wind capacity factor and the temperature index per day over the winters 1951–2022. As we are interested in separating the trend due to large-scale circulation from thermodynamically forced changes, an estimate of the forced trend of the temperature index anomaly for each winter month is removed before applying the dynamical adjustment. This low-frequency trend is estimated using a low-frequency LOESS smoother as done in Terray (2021). Finally, best estimates of the dynamic components of the wind capacity factor index and the temperature index are derived by averaging the 200 reconstructions of the wind capacity factor index and the temperature index, respectively.
To isolate the impact of large-scale circulation on the evolution of compound events, we define circulation-induced compound events. These are virtual events based only on the contribution of large-scale circulation. First, circulation-induced low-wind days and cold days are identified using the same thresholds as for the definition of low-wind days and cold days (i.e. the 5th percentile and the 23rd percentile of the extended winter distribution, respectively; Sect. 2.5), but this time they are based on the dynamic component of the wind capacity factor and temperature indices, respectively. Finally, circulation-induced compound events are identified as days when both the circulation-induced low-wind days and the circulation-induced cold days virtually occur.
3.1 Climatological characteristics and observed evolution of compound low-wind and cold events
During the extended winter period (November to March), there are clear monthly variations in the occurrence of compound events, which are concentrated in mid-winter months (i.e. December to February) and peak in January (Fig. 4a). This is well explained by cold days that have similar monthly variations, while low-wind days (i.e. days with a low wind capacity factor) predominantly occur during early and late winter months (i.e. November and March).
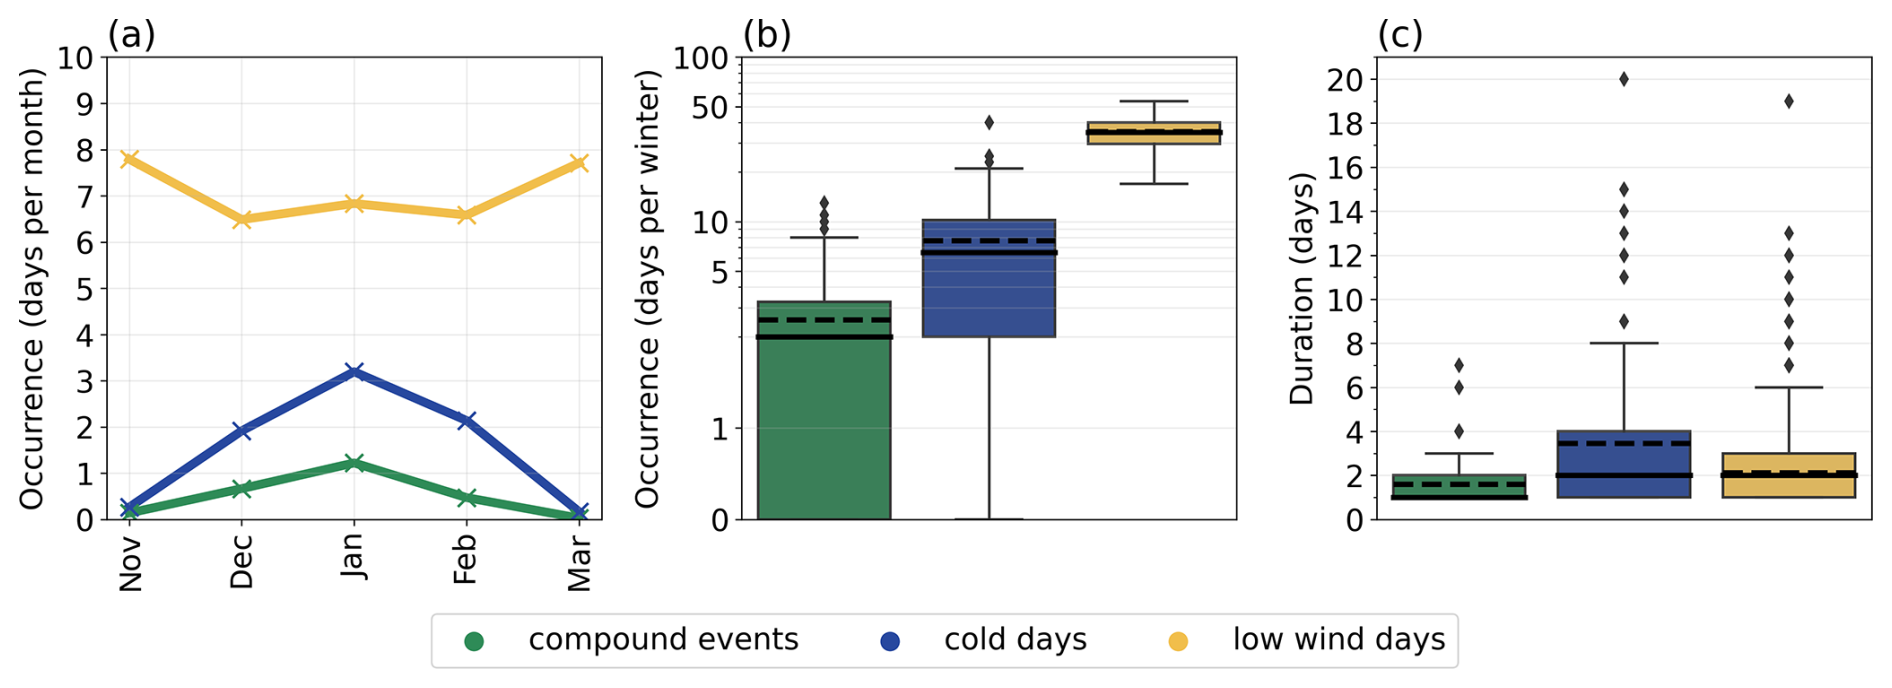
Figure 4(a) Monthly mean number of compound low-wind and cold events (green), cold days (blue), and low-wind days (yellow); distributions of (b) the number of days per winter and (c) the duration of compound low-wind and cold events, cold days, and low-wind days in winter over the 1951–2022 period in ERA5. The solid line and the dashed line in the boxplots in (b) and (c) show the median and the average, respectively.
The median number of compound events per winter (2 d; Fig. 4b) is a third of the median number of cold days per winter (6 d; Fig. 4b). The median number of low-wind days per winter reaches 35 d and is therefore substantially higher than for compound events and cold days. In terms of year-to-year variability, we find that the number of compound events ranges from 0 to 13 d per winter, while there are from 0 to 40 cold days and 17 to 54 low-wind days. When compared to the mean, the interannual variability is thus higher for the occurrence of compound events and cold days compared to low-wind days.
On average in winter, the duration of compound events is estimated to be around 2 consecutive days, with 3 d for cold days and 2 d for low-wind days (Fig. 4c). The maximum duration of compound events is 7 consecutive days, corresponding to the period between 17 and 23 January 1987, at the end of a severe 13 d cold spell. Overall, compound low-wind and cold events are relatively rare and generally short-lived, but they can last for a few days and up to a week occasionally.
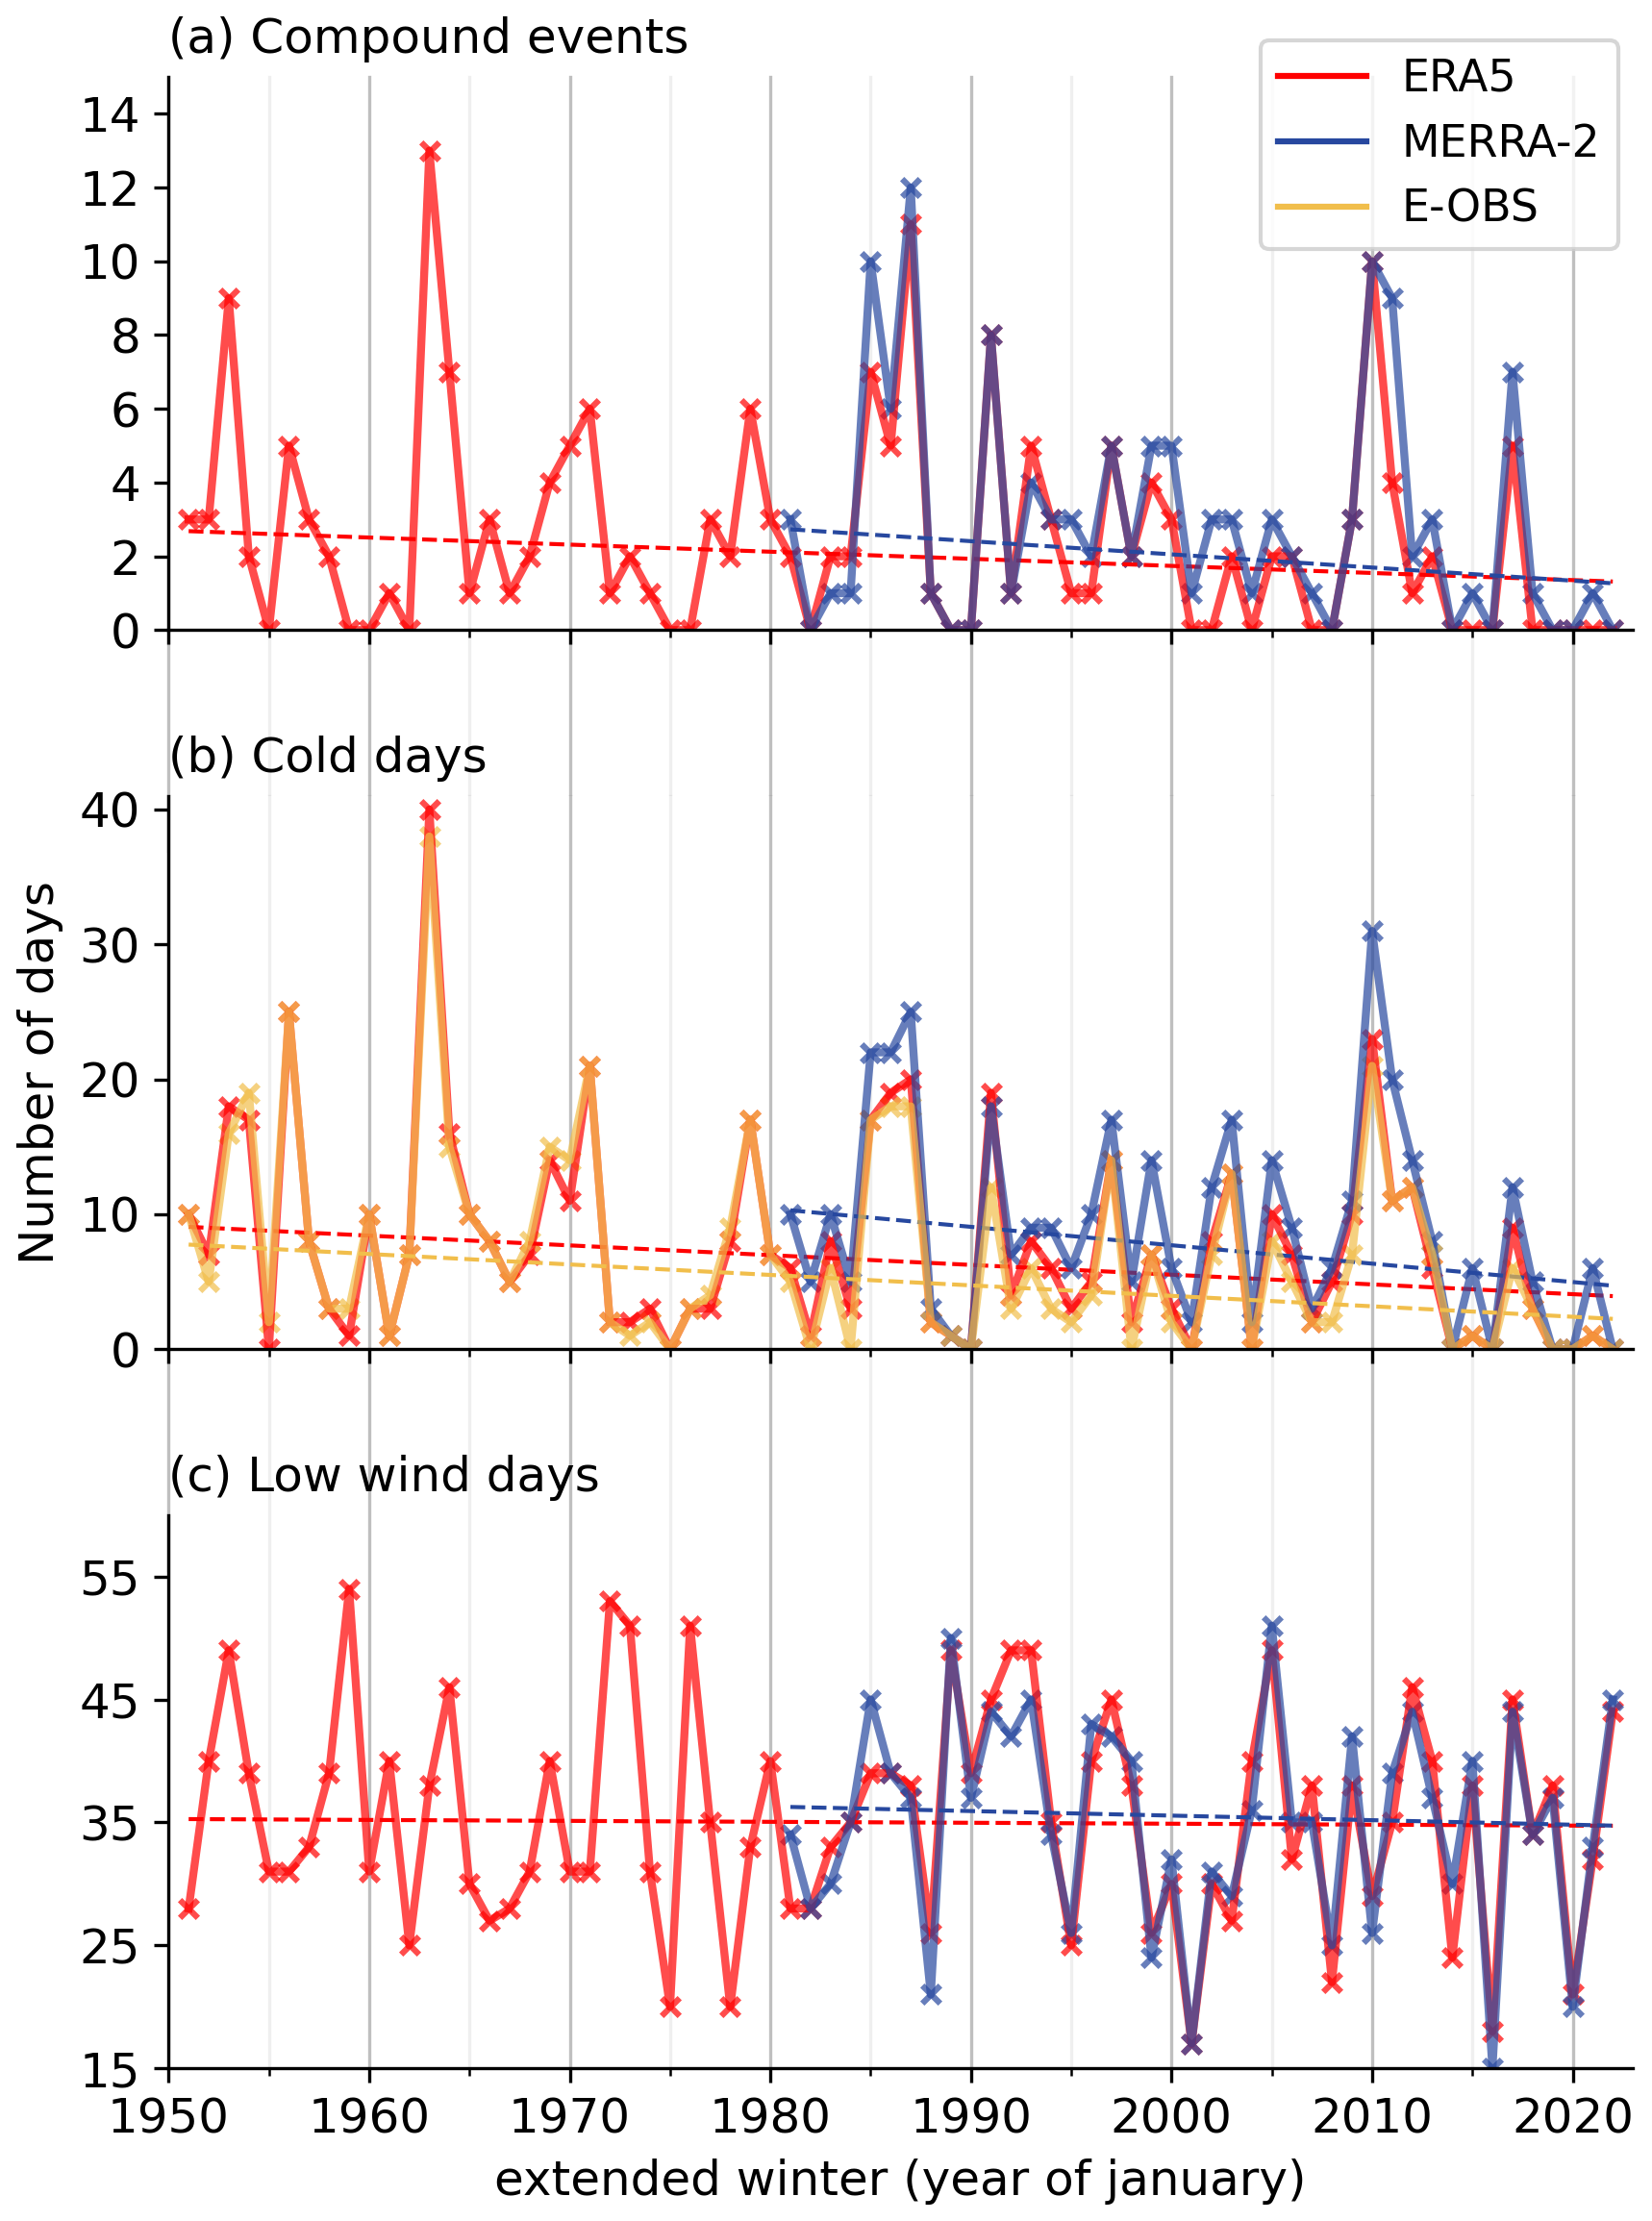
Figure 5Interannual evolution of the number of (a) compound low-wind and cold events, (b) cold days, (c) and low-wind days per winter in the ERA5 (in red; 1951–2022), MERRA-2 (in blue; 1981–2022), and E-OBS (in yellow; 1951–2022) datasets. Dashed lines show the linear trend (calculated with the Theil–Sen estimator; see Table 1 for the slope value and associated significance).
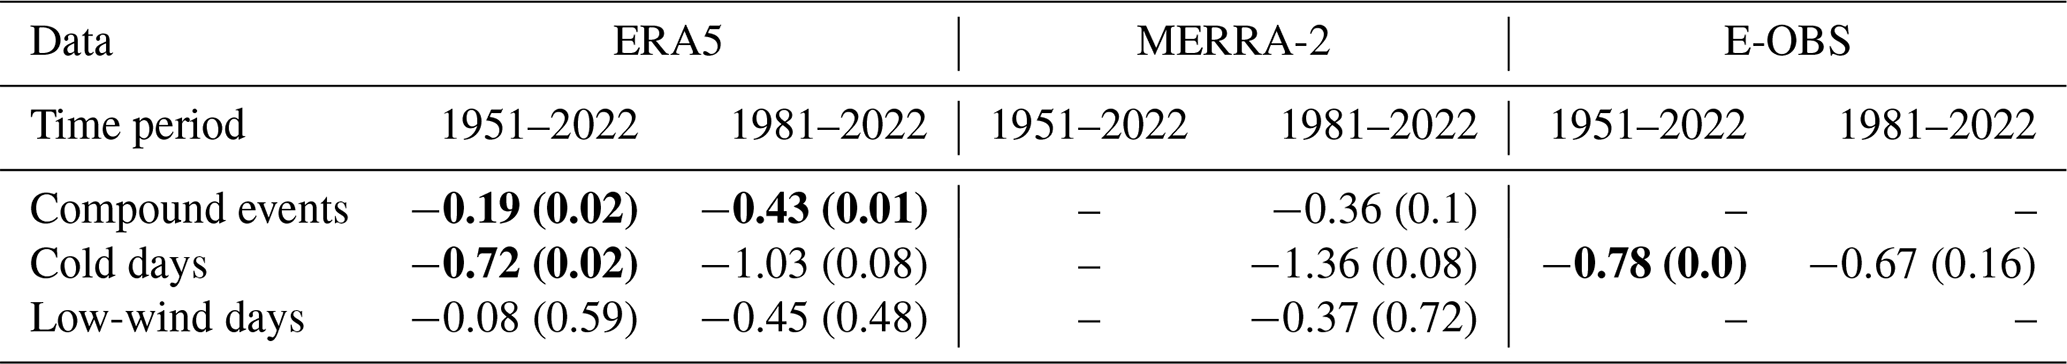
Table 1Trend (slope in days per decade) and associated p value for the number of compound low-wind and cold events, cold days, and low-wind days in ERA5, MERRA-2, and E-OBS over their respective time periods (as indicated in the first row). The slope is calculated with the Theil–Sen estimator and the p value with the Mann–Kendall test. Significant trends with p<0.05 are shown in bold. Cells with “–” correspond to missing data.
Further looking into the year-to-year differences in the number of compound low-wind and cold events, we find substantial interannual variability (Fig. 5a). Some winters stand out as extreme cases, such as 1963, 1985, 1987, and 2010. In particular, the exceptional season of winter 1963 is the most extreme winter, with 13 d of compound events (Fig. 5b). Winter 1963 was the coldest winter ever recorded over western Europe (Hirschi and Sinha, 2007), and our results further show that low-wind days co-occurred with some of these cold days. Overall, there is good agreement between ERA5 and MERRA-2 over the shorter 1981–2022 period. This includes the characterization of the most extreme winters in terms of compound events, although MERRA-2 generally shows a slightly higher number of compound events per winter.
The interannual variability in compound events is primarily driven by the variability in cold days compared to the variability in low-wind days (r= 0.86 and r= 0.19 in ERA5, respectively; Fig. 5a, b). In particular, the highest numbers of compound events are found in years also characterized by the highest numbers of cold days but not necessarily in years with the highest numbers of low-wind days (e.g. 1963, 1987, 2010; Fig. 5a, b, c). This is due to the more extreme threshold applied to the temperature index and therefore the larger sample of low-wind days per winter on average compared to the number of cold days (Sect. 2.5 and sensitivity analyses in the Supplement).
Over the 1951–2022 period, there is a significant decrease in the number of compound events per winter in ERA5 (−0.19 d per decade; Fig. 5a and Table 1). Over the shorter period in common between ERA5 and MERRA-2, compound events also decreased significantly in ERA5 and at a higher rate (−0.43 d per decade). MERRA-2 shows a slightly weaker decrease in compound events (−0.36 d per decade) compared to ERA5, which is not significant at the 0.05 level (p= 0.10). In terms of low-wind days, no trend is detected in ERA5 over both the longer and the shorter periods, and both reanalyses agree on the absence of a trend. Conversely, cold days have significantly decreased over the longer period in both the ERA5 reanalysis and the E-OBS observations and at similar rates of −0.72 and −0.78 d per decade, respectively (Fig. 5b and Table 1). Interestingly, over the shorter period in common with ERA5, MERRA-2, and E-OBS, the significance of the negative trend is lost, suggesting that this period might be too short for the influence of anthropogenic forcings to emerge from internal variability, contrary to what is observed over the longer period.
3.2 Role of large-scale circulation
On average, the synoptic conditions leading to the occurrence of compound low-wind and cold events (i.e. compound low-wind-capacity-factor and cold events) are characterized by strong positive mean sea-level pressure anomalies over the British Isles and less intense negative anomalies centred on the Azores (Fig. 6a). Overall, the average large-scale circulation during compound events is very well spatially correlated with that of cold days (Fig. 6b), but the intensity of the positive anomalies and associated pressure dipole are weaker in the case of compound events. The anomalies in mean sea-level pressure are somehow different during low-wind days compared to compound and cold events. Positive sea-level pressure anomalies are found further south over the North Sea, with relatively low intensity, and the negative anomalies over the Azores are not as clear (Fig. 6c).
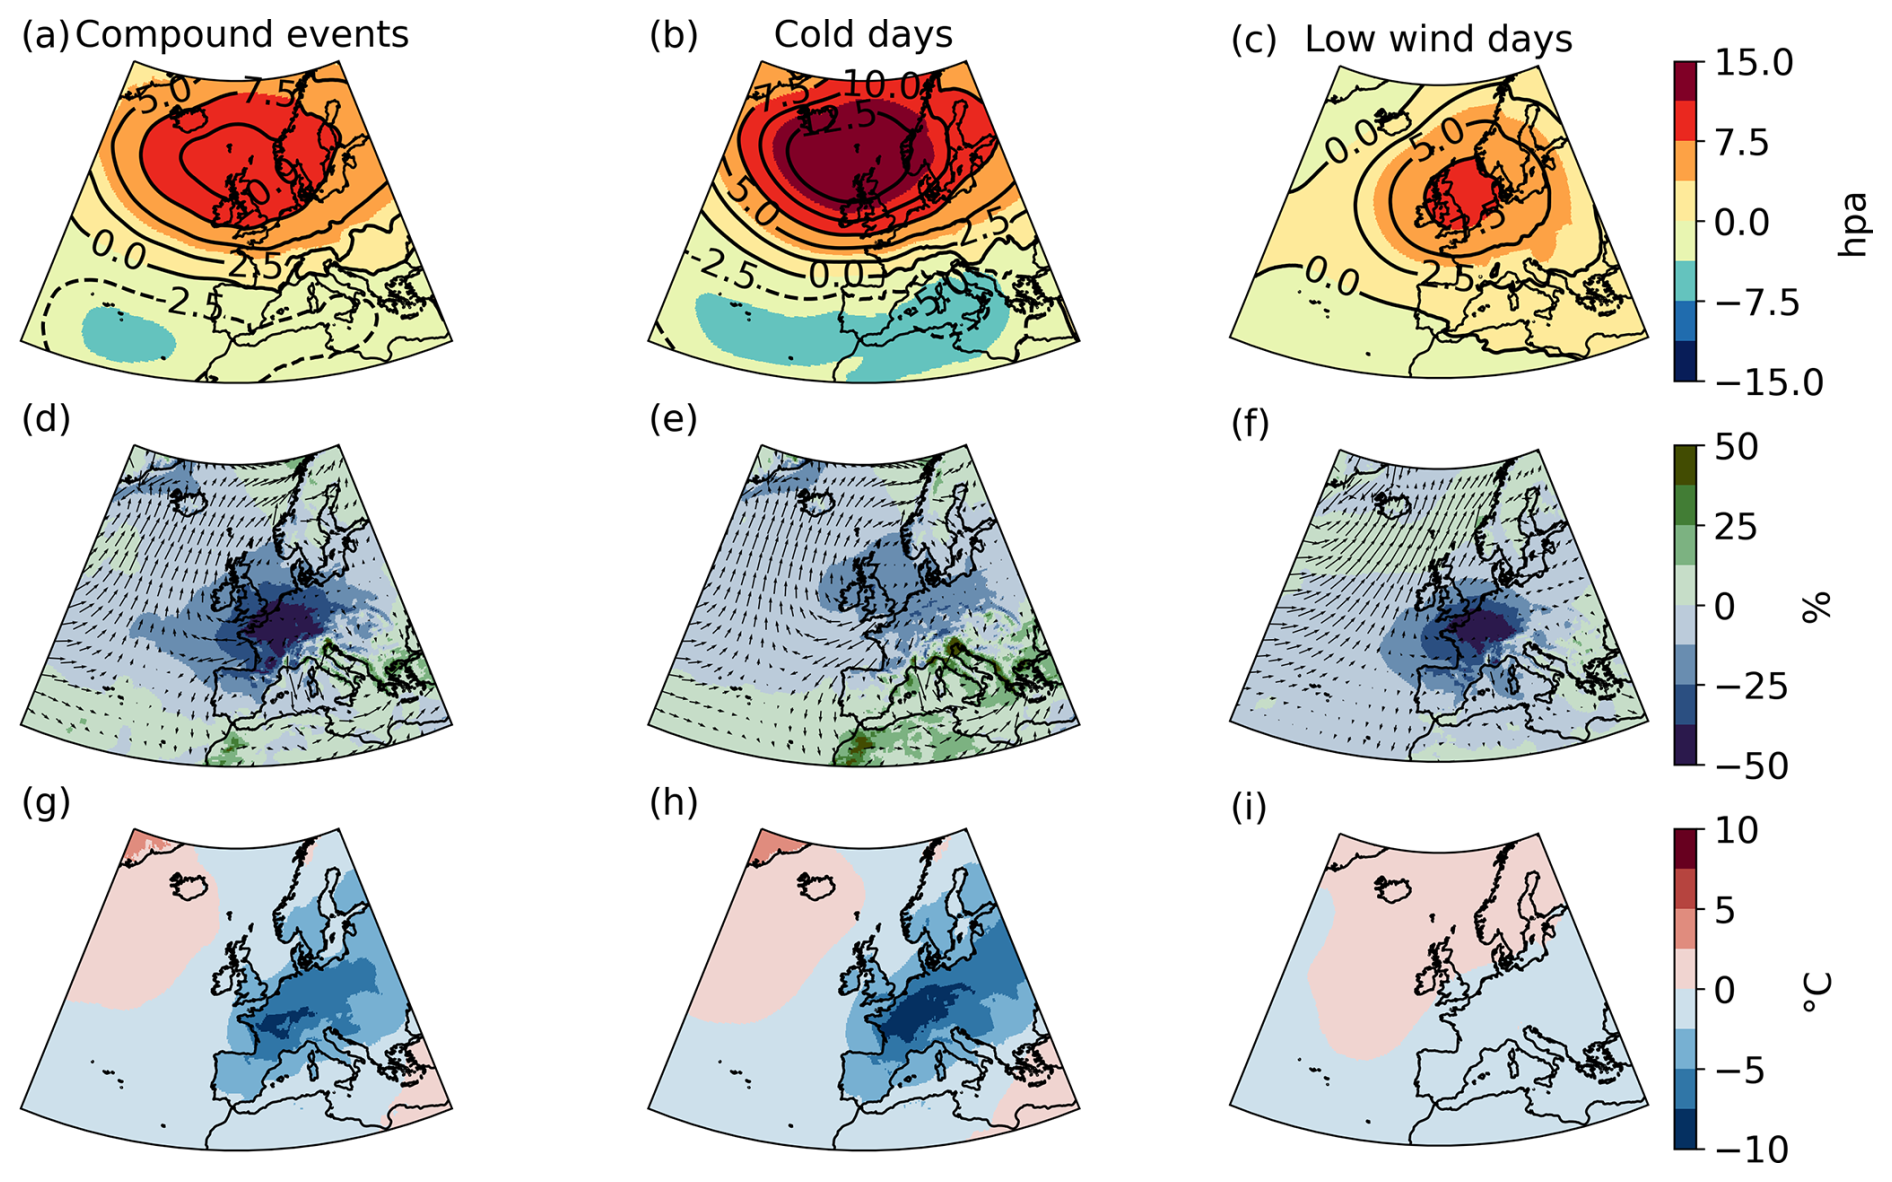
Figure 6Composite of (a, b, c) mean sea-level pressure anomalies (hPa) with solid and dashed contours corresponding to positive and negative anomalies, respectively; (d, e, f) 100 m wind speed relative anomalies (percent of climatological mean; shading) and wind direction (arrow); and (g, h, i) near-surface air temperature anomalies, on average during (a, d, g) compound low-wind and cold events, (b, e, h) cold days, and (c, f, i) low-wind days. Relative anomalies for both the temperature and the 100 m wind speed are calculated with respect to their daily climatology (1950–2022) in ERA5 (smoothed with a 15 d moving average).
On average during the compound events defined for the French electricity system solely, negative anomalies of wind speed and temperature expand over a wider European domain, comprising Germany and the British Isles, with anomalies of up to −40 % and −7.5 °C, respectively (Fig. 6d, g). The negative temperature anomalies over France and surrounding countries are slightly weaker during compound events compared to on cold days (Fig. 6g, h). These cold anomalies are induced by a north-easterly flow advecting cold polar air towards western Europe. During cold days and compared to compound events, the negative anomalies in wind speed are less intense and the advection of cold air is stronger, and thus colder temperatures are experienced over western Europe. During low-wind days, negative wind anomalies are found over western Europe, with intensities rather similar to those during compound events, along with neutral temperature anomalies (Fig. 6f, i). We find greater similarity in the mean sea-level pressure anomalies between cold days and compound events compared to between low-wind days and compound events. This can be explained by a more extreme threshold used for cold days compared to low-wind days in the definition of compound events. Note that the sensitivity to thresholds used in the definition of compound events is documented in the Supplement. While we find that sea-level pressure anomalies between low-wind days and compound events compare better when setting a more extreme threshold for low-wind days in the compound event definition, the main conclusions of this work are generally not sensitive to these thresholds (Fig. S3). It is important to acknowledge that these average climate conditions might hide a variety of different large-scale atmospheric circulations, further explored in the following section using a weather type analysis.
Four weather types (WT1–WT4) are obtained by classifying the mean sea-level pressure during low-wind days using the k-means algorithm (see Sect. 2.6). We then assess the distribution of compound low-wind and cold events across these four weather types to identify the most favourable synoptic situations leading to the occurrence of these compound events in France and over western Europe more generally.
The frequency of weather types of low-wind days is rather similar and ranges from 0.17 (WT4) to 0.32 (WT1). While all four weather types are characterized by low-wind conditions (by definition), interestingly, they are also associated with cold temperatures in France and they reveal a diversity of large-scale atmospheric conditions (Fig. 7):
-
WT1 is characterized by positive mean sea-level pressure anomalies over the Netherlands and northern Germany and negative anomalies over Iceland. The positive anomalies block the entry of the westerlies at the western border of Europe and cause them to deviate further north, thus advecting relatively warm and humid air over northern Europe and inducing a substantial decrease in wind speed along with cold anomalies in France and western Europe.
-
WT2 shares blocking-like characteristics with WT1 but with more intense positive mean sea-level pressure anomalies and over a wider domain extending further west, pushing the negative mean sea-level pressure anomalies further to the north-western corner of the domain. As in WT1, the westerlies are derived north of Europe, inducing a similar dipole of warmer temperatures in the north and colder temperatures under the positive pressure anomalies. In France and southern Europe in general, and compared to WT1, the negative anomalies in wind and temperature are enhanced because of the amplified positive pressure anomalies.
-
WT3 shows pronounced positive mean sea-level pressure anomalies over Iceland and negative anomalies west of Portugal. This WT resembles the average atmospheric conditions during compound events the most (Fig. 6a). The dipole of pressure anomalies results in a strong north to north-easterly flow advecting cold air masses from Scandinavia to France. This weather type is associated with the coldest temperatures over France compared to the other weather types, and generally over the entire European domain, which also experiences low-wind conditions.
-
WT4 is rather different from WT1, WT2, and WT3 as it is characterized by substantial negative mean sea-level pressure anomalies in the eastern Atlantic and positive anomalies over the Norwegian Sea. These pressure anomalies induce low-wind conditions in France and generally the northern part of Europe and a reinforcement of the westerlies in the southern part of the domain. This is associated with colder temperatures in the north, including the northern part of France, and positive or low temperature anomalies in south-western Europe.
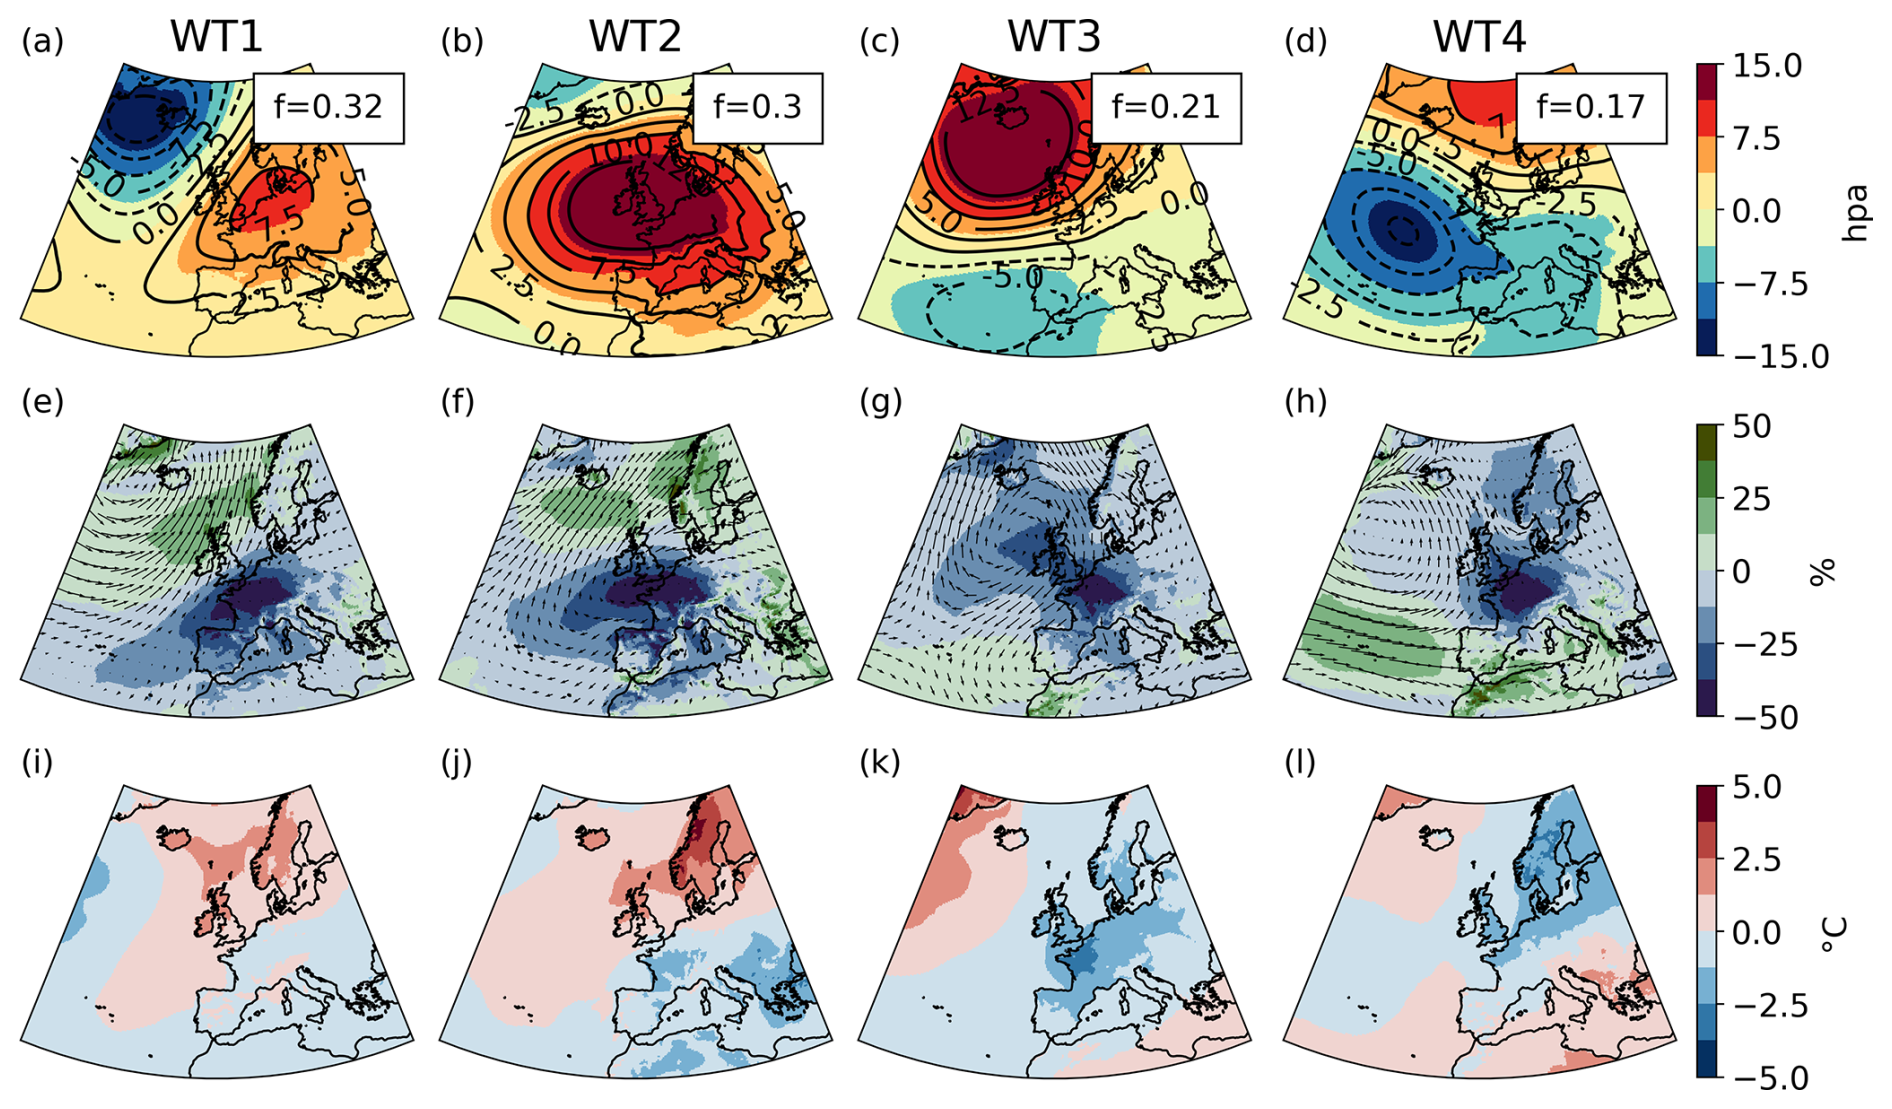
Figure 7Composite of (a, b, c, d) sea-level pressure anomalies (hPa) with solid and dashed contours corresponding to positive and negative anomalies, respectively; (e, f, g, h) 100 m wind speed relative anomaly magnitude (percent of climatological mean; shading) and wind direction (arrows); and (i, j, k, l) near-surface air temperature anomalies corresponding to the weather types of low-wind days: (a, e, i) WT1, (b, f, j) WT2, (c, g, k) WT3, and (d, h, l) WT4. The frequency f of the weather types is shown in the upper-right corner in panels (a)–(d).
Within each weather type, the temperature index shows substantial variability for low-wind days (Fig. 8a). All weather types present very cold days, with anomalies as large as −10 °C for WT1 and WT4 and −14 °C for WT3. WT3 is the coldest weather type, and WT1 is warmer than the others over France. The frequency of compound events when a particular weather type occurs varies from 4 % in WT1 to 12 % in WT3, while WT2 and WT4 present similar values of 7 % and 8 % (Fig. 8b). Importantly, WT3, which is associated with the highest frequency of compound events, also leads to negative anomalies in wind speed and temperature across the majority of Europe (Fig. 7c, g, k). This suggests that this weather type might challenge the electricity system on the larger scale of western Europe.
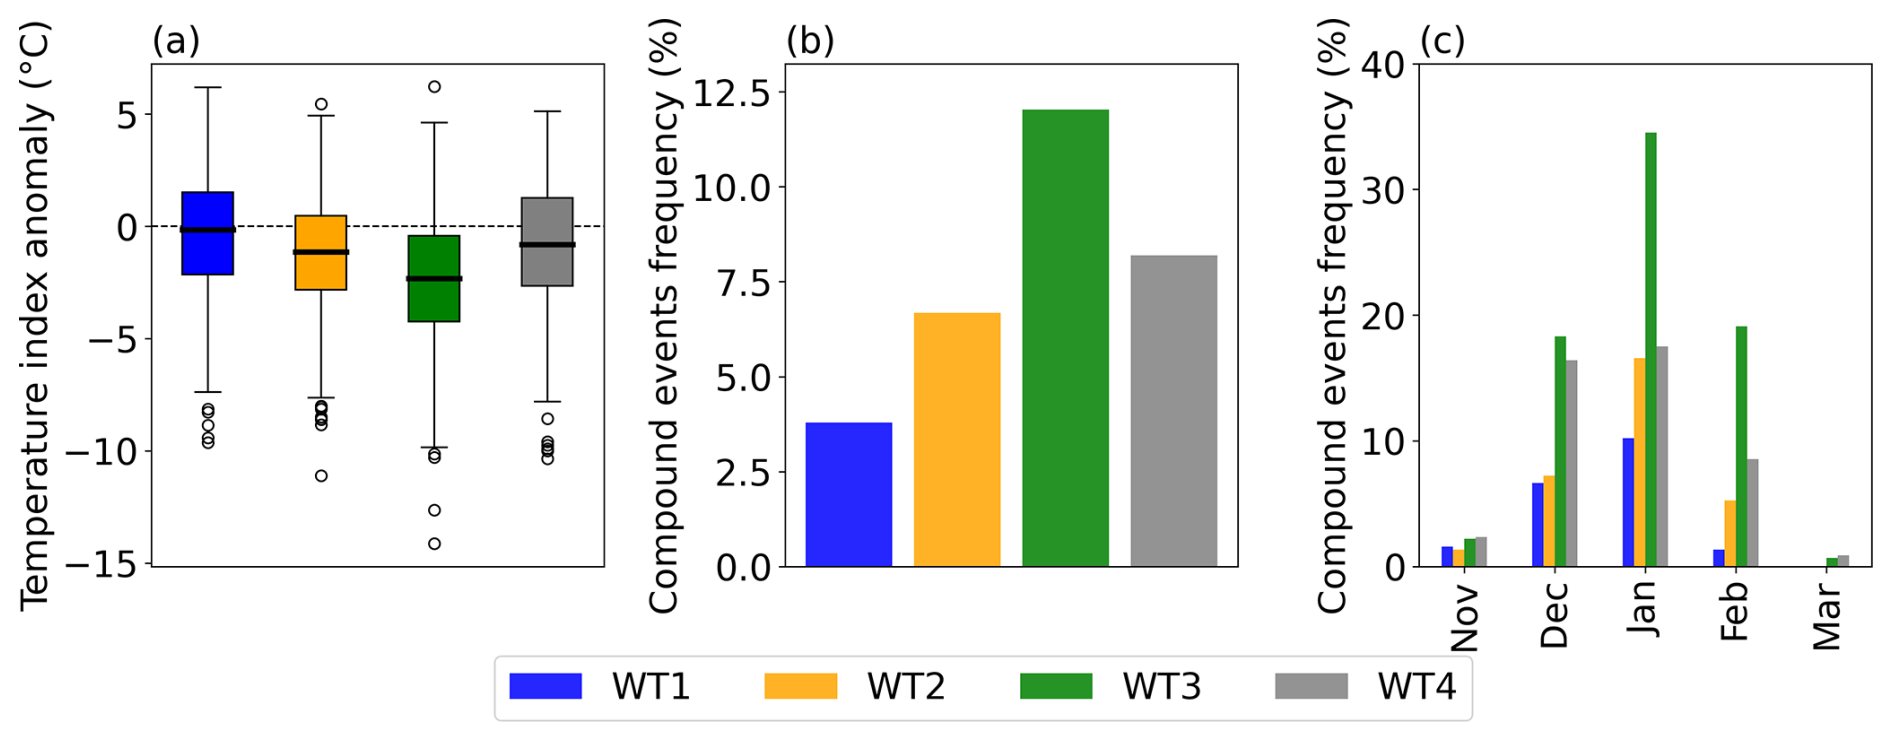
Figure 8(a) Distribution of temperature index anomalies for each weather type of low-wind days (WT; as defined in Fig. 7 and indicated in inserted legend). (b) Frequency of compound low-wind and cold events for each weather type of low-wind days (as a percentage of the weather type size). (c) Frequency of compound low-wind and cold events for each weather type of low-wind days and each individual winter month (as a percentage of the weather type size for a given month). Temperature index anomalies are calculated with respect to the daily climatology (1950–2022) in ERA5 (smoothed with a 15 d moving average).
The frequency of compound events for each weather type shows important monthly variations. For all weather types, the frequency of compound events is higher in January, when the climatological temperature reaches its lowest values, compared to other months (Fig. 8c). This is especially the case for WT3, for which nearly 35 % of days occurring in January are compound events. This important role of the temperature seasonality within each weather type is consistent with the overall seasonality of compound events discussed in Sect. 3.1.
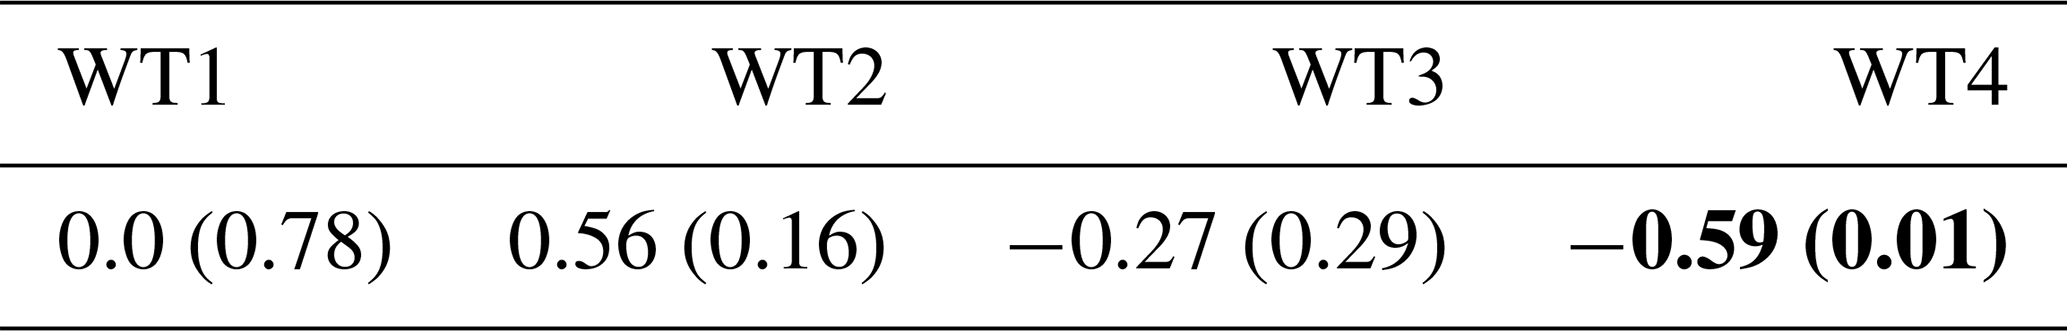
Only the frequency of WT4 shows a significant negative trend over the 1951–2022 period (−0.59 d per decade, p= 0.01; Table 2). The frequency of WT2 is found to increase (+0.56 d per decade), whereas WT3, which is associated with the highest frequency of compound events, decreases (−0.27 d per decade) over the observed period. These trends for both WT2 and WT3 are however not significant.
Table 2Trend (slope in days per decade) and associated p value for the frequency of each weather type of low-wind days (WT; as defined in Fig. 7) in winter over the 1951–2022 period in ERA5. The slope is calculated with the Theil–Sen estimator, and the p value is calculated with the Mann–Kendall test. Significant trends with p<0.05 are shown in bold.
To estimate the contribution of the trends in weather type frequencies to the overall evolution of compound events, trend values are multiplied by the frequency of compound events for each corresponding weather type, as done in Horton et al. (2015). Then the respective contributions from all four weather types are added to estimate the overall influence of the trends in weather type frequencies. This leads to a weak decrease in the frequency of compound events of 20 %. This analysis suggests a relatively minor influence of large-scale circulation on the trend of compound events. However, due to significant intra-type variability, a change in the frequency of a few weather types may not capture the full range of circulation changes.
The dynamical adjustment approach described in Sect. 2.7 is now used to better quantify the role of the atmospheric large-scale circulation in the evolution of compound low-wind and cold events. The interannual variability in the occurrence of both cold days and low-wind days is very well explained by the large-scale circulation (correlations with the corresponding circulation-induced event of 0.80 and 0.85, respectively; Fig. 9a, b). Therefore, the interannual variability in the number of compound events is also well explained by the large-scale circulation (correlations with the circulation-induced compound events of r= 0.64, Fig. 9a). Extreme winters in terms of compound events such as 1963, 1987, or 2010 are due, to a large extent, to the large-scale circulation. Interestingly, circulation-induced cold days substantially decrease (−0.40 d per decade; Table 3), although the p value does not reach the 0.05 significance level (p value = 0.14). Large-scale circulation may therefore have contributed to more than 50 % of the decline in the cold-day occurrence (−0.72 d per decade, Table 3) observed between 1951 and 2022, suggesting that anthropogenic forcing may not be the only driver of this trend. Similarly, circulation-induced compound events show a decrease (−0.14 d per decade, Table 3) over the 1951–2022 period (p value = 0.04). However, both the trend significance and the magnitude of the slope are sensitive to the parameters used in the dynamical adjustment (not shown). Thus, the robustness is too weak to draw conclusions on the role of large-scale circulation in the decrease in compound events. Finally, there is no significant trend in the circulation-induced low-wind days.
Table 3The trend (slope in days per decade, and associated p value) in the frequency of low-wind days, cold days, and compound low-wind and cold events in winter over the period 1951–2022 in ERA5 (first row; same trend estimates as in Table 1) and in their respective circulation-induced events (second row; Sect. 2.7). The slope is calculated with the Theil–Sen estimator, and the p value is calculated with the Mann–Kendall test. Significant trends with p<0.05 are shown in bold.
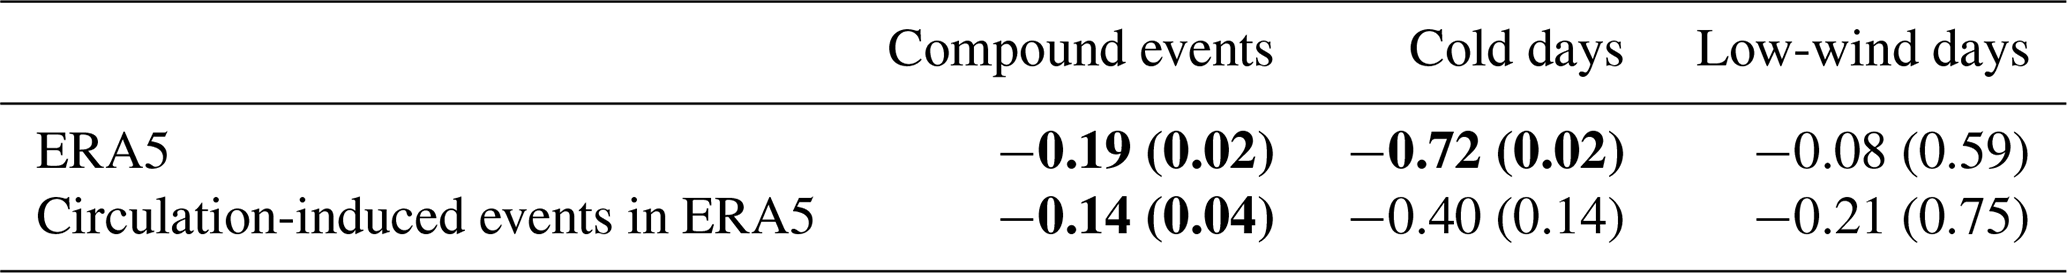
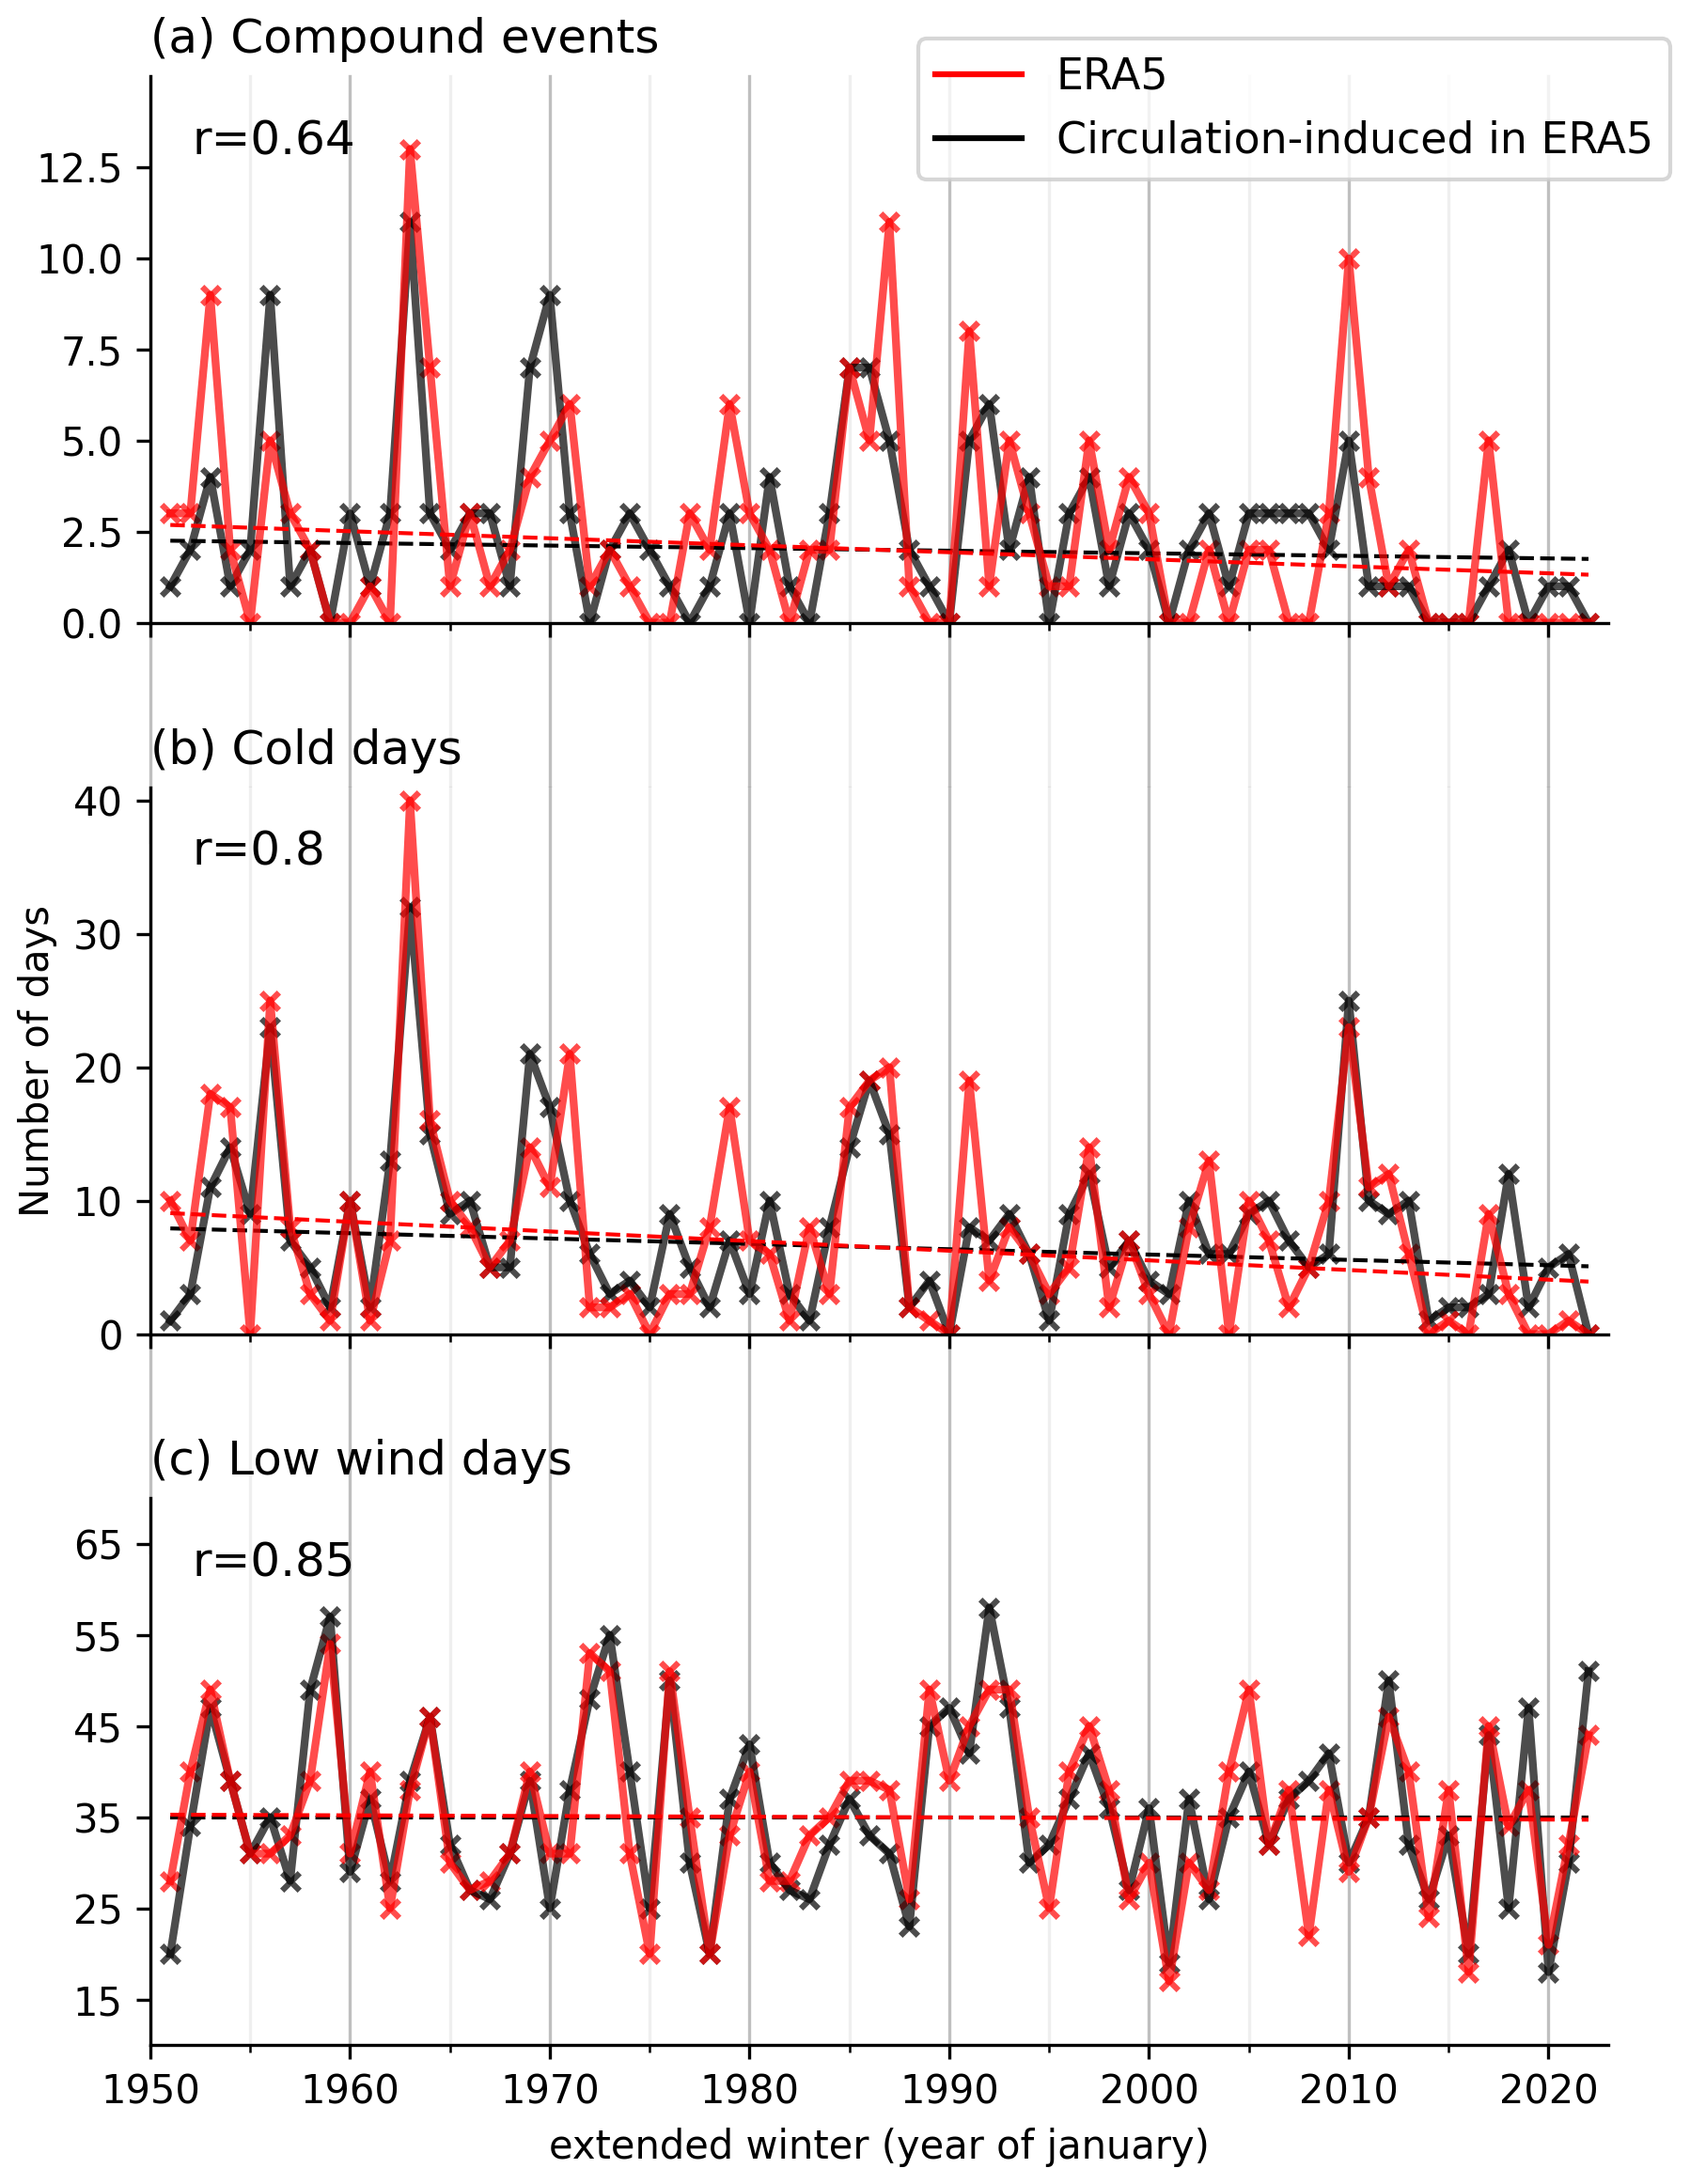
Figure 9Interannual evolution of the number of (a) circulation-induced compound low-wind and cold events, (b) cold days, and (c) low-wind days in winter over the 1951–2022 period in ERA5. For each event, the value of the correlation coefficient between the interannual evolution and its respective circulation-induced evolution is shown in the upper left. Dashed lines show the linear trend (calculated using the Theil–Sen estimator; see Table 3 for the slope value and associated p value).
In the context of energy transition, compound low-wind-capacity-factor and cold events could present a stronger threat to the adequacy of electricity production in meeting demand in France. Therefore, it is crucial to characterize these climate compound events and to better understand how their frequency has changed in the past to better anticipate how they could evolve in the coming decades.
Compound events are defined with ERA5 data over the 1950–2022 period using a wind capacity factor index and a temperature index that captures the current sensitivity of the electricity demand in France to temperature. As compound events mainly occur between November and March, our analyses focus on this period.
Compound events are quite rare (2 d per winter on average), with a peak occurrence in January. They are generally short-lived, with a mean duration of 2 consecutive days, although they can last up to 7 consecutive days. There are large interannual differences in the number of compound events, from 0 to 13 d per winter.
Over the observational record, we find a statistically significant decrease in compound event frequency (−0.19 d per decade) that tends to have been amplified over the last 4 decades. This decrease is likely driven by the significant negative trend in cold days, while the frequency of low-wind days shows no significant trend. Overall, considering the current electricity system, these results suggest a decrease in climate-related risks to the adequacy of electricity supply related to compound events over the observed period.
The role of large-scale atmospheric circulation in the occurrence of compound events is assessed using a set of four weather types derived from the unsupervised k-means classification technique applied to low-wind days. The frequency of compound events for each weather type ranges from 4 % to 12 %. This reveals a diversity of large-scale atmospheric circulations that can lead to the occurrence of compound events in France. The weather type associated with the highest compound event frequency (WT3) presents pronounced positive sea-level pressure anomalies over Iceland and negative anomalies west of Portugal. This weather type leads to negative anomalies of wind speed and temperature throughout Europe, which might pose challenges to the electricity system on a larger scale than just in France. Other studies focusing on compound low-wind and cold events at the scale of Europe also highlight the role of large-scale circulation in compound event occurrence. Bloomfield (2020) and Tedesco et al. (2023) find that pronounced positive mean sea-level pressure anomalies over northern Europe and negative anomalies over the Azores lead to a large number of compound events in central and western Europe, and this circulation pattern projects well onto WT3 of this study. Similarly, Otero et al. (2022b) finds that a particular weather type (called Greenland blocking), which is similar to our WT3, increases the probability of compound events in Europe. This is also true for a second weather type (called European blocking) that projects relatively well onto our WT2. Hence, in this study, we identify large-scale circulation patterns associated with compound events in France that compare broadly with previous findings focused over Europe. There are slight discrepancies in the location of the positive and/or negative anomalies, and these might be partly explained by differences in the particular domain of interest. Other methodological differences such as weather type calculation or the definition of compound events might also explain some differences.
Overall, we find that large-scale atmospheric circulation contributes substantially to the occurrence of compound events and explains an important part of their interannual variability. Interestingly, large-scale atmospheric circulation shows a contribution of approximately 50 % to the observed decrease in cold days over the 1951–2022 period in ERA5. Similarly, Deser and Phillips (2023) found that large-scale circulation has contributed to a third of the mean winter temperature trend in Europe over recent decades. Assuming that observed changes in the large-scale circulation are mainly driven by internal climate variability (Shepherd, 2014), these results suggest that, over the last few decades, climate variability likely reinforced the long-term decline in cold events in response to warming. This may not continue in the near future, potentially leading to a temporary increase in the occurrence of cold events. Finally, we cannot reach a conclusion on the role of large-scale circulation in the decrease in compound events as our methodology exhibits sensitivity to its parameters.
In this study, compound low-wind-capacity-factor and cold events are identified using a straightforward approach that consists of identifying cold days and low-wind-capacity-factor days independently. This has the advantage of allowing the assessment of the relative contribution of cold days and low-wind-capacity-factor days to the decrease in compound events. Another approach consists in identifying compound events as days with high residual load (electricity demand minus wind power production), i.e. days that crucially need availability of power sources other than wind power, such as hydro-electricity or nuclear generation (Bloomfield et al., 2020). Such an approach could help to test the sensitivity of compound events to different power system scenarios (e.g. with different wind power installed capacities).
With the anticipated rapid growth of onshore and offshore wind farms, the impact of low-wind conditions on power system risks is likely to increase and become a greater threat alongside cold temperature conditions. As climate change reduces the frequency of cold events (Seneviratne et al., 2021), future risks to the French power system may be more evenly spread throughout the winter season, rather than being concentrated primarily in January and February as they are currently (RTE, 2023, paragraph 6.2.5.3). In addition, changes in electricity demand patterns are also anticipated. During the summer, increased electricity demand is expected due to higher use of air conditioning in France. However, the risks to the French power system during summer are expected to be limited thanks to higher solar power production and power system flexibilities (RTE, 2023, paragraph 6.2.5.3). How the risks to the adequacy of electricity generation to meet demand associated with compound events will evolve in the next few decades is therefore multifaceted, depending on future levels of installed wind power capacity, changes in demand patterns, and climate change. We plan to address some of these questions in future work using climate projections from the latest Coupled Model Intercomparison Project Phase 6.
Future risks to the electricity system will also depend on the amount of electricity that can be stored to modulate the variability in renewable energy production. In this context, long-lasting compound low-wind and cold events at the European scale will be of particular relevance. The study of such long-lasting events impacting a large domain requires a large sample. The use of the ERA5 reanalysis in this context is therefore not appropriate. An interesting option would be to use state-of-the-art Earth system models, which provide large ensembles of simulations that enable identifying a higher number of long-lasting and high-impact compound events (Bevacqua et al., 2023).
How the occurrence of compound events will continue to evolve in a changing climate is also a crucial question in the context of energy transition. This study lays methodological groundwork for addressing this question. It can also serve as a reference for the evaluation and selection of climate models that could then be used to assess the projections in compound events. In particular, our findings highlight the important role of large-scale atmospheric circulation in driving compound low-wind and cold events in winter in France, and this contribution is therefore a relevant metric for model evaluation in this context.
The ERA5 reanalysis data are available on the Copernicus Climate Data Store (CDS) at https://cds.climate.copernicus.eu/cdsapp#!/dataset/reanalysis-era5- single-levels?tab=overview (Hersbach et al., 2020). The MERRA-2 reanalysis data are available from NASA at https://disc.gsfc.nasa.gov/datasets/M2T1NXLND_5.12.4/summary (Gelaro et al., 2017). The E-OBS gridded in situ observation datasets are provided by the European Climate Assessment & Dataset and are available at https://www.ecad.eu/download/ensembles/download.php (Cornes et al., 2018).
The supplement related to this article is available online at https://doi.org/10.5194/nhess-25-843-2025-supplement.
All authors contributed to the conception and design of the study. Data collection and analysis were performed by FC, MB, and JB. All authors contributed to the interpretation of the results. The first draft of the manuscript was written by FC, MB, and JB, and all authors commented on draft versions of the manuscript. All authors read and approved the final paper.
The contact author has declared that none of the authors has any competing interests.
Publisher’s note: Copernicus Publications remains neutral with regard to jurisdictional claims made in the text, published maps, institutional affiliations, or any other geographical representation in this paper. While Copernicus Publications makes every effort to include appropriate place names, the final responsibility lies with the authors.
The authors would like to thank Laure Coquart for data transfer and preparation and the CERFACS Computer Support Group for maintaining an efficient and user-friendly local computing facility.
This study is part of a PhD project funded by Réseau de Transport d'Électricité (RTE).
This paper was edited by Gregor C. Leckebusch and reviewed by two anonymous referees.
Añel, J., Fernández-González, M., Labandeira, X., López-Otero, X., and De La Torre, L.: Impact of Cold Waves and Heat Waves on the Energy Production Sector, Atmosphere, 8, 209, https://doi.org/10.3390/atmos8110209, 2017.
Bevacqua, E., Suarez-Gutierrez, L., Jézéquel, A., Lehner, F., Vrac, M., Yiou, P., and Zscheischler, J.: Advancing research on compound weather and climate events via large ensemble model simulations, Nat. Commun., 14, 2145, https://doi.org/10.1038/s41467-023-37847-5, 2023.
Bloomfield, H. C., Brayshaw, D. J., and Charlton-Perez, A. J.: Characterizing the winter meteorological drivers of the European electricity system using targeted circulation types, Meteorol. Appl., 27, e1858, https://doi.org/10.1002/met.1858, 2020.
Bloomfield, H. C., Brayshaw, D. J., Deakin, M., and Greenwood, D.: Hourly historical and near-future weather and climate variables for energy system modelling, Earth Syst. Sci. Data, 14, 2749–2766, https://doi.org/10.5194/essd-14-2749-2022, 2022.
Boé, J., Mass, A., and Deman, J.: A simple hybrid statistical–dynamical downscaling method for emulating regional climate models over Western Europe. Evaluation, application, and role of added value?, Clim. Dynam., 61, 271–294, https://doi.org/10.1007/s00382-022-06552-2, 2023.
Cassou, C.: Intraseasonal interaction between the Madden–Julian Oscillation and the North Atlantic Oscillation, Nature, 455, 523–527, https://doi.org/10.1038/nature07286, 2008.
Cattiaux, J., Vautard, R., Cassou, C., Yiou, P., Masson-Delmotte, V., and Codron, F.: Winter 2010 in Europe: A cold extreme in a warming climate, Geophys. Res. Lett., 37, 2010GL044613, https://doi.org/10.1029/2010GL044613, 2010.
Cornes, R. C., Van Der Schrier, G., Van Den Besselaar, E. J. M., and Jones, P. D.: An Ensemble Version of the E-OBS Temperature and Precipitation Data Sets, J. Geophys. Res.-Atmos., 123, 9391–9409, https://doi.org/10.1029/2017JD028200, 2018 (data available at: https://www.ecad.eu/download/ensembles/download.php, last access: 6 November 2023).
Deser, C. and Phillips, A. S.: A range of outcomes: the combined effects of internal variability and anthropogenic forcing on regional climate trends over Europe, Nonlin. Processes Geophys., 30, 63–84, https://doi.org/10.5194/npg-30-63-2023, 2023.
Deser, C., Terray, L., and Phillips, A. S.: Forced and Internal Components of Winter Air Temperature Trends over North America during the past 50 Years: Mechanisms and Implications, J. Climate, 29, 2237–2258, https://doi.org/10.1175/JCLI-D-15-0304.1, 2016.
Falkena, S. K. J., de Wiljes, J., Weisheimer, A., and Shepherd, T. G.: Revisiting the Identification of Wintertime Atmospheric Circulation Regimes in the Euro-Atlantic Sector, Q. J. Roy. Meteor. Soc., 146, 2801–2814, https://doi.org/10.1002/qj.3818, 2020.
Gelaro, R., McCarty, W., Suárez, M. J., Todling, R., Molod, A., Takacs, L., Randles, C. A., Darmenov, A., Bosilovich, M. G., Reichle, R., Wargan, K., Coy, L., Cullather, R., Draper, C., Akella, S., Buchard, V., Conaty, A., Da Silva, A. M., Gu, W., Kim, G.-K., Koster, R., Lucchesi, R., Merkova, D., Nielsen, J. E., Partyka, G., Pawson, S., Putman, W., Rienecker, M., Schubert, S. D., Sienkiewicz, M., and Zhao, B.: The Modern-Era Retrospective Analysis for Research and Applications, Version 2 (MERRA-2), J. Climate, 30, 5419–5454, https://doi.org/10.1175/JCLI-D-16-0758.1, 2017 (data available at: https://disc.gsfc.nasa.gov/datasets/M2T1NXLND_5.12.4/summary, last access: 5 May 2023).
Grams, C. M., Beerli, R., Pfenninger, S., Staffell, I., and Wernli, H.: Balancing Europe's wind-power output through spatial deployment informed by weather regimes, Nat. Clim. Change, 7, 557–562, https://doi.org/10.1038/nclimate3338, 2017.
Hersbach, H., Bell, B., Berrisford, P., Hirahara, S., Horányi, A., Muñoz-Sabater, J., Nicolas, J., Peubey, C., Radu, R., Schepers, D., Simmons, A., Soci, C., Abdalla, S., Abellan, X., Balsamo, G., Bechtold, P., Biavati, G., Bidlot, J., Bonavita, M., Chiara, G., Dahlgren, P., Dee, D., Diamantakis, M., Dragani, R., Flemming, J., Forbes, R., Fuentes, M., Geer, A., Haimberger, L., Healy, S., Hogan, R. J., Hólm, E., Janisková, M., Keeley, S., Laloyaux, P., Lopez, P., Lupu, C., Radnoti, G., Rosnay, P., Rozum, I., Vamborg, F., Villaume, S., and Thépaut, J.: The ERA5 global reanalysis, Q. J. Roy. Meteor. Soc., 146, 1999–2049, https://doi.org/10.1002/qj.3803, 2020 (data available at: https://cds.climate.copernicus.eu/cdsapp#!/dataset/reanalysis-era5-single-levels?tab=overview, last acess: 15 January 2023).
Hirschi, J. J.-M. and Sinha, B.: Negative NAO and cold Eurasian winters: how exceptional was the winter of 1962/1963?, Weather, 62, 43–48, https://doi.org/10.1002/wea.34, 2007.
Horton, D. E., Johnson, N. C., Singh, D., Swain, D. L., Rajaratnam, B., and Diffenbaugh, N. S.: Contribution of changes in atmospheric circulation patterns to extreme temperature trends, Nature, 522, 465–469, https://doi.org/10.1038/nature14550, 2015.
Jourdier, B.: Evaluation of ERA5, MERRA-2, COSMO-REA6, NEWA and AROME to simulate wind power production over France, Adv. Sci. Res., 17, 63–77, https://doi.org/10.5194/asr-17-63-2020, 2020.
Lorenz, E. N.: Atmospheric Predictability as Revealed by Naturally Occurring Analogues, J. Atmos. Sci., 26, 636–646, https://doi.org/10.1175/1520-0469(1969)26<636:APARBN>2.0.CO;2, 1969.
Manwell, J. F., McGowan, J. G., and Rogers, A. L.: Wind energy explained: theory, design, and application, Wiley, New York, ISBN 978-0-470-01500-1, 2010.
Najac, J., Boé, J., and Terray, L.: A multi-model ensemble approach for assessment of climate change impact on surface winds in France, Clim. Dynam., 32, 615–634, https://doi.org/10.1007/s00382-008-0440-4, 2009.
Olauson, J.: ERA5: The new champion of wind power modelling?, Renew. Energ., 126, 322–331, https://doi.org/10.1016/j.renene.2018.03.056, 2018.
Otero, N., Martius, O., Allen, S., Bloomfield, H., and Schaefli, B.: A copula-based assessment of renewable energy droughts across Europe, Renew. Energ., 201, 667–677, https://doi.org/10.1016/j.renene.2022.10.091, 2022a.
Otero, N., Martius, O., Allen, S., Bloomfield, H., and Schaefli, B.: Characterizing renewable energy compound events across Europe using a logistic regression-based approach, Meteorol. Appl., 29, e2089, https://doi.org/10.1002/met.2089, 2022b.
Plaut, G. and Simonnet, E.: Large-scale circulation classification, weather regimes, and local climate over France, the Alps and Western Europe, Clim. Res., 17, 303–324, https://doi.org/10.3354/cr017303, 2001.
Rapella, L., Faranda, D., Gaetani, M., Drobinski, P., and Ginesta, M.: Climate change on extreme winds already affects off-shore wind power availability in Europe, Environ. Res. Lett., 18, 034040, https://doi.org/10.1088/1748-9326/acbdb2, 2023.
Ravestein, P., Van Der Schrier, G., Haarsma, R., Scheele, R., and Van Den Broek, M.: Vulnerability of European intermittent renewable energy supply to climate change and climate variability, Renew. Sust. Energ. Rev., 97, 497–508, https://doi.org/10.1016/j.rser.2018.08.057, 2018.
Raynaud, D., Hingray, B., François, B., and Creutin, J. D.: Energy droughts from variable renewable energy sources in European climates, Renew. Energ., 125, 578–589, https://doi.org/10.1016/j.renene.2018.02.130, 2018.
RTE (Réseau de transport d’électricité): Futurs énergétiques 2050, October, https://rte-futursenergetiques2050.com (last access: 10 February 2025), 2021.
RTE (Réseau de transport d’électricité): Bilan prévisionnel. Futurs énergétiques 2050. 2023–2035: première étape vers la neutralité carbone, https://www.rte-france.com/analyses-tendances-et-prospectives/les-bilans-previsionnels#Lebilanprevisionnel20232035 (last access: 10 February 2025), 2023.
Saffioti, C., Fischer, E. M., Scherrer, S. C., and Knutti, R.: Reconciling observed and modeled temperature and precipitation trends over Europe by adjusting for circulation variability, Geophys. Res. Lett., 43, 8189–8198, https://doi.org/10.1002/2016GL069802, 2016.
Seneviratne, S. I., Zhang, X., Adnan, M., Badi, W.,Dereczynski, C., Di Luca, A., Ghosh, S., Iskandar, I., Kossin, J., Lewis, S., Otto, F., Pinto, I., Satoh, M., Vicente-Serrano, S. M., Wehner, M., and Zhou, B.: Weather and Climate Extreme Events in a Changing Climate, 1st edn., Cambridge University Press, https://doi.org/10.1017/9781009157896, 2021.
Shepherd, T. G.: Atmospheric circulation as a source of uncertainty in climate change projections, Nat. Geosci., 7, 703–708, https://doi.org/10.1038/ngeo2253, 2014.
Sippel, S., Meinshausen, N., Merrifield, A., Lehner, F., Pendergrass, A. G., Fischer, E., and Knutti, R.: Uncovering the Forced Climate Response from a Single Ensemble Member Using Statistical Learning, J. Climate, 32, 5677–5699, https://doi.org/10.1175/JCLI-D-18-0882.1, 2019.
Sippel, S., Fischer, E. M., Scherrer, S. C., Meinshausen, N., and Knutti, R.: Late 1980s abrupt cold season temperature change in Europe consistent with circulation variability and long-term warming, Environ. Res. Lett., 15, 094056, https://doi.org/10.1088/1748-9326/ab86f2, 2020.
Staffell, I. and Pfenninger, S.: Using bias-corrected reanalysis to simulate current and future wind power output, Energy, 114, 1224–1239, https://doi.org/10.1016/j.energy.2016.08.068, 2016.
Tedesco, P., Lenkoski, A., Bloomfield, H. C., and Sillmann, J.: Gaussian copula modeling of extreme cold and weak-wind events over Europe conditioned on winter weather regimes, Environ. Res. Lett., 18, 034008, https://doi.org/10.1088/1748-9326/acb6aa, 2023.
Terray, L.: A dynamical adjustment perspective on extreme event attribution, Weather Clim. Dynam., 2, 971–989, https://doi.org/10.5194/wcd-2-971-2021, 2021.
Thornton, H. E., Scaife, A. A., Hoskins, B. J., and Brayshaw, D. J.: The relationship between wind power, electricity demand and winter weather patterns in Great Britain, Environ. Res. Lett., 12, 064017, https://doi.org/10.1088/1748-9326/aa69c6, 2017.
Van Den Dool, H. M.: Searching for analogues, how long must we wait?, Tellus A, 46, 314–324, https://doi.org/10.1034/j.1600-0870.1994.t01-2-00006.x, 1994.
Van Oldenborgh, G. J., Mitchell-Larson, E., Vecchi, G. A., De Vries, H., Vautard, R., and Otto, F.: Cold waves are getting milder in the northern midlatitudes, Environ. Res. Lett., 14, 114004, https://doi.org/10.1088/1748-9326/ab4867, 2019.
van der Wiel, K., Stoop, L. P., van Zuijlen, B. R. H., Blackport, R., van den Broek, M. A., and Selten, F. M.: Meteorological conditions leading to extreme low variable renewable energy production and extreme high energy shortfall, Renew. Sust. Energ. Rev., 111, 261–275, https://doi.org/10.1016/j.rser.2019.04.065, 2019a.
van der Wiel, K., Bloomfield, H. C., Lee, R. W., Stoop, L. P., Blackport, R., Screen, J. A., and Selten, F. M.: The influence of weather regimes on European renewable energy production and demand, Environ. Res. Lett., 14, 094010, https://doi.org/10.1088/1748-9326/ab38d3, 2019b.
Zscheischler, J., Martius, O., Westra, S., Bevacqua, E., Raymond, C., Horton, R. M., van den Hurk, B., AghaKouchak, A., Jézéquel, A., Mahecha, M. D., Maraun, D., Ramos, A. M., Ridder, N. N., Thiery, W., and Vignotto, E.: A typology of compound weather and climate events, Nat. Rev. Earth Environ., 1, 333–347, https://doi.org/10.1038/s43017-020-0060-z, 2020.