the Creative Commons Attribution 4.0 License.
the Creative Commons Attribution 4.0 License.
 | 13 Feb 2025
Are heavy-rainfall events a major trigger of associated natural hazards along the German rail network?
Sonja Szymczak
Frederick Bott
Vigile Marie Fabella
Katharina Fricke
Heavy-rainfall events and associated natural hazards pose a major threat to rail transport and infrastructure. In this study, the correlation between heavy-rainfall events and three associated natural hazards was investigated using geographic information system (GIS) analyses and random-effects logistic models. The spatiotemporal linkage of a damage database from Deutsche Bahn (DB) Netz AG and the catalogue of radar-based heavy-rainfall events (CatRaRE) from the German Weather Service (DWD) revealed that almost every part of the German rail network was affected by at least one heavy-rainfall event between 2011 and 2021, with 23 % of the flood events, 14 % of the gravitational mass movements, and 2 % of the tree fall events occurring after a heavy-rainfall event. The random-effects logistic regression models showed that a heavy-rainfall event significantly increases the odds of occurrence of a flood (tree fall) by a factor of 22.7 (3.62). We find no evidence of an effect on gravitational mass movements. The heavy-rainfall index and the 21 d antecedent precipitation index were determined to be the characteristics of the heavy-rainfall events with the strongest impact on all three natural hazards. The results underline the importance of gaining more precise knowledge about the impact of climate triggers on natural hazard-related disturbances in order to make rail transport more resilient.
- Article
(2799 KB) - Full-text XML
- BibTeX
- EndNote


Heavy-rainfall events are one of the most important triggers of flash floods, which can have catastrophic effects on the affected regions. A prominent recent example is the flood disaster in western Europe in July 2021, with over 200 fatalities (Kreienkamp et al., 2021). During the period of 12 to 15 July 2021, extreme rainfall occurred in Germany and the Benelux countries (Junghänel et al., 2021; Tradowsky et al., 2023). The resulting flash floods caused considerable damage to infrastructure such as houses (Korswagen et al., 2022), communication facilities, roads, and railway lines (Szymczak et al., 2022), making the event the deadliest European flooding event in nearly 3 decades and the costliest on record (Aon, 2021). Damage to critical infrastructure such as power supply and transportation is of particular concern, as efficient infrastructure is important to ensure that affected regions can be reached and supplied with essential goods even in the event of a disaster.
Fortunately, not every heavy-rainfall event has such catastrophic effects as the example from July 2021. Nevertheless, at the local level, secondary processes triggered by heavy rainfall, such as landslides, flooding, and scouring, can cause significant economic damage (e.g., Kjekstad and Highland, 2009; Lehmkuhl and Stauch, 2022), especially when transport infrastructure is affected (Klose et al., 2014; Winter et al., 2016). If such events occur along transport networks and disrupt traffic and transport, they are documented by the infrastructure operators. However, these damage databases rarely establish a cause–effect relationship; i.e., there is usually no precise information on which climatic or other parameter triggered the damaging event. This is because reactive natural hazard management, i.e., damage repair and rapid restoration of operations, is a higher priority for operators than detailed documentation of the triggering event. Nevertheless, it should not be forgotten that a proactive approach, which includes a detailed analysis of the cause–effect relationship between climatic triggers and resulting natural events, contributes significantly to increasing the long-term resilience of transport infrastructure to natural hazards.
Within the framework of proactive natural hazard management, it is possible to identify regions that are particularly at risk, e.g., by developing hazard indication maps, or to determine climatic thresholds for the triggering of certain processes. Particularly in view of the current climate change situation, the management of climatically induced natural hazards is becoming increasingly important in the transportation sector (Koks et al., 2019). Which natural hazards are particularly relevant depends on the region and the mode of transport. In addition to the climatic conditions of the respective region, special features specific to the mode of transport must also be considered. For example, line closures in rail transport have a significantly higher impact than in road transport due to the lower number of alternative routes, and short-term bypasses of rail lines are associated with a higher logistical and personnel effort (Rachoy and Scheikl, 2006). Likewise, the risk of damage is higher due to the more complex infrastructure, rail-bound driving, longer braking distance, and train length (Mattson and Jenelius, 2015).
In German railroad operations, tree falls, gravitational mass movements, and flood events are particularly common natural hazards that cause operational disruptions (Fabella and Szymczak, 2021). These events can be triggered by a variety or a combination of different factors, but heavy-rainfall events are possible triggers for all of these processes, as could be observed, for example, during the event in July 2021. As an increase in the intensity of daily and especially sub-daily extremes can be expected in a warmer climate (e.g., Lengfeld et al., 2020; Zeder and Fischer, 2020); special attention should be paid by transport operators to precipitation extremes and associated hazards. In our study, we investigate the relationship between heavy-rainfall events and associated natural hazards, such as floods, gravitational mass movements, and tree falls, and their impact on the Germany-wide rail network. For this purpose, we first perform a spatiotemporal linkage of a damage database of DB Netz AG (part of Deutsche Bahn, Germany's largest railroad company) and the catalogue of radar-based heavy-rainfall events (CatRaRE) from the German Weather Service (DWD). This analysis should bring any spatial or temporal bias in the heavy-rainfall events and the investigated natural hazards to light. Secondly, we set up random-effects logistic regression models to explore (1) whether the odds of the occurrence of natural hazards increase significantly with proximity to a heavy-rainfall event and (2) which characteristics of the heavy-rainfall events have the strongest impact on the occurrence of the natural hazards. The logistic regression, although customarily used in data science as a forecasting tool, was used in this study in order to fully explore and shed light on the nuances of the complex relationship between heavy rainfall and natural hazards.
2.1 Datasets
2.1.1 CatRaRE of the German Weather Service (DWD)
In Germany, the DWD has developed the CatRaRE, a catalogue of heavy-rainfall events collected via radar to provide a comprehensive overview of all heavy-rainfall events that have occurred in Germany since 2001 (Lengfeld et al., 2021). Each event is described by various parameters such as time, duration, location, mean and maximum precipitation, and severity indices, as well as meteorological, geographical and demographic information. Strictly speaking, the CatRaRE consists of two catalogues: T5 and W3 (Lengfeld et al., 2021). As no standardized guideline for defining heavy rainfall exists, events for the catalogue were extracted by calculating either (1) their intensity, with warning level W3 (events with 25–40 L m−2 in 1 h or 35–60 L m−2 in 6 h) of the official DWD warning levels used as a threshold (W3 catalogue), or (2) their return period, taking local conditions into account (T5 catalogue). We decided to use the W3 catalogue for our analysis, as it is more suitable for Germany-wide studies because of the uniform threshold for heavy-rainfall events (Lengfeld et al., 2021). As event data from the database of DB Netz AG are only available for the years 2011–2021, only heavy-rainfall events from these years were included in our analysis. A total of 14 275 heavy-rainfall events occurred in these 11 years. Not all of these events are relevant to our study since only 7722 events spatially intersect the German rail network. Throughout the study period, the proportion of events that spatially intersect the rail network remains constant per year at around 50 %. The largest number of events affecting the rail network occurred in 2018 (1160) and the lowest in 2012 (454) (Fig. 1a). According to Lengfeld et al. (2021), 2018 belongs to the years with the highest number of heavy-rainfall events over the entire observation period (2001–2021). The monthly distribution shows a clear seasonal pattern, with the majority of events (5682, 73.6 %) occurring in summer (JJA; see Fig. 1b). In addition, many events occurred in May and September, while heavy-rainfall events were rare during winter. This is consistent with the distribution over the entire period of 2001–2021, as May–August are the most eventful months here (Lengfeld et al., 2021).
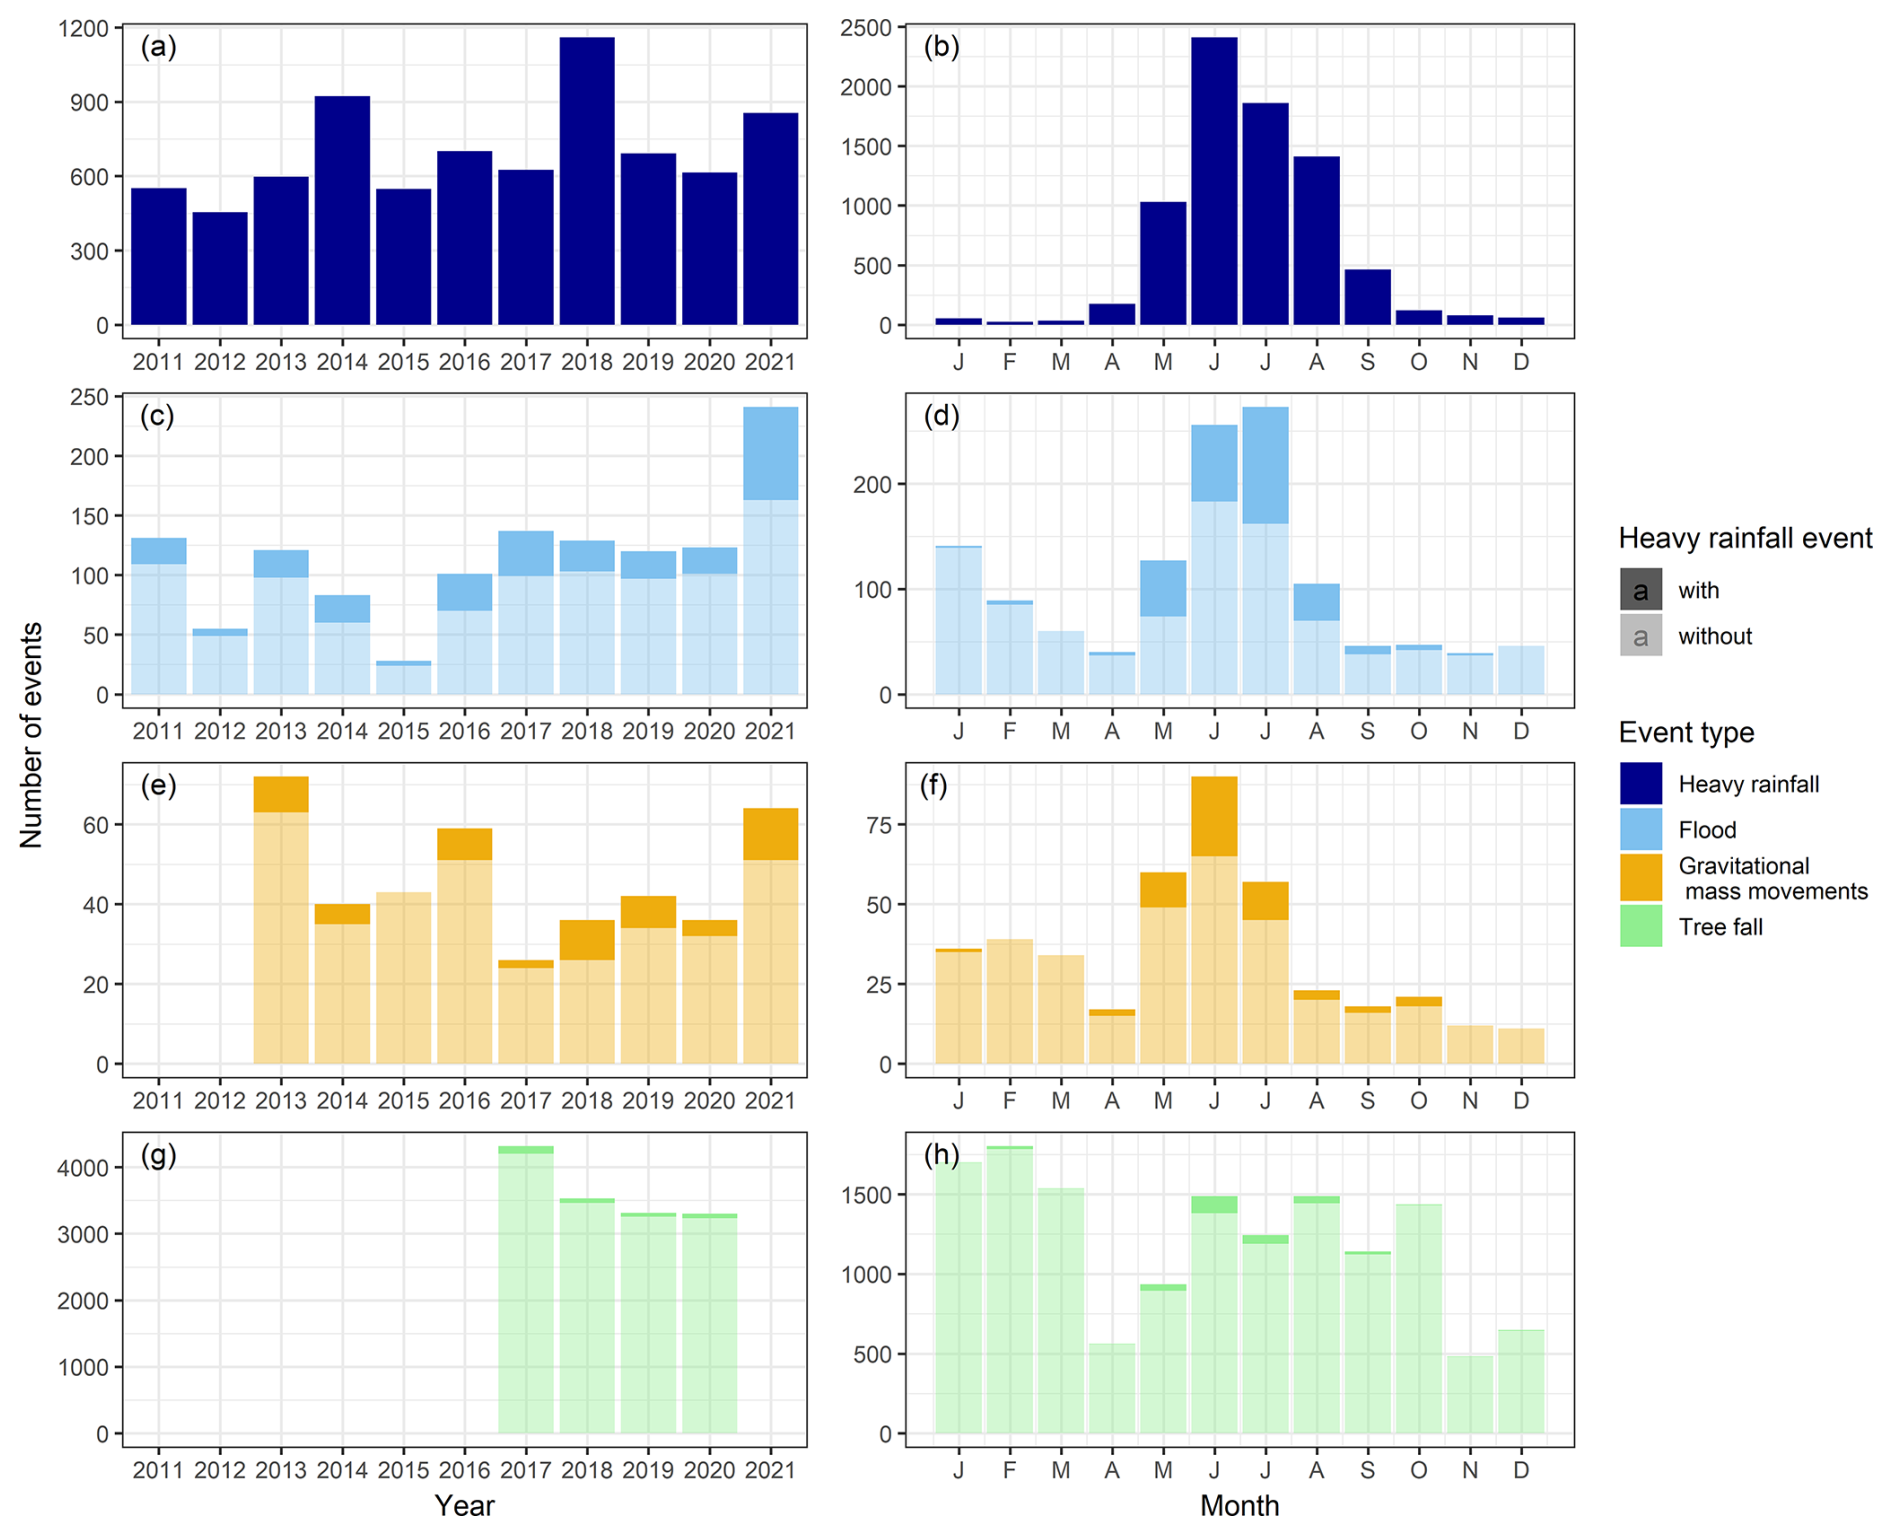
Figure 1Monthly and yearly distribution of heavy-rainfall events (data source – CatRaRE) that spatially intersected the German rail network, and gravitational mass movement, flood, and tree fall events along the German rail network that were recorded by the damage database of DB Netz AG. The darker areas of the bars in panels (c–h) include the events where a heavy-rainfall event occurred up to 2 d prior to the event.
The spatial distribution of all heavy-rainfall events that spatially intersected the German rail network is shown in Fig. 2. The spatial references used for this analysis were the track sections defined by the GIS layer geo-strecke provided by DB Netz AG, resulting in a total of 15 939 track sections. The events are distributed over all regions of Germany, with a focus on southern Germany (the federal states of Bavaria and Baden-Wuerttemberg). Over the 11-year period, there are very few track sections (437) that were not affected by at least one heavy-rainfall event, while most of the pre-alpine railway lines in southern Germany were affected by more than 30 events. However, the Starkregenindex (SRI), an index describing the speed at which rainfall accumulates within a specified duration of time, of these events is in general lower. The highest mean SRI values are recorded in the northern part of Germany, mainly in the federal state of Lower Saxony.
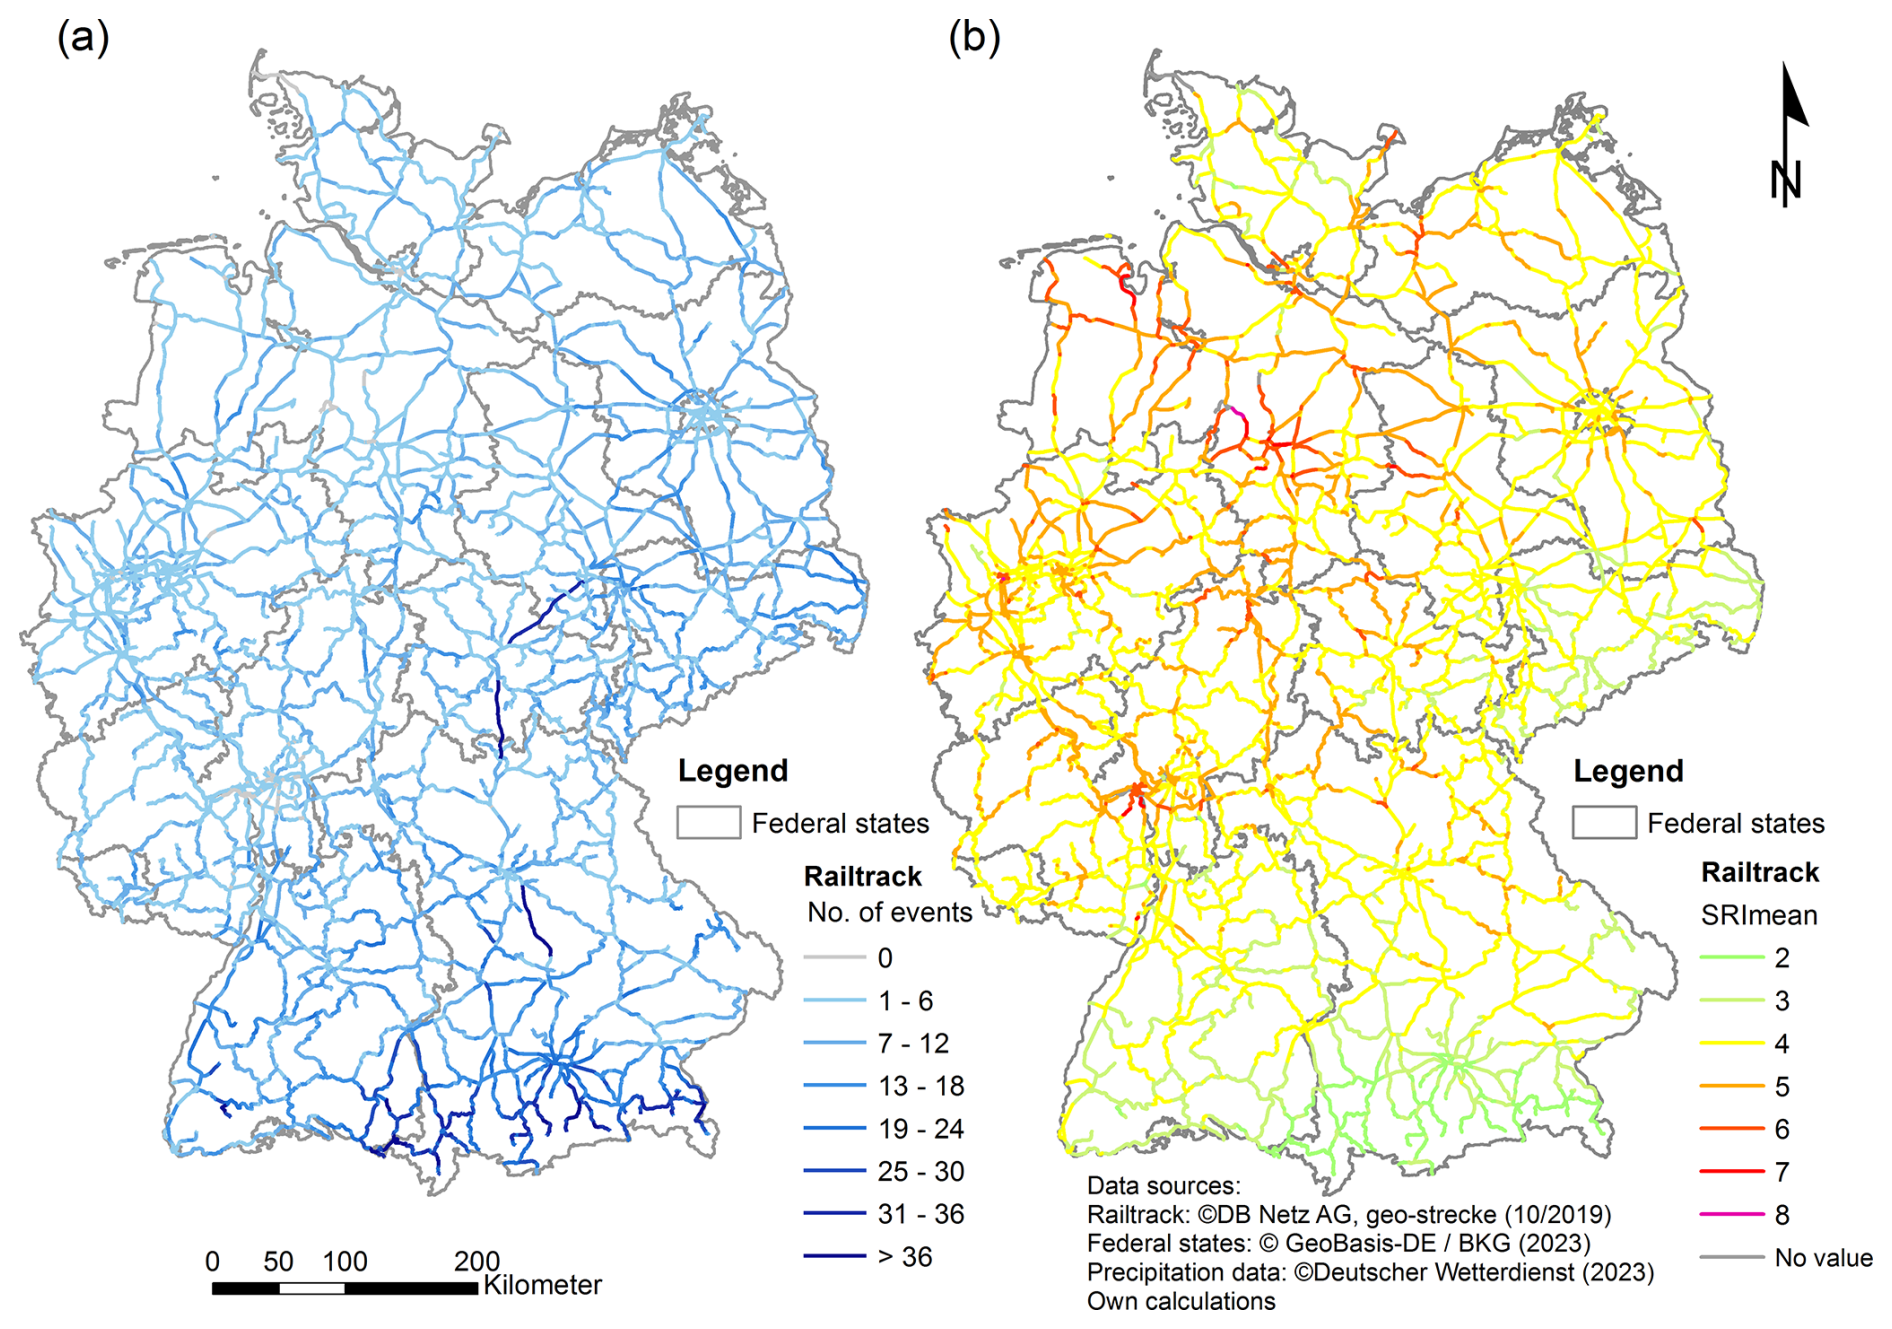
Figure 2Spatial intersection of heavy-rainfall events from the CatRaRE and the German rail network for the time period of 2011–2021. (a) Number of events per track section. (b) Mean SRI values (Starkregenindex, for definition refer to Table 1) for all events per track section. The SRI is calculated for every heavy-rainfall event and ranges from 0 to 12. Note that in this figure the mean values for several events are shown, limiting the resulting SRI values to the range of 2 to 8. Data sources – geo-strecke 10/2019 DB Netz AG (rail network), GeoBasis-DE/BKG 2023 (federal states), and Deutscher Wetterdienst (heavy-rainfall events).
2.1.2 Damage database for the German rail network
The event data of the natural hazards along the German rail network were extracted from the damage database of DB Netz AG. In the database, each disruption along the rail infrastructure is documented with a time stamp, the event location, and a short event description. As this database and data collection are not restricted to natural-hazard-specific incidents, the events relevant to this study were filtered using an extended text search with event-specific search terms and then checked manually for correctness and double notification. This procedure cannot verify that all events were actually extracted from the database (completeness) and that there are no false negatives, as the textual descriptions do not follow a fully consistent categorization and thus all keywords may not have been correctly identified. However, the two-step extraction with subsequent manual control of the data ensures the correctness of the data insofar as there are no false positives, and no events are contained in the database export due to incorrect assignment. The distribution of false negatives is assumed to be fairly even throughout the study period due to the invariant methods of data collection and filtering.
In the following, the three resulting sub-databases for flood events, gravitational mass movements, and tree falls are briefly described. The flood dataset contains in total 1269 events for the period of 1 January 2011–31 December 2021, which include, but are not further categorized into, river floods or local flash floods. The most eventful years were 2021 (241), 2017 (137), 2011 (131), and 2018 (129), while the least eventful years were 2012 (55) and 2015 (28) (Fig. 1c). Flood events occurred mainly between May and August, with a high concentration in June and July, but also in January (Fig. 1d). In contrast, they were rare between September and December. The gravitational mass movement dataset includes a total of 418 events for the period of 1 January 2013–31 December 2021, with the most eventful years being 2013 (72), 2021 (64), and 2016 (59) and the least eventful being 2018 and 2020 (36 each) and 2017 (26) (Fig. 1e). The monthly distribution showed a concentration of events between May and July and a second, smaller peak between January and March (Fig. 1f). The tree fall dataset includes a total of 14 461 events for the period of 1 January 2017–16 December 2020. The most eventful year was 2017 (4319), and the least eventful was 2020 (3301) (Fig. 1g). However, as the last 15 d of the year are missing in 2020, it is also possible that 2019 is the least eventful year (3310). The seasonal distribution of tree fall events is not as pronounced as that of the other two processes. Tree fall events occurred mainly between January and March, as well as between June and October (Fig. 1h).
2.1.3 Explanatory control variables
Additional climatological and hydrometeorological variables related to the natural hazards investigated were used to serve as explanatory control variables and to check for other relationships in the statistical regression analysis. These variables were derived from publicly available datasets provided by the DWD. Daily precipitation values were used from gridded observational datasets of precipitation provided by the HYRAS dataset (Razafimaharo et al., 2020): HYRAS stands for hydrometeorological raster data. This dataset is based on precipitation measurements for Germany and its neighboring countries and interpolates them into 5 km × 5 km grids, taking into account topographic and other effects. Daily values of soil moisture were used from a 1 km × 1 km grid developed by the DWD for agrometeorological applications. These values are interpolated from soil moisture at 60 cm in depth under grass at a fixed selection of stations (Löpmeier, 1994). Also included was the hazard indication map for slope and embankment landslides along the German rail tracks that is provided by the German Centre for Rail Traffic Research at the Federal Railway Authority, which is modeled based on the geology, morphology, and land use characteristics of the area surrounding the rail tracks (Kallmeier et al., 2018).
2.2 Methods
2.2.1 Intersection of heavy-rainfall events and events from the damage database
The analysis of the spatial and temporal relationship between the heavy-rainfall events and damage events along the German rail network was carried out by combining the CatRaRE polygon data provided by the DWD and the compiled railway damage database. First, the spatial intersection was carried out using the GIS software ArcMap version 10.8.1. In ArcMap, the floods, gravitational mass movements, and tree falls, which are available as point information, were combined with the CatRaRE heavy-rainfall events (W3 catalogue) between 2011 and 2021, which are available as area polygons, using the tool spatial join. In the process, multiple join features (heavy-rainfall events) were assigned to each target feature (damage event (join one to many)). This creates a database in which all spatially overlapping heavy-rainfall events are assigned to the damage events. Thus, there are event locations where more than 50 heavy-rainfall events from 2011 to 2021 can be found.
A heavy-rainfall event can only be considered a trigger for a damage event if the heavy-rainfall event occurs directly or shortly before the damage event. As a heavy-rainfall event is usually an event of short duration and high intensity, in general the time lag between trigger and effect is rather short (e.g., shown for shallow landslides by Zêzere et al., 2015, and for landslides during summer by Rupp, 2022). However, heavy-rainfall events often occur during weather conditions that lead to clusters of rainfall events, so the occurrence of several heavy-rainfall events in succession can also be a possible cause (e.g., shown for deep landslides by Bevacqua et al., 2021, and for tree fall by Locosselli et al., 2021). As there is no generally accepted threshold, we have chosen in our study to consider all heavy-rainfall events that occurred up to 2 d before the damage event. This considers possible inaccuracies in the DB damage database, as the date in the damage database represents the time when the event was recorded. This does not necessarily coincide with the actual occurrence of the event, as, for example, events that occur at night are often not recorded until the following day during the first train journey of the day. Furthermore, the selected time period was supported by an analysis of the natural breaks in the dataset. The selection of the events was conducted by temporal intersection using the function datediff in ArcMap. Since both the damage events and the heavy-rainfall events have a day-accurate time stamp, the difference in days between the start of the heavy-rainfall event and the occurrence of the damage event was identified.
2.2.2 Extraction of explanatory control variables
The corresponding values from the explanatory control variables daily precipitation, daily soil moisture, and hazard class of landslide risk were extracted from the gridded data at the location and, when applicable, for the date of the event occurrence using the Geospatial Data Abstraction Library (GDAL) and One Git library to Rule (OGR) in Python.
2.2.3 Statistical analysis and modeling
For the statistical investigation, a panel data analysis, as well as a cross-sectional analysis, was carried out. The panel data analysis was conducted to test whether the odds of the occurrence of natural hazards are affected by a heavy-rainfall event and whether the odds increase with proximity to a heavy-rainfall event. Panel data allow us to consider observations over several points in time, which is crucial for measuring the temporal proximity to a heavy-rainfall event at a route segment. Therefore, it is possible to compare the effects of heavy-rainfall events that occur at different times before a natural hazard event, e.g., 2 d before, 1 d before, or on the same day. The cross-sectional analysis was conducted to examine which characteristics of a heavy-rainfall event have the strongest effect on natural hazard occurrence. In cross-sectional analyses, each observation is only considered at a single point in time.
Panel data analysis
For the panel data analysis, the dataset was created with the route segments as the cross-sectional unit and the day as the time series unit. A route segment is defined as a section of the German rail network between two adjacent operating points. The total length of the German rail network owned by DB is 56 939 km of tracks and was divided into 9679 route segments for our dataset. The segments differ in length between 140 m and 12.7 km, with an average length of 3.4 km. Route segments were chosen as the cross-sectional unit as they are the smallest operational unit used by DB that can represent the complete rail network. On the other hand, the number of route segments still allows for a tractable dataset size that does not inflate the calculation times in the statistical analysis compared to, for example, taking 5 m segments across the entire network. The period under consideration was the years between 2011 and 2021 for each route segment, and we tested whether a heavy-rainfall event had occurred or not. To calculate 30 d antecedent precipitation (one of the control variables) for each day and route segment, we began with the period starting on 1 February 2011, so the complete dataset is available for 3987 d (i.e., time series units), resulting in a total of 38 590 173 route segment–day combinations, hereafter referred to as observations. The number of observations used in the following models varies depending on the available time period of the natural hazard event datasets.
Each observation was spatially combined with the CatRaRE and the explanatory control variables based on the coordinates of the segment's starting point. The segment is considered to have been affected by a heavy-rainfall event on a given day if a heavy-rainfall event from the CatRaRE database occurred on that day or up to a maximum of 2 d previously. This is then indicated by a binary variable. The flood, gravitational mass movement, and tree fall events from the DB damage database were matched to route segments based on their reported route number and kilometer. A natural hazard event can affect more than one route segment. A binary variable was then created for each natural hazard event, which takes the value of 1 if the respective event was reported on the route segment on that day and 0 otherwise.
To test if the odds of the occurrence of natural hazards increase with proximity to a heavy-rainfall event, a random-effects logistic regression (logit) model was used. Although the logit approach is conventionally used in forecasting, it can also be applied to questions of inference, as in this case, where it is used to elucidate the effect of heavy rain on the occurrence of natural hazards. Taking to be the probability that a natural hazard event occurs (where Y is a flood, gravitational mass movement, or tree fall), the relationship between this probability p and a heavy-rainfall event (HR) was modeled using a logit link function, such that
where x is a vector of explanatory control variables, z is a vector of seasonal and yearly dummy variables, and (HR⋅x) is the interaction between heavy rainfall and the control variables. The parameters β0, β1, , β3′, and β4′ are the corresponding scalar and vector coefficients. The vector of controls x contains the following variables:
To account for the potential non-linear effect of soil moisture on the incidence of natural hazards due to the non-linear relationship between soil water content and soil matrix potential (Rawls et al., 1993; Zhu et al., 2022; Vichta et al., 2024), we include the square of daily soil moisture in x. Season and year dummy variables are included as the vector z to control for seasonal effects and effects caused by particular years with climactic extremes, as well as to account for the fact that the number of natural hazards varies greatly in different years and seasons. To test whether there are interaction effects between the control variables and heavy-rainfall events, the following interaction terms are added to Eq. (1): daily precipitation ⋅HR, 30 d accumulated precipitation ⋅ HR, daily soil moisture ⋅ HR, and (daily soil moisture)2 ⋅ HR.
The logit function in Eq. (1) is simply the natural log of the odds, that is, the natural log of the probability that a natural hazard event occurs (p) divided by the probability that it does not occur (1−p). The basis of interpretation of the model lies in its exponential form, which results in the odds on the left-hand side of the equation:
Taking HR to be a binary variable with a value of 1 when heavy rainfall occurred in the last 2 d and 0 otherwise, then the odds ratio (OR) between the heavy-rainfall and no-rainfall events becomes
If indeed a heavy-rainfall event increases the odds of a natural hazard event occurring, then the numerator of the odds ratio should be greater than the denominator; hence the odds ratio should exceed 1. Note that the odds ratio will depend on the value of the control variables that are interacting with HR.
To test if the odds of a natural hazard event increase the closer it occurs to days with heavy-rainfall events, a second logistic regression model similar to Eq. (1) was also estimated:
where DHR takes the form of a vector of dummy variables representing the number of days after the heavy rainfall occurred,
and are the corresponding parameter coefficients. Since interaction effects are already tested in the first model, interaction terms have been removed in this model for simplicity. The assumption that the odds of an event increase the closer it is in time to a heavy-rainfall event is confirmed when the odds ratios follow the order , where
with d−1 as the reference category representing no heavy rainfall in the last 2 d.
Given the panel structure of the data, observations from the same route segment may be correlated with each other. To overcome this issue, the models described in Eqs. (1) and (2) were extended to include a random variable μi representing the unobserved individual heterogeneity of each route segment i. The final models are therefore
where the subscript t identifies the days in the sample that differ based on the type of natural hazard (4011 d for floods, 3280 d for gravitational mass movement, and 1461 d for tree fall). The parameters of the random-effects models are estimated using maximum likelihood. Given that all the explanatory variables in the models (HRit, DHRit, and xit) are exogenous meteorological factors, the individual-specific component μi is expected to be uncorrelated with all the regressors in the models. The variable μi therefore represents the random effect for route segment i, which is typically assumed to be independently and identically distributed across route segments following a normal distribution ). Higher variance indicates a higher correlation between two observations within the same route segment.
Cross-sectional analysis
Since heavy-rainfall events differ considerably in intensity, duration, and other features, a cross-sectional analysis was used to test which of these characteristics influence the occurrence of a natural hazard event. The cross-sectional dataset contains only those route segments hit by at least one heavy-rainfall event between 2011 and 2021. This resulted in a total number of 9339 route segments, of which 8589 were affected more than once during the 11-year period, on average about 5 times. Each combination of route segment and heavy-rainfall event is considered a separate observation in the cross-sectional dataset. From the panel dataset, we can determine whether a natural hazard event occurred during and up to 2 d after a heavy-rainfall event on this specific route segment. For each heavy-rainfall event, several characteristics are available in the CatRaRE, of which a selection was used in this study (Table 1).
Table 1Abbreviations and descriptions of the characteristics of heavy-rainfall events in the CatRaRE that were used for the analysis in this study.
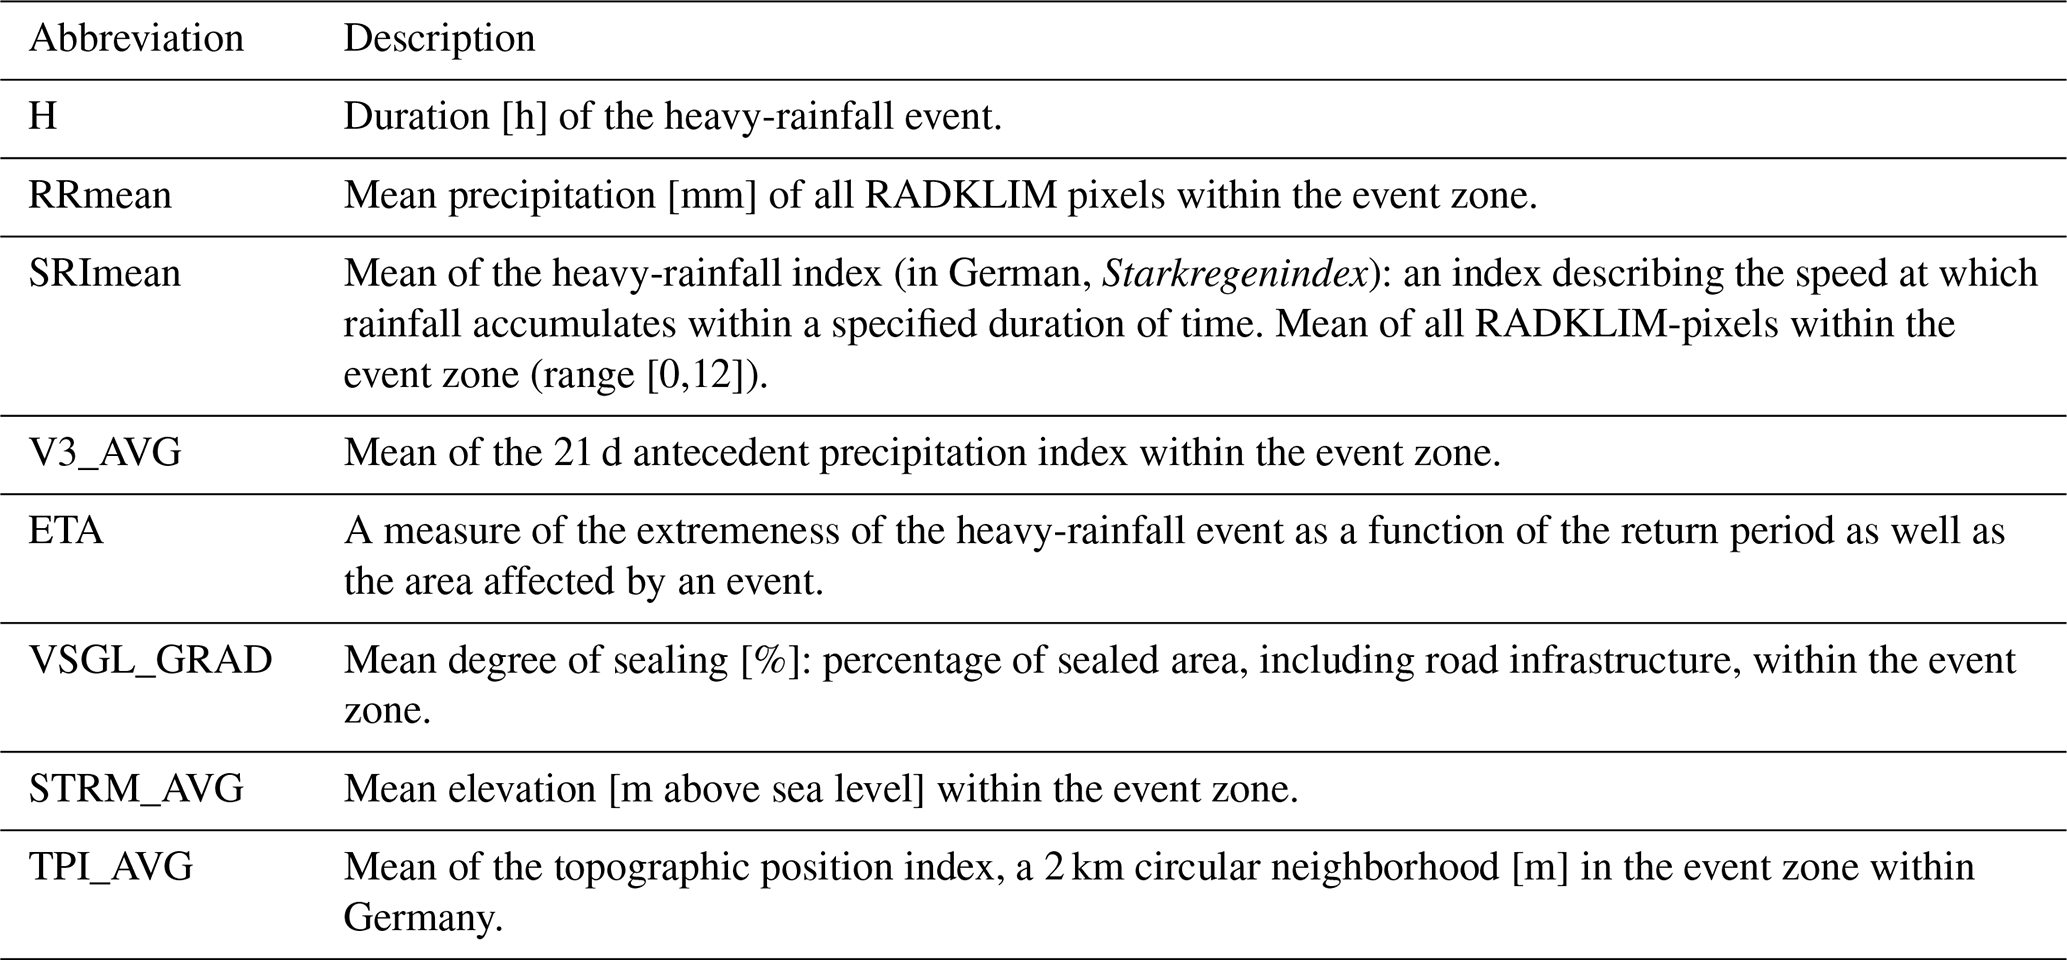
Considering a similar logistic model as in the panel analysis, the relationship between the characteristics of the heavy-rainfall events and the probability (pi) that a natural hazard occurs in observation i is assumed to take the form
where is a vector of the eight aforementioned characteristics from the CatRaRE in Table 1, in addition to a variable for the slope and embankment landslide hazard index from the German Centre for Rail Traffic Research. The vector zi is a vector of year and season control variables, and are the corresponding parameter coefficients. Since the variables in Ci are continuous, the interpretation of the odds ratios is based on a 1-unit increase in the value of the variable of interest:
The maximum likelihood method was used to estimate the parameters in this cross-sectional logistic model (4).
3.1 Spatial intersection of heavy-rainfall events and natural hazards
Of the 1269 flooding events, a total of 296 events (23 %) can be spatially and temporally linked to a heavy-rainfall event. A total of 184 (62 %) of the flooding events linked to heavy rainfall occur in June and July, with July being the front-runner (111 events) (Fig. 1d). There are also a large number of coupled events in May and August, while the number is below 10 events in the other months. The lowest numbers are in March and December (zero each) and January and November (two each). The distribution over the years varies between 4 (2015) and 78 (2021) events. Besides 2021, the most frequent overlaps occur in 2016 and 2017. Of the 418 gravitational mass movement events, a total of 59 events (14 %) can be spatially and temporally linked to a heavy-rainfall event, most of them (48 % or 81 %) between May and July (Fig. 1f). The distribution among the years varies between 0 (2011, 2012, 2015) and 13 (2021) events. Besides 2021, the most frequent intersections occur in 2013, 2016, 2018, and 2019. Of the 14 461 tree fall events, a total of 312 (2 %) events can be spatially and temporally linked to a heavy-rainfall event. A total of 163 of the tree falls (35 %) linked to heavy rainfall occur in June and July, with June being the front-runner (108 events) (Fig. 1h). There are also a large number of coupled events in May (40) and August (46), followed by September (21) and February (20). The lowest numbers occur in November (one) and January (two). The distribution across years varies between 57 (2019) and 118 (2017) events.
A comparative analysis of all three natural hazards shows that in all three processes, the hazard events in summer are mainly coupled with heavy-rainfall events (Fig. 3). In contrast, the hazard events in winter are predominantly not coupled with heavy-rainfall events.
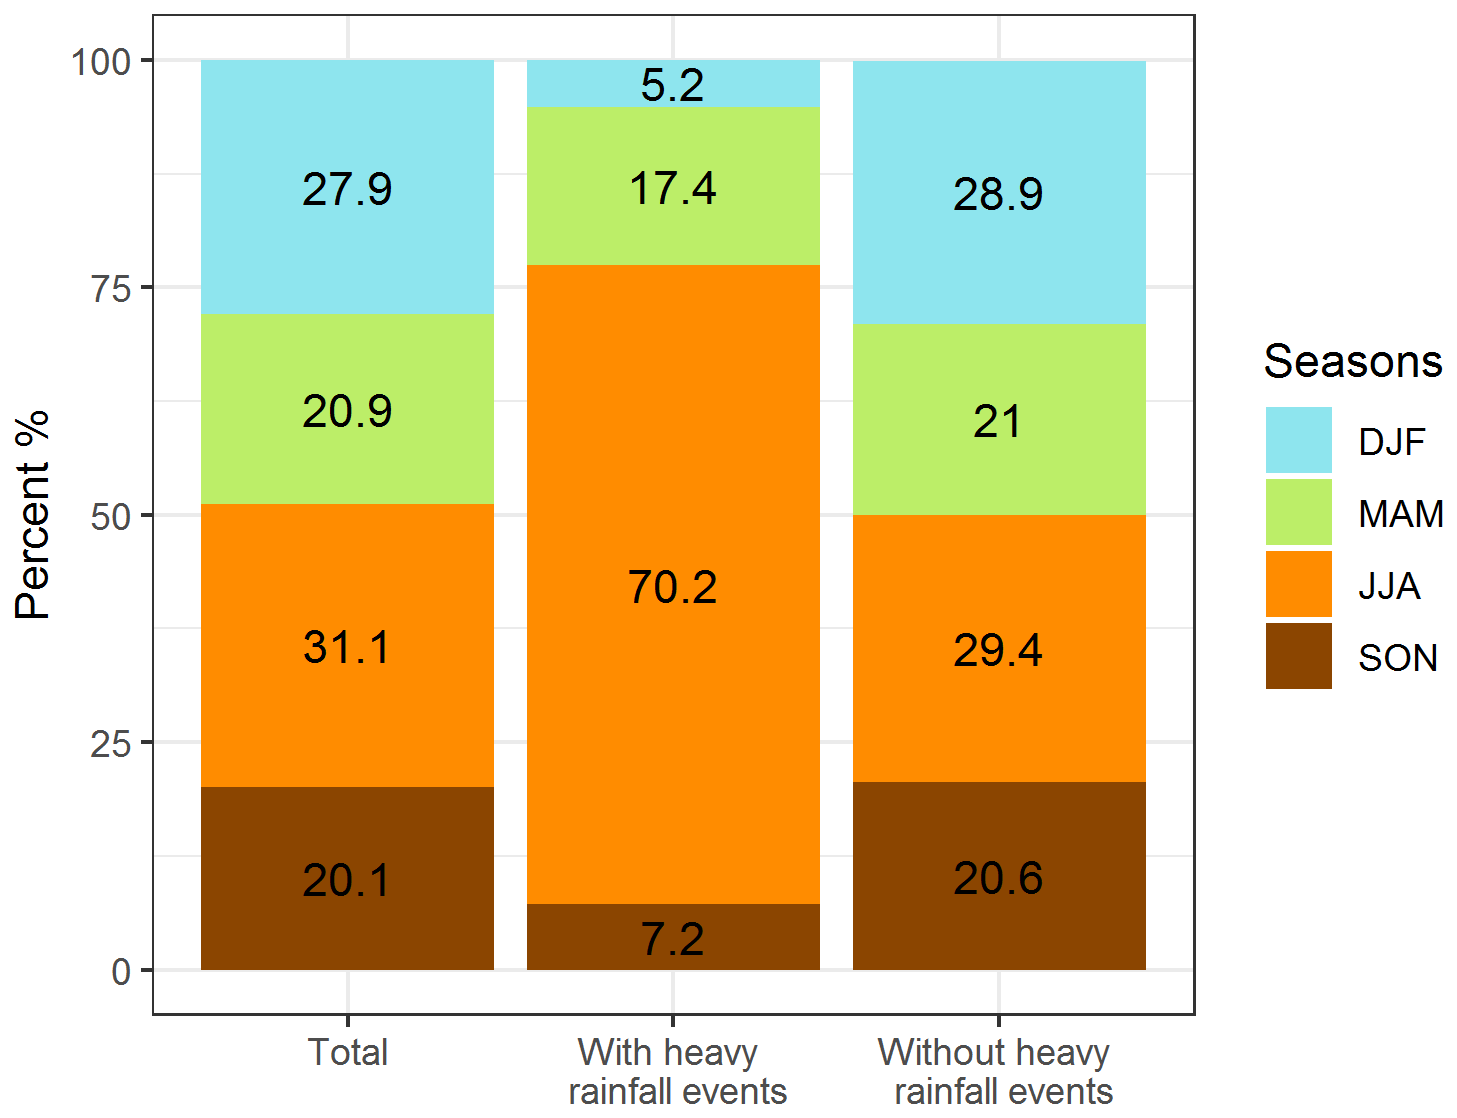
Figure 3Seasonal distribution of natural hazard events reported for the German rail network with and without heavy-rainfall events. All three natural hazard processes are shown together in the figure, as the distribution looks similar for each process when viewed individually.
3.2 Influence of heavy-rainfall events on the occurrence of natural hazard events
Table 2 provides the estimated odds ratios of the random-effects logit models in Eq. (3) for the three different natural hazard events. The dataset of the entire period contains a total of 38 590 173 observations, but this number is lower for gravitational mass movements and tree falls because of the shorter available time period of the natural hazard event datasets. To evaluate model performance, several model criteria were calculated and are presented in Table 2. Several values are provided to evaluate the goodness of fit for the models; the log likelihood is a function of the sample size and the higher the value, the better. The ρ value shows the contribution of the random effect to the total variance. The Akaike information criterion (AIC) is an estimator of the prediction error and the lower the AIC, the better a model fits the data it was generated from. The full regression tables with all explanatory variables and the evaluation of the model quality of the chosen model can be found in Appendix A. From this point forward, we will only be interpreting and discussing the results that are robust across the different models.
Table 2Results of the random-effects logit model for incidence of a natural hazard after a heavy-rainfall event. The number of observations is lower for gravitational mass movements and tree fall events than for floods because of the shorter time period under consideration. Significant values are shown in bold font.
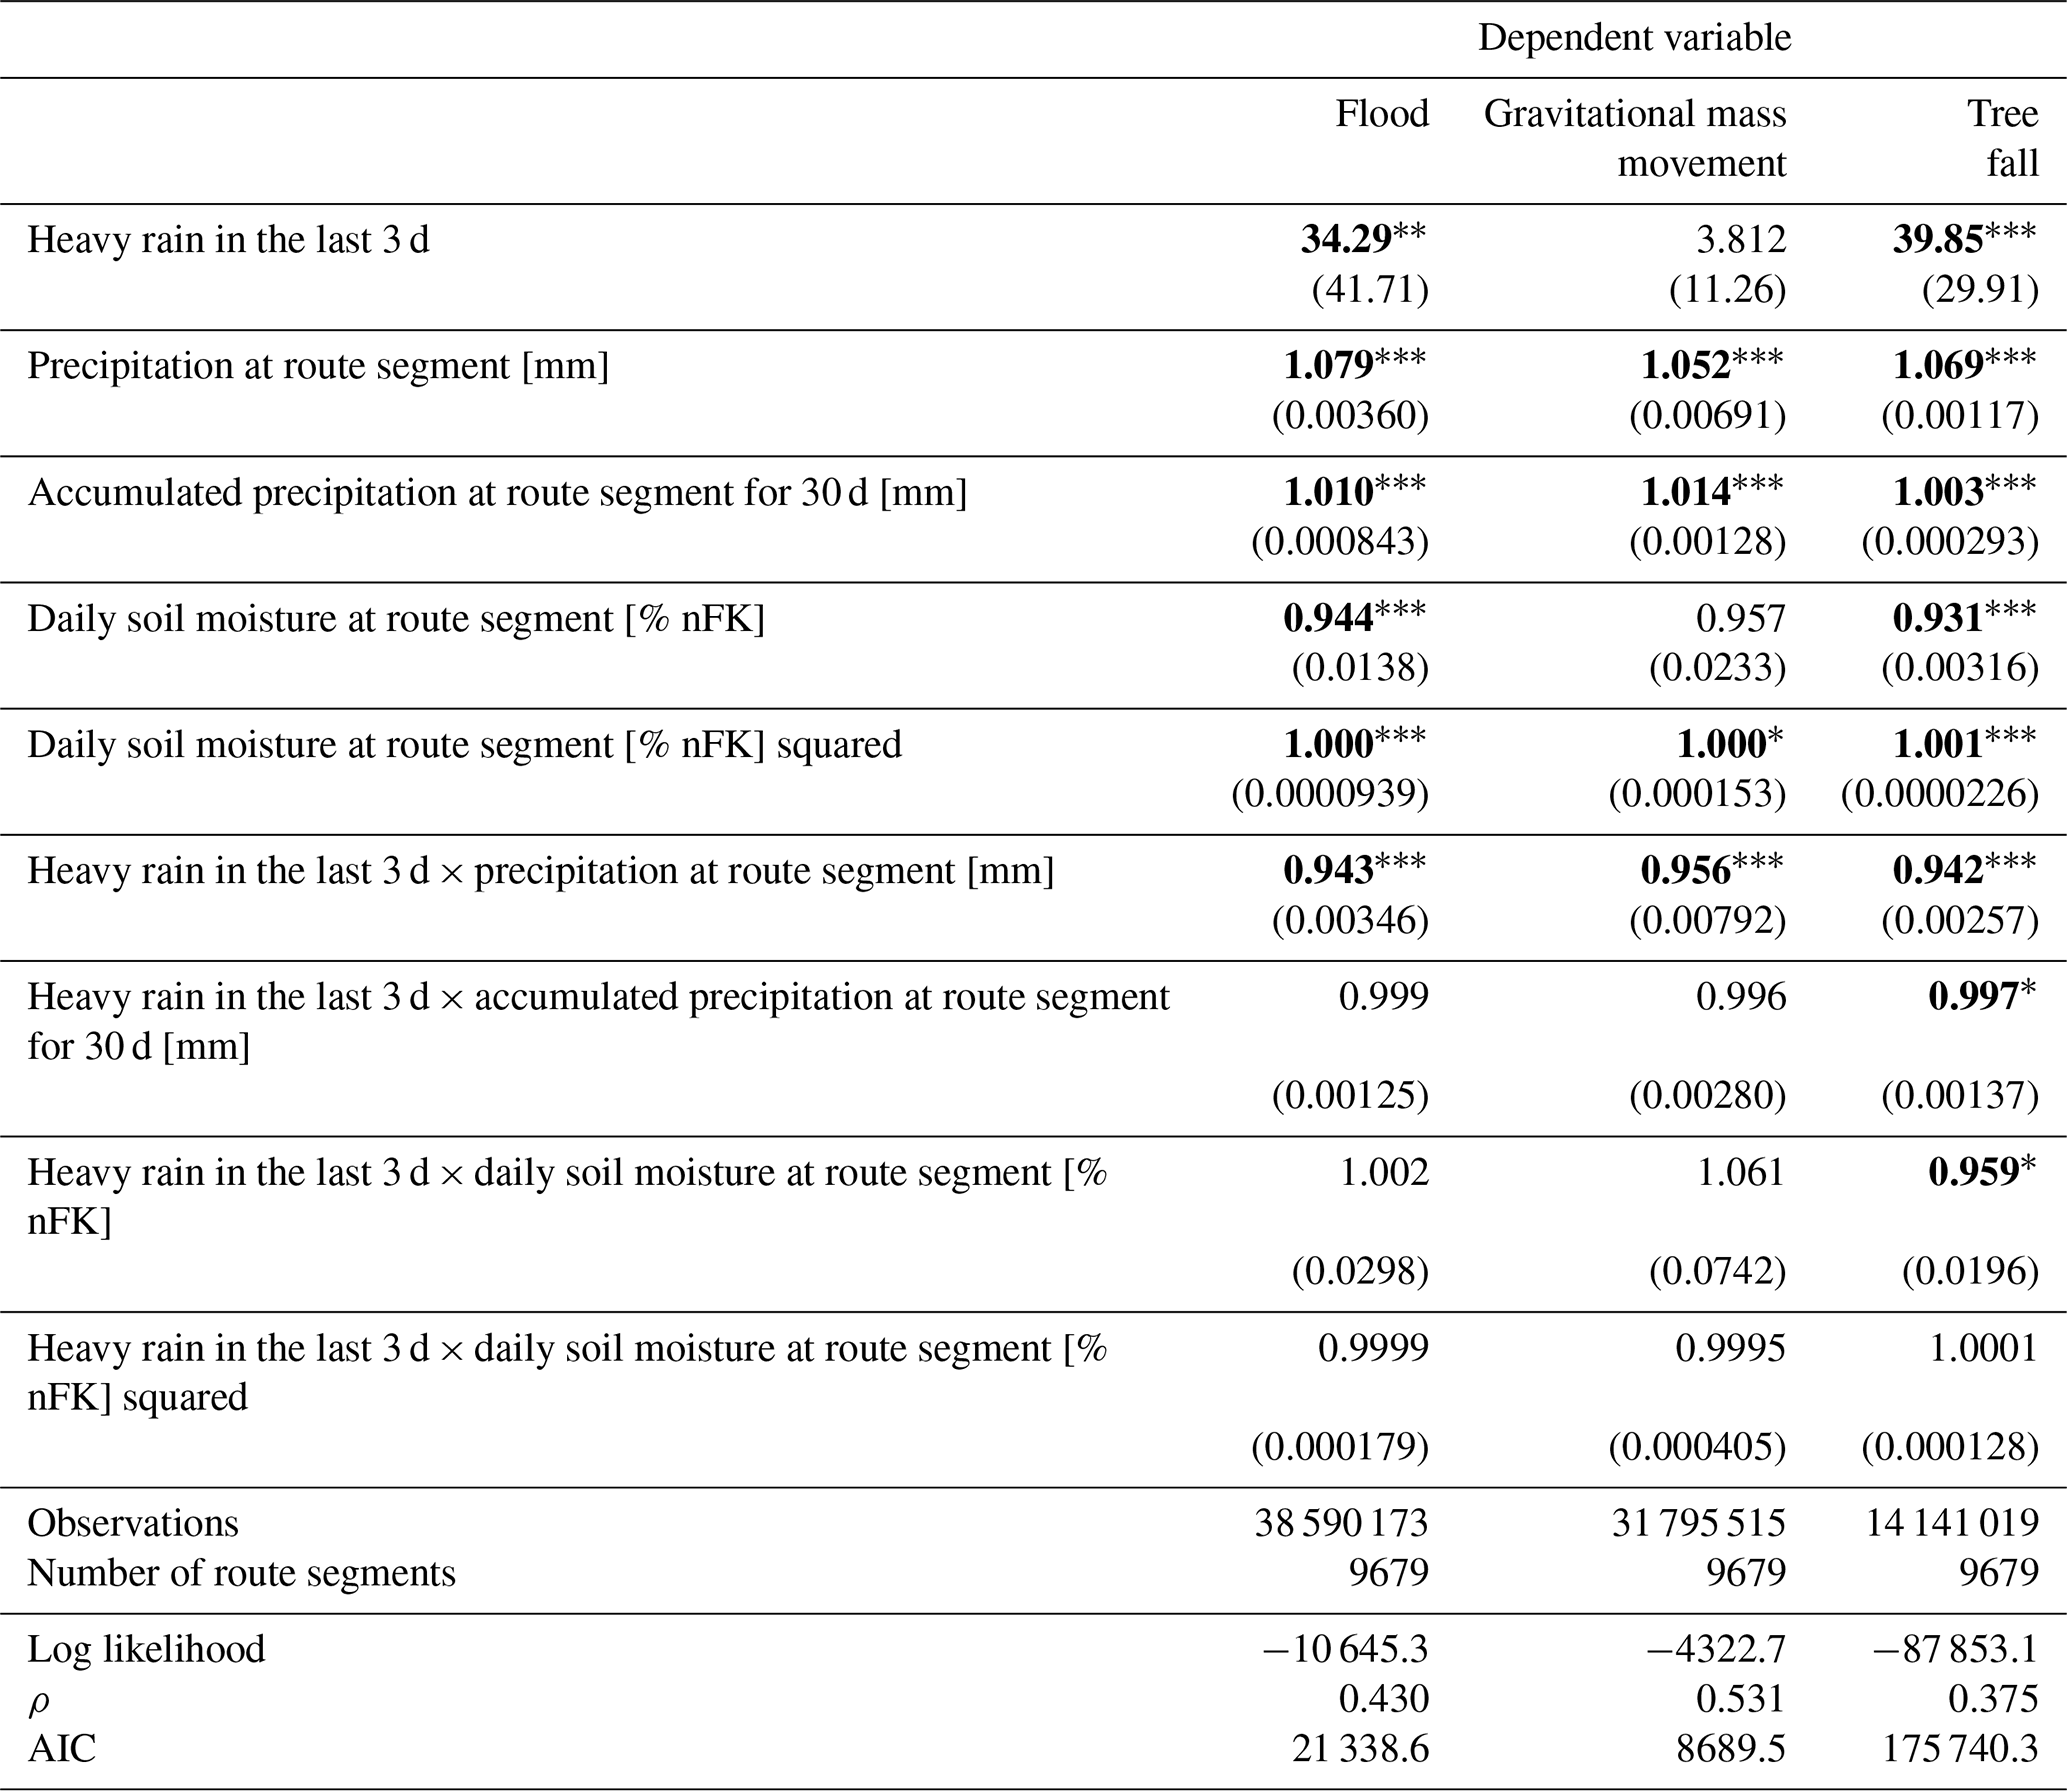
All values are exponentiated coefficients (odds ratios) with the standard errors in parentheses. All models include season and year controls. * p<0.05, p<0.01, and p<0.001.
The exponentiated coefficients of heavy rain in Table 2 for the hazards flood and tree fall are greater than 1 and are statistically significant at 0.1 %. For gravitational mass movements, the coefficient is not statistically different from 1. To further evaluate the magnitude of these effects, one must take into account the estimates of the interactions with the meteorological control variables. Since interaction terms are included in the model, the effect of heavy rain will depend on the level of precipitation, accumulated precipitation, and daily soil moisture. In Table 3, we take the mean and median values of these meteorological control variables over all the time periods investigated and calculate the odds ratio of heavy rain based on Eq. (1.1). The large difference in magnitudes between the main coefficient of heavy rain in Table 2 and the odds ratio of heavy rain in Table 3, particularly for tree fall and gravitational mass movements, is primarily due to the exponentiated coefficient of the interaction between heavy rain and daily soil moisture. This coefficient is slightly greater than 1 for gravitational mass movements and is less than 1 for tree fall. When raised to the power of the mean or median value of soil moisture, which is at least 75, the resulting number is very large for mass movements and very small for tree fall. Following Eq. (1.1), this number is multiplied by the main coefficient, resulting in a substantial difference in the magnitudes.
Table 3Odds ratios of heavy rain for the mean and median values of the precipitation, 30 d accumulated precipitation, and daily soil moisture based on the estimates of the random-effects logit model in Table 2. Odds ratios are calculated according to Eq. (1.1).
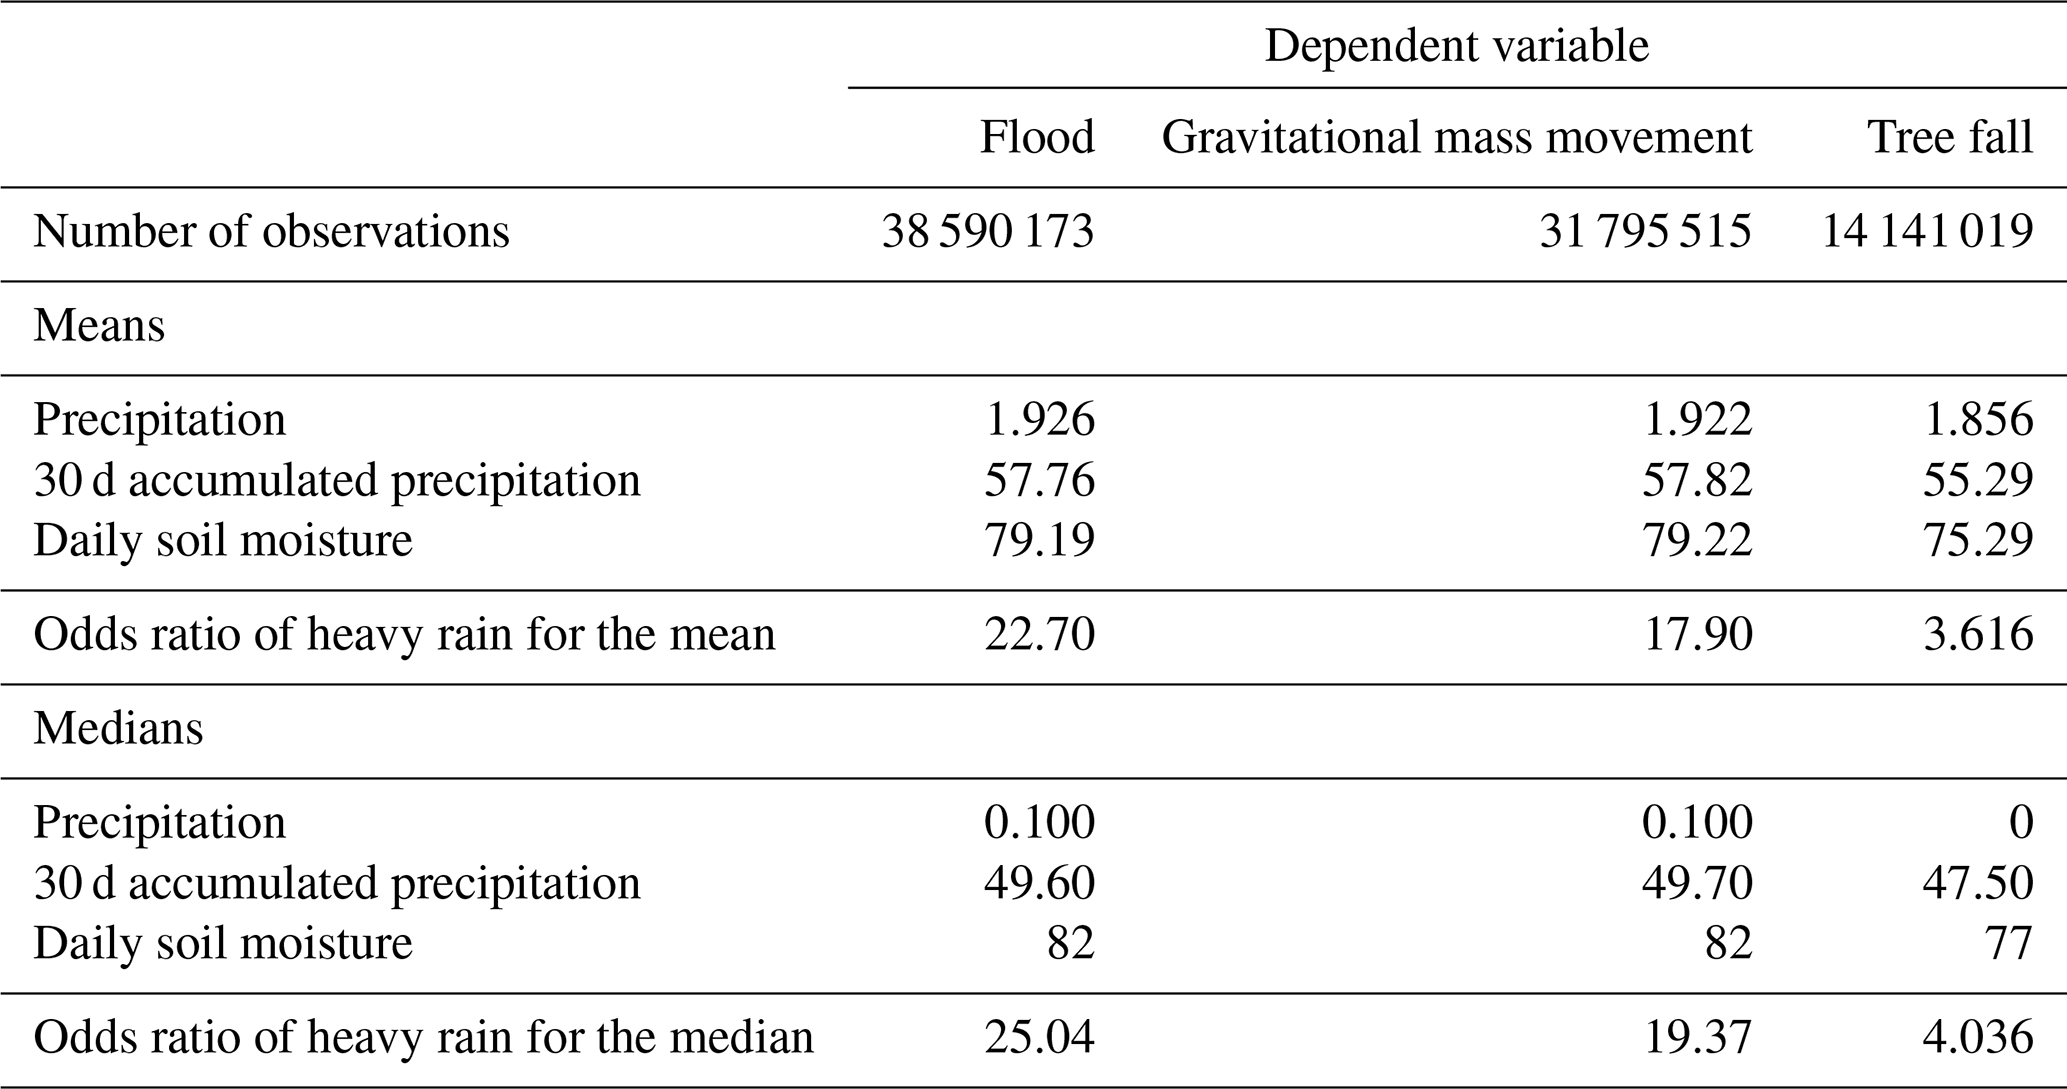
According to Table 3, when all meteorological control variables are at their mean (median) values, the odds of a flood event is on average 22.7 (25) times larger if heavy rain occurred in the last 2 d than if no heavy rain occurred. The odds of a tree fall event, on the other hand, are on average 3.6 (4) times larger when the meteorological factors are at their means (medians). For gravitational mass movements, the odds ratio is between 17 to 19 times larger; however, since the main effect of heavy rain on gravitational mass movement is not statistically significant, we will not interpret these values.
To provide insight into the temporal relationship between heavy-rainfall events and the resulting natural hazards, the random-effects logit models were also calculated with the vector dummy variables in Eq. (3.2) that represent the number of days after the heavy rainfall occurred (Table 4). Regarding the time lag, the odds of flood events are highest when the heavy-rainfall event occurred on the same day as the flood event and decrease with increasing temporal distance. All values are statistically significant. This means that compared to a situation with no heavy rainfall occurring, a heavy-rainfall event is close to 12 times more likely to cause a flood on the same day, while it is 10 times more likely to cause a flood the day after and almost 5 times more likely to cause a flood after 2 d.
Table 4Results of the random-effects logit model for incidence of a natural hazard that occurs different numbers of days after a heavy-rainfall event. Significant values are shown in bold font.
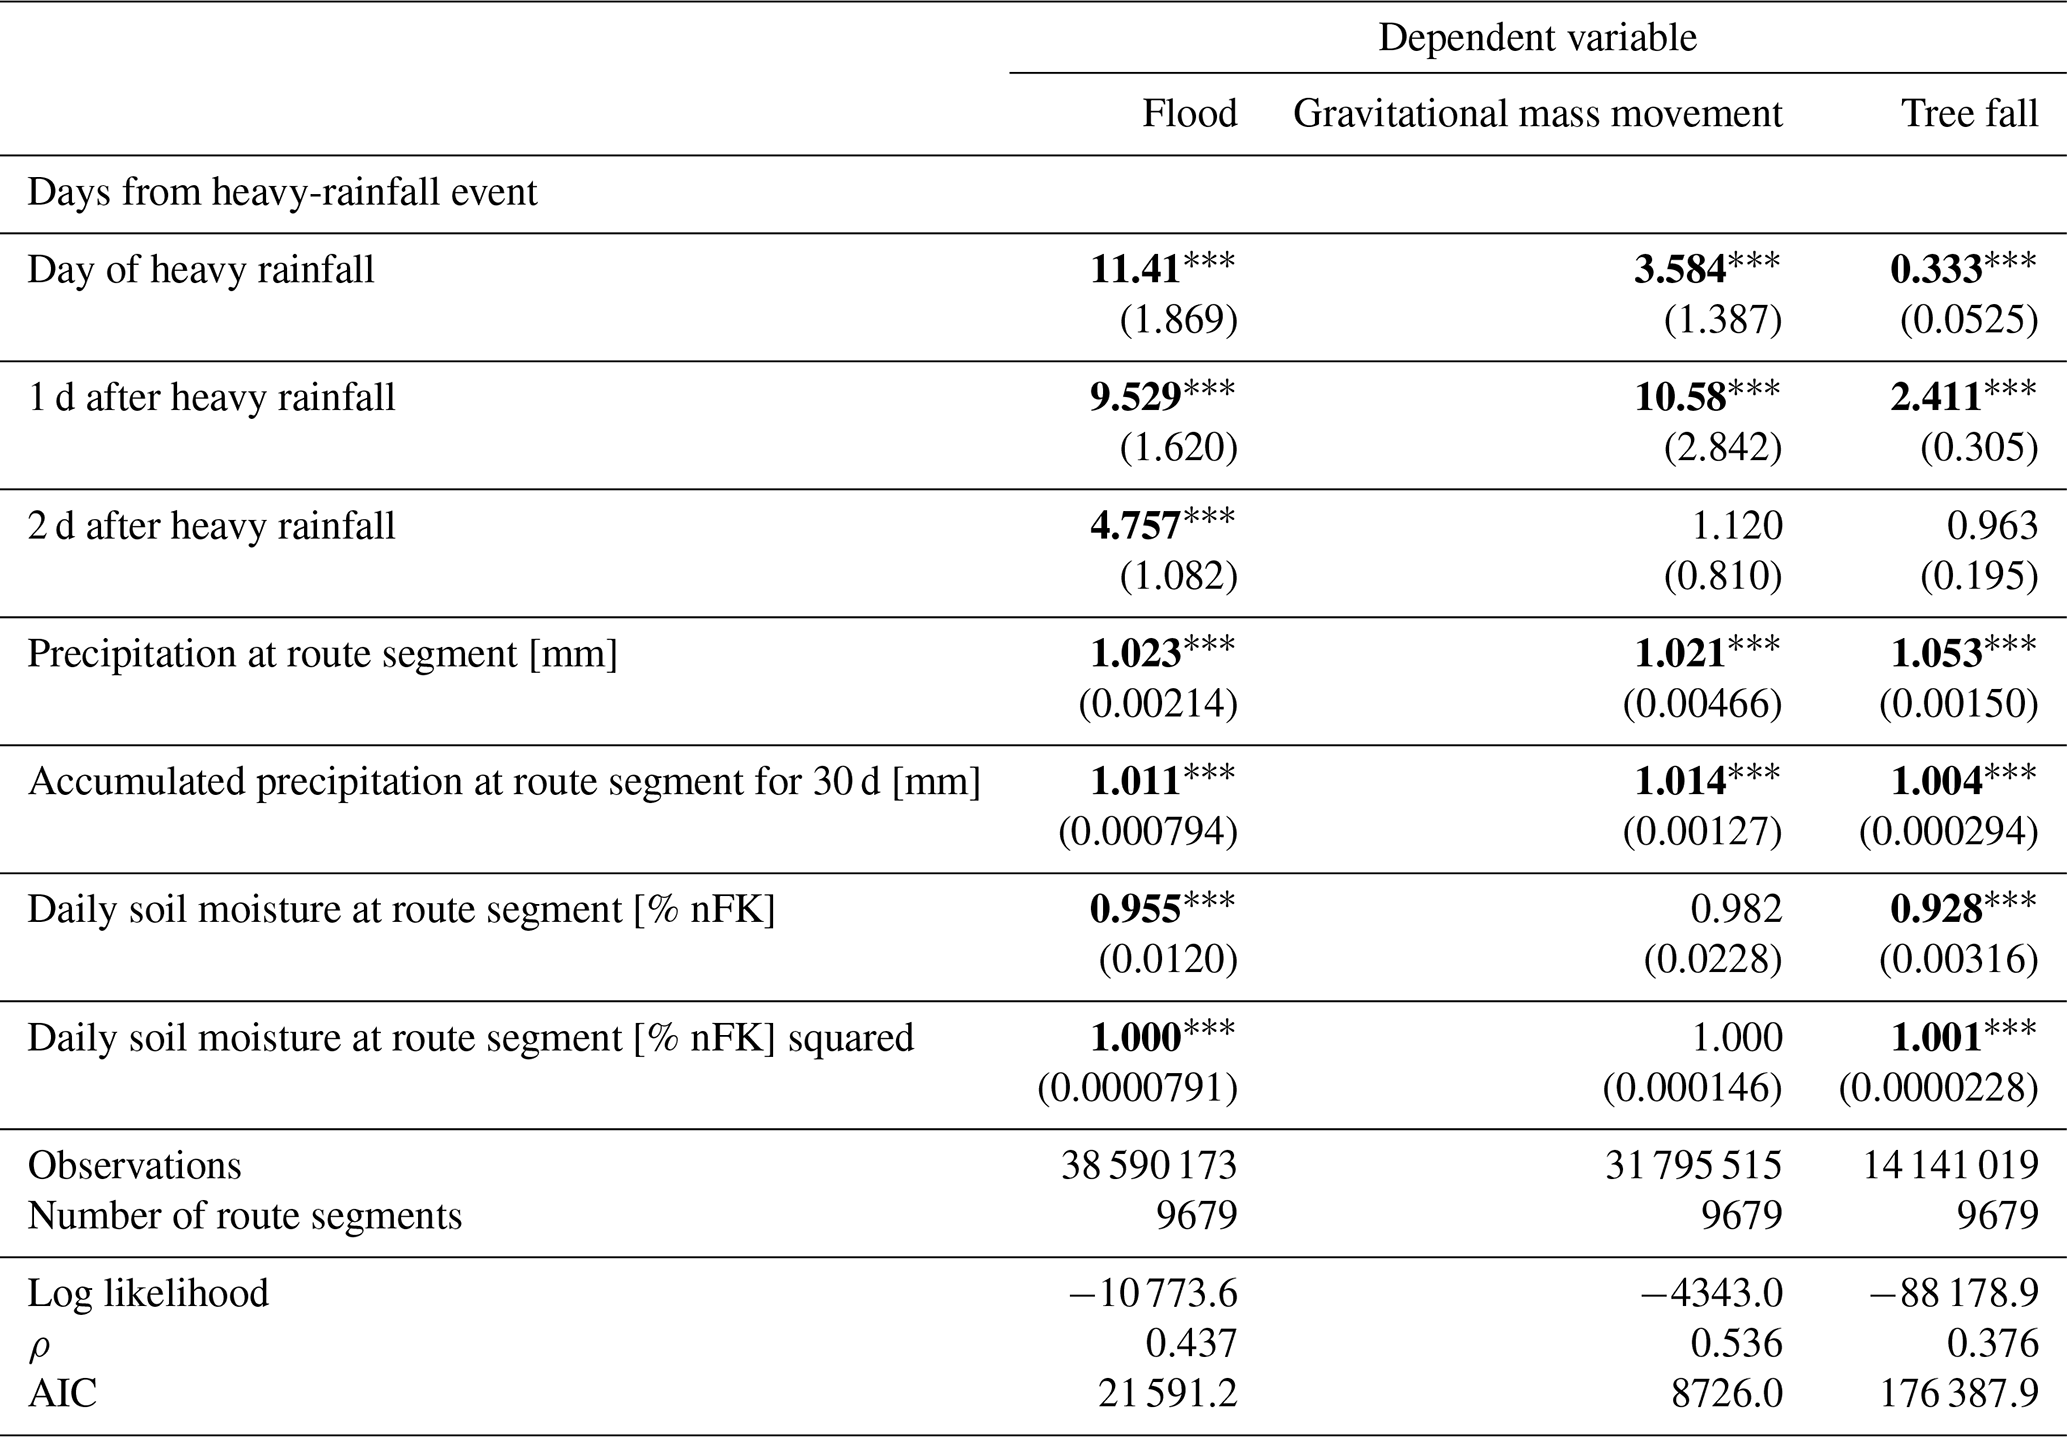
All values are exponentiated coefficients (odds ratios) with the standard errors in parentheses. All models include season and year controls and controls for landslide hazard. * p<0.05, p<0.01, and p<0.001.
For gravitational mass movement and tree fall events, the relationship is weaker than for flood events and is even insignificant for heavy-rainfall events occurring 2 d before the natural hazard event. Interestingly, the highest odds ratios can be observed for gravitational mass movements when the heavy-rainfall event occurred 1 d before the natural hazard. In particular, the odds of a gravitational mass movement are close to 11 times higher 1 d after heavy rainfall compared to a situation with no heavy rainfall and more than 3 times higher on the day of heavy rainfall compared to no heavy rainfall. After 2 d, the odds of a gravitational mass movement are no longer different from a situation with no heavy rainfall. For tree fall events, the odds ratio on the day of a heavy rainfall is 0.333 and is statistically significant, meaning that the odds of a tree fall event occurring on the same day as heavy rainfall are less than one-third that of a situation when no heavy rainfall occurs. In contrast, 1 d after a heavy-rainfall event, a tree fall event is 2.4 times more likely to occur than on days with no heavy rainfall. After 2 d, the odds ratio is no longer statistically different from 1. A possible explanation for this observation is an operational one and lies in the way data for tree fall is collected by Deutsche Bahn AG. Tree fall events are reported by train operators only upon encountering the trees en route. When a heavy storm or rainfall is expected, often train journeys are canceled in advance to ensure the safety of passengers and employees. Therefore, fewer trains travel on days of heavy rain, making it less likely that a train would encounter tree fall events on the same day. Most of the events are reported after the storm has settled.
In Tables 2 and 4, the odds ratios of the control variables precipitation and 30 d accumulated precipitation are statistically significant and slightly greater than 1. The estimates are relatively smaller in magnitude compared to those of the heavy-rainfall variables, which is to be expected from the continuous nature of the precipitation variables. In contrast, the results for daily soil moisture are ambiguous and are not robust to changes in the specification of the heavy-rainfall variable.
The influence of the control variables precipitation, 30 d accumulated precipitation, and daily soil moisture on the relationship between heavy rainfall and the occurrence of a natural hazard event is depicted in Fig. 4. Using the predictive margins approach (Williams, 2012) and applying the regression models in Table 2, the predicted probability of a natural hazard event is calculated for each observation in the dataset for the case of no heavy rainfall and for the case of a heavy-rainfall event. The actual observed values of all the control variables were used to calculate the predicted probabilities. For observations with the same value of the meteorological variable, the average of the predicted probabilities was then taken. Therefore, for each value of, say, precipitation, two points are obtained: the average probability with heavy rain (points on the dashed line) and the average probability without heavy rain (points on the solid line).
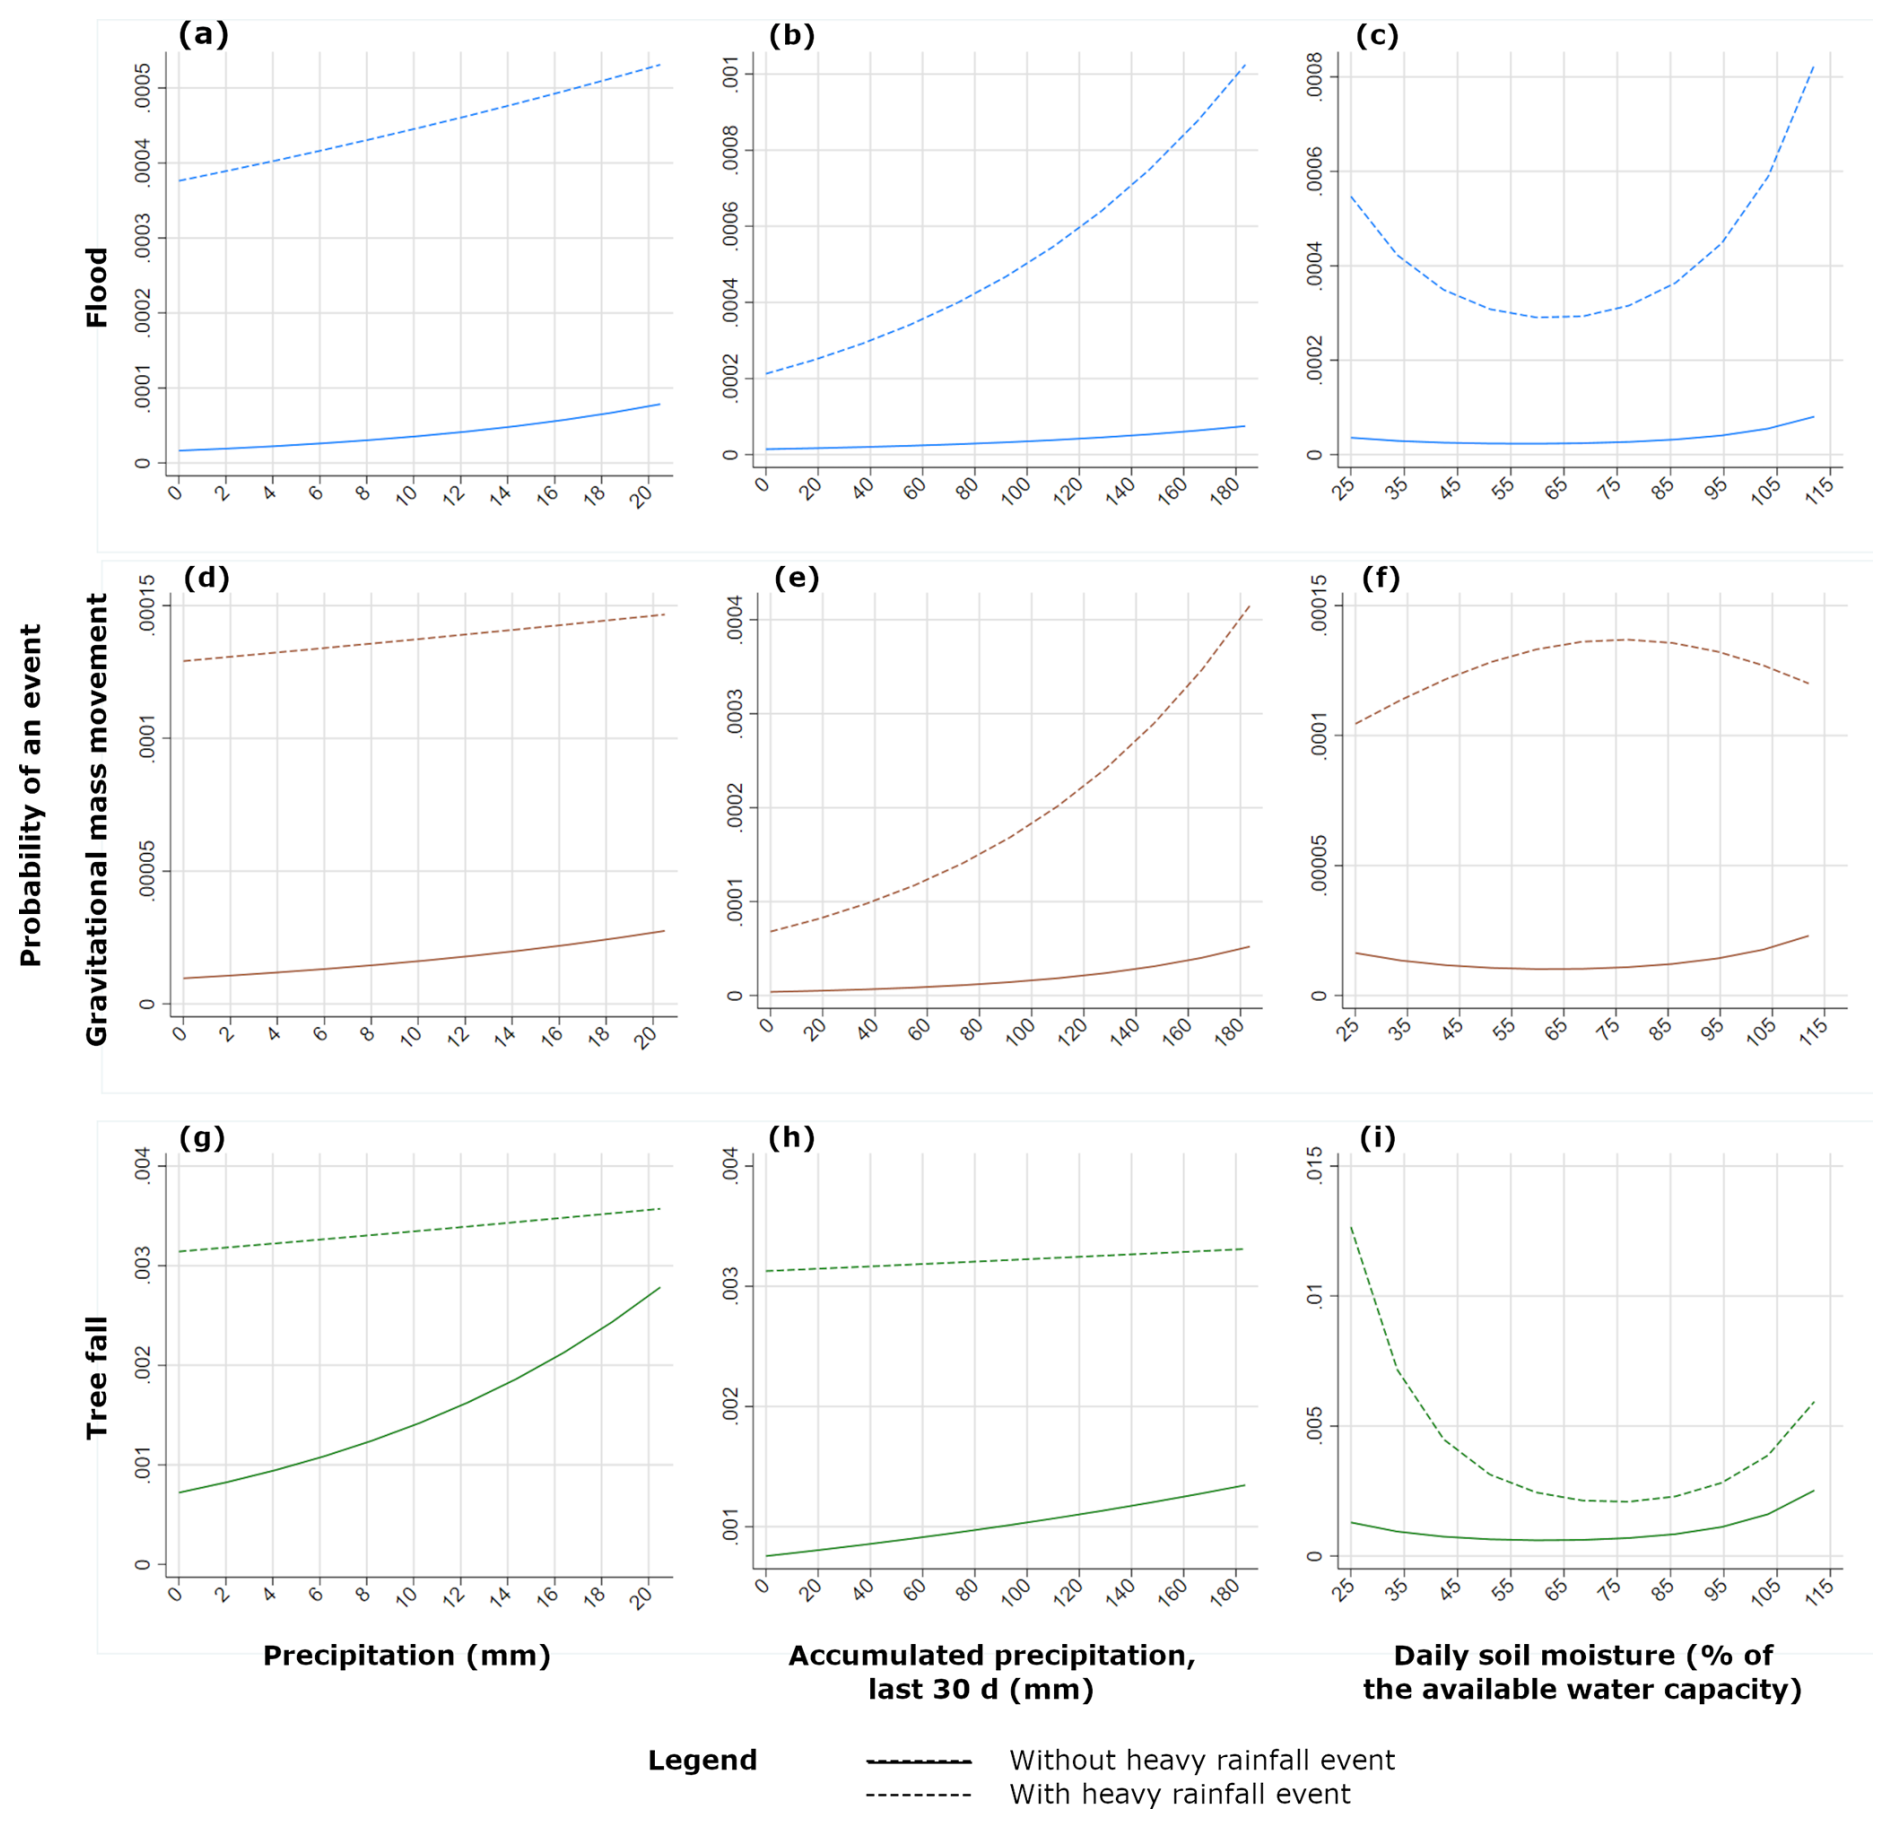
Figure 4The influence of the control variables precipitation, accumulated precipitation, and soil moisture on the probability of occurrence of floods, gravitational mass movement, and tree fall events. Each panel compares the probability of occurrence for two cases: without heavy-rainfall event and with heavy-rainfall event.
The curves and the probability of the situation “with heavy-rainfall event” are above the curves of the “without heavy-rainfall event” for all three types of natural hazards and all three control variables, indicating that the probability of a natural hazard occurring is always higher with a preceding heavy-rainfall event. However, the curves have different shapes. In several panels in Fig. 4, both curves show a slight increase, and the distance between them remains about the same in panels (a), (d), and (h). This means that the difference in the probability of occurrence is independent of the amount of precipitation. In the cases of panels (b) and (e), the distance becomes greater at higher values; i.e., the higher the amount of accumulated precipitation, the more a heavy-rainfall event increases the probability of occurrence of a flood or gravitational mass movement. In the case of panel (g), both curves slightly converge at high values, i.e., the higher the amount of precipitation, the less a heavy-rainfall event increases the probability of occurrence of a tree fall event.
For panels (c) and (i), the curve of with heavy-rainfall event has a U-shape. Thus, the probability of a natural hazard occurring during a heavy-rainfall event is higher when the soil moisture takes on extreme values than when it takes on average values. There is evidence that both extremely dry soil and extremely wet soil are determinants of floods (Vichta et al., 2024), mainly due to the hydrophobic properties of soil and oversaturation, respectively. Heavy rainfall in an environment with very dry and hydrophobic soil or very wet and oversaturated soil can therefore easily trigger a flood event, and this is reflected clearly in the results. In moderate soil moisture cases, where the soil can still absorb water brought about by heavy rains, the effect of heavy rain is then less pronounced. Similarly, it has been shown that drought stress can cause tree mortality (Grote et al., 2016); meanwhile, soil oversaturation can cause waterlogging stress in trees (Gill, 1970; Kreuzwieser and Rennenberg, 2014). With trees that are already under stress and are vulnerable in very dry or very wet soil conditions, a heavy-rainfall event could cause additional stress and be more likely to trigger tree fall. According to the data, the effect of heavy rain on tree fall is stronger for trees that are experiencing drought stress.
The arc shape in panel (f) suggests that the probability of occurrence is highest at medium soil moisture values. However, since the main effect of heavy rain on gravitational mass movement is insignificant, we will refrain from interpreting this result.
3.3 Characteristics of heavy-rainfall events and their influence on the occurrence of natural hazards
The previous section has shown that the occurrence of heavy-rainfall events has a statistically significant influence on the occurrence of natural hazards, particularly flood and tree fall events. However, as heavy-rainfall events can be described by various parameters, the aim of the cross-sectional analysis was to investigate which characteristics of the heavy-rainfall events affect the odds of natural hazards occurring and how these effects differ across the three processes. Table 5 presents the resulting odds ratios of the estimated logistic regression model of the cross-sectional analysis when the parameter in question is increased by 1 unit. The duration of the heavy-rainfall event and the mean precipitation throughout the area affected by the heavy-rainfall event do not seem to have a significant effect on the odds of occurrence of a natural hazard. However, the heavy-rainfall index (SRImean) does significantly increase the odds of all three natural hazards. When the index increases by 1 unit, the odds increase by a factor of 1.577 (floods), 1.716 (gravitational mass movements), and 1.389 (tree falls). The table also reveals the significant effect of the 21 d antecedent precipitation index (API) on all three types of natural hazards. A 1 mm increase in the API increases the odds by a factor of 1.055 (flood), 1.075 (gravitational mass movements), and 1.025 (tree fall).
Table 5Results of the cross-sectional logit model on the components of heavy-rainfall events and their effect on the odds ratios of the probability of occurrence of floods, gravitational mass movement, and tree fall events. Note that the number of observations is reduced compared to Tables 2 and 3, as the cross-sectional dataset contains only those route segments hit by at least one heavy-rainfall event between 2011 and 2021. Significant values are shown in bold font.
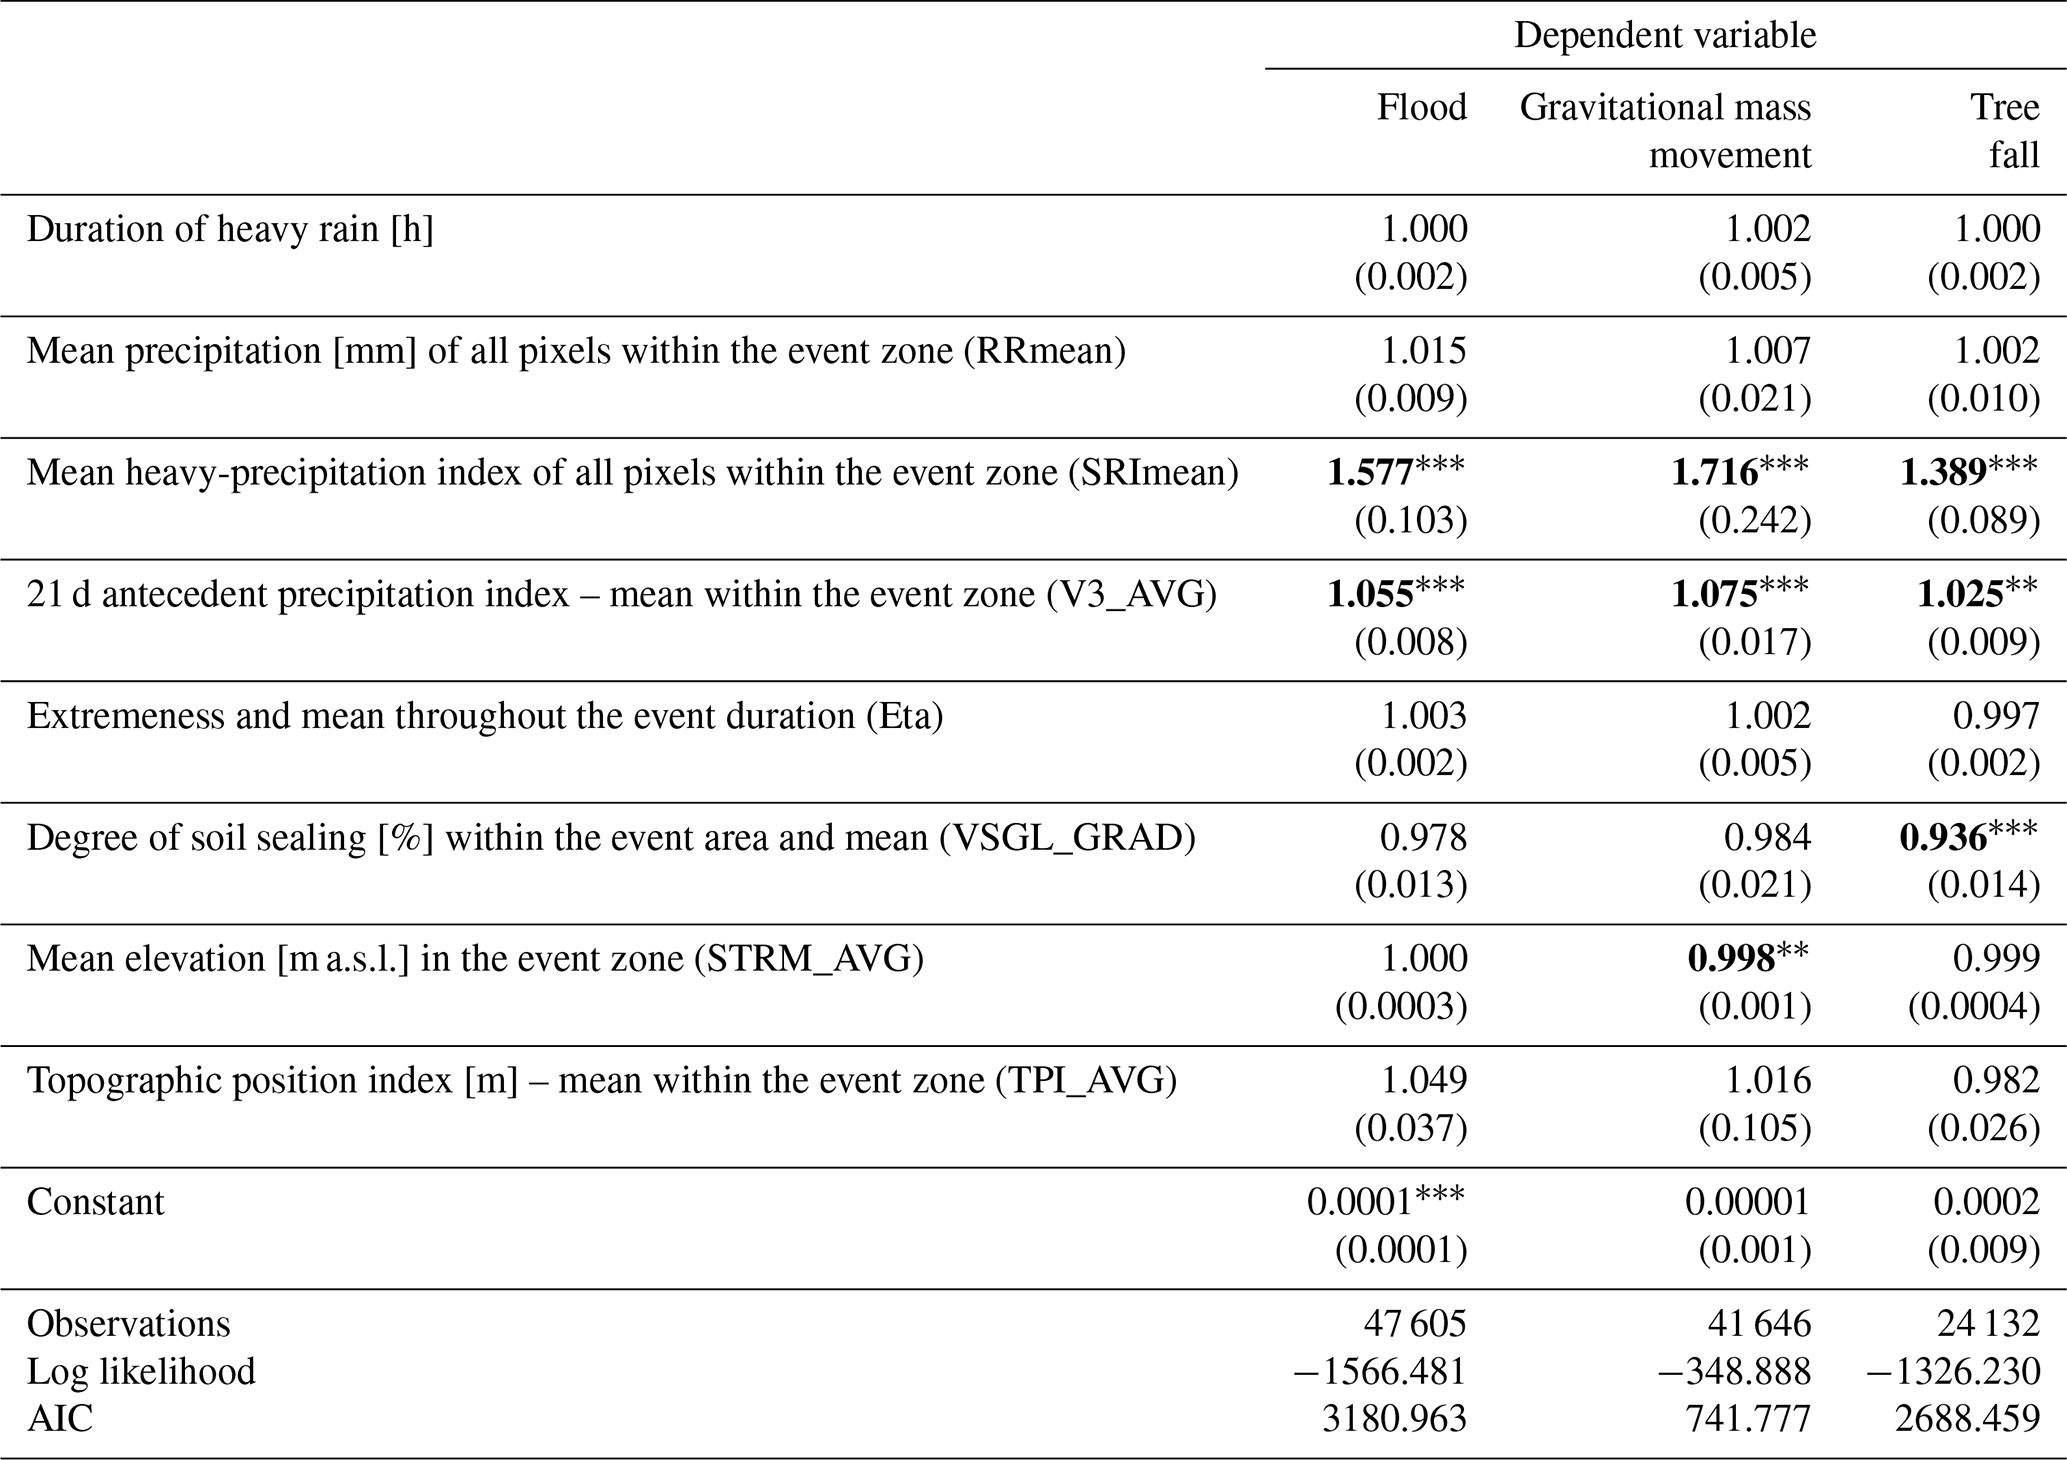
All values are exponentiated coefficients (odds ratios) with standard errors in parentheses. Season and year controls are included in all regressions. * p<0.05, p<0.01, and p<0.001.
The geographical characteristics within the heavy-rainfall-event zone that show a significant influence on the occurrence of natural hazards are the degree of soil sealing and elevation. The degree of soil sealing has a negative effect on tree fall events, and 1 % of increased soil sealing reduces the odds by a factor of 0.936 (statistically significant at 0.1 %). This could be due to the fact that more soil sealing means that there are fewer trees in the area. The mean elevation within the heavy-rainfall area reduces the odds of gravitational mass movement events by a factor of 0.998 (statistically significant at 1 %). This unexpected observation may be due to the fact that (1) the number of gravitational mass movement events in the available dataset is very small and (2) railway lines are unevenly distributed in Germany in terms of elevation, with most lines being located in low-lying areas.
4.1 Heavy-rainfall events and associated natural hazards
The heavy-rainfall event in July 2021 was an exceptional event in terms of intensity and spatial extent (Tradowsky et al., 2023). Such devastating flash floods are therefore not to be expected with every heavy-rainfall event occurring in Germany. Nevertheless, less intense heavy-rainfall events are not a rare phenomenon in Germany; they can occur anywhere and are seasonally concentrated in the summer months. About 50 % of all heavy-rainfall events between 2011 and 2021 can be spatially overlaid on the German rail network, and almost the entire rail network has been affected by a heavy-rainfall event at least once during this 11-year period. Heavy-rainfall events and associated natural hazards can therefore potentially affect the entire German rail network. However, vulnerability varies greatly from region to region and is determined, for example, by the route of the line in relation to the topography (Braud et al., 2020). Routes that follow valley courses or cross low mountain ranges are particularly susceptible to associated processes such as gravitational mass movements and local flooding. In order to make rail transport more resilient to heavy rainfall, it is important to gain more detailed knowledge about cause–effect relationships between heavy-rainfall events and the disruptions that they trigger.
Often it is not the heavy-rainfall event itself that causes damage to transport infrastructure but processes that are triggered by it. Connections between heavy-rainfall events as a triggering factor for further processes such as flooding (Bernet et al., 2019; Wake, 2013) and various types of gravitational mass movements (Araújo et al., 2022; Huggel et al., 2012; Kirschbaum et al., 2022; Tichavský et al., 2019) have already been established in several studies. Similarly, the regression models in our study show that when all meteorological variables are at their means, heavy-rainfall events can in the 2 d following the event significantly increase the odds of occurrence of flood by a factor of 22.7 and tree fall events by a factor of 3.62 (see Table 3). The odds ratios of flood events decrease the more time has passed after the heavy-rainfall event, while the odds ratios of tree fall events peak the day after a heavy-rainfall event (Table 4). The increased odds of gravitational mass movement events are only statistically significant the day of and the day after a heavy-rainfall event but are also strongly correlated with precipitation and accumulated precipitation (Tables 2 and 4). It is therefore important not to consider the occurrence of different natural hazards individually but to establish connections between the processes, for example, using climate impact chains (e.g., UBA, 2021) or a compound-hazard approach (e.g., Zscheischler et al., 2020).
About one-quarter of all flood events could be coupled with a heavy-rainfall event, and for the gravitational mass movements, it was as high as 17 % (Fig. 1). The proportion of tree fall events connected to heavy-rainfall events is very low, which could be due to the fact that storms and strong winds are considered the main trigger for this type of event (e.g., Bíl et al., 2017; Gardiner et al., 2010). A large proportion of the tree fall disturbances recorded in the DB damage database has been caused by a few large autumn and winter storms, such as Friederike in January 2018 (286 reports) or Sabine in February 2020 (513 reports), which were characterized by prolonged precipitation rather than heavy-rainfall events. The influence of heavy rainfall on the increasing risk of tree fall has been studied very little so far. Morimoto et al. (2021) found that heavy rainfall connected to typhoons increases the probability of disturbances in forest stands. Even if a spatial and temporal overlap of heavy rainfall with an event from the damage database could be determined, it must be emphasized once again at this point that the heavy-rainfall event can only be considered a possible cause for the event, and the actual causal trigger cannot be derived from the DB damage database. With our study, the aim is not to develop a predictive model of the natural hazards but instead to provide empirical evidence for the potential relationship between heavy rainfall and the three natural hazard processes. We also demonstrated how damage data from infrastructure operators can be merged with climate data from weather services to establish a potential relationship. This step represents an important contribution in terms of proactive natural hazard management to identify the route sections that are particularly affected by certain climatic parameters and associated processes. Furthermore, this information can be used to prioritize adaptation needs.
The parameters heavy-rainfall index (SRI) and antecedent precipitation index (V3) are the properties of the heavy-rainfall events that most strongly influence the occurrence of all three natural hazard processes considered (Table 4, Fig. 4). Thus, it is a combination of the pre-moisture conditions of the soil due to previous rainfall events and the occurrence of a heavy-rainfall event that most clearly promotes the occurrence of the processes. This is in concordance with, for example, findings from Rupp (2022), who analyzed the triggering factors for landslides with a seasonal resolution. Antecedent precipitation is of great importance for the occurrence of landslides all year round but especially in winter. Locosselli et al. (2021) found a similar seasonal variability for the climate drivers for tree falls among urban trees in Brazil. During the wet season, temperature has a direct influence on tree fall, while the effects of precipitation and wind gusts can lag behind.
No information on the magnitude of the hazard events can be obtained from the damage database. The duration of the disturbance, which is given for flood and tree fall events only, shows that for floods, 33 % of the events have a disturbance duration of more than 1 d, but for tree falls, it is only 2 % (Fabella and Szymczak, 2021). From the rather short disruption durations, it can be deduced that most of the events must be smaller, as it is not possible to resume operations after a short time in the case of a larger event. In the case of smaller events, the local climate conditions, as represented, for example, by SRI and V3, are most important. Hence, no significant correlations could be observed with the larger-scale parameters such as mean precipitation, mean topographic position index, and mean daily soil moisture. The role of the parameter degree of soil sealing (VSGL) on tree falls could be explained by the fact that areas with a high degree of sealing tend to have fewer trees along the track that can potentially cause disturbances, while more rural and less sealed areas have more trees and therefore also have an increased risk of tree fall events.
4.2 Data availability and quality
While the data quality of the CatRaRE is very high, it is difficult to validate the quality and completeness of the DB damage database. Therefore, we must consider the possibility that the relatively low numbers of damage reports that could be linked to a heavy-rainfall event are only minimum values due to the weaknesses of the data collection process. While the DWD is responsible for meeting the meteorological needs of all economic and social sectors in Germany, the DB damage database is an internal product. The main task of a railroad operator is to ensure safe railroad operations. The focus is not on the detailed recording of the damage event with exact process allocation, cause, etc. but rather on enabling a quick repair and ensuring the resumption of railroad operations. However, disruptions caused by natural hazards account for a substantial proportion of disruption events overall. In 2018, for example, weather-related disruptions were the second-most-frequent cause of cancelations according to DB data (Deutscher Bundestag, 2019). As climate change advances, it can be assumed that the number and extent of disruptive events are more likely to increase rather than decrease in the future, unless targeted countermeasures are taken. It is therefore essential to adapt rail transport and rail infrastructure to climate change. However, this requires reliable data on past damage events in order to guarantee a statistically robust consequence-based risk assessment and the targeted development of measures for action in the future. We therefore recommend improving the documentation requirements for the various modes of transport in order to create a reliable damage database in the long term. This should also include subdivision of natural hazard events according to the underlying processes. For instance, river floods are typically caused by (longer) precipitation runoff in larger areas of the river watershed, while local flash floods are caused by the immediate runoff of concentrated, intense heavy-rainfall events (Penna et al., 2013). Gravitational mass movements should be classified according to their volume and the type of transported materials, transportation processes, and triggers, as, for example, heavy-rainfall events typically trigger shallow landslides, while accumulated rainfall contributes more to deeper landslides (Zêzere et al., 2015).
4.3 Future development of heavy-rainfall events and associated hazards
In western and central Europe, extreme rainfall has already increased in frequency and will, with high confidence, continue to increase further with climate change (Seneviratne et al., 2021). However, modeling current and future trends in heavy-rainfall events on a regional scale is a challenging task. Rybka et al. (2022) used a convection-permitting regional climate model to estimate return levels dependent on the rainfall duration and return period for Germany. They found a 30 % mean increase in intensity for daily rainfall extremes for the end of the 21st century assuming a high-end emission scenario, but the model shows no further increase in intensity for sub-daily heavy-rainfall estimates. Although the exact rate is a subject of debate, it can be assumed that with rising temperatures, more water vapor can potentially be retained in the atmosphere thus increasing the potential for the occurrence of heavy-rainfall events (Lengfeld et al., 2020; Zeder and Fischer, 2020). Several studies using observational data (e.g., Westra et al., 2013) or modeling experiments (e.g., O'Gorman, 2015) successfully tested the hypothesis that the intensity of daily extreme rainfall roughly follows the Clausis–Clapeyron relationship, e.g., an increase of roughly 7 % per 1 °C of ambient temperature increase (Allen and Ingram, 2002; Trenberth, 1999). An increase in daily (e.g., Westra et al., 2014; Fischer and Knutti, 2015) and sub-daily precipitation (e.g., Lenderink and Meijgaard, 2010; Guerreiro et al., 2018) extremes has already been observed in several studies over many regions. Especially in the summer months, with a combination of long dry periods interrupted by single heavy-precipitation periods, it can be assumed that these heavy-rainfall events can lead to an increase in associated processes, e.g., landslides (Tichavský et al., 2019).
The time span of the DB damage database is too short to analyze trends in the occurrence of the three types of natural hazards. Access to high-quality data on past natural-hazard-related disruptions in the transport sector is a major limitation and is one of the reasons why there are only a few scientific studies available on this issue (e.g., Braud et al., 2020; Donnini et al., 2017; Fabella and Szymczak, 2021; Gardiner et al., 2024). However, quantifying the impact of natural hazards on the transport sector is of great importance, especially with regard to climate change. A global study by Koks et al. (2019) shows that already today about 27 % of all road and rail assets are exposed to at least one natural hazard. Climate change has a significant impact on forest stability (Seidl et al., 2017), and the frequency and magnitude of several natural hazards are likely to increase with ongoing climate change, as shown for gravitational mass movements (e.g., Chiang and Chang, 2011; Gariano and Guzzetti, 2016) or flash floods (e.g., Kundzewicz et al., 2013). It is therefore very likely that disturbances along transport routes due to natural hazards will occur more frequently in the future.
Due to the heavy-rainfall event in July 2021 and the resulting flash floods and damage, awareness of vulnerability to this natural hazard has increased significantly, and, among other things, a large number of research activities have been initiated. As the rail infrastructure was hit particularly hard, we contribute to raising awareness in the rail sector and in the transport sector in general with our study. We were able to show that heavy-rainfall events have a significant influence on the occurrence of associated natural hazards. Furthermore, we demonstrate an approach to link climate data with damage data from a mode of transport in order to establish correlational interdependence. This can also be applied to other climate impacts and other modes of transport and represents an important component in the context of proactive natural hazard management.
In this Appendix, we show the full results of the regression models, including all explanatory variables, seasonal and year dummy variables, and interaction terms. This section also addresses the question of overfitting in the models presented in the main text by presenting simpler models and assessing the robustness of the results.
Tables A1, A2, and A3 present the estimation results for the model in Table 2 for the natural hazards tree fall, flood, and gravitational mass movement, respectively. Columns (1)–(5) in each table are the results of a random-effects logistic regression, beginning with a simple regression in column (1) and successively adding control variables and interaction terms in columns (2)–(4) until the final model is reached in (5), the estimates of which are presented in the main text (Table 2). Columns (1)–(5) provide some insight into how sensitive the results are to changes in the selection of control variables. The simple logistic regression in column (1) would be less prone to overfitting due to having only one coefficient to estimate but would be very prone to omitted variable bias. The omitted variable bias is evident from the fact that in all three tables, the magnitude of the coefficient estimate for heavy rainfall dramatically changes once the control variables precipitation, accumulated precipitation, and daily soil moisture are added to the model (column 2), as well as when interaction terms are added to the model (column 4).
Column (6) presents the results of a pooled logistic regression model, which is a regression of panel data where the time dimension is not considered; i.e., the data is regarded as cross-sectional. Column (6) addresses the concern that the panel data analysis, due to its two-dimensional nature – with the time dimension and the individual dimension (here route segments) – has many fixed-effect parameters to estimate, which may lead to overfitting. For all models that include interaction terms, the odds ratios of heavy rain at the mean values of the meteorological variables are reported at the bottom of the table.
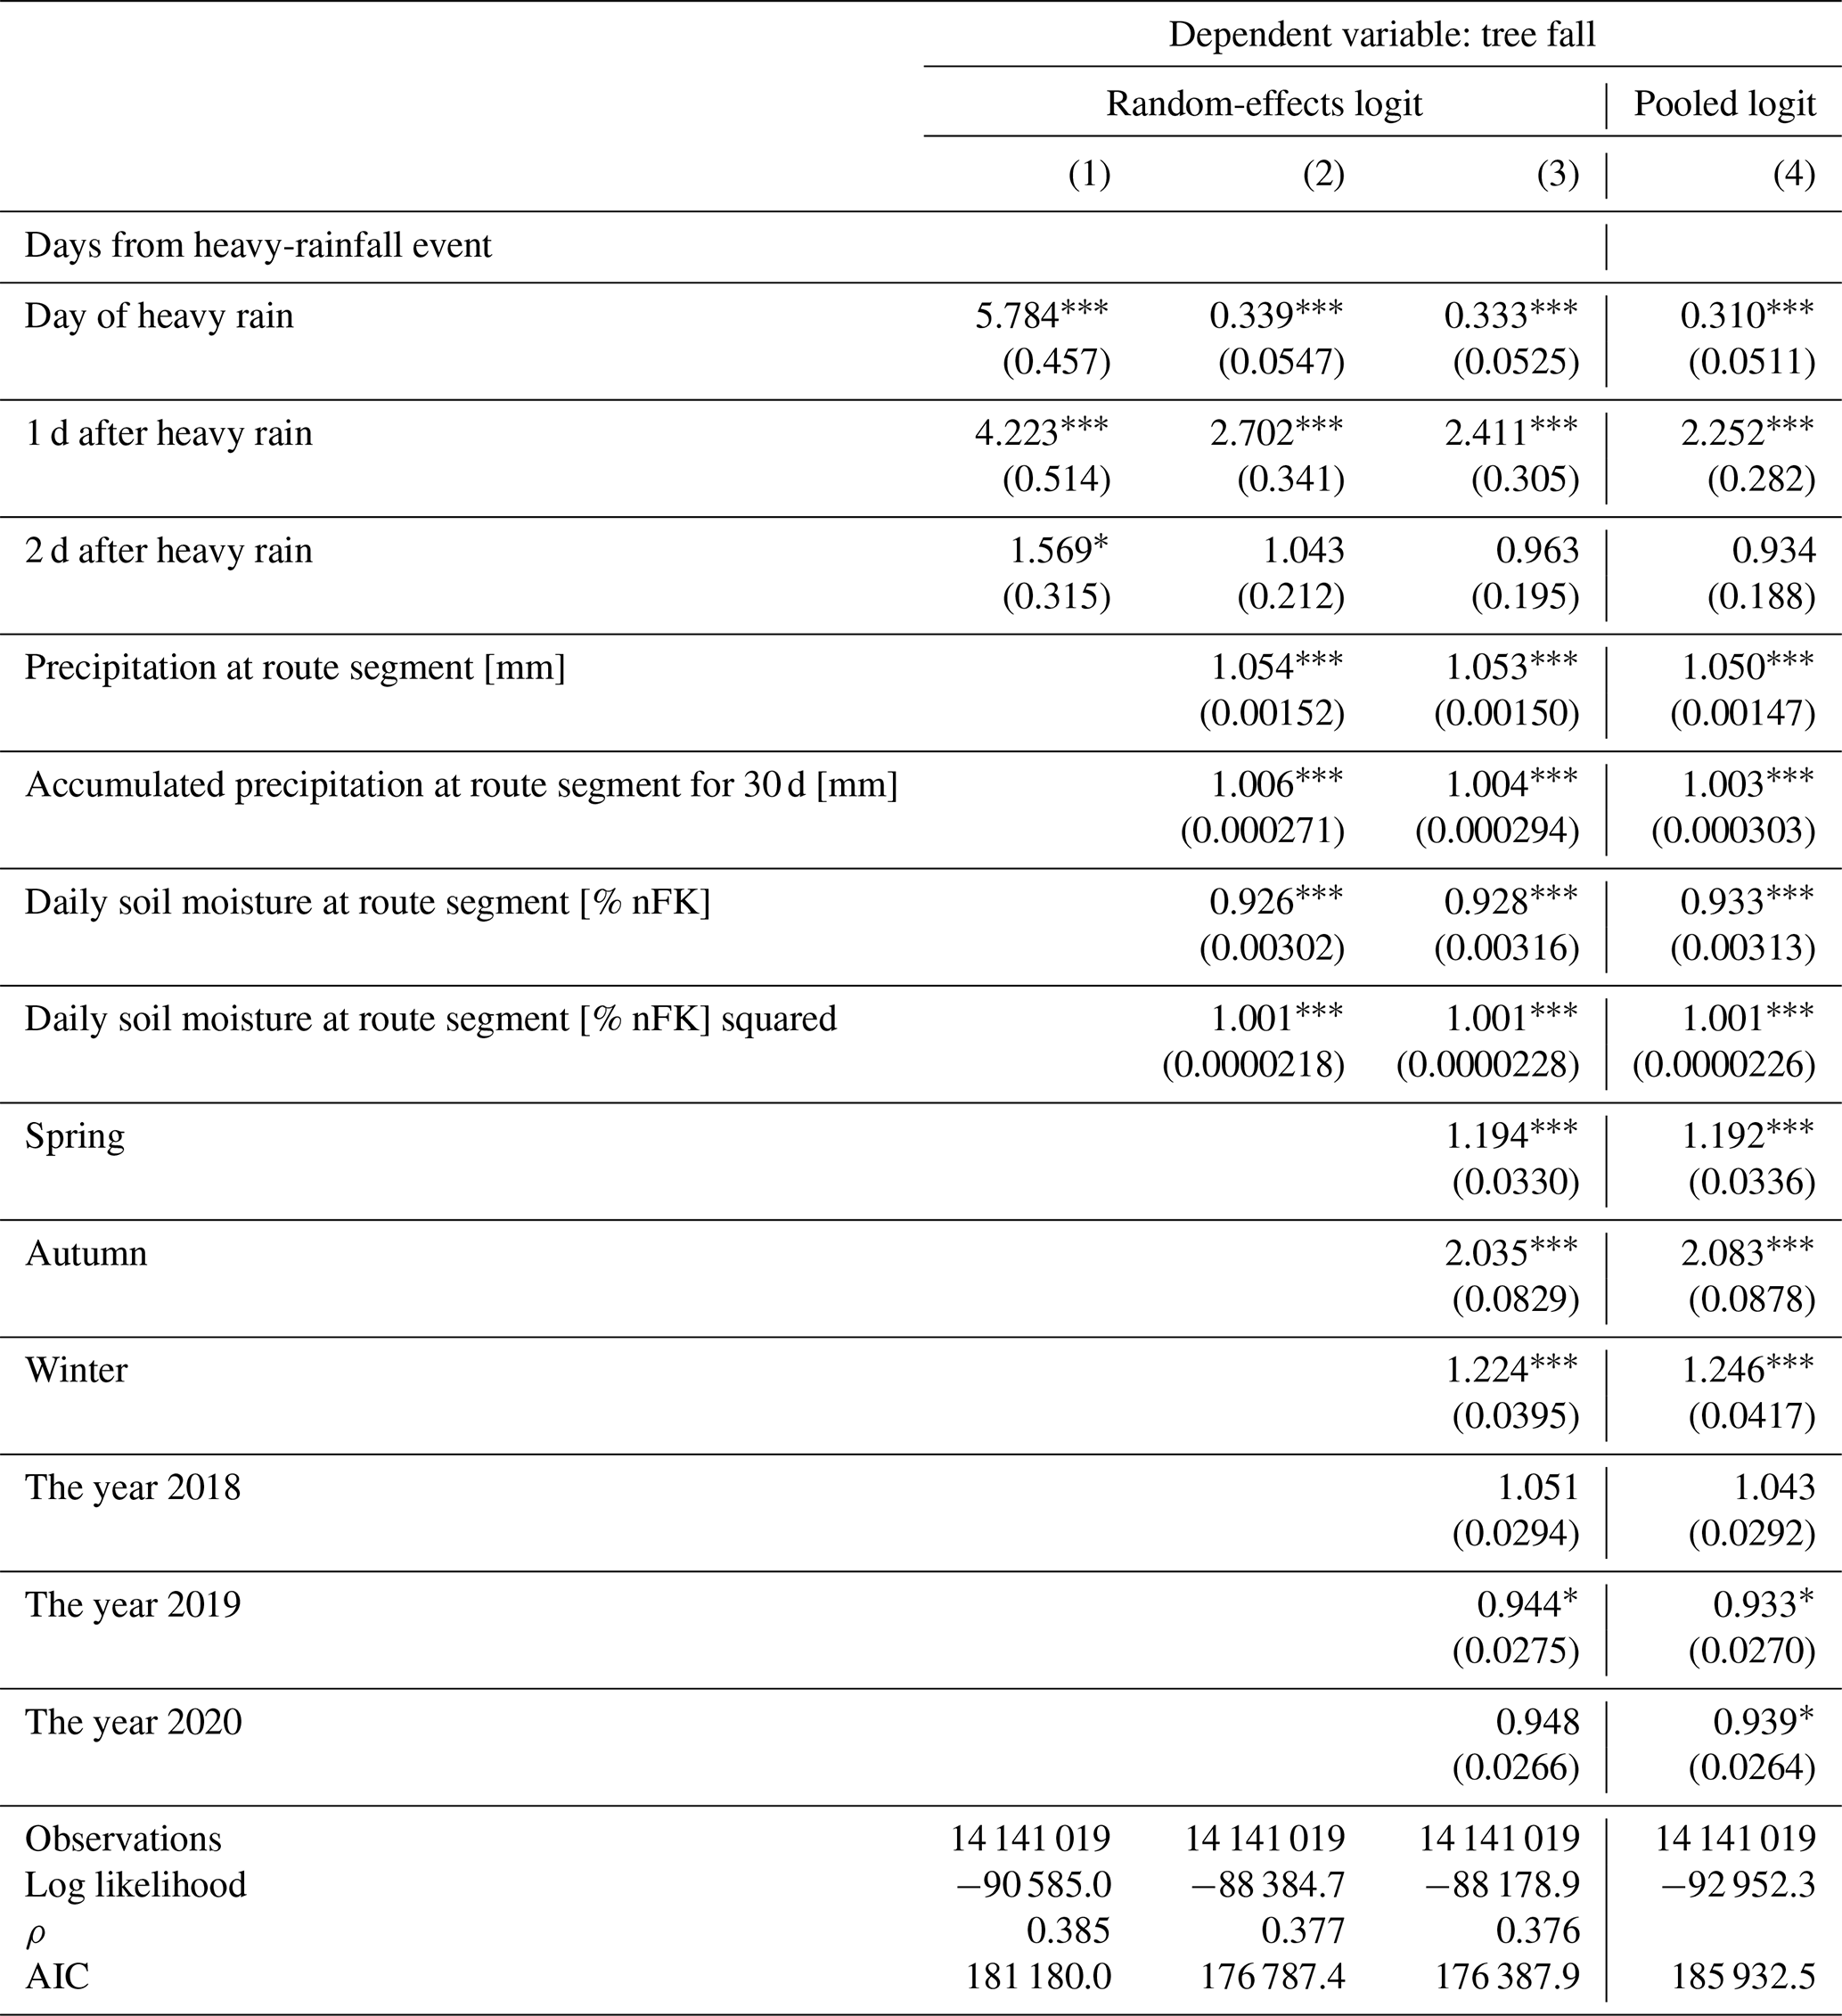
In Table A1, column (1) indicates that the odds of a tree fall occurring are 4 times higher when there was heavy rainfall in the last 3 d versus no heavy rain. This effect, however, becomes less than 1 upon addition of the control variables precipitation, accumulated precipitation, and daily soil moisture, as seen in columns (2) and (3). This means that when keeping meteorological variables constant, the odds of a tree fall event are lower during heavy rain versus when no heavy rain occurs. In columns (4) and (5), the interactions between heavy rain and the control variables are included, and this causes an even bigger jump in the coefficient estimate of heavy rain, indicating that heavy rain indeed has an effect on the incidence of tree fall and that this effect varies depending on the meteorological situation. The pooled logit estimates in column (6) do not differ significantly from the results of the full model in column (5), suggesting that the unobserved individual heterogeneity of the route segments does not play a crucial role in determining the relationship between heavy rainfall and tree fall incidence. The odds ratios computed based on the means of the meteorological variables in columns (4) to (6) are of similar magnitudes to the coefficient of the simple logistic regression in column (1). If a simpler model were selected to potentially avoid overfitting, say the model in column (1), then the results would not differ by very much. However, model (5) is preferred because it overcomes the omitted variable bias and provides a more nuanced picture of the complex relationship between heavy rainfall and the incidence of tree fall.
Table A1Tree fall: random-effects and pooled logistic regressions with successive inclusion of control variables.
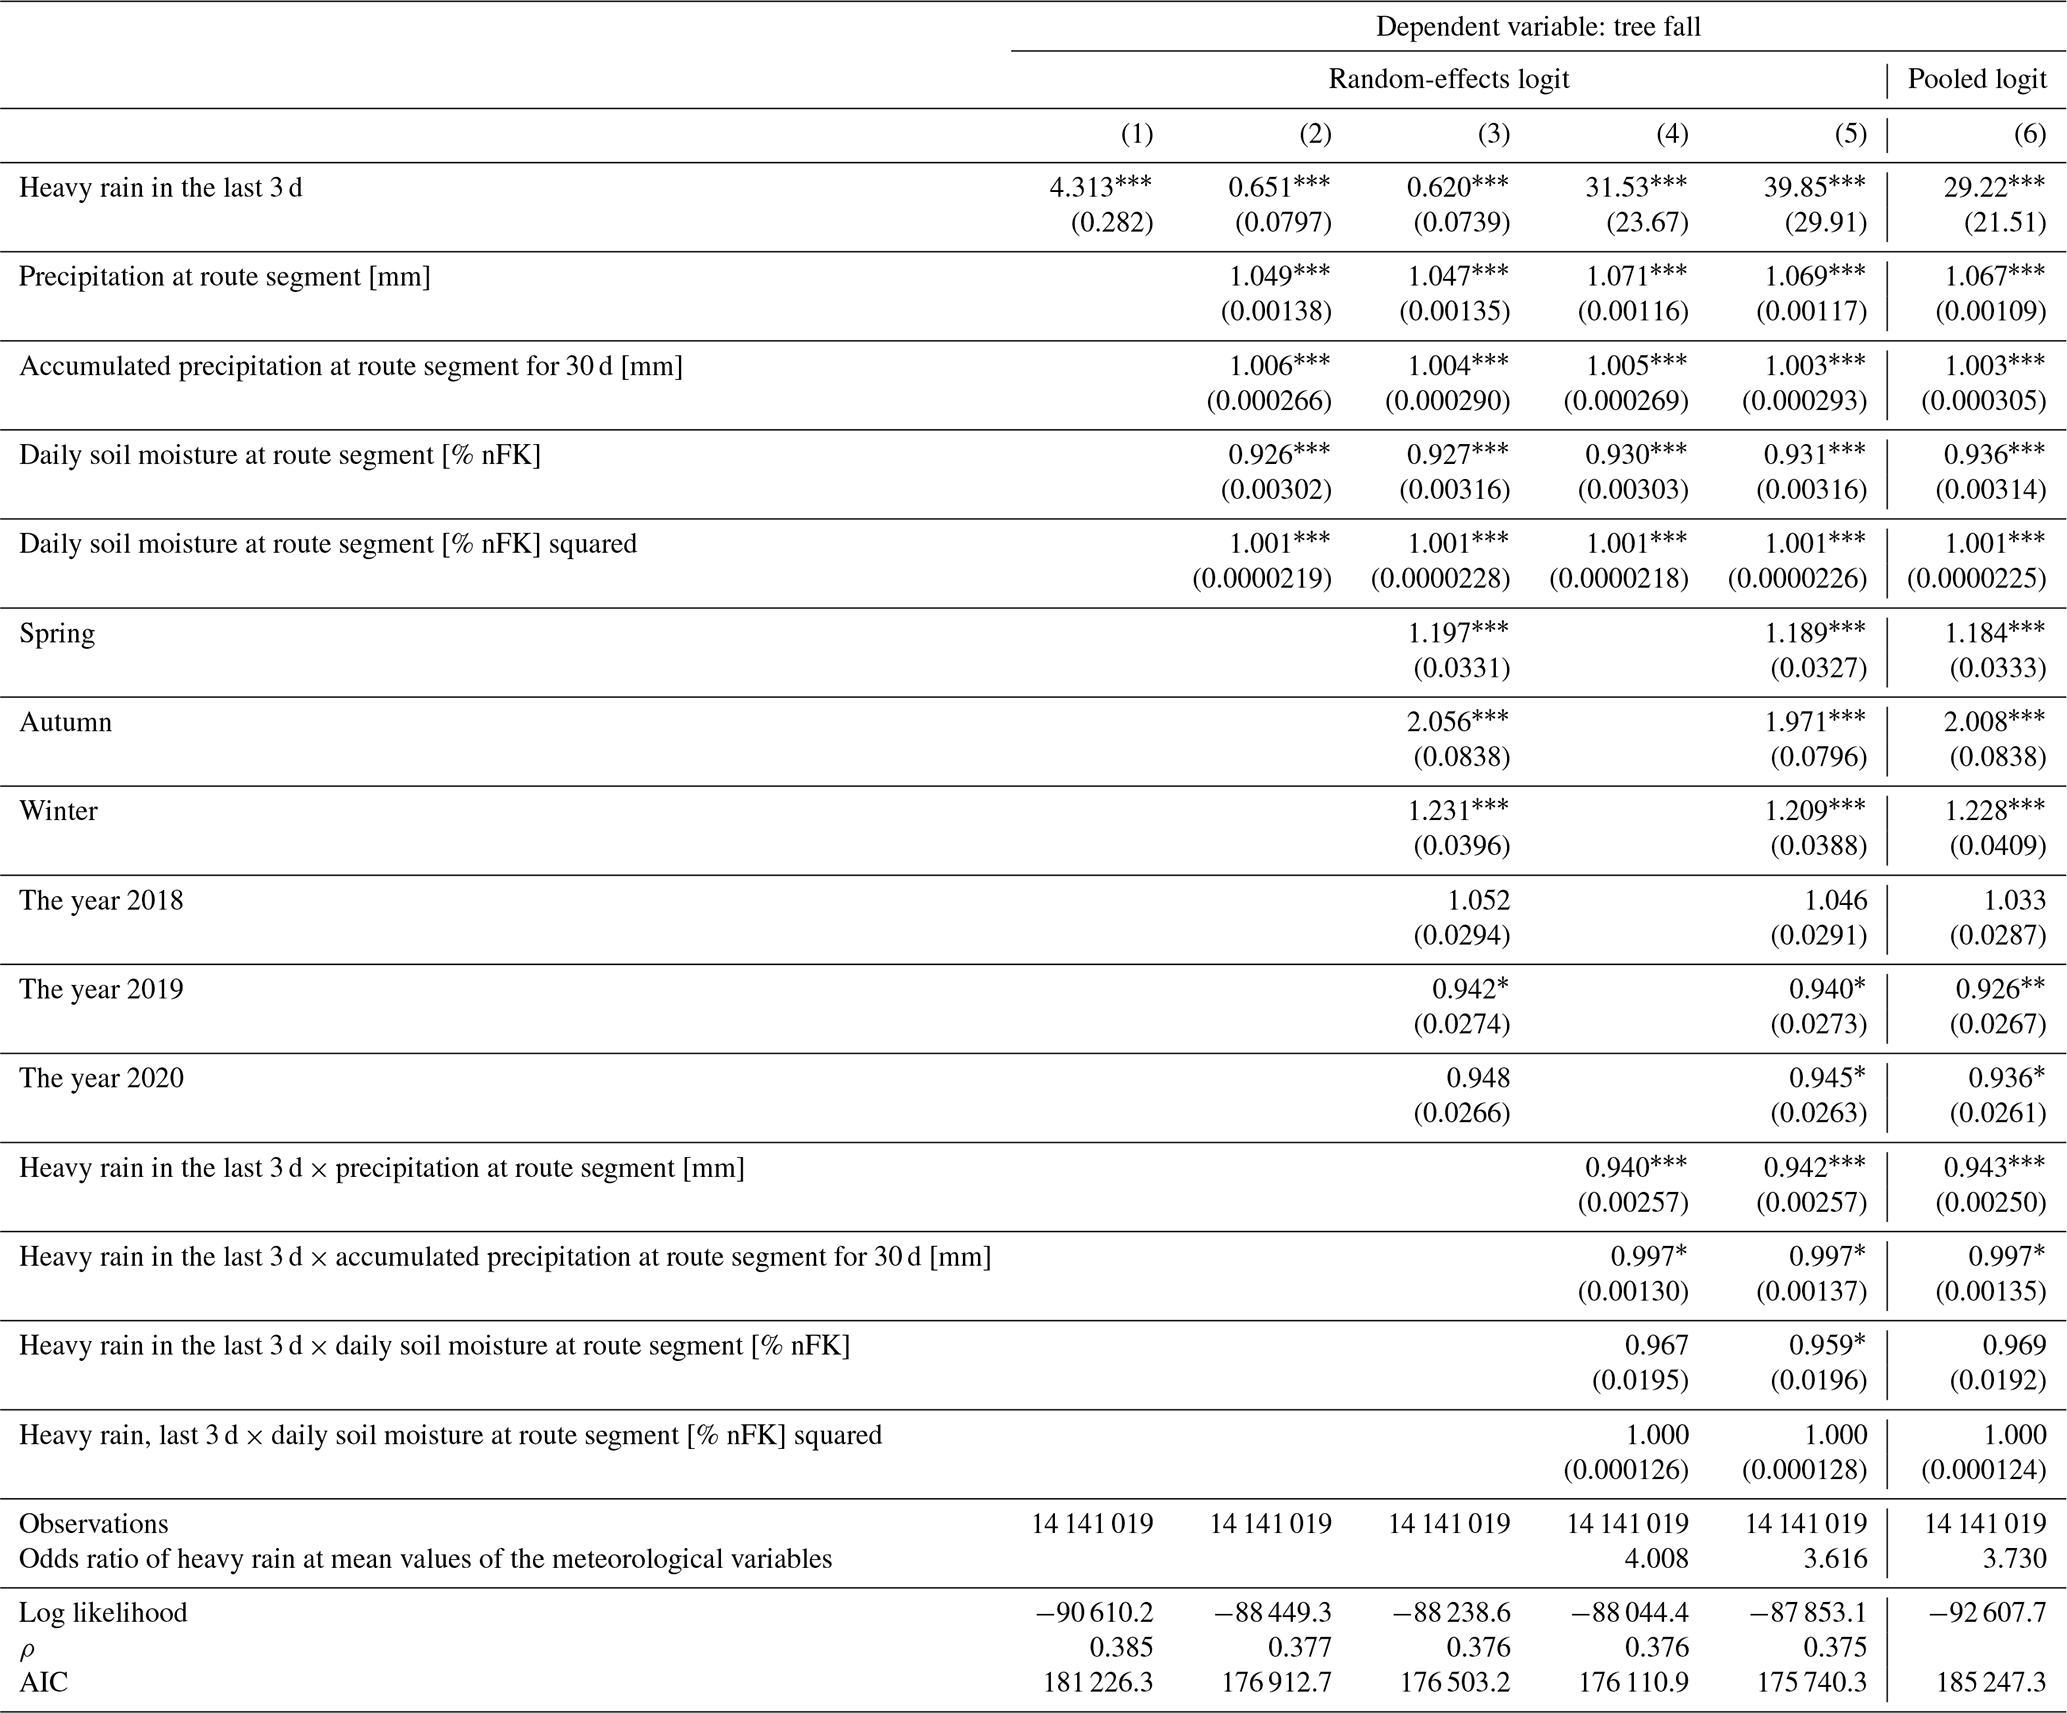
All values are exponentiated coefficients (odds ratios) with standard errors in parentheses. * p<0.05, p<0.01, and p<0.001.
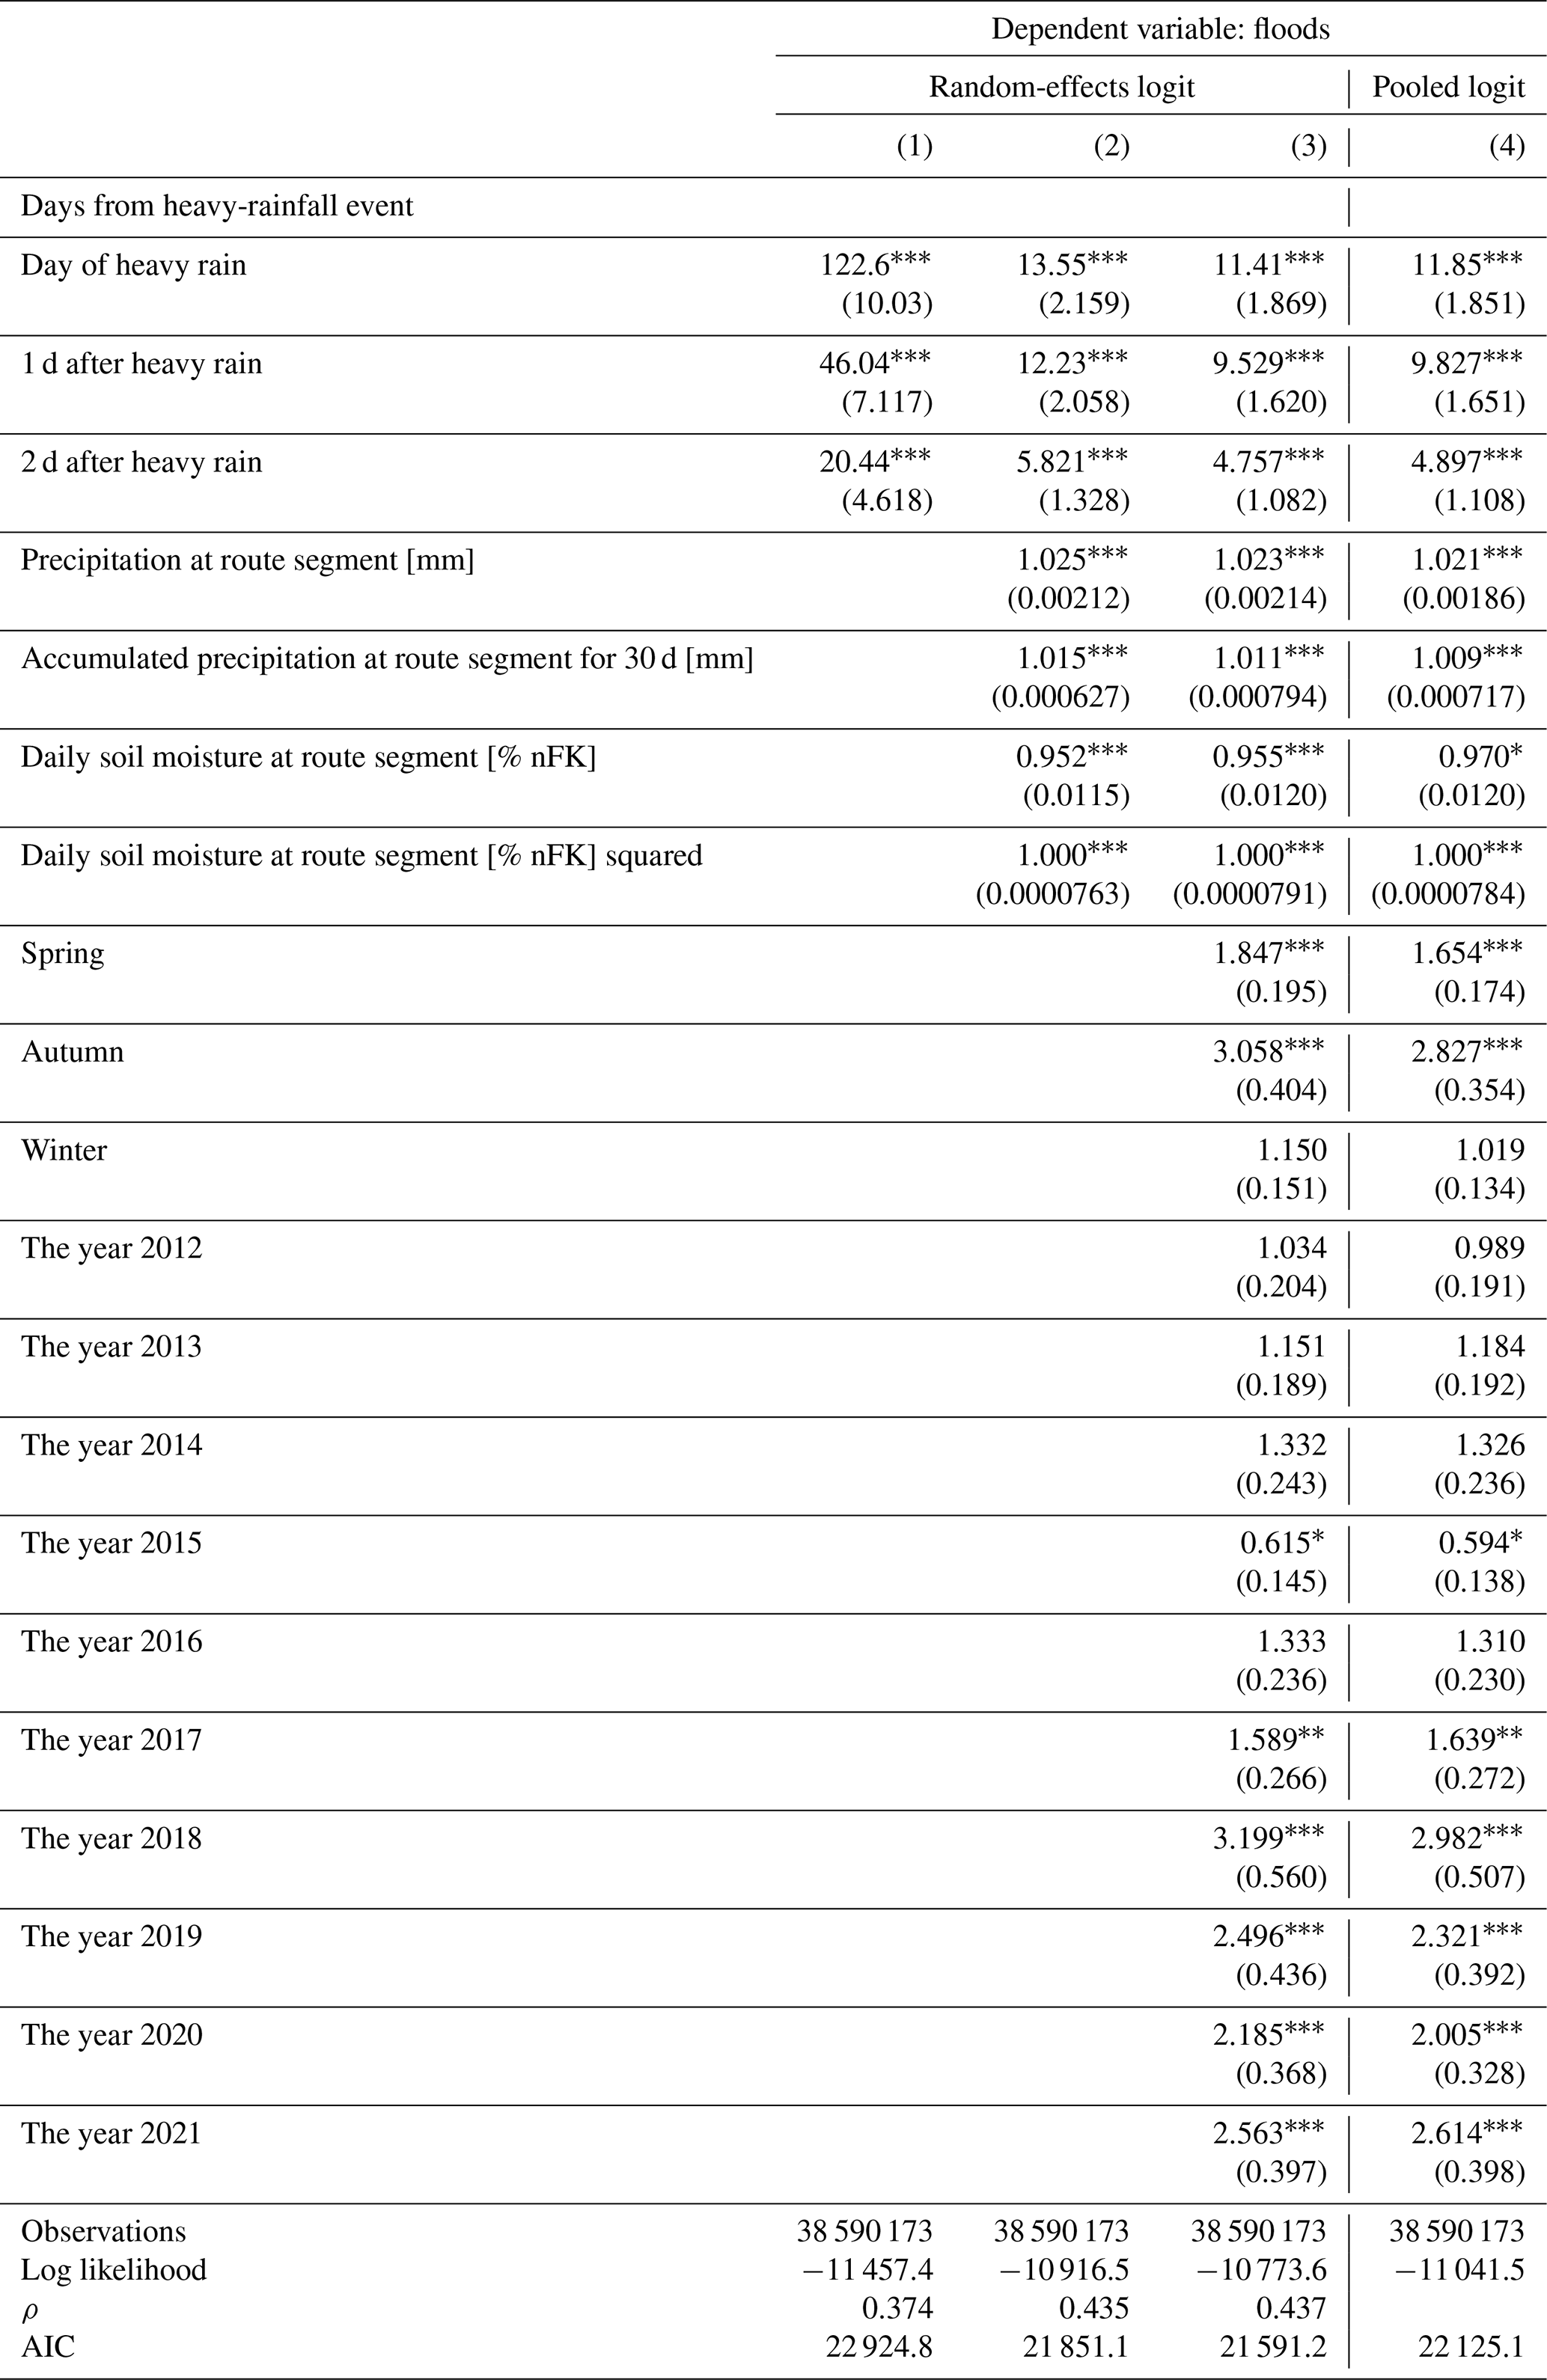
For flood hazards (Table A2), the odds ratio of heavy rain is close to or greater than 10 for all models, indicating that the result is robust to the choice of controls. When comparing the odds ratio in model (1) to the odds ratio at the means in models (4)–(6), one can observe that although they are similar in magnitude, the value in model (1) is still somewhat larger. This could suggest that for floods in particular, the omitted variable bias is quite substantial and that including meteorological controls is crucial. The smaller coefficient of the pooled logit in column (6) compared to the full model in column (5) suggests that for flood events, unobserved individual heterogeneity in the route segments (for example inclination) may influence the effect of heavy rain on flood incidence.
Table A2Flood: random-effects and pooled logistic regressions with successive inclusion of control variables.
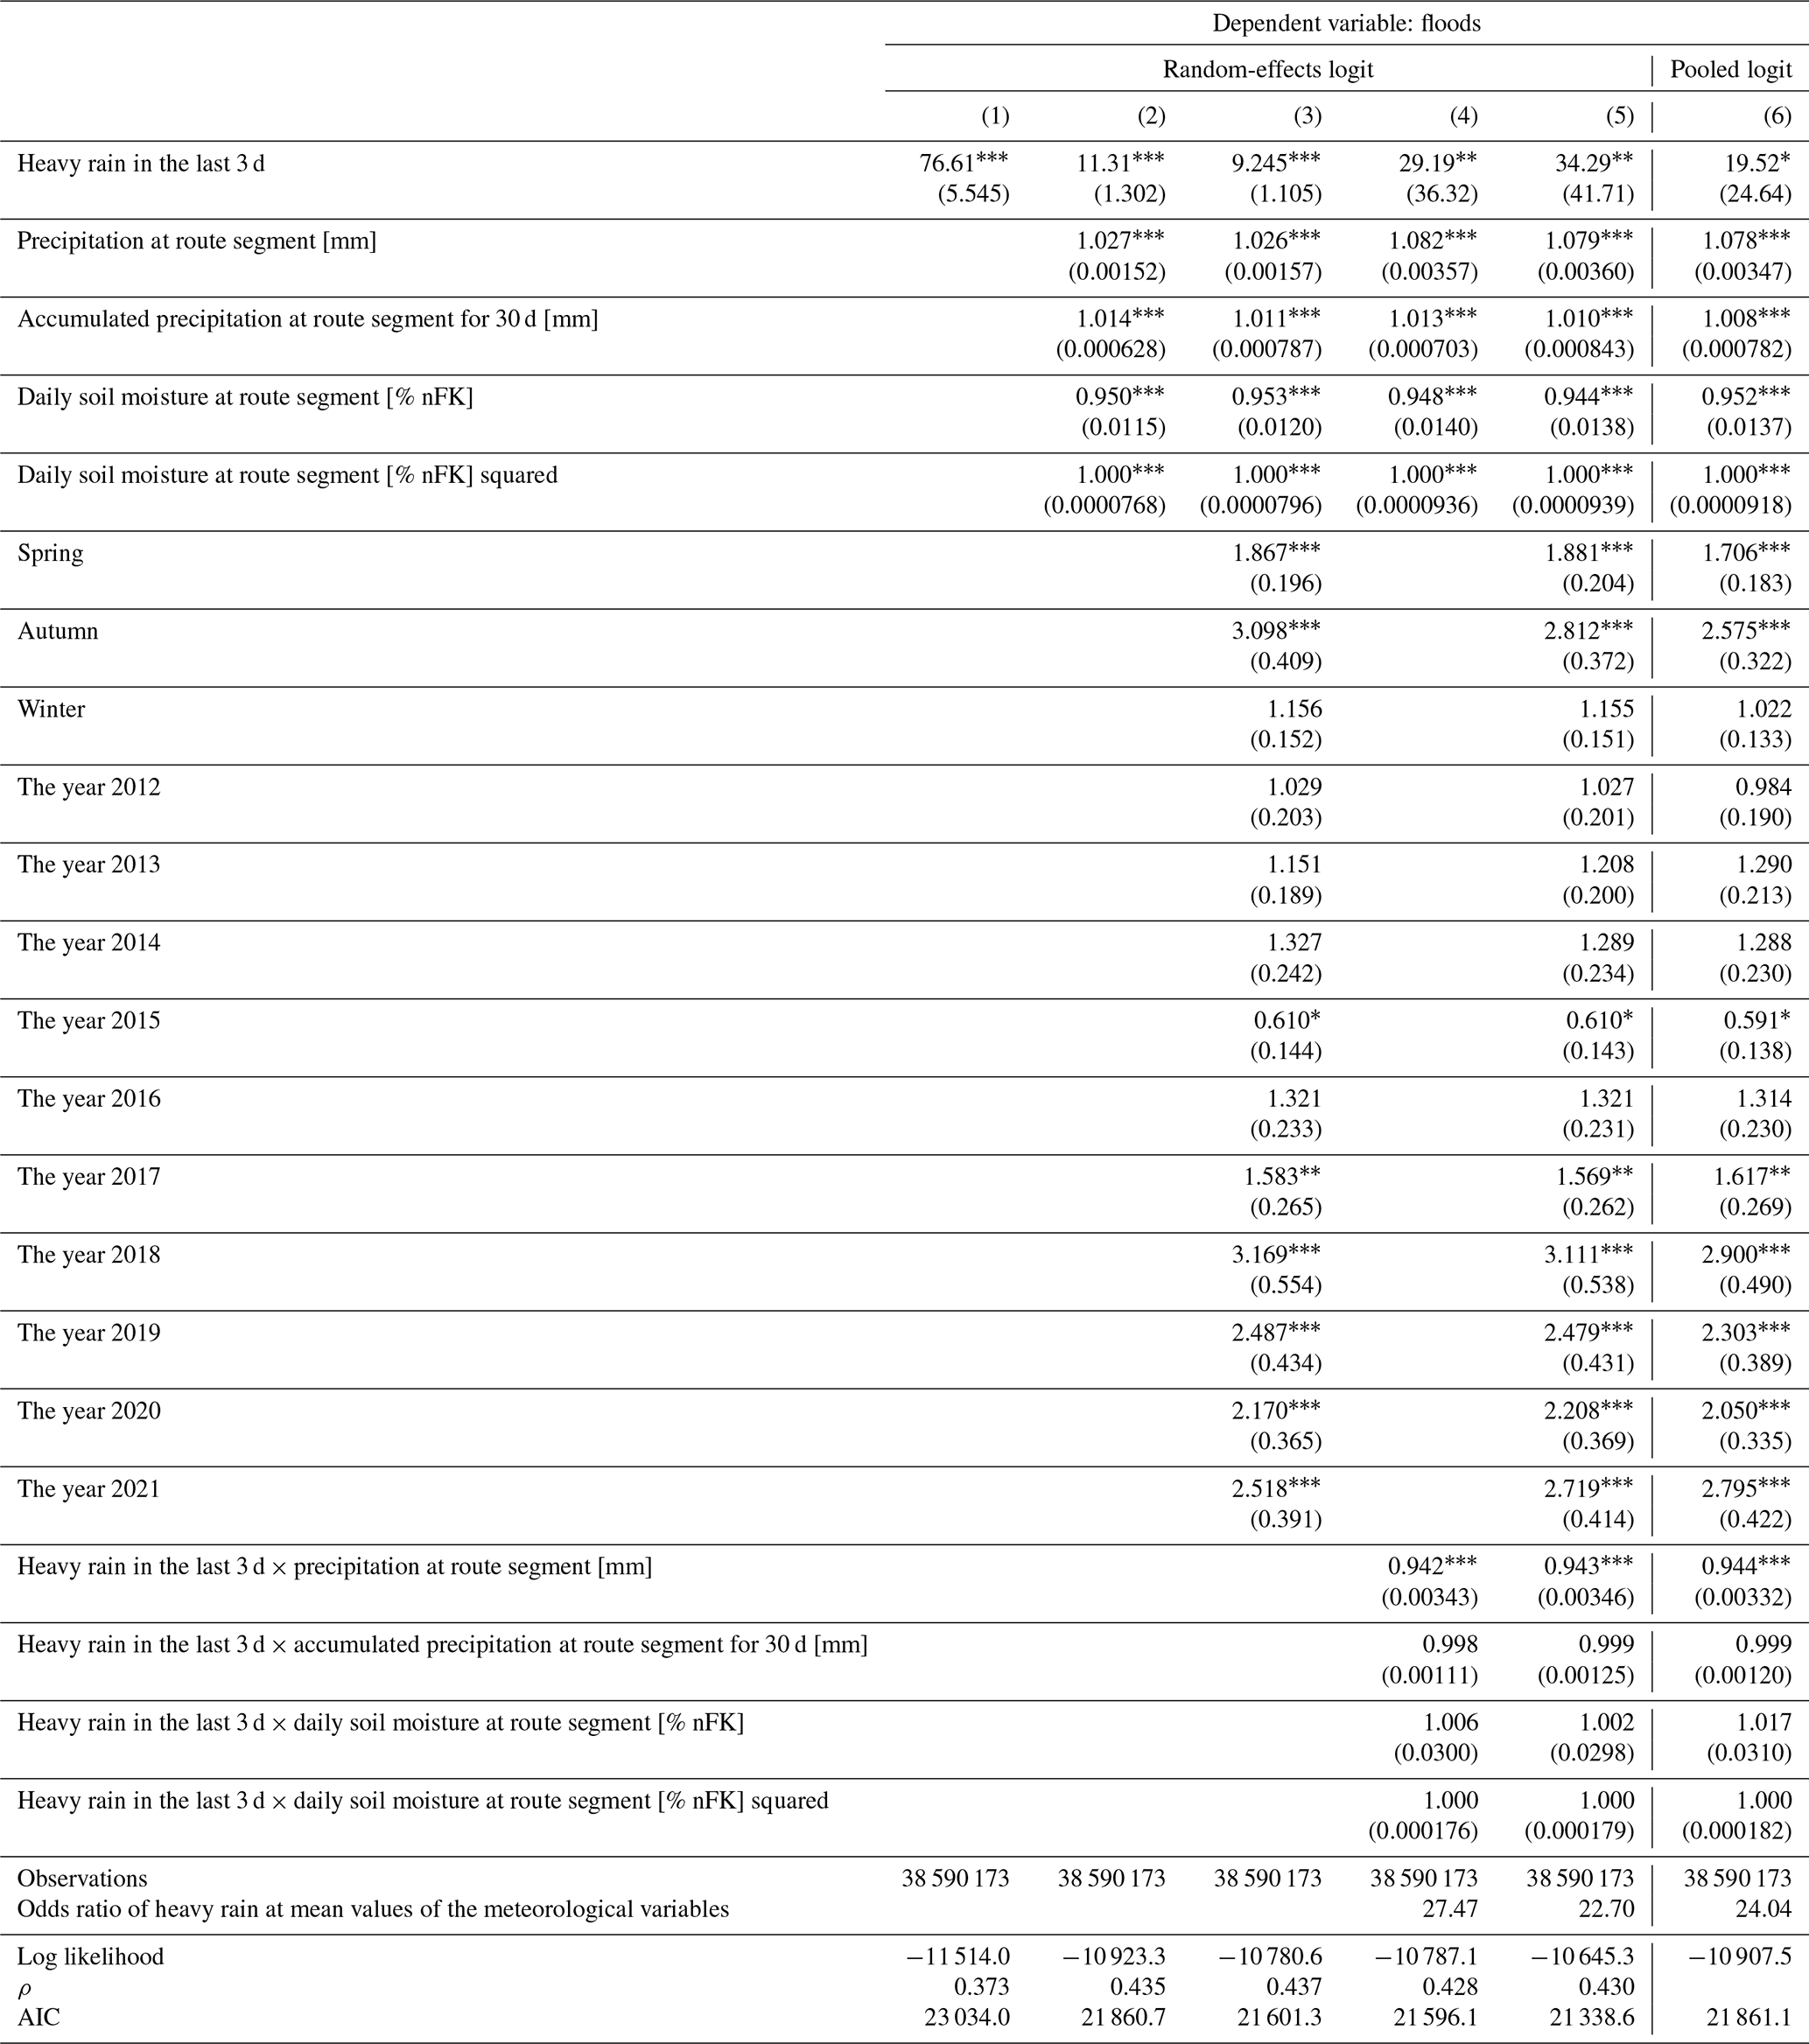
All values are exponentiated coefficients (odds ratios) with standard errors in parentheses. * p<0.05, p<0.01, and p<0.001.
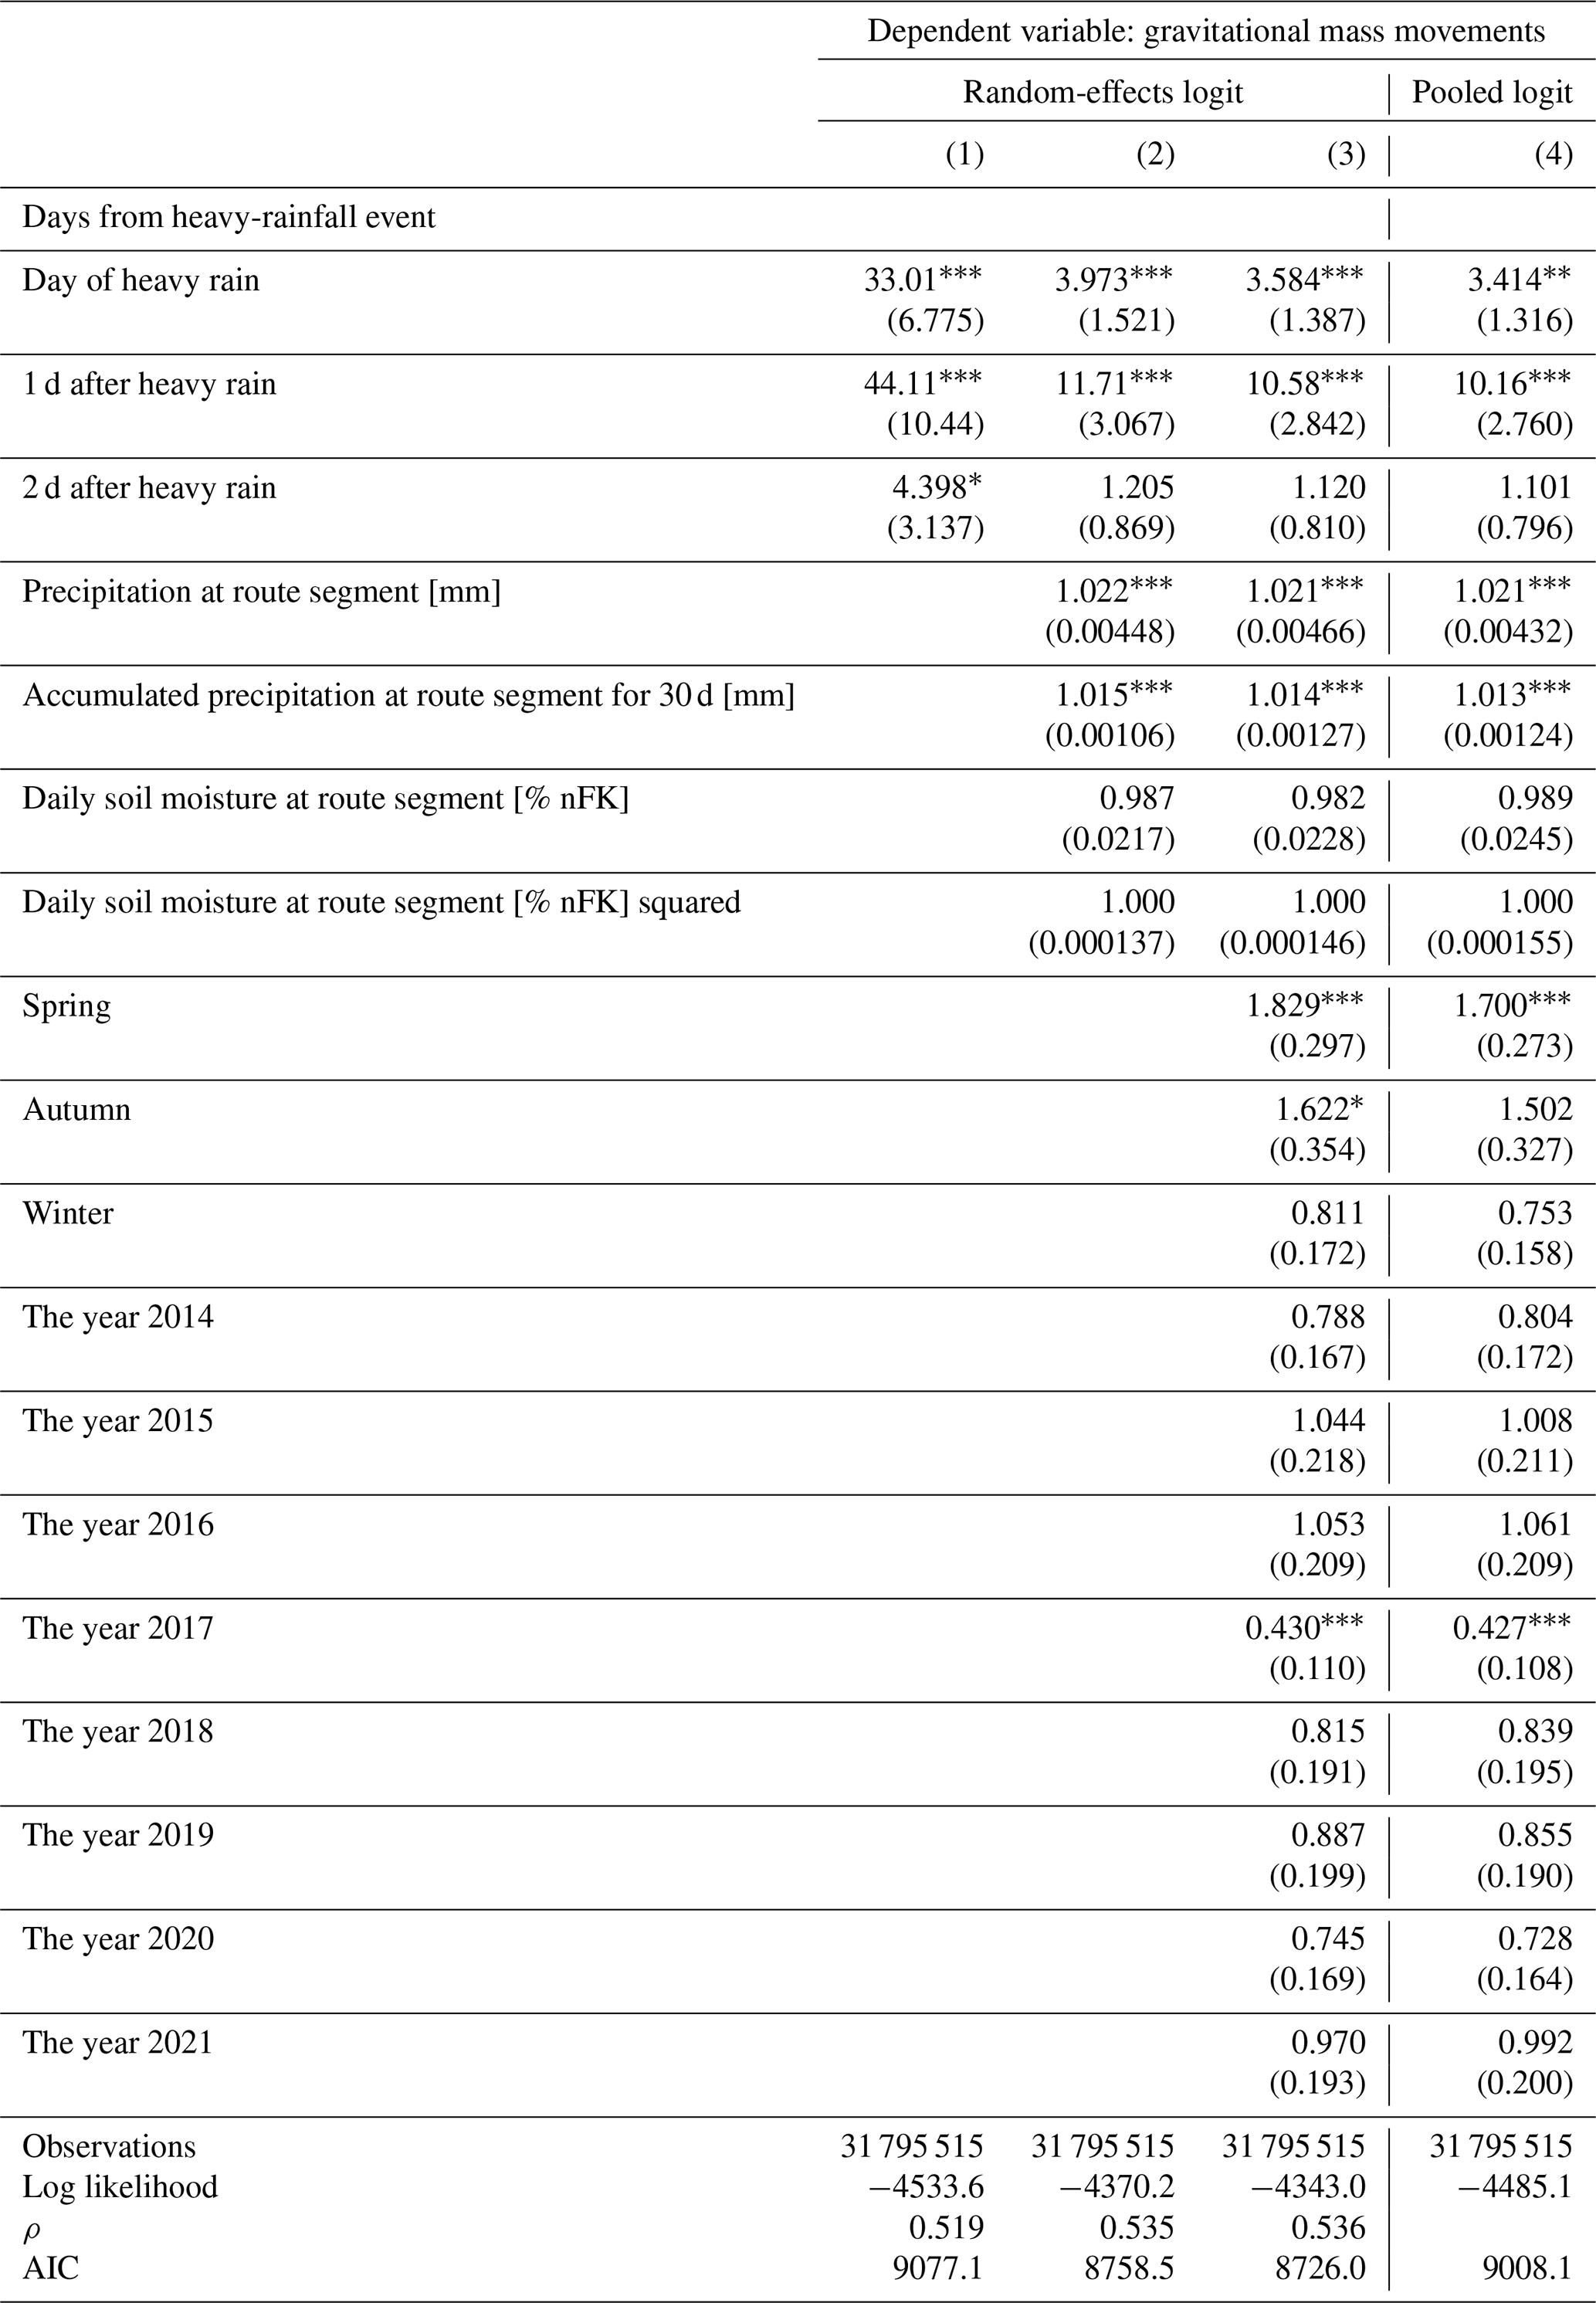
For gravitational mass movements (Table A3), the odds ratio in the simple regression in column (1) is of the same magnitude as the odds ratios at the mean (at the bottom of columns 2 to 6) once interactions are added. However, with the addition of interaction terms, the statistical significance of heavy rain disappears. One could perceive this as potentially indicating overfitting, but the model in column (4) with interactions is a simpler model with fewer parameters than the model in column (3) without interactions. Model complexity alone did not cause the coefficient of heavy rain to lose its significance, which could suggest that it is instead omitted variable bias that is at play here. Nevertheless, one could argue that a simpler model, say that in column (1), might still be preferable, particularly for gravitational mass movements, which are at most risk of overfitting due to the low number of events in the data. This will not change the interpretation by very much, since the odds ratio in model (1) and the odds ratios at the means in model (5) are similar in magnitude. However, from these results alone, one cannot conclude a statistically robust effect of heavy rainfall on gravitational mass movements. More data are required to make solid conclusions.
Table A3Gravitational mass movement: random-effects and pooled logistic regressions with successive inclusion of control variables.
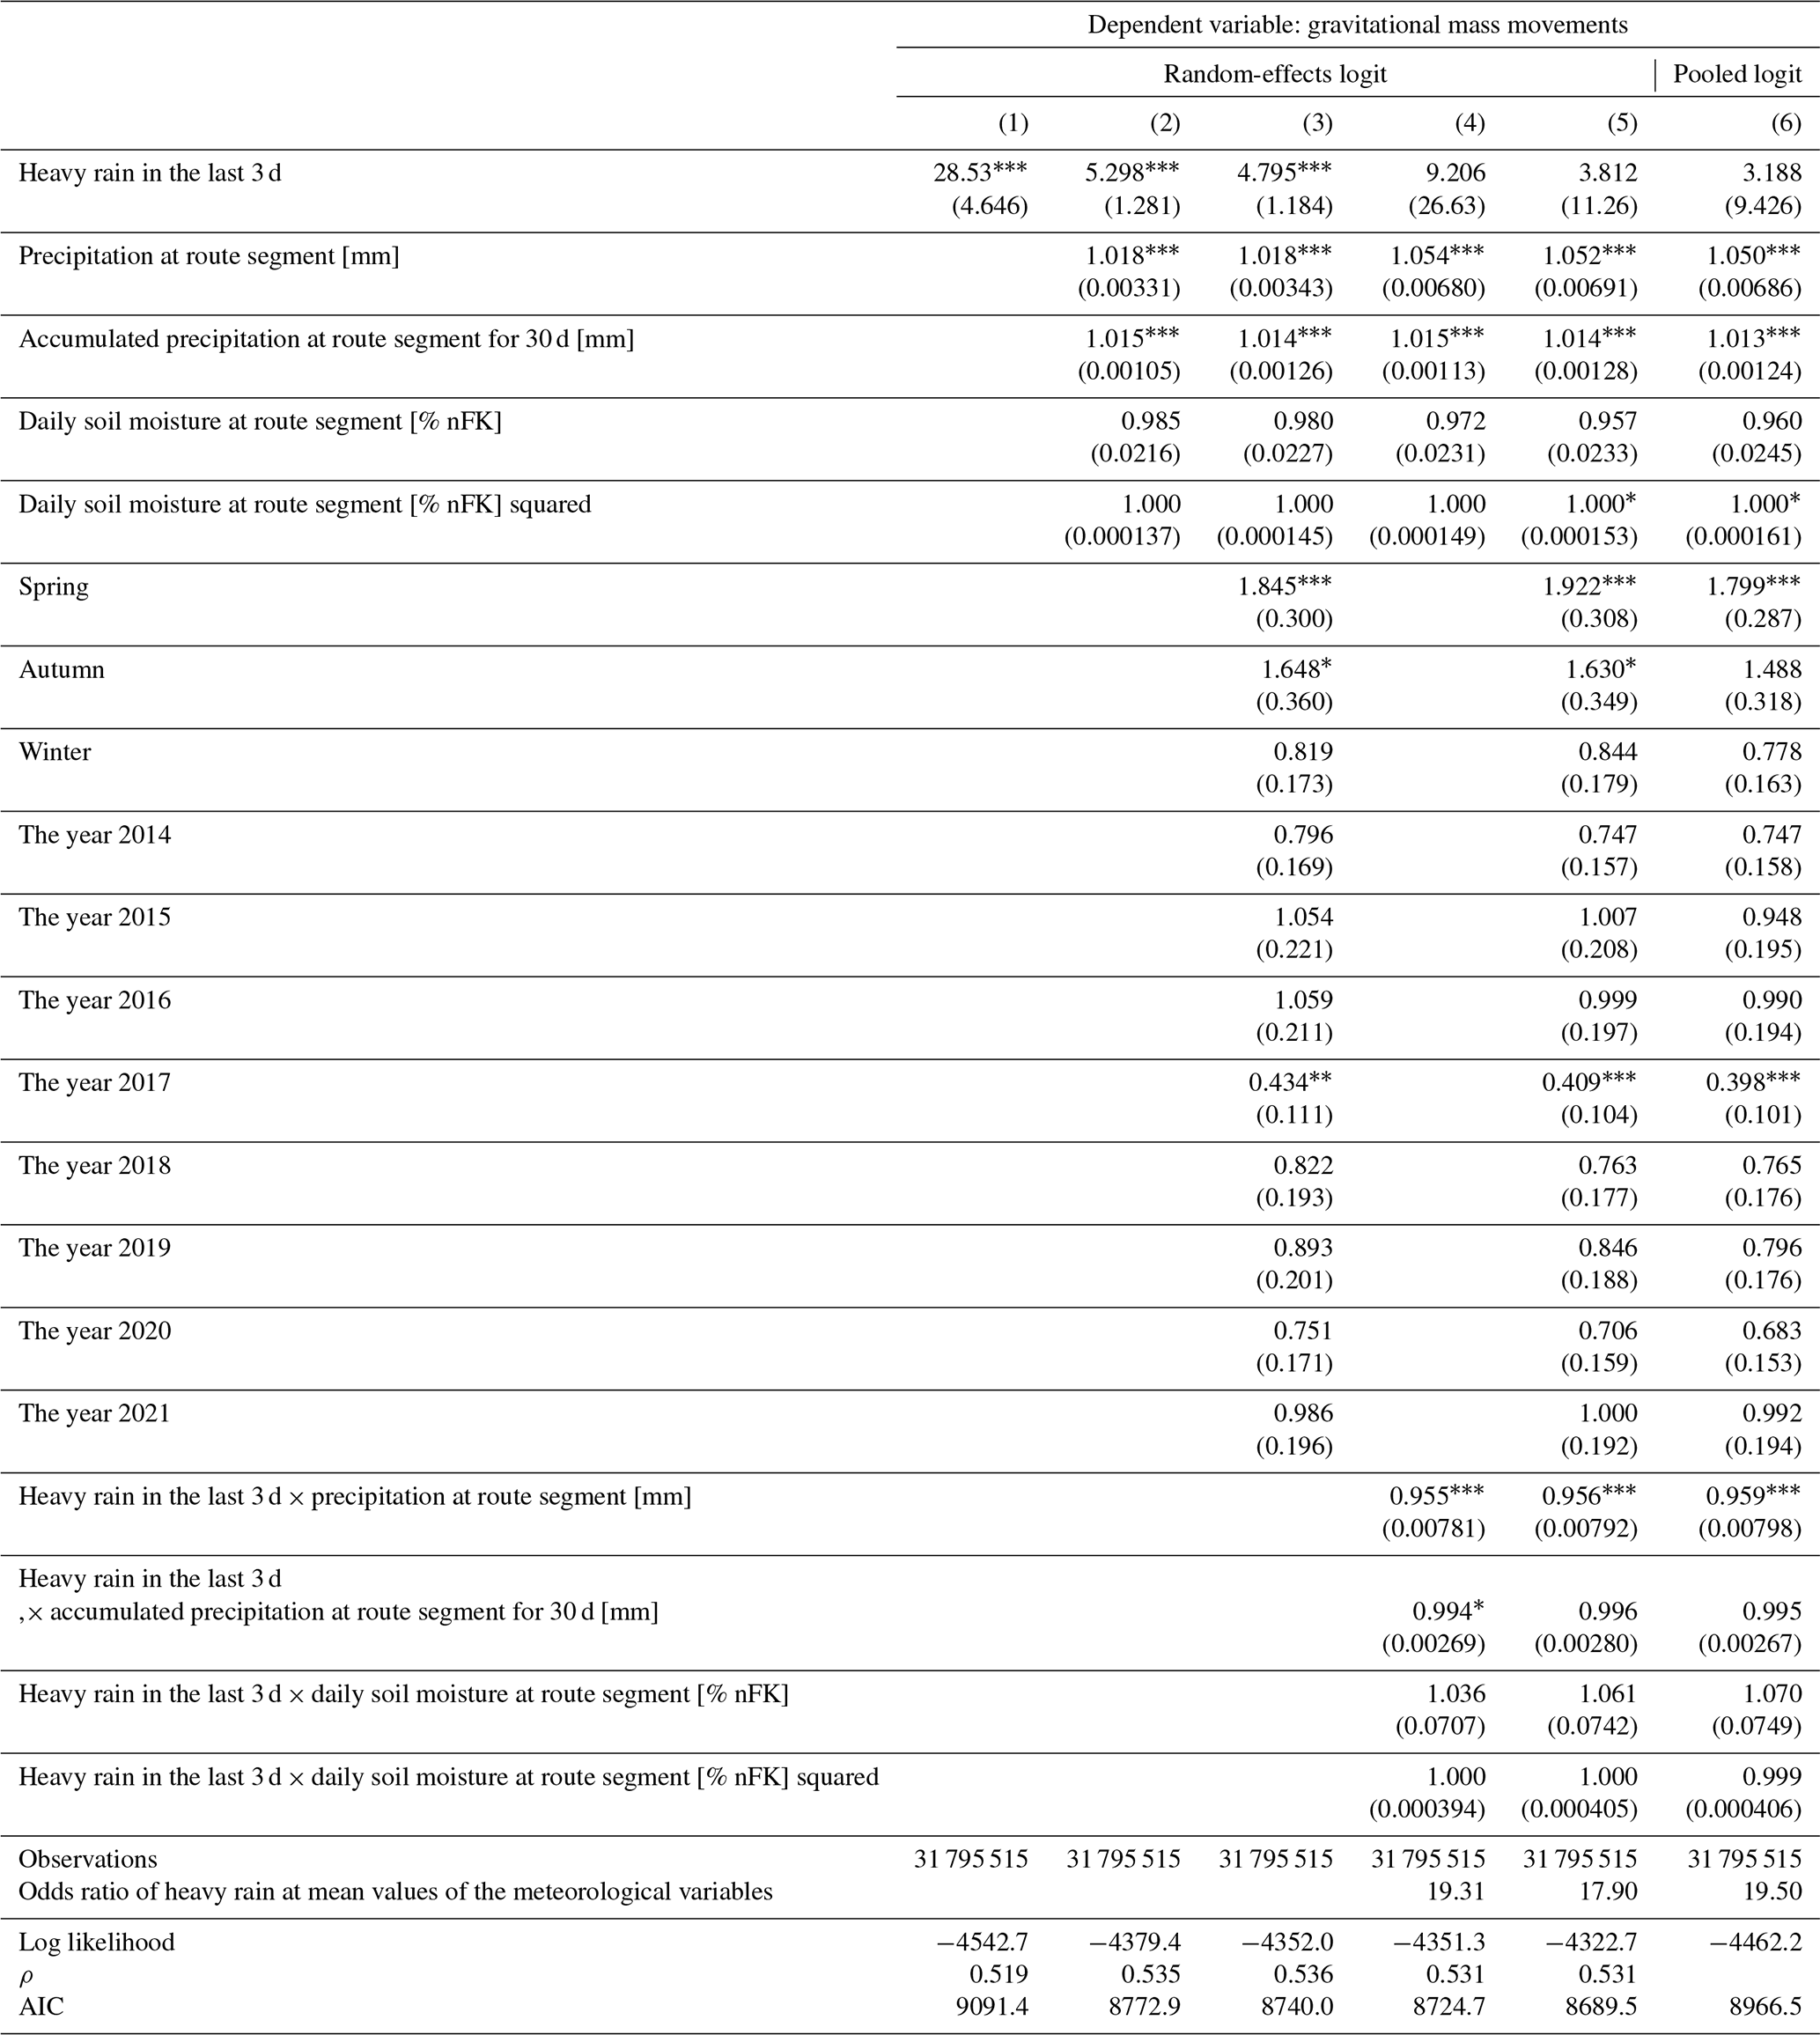
All values are exponentiated coefficients (odds ratios) with standard errors in parentheses. * p<0.05, p<0.01, and p<0.001.
In Tables A1, A2, and A3, the model with the best fit, i.e., the highest log likelihood and the lowest AIC, is the model in column (5), which is the result presented in Table 2 of the main text.
Tables A4, A5, and A6 provide estimation results for the model in Table 4 of the main text, where a dummy variable for the day of the heavy rain, 1 d after heavy rain, and 2 d after heavy rain are the variables of interest. In these tables, columns (1)–(3) have estimates of a random-effects logit with successively additional control variables, while column (4) has estimates of a pooled logit regression of the full model. The results in column (3) of Tables A3, A4, and A5 are the same as those presented in Table 4. Similar to the previous tables, a considerable jump in the odds ratios can be seen between columns (1) and (2), potentially due to omitted variable bias. However, for floods and gravitational mass movements, the direction of relative effects across time remains the same for all models despite the differences in magnitudes. For flood events (Table A5), the odds of having a flood are highest on the same day as the heavy rainfall, and decrease the further away in time the rainfall occurred. For gravitational mass movements (Table A6), the odds are highest 1 d after heavy rainfall occurred. In the case where overfitting is a potential issue, such as for gravitational mass movements, a simpler model, such as model (2), might be preferred to the one presented in the main text (Table 4). This would not change the result that the highest odds of a mass movement event come 1 d after heavy rain.
For tree fall (Table A4), both the magnitude of the effect and the direction across time change once control variables are added. Without the control variables (column 1), the odds of tree fall are highest on the same day as the occurrence of heavy rainfall and decrease in the following days. However, once the meteorological variables are added, the odds of a tree fall event on the same day as the heavy rain are in fact lower than the odds of when there is no heavy rain. This can be seen in columns (2)–(4) of Table A4, where the odds ratios on the day of heavy rain are less than 1. On the other hand, 1 d after heavy rain, the odds of a tree fall event are around twice as high as on days without heavy rain, and the effect is highest on this day.
Table A4Tree fall: random-effects and pooled logistic regressions different numbers of days after a heavy-rainfall event.
All values are exponentiated coefficients (odds ratios) with standard errors in parentheses. * p<0.05, p<0.01, and p<0.001.
Table A5Flood: random-effects and pooled logistic regressions different numbers of days after a heavy-rainfall event.
All values are exponentiated coefficients (odds ratios) with standard errors in parentheses. * p<0.05, p<0.01, and p<0.001.
In Tables A4, A5, and A6, the goodness-of-fit parameters performed best in the full model in column (3), whose results are presented in the main text.
Table A6Gravitational mass movement: random-effects and pooled logistic regressions different numbers of days after a heavy-rainfall event.
All values are exponentiated coefficients (odds ratios) with standard errors in parentheses. * p<0.05, p<0.01, and p<0.001.
In summary, there is a trade-off between omitted variable bias and overfitting in this empirical analysis, and the results presented in the main text are the ones deemed most appropriate for the investigation of the relationship between heavy rainfall and the incidence of natural hazards along railway lines. In the cases most at risk of overfitting due to the low number of events, particularly for gravitational mass movements, the interpretation of the results would not change if a simpler model were to be selected.
The CatRaRE data used for this study are available at https://opendata.dwd.de/climate_environment/CDC/help/landing_pages/doi_landingpage_CatRaRE_W3_Eta_v2022.01-de.html (Lengfeld et al., 2022).
Conceptualization – SoS, FB, VF, and KF. Methodology – SoS, FB, VF, and KF. Software – FB, VF, and KF. Data analysis and interpretation – SoS, FB, VF, and KF. Writing (original draft preparation) – SoS. Writing (review and editing) – SoS, FB, VF, and KF. Visualization – FB, VF, and KF. All authors have read and agreed to the published version of the paper.
The contact author has declared that none of the authors has any competing interests.
Publisher’s note: Copernicus Publications remains neutral with regard to jurisdictional claims made in the text, published maps, institutional affiliations, or any other geographical representation in this paper. While Copernicus Publications makes every effort to include appropriate place names, the final responsibility lies with the authors.
The authors thank DB Netz AG for providing data from the damage database.
This paper was edited by Uwe Ulbrich and reviewed by Ugur Ozturk and two anonymous referees.
Allen, M. R. and Ingram, W. J.: Constraints on future changes in climate and the hydrologic cycle, Nature, 419, 224–232, 2002.
Aon: Global Catastrophe Recap: July 2021, Aon-Report, London, 19 pp., https://info.aon.de/wp-content/uploads/Aon-July-Global-Recap.pdf (last access: 27 October 2023), 2021.
Araújo, J. R., Ramos, A. M., Soares, P. M. M., Melo, R., Oliveira, S. C., and Trigo, R. M.: Impact of extreme rainfall events on landslide activity in Portugal under climate change scenarios, Landslides, 19, 2279–2293, https://doi.org/10.1007/s10346-022-01895-7, 2022.
Bernet, D. B., Trefalt, S., Martius, O., Weingartner, R., Mosimann, M., Röhtlisberger, V., and Zischg, A. P.: Characterizing precipitation events leading to surface water flood damage over large regions of complex terrain, Environ. Res. Lett., 14, 064010, https://doi.org/10.1088/1748-9326/ab127c, 2019.
Bevacqua, E., De Michele, C., Manning, C., Couasnon, A., Ribeiro, A. F. S., Ramos, A. M., Vignotto, E., Bastos, A., Blesić, S., Durante, F., Hillier, J., Oliveira, S. C., Pinto, J. G., Ragno, E., Rivoire, P., Saunders, K., van der Wiel, K., Wu, W., Zhang, T., and Zscheischler, J.: Guidelines for Studying Diverse Types of Compound Weather and Climate Events, Earth's Future, 9, e2021EF002340, https://doi.org/10.1029/2021EF002340, 2021.
Bíl, M., Andrášik, R., Nezval, V., and Bílová, M.: Identifying locations along railway networks with the highest tree fall hazard, Appl. Geogr., 87, 45–53, https://doi.org/10.1016/j.apgeog.2017.07.012, 2017.
Braud, I., Lagadec, L.-R., Moulin, L., Chazelle, B., and Breil, P.: A method to use proxy data of runoff-related impacts for the evaluation of a model mapping intense storm runoff hazard: application to the railway context, Nat. Hazards Earth Syst. Sci., 20, 947–966, https://doi.org/10.5194/nhess-20-947-2020, 2020.
Chiang, S.-H. and Chang, K.-T.: The potential impact of climate change on typhoon-triggered landslides in Taiwan, 2010–2099, Geomorphology, 133, 143–151, https://doi.org/10.1016/j.geomorph.2010.12.028, 2011.
Deutscher Bundestag: Beantwortung der kleinen Anfragen vom 11. März 2019, Deutscher Bundestag, Drucksache 19/8434, https://dserver.bundestag.de/btd/19/084/1908434.pdf (last access: 27 October 2023), 2019.
Donnini, M., Napolitano, E., Salvati, P., Ardizzone, F., Bucci, F., Fiorucci, F., Santangelo, M., Cardinali, M., and Guzzetti, F.: Impact of event landslides on road networks: a statistical analysis of two Italian case studies, Landslides, 14, 1521–1535, https://doi.org/10.1007/s10346-017-0829-4, 2017.
Fabella, V. M. and Szymczak, S.: Resilience of Railway Transport to Four Types of Natural Hazards: An Analysis of Daily Train Volumes, Infrastructures, 6, 174, https://doi.org/10.3390/infrastructures6120174, 2021.
Fischer, E. M. and Knutti, R.: Anthropogenic contribution to global occurrence of heavy-precipitation and high-temperature extremes, Nat. Clim. Change, 5, 560–564, 2015.
Gardiner, B., Blennow, K., Carnus, J.-M., Fleischer, P., Ingemarson, F., Landmann, G., Lindner, M., Marzano, M., Nicoll, B., Orazio, C., Peyron, J.-L., Reviron, M.-P., Schelhaas, M.-J., Schuck, A., Spielmann, M., and Usbeck, T. (Eds.): Destructive storms in European forests: past and forthcoming impacts, European Forest Institute, Joensuu, Finland, 138 pp., https://doi.org/10.13140/RG.2.1.1420.4006, 2010.
Gardiner, B., Lorenz, R., Hanewinkel, M., Schmitz, B., Bott, F., Szymczak, S., Frick, A., and Ulbrich, U.: Predicting the Risk of Tree Fall onto Railway Lines, Forest Ecol. Manag., 553, 121614, https://doi.org/10.1016/j.foreco.2023.121614, 2024.
Gariano, S. L. and Guzzetti, F.: Landslides in a changing climate, Earth-Sci. Rev., 162, 227–252, https://doi.org/10.1016/j.earscirev.2016.08.011, 2016.
Gill, C.: The flooding tolerance of woody species – a review, Forestry Abstracts, 31, 671–688, 1970.
Grote, R., Gessler, A., Hommel, R., Poschenrieder, W., and Priesack, E.: Importance of tree height and social position for drought-related stress on tree growth and mortality, Trees, 30, 1467–1482, https://doi.org/10.1007/s00468-016-1446-x 2016.
Guerreiro, S. B., Fowler, H. J., Barbero, R., Westra, S., Lenderink, G., Blenkinsop, S., Lewis, E., and Li, X. F.: Detection of continental-scale intensification of hourly rainfall extremes, Nat. Clim. Change, 8, 803–807, 2018.
Huggel, C., Clague, J. J., and Korup, O.: Is climate change responsible for changing landslide activity in high mountains?, Earth Surf. Proc. Land., 37, 77–91, 2012.
Junghänel, T., Bissolli, P., Daßler, J., Fleckenstein, R., Imbery, F., Janssen, W., Kaspar, F., Lengfeld, K., Leppelt, T., Rauthe, M., Rauthe-Schöch, A., Rocek, M., Walawender, E., and Weigl, E.: Hydro-klimatische Einordnung der Stark- und Dauerniederschläge in Teilen Deutschlands im Zusammenhang mit dem Tiefdruckgebiet Bernd, vom 12. bis 19. Juli 2021, Report, Deutscher Wetterdienst, https://www.dwd.de/DE/leistungen/besondereereignisse/niederschlag/20210721_bericht_starkniederschlaege_tief_bernd.pdf?__blob=publicationFile&v=6 (last access: 26 July 2023), 2021.
Kallmeier, E., Knobloch, A., and Hertwig, T.: Erstellung einer ingenieurgeologischen Gefahrenhinweiskarte zu Hang- und Böschungsrutschungen entlang des deutschen Schienennetzes, EBA-Forschungsbericht 2018-13, https://doi.org/10.48755/dzsf.210024.01, 2018.
Kirschbaum, D., Kapnick, S. B., Stanley, T., and Pascale, S.: Changes in Extreme Precipitation and Landslides Over High Mountain Asia, Geophys. Res. Lett., 47, e2019GL085347, https://doi.org/10.1029/2019GL085347, 2022.
Kjekstad, O. and Highland, L.: Economic and Social Impacts of Landslides, in: Landslides – Disaster Risk Reduction, edited by: Sassa, K. and Canuti, P., Springer, Berlin, Heidelberg, 573–587, https://doi.org/10.1007/978-3-540-69970-5, 2009.
Klose, M., Damm, B., and Terhorst, B.: Landslide cost modeling for transportation infrastructures: a methodological approach, Landslides, 12, 321–334, https://doi.org/10.1007/s10346-014-0481-1, 2014.
Koks, E., Rozenberg, J., Zorn, C., Tariverdi, M., Vousdoukas, M., Fraser, S. A., Hall, J. W., and Hallegatte, S.: A global multi-hazard risk analysis of road and railway infrastructure assets, Nat. Commun., 10, 2677, https://doi.org/10.1038/s41467-019-10442-3, 2019.
Korswagen, P., Harish, S., Oetjen, J., and Wüthrich, D.: Post-flood field survey of the Ahr Valley (Germany) – Building damages and hydraulic aspects, TU Delft Report, 69 pp., https://doi.org/10.4233/uuid:3cafd772-facd-4e3a-8b1a-cee978562ff1, 2022.
Kreienkamp, F., Philip, S. Y., Tradowsky, J. S., Kew, S. F., Lorenz, P., Arrighi, J., Belleflamme, A., Bettmann, T., Caluwaerts, S., Chan, S. C., Ciavarella, A., De Cruz, L., de Vries, H., Demuth, N., Ferrone, A., Fischer, E. M., Fowler, H. J., Goergen, K., Heinrich, D., Henrichs, Y., Lenderink, G., Kaspar, F., Nilson, E., Otto, F. E. L., Ragone, F., Seneviratne, S. I., Singh, R. K., Skalevag, A., Termonia, P., Thalheimer, L., van Aalst, M., Van den Bergh, J., Van de Vyver, H., Vannitsem, S., van Oldenborgh, G. J., Van Schaeybroek, B., Vautard, R., Vonk, D., and Wanders, N.: Rapid attribution of heavy rainfall events leading to the severe flooding in Western Europe during July 2021, World Weather. Attrib., 54 pp., https://www.worldweatherattribution.org/wp-content/uploads/Scientific-report-Western-Europe-floods-2021-attribution.pdf (last access: 16 December 2021), 2021.
Kreuzwieser, J. and Rennenberg, H.: Molecular and physiological responses of trees to waterlogging stress, Plant Cell Environ., 37, 2245–2259, 2014.
Kundzewicz, Z. W., Kanae, Shinjiro, Seneviratne, S. I., Handmer, J., Nicholls, N., Peduzzi, P., Mechler, R., Bouwer, L. M., Arnell, N., Mach, K., Muir-Wood, R., Brakenridge, G. R., Kron, W., Benito, G., Honda, Y., Takahashi, K., and Sherstyukov, B.: Flood risk and climate change: global and regional perspectives, Hydrolog. Sci. J., 59, 1–28, https://doi.org/10.1080/02626667.2013.857411, 2013.
Lehmkuhl, F. and Stauch, G.: Anthropogenic influence of open pit mining on river floods, an example of the Blessem flood 2021, Geomorphology, 421, 108522, https://doi.org/10.1016/j.geomorph.2022.108522, 2022.
Lenderink, G. and van Meijgaard, E.: Linking increases in hourly precipitation extremes to atmospheric temperature and moisture changes, Environ. Res. Lett., 5, 025208, https://doi.org/10.1088/1748-9326/5/2/025208, 2010.
Lengfeld, K., Kirstetter, P.-E., Fowler, H. J., Yu, J., Becker, A., Flamig, Z., and Gourley, J.: Use of radar data for characterizing extreme precipitation at fine scales and short durations, Environ. Res. Lett., 15, 085003, https://doi.org/10.1088/1748-9326/ab98b4, 2020.
Lengfeld, K., Walawender, E., Winterrath, T., and Becker, A.: CatRaRE: A Catalogue of radar-based heavy rainfall events in Germany derived from 20 years of data, Meteorol. Z., 30, 469–487, https://doi.org/10.1127/metz/2021/1088, 2021.
Lengfeld, K., Walawender, E., Winterrath, T., and Becker, A.: CatRaRE: A Catalogue of radar-based heavy rainfall events in 60 Germany derived from 20 years of data, Meteorol. Z., 30, 469–487, https://doi.org/10.1127/metz/2021/1088, 2022 (data available at: https://opendata.dwd.de/climate_environment/CDC/help/landing_pages/doi_landingpage_CatRaRE_W3_Eta_v2022.01-de.html, last access: 27 October 2022).
Locosselli, G. M., Miyahara, A. A. L., Cerqueira, P., and Buckeridge, M. S.: Climate drivers of tree fall on the streets of Sao Pauli, Brazil, Trees, 35, 1807–1815, https://doi.org/10.1007/s00468-021-02145-4, 2021.
Löpmeier, F.-J.: Berechnung der Bodenfeuchte und Verdunstung mittels agrarmeteorologischer Modelle, Zeitschrift für Bewässerungswirtschaft, 29, 157–167, 1994.
Mattson, L.-G. and Jenelius, E.: Vulnerability and resilience of transport systems – A discussion of recent research, Transp. Res. Part A Policy Pract., 81, 16–34, 2015.
Morimoto, J., Aiba, M., Furukawa, F., Mishima, Y., Yoshimura, N., Nayak, S., Takemi, T., Haga, C., Matsui, T., and Nakamura, F.: Risk assessment of forest disturbance by typhoons with heavy precipitation in northern Japan, Forest Ecol. Manag., 479, 118521, https://doi.org/10.1016/j.foreco.2020.118521, 2021.
O'Gorman, P. A.: Precipitation Extremes Under Climate Change, Curr. Clim. Chang. Reports, 1, 49–59, 2015.
Penna, D., Borga, M., and Zoccatelli, D.: Analysis of flash-flood runoff response, with examples from major European events, in: Treatise on Geomorphology, edited by: Shroder, J., Marston, R. A., and Stoffel, M., Academic Press, San Diego, USA, 95–104, https://doi.org/10.1016/B978-0-12-818234-5.60052-4, 2013.
Rachoy, C. and Scheikl, M.: Anthropogenic caused mass movements and their impact on railway lines in Austria, in: Disaster Mitigation of Debris Flows, Slope Failures and Landslides, edited by: Marui, H. and Mikos, M., Universal Academy Press, Tokyo, Japan, 639–643, 2006.
Rawls, W. J., Ahuja, L. R., Brakensiek, D. L., and Shirmohammadi, A.: Infiltration and Soil Water Movement, in: Handbook of Hydrology, edited by: Maidment, D. R., ISBN 0070397325, 1993.
Razafimaharo, C., Krähenmann, S., Höpp, S., Rauthe, M., and Deutschländer, T.: New high-resolution gridded dataset of daily mean, minimum, and maximum temperature and relative humidity for Central Europe (HYRAS), Theor. Appl. Climatol., 142, 1531–1553, https://doi.org/10.1007/s00704-020-03388-w, 2020.
Rupp, S.: Effect of the antecedent precipitation on the occurrence of landslides: Examples from the Central Uplands in Germany, Z. Geomorphol., 64, 1–16, https://doi.org/10.1127/zfg/2022/0751, 2022.
Rybka, H., Haller, M., Brienen, S., Brauch, J., Früh, B., Junghänel, T., Lengfeld, K., Walter, A., and Winterrath, T.: Convection-permitting climate simulations with COSMO-CLM for Germany: Analysis of present and future daily and sub-daily extreme precipitation, Meterol. Z., 32, 91–111, https://doi.org/10.1127/metz/2022/1147, 2022.
Seidl, R., Thom, D., Kautz, M., Martin-Benito, D., Peltoniemi, M., Vacchiano, G., Wild, J., Ascoli, D., Petr, M., Honkaniemi, J., Lexer, M. J., Trotsiuk, V. Mairota, P., Scoboda, M., Fabrika, M., Nagel, T. A., and Reyer, C. P. O.: Forest disturbances under climate change, Nat. Clim. Change, 7, 395–402, https://doi.org/10.1038/nclimate3303, 2017
Seneviratne, S.I., Zhang, X., Adnan, M., Badi, W., Dereczynski, C., Di Luca, A., Ghosh, S., Iskandar, I., Kossin, J., Lewis, S., Otto, F., Pinto, I., Satoh, M., Vicente-Serrano, S., Wehner, M., and Zhou, B.: Climate Change 2021: The Physical Science Basis. Contribution of Working Group I to the Sixth Assessment Report of the Intergovernmental Panel on Climate Change, Chapter Weather and Climate Extreme Events in a Changing Climate, Cambridge, Cambridge University Press, 1513–1766, https://doi.org/10.1017/9781009157896, 2021.
Szymczak, S., Backendorf, F., Bott, F., Fricke, K., Junghänel, T., and Walawender, E.: Impacts of Heavy and Persistent Precipitation on Railroad Infrastucture in July 2021: A Case Study from the Ahr Valley, Rhineland-Palatinate, Germany, Atmosphere, 13, 1118, https://doi.org/10.3390/atmos13071118, 2022.
Tichavský, R., Ballesteros-Cánovas, J. A., Šilhán, K., Tolasz, R., and Stoffel, M.: Dry Spells and Extreme Precipitation are The Main Trigger of Landslides in Central Europe, Sci. Rep., 9, 14560, https://doi.org/10.1038/s41598-019-51148-2, 2019.
Tradowsky, J. S., Philip, S. Y., Kreienkamp, F., Kew, S. F., Lorenz, P., Arrighi, J., Bettmann, T., Caluwaerts, S., Chan, S. C., De Cruz, L., de Vries, H., Demuth, N., Ferrone, A., Fischer, E. M., Fowler, H. J., Goergen, K., Heinrich, D., Henrichs, Y., Kaspar, F., Lenderink, G., Nilson, E., Otto, F. E. L., Ragone, F., Seneviratne, S. I., Singh, R. K., Skalevag, A., Termonia, P., Thalheimer, L., van Aalst, M., Van den Bergh, J., Van de Vyver, H., Vannitsem, S., van Oldenborgh, G. J., Van Schaeybroeck, B., Vautard, R., Vonk, D., and Wanders, N.: Attribution of the heavy rainfall events leading to severe flooding in Western Europe during July 2021, Climate Change, 176, 90, https://doi.org/10.1007/s10584-023-03502-7, 2023.
Trenberth, K. E.: Conceptual framework for changes of extremes of the hydrological cycles with climate change, Climate Change, 42, 317–339, 1999.
Umweltbundesamt (UBA): Climate Impact and Risk Assessment 2021 for Germany – Summary, Umweltbundesamt, Dessau-Roßlau, 111 pp., https://www.umweltbundesamt.de/sites/default/files/medien/479/publikationen/cc_27-2021_climate_impact_and_risk_assessment_2021_for_germany_english_summary_bf.pdf (last access: 17 February 2022), 2021.
Vichta, T., Deutscher, J., Hemr, O., Tomášová, G., Žižlavská, N., Brychtová, M., Bajer, A. and Shukla, M. K.: Combined effects of rainfall-runoff events and antecedent soil moisture on runoff generation processes in an upland forested headwater area, Hydrol. Process., 38, e15216, https://doi.org/10.1002/hyp.15216, 2024
Wake, B.: Flooding costs, Nat. Clim. Change, 3, 778, https://doi.org/10.1038/nclimate1997, 2013.
Westra, S., Alexander, L. V., and Zwiers, F. W.: Global increasing trends in annual maximum daily precipitation, J. Climate, 26, 3904–3918, 2013.
Westra, S., Fowler, H. J., Evans, J. P., Alexander, L. V., Berg, P., Johnson, F., Kendon, E. J., Lenderink, G., and Roberts, N. M.: Future changes to the intensity and frequency of short-duration extreme rainfall, Rev. Geophys., 52, 522–555, 2014.
Williams, R.: Using the margins command to estimate and interpret adjusted predictions and marginal effects, The Stata Journal, 12, 308–331, 2012.
Winter, M. G., Shearer, B., Palmer, D., Peeling, D., Harmer, C., and Sharpe, J.: The Economic Impact of Landslides and Floods on the Road Network, Procedia Engineer., 143, 1425–1434, https://doi.org/10.1016/j.proeng.2016.06.168, 2016.
Zeder, J. and Fischer, E. M.: Observed extreme precipitation trends and scaling in Central Europe, Weather and Climate Extremes, 29, 100266, https://doi.org/10.1016/j.wace.2020.100266, 2020.
Zêzere, J. L., Vaz, T., Pereira, S., Oliveira, S. C., Marques, R., and Garcia, R. A. C.: Rainfall thresholds for landslide activity in Portugal: A state of the art, Environ. Earth Sci., 73, 2917–2936, https://doi.org/10.1007/s12665-014-3672-0, 2015.
Zscheischler, J., Martius, O., Westra, S., Bevacqua, E., Raymond, C., Horton, R. M., van den Hurk, B., AghaKouchak, A., Jézéquel, A., Mahecha, M. D., Maraun, D., Ramos, A. M., Ridder, N. N., Thiery, W., and Vignotto, E.: A typology of compound weather and climate events, Nature Reviews Earth & Environment, 1, 333–348, https://doi.org/10.1038/s43017-020-0060-z, 2020.
Zhu, J., Mao, Z., Wang, Y., Wang, Y., Li, T., Wang, K., Langendoen, E. J., and Zheng, B.: Soil moisture and hysteresis affect both magnitude and efficiency of root reinforcement, CATENA, 219, 106574, https://doi.org/10.1016/j.catena.2022.106574, 2022.