the Creative Commons Attribution 4.0 License.
the Creative Commons Attribution 4.0 License.
 | 13 Feb 2025
Brief communication: Forecasting extreme precipitation from atmospheric rivers in New Zealand
Daniel G. Kingston
Liam Cooper
David A. Lavers
David M. Hannah
With mountainous topography and exposure to midlatitude westerly storms causing frequent atmospheric river landfall and associated hydrohazards, medium-range forecasting of extreme precipitation is imperative for New Zealand. Here, the European Centre for Medium-Range Weather Forecasts Extreme Forecast Index (EFI) is applied to two variables in forecast week 2: total precipitation (TP–EFI) and vertically integrated water vapour transport (IVT–EFI). Results reveal the TP–EFI sometimes outperforms the IVT–EFI in capturing extreme precipitation events – in contrast to past Europe-based research. Importantly, these case studies highlight the need to develop further understanding of sources of predictability for extreme precipitation in different geographical contexts.
- Article
(2949 KB) - Full-text XML
- BibTeX
- EndNote


Located in the midlatitudes and with a relatively narrow east–west extent, New Zealand is strongly influenced by maritime air masses and embedded frontal weather systems. Combined with orographic forcing from steep topographic gradients, these weather systems can result in the occurrence of substantial precipitation events. Indeed, with mean annual precipitation>12 000 mm in places (Kerr et al., 2018), the windward slopes of the Southern Alps / Kā Tiritiri o te Moana on the South Island / Te Waipounamu of New Zealand can be an exceptionally wet landscape. Although New Zealand is impacted typically by the remnants of three to five tropical cyclones each year (Sinclair, 2002), most extreme precipitation and river flow events are associated with atmospheric rivers (ARs; Prince et al., 2021; Kingston et al., 2022). ARs are narrow corridors of relatively intense atmospheric water vapour transport that are associated with extreme precipitation in the midlatitudes globally, with New Zealand a hotspot for their occurrence (Guan and Waliser, 2015).
The precipitation that is associated with weak to moderate AR events is mostly beneficial (e.g. Ralph et al., 2019); in New Zealand these ARs are important for seasonal snow and, in turn, winter tourism and water resources for hydroelectricity and irrigation schemes (e.g. Jobst et al., 2022; Porhemmat et al., 2021). However, more extreme AR events and their associated precipitation can result in major disruption, with examples in recent years including damage to transport infrastructure (e.g. NIWA, 2019) and flooding of urban residential areas (e.g. NIWA 2021a). Correspondingly, accurate medium-range forecasting of such events – defined as a 3–14 d lead time – has clear benefits in terms of societal preparedness (including impact prevention, protection, mitigation, response and recovery).
Previous research (focussed mostly on western Europe) has found that in some cases the forecasting of extreme precipitation events associated with ARs can be more successful when the forecast focus is on vertically integrated horizontal water vapour transport (integrated vapour transport, IVT) rather than precipitation itself (e.g. Lavers et al., 2016). Notably, this was found for the late medium-range forecast horizon (i.e. forecast week 2). This higher forecast skill has been associated with the more predictable large-scale nature of IVT in comparison to precipitation and the strong connection between IVT and precipitation in midlatitude regions where precipitation occurs primarily at frontal boundaries. Interestingly, Lavers et al. (2016) found that the extent to which IVT-based forecasts outperformed those based on precipitation was influenced by characteristics of the large-scale atmospheric circulation (in particular, the North Atlantic Oscillation, NAO). For instance, based on differences in relative operating characteristic, IVT-based forecasts in week 2 were shown to be most useful during the positive phase of the NAO – a difference attributed to the associated windier and stormier conditions and thus greater importance of IVT for precipitation.
Given the findings of Lavers et al. (2016) for western Europe, it is important to determine the potential for improved forecasting of extreme precipitation based on IVT in other midlatitude regions. New Zealand makes for a particularly interesting study region given the dominance of frontal rain within the midlatitude westerlies, its status as a global AR hotspot and the peculiar situation of ARs landfalling not only on prevailing windward (i.e. western) coastlines, but also northern and eastern coasts. Correspondingly, this brief communication explores – for the first time – the potential for IVT-based forecasts to improve medium-range warning of extreme precipitation events in New Zealand according to synoptic situation and AR landfall location – focussing on three recent and highly damaging AR-related events.
To provide focus for this brief communication, case studies are analysed corresponding to three of the most damaging recent AR-related extreme precipitation events over New Zealand. Each event was associated with a markedly different synoptic-scale meteorological situation and maps broadly onto the dominant AR landfalling sectors documented for New Zealand by Prince et al. (2021). Event 1 was centred on the South Island east coast and included record magnitude 24 and 48 h rainfall totals at a number of weather stations, peaking above 500 mm in 48 h. The event exceeded a 200-year return period in places. Event 2 occurred on the South Island west coast, with the Buller River and coastal town of Westport / Kawatiri particularly affected. Rainfall in Westport exceeded its monthly average in the space of 48 h (212 mm compared to 139 mm), and higher rainfall totals in the upper Buller catchment resulted in exceptionally high river flows: at 7640 m3 s−1 this marked the highest discharge ever directly recorded in New Zealand (NIWA, 2021b). The third case study event was focussed in the north of the South Island. This was a longer-duration event, with daily rainfall totals in places exceeding 100 mm for 4 consecutive days, resulting in widespread flooding, particularly in the city of Nelson / Whakatū.
The IVT situation associated with each case study was determined using European Centre for Medium-Range Weather Forecasts (ECMWF) ERA5 reanalysis data, with 850 hPa geopotential height data providing more general information on the atmospheric circulation situation. The ERA5 reanalysis (Hersbach et al., 2020) provides a comprehensive record of the global atmosphere, land surface and ocean waves on a 31 km (TL639) horizontal grid. As a further descriptor of Southern Hemisphere midlatitude circulation, the Southern Annular Mode (SAM) was considered, using the Mo (2000) index. Mean sea level pressure analyses from the Meteorological Service of New Zealand (MetService) were also obtained. ARs are characterized using the Ralph et al. (2019) scale, following its previous application in New Zealand by Prince et al. (2021).
This analysis focusses primarily on the ECMWF Extreme Forecast Index (EFI; Lalaurette, 2003; Zsoter, 2006; Zsoter et al., 2015), which was used previously by Lavers et al. (2016). The EFI is calculated using the ensemble forecasts from the ECMWF Integrated Forecasting System (IFS). For the events, two different versions of the IFS were used, both at O640 (∼18 km) resolution: IFS Cycle 47r2 for events 1 and 2 and IFS Cycle 47r3 for event 3. The EFI compares the probability distribution of forecasts with that of the model climate, thus highlighting regions that are forecast to experience anomalous weather. EFI values range from −1 to 1, with −1 implying extremely low and 1 implying extremely high values with respect to the model climate. EFI values>0.5 indicate anomalous weather (Cox and Lavers 2020), but this threshold is lower at longer lead times because EFI values tend to diminish with increasing time into the forecast horizon due to increasing forecast uncertainty (or spread). Herein, the EFI for IVT and total precipitation (TP) is considered for forecast week 2, based on previous findings (e.g. Lavers et al., 2016) that the IVT–EFI begins to outperform the TP–EFI for forecasting extreme precipitation at this time horizon. Specifically, our focus is the aggregated timescales of 7–9 d and 10–15 d, as the periods for which EFI data are archived by the ECMWF. Although a more precise understanding of EFI differences may be possible from analysing daily time steps, these data are not currently calculated operationally for the EFI. At this initial stage, the analysis focussed on comparing the severity of EFI values and coherency of the spatial patterns in the EFI for TP and IVT.
3.1 Easterly airflow (event 1)
During event 1 (South Island east coast), easterly onshore wind and moderate IVT values were present, as part of a low-pressure system moving from northwest to southeast (Fig. 1a). The SAM was in a negative phase at the onset of the event (−1.6). IVT at landfall on the east coast peaked at approximately 500 and 800–900 further upwind. This magnitude of IVT corresponds to a moderate AR in the scale of Ralph et al. (2019). Although length and width dimensions of high IVT values meet those typically used for identification of an AR (e.g. Guan and Waliser, 2015; Ralph et al., 2017), the area of high IVT follows a more cyclonic trajectory compared to the archetypal windward/west coast AR in North America or western Europe. It is this cyclonic trajectory that enables landfall on the leeward (east) coast in a region of prevailing westerlies.
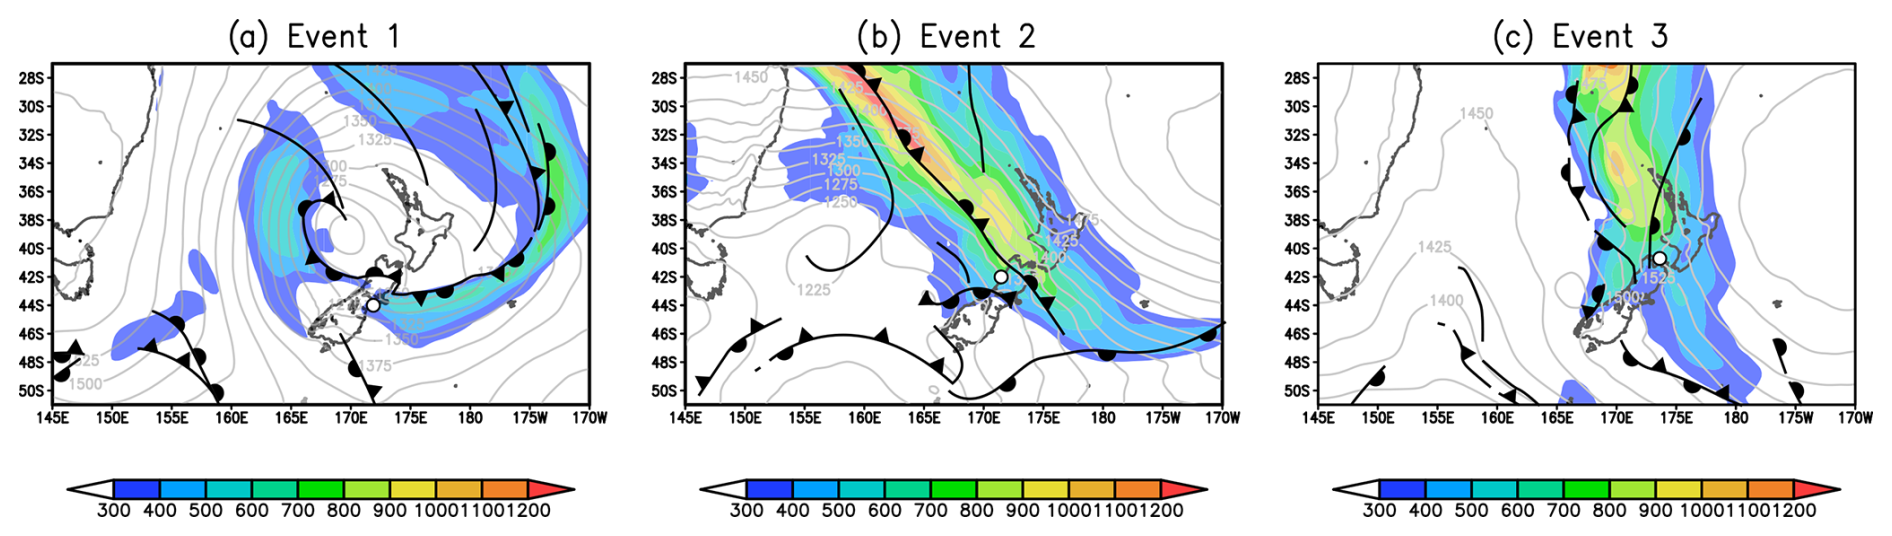
Figure 1IVT magnitude (shading) and 850 hPa geopotential (grey isolines), with the analysis of frontal activity for each of the three case study events overlain. Event 1 was at 00:00 UTC on 30 May 2021; event 2 was at 12:00 UTC on 16 July 2021; event 3 was at 12:00 UTC on 16 August 2022. The white dots with black outline indicate the approximate location of peak flooding for each event.
Both IVT–EFI and TP–EFI forecasts identify the possibility of an extreme event over the middle to upper South Island east coast during the 7–9 d period. The area of extreme IVT–EFI values is confined to the coast and region immediately offshore. However, the area of extreme TP–EFI values extends much further eastwards (Fig. 2a–c), corresponding more closely to the pattern of high IVT values (Fig. 1a) and a concurrent occluded front. As indicated in the difference plot, TP–EFI values are up to 0.4 higher across the entire east coast.
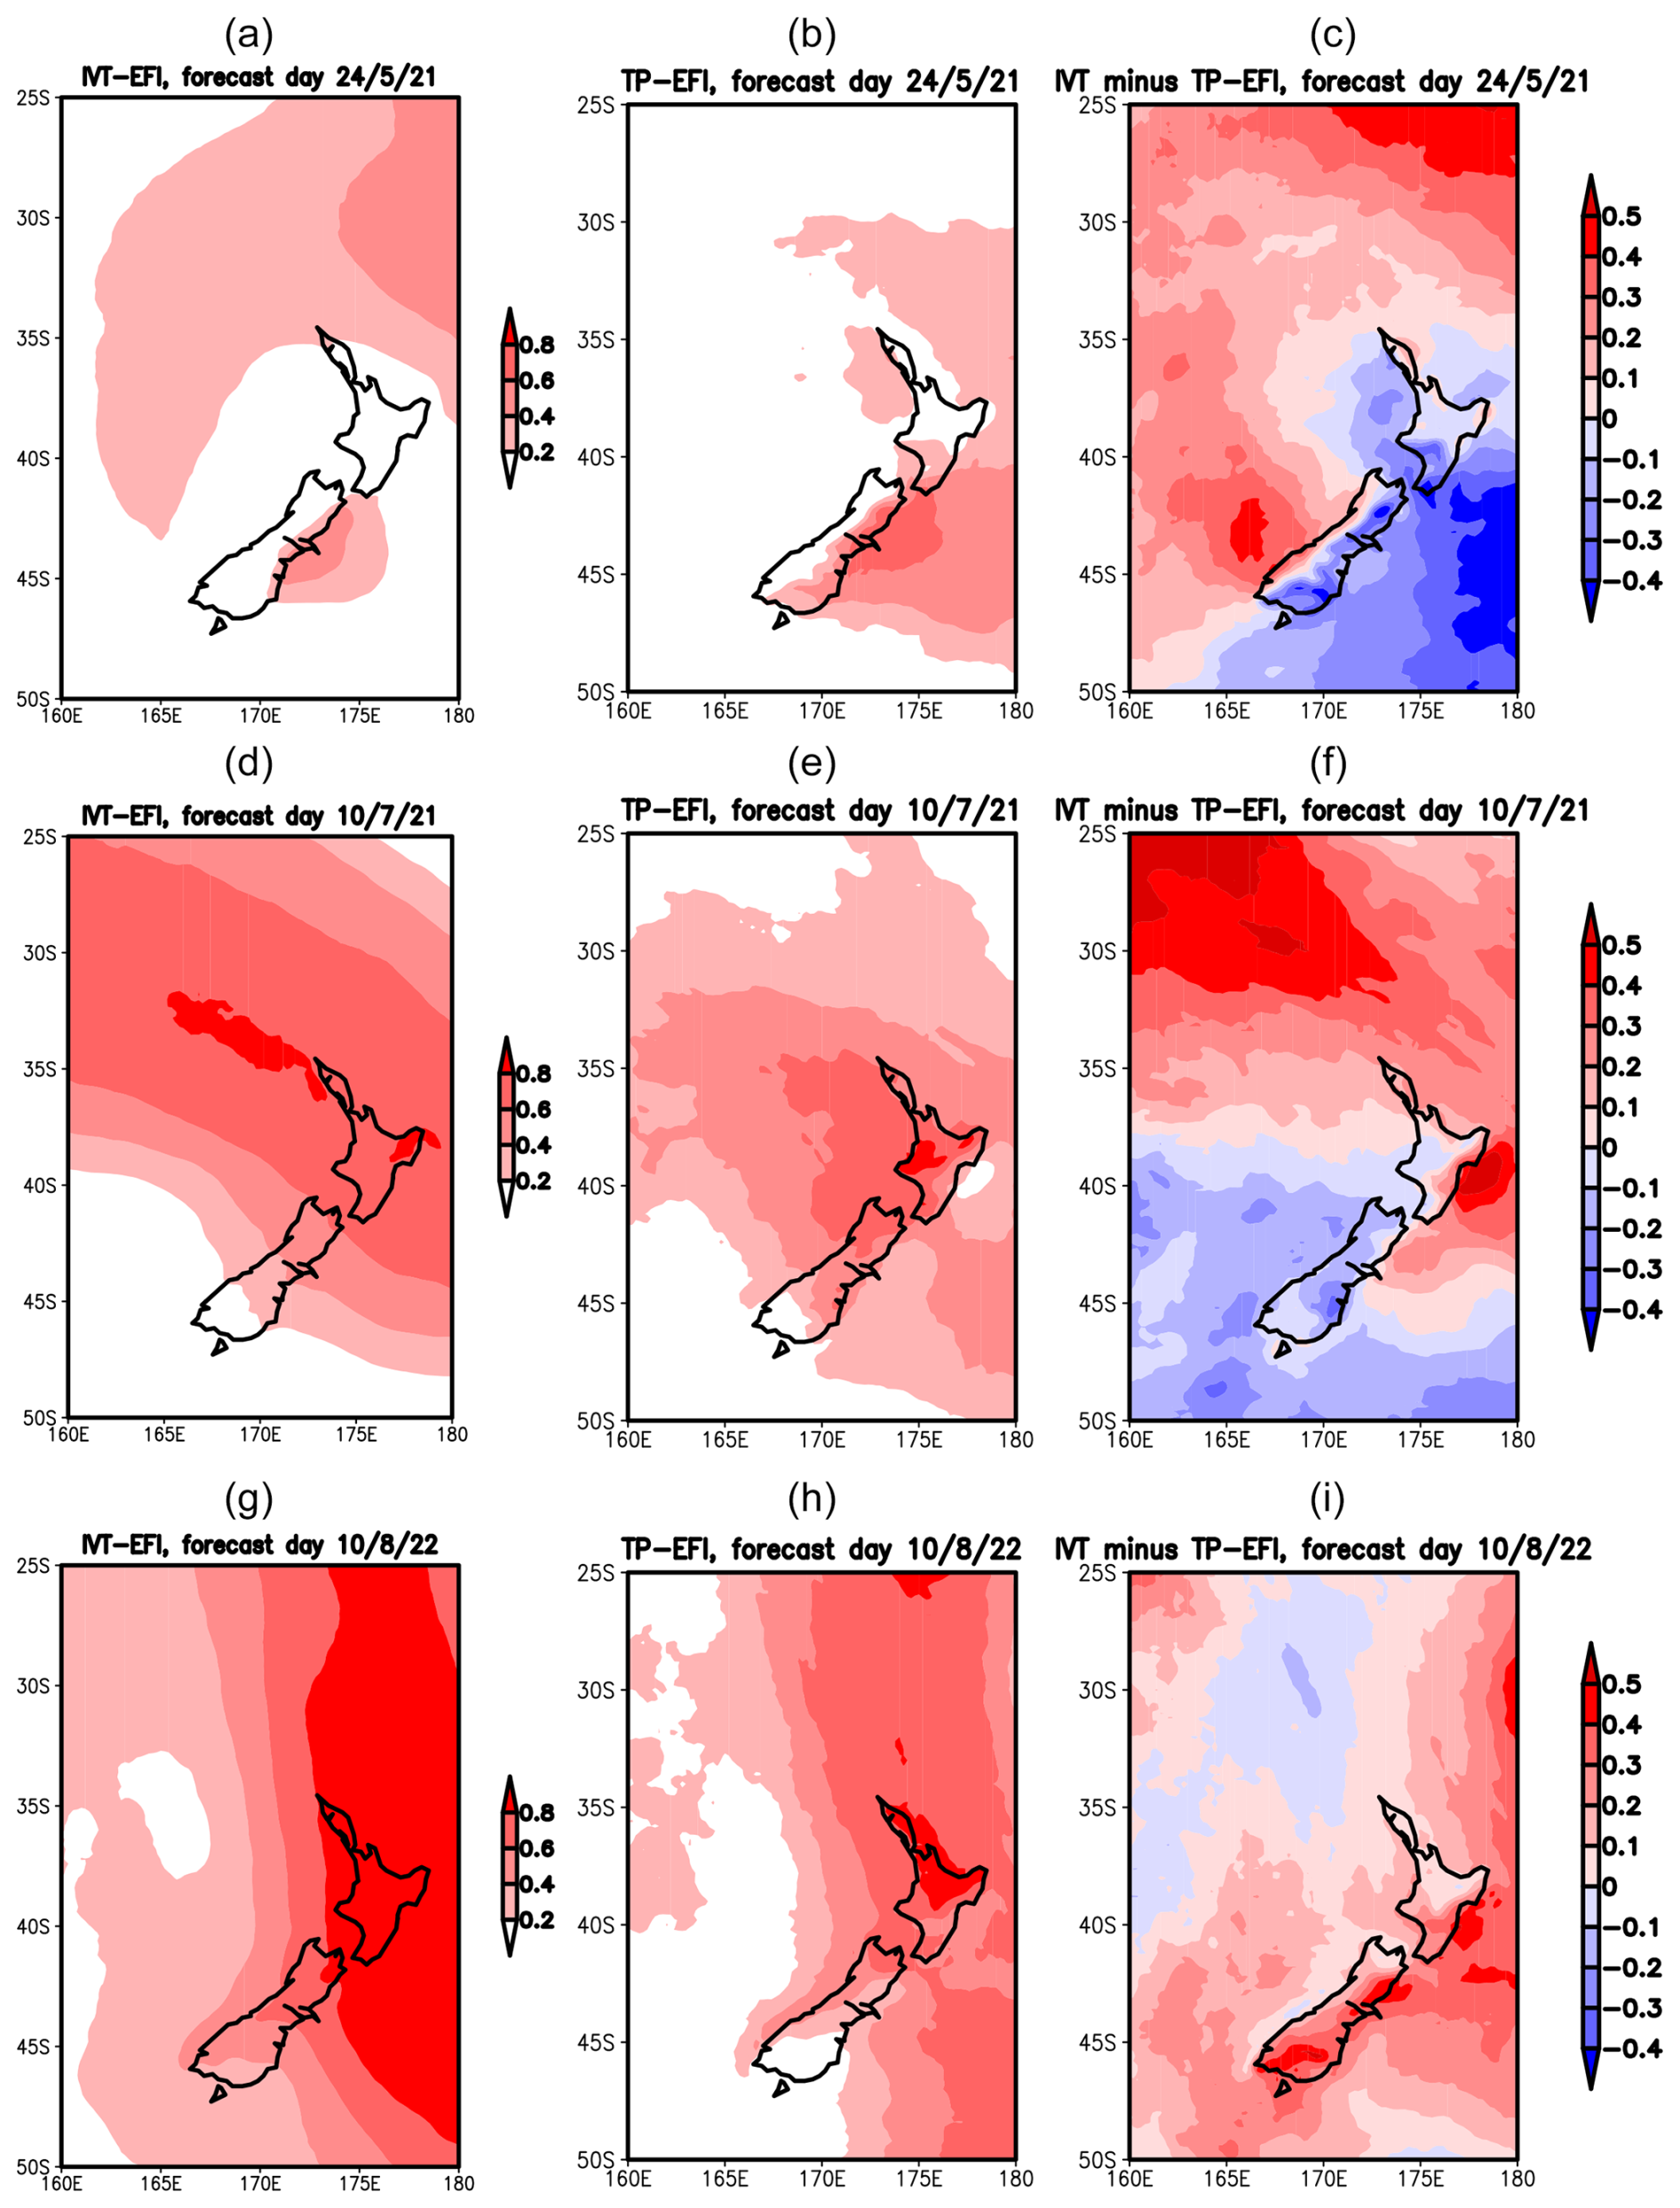
Figure 2The 7–9 d EFI forecast for TP, IVT and IVT minus TP difference for event 1 (a–c), event 2 (d–f) and event 3 (g–i).
During the 10–15 d period there is little evidence of a forthcoming extreme event (Fig. 3a–c). There is a region of IVT–EFI and TP–EFI values in the 0.2–0.4 range, and although lower EFI values are expected at longer lead times due to increasing forecast uncertainty, this is still below the 0.5 threshold used typically to signify an extreme event. Additionally, for the IVT–EFI these values are located further north than the actual event. While TP–EFI values are higher (by 0.1–0.2) over the case study region, they are still<0.5, and their location is not well matched to the eventual spatial pattern of raised IVT values or extreme precipitation.
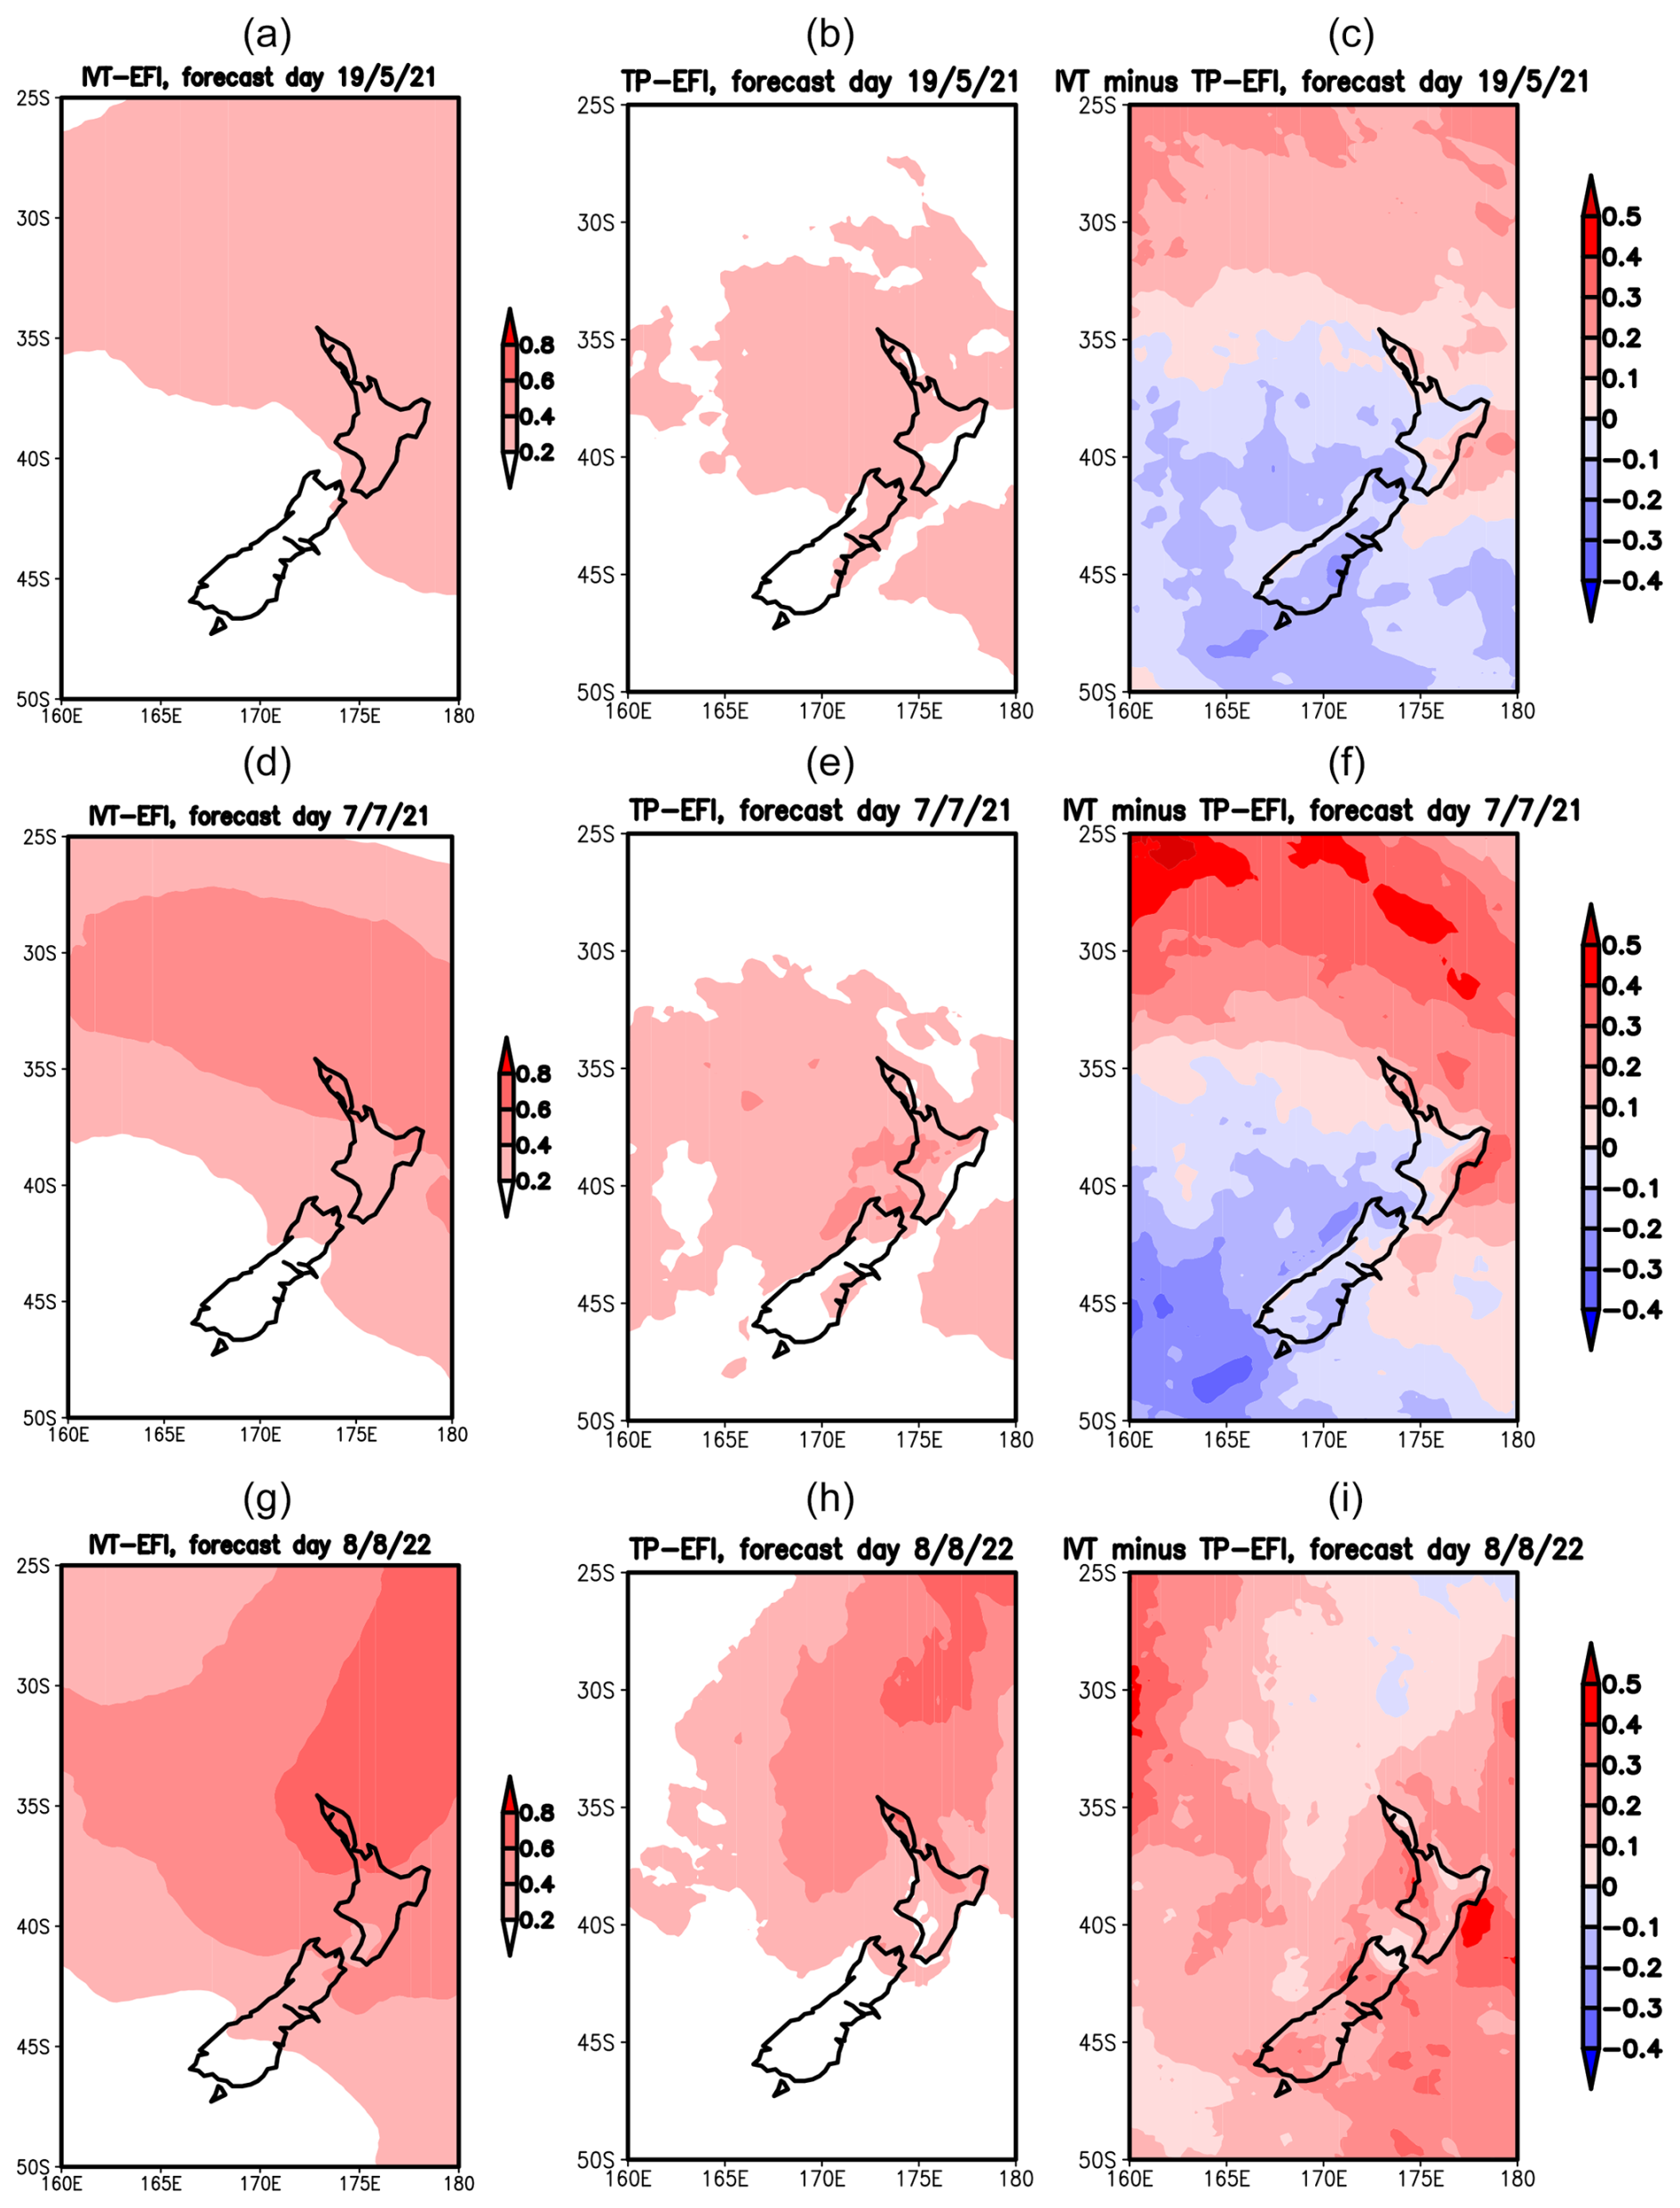
Figure 3The 10–15 d EFI forecast for TP, IVT and IVT minus THE TP difference for event 1 (a–c), event 2 (d–f) and event 3 (g–i).
3.2 Northwesterly airflow (event 2)
Event 2 was associated with a strong northwesterly IVT and airflow (Fig. 1b), a SAM value of −1.0 at onset and substantially higher IVT in comparison to event 1. The overall system encompassed zones of exceptional-magnitude IVT (), corresponding to an occluded front extending across the Tasman Sea and with the zone of high IVT extending as far away as the Indian Ocean. IVT values at landfall on the west coast approached 1000 . Correspondingly, the IVT field matches well with the typical features of an AR. In addition to the relatively high IVT magnitude of this event, a key characteristic was its persistence, pushing it to the highest category (5) on the Ralph et al. (2019) AR scale and resulting in high precipitation over a 3–4 d period.
In contrast to event 1, the IVT–EFI forecast at 7–9 d is more spatially coherent at large scales compared to the TP–EFI and more closely matches the overall pattern of high IVT (Fig. 2d–f). Despite this stronger large-scale match and the higher IVT–EFI across a wider area, the placement of higher values is somewhat to the north of the main area of extreme precipitation, with the result being that the TP–EFI indicates more extreme conditions over the South Island upper west coast for the time of event 2 compared to the IVT–EFI.
As with event 1, the likelihood of an extreme event is not as obvious from the 10–15 d EFI values (Fig. 3d–f), although for event 2 there is a more coherent large-scale pattern in the IVT–EFI values that resembles somewhat both the 7–9 d values and actual IVT situation. As for the 7–9 d IVT–EFI values, the highest values are situated even further northwards of the zone of highest precipitation. Thus, although the 10–15 d TP–EFI values are generally lower and less spatially coherent than for IVT–EFI, they are higher in the regions where extreme precipitation actually occurred.
3.3 Northerly airflow (event 3)
Event 3 was associated primarily with northerly airflow and IVT, impacting a wide zone across parts of the northern and western North Island, the South Island west coast, and most of all the South Island north coast (Fig. 1c). For this event, the SAM was in the negative phase (−1.06 at onset). The air mass originated from the tropics and contained a complex series of frontal features with the overall system remaining in place for approximately 4 d due to a slow-moving high-pressure system to the east. As with event 2, zones of exceptional-magnitude IVT existed upwind of the coast with landfall values for the South Island north coast that at times exceeded 1000 – extremely unusual for August from a climatological perspective. This long and narrow zone of high IVT matches closely the typical spatial characteristics of a strong AR.
For the 7–9 d forecast, both the IVT–EFI and TP–EFI show a large zone of very high values (>0.8 – Fig. 2, bottom row). These high values – especially at this lead time – are particularly widespread for the IVT–EFI. However, for both the IVT–EFI and TP–EFI (but IVT especially), the highest values are further east compared to the zone of highest precipitation. Unlike events 1 and 2, for event 3 the IVT–EFI values are almost universally higher than for the TP–EFI over the zone of highest precipitation. Unlike events 1 and 2, during the 10–15 d forecast period the EFI patterns and values clearly indicate a forthcoming extreme event – although the EFI magnitudes are slightly lower than the 7–9 d forecast (in the 0.6–0.8 range – Fig. 3g–i). However, the spatial dimensions of the high EFI area match well the zone of high IVT (Fig. 1c). The IVT–EFI values are again more extreme than for the TP–EFI, both upwind of and over the area of highest precipitation.
Three very different synoptic weather situations and associated extreme weather events have been explored, which represent the main types of AR systems experienced in New Zealand (Prince et al., 2021). Moreover, these case studies capture the unusual situation in New Zealand of landfalling ARs occurring on coastlines of different orientation with respect to the prevailing atmospheric circulation. Despite the different meteorological processes involved, each case study was associated with IVT and precipitation magnitudes that were either close to or record-breaking, resulting in major impacts on society.
As with the meteorological situation, key aspects of the EFI for TP and IVT differ between the events. For event 1 during the 10–15 d period, neither version of the EFI indicated a forthcoming extreme event. For event 2, only the IVT–EFI indicated an extreme event at 10–15 d, but for event 3 it was present for both. At the 7–9 d forecast horizon, the large-scale EFI patterns approximately matched those of IVT during the events. The larger-scale pattern was stronger and more spatially coherent for the TP–EFI (vs. IVT–EFI) in event 1, but the IVT–EFI pattern was stronger for events 2 and 3. Finally, in terms of EFI values specific to the locations of highest precipitation, more extreme local conditions were indicated by the TP–EFI for events 1 and 2 and the IVT–EFI for event 3.
The tendency of the IVT–EFI to be more useful in detecting extreme events at longer forecast horizons in Northern Hemisphere locations (Lavers et al., 2016) is not replicated for all situations in the current case studies. Lavers et al. (2016) noted that for western Europe the IVT–EFI was more useful than the TP–EFI during positive NAO conditions, which are commonly associated with stronger westerlies and the more frequent passage of extratropical cyclones in that region. Although all three case studies here were associated with negative SAM values (typically associated with stronger westerlies for the New Zealand region; Kidston et al., 2009), in fact both the strongest and weakest IVT–EFI signals were found during regionally weak westerly flows. Furthermore, event 1 experienced a clear frontal boundary – also at odds with the Lavers et al. (2016) finding that the IVT–EFI was more useful during periods where frontal rainfall dominated. Instead, the much weaker IVT–EFI signal for event 1 may be due to a weaker overall IVT magnitude. Irrespective of the cause, these differences in IVT–EFI versus TP–EFI based forecasts indicate subtle variation from the western European EFI paradigm and suggest further investigation is needed. Potential avenues of interest include event duration (here the longest event had the strongest IVT–EFI signal) and the relative importance of frontal vs. orographic uplift for precipitation between events, including AR orientation relative to topographic features.
The occurrence of the highest IVT–EFI values (and TP–EFI to a lesser extent) further to the north (event 2) or east (event 3) of the most extreme precipitation points to further important features of IVT vs. TP forecasts. These spatial offsets in EFI values are not resolved when multiday averages of IVT are compared with the matching EFI aggregation periods. An equatorward (i.e. northwards, in this case) displacement of the IVT–EFI signal from the core precipitation zone has also been observed in a European context (Cox and Lavers, 2020). However, this phenomenon was thought to be associated with IVT also being influenced by the wider low-pressure system rather than just the frontal boundary where peak precipitation rates typically occur – a context that does not quite fit events 2 and 3 here. In these two cases a full explanation of the offset requires further research. A further matter of interest is that the spatial offset of high IVT–EFI values compared to the actual location of high IVT during events 2 and 3. These offsets correspond to a more downwind location (in the context of broad westerly circulation) of high IVT–EFI values as well as to the left/equatorward side of the jet stream exit. This offset is not apparent for event 1: under this type of east coast event, New Zealand typically sits between a split jet stream structure (e.g. Kingston et al., 2022; Prince et al., 2021).
One final matter in the interpretation of the three case studies relates to the match between event duration and the multiday aggregation of EFI data in the ECMWF archive. Duration increased from events 1–3, meaning that while event 3 could occupy the full duration of a 7–9 d forecast aggregation, event 1 could not. This means that depending on the starting day, the 7–9 d forecast for event 1 could include the relatively normal weather conditions before or after this extreme event, as well as the event duration itself – naturally muting the 7–9 d aggregated forecast. This effect was most likely even greater for the 10–15 d EFI and thus may partly explain the stronger apparent EFI signal detected for the longer-duration event 3.
This article is the first investigation to use the EFI in New Zealand. While the small number of case studies included in this exploratory analysis limits the broader conclusions, several gaps and avenues for improving extreme precipitation forecasts in New Zealand have been clearly identified. Furthermore, thorough analyses of past extreme events are essential to determine whether these results hold for a larger sample. Similarly, the calculation of the EFI on daily time steps would afford us the opportunity of more clearly determining the difference in skill between the IVT–EFI and TP–EFI in forecast week 2. Notwithstanding the case study approach, these results still challenge (or at least suggest complexity in) the existing western European paradigm of superior IVT–EFI compared with TP–EFI forecasts under conditions of stronger westerly circulation. Furthermore, the importance of testing concepts of predictability in different geographical settings is shown (e.g. different AR landfall climatologies) to develop improved medium-range forecasts and to better understand the impacts of forecast model process representation.
ERA5 geopotential height data (Hersbach et al., 2018) were downloaded from https://cds.climate.copernicus.eu (Copernicus Climate Change Service, 2022). The EFI (https://doi.org/10.1256/qj.02.152, Lalaurette, 2003; https://doi.org/10.21957/kl9821hnc7, Zsoter, 2006; https://doi.org/10.1002/met.1447, Zsoter et al., 2015) data were downloaded from https://www.ecmwf.int/en/forecasts/access-forecasts/access-archive-datasets (ECMWF, 2022).
Conceptualization was done by DGK, DAL and DMH. Data curation was done by DAL. Formal analysis, investigation and visualization were done by DGK and LC. Project administration and supervision were done by DGK. Writing (original draft preparation) was done by DGK. Writing (review and editing) was by DGK, DAL and DMH.
The contact author has declared that none of the authors has any competing interests.
Publisher's note: Copernicus Publications remains neutral with regard to jurisdictional claims made in the text, published maps, institutional affiliations, or any other geographical representation in this paper. While Copernicus Publications makes every effort to include appropriate place names, the final responsibility lies with the authors.
David Lavers was supported by the Copernicus Climate Change Service, which is implemented by the ECMWF on behalf of the European Union. This research is a contribution to the UNESCO Chair in Water Sciences at the University of Birmingham. Figure 1 was produced by Chris Garden, University of Otago.
This paper was edited by Joaquim G. Pinto and reviewed by Kimberley Reid and one anonymous referee.
Copernicus Climate Change Service: ERA5 hourly data on pressure levels from 1940 to present. Copernicus Climate Change Service (C3S) Climate Data Store (CDS), https://cds.climate.copernicus.eu (last access: 19 September 2022).
Cox, D. and Lavers, D. A.: Using the EFI for water vapour flux at the UK Met Office Flood Forecasting Centre, ECMWF Newsletter, 165, https://www.ecmwf.int/en/newsletter/165/news/using-efi-water-vapour-flux-uk-met-office-flood-forecasting-centre (last access: 9 February 2025), 2020.
ECMWF: Meteorological Archival Retrieval System (MARS), https://www.ecmwf.int/en/forecasts/access-forecasts/access-archive-datasets (last access: 6 June 2022), 2022.
Guan, B. and Waliser, D. E.: Detection of atmospheric rivers: Evaluation and application of an algorithm for global studies, J. Geophys. Res.-Atmos., 120, 12514–12535, https://doi.org/10.1002/2015JD024257, 2015.
Hersbach, H., Bell, B., Berrisford, P., Hirahara, S., Horányi, A., Muñoz-Sabater, J., Nicolas, J., Peubey, C., Radu, R., Schepers, D., Simmons, A., Soci, C., Abdalla, S., Abellan, X., Balsamo, G., Bechtold, P., Biavati, G., Bidlot, J., Bonavita, M., De Chiara, G., Dahlgren, P., Dee, D., Diamantakis, M., Dragani, R., Flemming, J., Forbes, R., Fuentes, M., Geer, A., Haimberger, L., Healy, S., Hogan, R. J., Hólm, E., Janisková, M., Keeley, S., Laloyaux, P., Lopez, P., Lupu, C., Radnoti, G., de Rosnay, P., Rozum, I., Vamborg, F., Villaume, S., and Thépaut, J.-N.: The ERA5 global reanalysis, Q. J. Roy. Meteor. Soc., 146, 1–51, https://doi.org/10.1002/qj.3803, 2020.
Jobst, A. M., Cullen, N. J., and Kingston, D. G.: The hydroelectric power potential of New Zealand's largest catchment (Clutha River) under 21st century climate change, J. Hydrol. (NZ), 61, 113–136, 2022.
Kerr, T., Henderson, R., and Sood, A.: The precipitation distribution across Westland Tai Poutini National Park, J. Hydrol. (NZ), 57, 1–23, 2018.
Kidston, J., Renwick, J. A., and McGregor, J.: Hemispheric-Scale Seasonality of the Southern Annular Mode and Impacts on the Climate of New Zealand, J. Climate, 22, 4759–4770, https://doi.org/10.1175/2009JCLI2640.1, 2009.
Kingston, D. G., Lavers, D. A., and Hannah, D. M.: Characteristics and large-scale drivers of atmospheric rivers associated with extreme floods in New Zealand, Int. J. Climatol., 42, 3208–3224, https://doi.org/10.1002/joc.7415, 2022.
Lalaurette, F.: Early detection of abnormal weather conditions using a probabilistic extreme forecast index, Q. J. Roy. Meteor. Soc., 129, 3037–3057, https://doi.org/10.1256/qj.02.152, 2003.
Lavers, D. A., Pappenberger, F., Richardson, D. S., and Zsoter, E.: ECMWF Extreme Forecast Index for water vapor transport: A forecast tool for atmospheric rivers and extreme precipitation, Geophys. Res. Lett., 43, 11852–11858, https://doi.org/10.1002/2016GL071320, 2016.
Mo, K. C.: Relationships between Low-Frequency Variability in the Southern Hemisphere and Sea Surface Temperature Anomalies, J. Climate, 13, 3599–3610, 2020.
NIWA: New Zealand climate summary: Autumn 2019, National Institute of Water and Atmospheric Research Tech. Rep., 15 pp., https://niwa.co.nz/climate-and-weather/seasonal/autumn-2019 (last access: 7 February 2025), 2019.
NIWA: New Zealand climate summary: Winter 2021, National Institute of Water and Atmospheric Research Tech. Rep., 17 pp., https://niwa.co.nz/climate-and-weather/seasonal/winter-2021 (last access: 7 February 2025), 2021a.
NIWA: The largest flood flow ever measured, National Institute of Water and Atmospheric Research Media Release 29/07/2021, https://niwa.co.nz/news/the-largest-flood-flow-ever-measured (last access: 7 February 2025), 2021b.
Porhemmat, R., Purdie, H., Zawar-Reza, P., Zammit, C., and Kerr, T.: Moisture Transport during Large Snowfall Events in the New Zealand Southern Alps: The Role of Atmospheric Rivers, J. Hydrometeorol., 22, 425–444, https://doi.org/10.1175/JHM-D-20-0044.1, 2021.
Prince, H. D., Cullen, N. J., Gibson, P. B., Conway, J., and Kingston, D. G.: A climatology of atmospheric rivers in New Zealand, J. Climate, 34, 4383–4402, https://doi.org/10.1175/JCLI-D-20-0664.1, 2021.
Ralph, F. M., Dettinger, M., Lavers, D., Gorodetskaya, I. V., Martin, A., Viale, M., White, A. B., Oakley, N., Rutz, J., Spackman, J. R., Wernli, H., and Cordeira, J.: Atmospheric Rivers Emerge as a Global Science and Applications Focus, B. Am. Meteorol. Soc., 98, 1969–1973, https://doi.org/10.1175/BAMS-D-16-0262.1, 2017.
Ralph, F. M., Rutz, J. J., Cordeira, J. M., Dettinger, M., Anderson, M., Reynolds, D., Schick, L. J., and Smallcomb, C.: A Scale to Characterize the Strength and Impacts of Atmospheric Rivers, B. Am. Meteorol. Soc., 100, 269–289, https://doi.org/10.1175/BAMS-D-18-0023.1, 2019.
Sinclair, M. R.: Extratropical Transition of Southwest Pacific Tropical Cyclones. Part I: Climatology and Mean Structure Changes, Mon. Weather Rev., 130, 590–609, https://doi.org/10.1175/1520-0493(2002)130<0590:ETOSPT>2.0.CO;2, 2002.
Zsoter, E.: Recent developments in extreme weather forecasting, ECMWF Newsletter, 107, ECMWF, Reading, United Kingdom, 8–17, https://doi.org/10.21957/kl9821hnc7, 2006.
Zsoter, E., Pappenberger, F., and Richardson, D.: Sensitivity of model climate to sampling configurations and the impact on the Extreme Forecast Index, Meteorol. Appl., 22, 236–247, https://doi.org/10.1002/met.1447, 2015.