the Creative Commons Attribution 4.0 License.
the Creative Commons Attribution 4.0 License.
 | 11 Feb 2025
Identifying unrecognised risks to life from debris flows
Mark Bloomberg
Tim Davies
Elena Moltchanova
Tom Robinson
David Palmer
Many debris-flow catchments pose an underappreciated hazard, especially where there are dwellings on debris-flow fans and other depositional areas. There is a need to make communities and those involved in community governance aware of situations where there may be a credible risk to life from debris flows. This needs to be simple and cheap to do, since funding is often not available to study unrecognised natural hazards. Here, we use published models to (1) estimate the threshold annual recurrence interval (ARI) for debris flows in a catchment, below which there is an unacceptable annual risk to life for the occupants of any dwellings, and (2) identify the “window of non-recognition” where debris flows are sufficiently infrequent within a catchment that it is not recognised as susceptible yet frequent enough that the risk to life exceeds the acceptability threshold.
Using four Aotearoa New Zealand (NZ) studies, we estimate a 95 % credible interval range for the ARIs of life-threatening debris flows of between 100 and 500 years. We show that given these credible intervals and precautionary but realistic assumptions about debris-flow behaviour and the vulnerability of dwellings and their occupants, catchments with no history of debris-flow activity can pose an unrecognised and unacceptable annual risk to life (P=0.256 that the annual risk-to-life threshold of 1 in 1000 is exceeded).
- Article
(584 KB) - Full-text XML
- BibTeX
- EndNote


Debris flows are intense sediment-flood events that can occur in steep, erodible catchments when heavy rainfall causes slope failures to deliver large quantities of fine sediment to stream channels (Jakob, 2005). This input then causes sediments to be mobilised in the channel as discrete surge waves containing boulders and often trees that move rapidly down-channel to fan areas, where they can be destructive and potentially fatal (Iverson, 2014). Aotearoa New Zealand (NZ) is prone to such events because of its active tectonic, volcanic, and hydrological setting and many steep, erodible catchments (Welsh and Davies, 2011; Farrell and Davies, 2019).
Debris flows are often unrecognised and underappreciated by the NZ public (Welsh and Davies, 2011). This is partly due to confusing terminology, with debris flows referred to as “floods”, “flash floods”, or “slips” (McSaveney et al., 2005). However, the behaviour and impacts of debris flows are very different from conventional floods or landslips on a hillside. For the same amount of rain, a debris flow can have a much higher instantaneous discharge rate, contain much more and often much larger rock debris, and move faster than a flood in the same location (Jakob and Jordan, 2001). Therefore, in a given catchment, debris flows are usually far more hazardous and harder to manage than floods (Dowling and Santi, 2014; McSaveney et al., 2005). At the same time, their flow behaviour means that they can travel very large distances, impacting environments far from their sources (Frank et al., 2015). In contrast, potentially catastrophic slips and other landslides generally occur on steep slopes, and their impacts occur within a limited zone downslope of the landslide.
Problem statement and objectives
There is a large and growing body of literature on debris-flow hazard assessments (Jakob, 2021), but implementing these assessments requires funding. Thus, the debris-flow literature has an inherent bias towards relatively complex studies involving a range of site assessment and modelling techniques. There is a lack of studies describing how to overcome the problem described by Jakob (2021): “Most districts, states, provinces, or even nations have limited funds for geohazard mitigation. This necessitates the allocation of existing funds to those sites with the highest risk potential. Funds for studies and mitigation often get allocated because of particularly damaging events that result in focused public, media, and political attention. Those sites, however, may not necessarily be the ones with highest risk.”
Although there are catchments that generate debris flows with average recurrence intervals (ARIs) of a few years or less (see Table 1 in Davies et al., 2024, for a summary), many have ARIs ranging from decades to millennia (Jakob, 2005). Consequently, many debris-flow-susceptible catchments have no record of debris-flow activity, resulting in an underappreciated hazard.
Table 1ARIs and estimated sizes of four well-studied debris-flow catchments in NZ. Size classes are according to Jakob (2005).
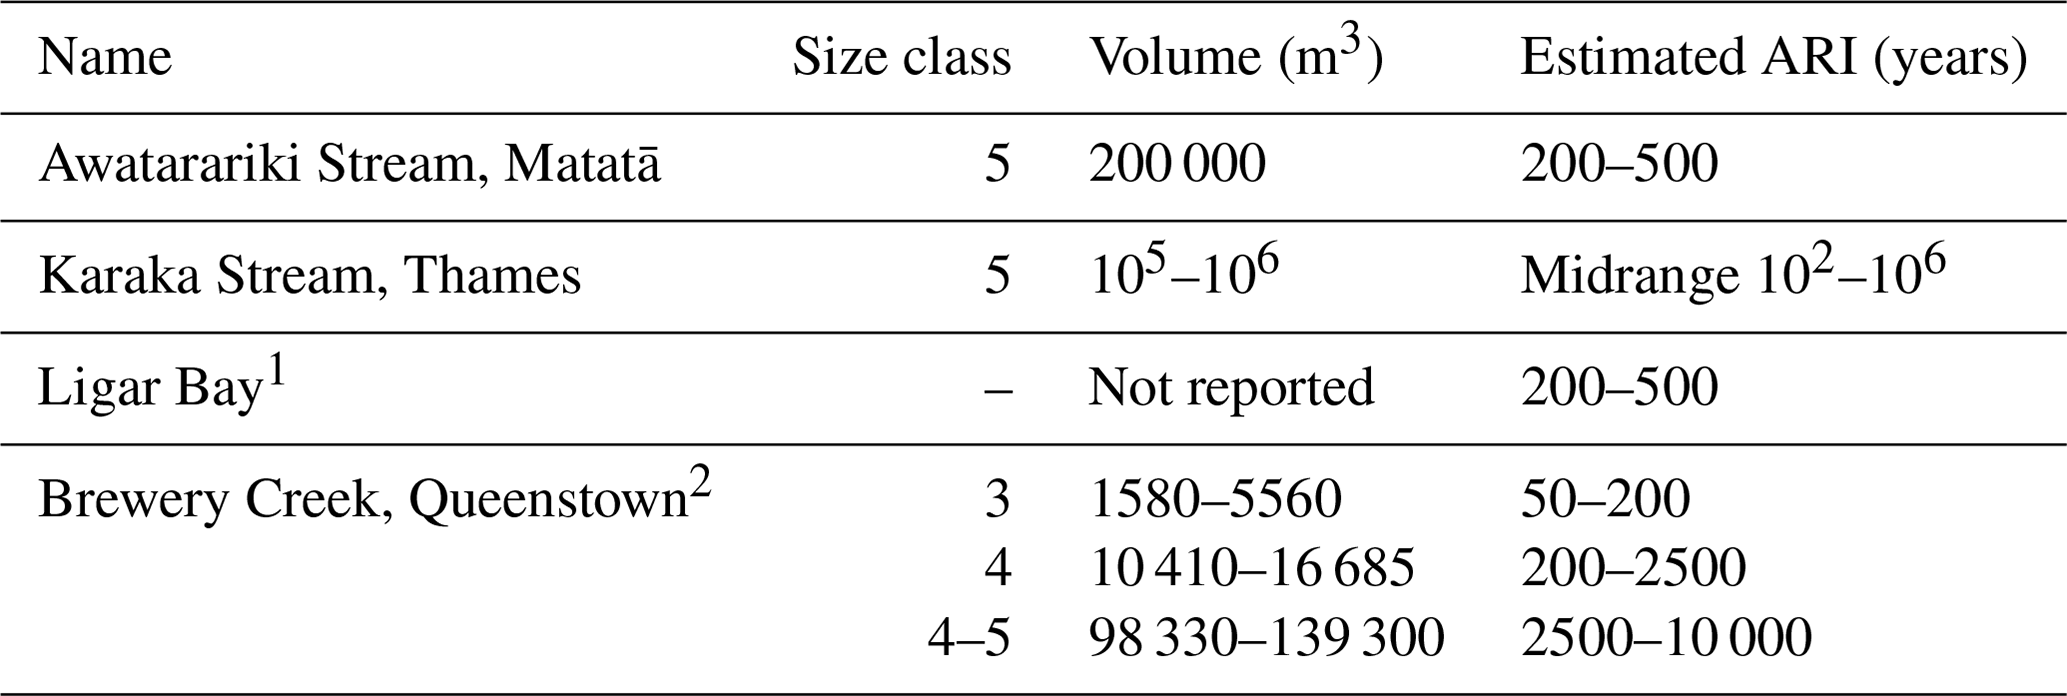
1 Page et al. (2012) noted that the estimated 200-year ARI for a debris-flow catchment in Ligar Bay may be reduced, possibly by up to half, based on climate-change projections. 2 ARIs were based on simulations for three debris-flow magnitudes (small, medium, large). The smallest magnitude (ARI 50–200 years) still resulted in an unacceptable risk to life near the top of the fan apex.
The primary requirement for a debris flow to occur is a large volume of sediment, especially fine sediment, available for mobilisation by a triggering event. This requires a steep and erodible catchment so that hillslope processes can deliver sediment to the stream channel (Welsh and Davies, 2011). Thus, catchment gradient is an obvious factor likely to be associated with debris-flow occurrence, and numerous morphometric indices for debris-flow susceptibility have been proposed based on catchment topography (de Haas et al., 2024).
The most-used indicator variable is the Melton ratio (R), which measures a catchment's average steepness (Melton, 1965). R is calculated from
where A is the map area of the catchment surface (m2), and H is the elevation difference between the catchment's highest point and the fan apex (m).
Various studies have derived a range of threshold values for R, above which a catchment is deemed susceptible to debris flows. A typical threshold for debris-flow susceptibility is R>0.5 or >0.6 (Holm et al., 2016; Page et al., 2012; Welsh and Davies, 2011; Wilford et al., 2004). However, in practice, there is no well-defined R threshold, with debris flows occurring in catchments with R values down to as low as 0.15 (e.g. Davies et al., 2024; Church and Jakob, 2020; McSaveney et al., 2005).
Morphometric indices such as the Melton R have proved useful for regional-scale assessment of debris-flow susceptibility using geospatial analysis in both Europe and North America (e.g. Bertrand et al., 2017; Cavalli et al., 2017; Holm et al., 2016; Ilinca, 2021). In NZ, regional-scale mapping of catchment R (Welsh and Davies, 2011; Bloomberg and Palmer, 2022) suggests that significant areas of built environments may be subject to debris-flow hazards, even where no previous events have been recorded. However, these regional reconnaissance-level studies require follow-up by agencies responsible for natural hazard management, i.e. detailed site investigation of potential debris-flow hazards and risks at the site level.
Of particular concern are locations where debris flows pose a risk to life for occupants of dwellings on debris-flow fans. The lack of a quantified ARI makes accurately calculating risk difficult. In this case, “unquantified (or ignored) risks can lead to incomplete or irrational risk management” decisions (Strouth and McDougall, 2022).
Here, we describe a simple method to rapidly and easily estimate the annual risk that debris flows pose to dwellings located on debris-flow fans and, thus, the annual risk to life for the occupants of those dwellings. We utilise these methods to show that even though debris flows may have ARIs of centuries, their ability to cause great damage means that the risk they pose to life can exceed acceptable levels. Nonetheless, the long ARIs for these events create an illusory sense of security, so their risk to life is not recognised.
2.1 Setting acceptable limits to risk to life from potential debris-flow hazards
Globally, the individual risk to life from natural hazard impacts is considered unacceptable at levels greater than about 10−3 to 10−4 per year (Taig et al., 2012). Where multiple deaths can occur, graphs showing the expected frequency and cumulative number of fatalities (F–N curves) can indicate the societal risk and its tolerability (e.g. Fig. 1 in Porter and Morgenstern, 2012). Such graphs are widely used as indicators of acceptable risk limits for various hazards but vary in the thresholds for acceptable risk (Rad, 2014; Sim et al., 2022). Here, we follow Porter and Morgenstern (2012) to establish a maximum acceptable individual risk to life of 10−3 per year, which scales linearly with the maximum acceptable risk to multiple lives ( per year, where N is the number of fatalities).
2.1.1 Calculation of risk to life for a debris-flow catchment
If the Melton R or other evidence suggests that a catchment may be susceptible to debris flows and there are existing or proposed dwellings on the debris-flow fan, then there is a need to demonstrate to communities and those involved in community governance that there may be a risk to life from debris flows. This demonstration needs to be credible yet simple and inexpensive since funding is often not available to study unrecognised natural hazards.
To achieve this, we use a modified form of a commonly used calculation of the annual risk to life from exposure to a single landside (see Walker et al., 2007; Jakob et al., 2012; Porter and Morgenstern, 2012; de Vilder et al., 2022):
where RDF is the individual risk to life from a debris-flow event; PH is the annual probability of the debris flow occurring; PS:H is the spatial probability of impact on a dwelling if a debris flow occurs; PT:S is the temporal probability that an individual occupant will be present when the debris flow impacts the dwelling; V is vulnerability or probability of loss of life if the occupied dwelling is impacted; and E is the number of occupants at risk, which is equal to 1 for the determination of individual risk. PH can also be specified in terms of its inverse, the average recurrence interval (ARI, years), for a debris-flow event.
We retain the notation but redefine some of the variables in Eq. (2) to reflect our understanding of the components of risk to life from debris flows. We redefine the “risk” term as the maximum acceptable annual risk to life (RDF(max)) and PH as PH(max), the value for the annual probability of a debris flow that will result in RDF(max) such that
Equation (4) allows PH(max) to be calculated, given an accepted value for RDF(max) and known or assumed values for PS:H, PT:S, V, and E. If there is evidence that the annual probability of a debris flow occurring is greater than the calculated PH(max), then any occupants of dwellings on the debris-flow fan will be subject to an unacceptable risk to life.
Equation (4) also allows us to explore the effects of uncertainty about the values of its other parameters. These parameters and their uncertainties are discussed in the following sections.
2.1.2 Probability of impact on a dwelling if a debris flow occurs (PS:H)
If a debris flow occurs, it will likely discharge onto a debris-flow fan, typically a depositional area where a steepland catchment disgorges onto a lower-slope landform. Initially, the debris flow is likely to follow existing active stream channels. However, changes in the active-channel position, termed avulsions, can pose a severe threat to dwellings on fans. This is because mitigation measures (e.g. check dams, bunds) are usually applied to active channels and cannot prevent damage from flows that establish a new channel pathway (de Haas et al., 2018). Thus, a dwelling on the fan can still be impacted, even if it is far from existing stream channels.
Furthermore, the path(s) followed by the avulsing debris flows are difficult to predict (de Haas et al., 2018). A very conservative assumption is, therefore, . In other cases where debris fans may be small or truncated by wave action or river flows, dwellings are often sited on the fan apex, and is near certain.
2.1.3 Temporal probability that an individual will be present when the landslide occurs (PT:S)
In NZ, the average proportion of time an individual spends within a residential dwelling is 0.69 (Khajehzadeh and Vale, 2017). However, this average value may not apply during high-intensity rainfall events when debris flows are most likely. At such times, dwelling occupants may self-evacuate or be evacuated by the authorities. Alternatively, during the event, the proportion of time spent in the dwelling may be close to 1, as the occupants shelter in place. We use a value of for this study, recognising that actual values are likely to be binomial (1 or 0) during high-intensity rainfall events.
2.1.4 Probability of an individual's death if dwelling impact occurs (V)
This parameter is critical but has considerable uncertainty. Firstly, it depends on debris-flow intensity in terms of volume, depth, composition, and velocity. While somewhat governed by catchment area and topography, debris-flow volumes may vary by at least 2 orders of magnitude between the median and 99th percentile for catchments of the same area (de Haas and Densmore, 2019; Marchi et al., 2019). Other factors (rainfall intensity and the volume of landslide material available for mobilisation as debris flows) are difficult to estimate or predict but are likely to be important drivers of debris-flow intensity (e.g. Chang et al., 2011).
Also important to the value of the V parameter is the vulnerability of the impacted building since casualties in landslides are often related to the destruction of occupied buildings and are thus a function of structural vulnerability (Jakob et al., 2012; Pollock and Wartman, 2020).
Massey et al. (2018) review building vulnerability studies and state that building performance during impact from a natural hazard depends on the type of structure or “building typology”. To describe the susceptibility of a building to damage from landslide hazards, most authors use the building typology. For example, Kang and Kim (2016) analysed data from 11 debris-flow events in different parts of South Korea in July and August 2011. All events resulted in damage to buildings from debris-flow impacts. For these events, vulnerability functions were related to the debris-flow depth, flow velocity, and impact pressure. Separate vulnerability functions were estimated for reinforced concrete frame buildings and non-reinforced concrete frame buildings, with reinforced concrete frame buildings having much lower vulnerability.
Finally, V may depend on chance, timing, or human behaviour. For example, out of caution, occupants may move to a less vulnerable part of the dwelling during a high-intensity rainfall event (Pollock and Wartman, 2020). Conversely, if the debris flow occurs in the middle of the night, a person sleeping in a bedroom on the upslope side of a dwelling may have no warning or chance to avoid the full force of impact.
We assume that the risk of death for an individual in an impacted dwelling is V=0.1. This is consistent with Bell and Glade (2004), who published values for the risk of death to an individual within a building (0.02 to 0.25) for “low-magnitude” to “high-magnitude” debris-flow events, respectively – although they did not specifically define the terms low magnitude or high magnitude. Note that if we chose a value of V=1.0 (it is certain the occupant of an impacted dwelling would die), then the threshold for PH(max) would be an order of magnitude lower, assuming that we use the same threshold RDF(max) (0.001 in this study).
2.1.5 The number of occupants at risk (E)
The PH(max) value is based on the RDF(max) value for the number of occupants in a single dwelling. Note that the maximum acceptable annual probability of debris flows PH(max) becomes progressively smaller with increasing E. In other words, the risk to life will increase with an increasing number of dwellings (and therefore E), and the acceptable-risk threshold for the annual probability of debris flows should be reduced. At the same time, some factors may reduce the risk to life with increasing E. If the larger numbers of people E are dispersed over multiple dwellings on a fan and if the debris-flow path and deposition area are restricted to part of the fan, some dwellings may not be impacted. Thus, the decrease in PH(max) might not scale linearly with increasing E since PS:H is less if averaged over all the dwellings.
We wish to avoid this complexity, as the parameter values in Eq. (2) will vary amongst the different dwellings located on a debris-flow fan. For simplicity, we assume that we are estimating the risk to life from a debris-flow event for an individual in a dwelling subject to the highest risk. However, we also assume that other individuals in the same dwelling will have a similar risk. Therefore, we used the usual NZ occupancy rate for residential households (NO=2.67; Statistics NZ, 2024) to calculate the number of occupants at risk (E) for a single dwelling on a debris-flow fan. This approach was also used by Bell and Glade (2004), who estimated an individual risk to a person in a building and then multiplied this by the total number of occupants in the building to estimate an “object risk to people in buildings”, defined as the risk to life, taking all people in a building into account.
2.2 Analysis of potential risk to life
2.2.1 The estimated annual probability of debris-flow occurrence (PH)
Calculating PH(max) provides a standard for comparison with estimated PH (annual probability of a debris flow occurring). There is an unacceptable risk to life for debris-flow catchments where estimated PH> calculated PH(max). However, estimated PH can have wide confidence limits or be completely uncertain since ARIs may be centuries or even millennia in magnitude. This means that no debris flows may have occurred in living or even historical memory for most catchments, so data to estimate ARIs are sparse or lacking.
This lack of certainty is a serious problem since (1) PH is an important driver of annual risk to life from debris flows; (2) the lack of observations means estimates of PH may have confidence limits that are so wide as to make the estimates uninformative; and (3) in rapidly developing countries like NZ, the expansion of land use into hitherto-unutilised areas means that debris-flow hazard may be unrecognised. Of course, with very long ARIs (very low PH), the risk to life may be acceptably low. However, there may be a window of non-recognition where ARIs are long enough that the debris-flow hazard is not yet recognised but short enough that the risk to life is still unacceptably high. The second application of our model is identifying any such window.
Our model assumes a single annual probability threshold PH(max) for a debris flow that results in an unacceptable risk to life for occupants of a dwelling in a debris-flow catchment. A more complex formulation would account for the reality that debris flows of different magnitudes/intensities may come from the same catchment, with larger, more intense events having lower frequencies. For example, Strouth and McDougall (2022) estimate separate model parameter values for each frequency–magnitude scenario then integrate these to estimate an overall risk to life. However, this requires sufficient data to estimate frequency–magnitude relationships (Jakob et al., 2020). As pointed out earlier in this paper, our method is designed for situations where there may be no data on debris-flow occurrences since either (1) none have occurred within recorded history or (2) funding was not available to carry out the required study.
2.2.2 Using Bayesian analysis to estimate PH
We used Bayesian inference to estimate PH for debris-flow events. In a previous study, we used the upper bound of PH values from studies of known debris-flow catchments (see Table 1, Davies et al., 2024) to estimate the risk to life from debris-flow hazards. However, this approach has the disadvantage of basing PH values on the most active debris-flow catchments, leading to the criticism that any estimates of risk to life are overly pessimistic (“risk estimate conservatism”), which is to be avoided in evaluating risk (Strouth et al., 2024).
Bayesian analysis uses expert opinion to estimate a “prior” distribution of the variable of interest (in this case, PH) combined with any available observed evidence to produce a “posterior” distribution. This has the advantage of accounting for the full range of catchment PH values, not just the values for the most active catchments.
There are few formal expert estimates of ARI or PH for debris flows in NZ catchments. Table 1 summarises ARIs for four well-studied debris-flow catchments – Awatarariki Stream, Mātata (McSaveney et al., 2005); Karaka Stream, Thames township (McSaveney and Beetham, 2006); Nyhane Drive, Ligar Bay (Page et al., 2012); and Brewery Creek, Queenstown (Beca Ltd, 2020). ARIs are for debris flows that observation or modelling suggested were potentially life-threatening.
Based on Table 1, we used two conjugate beta-binomial models with the beta prior PH∼ beta (a, b), where the parameters a and b were chosen to correspond to the prior 95 % credible intervals for PH of (, ) and (, ), respectively. We then assume that there have been no observed life-threatening debris flows in a catchment for 100 years. This “observation” allows us to estimate the posterior probability and 95 % credible intervals for PH for that catchment. We then compared the estimated PH to the PH(max) values, assuming one dwelling per catchment. Where estimated PH>PH(max), the risk to life was classified as unacceptable.
We also estimated the probability of a window of non-recognition where ARIs are long enough that the debris-flow hazard is not recognised but short enough that the risk to life is still unacceptably high. For three defined periods (50, 100, and 150 years), we estimated the posterior predictive distributions for the probabilities of outcomes where zero debris flows occurred during the period since, for these outcomes, the debris-flow susceptibility of the catchment would likely be unrecognised (assuming no expert investigation of the catchment). This assumes that if at least one debris flow had occurred in a catchment during the specified period, it would have been recorded, and the catchment's susceptibility would have been clearly recognised.
Note that while we have used 50-, 100-, and 150-year periods, these methods can be used with any time period. The criterion for the choice of time period is how far back it is likely that a debris-flow occurrence would be remembered and recorded. In regions where human settlement is very recent, an appropriate period might be considerably shorter than 150 years.
All statistical analysis was done in the program R (R Core Team, 2021).
3.1 Estimation of PH(max) and comparison with estimated PH
Table 2 shows the calculated values for PH(max) assuming that the upper limit for acceptable risk to an individual life (RDF(max)) is 0.001, probability of impact is , and probability of an individual's death if a debris flow impacts an occupied dwelling is V=0.1. It also shows the inverse of PH(max), the minimum ARI threshold below which the risk to life is unacceptable.
Table 2Parameters used to calculate PH(max), the maximum acceptable annual probability of a debris flow occurring.
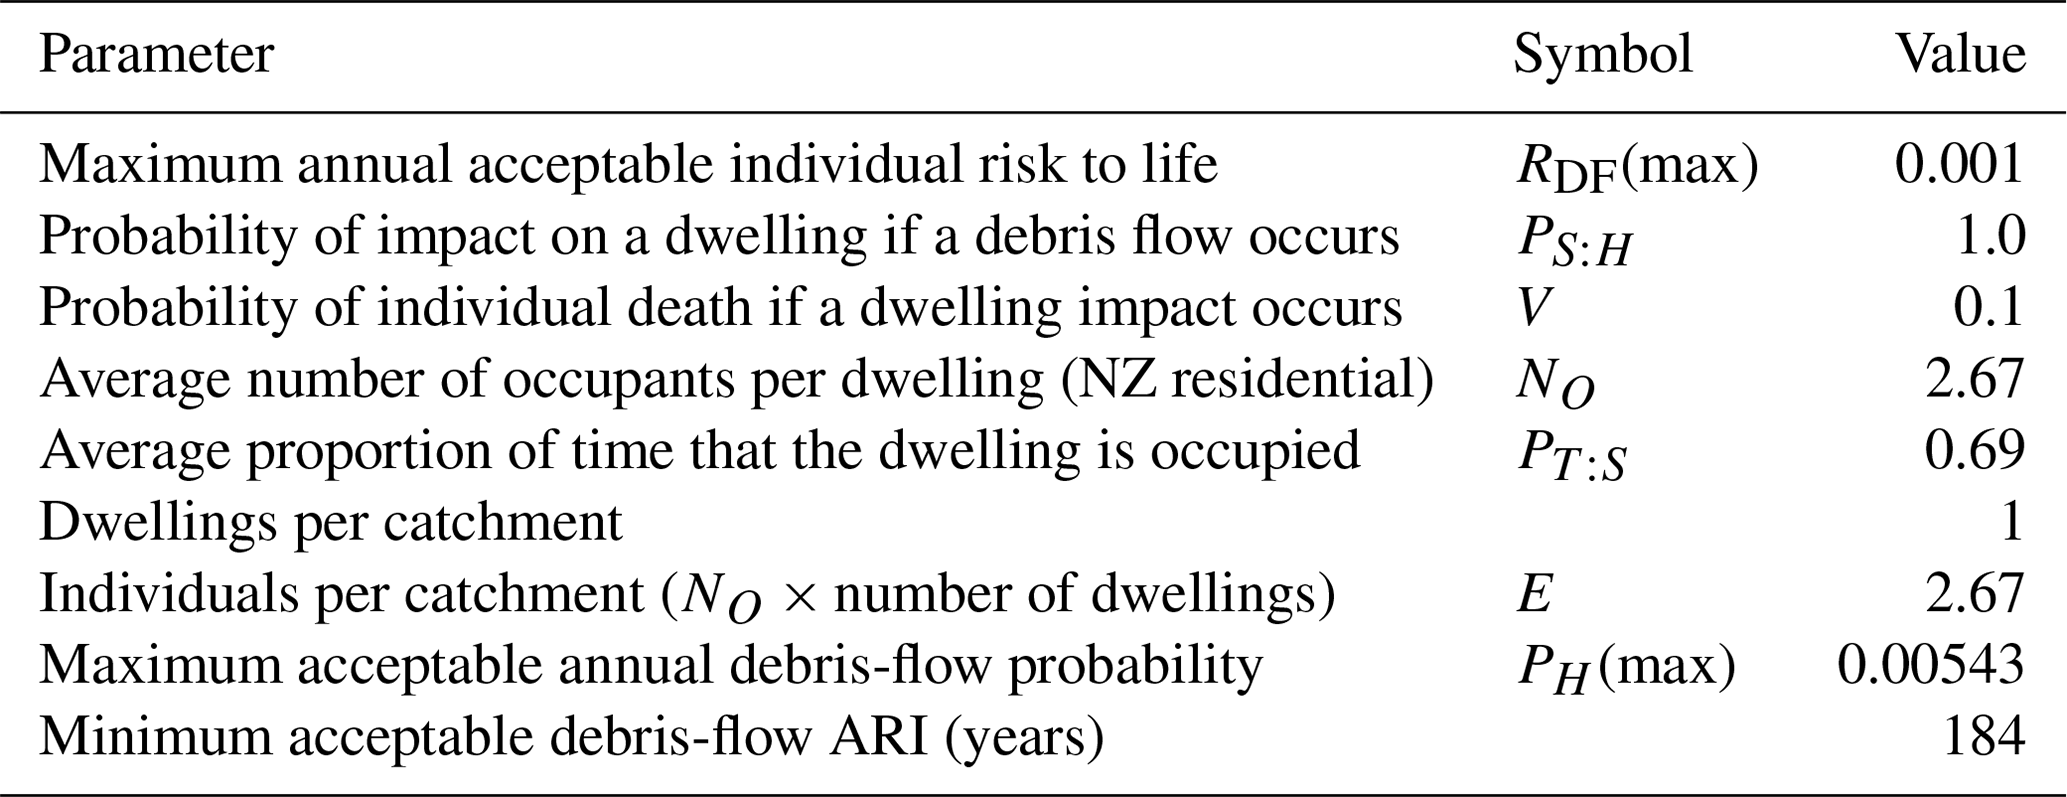
The upper acceptable threshold for the annual probability of a debris flow (PH(max)) can be used to explore the risk to life from debris flows by comparing it to estimated PH from Bayesian inference. Unacceptable risk to life occurs where the estimated annual probability of a debris flow PH exceeds the PH(max) threshold in Table 2 (0.00543).
Table 3 summarises the parameters for the Bayesian estimates. Prior estimates are for two possible ranges for ARI: 200–500 years and 100–500 years. Posterior estimates are based on the assumed observation that no life-threatening debris flows have occurred within the last 100 years.

Figure 1 shows how PH(max) for a single dwelling can be compared to (1) the prior distribution of PH and (2) a posterior distribution of PH that assumes zero observations in a catchment for a 100-year period.
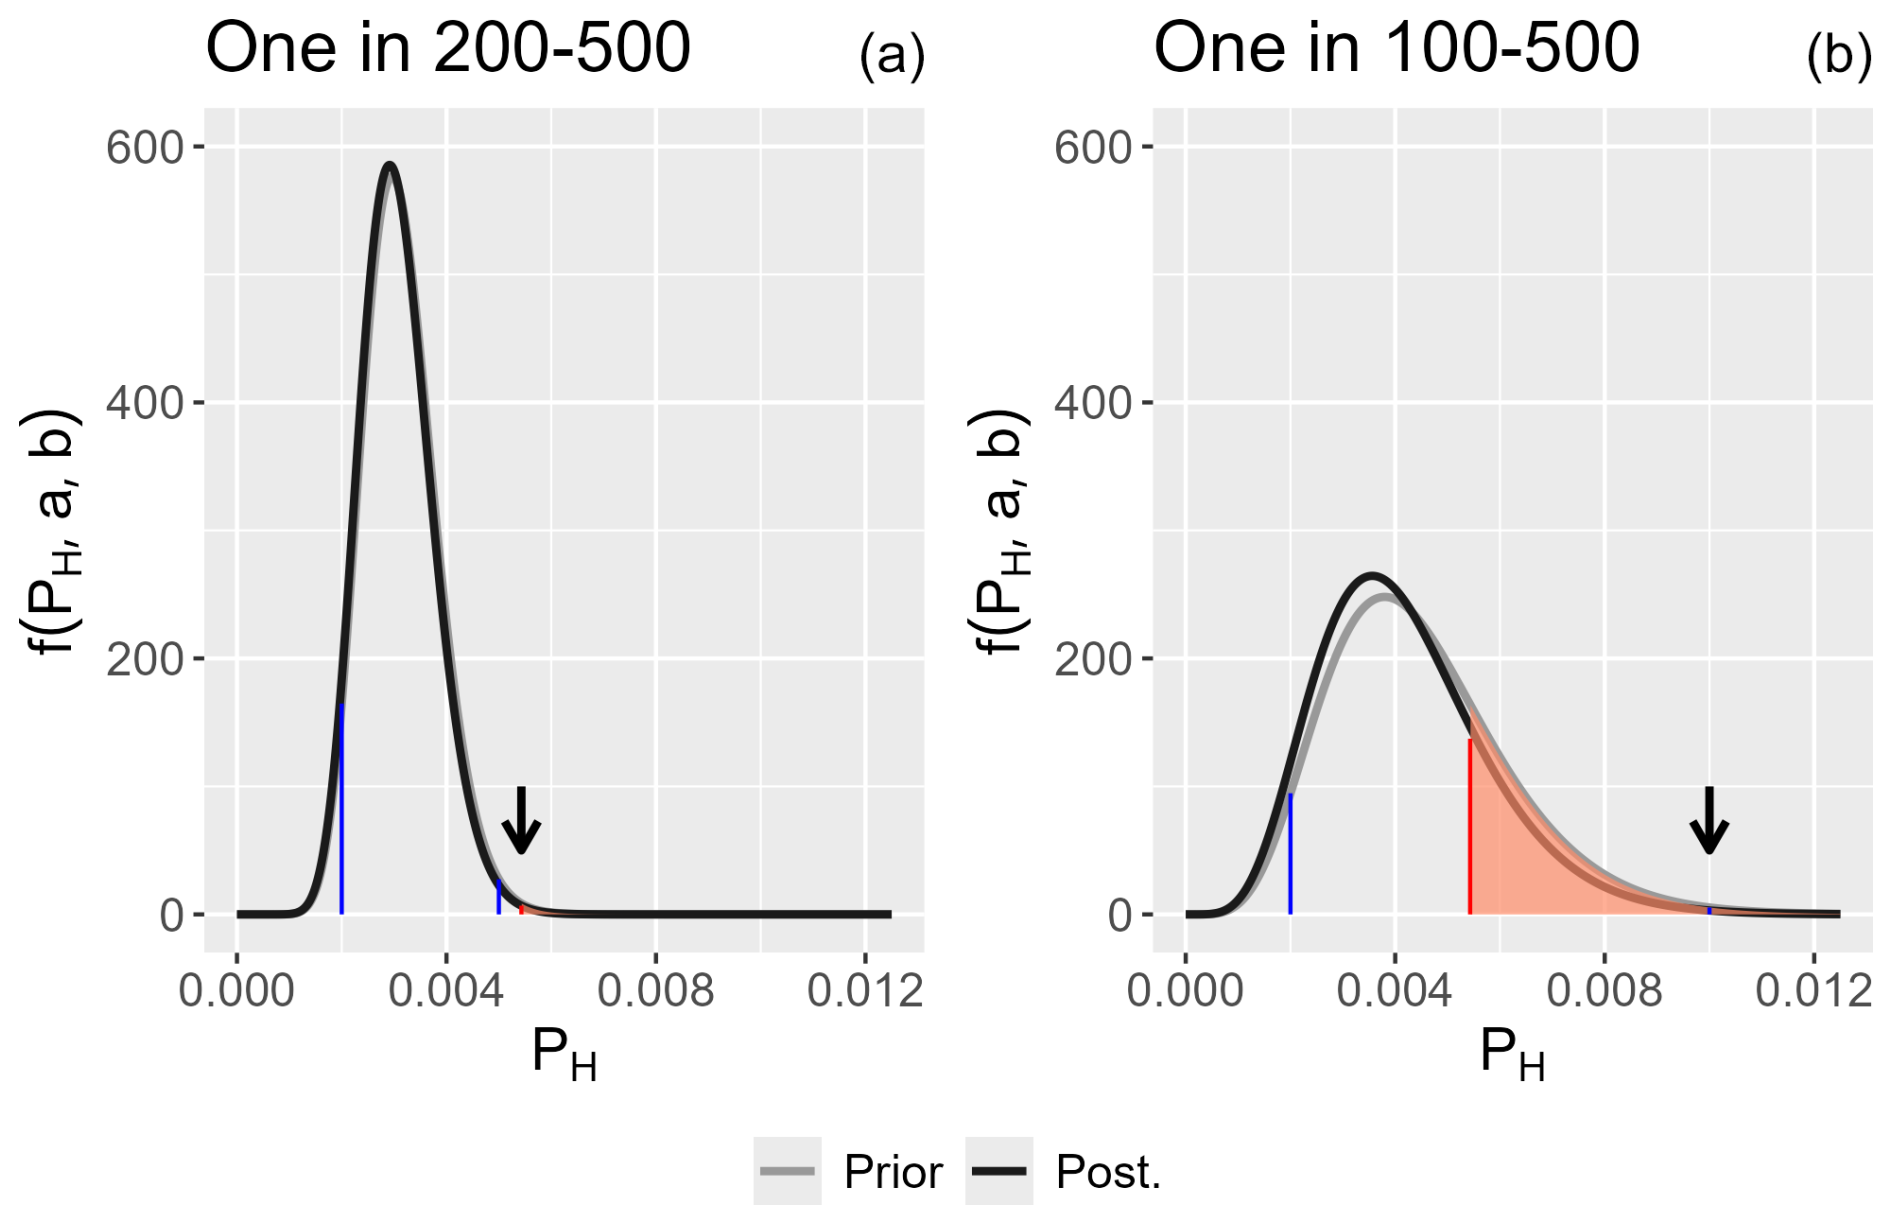
Figure 1Prior (grey) and posterior (black) probability distributions for PH, assuming that the 95 % limits for PH are (a) (, ) or (b) (, ). Posterior probabilities are calculated with zero occurrences of debris flows over 100 years. The orange area under the curve corresponds to the posterior probability that PH>PH(max) for a single dwelling. PH(max)=0.00543 is shown by a vertical red line. The vertical blue lines indicate the values for the prior probabilities. The arrows are used to indicate probability lines that are too small to see: PH(max) in panel (a) and the prior probability of 1 in 100 (0.01) in panel (b).
Using the posterior distributions in Fig. 1, the posterior probability that PH>PH(max) is the area under the black curve to the right of the vertical red line (PH(max)=0.00543 for a single dwelling) (Table 2). For the 95 % credible intervals for PH of (, ), the posterior probability is 0.0060; therefore, it is highly unlikely that PH>PH(max). For the 95 % credible intervals for PH of (, ), the posterior probability that PH>PH(max)=0.2560. In this case, there is a reasonably high probability that the maximum acceptable risk to life PH(max) would be exceeded.
3.2 Estimating the window of non-recognition
The probability distributions for the probability of zero events in 50, 100, and 150 years were used to identify a window of non-recognition where ARIs are long enough that the debris-flow hazard is not recognised but short enough that risk to life is still unacceptably high. These distributions are based on the credible intervals (, ) or (, ) for the PH of a life-threatening debris-flow event in a catchment (Table 4, Fig. 2).
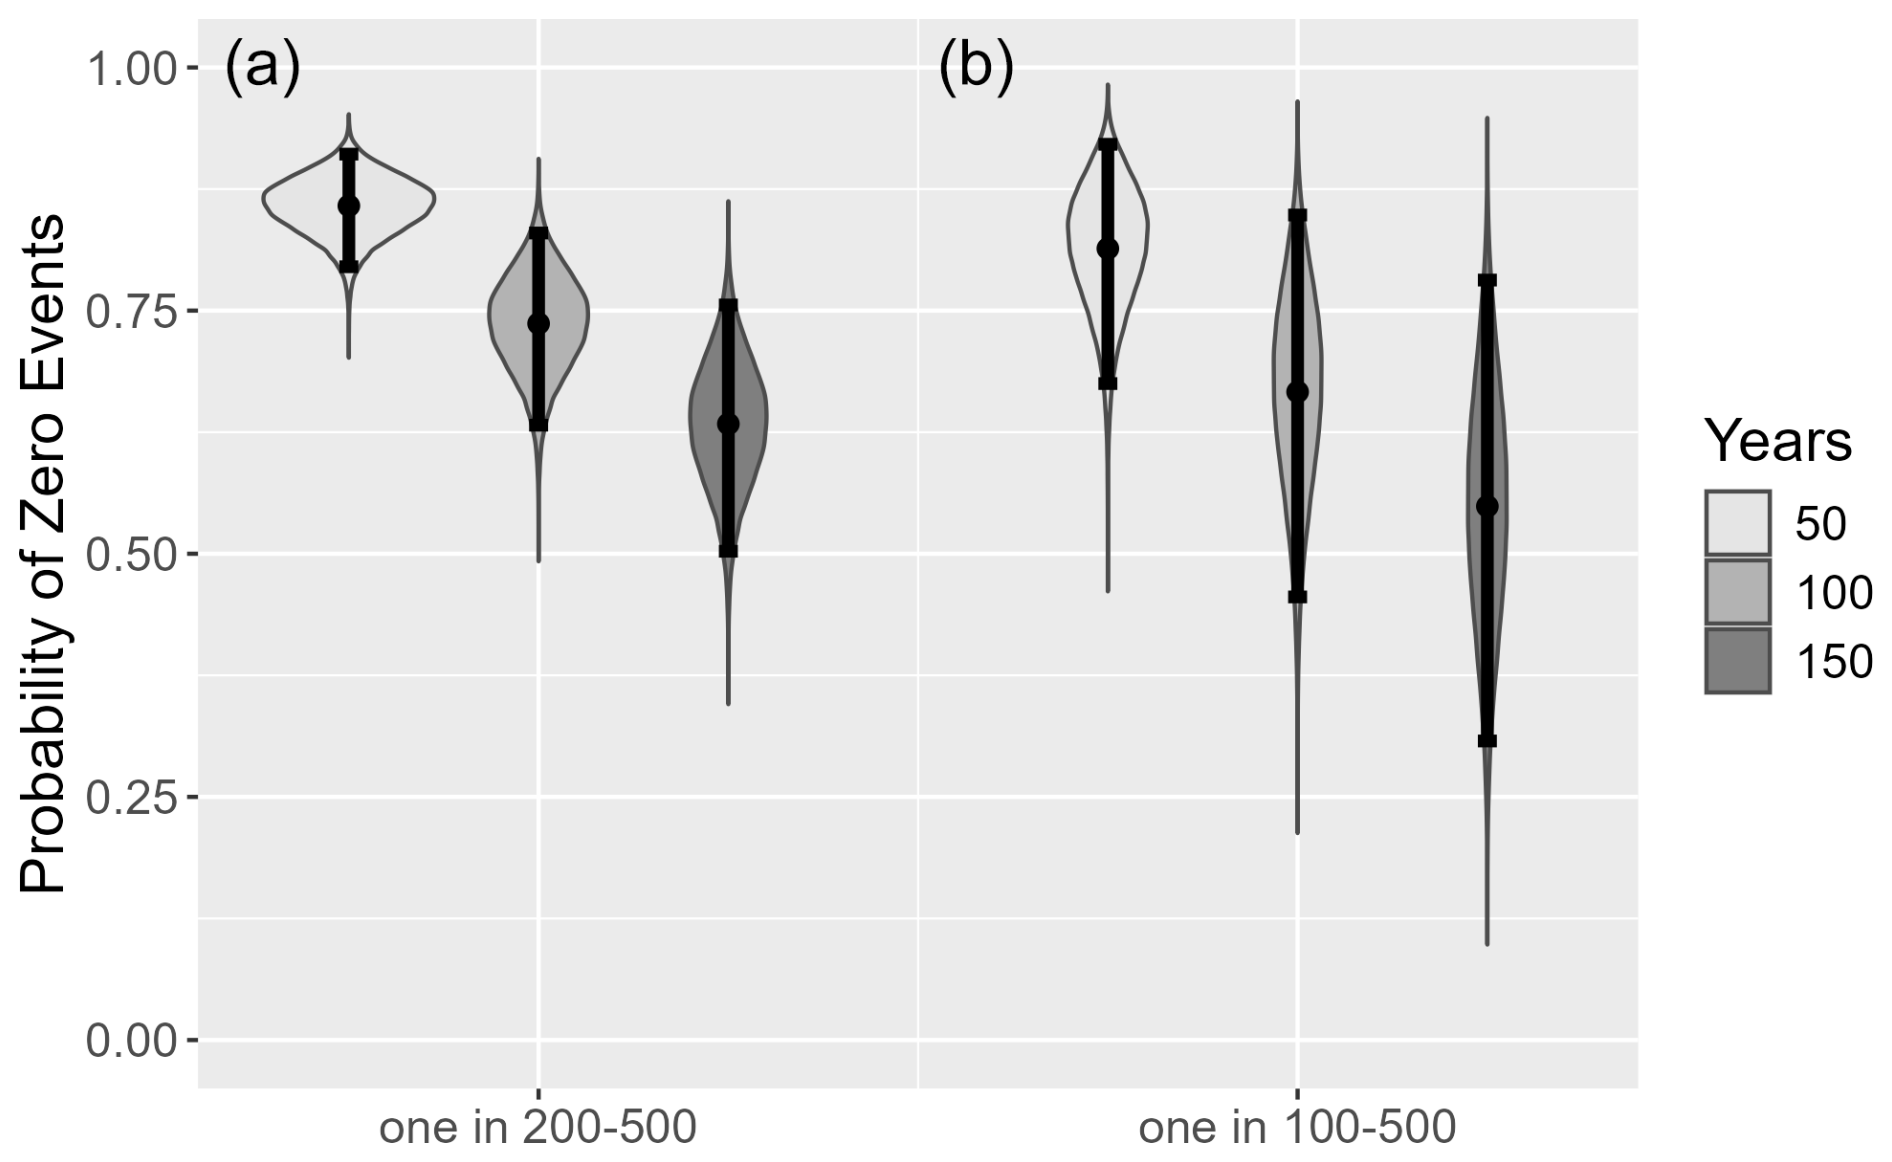
Figure 2The mean posterior predicted probabilities and the underlying densities (violin plots) for zero events in 50, 100, and 150 years, assuming PH estimated with credible intervals of (, ) (a) or (, ) (b). Error bars are the associated 95 % credible interval for the mean posterior predicted probabilities.
If we use 95 % credible intervals for PH (, ), the mean probability that no life-threatening debris flow occurs within 100 years is 0.65, with 95 % credibility intervals of 0.43 and 0.84. If the time interval for historical records is increased to 150 or decreased to 50 years, the mean posterior predicted probability decreases to 0.53 or increases to 0.80, respectively. This analysis suggests there is a very good chance that catchments may have no recorded debris-flow activity over long periods yet pose an unacceptable and unrecognised risk to life from debris flows.
Table 4Probability of zero life-threatening debris-flow events within a nominated period, using two priors assuming that the 95 % limits for PH are (, ) or (, ). CI is the associated 95 % credible interval for the mean posterior predicted probabilities.
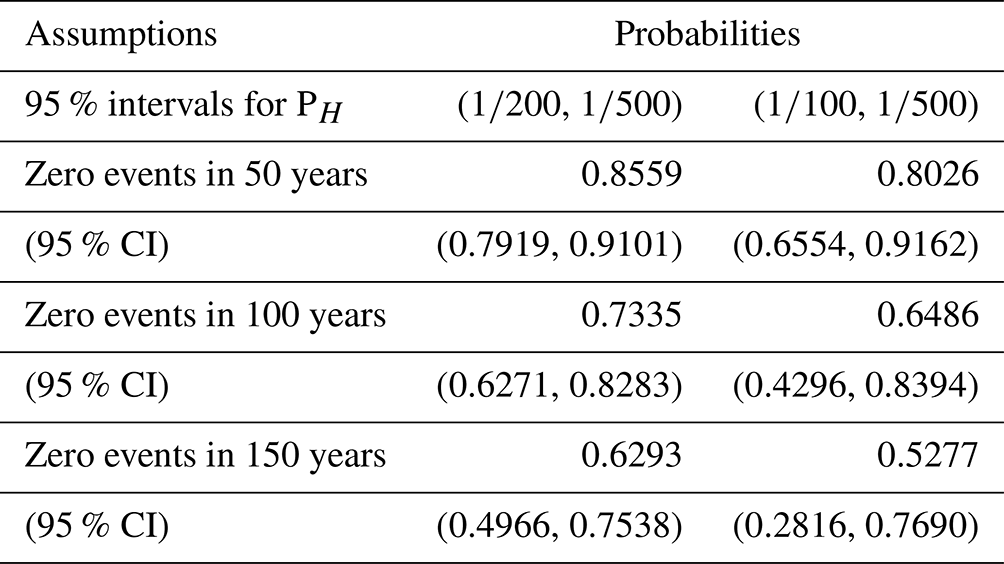
If we use 95 % credible intervals for PH (, ), there is also a very good chance that catchments may have no recorded debris-flow activity over long periods. However, in this case the risk to life from debris flows is considerably less (probability that PH>PH(max)=0.006).
4.1 Uncertainty in parameter values
The model parameters (Eq. 4) determining the PH(max) were based on reported values in the literature. All have uncertainty, but some appear to have higher uncertainty than others.
The probability of impact on dwellings if a debris flow occurs (PS:H) is assumed to be 1. Where the fan is small and/or dwellings are sited in the likely path for a debris flow, this is a credible assumption. If dwellings are sited at a distance from the flow path, it is a matter of whether the debris flow avulses and, if it does, whether it will travel towards dwellings sited on the fan. Debris-flow avulsion is poorly understood, and patterns of deposition on debris-flow fans have been monitored or reconstructed on only a few natural debris-flow fans (e.g. Zubrycky et al., 2021; de Haas et al., 2018; Santi et al., 2017).
The probabilities of an individual death if dwelling impact occurs (V) and of an individual being present when the landslide occurs (PT:S) are even more uncertain, depending on the interaction of debris-flow intensity, dwelling vulnerability, and human behaviour. The temporal probability that an individual will be present depends on human behaviours such as evacuation or sheltering in place and on diurnal variations in occupancy or seasonal variations in occupancy, as are found with holiday homes. In NZ, given the large number of debris-flow impacts on dwellings within the last 15 years with no fatalities (albeit with injuries and lucky escapes), the values for V (0.1) and PT:S (0.69) may be too high. However, given the risk-to-life implications of these parameters, we have adopted a precautionary approach.
Finally, the model must deal with catchments where there is not enough information to estimate ARIs for life-threatening debris flows. Based on estimates of ARI for life-threatening debris flows from four NZ studies, we used 95 % credible intervals for PH of (, ) and (, ) to estimate the probability that PH(max) would be exceeded for a debris-flow catchment. We found that the choice of the lower threshold for the credible interval was critical. If we used (ARI = 200 years), then the probability was low that the risk-to-life threshold (0.001) would be exceeded. However, if the lower threshold for the credible interval was (ARI = 100 years), then the probability that the risk-to-life threshold (0.001) would be exceeded was much higher. Again, a cautious approach would be to assume 95 % credible intervals for PH of (, ) and, therefore, a significant risk to life (probability that PH>PH(max)=0.2560).
4.2 Limitations of the model
Our model assumes a single annual probability threshold for a debris flow that is an unacceptable risk to life for occupants of a dwelling in a debris-flow catchment rather than a more complex and realistic model that integrates a range of debris-flow frequency and intensity scenarios.
An example of this limitation of our model is the window of non-recognition estimate, where catchments may exhibit no debris-flow activity over long periods yet pose an unacceptable and unrecognised risk to life from debris flows. Of course, this analysis is based on limited data for ARIs of life-threatening debris flows in four catchments. For catchments with smaller ARIs, the proportion of unrecognised catchments with zero occurrences will be smaller and that of recognised catchments with occurrences ≥1 will be larger. At the same time, these more frequent debris flows may not be life-threatening, leading to complacency about the actual risk to life in the catchment. This was the case for Matatā township in the eastern Bay of Plenty, NZ. Four debris flows had occurred at Matatā since 1860 before a major debris-flow disaster in 2005 happened, which destroyed 27 dwellings and damaged 87 properties, fortuitously with no fatalities (McSaveney et al., 2005).
Despite these limitations, we have chosen a simple model because reliable data are scarce, and most model parameters are subject to considerable uncertainty. More importantly, our conceptual approach highlights the dangers of complacency about the risk to life from debris flows. Using simple concepts and Bayesian inference, we can show that given precautionary but realistic assumptions about debris-flow hazards and the vulnerability of dwellings and their occupants, unrecognised catchments with no history of debris-flow activity can pose an unacceptable risk to life. Parameters subject to uncertainty (debris-flow ARIs, probability of debris-flow impact, dwelling vulnerability, occupancy during debris-flow-triggering rainfall events) must be priorities for research to better understand the risk to life from debris flows.
Debris flows are a potentially dangerous natural hazard for any dwelling on an alluvial fan at the mouth of a steepland catchment. However, debris-flow-susceptible catchments may be unrecognised because debris flows may only rarely occur in each catchment. Even where reconnaissance studies using morphometric indices (e.g. Melton's R) indicate a significant potential hazard, the long annual recurrence intervals (ARIs) for some debris-flow catchments mean that their annual probability of occurrence (PH) is difficult to estimate reliably. Thus, there is a danger that their risk may be considered negligible.
Here, we have handled this difficulty by inverting the problem. Instead of trying to estimate PH for debris flows in a specific catchment, we have back-calculated a maximum acceptable annual probability PH(max) to meet accepted thresholds for maximum risk to life. This has allowed us to do the following.
-
We compared the threshold PH(max) with four NZ studies where the probability distribution of PH can be estimated from field evidence. Given conservative assumptions about the debris-flow ARI, the probability of impact on dwellings, and the probability of mortality for an impacted dwelling, we have shown that for catchments with one dwelling, PH can exceed PH(max).
-
We estimated the window of non-recognition where debris flows within a catchment may be so infrequent that it is not recognised as susceptible, yet the risk to life from debris flows exceeds the accepted threshold. We have shown that a significant proportion of debris-flow-susceptible catchments will fall within this window, even assuming up to 150 years of written or oral history recording debris flows within the catchment.
-
We explored the influence of the important parameters underlying the annual risk to life from debris flows. The observed frequency of deaths in NZ dwellings from debris-flow impacts, admittedly from a small sample, appears to be lower than the assumed value in this study, suggesting that these key parameters need further research.
-
Nevertheless, we have shown that catchments not recognised as debris-flow-capable can pose risks to life that are unacceptable. Land-use planning for future developments in a potentially susceptible catchment cannot rely on the fact that no debris flows have been recorded. There is a need to do site analyses and to think carefully about the siting of dwellings or other structures that people may occupy.
The analysis used the programme R to perform widely understood and fundamental Bayesian statistics, which can be readily duplicated from the description and equations in the text. There is no specialised code required to perform these analyses. The calculation can be performed in any software, including basic Excel.
This study uses a small data set that is fully available in Table 1 of this paper. Sources of the data are also fully referenced. There are no additional data sets.
MB and TRHD conceptualised and designed the study, including a literature review and preliminary analyses. EM performed statistical analyses, produced figures, and contributed to the writing and reviewing of the paper. TRR and DJP contributed to the writing and reviewing of the paper. MB revised and edited the text.
The contact author has declared that none of the authors has any competing interests.
Publisher’s note: Copernicus Publications remains neutral with regard to jurisdictional claims made in the text, published maps, institutional affiliations, or any other geographical representation in this paper. While Copernicus Publications makes every effort to include appropriate place names, the final responsibility lies with the authors.
This paper arose from our work on mapping catchment debris flow susceptibility at a regional scale for Marlborough and Tasman District Councils NZ. We acknowledge the ongoing support of both councils.
This paper was edited by Bruce D. Malamud and reviewed by two anonymous referees.
Beca Ltd: Natural hazards affecting Gorge Road, Queenstown, Prepared for Queenstown Lakes District Council, Beca Ltd, Christchurch, New Zealand, https://www.qldc.govt.nz/media/vsnfk4vk/3c-attachment-c-beca-limited-risk-assessment-natural-hazards-affecting-gorge-road-queenstown-november-2020-c.pdf (last access: 31 January 2025), 2020.
Bell, R. and Glade, T.: Quantitative risk analysis for landslides ‒ Examples from Bíldudalur, NW-Iceland, Nat. Hazards Earth Syst. Sci., 4, 117–131, https://doi.org/10.5194/nhess-4-117-2004, 2004.
Bertrand, M., Liébault, F., and Piégay, H.: Regional Scale Mapping of Debris-Flow Susceptibility in the Southern French Alps, Journal of Alpine Research | Revue de géographie alpine, 105-4, https://doi.org/10.4000/rga.3543, 2017.
Bloomberg, M. and Palmer, D. J.: Estimation of catchment susceptibility to debris flows and debris floods–Marlborough Sounds, Pelorus Catchment and Wairau Northbank. Draft Report to Marlborough District Council, https://www.marlborough.govt.nz/repository/libraries/id:2ifzri1o01cxbymxkvwz/hierarchy/documents/your-council/meetings/2022/environment-2022/Item_5-17032022-Estimation_of_catchment_susceptibility_to_debris_flows.pdf (last access: 31 January 2025), 2022.
Cavalli, M., Crema, S., Trevisani, S., and Marchi, L.: GIS tools for preliminary debris-flow assessment at regional scale, J. Mt. Sci., 14, 2498–2510, 2017.
Chang, C. W., Lin, P. S., and Tsai, C.L.: Estimation of sediment volume of debris flow caused by extreme rainfall in Taiwan, Eng. Geol., 123, 83–90, 2011.
Church, M. and Jakob, M.: What is a debris flood?, Water Resour. Res., 56, e2020WR027144, https://doi.org/10.1029/2020WR027144, 2020.
Davies, T., Bloomberg, M., Palmer, D., and Robinson, T.: Debris-flow risk-to-life: Preliminary screening, Int. J. Disast. Risk Red., 100, 104158, https://doi.org/10.1016/j.ijdrr.2023.104158, 2024.
de Haas, T., Kruijt, A., and Densmore, A.: Effects of debris-flow magnitude–frequency distribution on avulsions and fan development, Earth Surf. Proc. Land., 43, 2779–2793, 2018.
de Haas, T., Lau, C. A., and Ventra, D.: Debris-Flow Watersheds and Fans: Morphology, Sedimentology and Dynamics, in: Advances in Debris-flow Science and Practice, 9–73, Springer International Publishing, Cham, https://doi.org/10.1007/978-3-031-48691-3_11, 2024.
de Vilder, S., Massey, C., Lukovic, B., Taig, T., and Morgenstern, R.: What drives landslide risk? Disaggregating risk analyses, an example from the Franz Josef Glacier and Fox Glacier valleys, New Zealand, Nat. Hazards Earth Syst. Sci., 22, 2289–2316, https://doi.org/10.5194/nhess-22-2289-2022, 2022.
Dowling, C. A. and Santi, P. M.: Debris flows and their toll on human life: a global analysis of debris-flow fatalities from 1950 to 2011, Nat. Hazards, 71, 203–227, 2014.
Farrell, J. and Davies, T.: Debris flow risk management in practice: a New Zealand case study, Association of Environmental and Engineering Geologists, Special Publication, 28, https://doi.org/10.25676/11124/173158, 2019.
Frank, F., McArdell, B. W., Huggel, C., and Vieli, A.: The importance of entrainment and bulking on debris flow runout modeling: examples from the Swiss Alps, Nat. Hazards Earth Syst. Sci., 15, 2569–2583, https://doi.org/10.5194/nhess-15-2569-2015, 2015.
de Haas, T. and Densmore, A. L.: Debris-flow volume quantile prediction from catchment morphometry, Geology, 47, 791–794, 2019.
Holm, K., Jakob, M., and Scordo, E.: An inventory and risk-based prioritization of Steep Creek Fans in Alberta, Canada, in: 3rd European Conference on Flood Risk Management (FLOODrisk 2016), E3S Web of Conferences, 7:01009, EDP Sciences, https://doi.org/10.1051/e3sconf/20160701009, 2016.
Ilinca, V.: Using morphometrics to distinguish between debris flow, debris flood and flood (Southern Carpathians, Romania), Catena, 197, 104982, https://doi.org/10.1016/j.catena.2020.104982, 2021.
Iverson, R. M.: Debris flows: behaviour and hazard assessment, Geology Today, 30, 15–20, 2014.
Jakob, M.: A size classification for debris flows, Eng. Geol., 79, 151–161, 2005.
Jakob, M.: Debris-flow hazard assessments: a practitioner's view, Environ. Eng. Geosci., 27, 153–166, 2021.
Jakob, M. and Jordan, P.: Design flood estimates in mountain streams-the need for a geomorphic approach, Can. J. Civil. Eng., 28, 425–439, 2001.
Jakob, M., Stein, D., and Ulmi, M.: Vulnerability of buildings to debris flow impact, Nat. Hazards, 60, 241–261, 2012.
Jakob, M., Mark, E., McDougall, S., Friele, P., Lau, C. A., and Bale, S: Regional debris-flow and debris-flood frequency–magnitude relationships, Earth Surf. Proc. and Land., 45, 2954–2964, 2020.
Kang, H. S. and Kim, Y. T.: The physical vulnerability of different types of building structure to debris flow events, Nat. Hazards, 80, 1475–1493, 2016.
Khajehzadeh, I. and Vale, B.: How New Zealanders distribute their daily time between home indoors, home outdoors and out of home, Kōtuitui: New Zealand Journal of Social Sciences Online, 12, 17–31, 2017.
Marchi, L., Brunetti, M. T., Cavalli, M., and Crema, S.: Debris-flow volumes in northeastern Italy: Relationship with drainage area and size probability, Earth Surf. Proc. Land., 44, 933–943, 2019.
Massey, C. I., Thomas, K.-L., King, A. B., Singeisen, C., Horspool, N. A., and Taig, T.: SLIDE (Wellington): vulnerability of dwellings to landslides (Project No. 16/SP740), GNS Science report, 2018/27, GNS Science, Lower Hutt, New Zealand, https://doi.org/10.21420/G2DD2Q, 2018.
McSaveney, M. and Beetham, R.: The potential for debris flows from Karaka Stream, Thames, Coromandel, GNS Science Consultancy Report, 2006/014, GNS Science, Wellington, New Zealand, https://portal.issn.org/resource/ISSN/1172-4005 (last access: 31 January 2025), 2006.
McSaveney, M., Beetham, R., and Leonard, G.: The 18 May 2005 debris flow disaster at Matata: Causes and mitigation suggestions, GNS Science Client Report, 2005/71, GNS Science, Wellington, New Zealand, 2005.
Melton, M. A.: The geomorphic and paleoclimatic significance of alluvial deposits in southern Arizona, J. Geol., 73, 1–38, 1965.
Page, M., Langridge, R., Stevens, G., and Jones, K.: The December 2011 debris flows in the Pohara-Ligar Bay area, Golden Bay: causes, distribution, future risks and mitigation options, GNS Science Consultancy Report 2012/305, GNS Science, Wellington, New Zealand, 2012.
Pollock, W. and Wartman, J.: Human vulnerability to landslides, GeoHealth, 4, e2020GH000287, https://doi.org/10.1029/2020GH000287, 2020.
Porter, M. and Morgenstern, N.: Landslide risk evaluation in Canada, in: Proc. Joint XIth International & 2nd North America Symposium on Landslides, Banff, Alberta, 2–8, 2012.
Rad, M. K.: Global Risk Assessment of Natural Disasters: new perspectives, PhD thesis, University of Waterloo, Canada, http://hdl.handle.net/10012/8545 (last access: 31 January 2025), 2014.
R Core Team: R: A language and environment for statistical computing, R Foundation for Statistical Computing, Vienna, Austria, https://www.R-project.org/ (last access: 31 January 2025), 2021.
Santi, P. M., Pyles, D. R., and Pederson, C. A.: Debris flow avulsion, International Journal of Erosion Control Engineering, 10, 67–73, 2017.
Statistics NZ: Census household, family, and extended family highlights, https://www.stats.govt.nz/information-releases/2023-census-household-family-and-extended-family-highlights/ (last access: 31 January 2025), 2024.
Sim, K. B., Lee, M. L., and Wong, S. Y.: A review of landslide acceptable risk and tolerable risk, Geoenvironmental Disasters, 9, 3, https://doi.org/10.1186/s40677-022-00205-6, 2022.
Strouth, A. and McDougall, S.: Individual risk evaluation for landslides: key details, Landslides, 19, 977–991, 2022.
Strouth, A., LeSueur, P., Zubrycky, S., de Vilder, S., Lo, F., Ho, K., and McDougall, S.: Debris-Flow Risk Assessment, in: Advances in Debris-flow Science and Practice, 433–493, Springer International Publishing, Cham, https://doi.org/10.1007/978-3-031-48691-3_14, 2024.
Taig, T., Massey, C., and Webb, T.: Principles and criteria for the assessment of risk from slope instability in the Port Hills, Christchurch, GNS Science Consultancy Report 2011/319, 2012.
Walker, B., Davies, W., and Wilson, G.: Practice note guidelines for landslide risk management, Aust. Geomech, 42, 64–109, 2007.
Welsh, A. and Davies, T.: Identification of alluvial fans susceptible to debris-flow hazards, Landslides, 8, 183–194, 2011.
Wilford, D., Sakals, M., Innes, J., Sidle, R. C., and Bergerud, W.: Recognition of debris flow, debris flood and flood hazard through watershed morphometrics, Landslides, 1, 61–66, 2004.
Zubrycky, S., Mitchell, A., McDougall, S., Strouth, A., Clague, J. J., and Menounos, B.: Exploring new methods to analyse spatial impact distributions on debris-flow fans using data from south-western British Columbia, Earth Surf. Proc. Land., 46, 2395–2413, 2021.