the Creative Commons Attribution 4.0 License.
the Creative Commons Attribution 4.0 License.
 | 11 Feb 2025
A quantitative module of avalanche hazard – comparing forecaster assessments of storm and persistent slab avalanche problems with information derived from distributed snowpack simulations
Florian Herla
Pascal Haegeli
Simon Horton
Patrick Mair
Avalanche forecasting is a human judgment process with the goal of describing the nature and severity of avalanche hazard based on the concept of distinct avalanche problems. Snowpack simulations can help improve forecast consistency and quality by extending qualitative frameworks of avalanche hazard with quantitative links between weather, snowpack, and hazard characteristics. Building on existing research on modeling avalanche problem information, we present the first spatial modeling framework for extracting the characteristics of storm and persistent slab avalanche problems from distributed snowpack simulations. The grouping of simulated layers based on regional burial dates allows us to track them across space and time and calculate insightful spatial distributions of avalanche problem characteristics.
We applied our approach to 10 winter seasons in Glacier National Park, Canada, and compared the numerical predictions to human hazard assessments. Despite good agreement in the seasonal summary statistics, the comparison of the daily assessments of avalanche problems revealed considerable differences between the two data sources. The best agreements were found in the presence and absence of storm slab avalanche problems and the likelihood and expected size assessments of persistent slab avalanche problems. Even though we are unable to conclusively determine whether the human or model data set represents reality more accurately when they disagree, our analysis indicates that the current model predictions can add value to the forecasting process by offering an independent perspective. For example, the numerical predictions can provide a valuable tool for assisting avalanche forecasters in the difficult decision to remove persistent slab avalanche problems. The value of the spatial approach is further highlighted by the observation that avalanche danger ratings were better explained by a combination of various percentiles of simulated instability and failure depth than by simple averages or proportions. Our study contributes to a growing body of research that aims to enhance the operational value of snowpack simulations and provides insight into how snowpack simulations can help address some of the operational challenges of human avalanche hazard assessments.
- Article
(2923 KB) - Full-text XML
- BibTeX
- EndNote


Avalanche forecasting is a human judgment process where a wide range of observations is synthesized into an overall picture of the nature and severity of avalanche hazard (LaChapelle, 1980; McClung, 2002a, b). The North American Conceptual Model of Avalanche Hazard (CMAH; Statham et al., 2018a) and similar standards in Europe (EAWS, 2023b) set the foundation for a common language and qualitative framework for assessing avalanche hazard based on the concept of avalanche problems. While multiple problems can be present at any given time or location, each avalanche problem is characterized by a set of descriptors: (1) the avalanche problem type, which represents an overarching classification that sets expectations for typical patterns; (2) the location of the problem in the terrain; (3) the likelihood of avalanches of the identified problem type; and (4) their expected destructive size. Avalanche forecasters then typically synthesize the avalanche problem information into an overall assessment of the severity of avalanche hazard using a five-level ordinal danger scale (Statham et al., 2010; EAWS, 2023a).
Substantial research has recently leveraged data-driven approaches to design decision support tools for avalanche forecasters ranging from predictions of avalanche danger ratings (Pérez-Guillén et al., 2022) to snow instability (Mayer et al., 2022) and avalanche activity (Hendrick et al., 2023; Viallon-Galinier et al., 2023; Mayer et al., 2023). One of the key requirements for employing machine learning methods is the availability of large data sets that include the full range of possible events and, ideally, measurable target variables (Guikema, 2020).
Operational experience and recent research has shown that there are considerable differences in how the avalanche danger rating, the CMAH, and the concept of avalanche problems are applied by avalanche forecasters (Lazar et al., 2016; Statham et al., 2018b; Techel et al., 2018; Clark, 2019; Horton et al., 2020c; Hordowick, 2022). Since these inconsistencies can lead to serious miscommunication among forecasters themselves and with the recreational backcountry community, there is a need for improving the consistency and quality of the operational use of these cornerstones of avalanche hazard assessments. While the use of predictive models is a possible approach for addressing these challenges, training such models on the existing data sets runs the risk of perpetuating biases and inconsistencies that are contained in the human assessments. Horton et al. (2020c) concluded that a more prescriptive approach might be needed to numerically predict avalanche problem characteristics in an objective way.
Snowpack simulations that numerically link weather, snowpack, and hazard have great potential to present avalanche forecasters with an independent and reproducible perspective on the possible characteristics of the expected avalanche problems. Extensive research in snowpack modeling for avalanche forecasting dates back over 2 decades and has led to a variety of operational modeling chains (Morin et al., 2020). While data overload issues and validity concerns have traditionally been the primary hurdles preventing the operational use of snowpack models in Canada (Morin et al., 2020; Herla et al., 2021), several recent studies have focused on making the simulated data more accessible and operationally more relevant by designing visualization tools that better support human sensemaking (Horton et al., 2020b; Nowak et al., 2020; Nowak and Bartram, 2022) and by developing algorithms that process snowpack simulations numerically to display relevant summaries in familiar ways (Herla et al., 2021, 2022). A large body of research provides insights into the validation of snowpack simulations from a variety of different angles (Schirmer et al., 2010; Bellaire and Jamieson, 2013; Schmucki et al., 2014; Magnusson et al., 2015; Vernay et al., 2015; Quéno et al., 2016; Bellaire et al., 2017; Revuelto et al., 2018; Calonne et al., 2020; Menard et al., 2021; Viallon-Galinier et al., 2020; Morin et al., 2020). Recently, Horton and Haegeli (2022) and Herla et al. (2024b) validated the simulations on a large scale for their capabilities of representing both new snow amounts and critical avalanche layers, two of the most important aspects for the practitioner community.
While these studies help forecasters better understand and integrate the simulated snowpack information into their workflows, they do not address the existing challenges in the human analysis process that synthesizes the information into a comprehensive hazard assessment. To address this issue, Reuter et al. (2021) recently established a prescriptive approach for modeling avalanche problem types from simulated snowpack information based on the current understanding of snow instability. In addition, Mayer et al. (2023) developed data-driven models for predicting the probability and size of dry snow avalanches in the vicinity of weather stations used for snow stratigraphy simulations based on verified data sets of natural avalanche activity and stability tests related to human-triggered avalanches. Both of these studies clearly demonstrate the potential of snowpack models for providing avalanche problem information.
The present study expands on these ideas with two main contributions. First, we present a spatial approach to extracting the characteristics of storm and persistent slab avalanche problems from distributed snowpack simulations that traces individual snowpack layers across space and time and allows the calculation of insightful spatial distributions of avalanche problem characteristics. We tailor the output of our numerical predictions to the needs of the North American avalanche community by mirroring concepts included in the CMAH and make the output tangible and relevant by summarizing the simulated information in the familiar format of hazard charts. Second, we examine the agreement between simulations and human assessments for persistent and storm slab avalanche problem situations. We start out with seasonal patterns to compare our results to Reuter et al. (2021) and Mayer et al. (2023), but we primarily focus on the comparison of daily assessments to simultaneously explore the capabilities of the model chain and gain further insight into the strengths and weaknesses of human avalanche hazard assessments. This paper contributes to a growing body of research that aims to enhance the operational value of snowpack simulations and provides insight into how snowpack simulations can help address some of the operational challenges of applying avalanche problems.
The data sets used in this study consist of snowpack simulations and operational avalanche hazard assessments from avalanche forecasters in western Canada over 10 winter seasons (2013–2022), similar to Herla et al. (2024b).
The study focuses on the public avalanche forecast region of Glacier National Park that is located in the Columbia Mountains of British Columbia, Canada. Glacier National Park experiences a transitional snow climate with substantial amounts of new snow interspersed with frequent periods of critical layer formation (Haegeli and McClung, 2007; Shandro and Haegeli, 2018). Numerous snowpack modeling studies have been carried out at Glacier National Park (e.g., Bellaire and Jamieson, 2013; Horton et al., 2020c), which is known for high-quality avalanche hazard assessments and observations.
For our simulations, we feed the Canadian numerical weather prediction model HRDPS (High Resolution Deterministic Prediction System) (2.5 km resolution; Milbrandt et al., 2016) into the detailed snow cover model SNOWPACK (Bartelt et al., 2002; Lehning et al., 2002b, a) to simulate the snow stratigraphy at 100 grid point locations within the boundaries of Glacier National Park. All simulated snow profiles were valid between 16:00–17:00 LT (local time), representing flat field conditions. For a detailed description of the snowpack simulations used for this study, the interested reader is referred to Herla et al. (2024b). Informal conversations with forecasters suggest that the hazard assessments are most supported by observations for the treeline elevation band. Since previous research found most agreement between simulations and assessments also for the treeline elevation band (Herla et al., 2024b), we limit the data set for the present study to grid points between 1800–2100 m a.s.l.
Avalanche hazard assessments used in this study were issued by public avalanche forecasters every day of the winter season. The assessments represent forecasters' best knowledge of the current conditions (i.e., nowcasts) and were issued in the afternoon for the treeline elevation band in Glacier National Park. Applying the CMAH (Statham et al., 2018a), forecasters partition the avalanche hazard into different avalanche problems and characterize each problem by its type, the likelihood of avalanches, and destructive avalanche size resulting from each avalanche problem. Forecasters express the likelihood of avalanches on a five-level ordinal scale ranging from unlikely, possible, likely, and very likely to almost certain with half steps. The expected destructive size of avalanches is also expressed on a five-level ordinal scale ranging from Size 1 to Size 5 with half sizes (Canadian Avalanche Association, 2024; Statham et al., 2018a). It is common practice in Canada to visualize the assessments of different avalanche problems in a hazard chart that allows for quickly understanding the conditions within a specific location (Fig. 1, taken from Statham et al., 2018a). In addition to the avalanche problem information, the hazard assessments contain danger ratings that summarize the hazard from all avalanche problems using the five-level ordinal North American Public Avalanche Danger Scale (Statham et al., 2010), which ranges from low, moderate, considerable, and high to extreme.
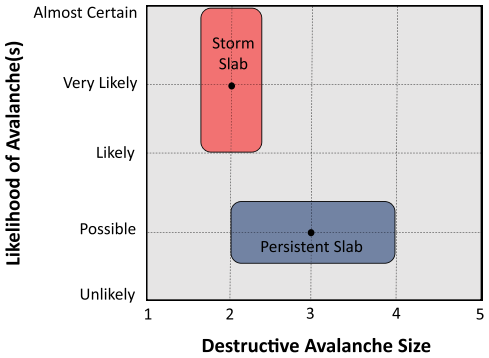
Figure 1The hazard chart as part of the CMAH allows us to quickly understand the severity of distinct avalanche problems. Taken from Statham et al. (2018a).
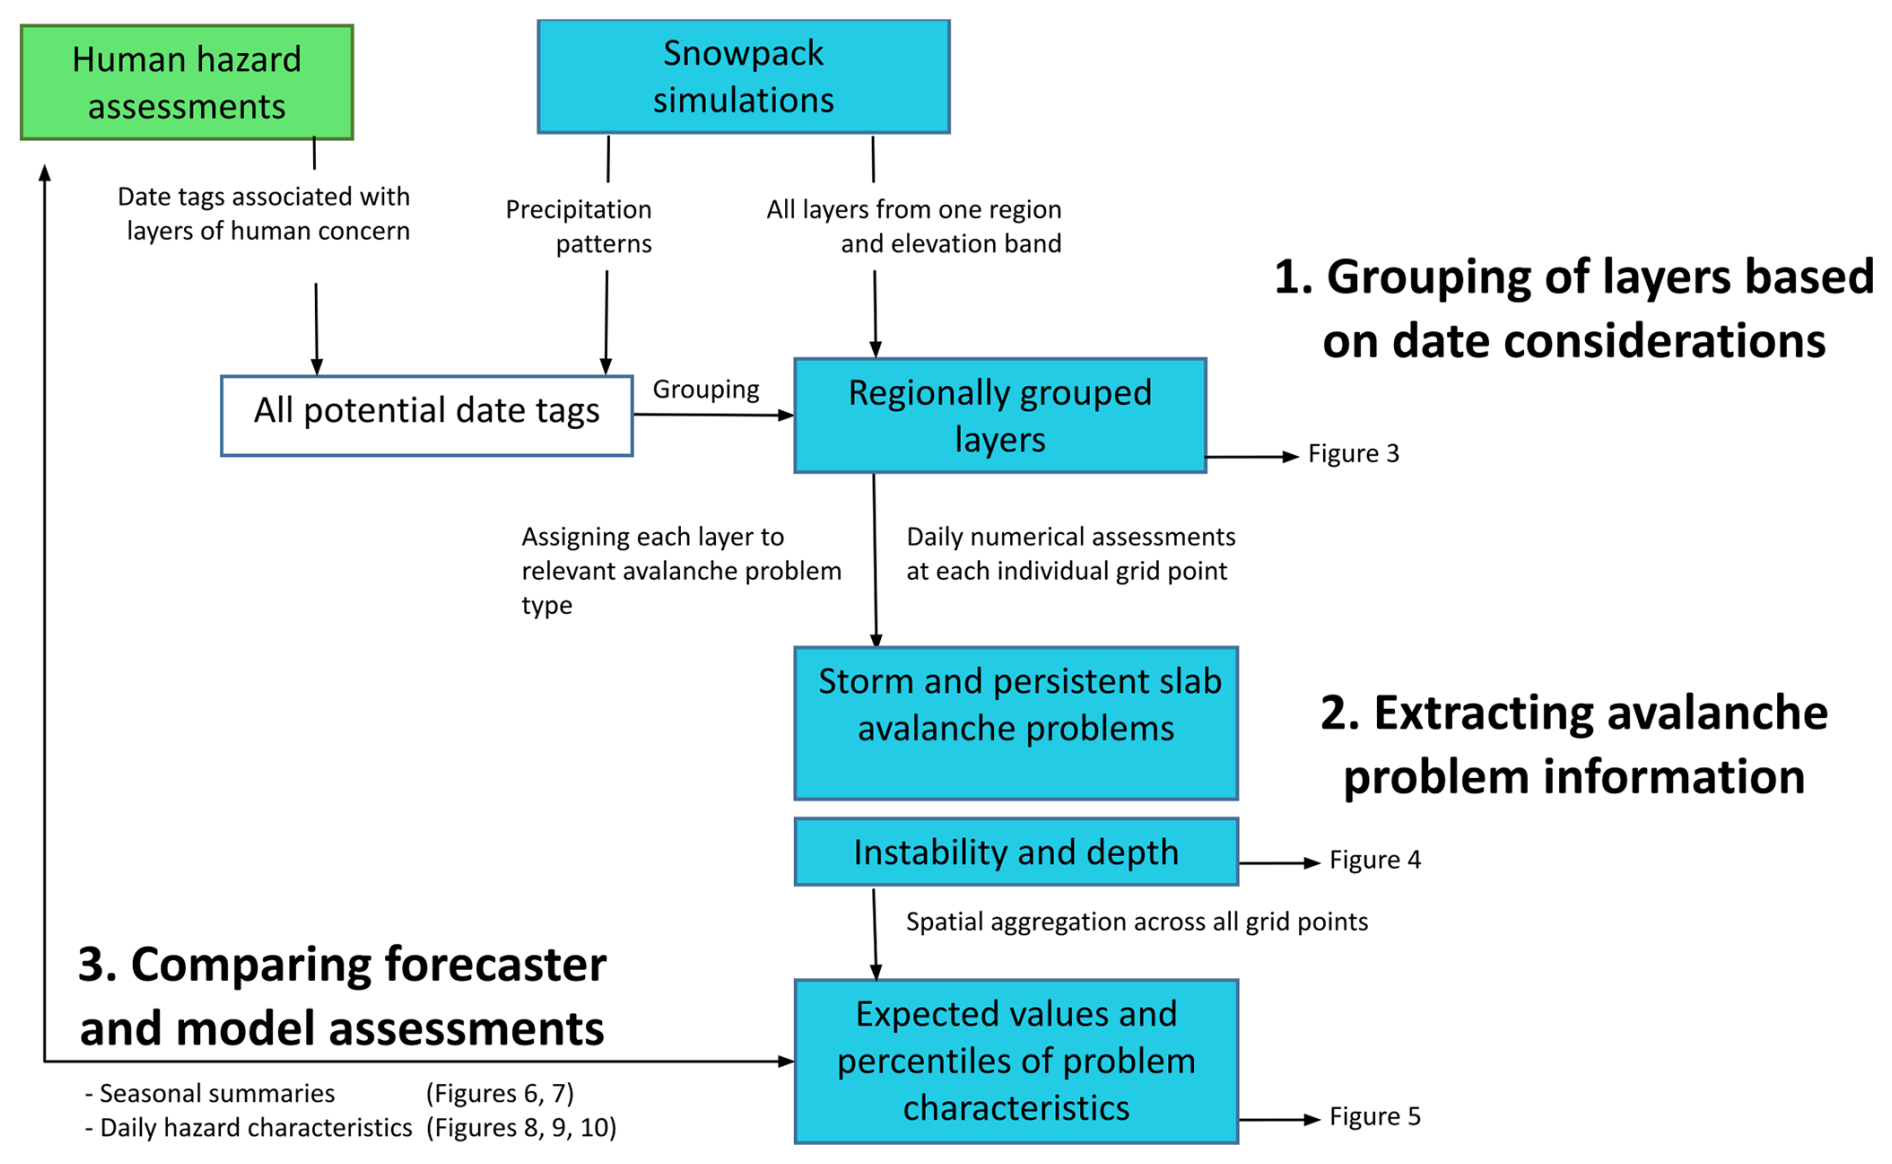
Our entire analysis is conducted in the R language and environment for statistical computing (R Core Team, 2023) using the open-source software package sarp.snowprofile (Horton et al., 2020a) and consists of three distinct steps. First, individual layers from distributed snowpack simulations are grouped based on date considerations in order to track individual layers across time and maintain knowledge about regional layers across space (Sect. 3.1). Second, we extract avalanche problem information from the snowpack simulations (Sect. 3.2). Finally third, we compare the simulated information to the human assessment data (Sect. 3.3). Figure 2 illustrates how these individual steps are related.
3.1 Grouping of layers from distributed simulations based on date considerations
Since persistent weak layers and crusts can cause multiple avalanche cycles, avalanche forecasters typically establish a mental model of where these layers exist and then track the evolution of these layers over time. To facilitate both tracking and communication of these layers, avalanche forecasters in Canada name these layers with date tags and their grain type(s) (e.g., “17 January surface hoar layer”). Reported date tags mostly represent the beginning of snowfall periods that bury layers that were exposed to processes happening at the snow surface before the snowfall and therefore likely contain weak grain types. Sometimes the date tags can also represent rain events that form a crust at the snow surface1.
Since the snowpack builds up chronologically over the winter season, the concept of date tags represents a means to reference specific layers within the snow stratigraphy, similarly to providing the vertical coordinate of a layer (e.g., its depth). However, the referencing of layers based on dates is more robust because the vertical coordinate of a specific layer will vary substantially between different locations (Schweizer et al., 2007; Herla et al., 2021) and over time (due to snowpack settlement).
Herla et al. (2024b) recently applied the concept of layer date tags to group unstable layers from distributed snowpack simulations to determine the spatial prevalence of instability from different layers. In the present study, we apply the concept to our entire data set of layers from one forecast region and elevation band independently of their stability, grain type, or other properties. First, we create a list of all possible date tags for the season based on (a) layers that were explicitly tracked by forecasters and (b) simulated precipitation patterns across the region. Analogously to forecaster practice, each date tag represents a date when the snow surface got buried by new snow. We then label all simulated snowpack layers that got deposited by the same storm and were exposed to the same subsequent dry period with one date tag based on its formation date. Figure 3 illustrates the concept by showing all date tags for the 2019 season and coloring all layers from one profile location according to their date tags. The interested reader is referred to Herla et al. (2024b) for more detailed descriptions of exact rules and thresholds.
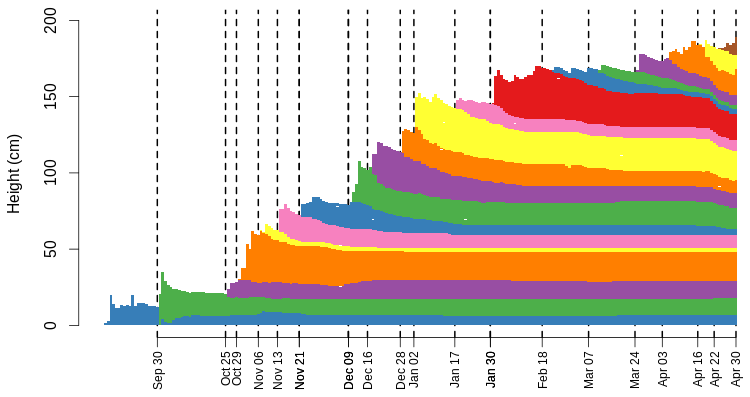
Figure 3The evolution of a snow stratigraphy over the course of a winter season. The succession of storms and dry periods is illustrated by date tags (dashed vertical lines) that can be used to efficiently track layers across space and over time. Adjacent layers of the same color have been assigned to the same date tags.
The present approach is well suited to group the layers of large-scale simulations across space and time in a computationally efficient way. Notably, the approach allows us to take into account stable and unstable layers alike, while traditionally, weak layer detection routines only target unstable layers. We exploit that detail in the next step when extracting avalanche problem information from the individual groups of layers.
3.2 Extracting avalanche problem information from snowpack simulations
To extract the avalanche problem characteristics (i.e., type, location, likelihood of avalanches, and their expected size) from the simulations, we start by selecting all regionally grouped layers from a given location on a given day (Sect. 3.1, Fig. 2). Since our simulations represent flat field conditions and the study domain is limited to one forecast region and elevation band, the location characteristic remains constant throughout this exercise. In a larger-scale application, though, the location would span different regions, elevation bands, and even aspects. In the following paragraphs we describe how we model avalanche problem characteristics for each layer at each model grid point separately before aggregating these individual evaluations by date tags, by problem types, and finally by all grid points within the relevant location.
Our study focuses on storm and persistent slab avalanche problems (including deep persistent slab avalanche problems) because these problem types can be derived solely from simulated snow profiles. Problem types that cause different avalanches (i.e., wet slab, loose dry, loose wet, cornice, and glide avalanche problems) or require additional weather data (i.e., wind slab avalanche problem) are not included in this study. To differentiate between storm and persistent problems, we take into account that forecasters typically issue a storm snow problem for the first few days of the storm, even if a persistent weak layer was buried by the storm and represents the main weakness (Klassen, 2014; Hordowick, 2022). Although our strategy mainly relies on grain type – a persistent layer contributes to a persistent problem, and a new snow layer contributes to a storm problem – we assign all persistent layers that have been buried for less than 5 d to a storm problem instead of a persistent problem.
According to the CMAH, the likelihood of avalanches emerges from a combination of the spatial distribution2 of the avalanche problem within the location bin and the associated sensitivity to triggering avalanches (Statham et al., 2018a). For one isolated model grid point, the likelihood of avalanches simplifies to solely the sensitivity of triggering. To assess the sensitivity of a single layer we use the random forest classifier punstable developed by Mayer et al. (2022) to characterize dry snow instability for artificial triggering. This model was trained with a high-quality data set of observed snow profiles recorded around Davos, Switzerland. Based on the observed instability of the weakest layer in each profile, the model learned to predict the probability of layer instability () from six simulated predictor variables. These predictor variables include both weak layer and slab characteristics, namely the viscous deformation rate, the critical cut length, the sphericity and grain size of the weak layer, the skier penetration depth, and the cohesion of the slab. As suggested by Mayer et al. (2022), we considered layers with punstable≥0.77 as critical avalanche layers with poor stability.
Avalanche size is a function of the lateral and longitudinal extent of the initial slab, release depth, and entrainment along the path (McClung, 2009). While recent research examined the influence of snow mechanical properties like tensile strength and crack propagation speeds on snow instability and avalanche size (e.g., Reuter and Schweizer, 2018; Trottet et al., 2022), there are currently no parametrizations available that can derive avalanche size from large-scale snowpack simulations. We therefore follow the footsteps of McClung (2009) and Mayer et al. (2023) and simply use layer depth to characterize the destructive potential of simulated avalanche problems. Since the ordinal scale for rating avalanche size is nonlinear (Campbell et al., 2016; Statham et al., 2018a) and also the relationship between failure depth and avalanche size has been reported as nonlinear (McClung, 2009; Mayer et al., 2023), we display failure depth on a nonlinear axis in all figures of this study by using thresholds suggested by McClung (2009).
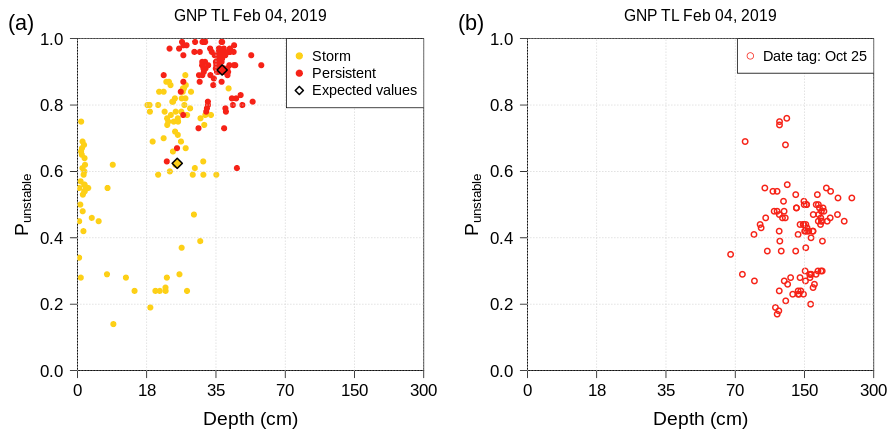
Figure 4Numerical hazard charts derived from snowpack simulations that are similar to the ones produced by forecasters (Fig. 1). As described in the text, the data can be subset by avalanche problem types and date tags such that each data point corresponds to one grid point location showing the weakest instability (punstable) and the relevant failure depth for the given subset. (a) Storm snow and persistent weak layer problems and (b) the subset for a specific date tag (25 October, the green layer close to the ground in Fig. 3).
After computing the characteristic avalanche problem type, likelihood of associated avalanches (approximated by punstable), and avalanche size (approximated by anticipated failure depth) for each layer at each grid point with the approaches described above, we then aggregate the information at each grid point by date tag. Hence, the likelihood of avalanches from each group of layers with a specific date tag is modeled by the layer with the highest punstable value, and the release depth corresponds to either the depth of the identified layer (i.e., stable case) or the deepest unstable layer (i.e., if one or more layers are classified as unstable, with punstable≥0.77). At this point, we know the numerical counterparts for all avalanche problem characteristics for each grid point and each date tag, and we can then apply the same strategy to aggregate this information into a single assessment per avalanche problem type at each grid point. Again, the likelihood of avalanches from each problem type is modeled by the layer with the highest punstable value, and the release depth corresponds to either the depth of the identified layer or the deepest unstable layer (i.e., punstable≥0.77). The derived avalanche problem information from all grid points in the model domain can now be visualized similarly to the hazard charts known from the CMAH. The information characterizes either the contribution from each problem type (Fig. 4a) or the contribution from a subset of layers with a specific date tag (Fig. 4b). Data points that are located close to the upper right corner correspond to deeply buried layers that are expected to be triggered easily. Since every data point corresponds to one grid point, the number of potential triggering spots (i.e., spatial distribution in the CMAH) can be gauged from the distribution of the point cloud on the chart. A detailed discussion of the numerical hazard chart and its feature of selecting specific date tags is presented in Sect. 5.2.
To aggregate avalanche problem characteristics over a spatial domain, we compute medians3 as well as other percentiles4 of punstable and depth across all individual model grid points (i.e., 10th, 25th, 50th, 75th, and 90th percentiles), taking advantage of our regionally grouped layers that preserve knowledge of stable layers in a meaningful way. While all data points contribute to the computation of the expected punstable (50th percentile), only data points with poor stability (i.e., punstable≥0.77q) are considered for the computation of the expected failure depth (50th percentile) and the other percentiles5. Taking into account knowledge about both stable and unstable layers allows us to present the spatial distribution of instability in a more comprehensive way and expands on previous approaches, which focused on unstable layers only and were therefore limited to using the proportion of unstable grid points to summarize spatial information (like, e.g., Herla et al., 2024b; Mayer et al., 2023).
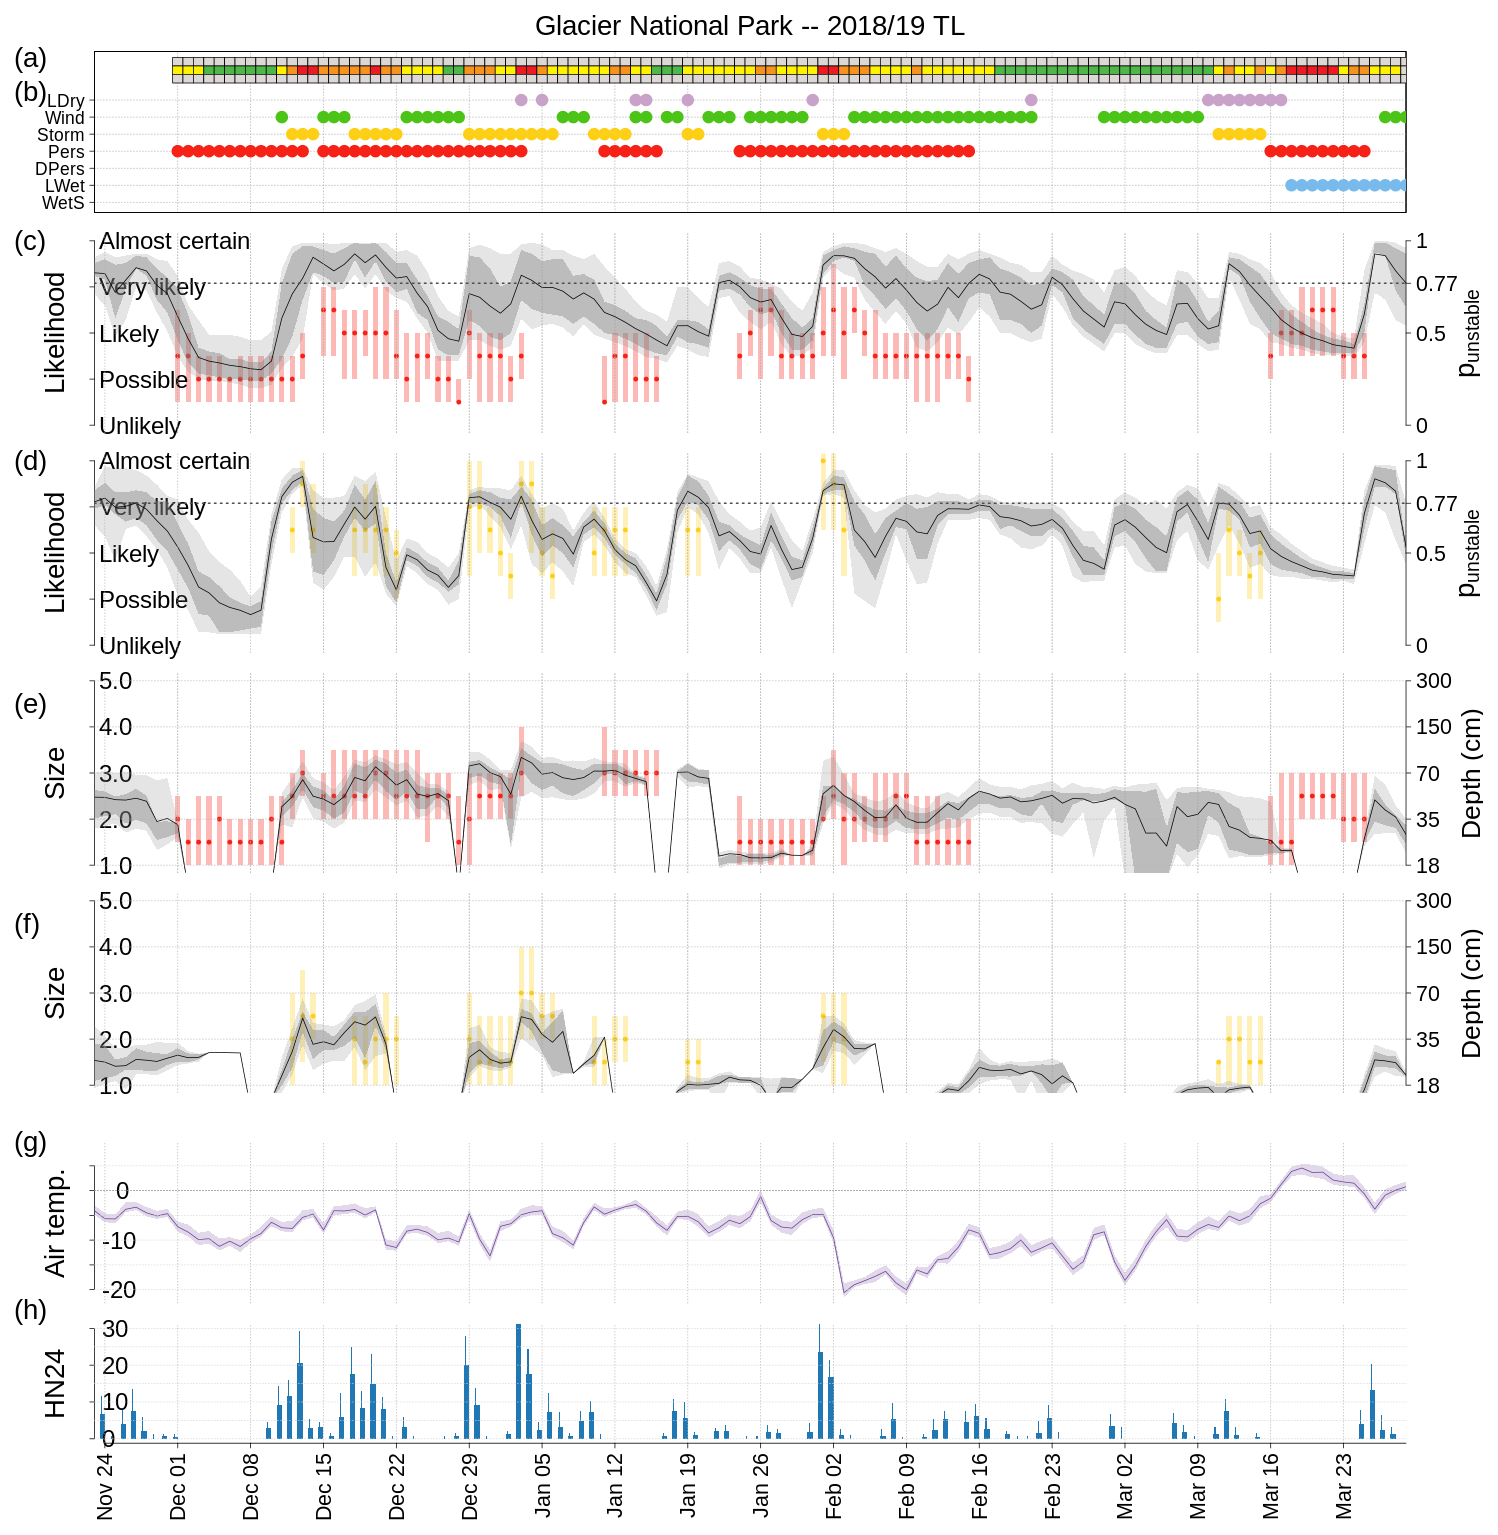
Figure 5Season summary 2018/2019 of human hazard assessments and modeled hazard characteristics for Glacier National Park. (a) Reported danger rating and (b) avalanche problems at treeline elevation. (c, d) Reported likelihood of avalanches from persistent (red) and storm slab avalanche problems (yellow). In addition, modeled distribution of punstable with the envelope of the 10th–90th percentiles (light gray shading), the interquartile range (dark gray shading), and the expected value (black line). (e, f) Analogous to the previous two panels but showing the reported size of avalanches and the modeled failure depth. (g) Modeled interquartile range and median air temperature in units of degrees Celsius. (h) Modeled median height of new snow within 24 h in units of centimeters (HN24).
To sum up, the present study uses concepts from Reuter et al. (2021), Mayer et al. (2022), and Herla et al. (2024b) to extract avalanche problem characteristics from the simulations. Reuter et al. (2021) demonstrated a prescriptive approach to modeling avalanche problem types primarily informed by physical science principles. Prompted by the findings and conclusions of Horton et al. (2020c) about existing inconsistencies in the Canadian hazard assessments, we followed the footsteps of Reuter et al. (2021) and designed a prescriptive model-driven approach instead of a data-driven one. Instead of using the process-based stability indices employed in Reuter et al. (2021), though, we applied the random forest classifier punstable by Mayer et al. (2022), which resulted from a data-driven study using a high-quality data set from Switzerland. We decided to use punstable instead of the even more recent models proposed by Mayer et al. (2023) that predict the probability of natural dry snow avalanche activity and their expected size by modifying punstable in order to build on Herla et al. (2024b), who found encouraging results when applying punstable to a Canadian data set.
3.3 Comparing human assessments to simulations
After extracting and aggregating avalanche problem information from the simulations, this information can be compared to the human avalanche hazard assessment data set. We focused our analysis on the following hazard characteristics: (i) the presence or absence of the problem in either data set with an additional focus on times when the problem was added and removed by forecasters, (ii) trends, and (iii) absolute magnitudes of the likelihood of avalanches and their expected size for each avalanche problem type. We used the expected punstable and the expected failure depth to approximate those characteristics from the simulations (Sect. 3.2). Furthermore, we computed the trends as the strongest trend within a moving 5 d window, where the trend could span a single or multiple days. Finally, (iv) we contrasted the expected punstable and the expected failure depth of both avalanche problem types against the reported danger rating. Since the danger rating synthesizes hazard characteristics from all avalanche problems on a given day, we reduced the data set for this comparison to days when only storm or persistent slab avalanche problems were present but no others. Figure 5 illustrates all hazard characteristics from the two data sets for the 2019 season: the assigned danger rating and days with reported avalanche problems are shown in Fig. 5a and b, respectively; the assessed likelihood of avalanches from persistent and storm slab avalanche problems is contrasted against the distribution of simulated punstable in Fig. 5c and d, respectively; and the reported expected size of avalanches is contrasted against the distribution of the simulated depth in Fig. 5e and f.
To build on previous studies from Reuter et al. (2021) and Mayer et al. (2023), we first examined seasonal patterns between the two data sets before analyzing their daily agreement in more detail. For this, we computed the seasonal frequency of storm and persistent slab avalanche problems with the approach presented by Reuter et al. (2021). Next, we explored the multi-seasonal distribution of punstable and layer depth on the hazard chart stratified by different avalanche danger ratings in a similar way to Mayer et al. (2023). Finally, we explored the daily agreement between simulated and human assessments by computing multi-seasonal distributions of the simulated expected hazard characteristics grouped by forecaster assessments. To examine daily agreement in more detail and make use of the rich information provided by the simulations, we also employed conditional inference trees (CTrees) (Hothorn et al., 2006), a type of classification tree that uses a statistical criterion for finding splits. CTrees recursively partition the distribution of a response variable based on the statistically most significant splits along a set of explanatory variables. While the top node of a CTree represents the most significant split that divides the entire sample, the resulting subsamples are recursively split into smaller subsamples until the algorithm cannot find any significant splits in the response variable anymore. The resulting terminal nodes describe subsets of the data set with distinct distributions of the response variable that can be linked to specific combinations and thresholds of the explanatory variables. For the present analysis, we used the CTree function in the R package “partykit” (Hothorn and Zeileis, 2015). We fitted CTrees for both assessed and modeled hazard characteristics as response variables that used explanatory variables from the other data set. The following lists all variables included in the CTree analysis, first the reported variables from the human assessments:
-
danger rating
-
problem type (i.e., storm and persistent)
-
problem status (i.e., present, absent)
-
expected likelihood of associated avalanches
-
expected size of associated avalanches
-
trend of problem status (i.e., problem got added or removed or status remained constant)
-
trends of expected likelihood and size.
Second are the variables extracted from the simulations:
-
problem type (i.e., storm and persistent)
-
expected punstable of problem type and other percentiles (i.e., 10th, 25th, 50th, 75th, and 90th)
-
proportion of unstable grid points with punstable≥0.77
-
expected depth of problem type and different percentiles (i.e., 10th, 25th, 50th, 75th, and 90th)
-
trends of expected punstable and depth.
4.1 Seasonal patterns
Our 10-year data set contained 1289 d of forecaster assessments that assigned a total of 780 persistent slab avalanche problem days and 572 storm slab avalanche problem days. Using a threshold for the expected punstable≥0.77 to classify a problem as modeled, the simulations identified considerably fewer days with avalanche problems, namely 558 and 328 persistent and storm slab avalanche problem days, respectively. While this offset is evident in all seasons to some degree, the agreement varies between individual seasons (Fig. 6a and b). Overall, the relative frequency between the two avalanche problems is similar between both data sources (Fig. 6c and d). These results are in line with Reuter et al. (2021), whose modeling approach also suggested fewer problems than actually assessed but also found good agreement in the relative frequency of avalanche problems (Fig. 9d–f in Reuter et al., 2021).

Figure 6(a, c) The number of days per season with assessed and modeled persistent weak layer and storm snow problems in Glacier National Park. Solid colors refer to human assessments and hatched colors to model results. (b, d) The relative frequency of assessed and modeled problems. A threshold of the average punstable≥0.77 was used to label a problem as modeled.
Stratifying the predictions of the numerical hazard chart by the assessed danger rating of the day reveals a steady increase in the median expected values of both failure depth and punstable (Fig. 7a–d). While the contour maps and their marginal distributions for different danger ratings overlap, the maps for low and high occupy distinct areas on the chart. The patterns for low and moderate as well as considerable and high show most similarity, particularly since the contour maps are focused on a smaller area for higher danger ratings. The pattern for moderate covers most space on the chart and is therefore most strongly characterized by variability.
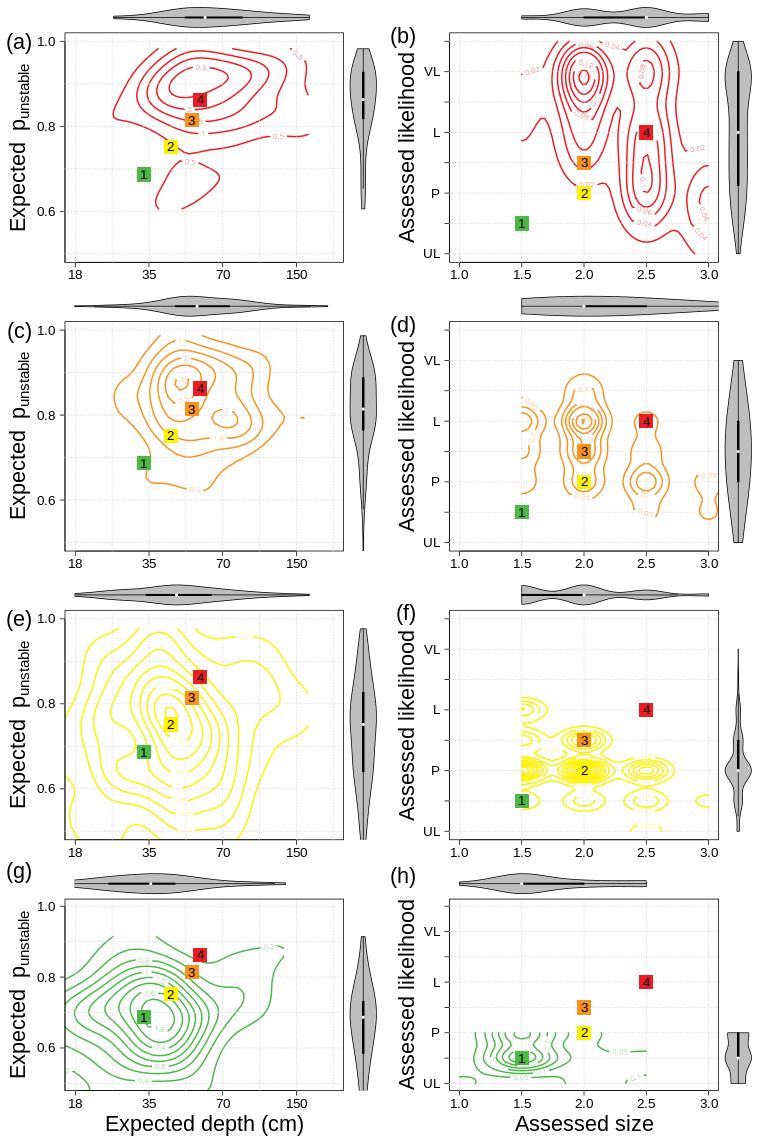
Figure 7(a, c, e, g) Contour maps of the numerical hazard chart and (b, d, f, h) the human assessment hazard chart stratified by different danger ratings from human assessments. The colored square labels highlight the median values of the contour maps and are identical within the left and right columns of the panels. The violins show the marginal distributions of the contours. While the expected punstable and the expected depth represent continuous numbers, the assessed likelihood and size are expressed on five-level ordinal scales with half steps, which causes the contours to appear binned around the grid intersections.
In addition to the expected punstable (i.e., 50th percentile), we explored other variants that describe the distribution of punstable, such as the 90th percentile of punstable or the proportion of unstable grid points (with punstable≥0.77) (Fig. A1). While the general patterns remain similar, this comparison illustrates that not one single descriptor best discriminates between the different danger ratings but that a combination might be required (also see CTree analysis further below). Notably, the 90th percentile of punstable best discriminates between the danger rating low and the others. While it is located close to the threshold of 0.77 for low, it is substantially higher for all other danger ratings.
Comparing the multi-seasonal patterns of the numerical hazard chart against the human assessments reveals similarities and differences. Most importantly, the medians of the assessed likelihood and size of avalanches increase in a similar manner to the numerical predictions of Fig. 7, although they are arranged slightly differently due to the categorical nature of the human assessments. Furthermore, the contour maps and their marginal distributions show a similar degree of overlap for different danger ratings as the simulated counterparts. Again, the extreme cases of the danger rating occupy distinct areas on the chart. However, the patterns of the human assessments for moderate and considerable are most similar, and the variability is larger for considerable and high. Lastly, the visual patterns of the contour maps appear distinctly different between the two data sources. While the numerical contours are circular, the human assessment contours suggest a decreasing trend of the likelihood of avalanches for increasing size. The numerical predictions indeed show similar patterns for single days, particularly for layers assigned to different date tags (Fig. 4), but these patterns smooth out when aggregating avalanche problem types and computing multi-seasonal summaries.
4.2 Daily agreement
While examining the 10 season summaries (like Fig. 5) qualitatively, we initially found more disagreement than agreement. For many individual hazard cycles (i.e., a consecutive period of elevated hazard caused by the development and disappearance of an avalanche problem or the cycle of its characteristics), the majority of hazard characteristics showed substantial differences between the human and simulated assessment data sets. For most cycles, only one or two characteristics, such as either absolute magnitudes or trends of different variables of interest, would agree between the two data sets, while the other characteristics showed divergent patterns. Hazard cycles with higher levels of agreement in the majority of characteristics were rare. However, a more detailed analysis of the time series that took operational considerations into account revealed more valuable insight.
This paragraph highlights several examples from the 2019 season (Fig. 5). The operational forecasting program started on 1 December and instantly reported a persistent weak layer problem. At first sight, this assessment is at odds with the distribution of punstable, which remained at its seasonal minimum for about 1 week. However, the instability was modeled to be high for the entire week before the forecasting program started and relaxed during the first 2 d of operations. The human assessments during that period most likely took a conservative approach and included the problem due to limited data availability at the beginning of the season, but they acknowledged the dormant character of the problem at the same time by publishing danger rating low. Upon loading the persistent layer with several storm cycles between 10 December and 5 January, both data sources agree on the presence of both storm and persistent problems, show comparable trends in hazard characteristics, and suggest a correlation between modeled instability and reported danger rating. A short storm cycle starting on 10 January led to storm and persistent problems in the human assessment data set. However, since no new snow was modeled during that time period, the modeled hazard characteristics deviated from the assessments for several days. Another brief 2 d storm problem starting on 19 January was captured by the instability predictions, and the resulting persistent problem was anticipated by the simulations 2 d earlier than in the assessments. Despite these two problems, the danger rating remained mainly at moderate until the simulated depth of the weakness increased substantially on 1 February, when the danger rating also increased to high. After this short-lived peak of instability, the danger rating, the reported likelihood of avalanches from persistent problems, and punstable decreased in concert. After the initial 2 d of decreasing hazard, the distribution of punstable started to span a wider range, suggesting more variable conditions for triggering. The persistent problem was removed by the forecasters on 15 February, a week after the modeled interquartile range of punstable values had decreased below the threshold of 0.77. In the subsequent weeks, several short and mid-level peaks of modeled instability around the threshold of 0.77 were not reflected in the human assessments. Each of the peaks was caused by little snowfall amounts below daily averages of 10 cm. A final hazard cycle of the season between 16 and 23 March was entirely missed by the simulations. Forecasters issued loose wet avalanche problems, and temperatures rose above the freezing level. Although human assessments reported persistent problems, modeled punstable values remained very low, highlighting that the random forecast classifier was trained for dry snow conditions.
Our qualitative analysis of the seasonal summaries for the other winters revealed the following findings. The modeled instability predictions of persistent problems appear more sensitive to recurrent snow loading than forecaster assessments of the likelihood of avalanches. Particularly subtle day-to-day variations seem to agree better with the reported danger rating than the likelihood of persistent avalanches. Interestingly, the 2017 season contained a case when a heavy prolonged snowfall that lasted for longer than 2 weeks led the modeled instability of persistent layers to decrease considerably, while the instability in storm snow remained high. Not surprisingly, the forecaster assessments listed both problems with peak likelihoods of triggering avalanches, and the danger rating fluctuated between considerable and high. Another notable situation occurred in 2018 when a persistent weak layer problem was dominating the bulletin for 9 weeks and simultaneously kept the modeled instability in persistent layers well above the threshold. We also found several instances when an increase in the range of the distribution of punstable coincided with a decrease in the reported likelihood or danger rating. Although more nuanced, layer-specific information, such as average snow profiles (Herla et al., 2022, 2024b) or date tag subsets (Fig. 4b), was often helpful in better understanding times when persistent problems were added. We also found that the distribution of punstable added value to the process of understanding the different phases of individual hazard cycles for both storm and persistent problems. Visualizations of the season summaries (like Fig. 5) that are not printed in this paper are provided in the code repository (Herla et al., 2024a).
Our quantitative analysis of the multi-seasonal distributions of modeled hazard characteristics using CTrees and direct comparisons supports our qualitative findings. There are distinct differences between storm and persistent slab avalanche problems. The expected punstable discerns better periods of the reported presence and absence of storm problems than persistent problems (Fig. 8a and b). For both problems, the distributions of the expected punstable are shifted to significantly larger values when the problem is present (Wilcoxon rank sum test: P<0.001), but there is considerably more overlap for persistent problems. The addition and removal of storm snow problems are accompanied by mostly increasing and decreasing trends in the expected punstable (Wilcoxon rank sum test: P<0.001; Fig. 8c), respectively. In contrast, the distributions of the absolute expected punstable and the trend of the expected punstable do not show any differences between days when a persistent problem was added or removed (Wilcoxon rank sum test: P=0.5; Fig. 8d). Comparing the distributions of the trend of the expected punstable for different reported trends of the likelihood of avalanches shows no significant patterns for either avalanche problem type (Wilcoxon rank sum test: P>0.17; Fig. 8e and f). Lastly, the absolute values of the expected punstable and the expected failure depth show meaningful patterns given their reported counterparts (Fig. 8g–j), although there is substantial overlap within the grouped distributions. Here, the trends are more apparent for persistent problems and expected depth with each modeled median consistently increasing for each increase in the ordinal assessment variable (notched box plots of Fig. 8h and j; for notches see Chambers et al., 2018, p. 61) (Kendall's τ: 0.16 and 0.17 for Fig. 8g and i and 0.17 and 0.32 for Fig. 8h and j, respectively).
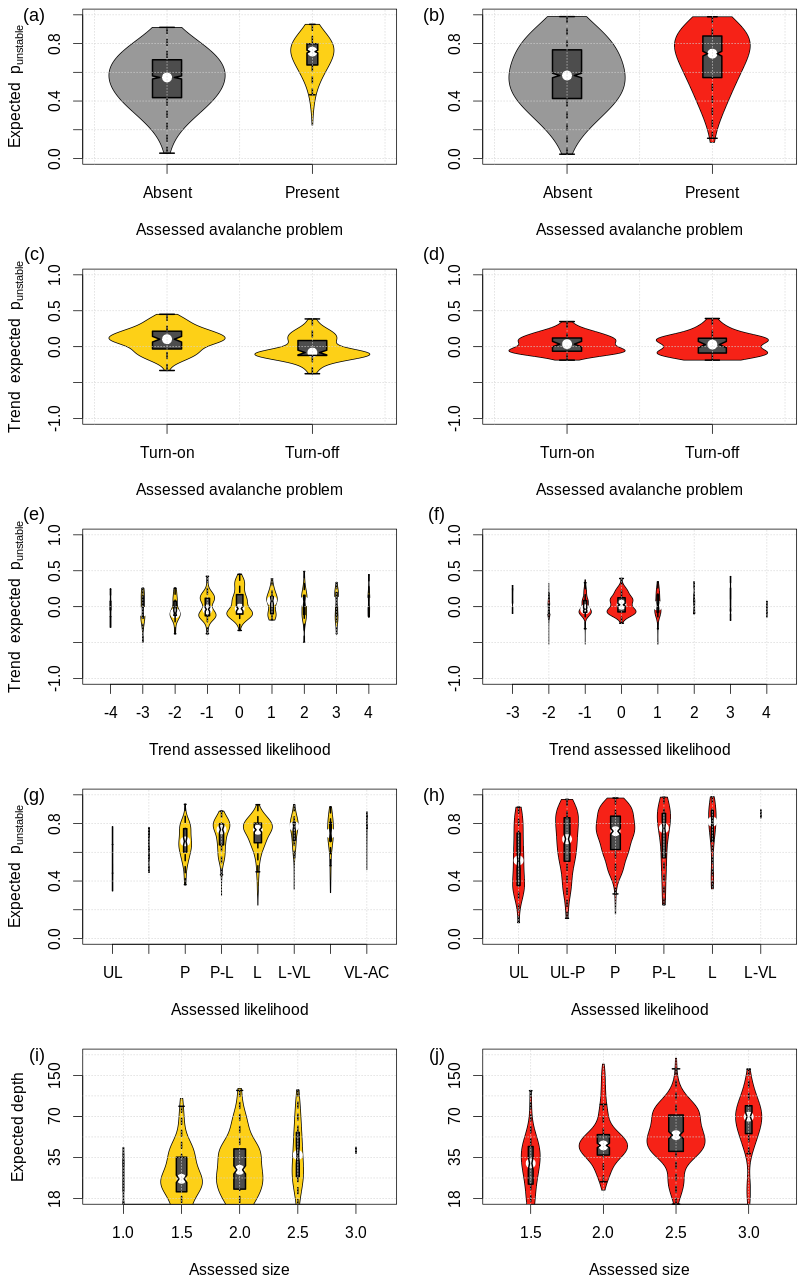
Figure 8Multi-seasonal distributions of numerical hazard characteristics grouped by categorical assessments of human forecasters for (a, c, e, g, i) storm snow problems and (b, d, f, h, j) persistent weak layer problems.
Our CTree analyses of the hazard characteristics that did not show strong trends in their multi-seasonal distributions mainly uncovered inconsistencies between both data sources and did not reveal any additional insightful findings. We therefore limit our description to the CTrees that use the expected punstable and the reported danger rating as response variables. To focus readers' attention and highlight patterns more clearly, we limit the visual representation of the CTrees to a few levels. Deeper splits that showed insightful relations are mentioned in the text only.
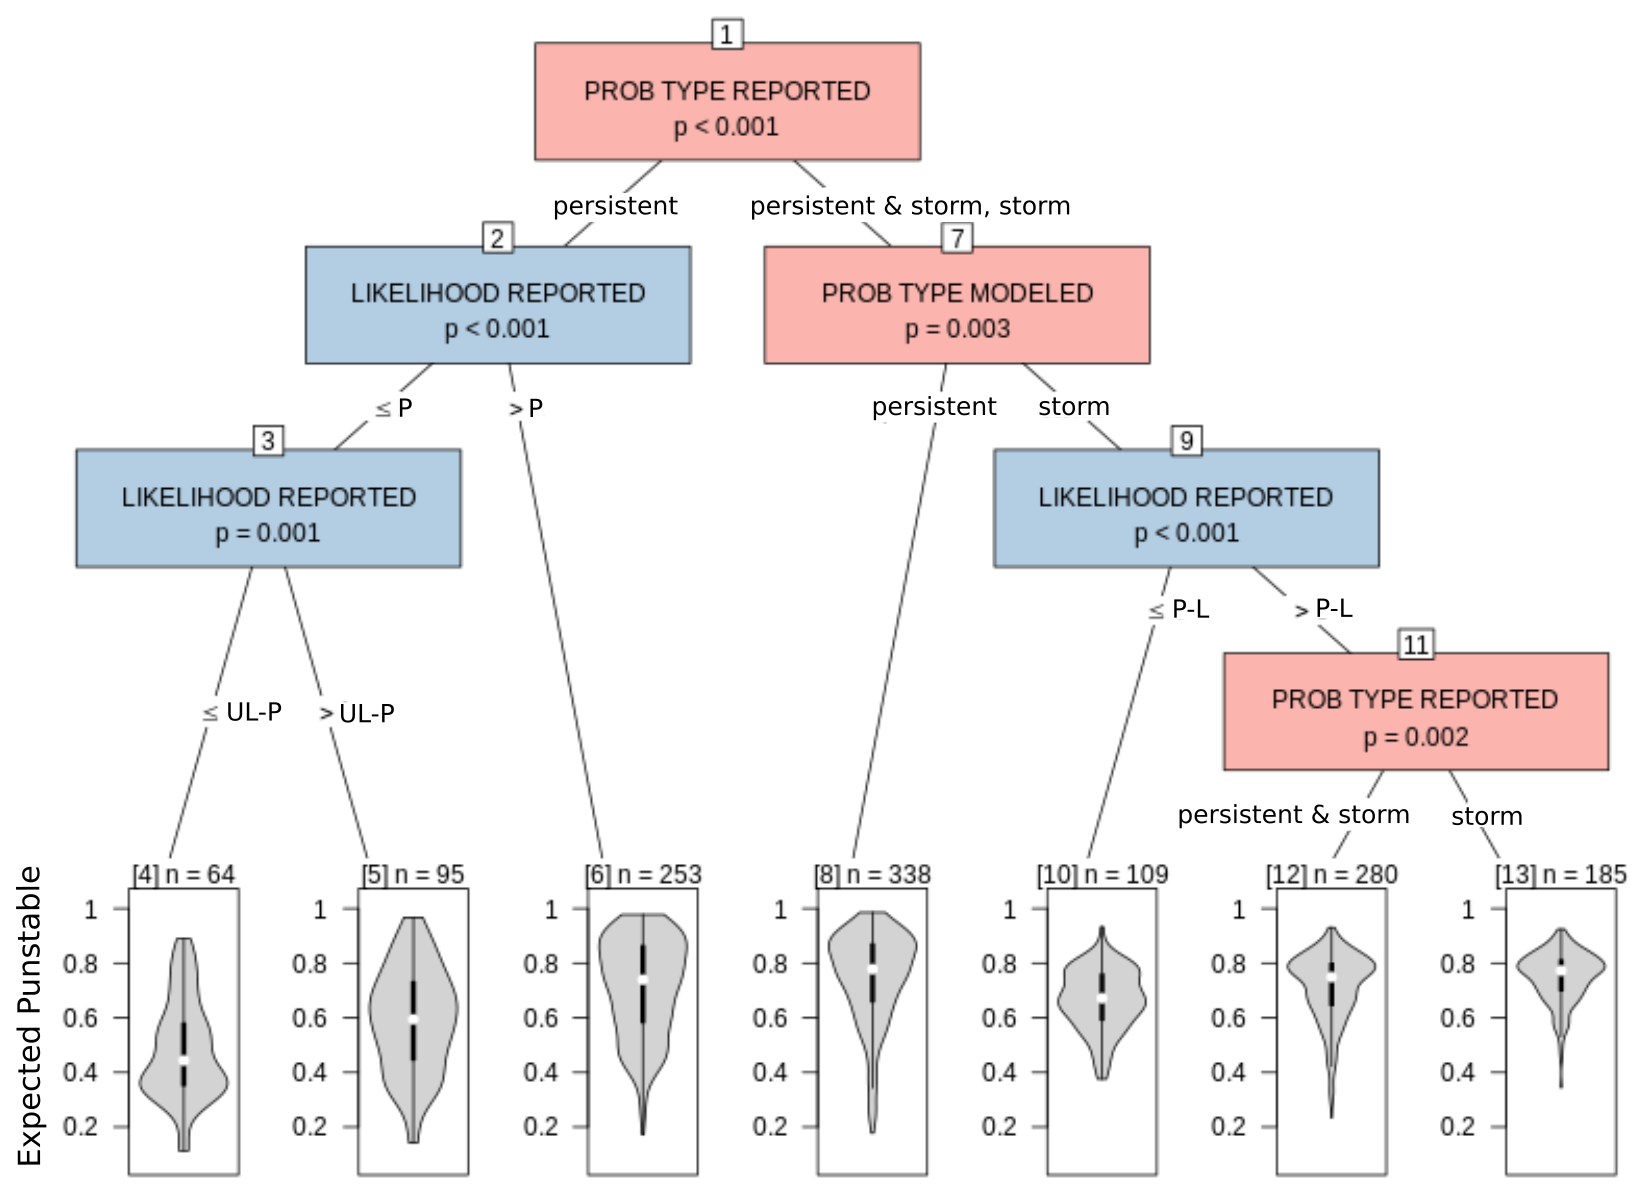
Figure 9CTree for the expected punstable examining the interaction effects of explanatory variables extracted from human assessments.
The CTree for the expected punstable (Fig. 9) highlights a strong interaction between persistent and storm slab avalanche problems (Node 1). The distributions of the expected punstable are shifted towards larger values for increasing the reported likelihood of avalanches if only persistent problems are reported in the assessments (left branch with Nodes 2–6). However, if both problems are reported, the expected punstable of persistent layers (Node 8) is yet significantly larger, independently of the reported likelihood. Storm snow problems are generally associated with smaller values of the expected punstable and are influenced by the reported likelihood more strongly than by the interaction with persistent problems (Nodes 9–13).
The first CTree for the reported danger rating explores its relation to simulated hazard characteristics (Fig. 10a). The most significant splits of the CTree are driven by characteristics that pertain to the likelihood of avalanches (i.e., percentiles of punstable and the proportion of unstable grid points: Nodes 1, 2, and 5), followed by characteristics that pertain to avalanche size (i.e., percentiles of layer depths: Nodes 6 and 9). While the 90th percentile of punstable discerns low-hazard situations (Nodes 1–4), it is the proportion of unstable grid points (with punstable≥0.77) that initiates the splits for higher-hazard situations (Node 5). This nicely illustrates that hazard is driven by the weakest instabilities combined with the spatial distribution of instability, but not by stability, which would be expressed by the more stable part of the distribution (i.e., lower percentiles of punstable). At this point, the depth of the layers becomes important. The 90th percentile of expected failure depth explains the hazard when less than 55 % of grid points are unstable. For depths less than 30 cm the hazard is significantly lower than for situations when avalanches could potentially release deeper (Nodes 7–8). However, if the majority of grid points are unstable, the 10th percentile of expected failure depth identifies the highest-hazard situations (Node 9). If avalanches are expected to release at at least 35 cm deep, the hazard is almost exclusively rated as considerable or high (Node 11). Deeper splits show that the hazard rating generally tends to be higher for storm snow problems than for persistent problems (not shown but discussed in detail in Sect. 5.1).
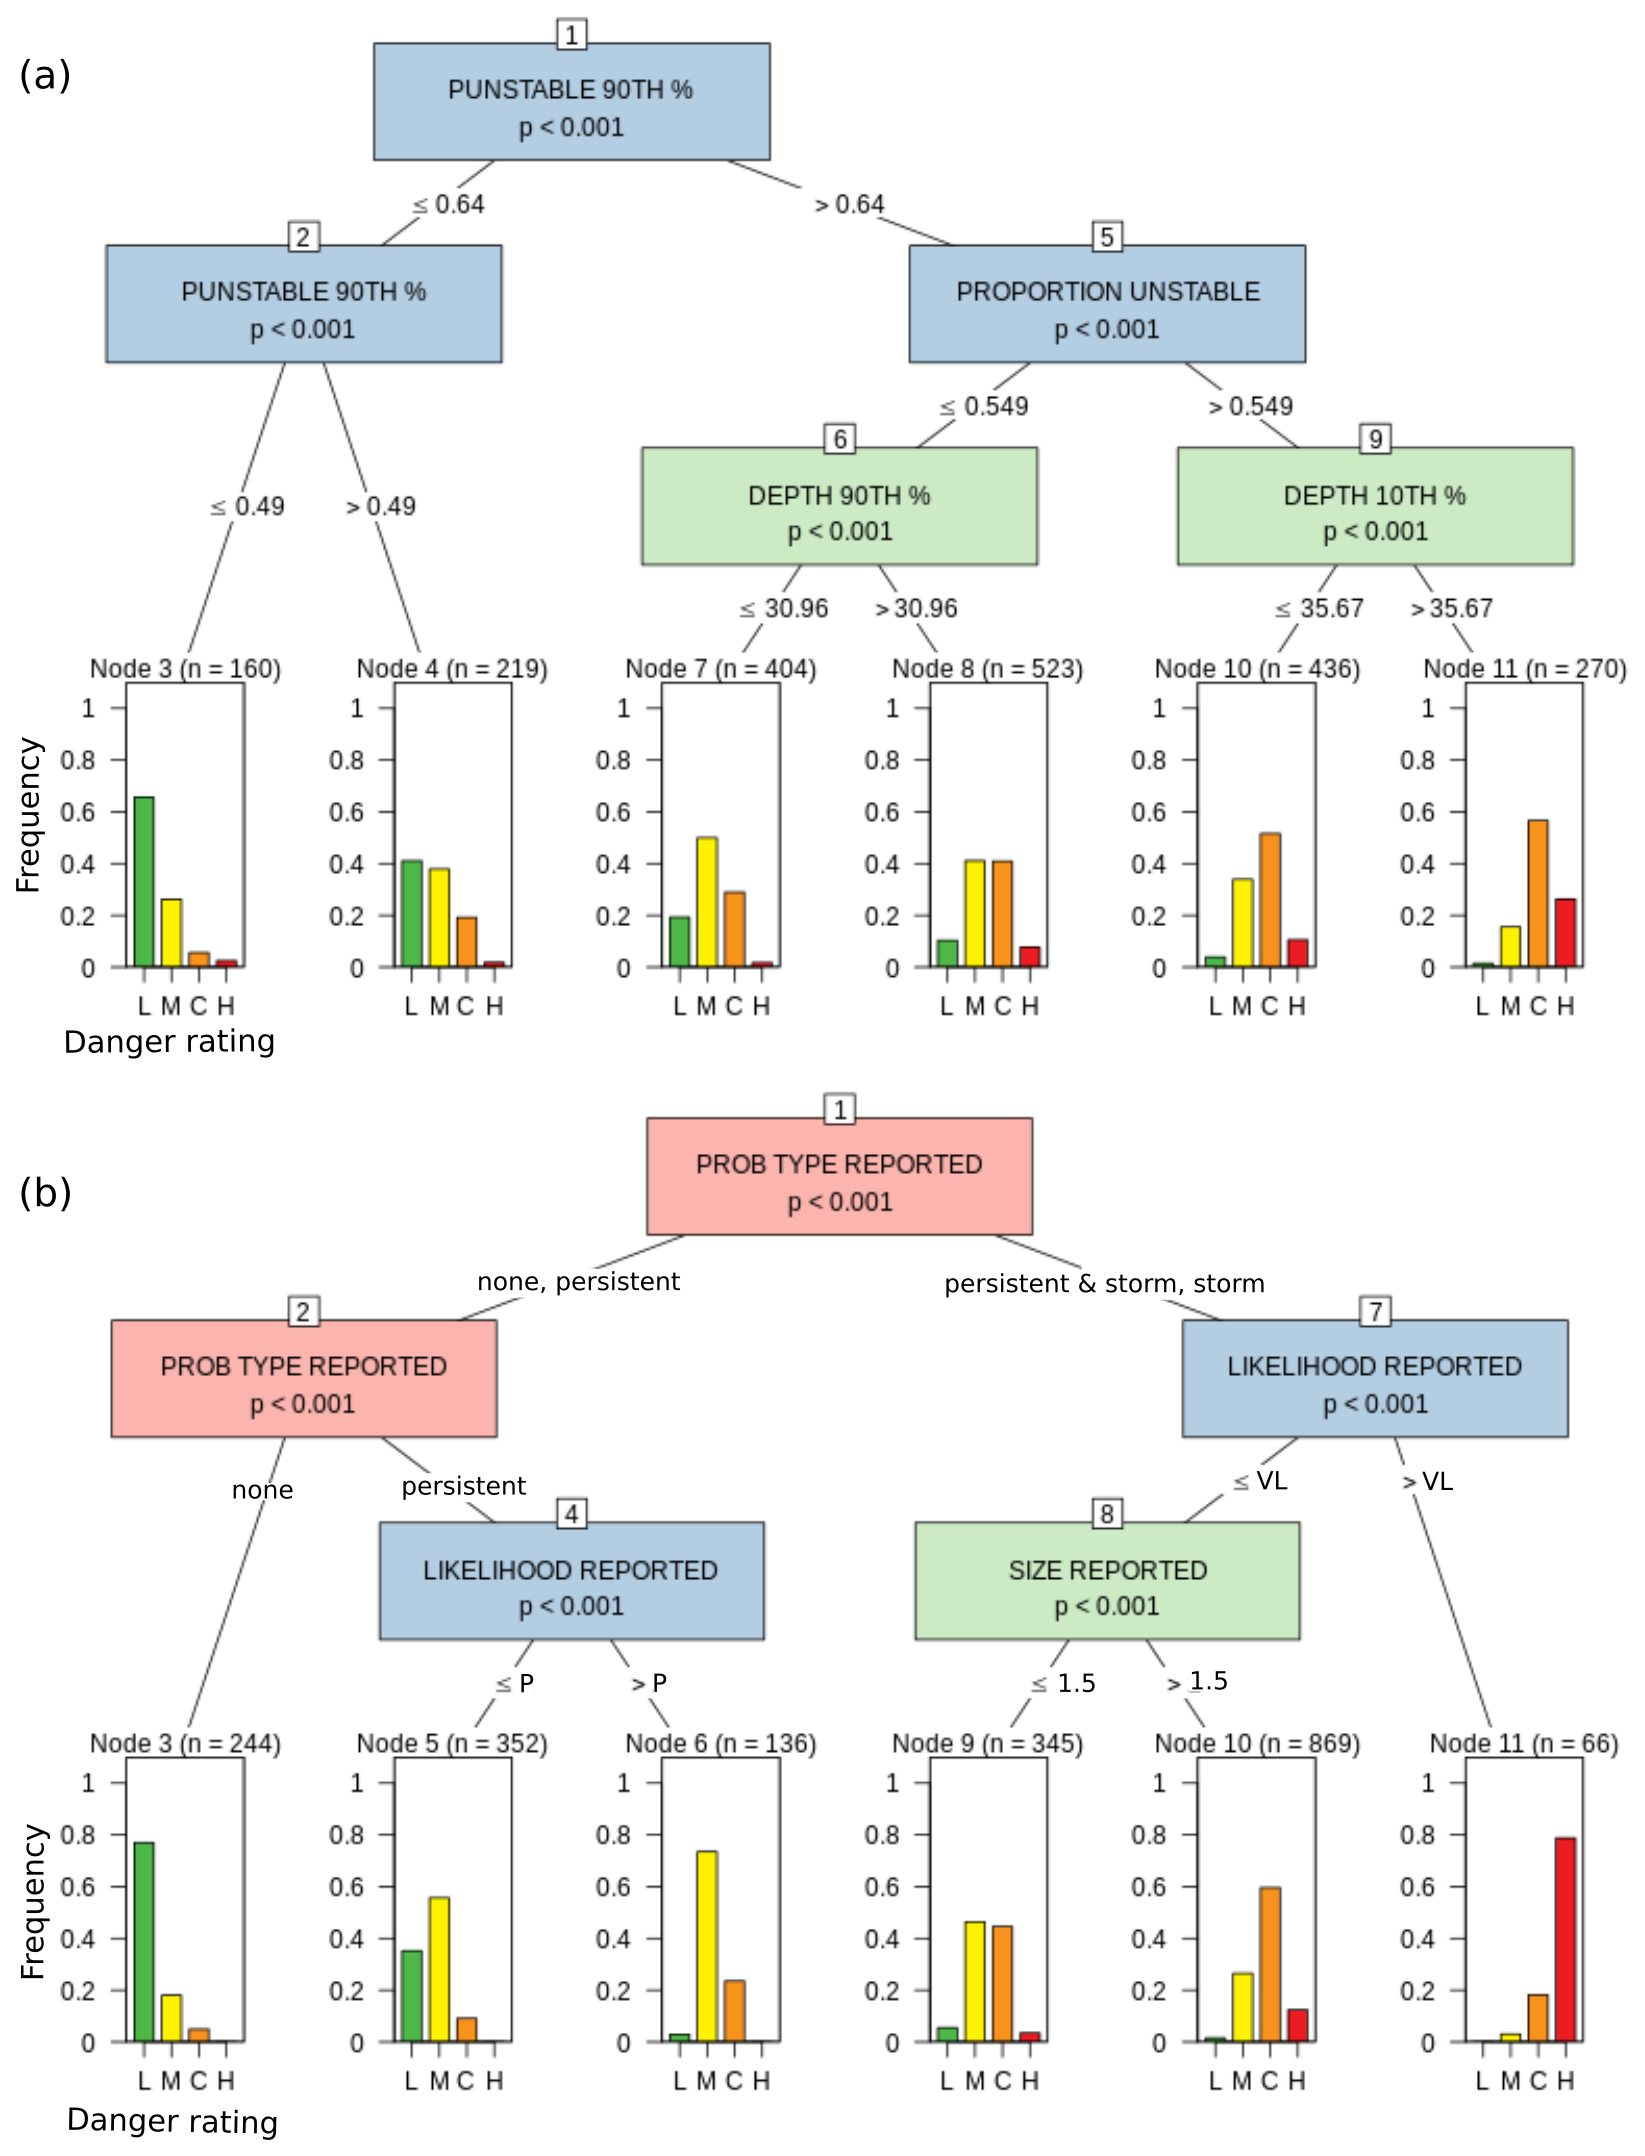
Figure 10CTrees for the reported danger rating examining the explanatory performance of (a) modeled hazard characteristics and (b) human hazard assessments.
We recomputed the CTree for the reported danger rating by using explanatory variables from the human assessments (instead of the simulations) to illustrate similarities and differences between the two data sources (Fig. 10b). In contrast to the previous CTree with the simulated predictors, the most significant split is driven by the presence and absence of avalanche problems (Nodes 1–2). As expected, the hazard is mostly low when no problem is present (Node 3). A sole persistent slab avalanche problem increases the hazard to mostly moderate, while the reported likelihood of avalanches affects the hazard level (Nodes 5–6). In situations with only a storm snow problem or both problems being present, the likelihood of avalanches being at “almost certain” discerns most days with high hazard (Nodes 7, 11). Only at a third level does the expected size of avalanches shift the hazard between moderate and considerable (Nodes 8–10). Despite the substantial importance of the presence and absence of avalanche problems in this CTree, both CTree analyses for the reported danger rating suggest that the reported likelihood of avalanches is slightly more influential than their expected size. Furthermore, both CTrees suggest meaningful combinations and thresholds of explanatory variables, while the CTree using human assessment predictors is characterized by slightly less variability than the CTree using numerical hazard characteristics (mean relative frequency of the modes of the terminal nodes equals 0.66 versus 0.51, respectively).
The following discussion is structured around the two overarching research objectives. We first discuss the insights and implications from our comparison between simulations and human assessments before reviewing the benefits of the proposed spatial modeling framework and reflecting on the limitations. All sections speak to snowpack modelers and avalanche forecasters alike.
5.1 Insights from the comparison between simulations and human assessments
Reuter et al. (2021) use different process-based indices for natural versus artificial triggering and dry versus wet slab avalanches, whereas Mayer et al. (2023) and Hendrick et al. (2023) derived data-driven models for natural dry slab avalanche and natural wet slab avalanche activity, respectively. Our study only uses one stability index, punstable as developed by Mayer et al. (2022), to characterize dry snow instability in the context of artificial triggering. Although this decision limits the scope of the present study conceptually, comparisons with the patterns found by Reuter et al. (2021) and Mayer et al. (2023) show very encouraging similarities. Reuter et al. (2021) focused their model validation on a well-documented case of critical snow instability over the course of 10 d as well as on seasonal comparisons against avalanche observations and hazard assessments in Switzerland and Canada spanning multiple years. Although the approaches of characterizing snow instability differ between Reuter et al. (2021) and the present study, seasonal comparisons of modeled storm and persistent slab avalanche problem days against hazard assessments from Glacier National Park, Canada, show very similar patterns (Sect. 4.1 and Fig. 6 of this study; Fig. 9d–f in Reuter et al., 2021). Both modeling approaches suggest fewer avalanche problem days than were actually issued but agree with the human assessments on the relative frequency of the different problem types. This is in line with direct comparisons between punstable and a combination of process-based instability indices conducted by Herla et al. (2024b), who found similar performances in the characterization of weak layers.
Mayer et al. (2023) nicely illustrate how their data-driven models for predicting the probability of natural dry slab avalanche activity and their expected size can be used to simulate avalanche problem characteristics. While they did not distinguish between different avalanche problem types, they used the hazard chart of the CMAH (Statham et al., 2018a) to demonstrate that their model predictions are in line with multi-seasonal patterns of verified danger ratings from 21 years (Fig. 10 in Mayer et al., 2023). A comparison with Fig. 7a, c, e, and g of our study shows very similar patterns. In both studies, the contours of the joint distribution of likelihood and size (or expected punstable and layer depth) migrate nicely from the lower left to the upper right corner with increasing danger ratings, and the medians show clear and comparable trends. While the contours show a considerable amount of spread for all danger rating levels, the Canadian data set tends to show more overlap than the Swiss one, which is likely caused by the fact that Canadian danger ratings are of lower quality since they represent operational nowcasts compared to the verified reanalysis ratings in the Swiss data set (Mayer et al., 2023). Interestingly though, the Swiss data set shows the biggest spread for considerable, whereas the Canadian data set has it for moderate. Despite the agreement on general patterns, a detailed comparison of the absolute values along the likelihood axis of the contour plots reveals some differences. Since Mayer et al. (2023) derived the likelihood characteristic from the probability of more than 50 % of grid points being unstable, their numerical predictions span the entire range within [0, 1]. Our likelihood estimates, on the other hand, are limited to a much smaller effective range, since we use the punstable output of the random forecast classifier. However, this discrepancy can easily be accounted for by shifting the base line of the hazard chart. Lastly, our median predictions of expected failure depth are slightly larger than those reported by Mayer et al. (2023) for danger ratings low to considerable and smaller for high, which we attribute to differences in model setup (weather-model-driven versus weather-station-driven) and the underlying hazard assessment approaches.
Although the seasonal and multi-seasonal comparisons of simulated and reported avalanche problem characteristics presented in this and other studies (Reuter et al., 2021; Mayer et al., 2023) show encouraging agreement, our in-depth comparison of their temporal evolution shows very variable agreement. There are only a very few days when most hazard characteristics from both data sources agree, but most hazard cycles show some degree of agreement in select characteristics, although these characteristics vary between different cycles. Taking operational considerations into account helped explain the observed differences at times. This general finding is in line with the results of Herla et al. (2024b), who validated snowpack simulations for their capabilities to capture critical layers of operational concern. While they found reasonable patterns overall, the agreement in their seasonal validation was substantially higher than in the validation using daily observations. Our analysis also showed that the simulated characteristics of storm problems seem better suited to determine their presence and absence, while the numerical characteristics of persistent problems could better inform the likelihood and size of persistent slab avalanches.
While the human avalanche hazard assessments used in this research aim to accurately represent the current conditions based on the available information and snow science considerations, they are ultimately subjective judgments for the purpose of informing the public about the existing hazard (McClung, 2002a, b; Statham et al., 2018a). As such, they are influenced by several operational considerations, which is different from the simulations that focus purely on physical conditions. For example, forecasters may continue to issue a persistent problem to highlight its lingering character even if they do not expect associated avalanches on the specific day. At other times, forecasters may remove the problem on these low hazard days even if the problem is still present to prevent message fatigue and have a chance to more strongly emphasize the timing of the reawakening of the problem (Hordowick, 2022). For these reasons, it is unrealistic to expect that the numerical predictions align closely with all aspects of the human assessments (Horton et al., 2020c).
Given these differences, our comparison poses the question of which data source represents reality better when they disagree. While model simulations have started to outperform observation networks in related geophysical fields (Lundquist et al., 2019), completely misassessed avalanche forecasts have been rare for a long time (LaChapelle, 1980). Nonetheless, inherent uncertainty in the data sets available to human forecasters and inconsistencies found in the assessments support the notion that high-quality forecasts are rare too (LaChapelle, 1980; Schweizer, 2008). We therefore argue that the model predictions can also add value to situations where the present results show rather variable or even poor agreement, at the very least as independent pieces of information that provoke critical reflection on human assessments.
One of the situations where simulated avalanche problem characteristics could be particularly helpful for forecasters is the removal of persistent slab avalanche problems. Both Horton et al. (2020c) and Hordowick (2022) found that forecasters struggle with the decision to remove persistent slab avalanche problems. We also found evidence of this issue in our analysis where the timing of forecasters' removal of reported persistent problems was often much later and was mostly uncorrelated to the simulated avalanche problem characteristics. Hence, in these difficult-to-assess situations, the simulations might provide valuable information about the instability of the relevant weak layers. Another advantage of the numerical predictions is that they depict the evolution of instability and depth more continuously and at a finer resolution than the coarser, ordinal human assessments. This presents forecasters with a more subtle perspective on the evolution of the hazard characteristics.
Our CTree analysis revealed a strong degree of interaction between storm and persistent slab avalanche problems, which is consistent with the findings of Horton et al. (2020c). Our results show that when there is no reported storm snow avalanche problem, the reported likelihood of persistent slab avalanches increases with increasing punstable (i.e., decreasing stability) as expected. When a storm snow problem was reported on the same day, however, punstable was usually highest and did not correlate with the reported likelihood of the persistent problem anymore. This is supported by our qualitative analysis that found modeled instabilities of persistent layers to be more sensitive to new snow loading than the human assessments would suggest. However, the model perceives concurrent instabilities in the storm snow to be more stable (i.e., lower values of punstable), which is different from forecasters who tend to assign higher likelihoods of avalanches and higher danger ratings to storm slab avalanche problems (Clark, 2019). This suggests that either punstable is better suited for persistent layers (which it was developed for) or forecasters generally overestimate the likelihood of storm slab avalanches relative to persistent slab avalanches. Despite these nuances, overall, punstable seems to characterize the transition from rather stable to rather unstable conditions well. The patterns from the present study are in line with the previously reported threshold of punstable≥0.77 (Mayer et al., 2022) and the logistic regression in Mayer et al. (2023, their Fig. 5b) that highlights a rapidly increasing probability of natural dry slab avalanches for punstable≥0.75–0.85.
Our qualitative and quantitative analyses both suggest that the reported danger rating aligns better with the simulated avalanche problem characteristics than the reported likelihood of avalanches. Comparisons between modeled instability and reported likelihood of avalanches showed a considerable amount of unexplained variability. Nonetheless, the modeled instabilities and layer depths were able to explain the reported danger rating almost as well as the reported hazard characteristics. Although punstable was only trained with snowpack characteristics, the local danger rating was used to filter only for stable and unstable profiles on low and high hazard days, respectively, which may create a subtle correlation. Interestingly, the reported characteristic with the most explanatory power was the presence or absence of avalanche problems and not the likelihood or size of avalanches. We hypothesize that this observation is at least partially due to the nature of the characteristic that represents a more high-level assessment and, as a binary variable (presence/absence), is easier to assess than a five-level ordinal scale. This was originally highlighted by Atkins (2004), the conceptual creator of avalanche problem types, who argued that traditional stability assessments are subject to substantial uncertainties and cannot express all important aspects of the severity of avalanche hazard, even if combined with expected avalanche size.
A notable finding for snowpack modelers is that our CTree analysis suggests that it is better to use detailed distribution information about instability and layer depth to describe avalanche hazard over a spatial domain than just using their average values. More specifically, the combination of the 90th percentile of punstable and the proportion of unstable grid points (with punstable≥0.77) together with the full envelope of the depth distribution (10th to 90th percentiles) was determined by the CTree to explain the hazard best. For instability, this finding can be re-interpreted as “the weakest instabilities paired with the distribution of instability drive hazard”. How stable individual grid points were (i.e., lower percentiles) did not emerge as an important explanatory variable.
5.2 Benefits of the proposed spatial modeling approach
The modeling approach presented in this paper expands on the methods presented by Reuter et al. (2021) and Mayer et al. (2023) by extracting information from distributed simulations in a way that preserves knowledge about layers across space and time. The approach adopts concepts from the practitioner community to make the output of numerical predictions of avalanche problems from large-scale simulations more organized, transparent, and informative for forecasters. By splitting the overall hazard into contributions from different regional layers, the model predictions cater to the existing sensemaking process of forecasters, which will allow them to integrate the simulated information into their mental model more easily.
This approach also makes it easier for forecasters to identify times when the modeled predictions deviate from reality, like when a specific hazard-driving weak layer is missed in the simulations or a non-existing layer is modeled. In these situations, the proposed modeling approach allows forecasters to keep using the simulations as an information source for all other regional layers since they are each assessed separately. This is not supported by other approaches that do not group layers based on date considerations, and it would therefore require a sophisticated data assimilation or model correction scheme to keep using the avalanche problem predictions in an informative way until the influence of the misrepresented layer has vanished.
There are several additional advantages to the proposed approach. Since we are grouping layers by date tags, we are not limited to extracting unstable layers. Instead, we can, for example, extract the most unstable layer at each grid point that belongs to a specific date tag. This allows us to compute the entire distribution of instability associated with each date tag across all grid points, while other approaches are limited to using the proportion of unstable grid points (Herla et al., 2024b; Mayer et al., 2023). Our approach also allows the tracking of layer characteristics during the transitions from instability to stability and can continue to provide information about the distribution of the depth of regional layers once they have become dormant. While the approach of Reuter et al. (2021) also supports this for individual layers at single locations, the grouping by date tags enables the continuous tracking for spatial simulations. Furthermore, the date tag approach is computationally more efficient and can be resourcefully applied to large-scale simulations. Finally, our approach avoids the known limitation of Reuter et al. (2021) that may miss the faceting of already-buried layers.
An additional feature that has not yet been implemented in our avalanche problem assessment is the integration of step-down potential. If an individual layer has become dormant, it does not contribute to the expected failure depth. However, forecasters might be interested in knowing whether the release of a shallower avalanche could trigger the layer. Our approach can help support this feature by identifying times and grid points when and where the triggering of a shallower layer is likely.
5.3 Limitations
While our approach of extracting avalanche problem information from spatial snowpack simulations offers a promising method, and the comparison against human hazard assessments revealed useful insights, our contribution has to be interpreted in light of several limitations. We have already alluded to two of these limitations earlier. First is the potential inconsistencies and biases contained in the human hazard assessments that prevent us from using it as a reliable ground truth during times of disagreement. Hence, our analysis should not be viewed as a complete validation of the simulations. Second, our choice of only focusing on modeled snowpack data and only one stability index limited the analysis of this paper to only storm and persistent slab avalanche problems. While the present analysis can be seen as a proof of concept, further effort is needed to integrate other data sources (e.g., wind fields), other stability indices6, and eventually other problem types into our analysis framework and to compare the predictions to assessments from other forecast regions and snow climates. Lastly, we want to acknowledge the limitations caused by uncertainties in the simulations. The quality of the numerical avalanche hazard characteristics depends heavily on the correct representation of the slab and the formation of the weak layer. Raleigh et al. (2015) and Richter et al. (2020) report that precipitation is the primary source of error for snowpack structure and stability predictions, which was further confirmed by Horton and Haegeli (2022), who examined differences in observed and modeled snow amounts. Combined with our present findings related to the sensitivity of the stability predictions in new snow loading, we can confidently say that the precipitation input is likely the main source of error in the present analysis. The second source of error, the correct formation of the weak layer, is governed by the interplay of several forcing variables combined with the correct timing. Errors in weak layer formation only need to happen during a short time window to negatively affect the stability predictions for several weeks thereafter. The interested reader is referred to Herla et al. (2024b) for a more in-depth discussion about model performances in capturing critical layers of concern.
We presented a spatial approach to extract the characteristics of storm and persistent slab avalanche problems from distributed snowpack simulations by grouping individual layers based on their regional burial dates. Our approach allows for computationally efficient tracking of instabilities across space and time to compute spatial distributions of hazard characteristics that are consistent with existing avalanche forecasting practices. We applied the approach to 10 winter seasons in Glacier National Park, Canada, and compared the numerical predictions to human hazard assessments to quantify seasonal and daily agreement.
Although the seasonal summaries of the numerically predicted avalanche problems showed strong similarities with human hazard assessments and agreed with the results of existing research (Reuter et al., 2021; Mayer et al., 2023), our comparisons of the daily characteristics of the avalanche problems revealed considerable discrepancies. The best agreements were found in the presence and absence of storm slab avalanche problems and in the likelihood and expected size assessments of persistent slab avalanche problems. However, our qualitative examination also suggested the numerical predictions might have a better handle on the removal of persistent slab avalanche problems, a known operational challenge (Hordowick, 2022). Our analyses also revealed that avalanche hazard was better explained by the combination of various percentiles of simulated instability and failure depth than by simple averages or proportions, which highlights the value of having access to the full distribution information. Lastly, the comparison of the two data sources with respect to multiple hazard characteristics led us to build more confidence in the reported danger rating than the reported likelihood of avalanches.
While differences between human assessments and simulated data sets are expected, an important caveat of our study is that it is unclear which of the two data sets represents the truth better. Interestingly, our analyses showed that both data sets have their own strengths and weaknesses and can contribute to a better understanding of the conditions. However, it is beyond the present comparison to explain in detail why the two data sources disagree. To answer this question and properly validate the numerical predictions (particularly the temporal integrity of existing stability indices and their underlying parametrizations), we need scientific-grade data sets of complete avalanche hazard assessments, which is currently not available in Canada. Such a data set could also be used to develop predictive data-driven models. Furthermore, future research should leverage existing data sets on avalanche activity, such as remote detections and manual observations, to better identify times when model simulations align with actual conditions.
To further strengthen avalanche forecasters' familiarity with the strengths and weaknesses of large-scale snowpack simulations, we encourage the use of dashboards that facilitate real-time comparisons between human assessment and model data sets. Understanding their current capabilities requires careful study of context and the consideration of operational practices that differ from the purely physical computations of the simulations. Since assessing some hazard characteristics is easier than others, there is potential for gauging the current value of the simulations and integrating them into the reasoning process accordingly. Even at times when forecasters disagree with the numerical predictions, they can be a valuable independent information source that can trigger critical reflection.
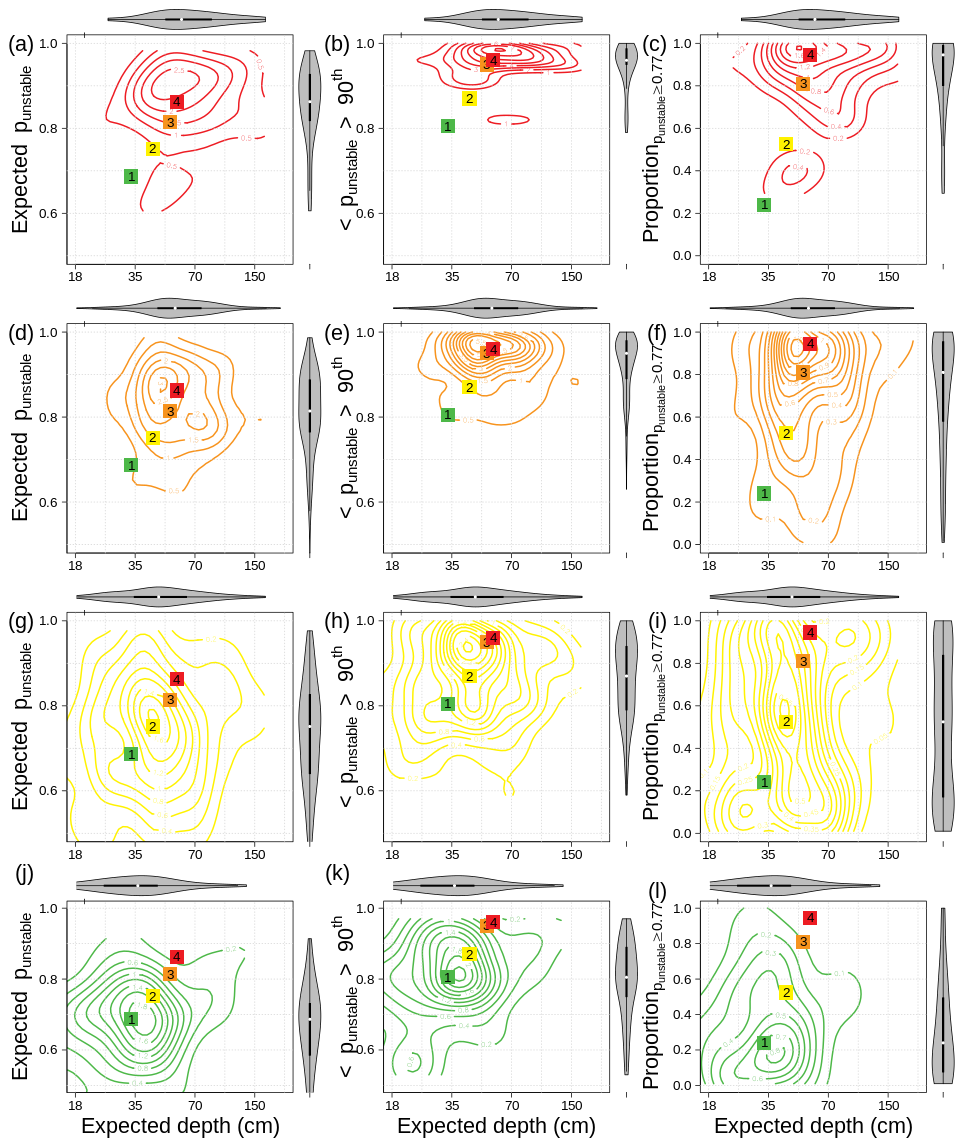
Figure A1Contour maps of the numerical hazard chart, using the expected punstable (i.e., 50th percentile) as in Fig. 7a, c, e, and g (left column); the 90th percentile of punstable (middle column); and the proportion of unstable grid points with punstable≥0.77 (right column). The charts are stratified by their reported danger ratings from human assessments (different rows). The colored square labels highlight the median values of the contour maps and are identical within each column. The violins show the marginal distributions of the contours.
The data and code to reproduce the analysis in this paper are available from a DOI repository at https://doi.org/10.17605/OSF.IO/W7PJY (Herla et al., 2024a).
All authors conceptualized the research. FH ran the snowpack simulations and implemented the methods and analysis. All authors contributed to writing the paper. PH acquired the funding.
At least one of the (co-)authors is a member of the editorial board of Natural Hazards and Earth System Sciences. The peer-review process was guided by an independent editor, and the authors also have no other competing interests to declare.
Publisher's note: Copernicus Publications remains neutral with regard to jurisdictional claims made in the text, published maps, institutional affiliations, or any other geographical representation in this paper. While Copernicus Publications makes every effort to include appropriate place names, the final responsibility lies with the authors.
This article is part of the special issue “Latest developments in snow science and avalanche risk management research – merging theory and practice”. It is a result of the International Snow Science Workshop, Bend, Oregon, USA, 8–13 October 2023.
We thank Ingrid Reiweger for handling the manuscript, as well as Veronika Hatvan and Zachary Miller for reviewing the manuscript and their constructive feedback.
This research has been supported by the Natural Sciences and Engineering Research Council of Canada (grant no. IRC/515532-2016).
This paper was edited by Ingrid Reiweger and reviewed by Zachary Miller and Veronika Hatvan.
Atkins, R.: An avalanche characterization checklist for backcountry travel decisions, in: Proceedings of the 2004 International Snow Science Workshop, 19–24 September 2004, Jackson Hole, WY, USA, 462–468, https://arc.lib.montana.edu/snow-science/item/1118 (last access: 29 January 2025), 2004. a
Bartelt, P., Lehning, M., Bartelt, P., Brown, B., Fierz, C., and Satyawali, P.: A physical SNOWPACK model for the Swiss avalanche warning: Part I: Numerical model, Cold Reg. Sci. Technol., 35, 123–145, https://doi.org/10.1016/s0165-232x(02)00074-5, 2002. a
Bellaire, S. and Jamieson, J. B.: Forecasting the formation of critical snow layers using a coupled snow cover and weather model, Cold Reg. Sci. Technol., 94, 37–44, https://doi.org/10.1016/j.coldregions.2013.06.007, 2013. a, b
Bellaire, S., van erwijnen, A., Mitterer, C., and Schweizer, J.: On forecasting wet-snow avalanche activity using simulated snow cover data, Cold Reg. Sci. Technol., 144, 28–38, https://doi.org/10.1016/j.coldregions.2017.09.013, 2017. a
Calonne, N., Richter, B., Löwe, H., Cetti, C., Ter Schure, J., Van Herwijnen, A., Fierz, C., Jaggi, M., and Schneebeli, M.: The RHOSSA campaign: Multi-resolution monitoring of the seasonal evolution of the structure and mechanical stability of an alpine snowpack, The Cryosphere, 14, 1829–1848, https://doi.org/10.5194/tc-14-1829-2020, 2020. a
Campbell, C., Conger, S., Gould, B., Haegeli, P., Jamieson, J. B., and Statham, G.: Technical Aspects of Snow Avalanche Risk Management–Resources and Guidelines for Avalanche Practitioners in Canada, Revelstoke, BC, Canada, ISBN 978-1-926497-00-6, 2016. a
Canadian Avalanche Association: Observation Guidelines and Recording Standards for Weather, Snowpack, and Avalanches, Tech. rep., Revelstoke, BC, Canada, ISBN 978-1-926497-04-4, https://www.avalancheassociation.ca/page/OGRS-Updates-2024 (last access: 29 January 2025), 2024. a
Chambers, J. M., Cleveland, W. S., Kleiner, B., and Tukey, P. A.: Graphical methods for data analysis, CRC Press, ISBN 9781351080750, https://doi.org/10.1201/9781351072304, 2018. a
Clark, T.: Exploring the link between the Conceptual Model of Avalanche Hazard and the North American Public Avalanche Danger Scale, in: MRM Thesis in Resource and Environmental Management, Simon Fraser University, https://summit.sfu.ca/item/18786 (last access: 29 January 2025), 2019. a, b
Conway, H. and Wilbour, C.: Evolution of snow slope stability during storms1, Cold Reg. Sci. Technol., 30, 67–77, https://doi.org/10.1016/S0165-232X(99)00009-9, 1999. a
EAWS: Standards – Avalanche Danger Scale, https://www.avalanches.org/standards/avalanche-danger-scale/ (last access: 29 January 2025), 2023a. a
EAWS: Standards – Avalanche Problems, https://www.avalanches.org/standards/avalanche-problems/ (last access: 29 January 2025), 2023b. a
Guikema, S.: Artificial Intelligence for Natural Hazards Risk Analysis: Potential, Challenges, and Research Needs, Risk Anal., 40, 1117–1123, https://doi.org/10.1111/risa.13476, 2020. a
Haegeli, P. and McClung, D. M.: Expanding the snow-climate classification with avalanche-relevant information: Initial description of avalanche winter regimes for southwestern Canada, J. Glaciol., 53, 266–276, https://doi.org/10.3189/172756507782202801, 2007. a
Hendrick, M., Techel, F., Volpi, M., Olevski, T., Pérez-Guillén, C., Herwijnen, A. V., and Schweizer, J.: Automated prediction of wet-snow avalanche activity in the Swiss Alps, J. Glaciol., 50, 1–14, https://doi.org/10.1017/jog.2023.24, 2023. a, b, c
Herla, F., Horton, S., Mair, P., and Haegeli, P.: Snow profile alignment and similarity assessment for aggregating, clustering, and evaluating of snowpack model output for avalanche forecasting, Geosci. Model Dev., 14, 239–258, https://doi.org/10.5194/gmd-14-239-2021, 2021. a, b, c
Herla, F., Haegeli, P., and Mair, P.: A data exploration tool for averaging and accessing large data sets of snow stratigraphy profiles useful for avalanche forecasting, The Cryosphere, 16, 3149–3162, https://doi.org/10.5194/tc-16-3149-2022, 2022. a, b
Herla, F., Haegeli, P., Horton, S., and Mair, P.: A quantitative module of avalanche hazard – Data and Code, OSF [code], https://doi.org/10.17605/OSF.IO/W7PJY, 2024a. a, b
Herla, F., Haegeli, P., Horton, S., and Mair, P.: A large-scale validation of snowpack simulations in support of avalanche forecasting focusing on critical layers, Nat. Hazards Earth Syst. Sci., 24, 2727–2756, https://doi.org/10.5194/nhess-24-2727-2024, 2024b. a, b, c, d, e, f, g, h, i, j, k, l, m, n
Hordowick, H.: Understanding avalanche problem assessments: A concept mapping study with public avalanche forecasters, in: MRM Thesis in Resource and Environmental Management, Simon Fraser University, https://summit.sfu.ca/item/34908 (last access: 29 January 2025), 2022. a, b, c, d, e
Horton, S. and Haegeli, P.: Using snow depth observations to provide insight into the quality of snowpack simulations for regional-scale avalanche forecasting, The Cryosphere, 16, 3393–3411, https://doi.org/10.5194/tc-16-3393-2022, 2022. a, b
Horton, S., Herla, F., and Haegeli, P.: An R package for snow profile analysis and visualization, in: Proceedings of the 2020 Virtual Snow Science Workshop VSSW, 4–6 October 2020, Fernie, BC, Canada, https://vssw2020.com/poster-submissions-2/ (last access: 29 January 2025), 2020a. a
Horton, S., Nowak, S., and Haegeli, P.: Enhancing the operational value of snowpack models with visualization design principles, Nat. Hazards Earth Syst. Sci., 20, 1557–1572, https://doi.org/10.5194/nhess-20-1557-2020, 2020b. a
Horton, S., Towell, M., and Haegeli, P.: Examining the operational use of avalanche problems with decision trees and model-generated weather and snowpack variables, Nat. Hazards Earth Syst. Sci., 20, 3551–3576, https://doi.org/10.5194/nhess-20-3551-2020, 2020c. a, b, c, d, e, f, g
Hothorn, T. and Zeileis, A.: Partykit: A modular toolkit for recursive partytioning in R, J. Mach. Learn. Res., 16, 3905–3909, 2015. a
Hothorn, T., Hornik, K., and Zeileis, A.: Unbiased recursive partitioning: A conditional inference framework, J. Comput. Graph. Stat., 15, 651–674, https://doi.org/10.1198/106186006X133933, 2006. a
Klassen, K.: What's the problem? A primer on defining avalanche character, Avalanche J., 105, 10–12, 2014. a
LaChapelle, E. R.: The fundamental processes in conventional avalanche forecasting, J. Glaciol., 26, 75–84, https://doi.org/10.3189/s0022143000010601, 1980. a, b, c
Lazar, B., Trautman, S., Cooperstein, M., Greene, E., and Birkeland, K. W.: North American Avalanche Danger Scale: Do Backcountry Forecasters Apply It Consistently?, in: Proceedings of the 2016 International Snow Science Workshop, Breckenridge, CO, USA, 3–7 October 2016, 457–465, https://arc.lib.montana.edu/snow-science/item/2307 (last access: 29 January 2025), 2016. a
Lehning, M., Bartelt, P., Brown, B., and Fierz, C.: A physical SNOWPACK model for the Swiss avalanche warning Part III: Meteorological forcing, thin layer formation and evaluation, Cold Reg. Sci. Technol., 35, 169–184, https://doi.org/10.1016/S0165-232X(02)00072-1, 2002a. a
Lehning, M., Bartelt, P., Brown, B., Fierz, C., and Satyawali, P.: A physical SNOWPACK model for the Swiss avalanche warning Part II. Snow microstructure, Cold Reg. Sci. Technol., 35, 147–167, https://doi.org/10.1016/S0165-232X(02)00073-3, 2002b. a
Lundquist, J., Hughes, M., Gutmann, E., and Kapnick, S.: Our skill in modeling mountain rain and snow is bypassing the skill of our observational networks, B. Am. Meteorol. Soc., 100, 2473–2490, https://doi.org/10.1175/BAMS-D-19-0001.1, 2019. a
Magnusson, J., Wever, N., Essery, R., Helbig, N., Winstral, A., and Jonas, T.: Evaluating snow models with varying process representations for hydrological applications, Water Resources Res., 51, 2707–2723, https://doi.org/10.1002/2014WR016498, 2015. a
Mayer, S., van Herwijnen, A., Techel, F., and Schweizer, J.: A random forest model to assess snow instability from simulated snow stratigraphy, The Cryosphere, 16, 4593–4615, https://doi.org/10.5194/tc-16-4593-2022, 2022. a, b, c, d, e, f, g
Mayer, S., Techel, F., Schweizer, J., and Van Herwijnen, A.: Prediction of natural dry-snow avalanche activity using physics-based snowpack simulations, Nat. Hazards Earth Syst. Sci., 23, 3445–3465, https://doi.org/10.5194/nhess-23-3445-2023, 2023. a, b, c, d, e, f, g, h, i, j, k, l, m, n, o, p, q, r, s, t, u
McClung, D. M.: The Elements of Applied Avalanche Forecasting, Part I: The Human Issues, Nat. Hazards, 26, 111–129, https://doi.org/10.1023/a:1015665432221, 2002a. a, b
McClung, D. M.: The Elements of Applied Avalanche Forecasting, Part II: The Physical Issues and the Rules of Applied Avalanche Forecasting, Nat. Hazards, 26, 131–146, https://doi.org/10.1023/a:1015604600361, 2002b. a, b
McClung, D. M.: Dimensions of dry snow slab avalanches from field measurements, J. Geophys. Res.-Earth, 114, F01006, https://doi.org/10.1029/2007JF000941, 2009. a, b, c, d
Menard, C. B., Essery, R., Krinner, G., Arduini, G., Bartlett, P., Boone, A., Brutel-Vuilmet, C., Burke, E., Cuntz, M., Dai, Y., Decharme, B., Dutra, E., Fang, X., Fierz, C., Gusev, Y., Hagemann, S., Haverd, V., Kim, H., Lafaysse, M., Marke, T., Nasonova, O., Nitta, T., Niwano, M., Pomeroy, J., Schädler, G., Semenov, V. A., Smirnova, T., Strasser, U., Swenson, S., Turkov, D., Wever, N., and Yuan, H.: Scientific and human errors in a snow model intercomparison, B. Am. Meteorol. Soc., 102, E61–E79, https://doi.org/10.1175/BAMS-D-19-0329.1, 2021. a
Milbrandt, J. A., Bélair, S., Faucher, M., Vallée, M., Carrera, M. L., and Glazer, A.: The pan-canadian high resolution (2.5 km) deterministic prediction system, Weather Forecast., 31, 1791–1816, https://doi.org/10.1175/WAF-D-16-0035.1, 2016. a
Mitterer, C., Techel, F., Fierz, C., and Schweizer, J.: An operational supporting tool for assessing wet-snow avalanche danger, in: Proceedings of the International Snow Science Workshop, 7–11 October 2013, Grenoble–Chamonix Mont-Blanc, 334–338, https://arc.lib.montana.edu/snow-science/item/1860 (last access: 29 January 2025), 2013. a
Monti, F., Gaume, J., van Herwijnen, A., and Schweizer, J.: Snow instability evaluation: calculating the skier-induced stress in a multi-layered snowpack, Nat. Hazards Earth Syst. Sci., 16, 775–788, https://doi.org/10.5194/nhess-16-775-2016, 2016. a
Morin, S., Fierz, C., Horton, S., Bavay, M., Dumont, M., Hagenmuller, P., Lafaysse, M., Mitterer, C., Monti, F., Olefs, M., Snook, J. S., Techel, F., Van Herwijnen, A., and Vionnet, V.: Application of physical snowpack models in support of operational avalanche hazard forecasting : A status report on current implementations and prospects for the future, Cold Reg. Sci. Technol., 170, 1098–1107, https://doi.org/10.1016/J.COLDREGIONS.2019.102910, 2020. a, b, c
Nowak, S. and Bartram, L.: I'm Not Sure: Designing for Ambiguity in Visual Analytics, in: Proceedings of Graphics Interface 2022, 16–19 May 2022, Montréal, Quebec, 114–126, https://doi.org/10.20380/GI2022.13, 2022. a
Nowak, S., Bartram, L., and Haegeli, P.: Designing for Ambiguity: Visual Analytics in Avalanche Forecasting, in: Proceedings – 2020 IEEE Visualization Conference, Institute of Electrical and Electronics Engineers Inc., 81–85, ISBN 9781728180144, https://doi.org/10.1109/VIS47514.2020.00023, 2020. a
Pérez-Guillén, C., Techel, F., Hendrick, M., Volpi, M., Van Herwijnen, A., Olevski, T., Obozinski, G., Pérez-Cruz, F., and Schweizer, J.: Data-driven automated predictions of the avalanche danger level for dry-snow conditions in Switzerland, Nat. Hazards Earth Syst. Sci., 22, 2031–2056, https://doi.org/10.5194/nhess-22-2031-2022, 2022. a
Quéno, L., Vionnet, V., Dombrowski-Etchevers, I., Lafaysse, M., Dumont, M., and Karbou, F.: Snowpack modelling in the Pyrenees driven by kilometric-resolution meteorological forecasts, The Cryosphere, 10, 1571–1589, https://doi.org/10.5194/tc-10-1571-2016, 2016. a
Raleigh, M. S., Lundquist, J., and Clark, M. P.: Exploring the impact of forcing error characteristics on physically based snow simulations within a global sensitivity analysis framework, Hydrol. Earth Syst. Sci., 19, 3153–3179, https://doi.org/10.5194/hess-19-3153-2015, 2015. a
R Core Team: R: A Language and Environment for Statistical Computing, https://www.R-project.org/ (last access: 29 January 2025), 2023. a
Reuter, B. and Schweizer, J.: Describing Snow Instability by Failure Initiation, Crack Propagation, and Slab Tensile Support, Geophys. Res. Lett., 45, 7019–7027, https://doi.org/10.1029/2018GL078069, 2018. a
Reuter, B., Viallon-Galinier, L., Horton, S., van Herwijnen, A., Mayer, S., Hagenmuller, P., and Morin, S.: Characterizing snow instability with avalanche problem types derived from snow cover simulations, Cold Reg. Sci. Technol., 194, 103462, https://doi.org/10.1016/j.coldregions.2021.103462, 2021. a, b, c, d, e, f, g, h, i, j, k, l, m, n, o, p, q, r, s, t
Revuelto, J., Lecourt, G., Lafaysse, M., Zin, I., Charrois, L., Vionnet, V., Dumont, M., Rabatel, A., Six, D., Condom, T., Morin, S., Viani, A., and Sirguey, P.: Multi-criteria evaluation of snowpack simulations in complex alpine terrain using satellite and in situ observations, Remote Sens., 10, 1171, https://doi.org/10.3390/rs10081171, 2018. a
Richter, B., Schweizer, J., Rotach, M. W., and Van Herwijnen, A.: Validating modeled critical crack length for crack propagation in the snow cover model SNOWPACK, The Cryosphere, 13, 3353–3366, https://doi.org/10.5194/tc-13-3353-2019, 2019. a
Richter, B., Van Herwijnen, A., Rotach, M. W., and Schweizer, J.: Sensitivity of modeled snow stability data to meteorological input uncertainty, Nat. Hazards Earth Syst. Sci., 20, 2873–2888, https://doi.org/10.5194/nhess-20-2873-2020, 2020. a
Schirmer, M., Schweizer, J., and Lehning, M.: Statistical evaluation of local to regional snowpack stability using simulated snow-cover data, Cold Reg. Sci. Technol., 64, 110–118, https://doi.org/10.1016/j.coldregions.2010.04.012, 2010. a
Schmucki, E., Marty, C., Fierz, C., and Lehning, M.: Evaluation of modelled snow depth and snow water equivalent at three contrasting sites in Switzerland using SNOWPACK simulations driven by different meteorological data input, Cold Reg. Sci. Technol., 99, 27–37, https://doi.org/10.1016/j.coldregions.2013.12.004, 2014. a
Schweizer, J.: On the predictability of snow avalanches, in: Proceedings of the 2008 International Snow Science Workshop, 21–27 September 2008, Whistler, BC, p. 688, https://arc.lib.montana.edu/snow-science/item/115 (last access: 29 January 2025), 2008. a
Schweizer, J., Kronholm, K., Jamieson, J. B., and Birkeland, K. W.: Review of spatial variability of snowpack properties and its importance for avalanche formation, Cold Reg. Sci. Technol., 51, 253–272, https://doi.org/10.1016/j.coldregions.2007.04.009, 2007. a
Shandro, B. and Haegeli, P.: Characterizing the nature and variability of avalanche hazard in western Canada, Nat. Hazards Earth Syst. Sci., 18, 1141–1158, https://doi.org/10.5194/nhess-18-1141-2018, 2018. a
Statham, G., Haegeli, P., Birkeland, K. W., Greene, E., Israelson, C., Tremper, B., Stethem, C., Mcmahon, B., White, B., and Kelly, J.: The North American Public Avalanche Danger Scale, Tech. rep., ISBN 4037621568, https://arc.lib.montana.edu/snow-science/item/353 (last access: 29 January 2025), 2010. a, b
Statham, G., Haegeli, P., Greene, E., Birkeland, K. W., Israelson, C., Tremper, B., Stethem, C., McMahon, B., White, B., and Kelly, J.: A conceptual model of avalanche hazard, Nat. Hazards, 90, 663–691, https://doi.org/10.1007/s11069-017-3070-5, 2018a. a, b, c, d, e, f, g, h, i
Statham, G., Holeczi, S., and Shandro, B.: Consistency and Accuracy of Public Avalanche Forecasts in Western Canada, in: Proceedings of the 2018 International Snow Science Workshop, 7–12 October 2018, Innsbruck, Austria, https://arc.lib.montana.edu/snow-science/item/2806 (last access: 29 January 2025), 2018b. a
Techel, F., Mitterer, C., Ceaglio, E., Coléou, C., Morin, S., Rastelli, F., and Purves, R. S.: Spatial consistency and bias in avalanche forecasts – a case study in the European Alps, Nat. Hazards Earth Syst. Sci., 18, 2697–2716, https://doi.org/10.5194/nhess-18-2697-2018, 2018. a
Trottet, B., Simenhois, R., Bobillier, G., Bergfeld, B., van Herwijnen, A., Jiang, C., and Gaume, J.: Transition from sub-Rayleigh anticrack to supershear crack propagation in snow avalanches, Nat. Phys., 18, 1094–1098, https://doi.org/10.1038/s41567-022-01662-4, 2022. a
Vernay, M., Lafaysse, M., Mérindol, L., Giraud, G., and Morin, S.: Ensemble forecasting of snowpack conditions and avalanche hazard, Cold Reg. Sci. Technol., 120, 251–262, https://doi.org/10.1016/j.coldregions.2015.04.010, 2015. a
Viallon-Galinier, L., Hagenmuller, P., and Lafaysse, M.: Forcing and evaluating detailed snow cover models with stratigraphy observations, Cold Reg. Sci. Technol., 180, 103163, https://doi.org/10.1016/j.coldregions.2020.103163, 2020. a
Viallon-Galinier, L., Hagenmuller, P., and Eckert, N.: Combining modelled snowpack stability with machine learning to predict avalanche activity, The Cryosphere, 17, 2245–2260, https://doi.org/10.5194/tc-17-2245-2023, 2023. a
Please note that other processes leading to crust formation, such as insolation, are not captured by the date tags as presented in this study. In this case, the present approach groups crust layers with other layers based on their burial date.
Please note that the term “spatial distribution” is used slightly differently in North America and Europe. European forecasters primarily use the term “frequency distribution” and only refer to spatial distribution when they know the exact locations in the terrain (e.g., on a map view). Since this paper builds on the CMAH, we use the term spatial distribution throughout this paper.
Note that an expected depth is therefore only computed when there is at least one unstable grid point.
For example, the skier stability index SK38 (Monti et al., 2016) and the critical cut length rc (Richter et al., 2019) (both for artificial triggering of dry slab avalanches), the expected time to failure (Conway and Wilbour, 1999) (for natural dry slab avalanche activity), the liquid water content index (Mitterer et al., 2013), and the random forest classifier by Hendrick et al. (2023) (for wet slab avalanche activity).
- Abstract
- Introduction
- Data
- Methodology
- Results
- Discussion
- Conclusions
- Appendix A: Contour maps based on different variables describing the distribution of punstable
- Code and data availability
- Author contributions
- Competing interests
- Disclaimer
- Special issue statement
- Acknowledgements
- Financial support
- Review statement
- References