the Creative Commons Attribution 4.0 License.
the Creative Commons Attribution 4.0 License.
 | 18 Dec 2025
China's three major cereal crops exposed to compound drought and extreme rainfall events
Hanming Cao
Qiren Yang
Wei Yang
Lin Zhao
Under the backdrop of global climate change, the increasing intensity and frequency of anomaly climate events have led to a rise in compound extreme events. China's large population exacerbates the pressure of agricultural production, and compound drought and extreme rainfall events (CDER) can cause considerable damage to soil structure, thereby disrupting normal agricultural activities. Previous studies have revealed the impacts of the individual event, but the spatiotemporal characteristics of CDER and their effects on agricultural production remain obscure. This study focuses on compound disaster events in China's nine major agricultural regions, where drought and extreme rainfall events occur within 5 d. The results show that compound disasters are mainly concentrated in the northwest, southwest, and northern regions. The impact area of compound disasters is largest in summer, and the frequency and intensity of drought-rainfall events are higher than those of rainfall-drought events. Further analysis at the crop growth stage scale reveals the exposure of the three major cereal crops (rice, wheat, and maize) during their growth stage. The study reveals that maize generally has the highest and most variable disaster risk, rice has the lowest risk with minimal fluctuations, and wheat has moderate risk with large variations. The risk evolution in each agricultural region follows a universal pattern of “first rising and then declining”, with the peak occurring around 2010. This study elucidates the spatiotemporal distribution patterns of this novel compound disaster and provides constructive insights for disaster prevention and mitigation through more refined risk assessments.
- Article
(10418 KB) - Full-text XML
- BibTeX
- EndNote


Climate change is one of the most serious threats to human society in the 21st century and may generate more extreme weather events and show an increasing trend at regional and global scales under anthropogenic climate change (AghaKouchak et al., 2014; Leonard et al., 2014; Zscheischler et al., 2020). With the intensification of global warming, the frequency, intensity, and compound effects of extreme rainfall and drought events have shown significant increases (Fang et al., 2025; Hao et al., 2018; Walz et al., 2021). The Sixth Assessment Report of the IPCC indicates that the frequency of compound drought and extreme rainfall events globally increased by 34 % between 1980 and 2020 compared to pre-industrial levels (Calvin et al., 2023). Farmers are constantly dealing with and managing various agricultural risks that may have compound effects (Van Winsen et al., 2013; Wauters et al., 2014). Compound extreme events can exacerbate the damage caused by individual events and push global socio-economic systems to tipping points (Dickinson et al., 2016). This is because the combined stressors can overwhelm the capacity of exposed natural and human systems to cope with extreme conditions (Jayaraman et al., 2025; Ruess et al., 2025). The hazards of compound drought and extreme rainfall events (CDER) are not only reflected in the individual effects of drought or extreme rainfall but also in their combined effects. These events can cause significant damage to soil structure: extreme rainfall-induced soil erosion leads to an annual loss of 240 billion tons of topsoil globally (Borrelli et al., 2017), while anomaly drought can reduce soil organic matter content by 40 %–60 %. Extreme rainfall events, characterized by high intensity and short duration, can induce severe soil erosion through processes such as splash erosion and overland flow (Quansah, 1981; Wang et al., 2021). The resultant detachment and transport of soil particles not only degrade soil fertility but also contribute to sedimentation in water bodies, exacerbating water quality issues. This alarming rate of soil erosion underscores the vulnerability of agricultural lands and natural ecosystems to hydrological extremes. Conversely, prolonged drought conditions impose distinct yet equally detrimental impacts on soil structure (Vicente-Serrano et al., 2020). Droughts reduce soil moisture levels, which are critical for maintaining soil aggregate stability and porosity. The desiccation of soil organic matter (SOM) under drought stress leads to its accelerated decomposition, resulting in a significant reduction in SOM content often by 40 %–60 % (Goebel et al., 2011; Yang and Liu, 2020). This decline in SOM not only diminishes soil fertility but also compromises the soil's ability to retain water and nutrients, further exacerbating its susceptibility to erosion during subsequent rainfall events. Additionally, drought-induced changes in soil structure can reduce hydraulic conductivity, impairing water infiltration and increasing runoff generation during rainfall events, and the water-replenishing effect of rainfall is further limited (Caplan et al., 2019). The combined effect of these two factors can reduce soil productivity by up to 75 % (Lal, 2015).
Recent studies indicate that compound extreme events will significantly increase globally, with the occurrence rate of related events potentially increasing by 20 %–40 % by mid-century (Steensen et al., 2025). Since the 1990s, the frequency of “drought-flood abrupt alternation” events in the South China and Southwest regions has significantly increased by over 40 % (Hui et al., 2013; Shen et al., 2012; Wang et al., 2009). These compound events pose a significant threat to China's agricultural production and ecological environment. Meanwhile, China, with only 7 % of the world's arable land, must support 20 % of the global population (Bongaarts, 2021). Moreover, the economic losses caused by these events are substantial and widespread. For example, in 2011, after experiencing continuous drought in winter, spring, and summer, the middle and lower reaches of the Yangtze River suffered from heavy rainfall, resulting in over 2 million ha of affected cropland and direct economic losses of CNY 29.36 billion (Meteorological Publishing House, 2012). Over the past 2 decades, extreme rainfall has reduced China's rice production by one-twelfth (Fu et al., 2023). Against this backdrop, the urgency of enhancing agricultural climate resilience is highlighted.
Existing studies have focused on the phenomenon of drought and extreme rainfall alternation, but most compound event identification studies are limited to provincial scales rather than national scales (Barriopedro et al., 2011; Zhao et al., 2023). Some studies are motivated by the development of an integrated index to address the multidimensional nature of agricultural drought impacts, its spatial vulnerability perspective, and scale requirements (Murthy et al., 2015). Additionally, while some studies have quantified the risks of population and economic exposure to drought-flood abrupt alternation using shared socio-economic pathways (Meng et al., 2024), the exposure risks of directly affected crops remain unclear. Most studies have used hydrological indices to characterize compound events, focusing on daily scales and using indices such as the standardized precipitation-evapotranspiration index. In contrast, this study uses soil moisture data to monitor compound events from an agricultural perspective rather than a hydrological one. Moreover, encountering compound events during critical crop phenological stages can amplify yield losses by 3–5 times (Lesk et al., 2022). The impact of compound events on crops at different growth stages is significant, but current agricultural studies have focused more on the exposure analysis of individual extreme rainfall and drought events, with limited research on compound event exposure. From a developmental perspective, existing studies have identified and analyzed drought-flood abrupt alternation events in China from daily, monthly, and annual scales, forming four important research hotspots and frontiers: identification methods, causation analysis, evolution characteristics, and disaster damages (Shen et al., 2018; Yang and Liu, 2020). However, there is still a lack of comprehensive, national-scale analyses of secondary CDER in agricultural regions. The spatiotemporal distribution and evolution characteristics of drought-flood abrupt alternation events in China remain unclear, and research on crop exposure in the nine major grain-producing regions is still a blank space.
We define CDER as disaster events where drought and extreme rainfall occur within a 5 d interval. Specifically, these can be divided into compound extreme rainfall-drought events CDERrd (extreme rainfall followed by drought within 5 d) and compound drought-rainfall CDERdr (drought followed by extreme rainfall within 5 d). The research statistically analyzes the frequency, intensity, monthly changes, and annual changes of these two types of events to reveal their spatiotemporal distribution characteristics comprehensively. Additionally, this study innovatively calculates the exposure of China's three major agricultural products (maize, wheat, and rice) during their maturation periods. By focusing on the crop growth stage, the study refines exposure calculations and trend analyses will aid in better disaster prevention and mitigation efforts based on an understanding of these compound disasters.
2.1 Study Area
China's agricultural regions are vast and geographically diverse, encompassing nine major agricultural zones that include plains, mountains, basins, and plateaus. These regions are crucial for grain production and span from 3°51′ to 53°33′ N and 73°33′ to 135°05′ E. The climate types are complex and varied, including tropical monsoon, subtropical monsoon, temperate monsoon, temperate continental, and alpine climates. Crop maturity systems range from one harvest per year to three harvests per year. The agricultural zoning data of China are derived from the China Agricultural Comprehensive Zoning Map released by the National Agricultural Commission (Fig. 1), where C1 represents the Northeast China Region; C2 represents the Inner Mongolia and Great Wall Contiguous Region; C3 represents the Gansu-Xinjiang Region; C4 represents the Huang-Huai-Hai Region; C5 represents the Loess Plateau Region; C6 represents the Qinghai-Tibet Region; C7 represents the Middle Lower Yangtze River Region; C8 represents the Southwest China Region; and C9 represents the South China Region.
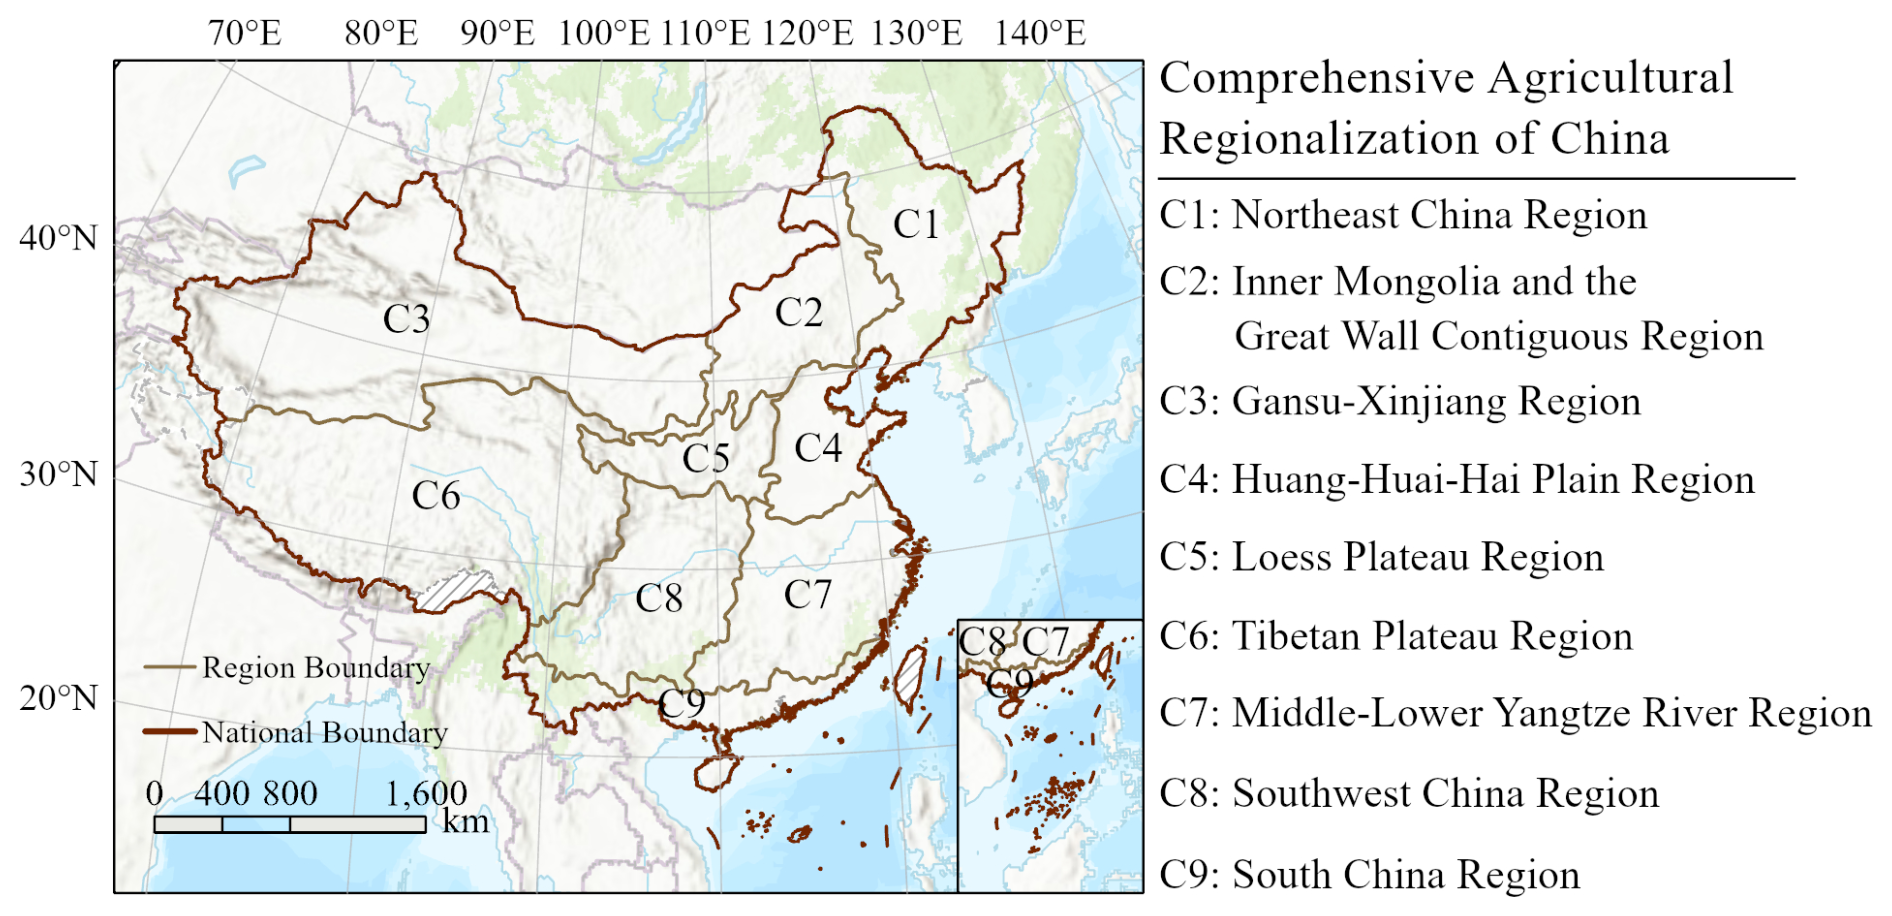
Figure 1Agricultural comprehensive zoning.
2.2 Data
We utilized soil moisture data, precipitation data, and phenological data of the three major cereal crops (Table 1). The soil moisture data were standardized to identify drought events; the 99th percentile of precipitation data for each grid cell with rainfall was set as the extreme rainfall threshold; and the phenological data of the crops were used to calculate the exposure during the maturity stage. The specific information and sources of the data are provided in detail in Table 1 and below:
-
China 1 km Soil Moisture Daily Dataset (2000–2022) based on station observations, National Tibetan Plateau Data Center (https://cstr.cn/18406.11.Terre.tpdc.272415, last access: 8 October 2024);
-
China Daily Precipitation Dataset (1961–2022; Hu and Miao, 2023), CHM_PRE V2: An upgraded high-precision gridded precipitation dataset for the Chinese mainland considering spatial autocorrelation and covariates, National Tibetan Plateau/Third Pole Environment Data Center (https://doi.org/10.11888/Atmos.tpdc.300523);
-
National Three Major Grain Crops 1 km Planting Distribution Dataset (2000–2019; Yuchuan and Zhang, 2022), National Three Major Grain Crops 1 km Planting Distribution Dataset (DS/OL), National Ecological Science Data Center. (https://doi.org/10.12199/nesdc.ecodb.rs.2022.016; https://cstr.cn/15732.11.nesdc.ecodb.rs.2022.016, last access: 2 November 2024).
2.3 Methodology
2.3.1 Identification of CDER
Compound events in this study are divided into two types: one is extreme rainfall followed by drought within 5 d (CDERrd), and the other is drought followed by extreme rainfall within 5 d (CDERdr) (Sun et al., 2024). The intensity of compound drought and extreme rainfall events is composed of three parts: drought intensity, extreme rainfall intensity, and the interval time between the two events (Eq. 1). Extreme rainfall is defined as days with rainfall exceeding the 99th percentile threshold of the grid's rainfall days (Schillerberg and Tian, 2024). A drought event is defined as a day on which the standardized soil moisture index (SSMI) in the region falls below one negative standard deviation of the 21 years mean value of this index. For drought events, this study first applies a moving average with a window size of 7 to smooth the data. Subsequently, soil moisture data for the same period in historical records are standardized, and values below −σ were identified as drought events. The absolute value of these standardized anomalies is defined as drought intensity. For extreme rainfall, all extreme rainfall events within the same region are standardized and uniformly shifted to be greater than zero. The resulting values are used to represent extreme rainfall intensity. Drought events are identified using the standardized soil moisture index, with the average value during the entire drought duration representing drought intensity.
Here C represents the compound event intensity, P represents the extreme rainfall intensity, D represents the drought intensity, and Δt represents the interval time between extreme rainfall and drought events. We have rendered both P and D dimensionless for the analysis.
2.3.2 Mechanism of Soil Damage from CDER
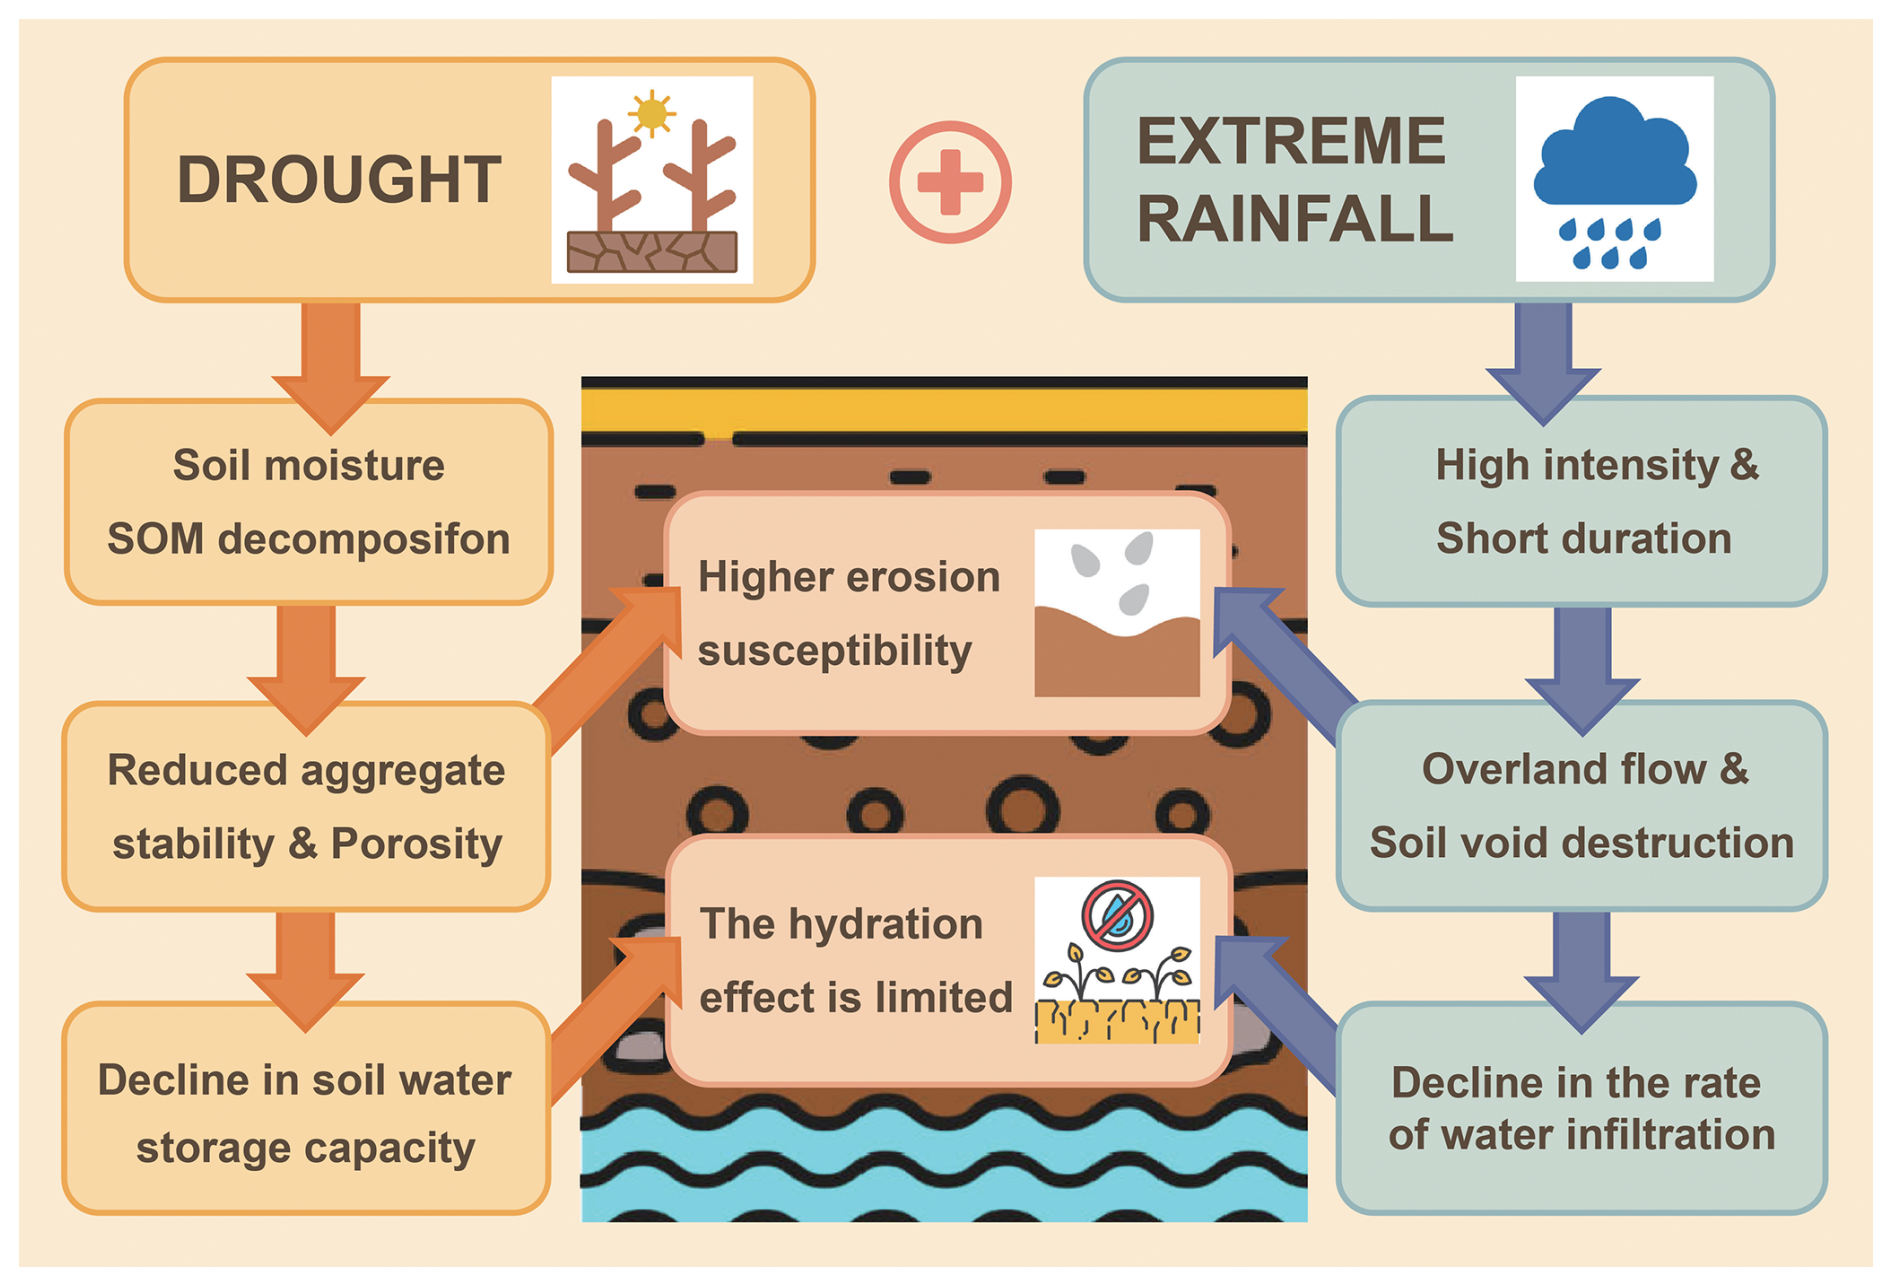
Compound events involving drought and extreme rainfall exert synergistic negative impacts on soil health and agricultural productivity (Fig. 2). Extreme rainfall events induce severe soil erosion, resulting in the loss of fine particles and essential nutrients. Simultaneously, prolonged drought conditions accelerate the decomposition and depletion of soil organic matter (SOM), further weakening soil structure. Together, these processes significantly increase soil erosion susceptibility. Drought-induced degradation of soil aggregate stability reduces porosity and water retention capacity. When followed by intense, short-duration rainfall, the already-compromised soil structure is further damaged by surface runoff and the destruction of soil pores, leading to a sharp decline in the infiltration rate. As a result, the limited water that is delivered during extreme rainfall events fails to effectively rehydrate the soil, compounding the water deficit stress experienced by crops and impairing agricultural resilience.
2.3.3 Calculation of Crops Exposure to CDER
The exposure during the growth stage of each crop is calculated by multiplying the number of compound events occurring within the growth stage of each grid by the agricultural land area of that grid (Eq. 2). We use the crop maturity date in combination with the typical maturity period length of the three major crops to backtrack and determine the time window for the entire growing season, within which we count the occurrences of compound events to obtain f. Specifically, we select 130 d for maize, 100 d for rice, 300 d for winter wheat, and 100 d for spring wheat. In China, a large proportion of rice cultivation consists of double-cropping rice, which includes early rice and late rice. Due to its higher yield, better grain quality, greater economic value, and increased vulnerability to CDER, this study focuses exclusively on late rice.
The distribution of different varieties of the three major cereal crops across China is relatively extensive. Therefore, it is not feasible to represent the growth period of each crop type by selecting a single representative variety; instead, multiple data sources need to be collected and weighed comprehensively.
For rice, the average growth period of the late rice in double-cropping systems used in this study is approximately 88 d (Liu et al., 2018), and around 117 d (Li et al., 2011). Ultimately, this study adopts a growth period of 100 d for rice.
For maize, the major varieties cultivated in China and their respective growth periods investigated in this study are as follows: Xianyu 335 (Zea mays L. 'Xianyu335'), approximately 130 d; Demeiya 1 (Zea mays L. 'Demeiya1'), approximately 110 d; Denghai 605 (Zea mays L. 'Denghai605'), ranging from 100 to 130 d; Longping 206 (Zea mays L. 'Longping206'), approximately 101 d; Jindan 1771 (Zea mays L. 'Jindan1771'), approximately 125 d; Gaonong 1206 (Zea mays L. 'Gaonong1206'), approximately 129 d; Shanyu 580 (Zea mays L. 'Shanyu580'), approximately 130 d; Tianyu 219 (Zea mays L. 'Tianyu219'), approximately 129 d. Taking these into account, this study uses 130 d as the growth period for maize.
Regarding spring wheat, the book Chinese Wheat Cultivation (Jin, 1961) indicates that the growth period of spring wheat generally exceeds 100 d, with the shortest around 80 d and the longest reaching approximately 190 d. The growth period of winter wheat typically exceeds 240 d, and can reach over 350 d in regions such as Linzhi, Tibet. Therefore, this study adopts a growth period of 100 d for spring wheat and 300 d for winter wheat.
where f represents the frequency of compound events, Expagr represents the agricultural exposure, and Agr represents the agricultural land area.
2.3.4 Other Statistical Methods
This study employed several methods to analyze CDER. Soil moisture data are standardized to identify drought conditions by transforming them to a distribution with a mean of 0 and a standard deviation of 1. The Least Squares Method (LSM) is used to fit a linear trend and assess annual changes in the frequency of compound events. The K-Means clustering algorithm classifies event intensity into five levels based on data similarity. Loess regression is applied to model local trends in crop risk evolution, capturing non-linear patterns through weighted least squares within local neighborhoods. These approaches enabled a comprehensive analysis of extreme climate events in relation to crop phenology and soil moisture.
3.1 Spatiotemporal Characteristics of CDER
This study systematically analyzed the spatial distribution characteristics of compound drought-rainfall events (CDERdr) and compound rainfall-drought events (CDERrd) across mainland China (Fig. 3a and c), and visualized their disaster intensities using a five-level intensity classification system (Fig. 3b and d). The results indicate: the annual occurrence frequency of CDERdr events is significantly higher than that of CDERrd events, with high-frequency aggregation zones formed in the Northwest Arid Region, Hengduan Mountains, and central-northern Xinjiang. Moreover, CDERdr events exhibit spatial heterogeneity characteristics in occurrence frequency compared to CDERrd events in northern regions. Although no significant differences were observed in intensity magnitudes between the two event types, high-intensity CDERrd zones (Level IV–V) are concentrated in northeastern China and northeastern Inner Mongolia (110–113° E, 37–40° N), while CDERdr events demonstrate spatially balanced intensity distribution with their high-intensity zones (Level III–IV) primarily forming a belt along the hilly belt of southern China (23–25° N).
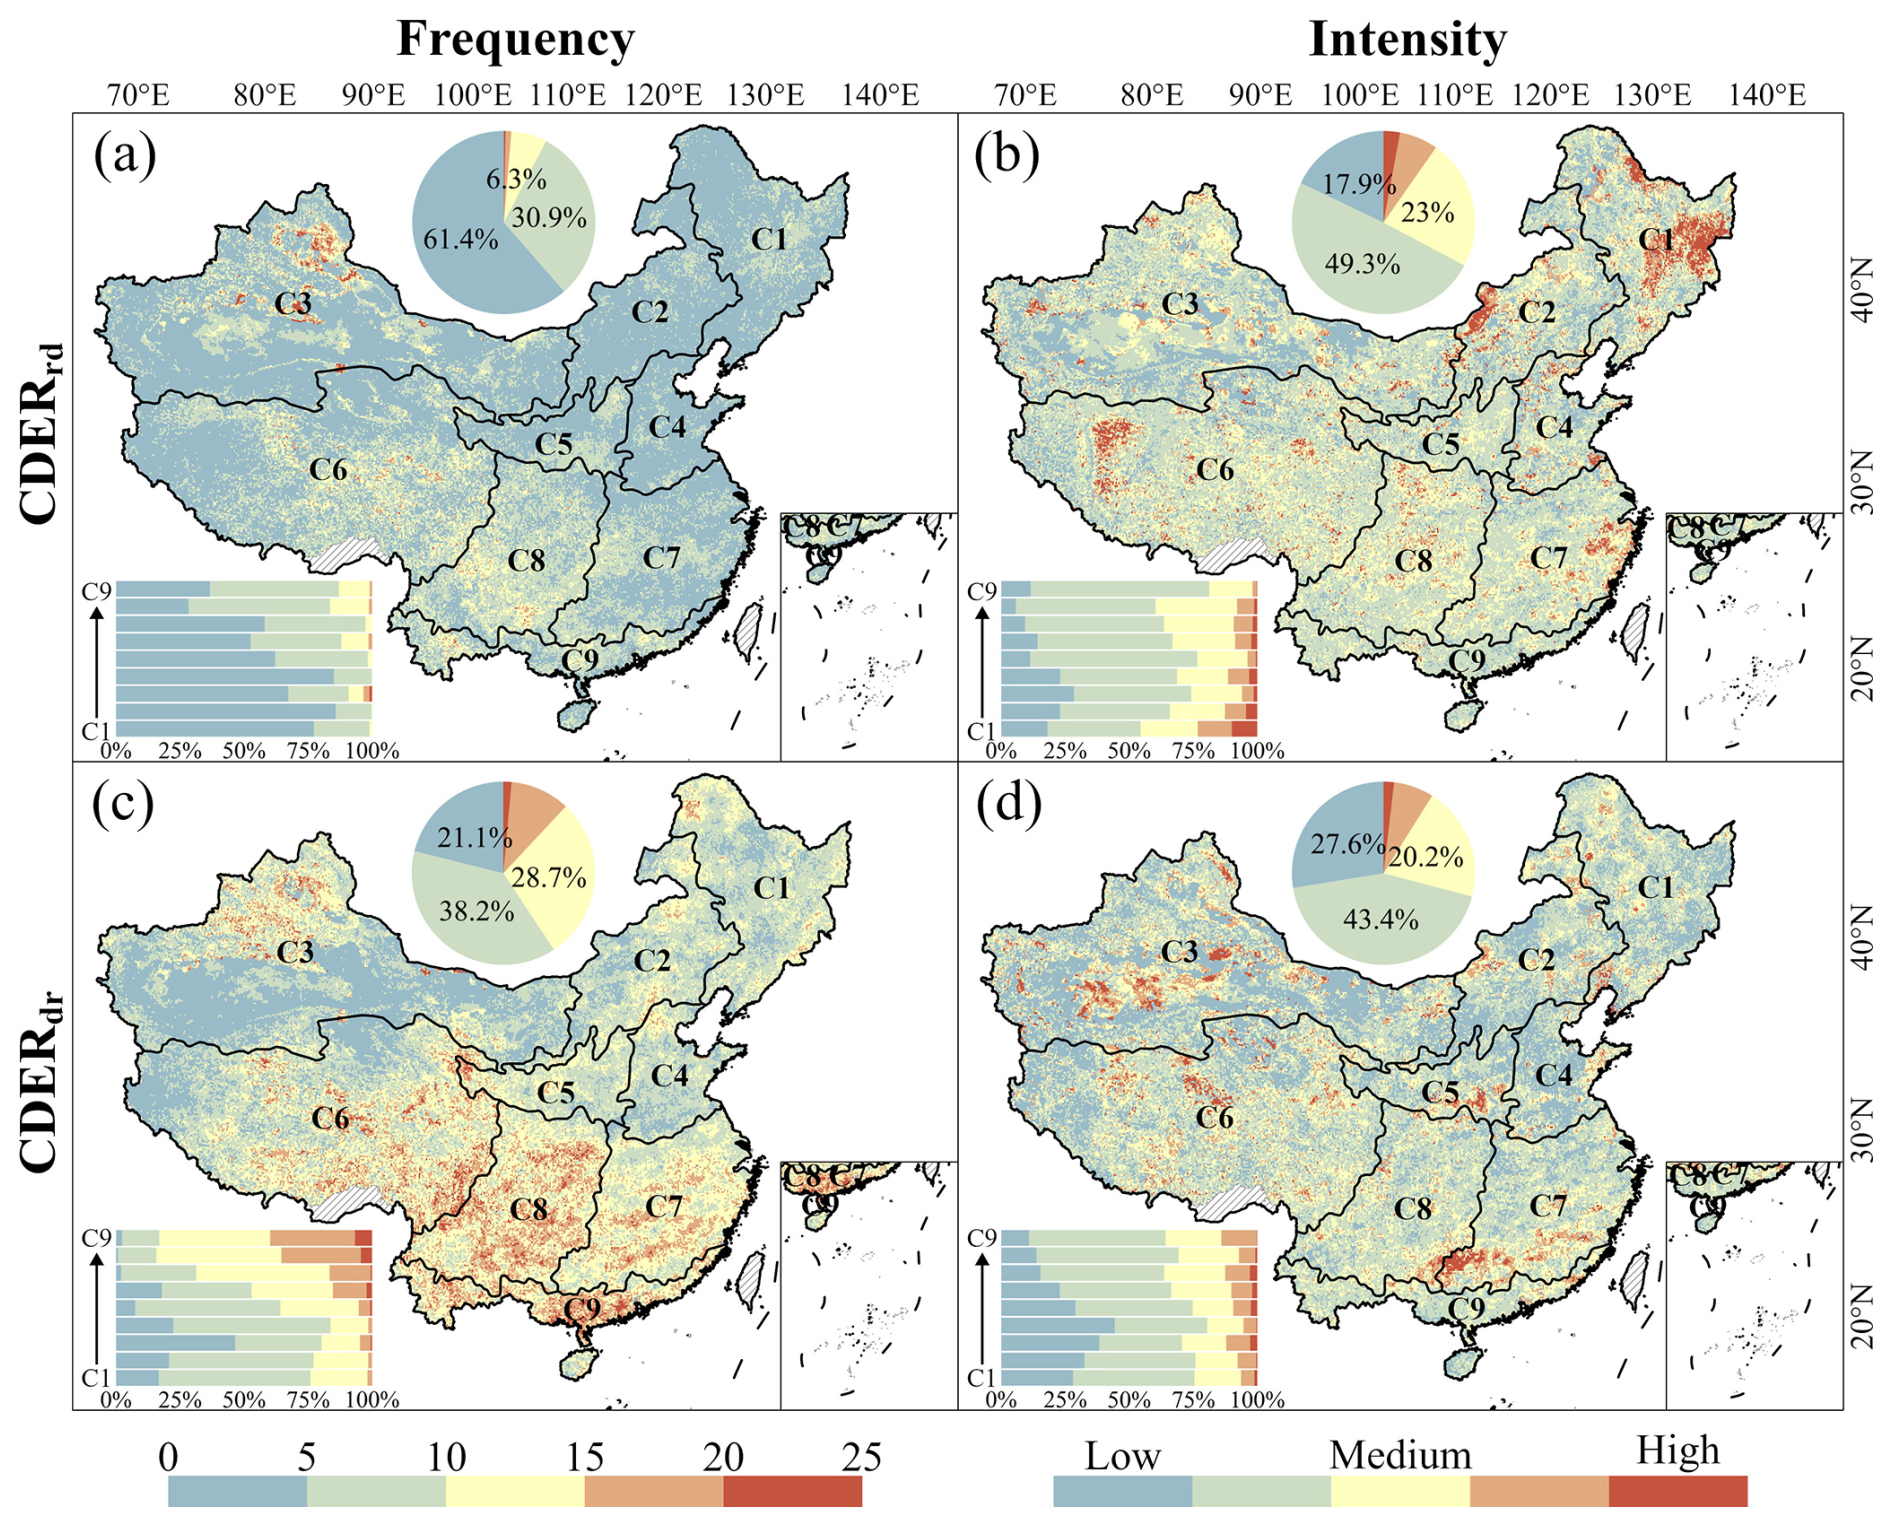
Figure 3Spatial distribution of compound drought and extreme rainfall events. (a) and (b) show the frequency and intensity of CDERrd respectively, while (c) and (d) depict the frequency and intensity of CDERdr. The bar charts represent the proportion of different color values within each region, while the pie charts show the proportion of each magnitude across the entire country.
There are distinct seasonal differences between CDERdr and CDERrd. This study statistically analyzes the monthly average proportions of affected areas for CDERrd and CDERdr (Fig. 4). Among the nine major agricultural regions, the temporal variation trends in affected area proportions across different regions are similar, with no significant inter-regional differences. The bar charts for each region exhibit unimodal distributions: northern regions (C1∼C6) reach peak coverage in July, while southwestern and southern regions (C7∼C8) peak in June when CDERdr achieve maximum coverage. Overall, CDERdr show the highest disaster coverage during summer months (June, July, August), significantly exceeding other seasons, followed by spring and autumn. Across all agricultural regions, the affected area proportions of CDERdr from December to February are nearly zero, indicating extremely low winter occurrence frequencies, with limited distributions only in the Middle-Lower Yangtze River region, southwestern region, and southern region.
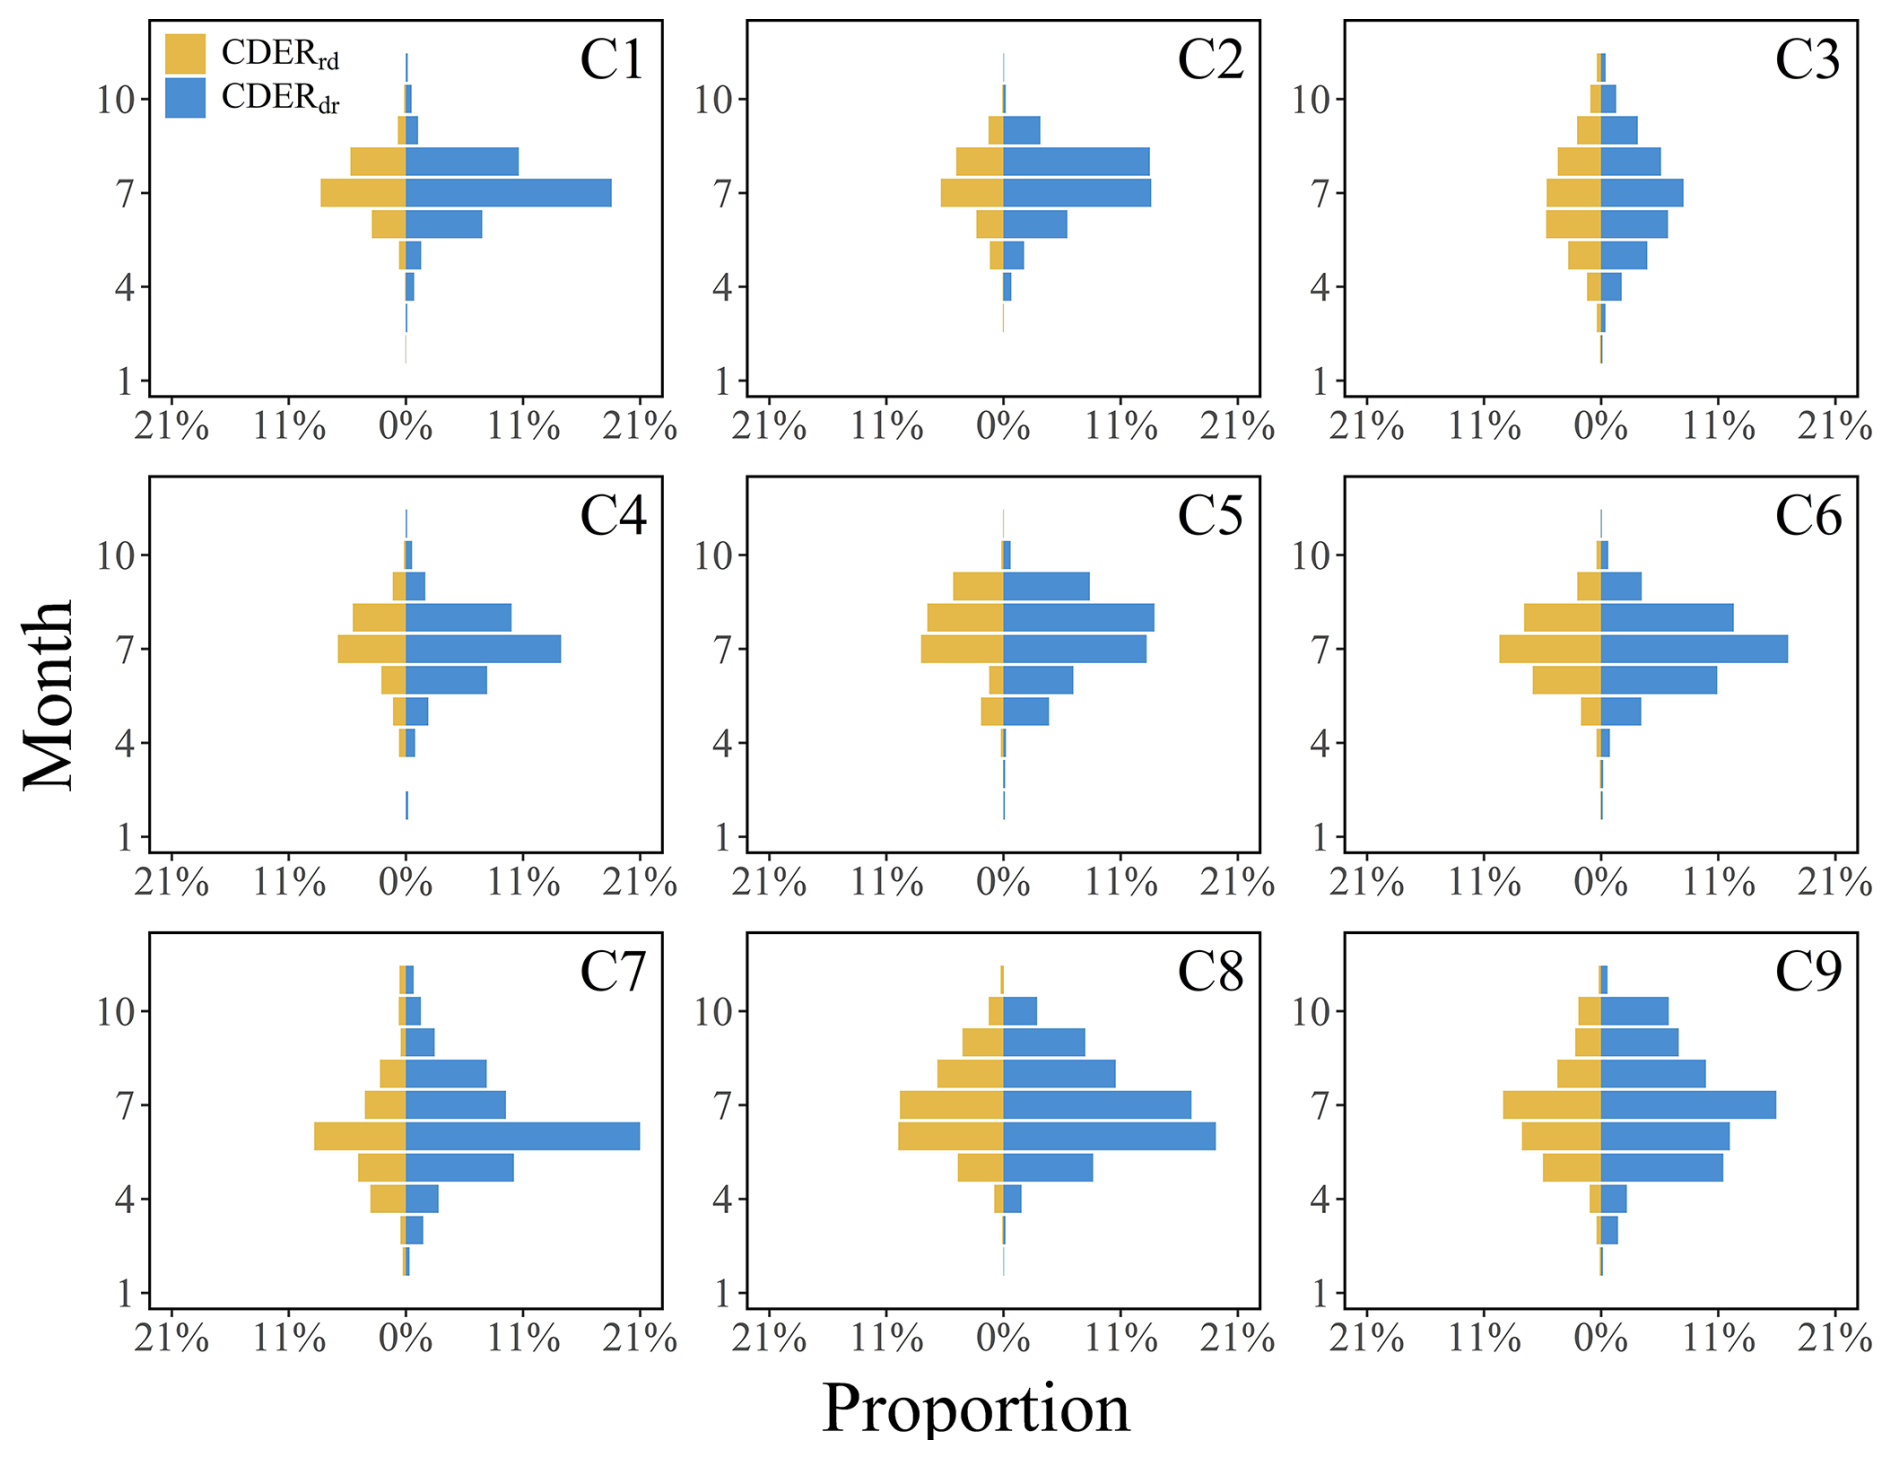
Figure 4Monthly average affected area of compound drought-rainfall events. C1 to C9 represent the nine major agricultural regions mentioned earlier, with yellow indicating CDERrd and blue representing CDERdr.
Simultaneously, comparing monthly affected area proportions between CDERdr and CDERrd reveals consistent inter-monthly variation trends: similar spatial distributions concentrated in summer, secondary peaks in spring/autumn, and minimal winter occurrences. However, the affected area proportions of CDERdr are significantly higher than those of CDERrd, nearly doubling the latter. For instance, in region C1, the July coverage proportion of CDERdr reaches 20 %, whereas CDERrd peak at only ∼10 %. Overall, CDERdr coverage proportions are approximately twice those of CDERrd. Notably, in region C5, the August affected area proportion of CDERdr exceeds that in September, whereas CDERrd show the opposite pattern.
The interannual variation trends in affected areas of the two compound event types exhibit regional differences. This study further analyzes the changing trends in affected area proportions of CDERdr and CDERrd across agricultural regions from 2000 to 2020 (Figs. 5 and 6). The nine agricultural regions show similar distribution patterns, with most regions maintaining relatively stable interannual variation trends and insignificant changes. Regional heterogeneity primarily manifests in C1, C3, and C6–C9, where both compound types exhibit declining trends (p<0), with CDERdr showing more pronounced frequency reductions. Specifically, C1 and C3 demonstrate insignificant downward trends characterized by relatively stable event frequencies with minor fluctuations. In C3, annual mean frequencies of CDERdr and CDERrd generally exhibit synchronized fluctuations, whereas no significant correlation is observed between them in C1. The declining trends in C6–C9 are notably stronger, collectively showing higher frequencies before 2010 followed by significant post-2010 reductions, despite occasional minor rebounds.
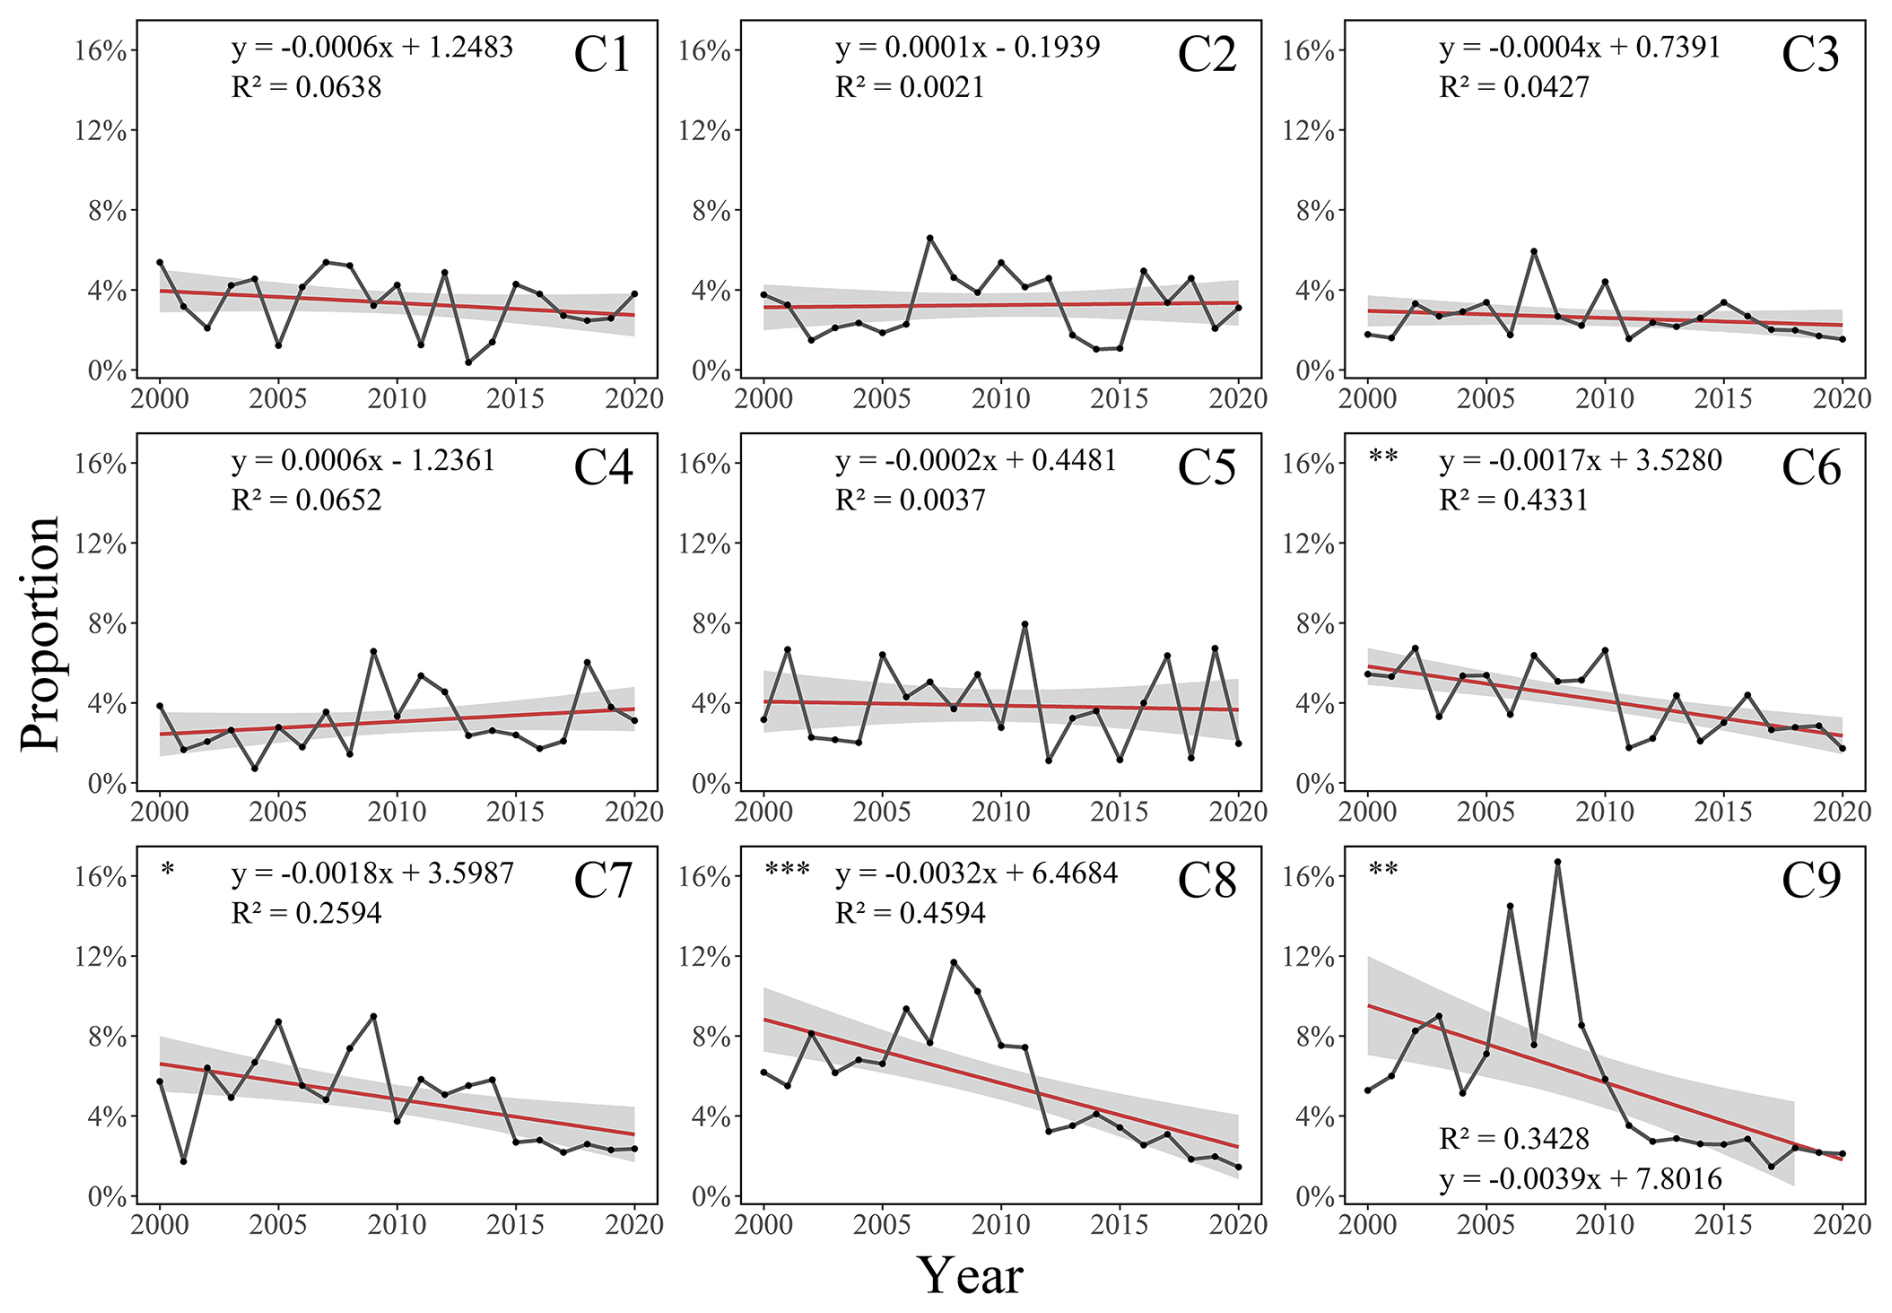
Figure 5Annual frequency of compound drought-rainfall events. Red line represents the fitted trend line, and the shaded area represents the confidence interval. One star indicates p<0.05, two stars indicate p<0.01, and three stars indicate p<0.001.
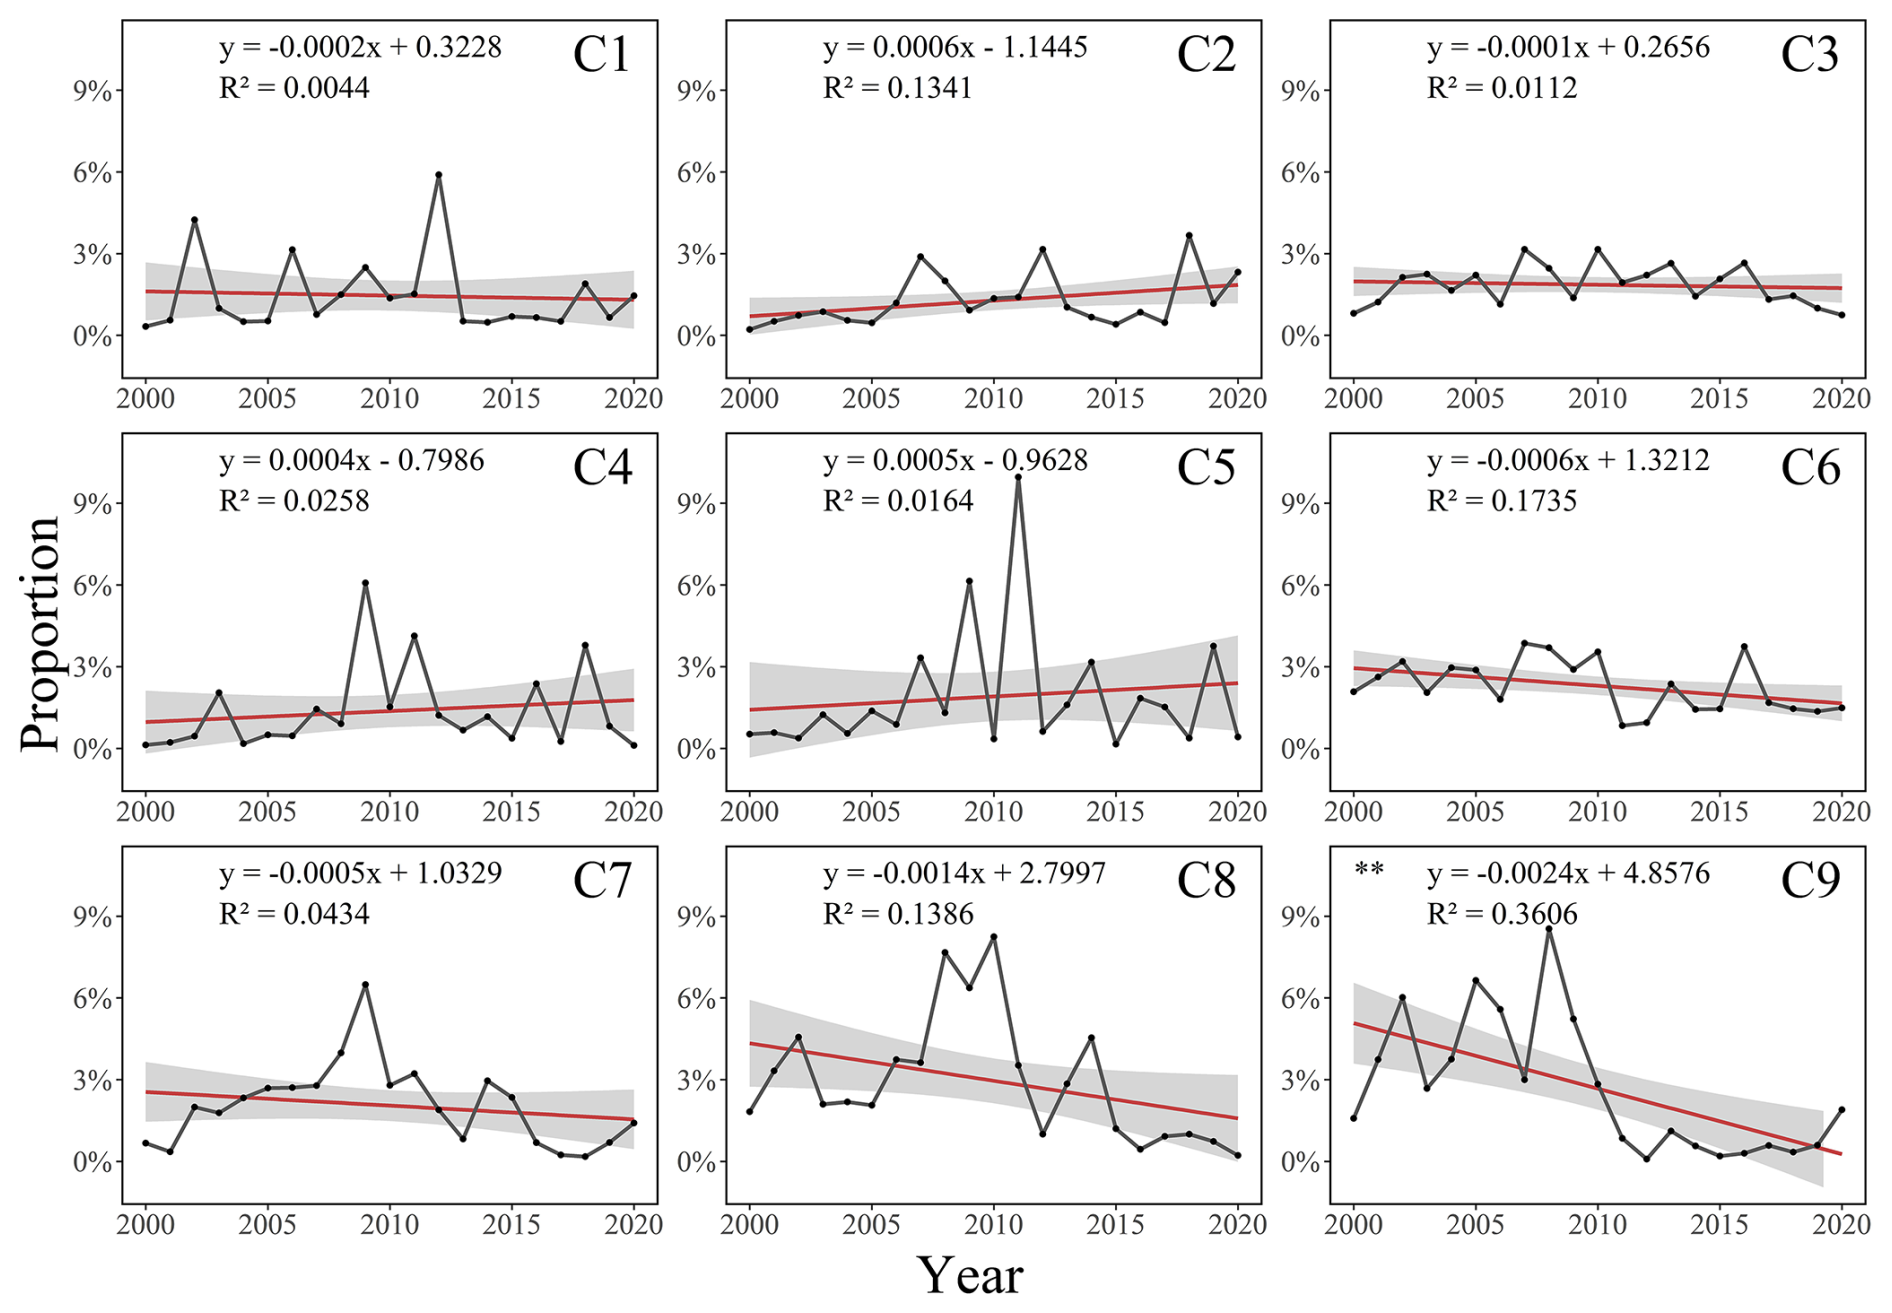
Figure 6Annual frequency of compound rainfall-drought events. Red line represents the fitted trend line, and the shaded area represents the confidence interval. One star indicates p<0.05, two stars indicate p<0.01, and three stars indicate p<0.001.
C2 and C4 display upward trends, with no apparent correlation between annual mean frequencies of CDERdr and CDERrd. Notably, although C4 shows an overall increasing trend, it exhibits consecutive declines during 2018–2020, suggesting potential future frequency reductions. The Loess Plateau region (C5) presents a unique case: CDERdr frequencies show a declining trend while CDERrd frequencies exhibit an upward trend, accompanied by substantial overall fluctuations and relatively poor model fitting performance.
3.2 Agricultural Production Exposure Analysis
3.2.1 Spatial Distribution of Compound Event Risk in Nine Major Agricultural Regions
By overlaying CDERrd and CDERdr across China's nine major agricultural regions, this study generates boxplots illustrating exposure for three primary crops (maize, rice, wheat) in these regions (Fig. 7). The boxplots reveal significant regional disparities in disaster risks among maize, rice, and wheat, reflecting notable fluctuations in crop exposure risks across regions. Overall, C8 demonstrates universally higher disaster risks for all crops, while geographically distinct regions like C1, C2, C3 and C6 exhibit lower risks. The exposure risk of maize and wheat covers a broader national extent, being widely distributed across all regions. Region C4 exhibits exposure risk that is markedly higher than in any other region, followed by C5 and C8, where the risk is chiefly concentrated on the North China Plain. A notable distinction between the two cereals is that maize exposure risk is comparatively elevated in C8, whereas wheat exposure risk in the same region remains relatively low. Owing to its geographically restricted cultivation zone, rice shows exposure risk only in C4, C7, C8, and C9; among these, region C7 registers the highest risk, and the areas of heightened risk are mainly situated in the middle reaches of the Yangtze River and the Pearl River Basin.
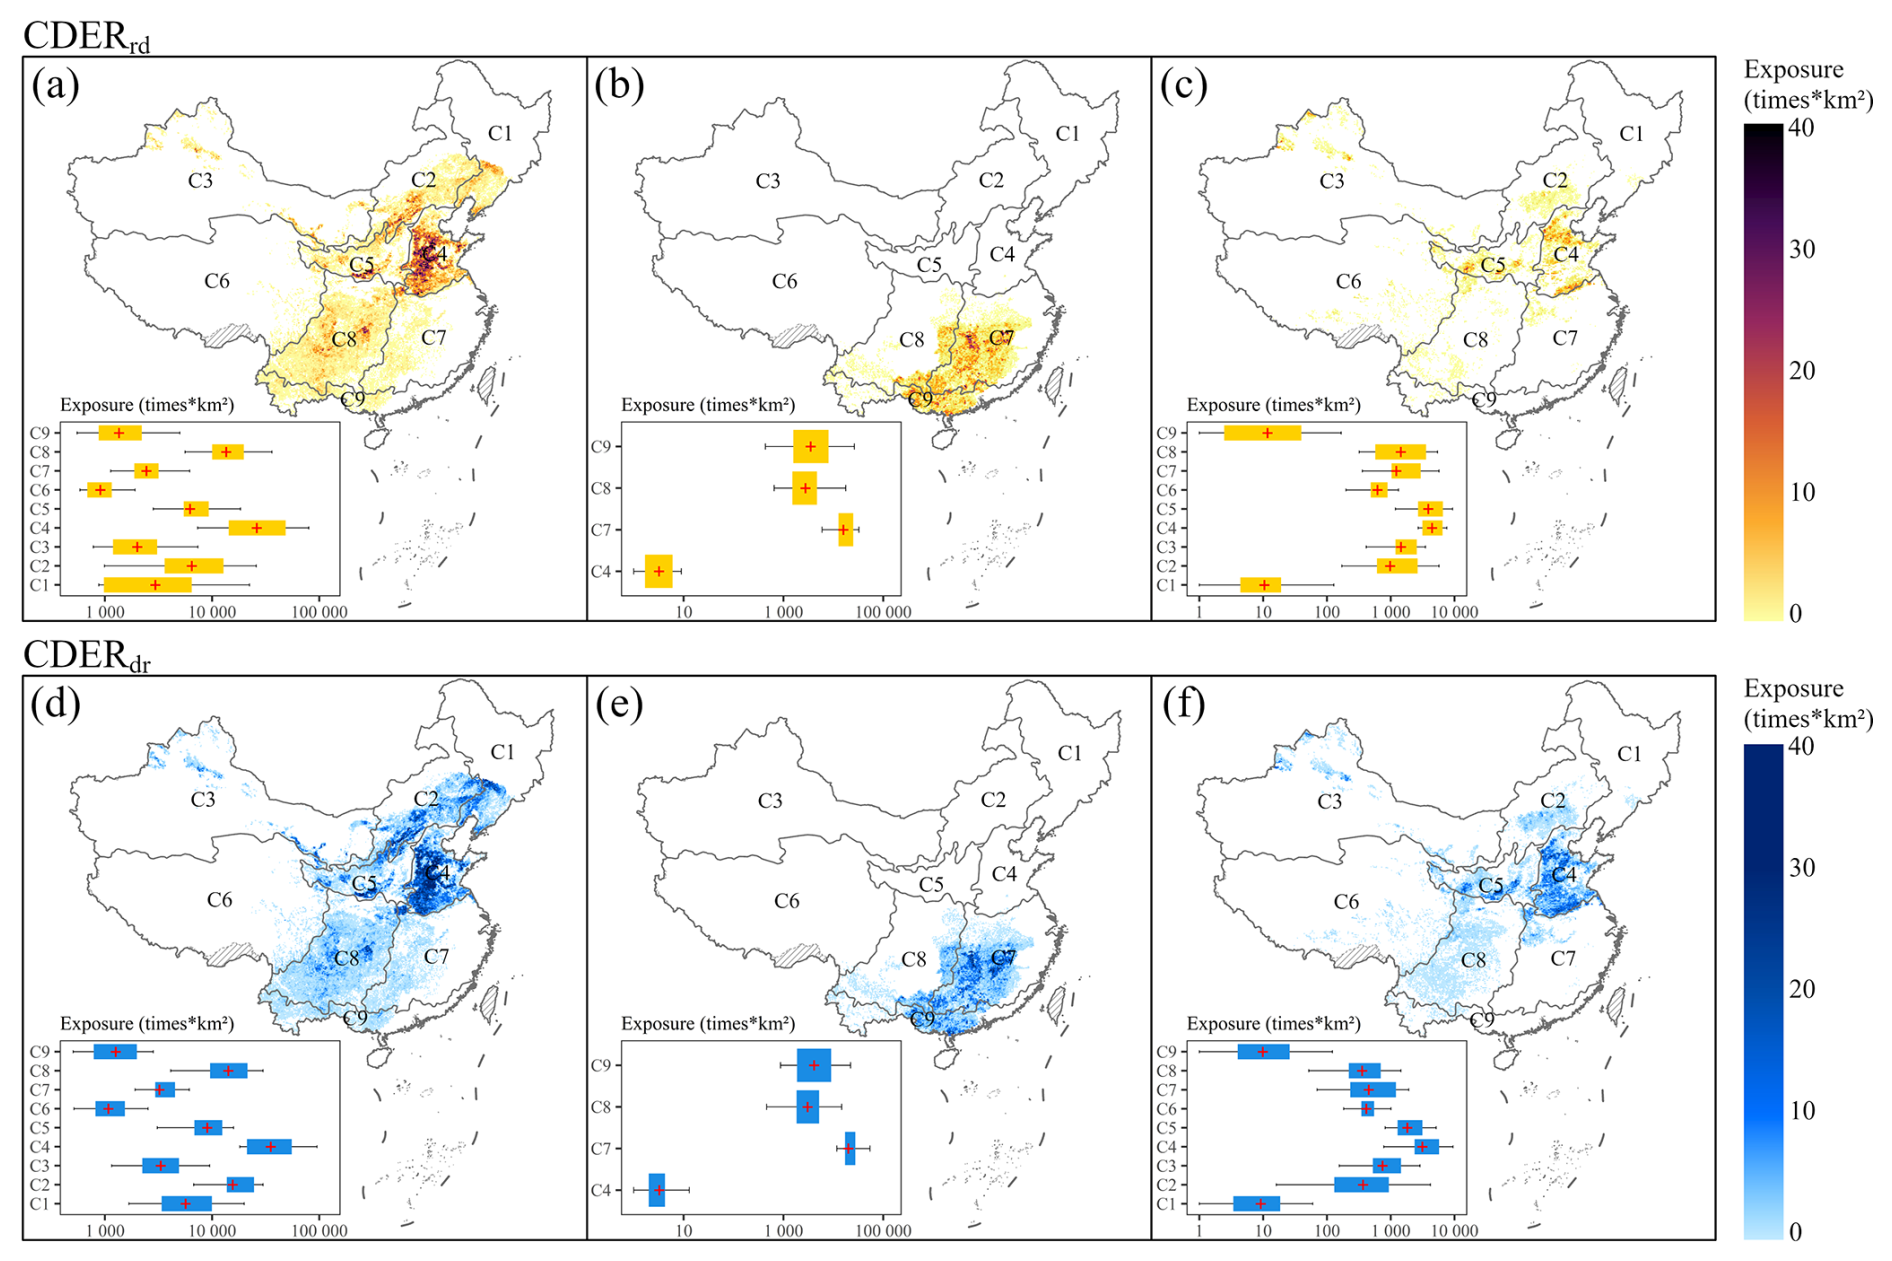
Figure 7Boxplots and spatial distribution maps of exposure risk for the three major crops in the nine agricultural regions. (a), (b), and (c) represent the exposure during CDERrd for maize, rice, and wheat, respectively; (d), (e), and (f) represent the exposure during CDERdr for maize, rice, and wheat. The box plots display the distribution of exposure values across the different regions.
Among the three crops, maize shows the highest average national risk, followed by wheat, while rice displays minimal exposure risks due to limited cultivation areas nationwide. Maize exhibits generally higher and more variable risks, particularly in C4 and C5, likely attributable to extensive cultivation and frequent disasters in these regions. Wheat demonstrates relatively lower and more stable risks, with concentrated vulnerabilities in C4 and C5. Rice maintains the lowest risks with minimal fluctuations, potentially linked to its climatic adaptability. Although C7, C8, and C9 show elevated rice risks, limited fluctuations suggest manageable cultivation risks.
Regionally, most agricultural zones display clear correlations between crop exposure risks and cultivation scales. Both C1 and C6 exhibit low risks with minor fluctuations for all crops, though for divergent reasons: favorable climate and rare disasters in the Northeast (C1) versus low cultivation intensity in the Qinghai-Tibet Plateau (C6). Notably, C8 shows moderate-to-high risk across all crops, indicating combined impacts of local climate and compound disasters on cultivation.
3.2.2 Annual Changes in exposure of the Three Major Crops
Based on maize exposure data from 2000–2019 across China's nine major agricultural regions, fitting curves were constructed (Fig. 8). Regionally, C4 exhibits the highest exposure (up to 60 000), followed by C1, C2, C5, and C8 (reaching ∼ 10 000), with lower exposure in other regions. Comparatively, CDERdr generally demonstrates higher exposure than CDERrd, though exceptions occur: CDERrd risks exceed CDERdr in C8 around 2008 and in C9 during 2011–2020. Trend analysis reveals: Most regions show similar exposure trajectories for both compound types. C1, C3, C4, and C7 display initial increases followed by declines and subsequent rises, peaking around 2010, troughing near 2016, then rebounding. C6, C8, and C9 exhibit rise-fall-rise-decline patterns with varying peak/trough years. C2 and C5 demonstrate distinct behaviors: C2 shows rise-decline trends for both compound types, peaking around 2011 before decreasing; C5 displays rise-decline trends under CDERdr but rise-decline-rise patterns under CDERrd. Simultaneously, It is noteworthy that the exposure of C3, C6, and C9 rose in lockstep with the expansion of maize-cultivated area. By contrast, although the cultivated areas of C1, C2, C4, C5, C7, and C8 increased steadily from 2000 to 2019, their exposure did not exhibit a sustained upward trajectory; rather, it generally peaked around 2009 and subsequently declined, revealing marked differences in trend. These patterns indicate that maize exposure is governed chiefly by intrinsic factors – such as the frequency of hazardous events – while the influence of cultivated area, though present, is comparatively modest.
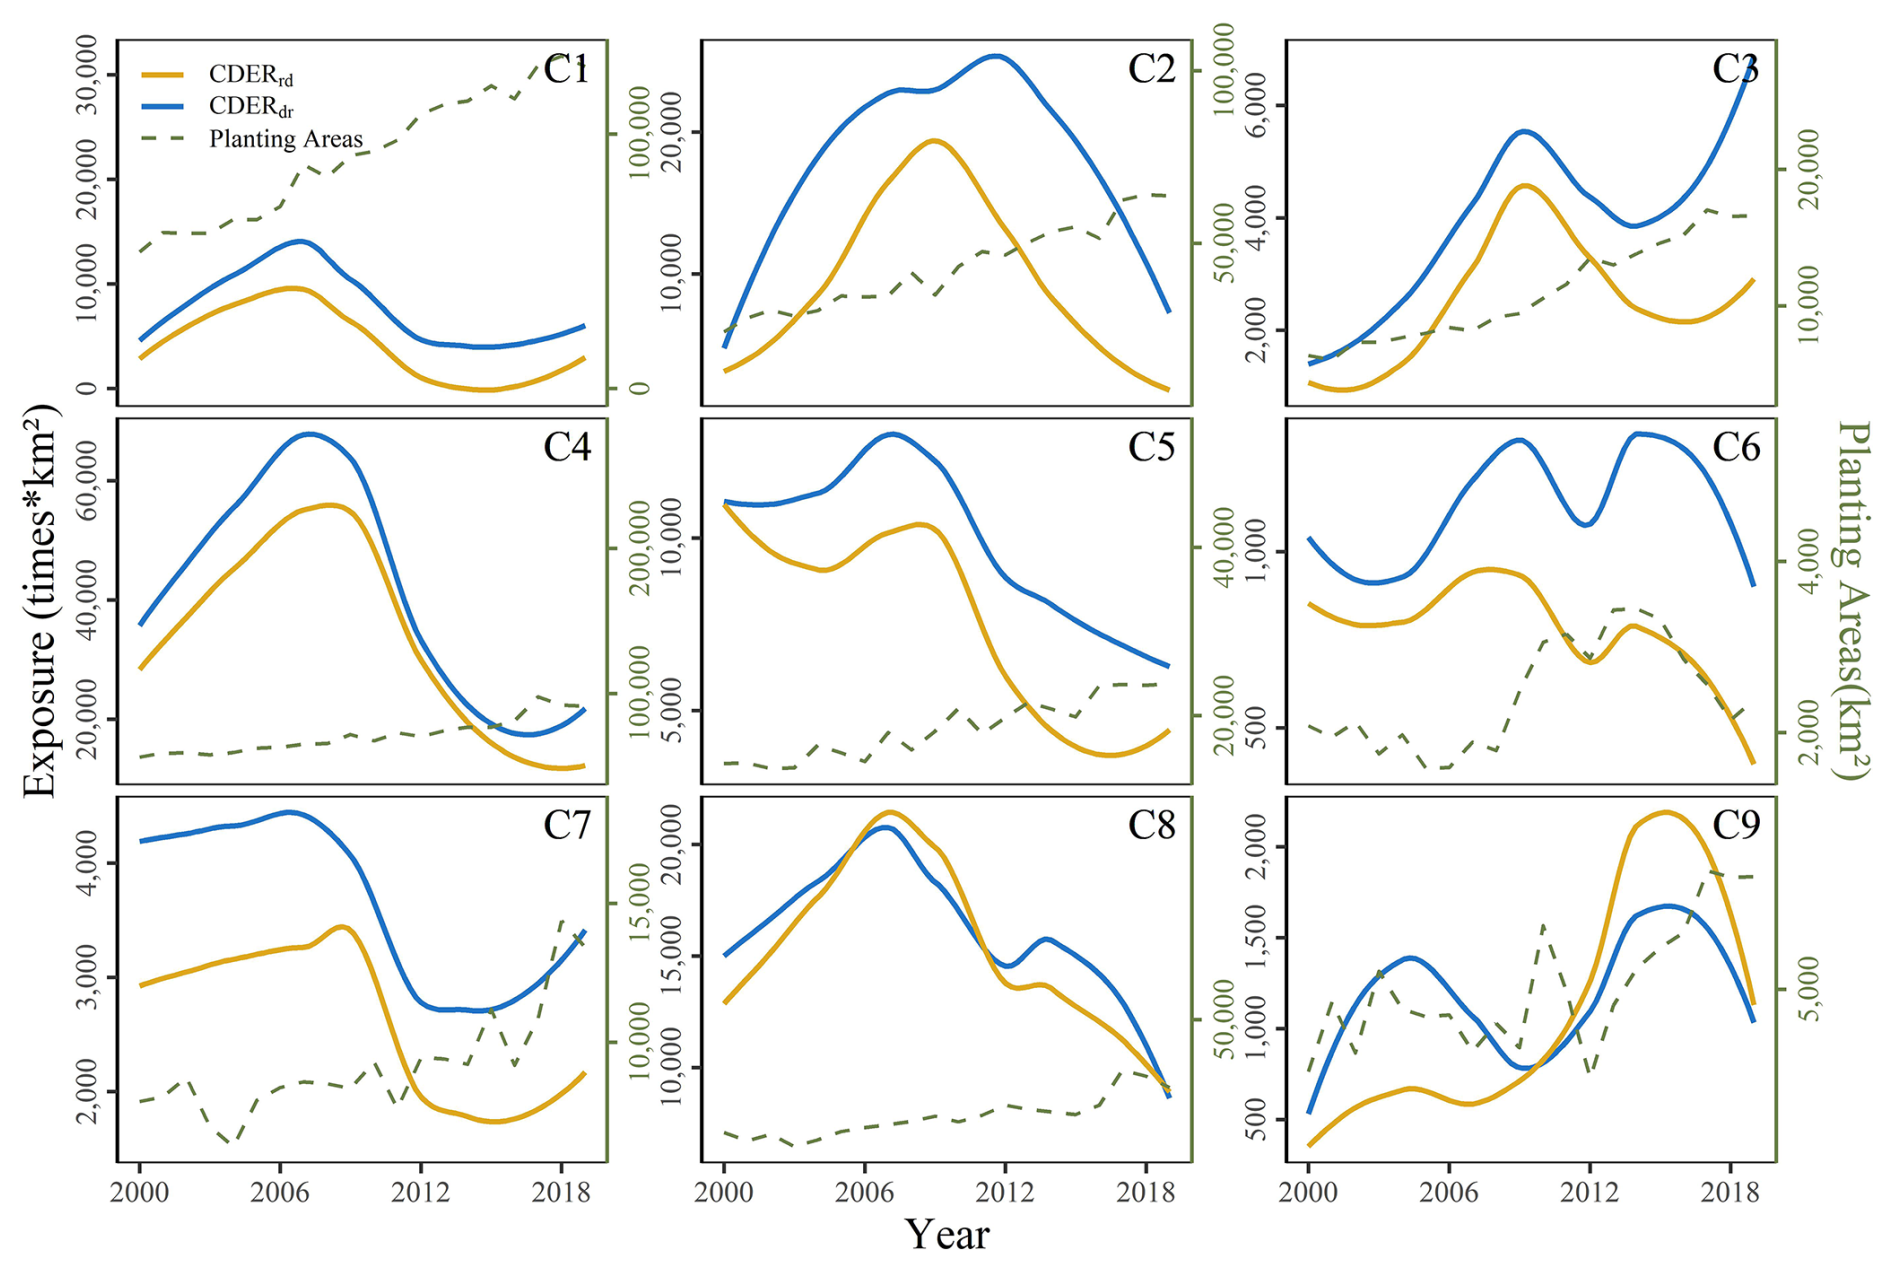
Figure 8Fitted curve of maize exposure risk during CDERrd in the nine agricultural regions (2000–2019). The yellow curve represents the annual exposure trend for CDERdr, the blue curve represents the annual exposure trend for CDERrd, while the green line shows the annual variation in planting area.
Based on rice exposure data from 2000–2019 across China's nine major agricultural regions, fitting curves were constructed (Fig. 9). Regions C1 (Northeast), C2 (Inner Mongolia-Great Wall), C3 (Gansu-Xinjiang), C5 (Loess Plateau), and C6 (Qinghai-Tibet Plateau) exhibit zero exposure throughout the period due to negligible rice cultivation and are excluded from presentation. Regionally, C7 shows the highest exposure (up to 40 000), followed by C8 and C9, with C4 displaying the lowest. Comparatively, exposure between CDERdr and CDERrd is generally similar, though CDERrd risks were lower than CDERdr prior to 2013 but higher post-2013. However, in C7, CDERrd exposure remains consistently lower than CDERdr. Trend analysis reveals divergent evolutionary patterns: C4 demonstrates an initial rise followed by decline and subsequent increase, peaking around 2006 before declining sharply. C7 and C8 both exhibit rise-fall-rise trajectories, peaking around 2010, troughing near 2012, then rebounding. Southern China (C9) displays distinct behaviors: CDERdr exposure follows a rise-decline pattern, while CDERrd exposure shows rise-decline-rise-decline fluctuations. Meanwhile, it is noteworthy that the exposure of C7, C8, and C9 changes in lockstep with the rice-planted area. In particular, although the rice-planted area in C4 has increased, its exposure has shown a consistently declining trend, revealing distinct differences among the trajectories. These findings indicate that rice exposure is strongly influenced by intrinsic factors such as event frequency, yet the planted area also exerts a substantial effect. This may be attributable to the relatively stable frequency and intensity of events in rice-growing regions, which accentuates the impact of changes in planted area.
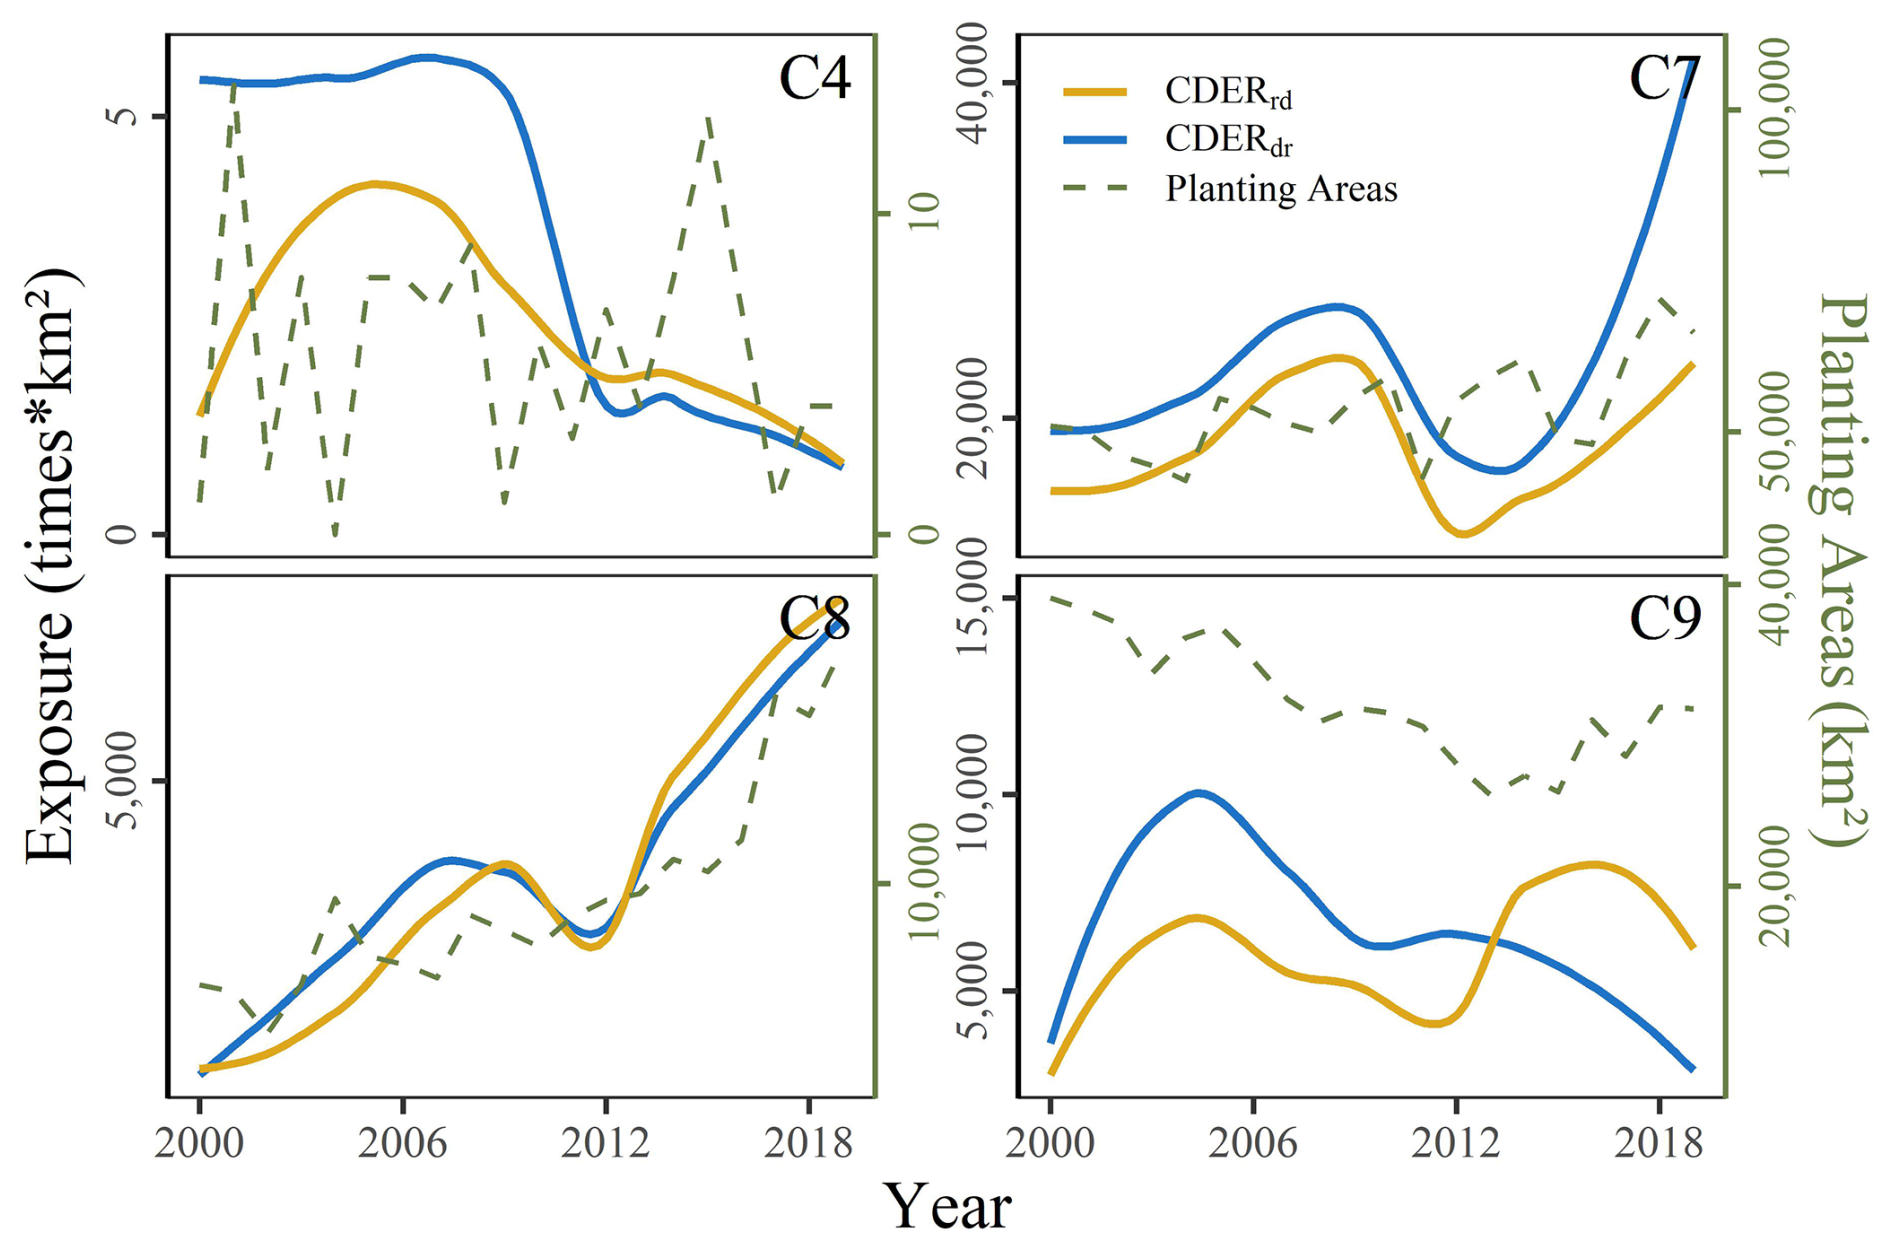
Figure 9Fitted curve of rice exposure risk during CDERrd in the nine agricultural regions (2000–2019). The yellow curve represents the annual exposure trend for CDERdr, the blue curve represents the annual exposure trend for CDERrd, while the green line shows the annual variation in planting area.
Figure 10 presents the fitting curves derived from wheat exposure data (2000–2019) across China's nine major agricultural regions. Regionally, C4 ranks first with a exposure index of 30 000, followed by C5 at 10 000, while other regions generally exhibit risks below 5000. The high-risk characteristics of C4 and C5, as China's core wheat production zones, show significant correlations with regional cultivation scales. Comparatively, CDERdr-induced exposures are nearly double those of CDERrd. Trend analysis reveals substantial differences between the two compound types: CDERdr exposure universally follow rise-decline patterns with peak years clustered around 2010, though specific timing varies. Conversely, CDERrd trends exhibit greater regional heterogeneity: C3, C5, C6, and C9 display decline-rise-decline-rise patterns (troughing around 2004, peaking near 2010, troughing again around 2014, then rebounding); C4, C7, and C8 show sustained declines, C7 experienced a brief rebound in 2013 before resuming its decline, whereas C4 rebounded after 2016 and has continued to climb since then; C2 demonstrates unique rise-decline-rise-decline fluctuations, peaking around 2004, troughing near 2007, rebounding to 2012 highs, then declining. At the same time, the relationship between wheat exposure and its planted area proves to be relatively complex. Specifically, the exposure of C3, C8, and C9 increases in tandem with expansions in planted area, whereas in C2, C4, C5, C6, and C7 the planted area remains essentially stable while exposure fluctuates markedly, showing no comparable trend. Particularly noteworthy is C1, where the planted area varies substantially, yet exposure has consistently remained at an extremely low level. These findings suggest that wheat exposure is governed primarily by intrinsic factors – such as the frequency of hazardous events – while planted area, though influential to some extent, plays a comparatively minor role.
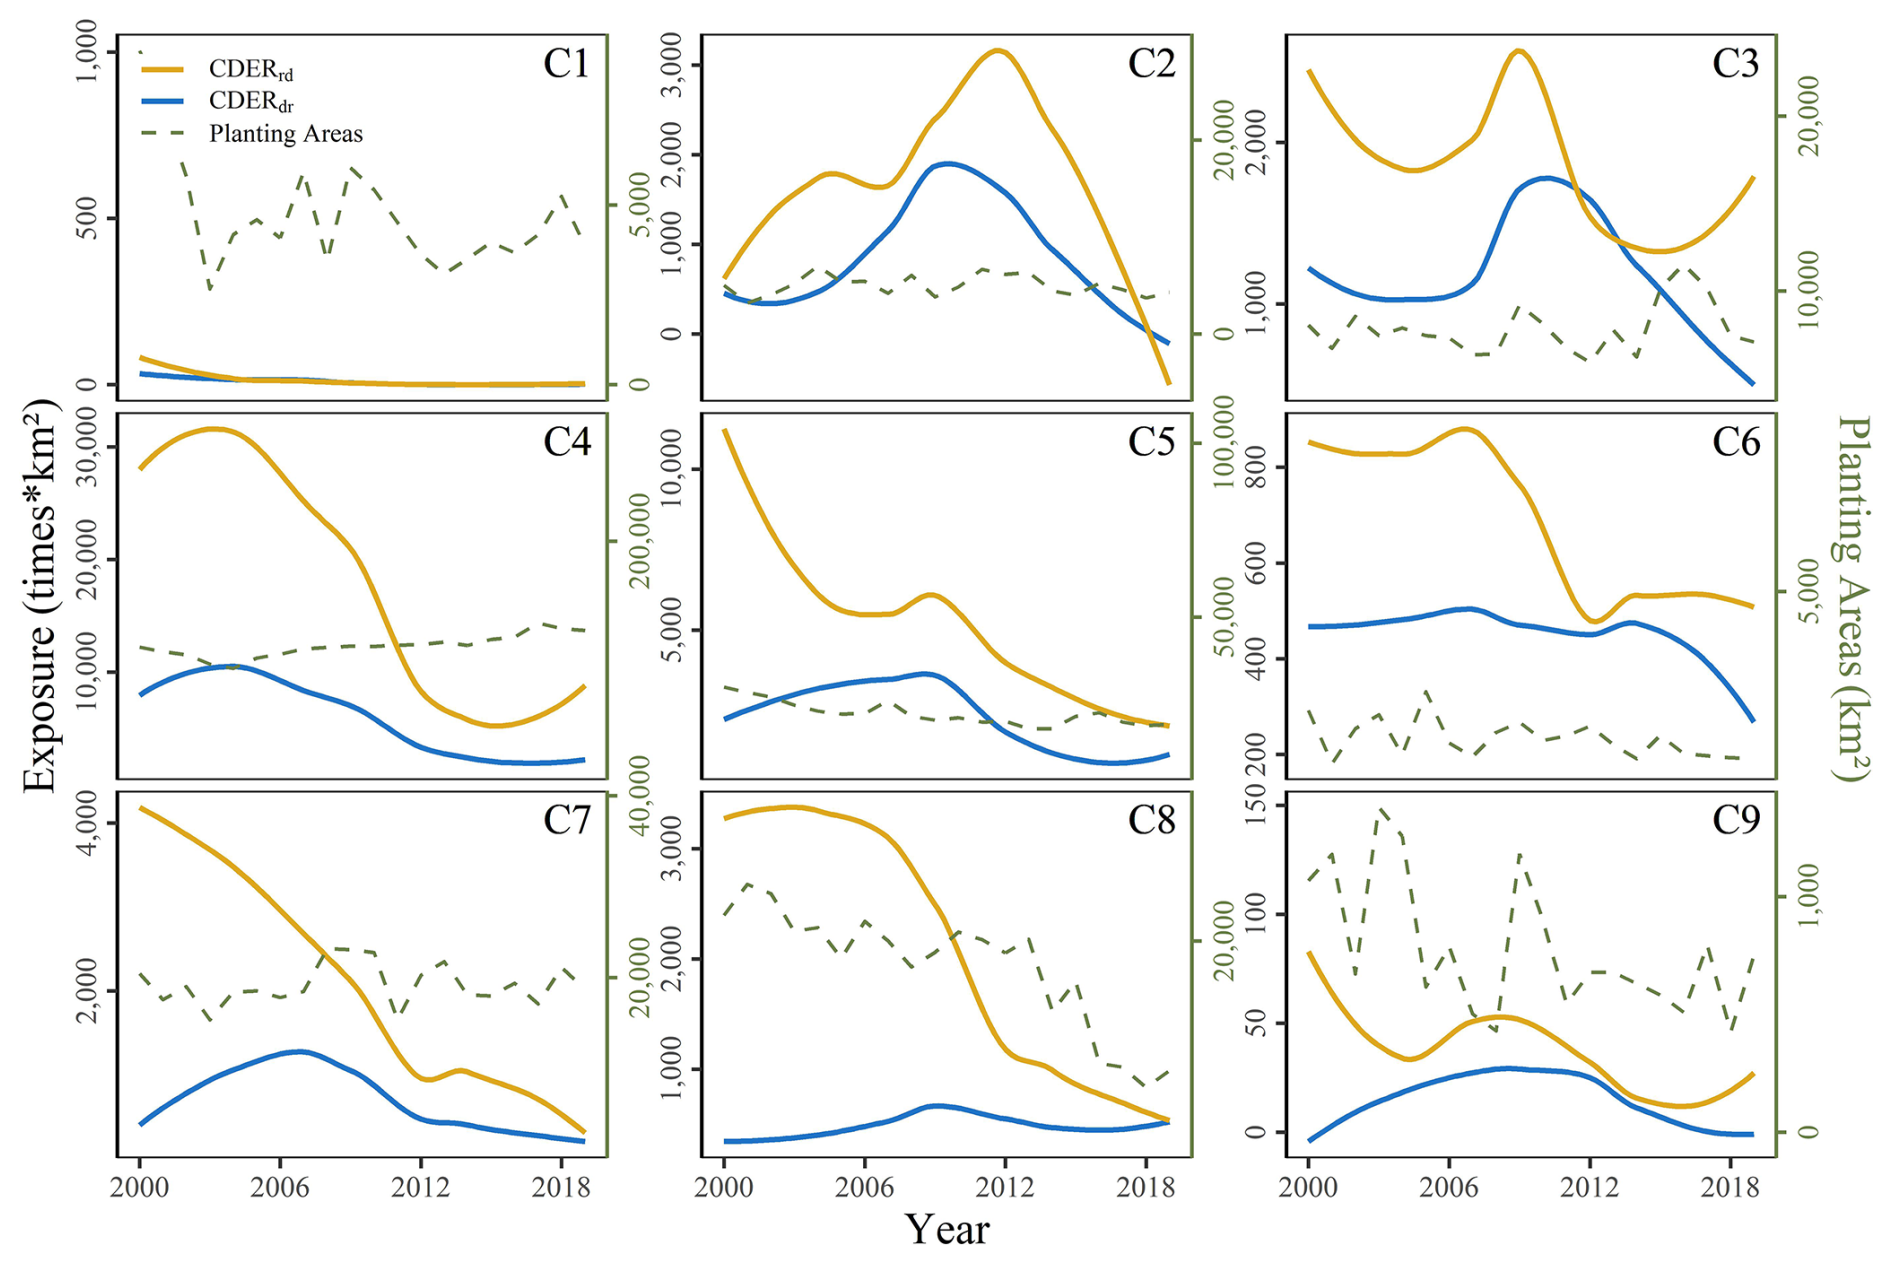
Figure 10Fitted curve of wheat exposure risk during CDERrd in the nine agricultural regions (2000–2019). The yellow curve represents the annual exposure trend for CDERdr, the blue curve represents the annual exposure trend for CDERrd, while the green line shows the annual variation in planting area of Spring wheat and winter wheat.
For maize and rice, CDERdr-induced exposure is significantly higher than that from CDERrd, whereas for wheat, CDERdr exposure is significantly lower than that from CDERrd. However, the double proportional relationship between exposure risks and affected areas of the two compound event types does not universally hold. The study reveals that agricultural regions with larger cultivation areas exhibit exposure ratios between CDERdr and CDERrd closer to the double proportion of their respective affected areas. This phenomenon stems from spatial non-overlap between compound disaster zones and major crop cultivation areas. As agricultural cultivation expands, spatial coupling between disaster-affected zones and croplands intensifies, driving progressive increases in exposure. Notably, green polylines reflect interannual variations in crop cultivation areas across regions. Combined analysis of cultivation area trends and exposure calculations reveals two primary scenarios: (1) inverse trends – exposure decrease despite cultivation area expansions, or increase despite area reductions; (2) asymmetric fluctuations – stable cultivation areas with volatile exposure risks, or stable exposure with fluctuating cultivation areas. Both scenarios demonstrate that interannual exposure variations primarily result from intrinsic changes in CDERdr characteristics rather than cultivation area adjustments.
4.1 Consistency Analysis of the Spatiotemporal Characteristics of CDER
Numerous studies have focused on the distribution patterns and impacts of drought-flood abrupt alternation events. These events share similarities with the CDERdr studied here, but they are typically approached from a hydrological perspective using runoff data, whereas our study focuses on the agricultural system using soil moisture data. Moderate rainfall following drought generally has a positive impact on agricultural production and the ecological environment. However, if drought abruptly turns into flooding, it can exacerbate soil erosion and other disasters, causing more severe impacts on crops and worsening water quality (Bi, 2022; Huang et al., 2019; Shi et al., 2022). In the field of CDERrd and CDERdr, previous studies have indicated that in the Yangtze River middle and lower reaches, the frequency of CDERdr is mainly concentrated in June each year, while the intensity shows certain fluctuations (Shen et al., 2018). In the Jianghuai-Huai River Basin, the onset of the rainy season in drought-prone and semi-humid regions is delayed by 1–2 months compared to that in humid regions, making the semi-humid and humid areas high-incidence regions for drought-flood abrupt alternation events (Xue et al., 2024). Additionally, studies in Fujian Province, China, have found that CDERrd occur more frequently in February, July, and August, while CDERdr have a higher occurrence rate from June to October (Zhang et al., 2018). These findings are highly consistent with our results, further validating the spatiotemporal distribution characteristics of compound events in these regions.
However, due to significant differences in the identification methods, definition criteria, and time scales used in different studies, some discrepancies inevitably exist in the results. Our study shows that CDERdr have significantly higher frequency and intensity than CDERrd, with values approximately twice as high. Yet one study using the Standardized Precipitation Evapotranspiration Index (SPEI) as an indicator of compound events found that the frequency and intensity of drought-to-flood and flood-to-drought events were comparable (Qiao et al., 2022). Moreover, several scholars have explored the correlation between drought-flood abrupt alternation events and complex climate factors (Bian, 2023; Wang et al., 2024), but the specific physical mechanisms behind these events are still under investigation, with no unified conclusions yet formed.
4.2 Uncertainty in the Impact of CDER on Crop Growth Stages
This study focuses on the maturity months of the three major grain crops and uses the monthly frequency of CDERrd and CDERdr, along with 1 km spatial resolution crop planting data, to characterize the exposure scenarios of the three major grain crops during their maturation periods in China's nine agricultural regions. Previous studies on crop exposure have mostly used annual time scales, such as those calculating exposure of population and farmland on a global scale for historical and future periods (2005 and 2085) (Tabari and Willems, 2023). However, disaster occurrences throughout the year do not always coincide with agricultural activities, leading to overestimation of crop exposure. Our study, which refines the exposure assessment to the crop maturity period, overcomes this limitation and provides a more accurate exposure profile.
Studies have shown that drought stress significantly affects crop yield, with varying impacts on different growth stages and species. For rice, drought during the reproductive stage causes a greater yield reduction compared to the early stages (Boonjung and Fukai et al., 1996). Similarly, wheat shows continuous yield reductions throughout its growth cycle. Maize is also more severely affected during the reproductive stage, with early-stage stress causing lasting damage to photosynthetic capacity (Daryanto et al., 2016; Ma et al., 2017). Overall, maize appears to be more sensitive to drought than wheat, with yield reductions of 39.3 % and 20.6 %, respectively, under 40 % water reduction (Daryanto et al., 2016). Therefore, failing to consider the sensitivity of different growth stages of crops to compound drought and extreme rainfall events can lead to overestimation or underestimation of risks. We suggest that future research should focus on designing experiments or other forms of investigation to explore the sensitivity of different growth stages of the three major grain crops to compound disasters. Based on this, key growth stages should be identified to incorporate the vulnerability of the affected bodies into more refined exposure risk studies.
4.3 Increase in CDER Events under Future Climate Change and Adaptation Strategies
Analysis of our results indicates that CDER events have increased over the study period and are concentrated in the northwest, southwest and northern agricultural regions. This pattern reflects broader climate processes: a warmer atmosphere can hold more moisture, leading to more intense rainfall, while rising temperatures also heighten evaporation and soil drying. Such a combination intensifies the alternation between drought and flooding and exemplifies the “wet-gets-wetter, dry-gets-drier” trend. The IPCC warns that compound extremes are likely to become more frequent as the climate warms and that concurrent heatwaves and droughts will intensify. In East Asia, summer monsoon rainfall has become heavier and more variable in recent decades, and heavy rain along the Meiyu front is occurring more often due to changes in moisture convergence and circulation (Steensen et al., 2025).
Given these projections, adaptation strategies are essential. Remote-sensing research shows that combining soil-moisture and vegetation indices can provide agricultural drought warnings up to 2 months in advance, highlighting the need to expand soil-moisture monitoring and early warning systems in high-risk regions. Our study showed that maize and wheat face higher exposure risks than rice, underscoring the vulnerability of certain crops to these events. Improving early warning systems would help farmers and authorities prepare for abrupt shifts from drought to extreme rainfall. Complementary measures include breeding crop varieties tolerant to both drought and waterlogging, adopting precision agriculture and efficient irrigation, and developing weather-index insurance and other risk-sharing instruments to spread losses. National and regional climate-adaptation plans should explicitly account for compound extremes, recognising that uncertainties remain in the physical mechanisms driving CDER and the sensitivity of different crop growth stages. Ongoing research into these mechanisms and the vulnerability of crops will be vital for designing robust strategies to maintain food security in a changing climate.
This study defines compound drought and extreme rainfall events, including CDERdr and CDERrd, and analyzes their spatiotemporal distribution in China's nine major agricultural regions. High-intensity CDERrd are concentrated in the north, especially Northeast China and Inner Mongolia, while CDERdr are widespread in the northeast and south, particularly South China and the Jianghuai region. CDERdr occur with higher frequency and intensity, affecting up to 20 % of the area, compared to 10 % for CDERrd. Both event types are most prevalent in summer, with regional differences observed in annual affected area changes, especially in the Northeast, Inner Mongolia, Great Wall, Gansu-Xinjiang, Huang-Huai-Hai, and Loess Plateau regions.
The study further refines the calculation of exposure to compound events for maize, rice, and wheat during their crop maturity periods. Results show significant regional differences in disaster risk, with C8 facing the highest risk for all crops, while regions like C1, C2, and C6 experience lower risks. Among the crops, wheat faces the highest risk, followed by maize, while rice has the lowest exposure due to limited planting areas. Meanwhile interannual exposure variations primarily result from intrinsic changes in characteristics rather than cultivation area adjustments. The risk evolution across regions follows a common pattern of rising and then declining, with a peak around 2010, coinciding with higher frequencies and intensities of compound events.
Data are available from the following sources:
-
China 1 km Soil Moisture Daily Dataset (2000–2022) based on station observations, National Tibetan Plateau Data Center (https://cstr.cn/18406.11.Terre.tpdc.272415, last access: 8 October 2024);
-
China Daily Precipitation Dataset (1961–2022; Hu and Miao 2023), CHM_PRE V2: An upgraded high-precision gridded precipitation dataset for the Chinese mainland considering spatial autocorrelation and covariates, National Tibetan Plateau/Third Pole Environment Data Center (https://doi.org/10.11888/Atmos.tpdc.300523);
-
National Three Major Grain Crops 1 km Planting Distribution Dataset (2000–2019; https://doi.org/10.12199/nesdc.ecodb.rs.2022.016; Yuchuan and Zhang, 2022; https://cstr.cn/15732.11.nesdc.ecodb.rs.2022.016, last access: 2 November 2024).
HC contributed to the original draft preparation, review and editing of the manuscript, as well as conceptualization, data curation, investigation, methodology development, and validation. QY participated in reviewing and editing the manuscript, conceptualization, and visualization. WY was involved in drafting and editing the manuscript, data curation, and methodology. LZ contributed to manuscript review and editing, funding acquisition, project administration, and resource provision.
The contact author has declared that none of the authors has any competing interests.
Publisher's note: Copernicus Publications remains neutral with regard to jurisdictional claims made in the text, published maps, institutional affiliations, or any other geographical representation in this paper. While Copernicus Publications makes every effort to include appropriate place names, the final responsibility lies with the authors. Views expressed in the text are those of the authors and do not necessarily reflect the views of the publisher.
This article is part of the special issue “Methodological innovations for the analysis and management of compound risk and multi-risk, including climate-related and geophysical hazards (NHESS/ESD/ESSD/GC/HESS inter-journal SI)”. It is not associated with a conference.
This research was funded by Third Xinjiang Scientific Expedition Program (2022xjkk0601), National Natural Science Foundation of China (42471085 and U22B2011), Natural Science Foundation of Hubei Province (2023AFB823). We acknowledge Esri's ArcGIS® software for map generation.
This research has been supported by the National Natural Science Foundation of China (grant nos. 42471085 and U22B2011) and the Natural Science Foundation of Hubei Province (grant no. 2023AFB823).
This paper was edited by Marleen de Ruiter and reviewed by Huicong Jia and two anonymous referees.
AghaKouchak, A., Cheng, L., Mazdiyasni, O., and Farahmand, A.: Global warming and changes in risk of concurrent climate extremes: Insights from the 2014 California drought, Geophysical Research Letters, 41, 8847–8852, https://doi.org/10.1002/2014GL062308, 2014.
Barriopedro, D., Fischer, E. M., Luterbacher, J., Trigo, R. M., and García-Herrera, R.: The Hot Summer of 2010: Redrawing the Temperature Record Map of Europe, Science, 332, 220–224, https://doi.org/10.1126/science.1201224, 2011.
Bi, W.: Soil phosphorus loss increases under drought-flood abrupt alternation in summer maize planting area, Agricultural Water Management, 262, 107426, https://doi.org/10.1016/j.agwat.2021.107426, 2022.
Bian, Q.: Study on the sharp turn of drought and flood in summer and atmospheric circulation characteristics in typical years in Liangshan Prefectur, Journal of Mountain Meteorology, 47, 31–37, 2023 (in Chinese).
Boonjung, H., and Fukai, S.: Effects of soil water deficit at different growth stages on rice growth and yield under upland conditions. 2. Phenology, biomass production and yield, Field Crops Res., 48, 47–55, https://doi.org/10.1016/0378-4290(96)00039-1, 1996.
Bongaarts, J.: FAO, IFAD, UNICEF, WFP and WHOThe State of Food Security and Nutrition in the World 2020. Transforming food systems for affordable healthy diets FAO, 2020, 320 p., Population and Development Rev, 47, 558–558, https://doi.org/10.1111/padr.12418, 2021.
Borrelli, P., Robinson, D. A., Fleischer, L. R., Lugato, E., Ballabio, C., Alewell, C., Meusburger, K., Modugno, S., Schütt, B., Ferro, V., Bagarello, V., Oost, K. V., Montanarella, L., and Panagos, P.: An assessment of the global impact of 21st century land use change on soil erosion, Nat. Commun., 8, 2013, https://doi.org/10.1038/s41467-017-02142-7, 2017.
Calvin, K., Dasgupta, D., Krinner, G., et al.: IPCC, 2023: Climate Change 2023: Synthesis Report. Contribution of Working Groups I, II and III to the Sixth Assessment Report of the Intergovernmental Panel on Climate Change, edited by: Core Writing Team, Lee, H., and Romero, J., IPCC, Geneva, Switzerland., Intergovernmental Panel on Climate Change (IPCC), https://doi.org/10.59327/IPCC/AR6-9789291691647, 2023.
Caplan, J. S., Giménez, D., Hirmas, D. R., Brunsell, N. A., Blair, J. M., and Knapp, A. K.: Decadal-scale shifts in soil hydraulic properties as induced by altered precipitation, Sci. Adv., 5, eaau6635, https://doi.org/10.1126/sciadv.aau6635, 2019.
Daryanto, S., Wang, L., and Jacinthe, P.-A.: Global Synthesis of Drought Effects on Maize and Wheat Production, PLoS ONE, 11, e0156362, https://doi.org/10.1371/journal.pone.0156362, 2016.
Dickinson, C., Aitsi-Selmi, A., Basabe, P., Wannous, C., and Murray, V.: Global Community of Disaster Risk Reduction Scientists and Decision Makers Endorse a Science and Technology Partnership to Support the Implementation of the Sendai Framework for Disaster Risk Reduction 2015–2030, Int. J. Disaster Risk Sci., 7, 108–109, https://doi.org/10.1007/s13753-016-0080-y, 2016.
Fang, Z., Morales, A. B., Wang, Y., and Lombardo, L.: Climate change has increased rainfall-induced landslide damages in central China, International Journal of Disaster Risk Reduction, 119, 105320, https://doi.org/10.1016/j.ijdrr.2025.105320, 2025.
Fu, J., Jian, Y., Wang, X., Li, L., Ciais, P., Zscheischler, J., Wang, Y., Tang, Y., Müller, C., Webber, H., Yang, B., Wu, Y., Wang, Q., Cui, X., Huang, W., Liu, Y., Zhao, P., Piao, S., and Zhou, F.: Extreme rainfall reduces one-twelfth of China's rice yield over the last two decades, Nat. Food, 4, 416–426, https://doi.org/10.1038/s43016-023-00753-6, 2023.
Goebel, M.-O., Bachmann, J., Reichstein, M., Janssens, I. A., and Guggenberger, G.: Soil water repellency and its implications for organic matter decomposition – is there a link to extreme climatic events?, Global Change Biology, 17, 2640–2656, https://doi.org/10.1111/j.1365-2486.2011.02414.x, 2011.
Hao, Z., Hao, F., Singh, V. P., and Zhang, X.: Changes in the severity of compound drought and hot extremes over global land areas, Environ. Res. Lett., 13, 124022, https://doi.org/10.1088/1748-9326/aaee96, 2018.
Hu, J., and Miao, C.: CHM_PRE V2: An upgraded high-precision gridded precipitation dataset for the Chinese mainland considering spatial autocorrelation and covariates, National Tibetan Plateau/Third Pole Environment Data Center [data set], https://doi.org/10.11888/Atmos.tpdc.300523, 2023.
Huang, J., Hu, T., Yasir, M., Gao, Y., Chen, C., Zhu, R., Wang, X., Yuan, H., and Yang, J.: Root growth dynamics and yield responses of rice (Oryza sativa L.) under drought – Flood abrupt alternating conditions, Environmental and Experimental Botany, 157, 11–25, https://doi.org/10.1016/j.envexpbot.2018.09.018, 2019.
Hui, H., Peslier, A. H., Zhang, Y., and Neal, C. R.: Water in lunar anorthosites and evidence for a wet early Moon, Nature Geosci., 6, 177–180, https://doi.org/10.1038/ngeo1735, 2013.
Jayaraman, P., Jones, E. C., Stewart, H. L., and McCurdy, S.: The relationship of prior flood experience to posttraumatic stress and depression in minority communities after Hurricane Harvey, International Journal of Disaster Risk Reduction, 117, 105178, https://doi.org/10.1016/j.ijdrr.2025.105178, 2025.
Jin, S.: Chinese Wheat Cultivation, China Agriculture Press, ISBN 16144.1091, 1961 (in Chinese).
Lal, R.: Restoring Soil Quality to Mitigate Soil Degradation, Sustainability, 7, 5875–5895, https://doi.org/10.3390/su7055875, 2015.
Leonard, M., Westra, S., Phatak, A., Lambert, M., Van Den Hurk, B., McInnes, K., Risbey, J., Schuster, S., Jakob, D., and Stafford-Smith, M.: A compound event framework for understanding extreme impacts, WIREs Climate Change, 5, 113–128, https://doi.org/10.1002/wcc.252, 2014.
Lesk, C., Anderson, W., Rigden, A., Coast, O., Jägermeyr, J., McDermid, S., Davis, K. F., and Konar, M.: Compound heat and moisture extreme impacts on global crop yields under climate change, Nat. Rev. Earth Environ., 3, 872–889, https://doi.org/10.1038/s43017-022-00368-8, 2022.
Li, Y., Yang, X., Ye, Q., and Huang, W.: Variation characteristics of rice water requirement in middle and lower reaches of Yangtze River during 1961–2007, Transactions of the CSAE, 27, 175–183, https://doi.org/10.3969/j.issn.1002-6819.2011.09.031, 2011 (in Chinese).
Liu, Y., Chen, Q., Ge, Q., and Dai, J.: Spatiotemporal differentiation of changes in wheat phenology in China under climate change from 1981 to 2010, Sci. Sin.-Terrae, 61, 888–898, https://doi.org/10.1360/N072017-00100, 2018 (in Chinese).
Ma, J., Li, R., Wang, H., Li, D., Wang, X., Zhang, Y., Zhen, W., Duan, H., Yan, G., and Li, Y.: Transcriptomics Analyses Reveal Wheat Responses to Drought Stress during Reproductive Stages under Field Conditions, Front. Plant. Sci., 8, 592, https://doi.org/10.3389/fpls.2017.00592, 2017.
Meng, C., Dong, Z., Wang, Y., Zhang, Y., and Zhong, D.: Evolution characteristics of drought-flood abrupt alternation events in Yangtze River basin and its socio-economic exposure, Journal of Hydroelectric Engineering, 43, 34–49, https://doi.org/10.11660/slfdxb.20240404, 2024 (in Chinese).
Meteorological Publishing House: China Meterological Administration. Yearbook of Meteorological Disasters in China, ISBN 7-5029-5446-8, 2012 (in Chinese).
Murthy, C. S., Laxman, B., and Sesha Sai, M. V. R.: Geospatial analysis of agricultural drought vulnerability using a composite index based on exposure, sensitivity and adaptive capacity, International Journal of Disaster Risk Reduction, 12, 163–171, https://doi.org/10.1016/j.ijdrr.2015.01.004, 2015.
Qiao, Y., Xu, W., Meng, C., Liao, X., and Qin, L.: Increasingly dry/wet abrupt alternation events in a warmer world: Observed evidence from China during 1980–2019, International Journal of Climatology, 42, 6429–6440, https://doi.org/10.1002/joc.7598, 2022.
Quansah, C.: The Effect of Soil Type, Slope, Rain Intensity and their Interactions on Splash Detachment and Transport, Journal of Soil Science, 32, 215–224, https://doi.org/10.1111/j.1365-2389.1981.tb01701.x, 1981.
Ruess, P. J., Khalid, Z., Ferreira, C. M., and Kinter, J. L.: Social and environmental justice implications of flood-related road closures in Virginia, International Journal of Disaster Risk Reduction, 117, 105123, https://doi.org/10.1016/j.ijdrr.2024.105123, 2025.
Schillerberg, T. A. and Tian, D.: Global Assessment of Compound Climate Extremes and Exposures of Population, Agriculture, and Forest Lands Under Two Climate Scenarios, Earth's Future, 12, e2024EF004845, https://doi.org/10.1029/2024EF004845, 2024.
Shen, B., Zhang, S., Yang, H., Wang, K., and Feng, G.: Analysis of characteristics of a sharp turn from drought to flood in the middle and lower reaches of the Yangtze River in spring and summer in 2011, Acta Phys. Sin., 61, 109202–109202, https://doi.org/10.7498/aps.61.109202, 2012 (in Chinese).
Shen, S., Cheng, C., Yang, J., and Yang, S.: Visualized analysis of developing trends and hot topics in natural disaster research, PLoS ONE, 13, e0191250, https://doi.org/10.1371/journal.pone.0191250, 2018.
Shi, W., Huang, S., Zhang, K., Liu, B., Liu, D., Huang, Q., Fang, W., Han, Z., and Chao, L.: Quantifying the superimposed effects of drought-flood abrupt alternation stress on vegetation dynamics of the Wei River Basin in China, Journal of Hydrology, 612, 128105, https://doi.org/10.1016/j.jhydrol.2022.128105, 2022.
Steensen, B. M., Myhre, G., Hodnebrog, Ø., and Fischer, E.: Future increase in European compound events where droughts end in heavy precipitation, Npj Clim. Atmospheric Sci., 8, 267, https://doi.org/10.1038/s41612-025-01139-0, 2025.
Sun, J., Su, B., Wang, D., Huang, J., Wang, B., Dai, R., and Jiang, T.: Temporospatial characteristics of drought-flood abrupt alteration events in China, Water Resources and Hydropower Engineering, 55, 13–23, https://doi.org/10.13928/j.cnki.wrahe.2024.08.002, 2024 (in Chinese).
Tabari, H. and Willems, P.: Global risk assessment of compound hot-dry events in the context of future climate change and socioeconomic factors, Npj Clim. Atmos. Sci., 6, 74, https://doi.org/10.1038/s41612-023-00401-7, 2023.
Van Winsen, F., De Mey, Y., Lauwers, L., Van Passel, S., Vancauteren, M., and Wauters, E.: Cognitive mapping: A method to elucidate and present farmers' risk perception, Agricultural Systems, 122, 42–52, https://doi.org/10.1016/j.agsy.2013.08.003, 2013.
Vicente-Serrano, S. M., Quiring, S. M., Peña-Gallardo, M., Yuan, S., and Domínguez-Castro, F.: A review of environmental droughts: Increased risk under global warming?, Earth-Science Reviews, 201, 102953, https://doi.org/10.1016/j.earscirev.2019.102953, 2020.
Walz, Y., Janzen, S., Narvaez, L., Ortiz-Vargas, A., Woelki, J., Doswald, N., and Sebesvari, Z.: Disaster-related losses of ecosystems and their services. Why and how do losses matter for disaster risk reduction?, International Journal of Disaster Risk Reduction, 63, 102425, https://doi.org/10.1016/j.ijdrr.2021.102425, 2021.
Wang, S., Tian, H., Ding, X., Xie, W., and Tao, Y.: Climate Characteristics of Precipitation and Phenomenon of Drought-flood Abrupt Alternation during Main Flood Season in Huaihe River Basin, Chinese Journal of Agrometeorology, 30, 31, ISBN 1000-6362, 2009.
Wang, X., Li, L., Ding, Y., Xu, J., Wang, Y., Zhu, Y., Wang, X., and Cai, H.: Adaptation of winter wheat varieties and irrigation patterns under future climate change conditions in Northern China, Agricultural Water Management, 243, 106409, https://doi.org/10.1016/j.agwat.2020.106409, 2021.
Wang, X., Hua, X., and Tian, F.: Study on the Spatiotemporal Variation Characteristics and Driving Forces of Drought–Flood Abrupt Alternation in Hainan Island from 1951 to 2020, Climatic and Environmental Research, 30, 1–14, https://doi.org/10.3878/j.issn.1006-9585.2024.23115, 2024 (in Chinese).
Wauters, E., Van Winsen, F., De Mey, Y., and Lauwers, L.: Risk perception, attitudes towards risk and risk management: evidence and implications, Agric. Econ. – Czech, 60, 389–405, https://doi.org/10.17221/176/2013-AGRICECON, 2014.
Xue, L., Zhang, Y., and Liu, Y.: Comparative study on change characteristics of drought-flood abrupt alternation in arid and humid zones, Water Resources Protection, 40, 1–8, 2024 (in Chinese).
Yang, T. and Liu, W.: A General Overview of the Risk-Reduction Strategies for Floods and Droughts, Sustainability, 12, 2687, https://doi.org/10.3390/su12072687, 2020.
Yuchuan, L. and Zhang, Z.: National Three Major Grain Crops 1 km Planting Distribution Dataset (DS/OL), National Ecological Science Data Center [data set], https://doi.org/10.12199/nesdc.ecodb.rs.2022.016, 2022.
Zhang, J., Zhang, S., Cheng, M., Jiang, H., Zhang, X., Peng, C., Lu, X., Zhang, M., and Jin, J.: Effect of Drought on Agronomic Traits of Rice and Wheat: A Meta-Analysis, IJERPH, 15, 839, https://doi.org/10.3390/ijerph15050839, 2018.
Zhao, Y., He, F., He, G., and Li, H.: Ten insights and reflections on the planning and construction of the national water network, China Water Resources, 23, 37–48, 2023.
Zscheischler, J., Martius, O., Westra, S., Bevacqua, E., Raymond, C., Horton, R. M., Van Den Hurk, B., AghaKouchak, A., Jézéquel, A., Mahecha, M. D., Maraun, D., Ramos, A. M., Ridder, N. N., Thiery, W., and Vignotto, E.: A typology of compound weather and climate events, Nat. Rev. Earth Environ., 1, 333–347, https://doi.org/10.1038/s43017-020-0060-z, 2020.