the Creative Commons Attribution 4.0 License.
the Creative Commons Attribution 4.0 License.
 | 27 Nov 2025
Multi-hazards in Scandinavia: impacts and risks from compound heatwaves, droughts and wildfires
Gwendoline Ducros
Timothy Tiggeloven
Anne Sophie Daloz
Nina Schuhen
Judith Claassen
Marleen C. de Ruiter
In the summer of 2018, large parts of Scandinavia faced record-breaking heat and drought, leading to increased mortality, agricultural water shortages, hydropower deficits, and higher energy prices. The 2018 heatwave coupled with droughts leading to wildfires are described as multi-hazard events, defined as compounding, cascading or consecutive events. Climate change is driving an increase in heat-related events and, subsequently, shows the necessity to prepare for such hazards, and to assess suitable mitigation strategies. To better understand the interplay of heatwaves, droughts, and wildfires across sectors, and to support disaster risk management in multi-hazard settings, we analyze their occurrence in Scandinavia using a spatial assessment of compound events. To assess their potential direct and indirect economic impacts we use the global Computable General Equilibrium (CGE) model GRACE (Global Responses to Anthropogenic Changes in the Environment) and the 2018 heatwave-drought period as a baseline to map multi-hazard risk. We find that multi-hazard events are pronounced in the summer months in Scandinavia and the 2018 multi-hazard events did not occur in isolation. The 2018 multi-hazard events led to a 0.08 % GDP drop in Scandinavia, with forestry experiencing a 3.04 % decline, affecting agriculture, electricity, and forestry exports, which dropped by 29.39 %, impacting Europe's trade balance. This research shows the importance of ripple effects of multi-hazards, specifically compound heatwave, drought and wildfire, and that forest management and a better understanding of their direct and indirect societal impacts are vital to reducing the risks of heat-related multi-hazards in vulnerable areas.
- Article
(4380 KB) - Full-text XML
- BibTeX
- EndNote


In the summer of 2018, in particular over the period May-August, large parts of Scandinavia experienced record-breaking temperatures, extreme drought and wildfires (Bakke et al., 2020). These climate conditions were linked to severe repercussions on human health and the ecosystem, leading to an increased mortality rate during that period (Åström et al., 2019), water shortages that impacted agricultural areas (Buras et al., 2020), as well as hydropower energy deficit and an increase in energy prices (NVE, 2018). The temperature anomalies experienced during the months of May to July were found to be enhanced by human-induced climate change (Wilcke et al., 2020), amongst other factors (Kueh and Lin, 2020).
Heat-related events are expected to increase in frequency, severity, and intensity in the future as a result of anthropogenic climate change (IPCC, 2021). Anthropogenic climate change is also predicted to intensify fire and drought frequency in boreal ecosystems (Girardin et al., 2010; IPCC, 2021) with winter warming expected to increase in boreal forests due to decreasing snow cover and albedo (IPCC, 2021). Spatial patterns of snow cover already show a declining trend in Scandinavia (Brown and Mote, 2008) and the northern area of Scandinavia even sees a projected increase in temperature twice as much as average global warming in winter (Christensen et al., 2022).
The 2018 heatwave coupled with droughts leading to wildfires events are described as multi-hazard events which can occur as compound events if they happen simultaneously, or consecutive events if they occur one after the other (Sutanto et al., 2020; de Ruiter et al., 2020). This study will focus on compound events, defined here as two or more extreme events occurring at the same time (same day and same region), following the definition from Sutanto et al., 2020. Specific compound events can be explained by feedback mechanisms, where interactions between climate processes can lead to a positive feedback loop and exacerbate the effects of multiple hazards (IPCC 2012; Zscheischler and Seneviratne, 2017; Raymond et al., 2020; AghaKouchak et al., 2020). Tilloy et al. (2019) provided a thorough overview of different quantification methods used in the literature for multi-hazard interactions, classifying approaches in stochastic, empirical, and mechanistic methods. In recent years, compound studies have increasingly made use of multivariate-statistical modeling techniques (Couasnon et al., 2020; Mazdiyasni and AghaKouchak, 2015; Paprotny et al., 2020; Moftakhari et al., 2019; Wahl et al., 2015).
The projected increase in heat-related events shows the necessity to prepare for such hazards, and to assess suitable adaptation measures, as is also evident in Scandinavia (Spinoni et al., 2018; Spensberger et al., 2020). Although the probability of compound events is predicted to increase with the rise in global temperature (IPCC, 2021), mitigation and adaptation measures for multi-hazard compound events have only recently begun to be addressed. Frameworks such as the Sendai Framework for Disaster Risk Reduction (SFDRR) have been adopted by the United Nations with the goal of decreasing disaster risk and increasing resilience, underlining the importance of looking at multi-hazard risk when implementing Disaster Risk Reduction (DRR) measures (UNDRR, 2015). Several studies have emphasized that adaptation strategies and policies are more effective when taking into account multiple stressors (Scolobig et al., 2017; IPCC, 2012; de Ruiter et al., 2021; Schipper, 2020; Berrang-Ford et al., 2021). Research has found that certain adaptation measures put into place for a specific hazard might negatively impact adaptation measures against another hazard (de Ruiter et al., 2021), such as the potential of flood DRR measures to increase the risk of droughts and vice versa (Ward et al., 2020). Accounting for multi-hazards in DRR measures decreases the probability that an adaptation measure designed for a singular hazard increases the risk for another (Zscheischler and Seneviratne, 2017; Raymond et al., 2020; AghaKouchak et al., 2020).
Moreover, heat-related events can have severe direct and indirect economic impacts on sectors such as agricultural or energy production. For example, annual economic losses caused by droughts are currently estimated at around EUR 9 billion for the EU and the UK, with agriculture amounting to 30 %–60 % of losses and the energy sector to 22 %–48 % (European Commission: Joint Research Centre, 2020). Nearing the end of the 21st century, these losses are estimated between EUR 25 billion and EUR 45 billion, depending on the climate scenario, and with no adaptations put into place (European Commission: Joint Research Centre, 2020). Additionally, socio-economic impacts of compound events may surpass those predicted by examining each driver individually (Matano et al., 2021). With this perspective it is thus crucial to include multi-hazard risk when analyzing economic impacts of heat-related events.
As the probability of occurrence of similar events of the 2018 multi-hazard in Scandinavia is increasing with climate change (Wilcke et al., 2020), it is crucial to better understand the interplay of multi-hazard risk of heatwaves, droughts and wildfires in a multi-sectoral context with economic ripple effects. In this paper, we assess the occurrence of these hazards using a spatial analysis of compound drought, wildfire, and heatwave events from 2000 to 2018 in Scandinavia (here Finland, Norway and Sweden). Secondly, to assess their potential direct and indirect economic impacts we use the global Computable general equilibrium (CGE) model GRACE (Global Responses to Anthropogenic Changes in the Environment) and the 2018 heatwave-drought period as a baseline. The macroeconomic model provides a comprehensive and regionally relevant assessment of how sector-specific shocks from the 2018 multi-hazard events in Scandinavia propagated through the economy, revealing both direct and indirect impacts. CGE models or partial equilibrium models are commonly used to evaluate the economic impacts of changes in agriculture and food production (Ntombela et al., 2017; Manuel et al., 2021; Solomon et al., 2021).
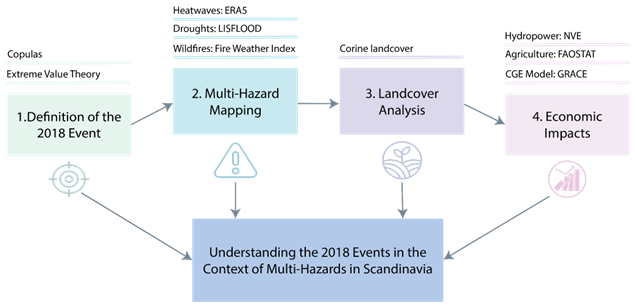
To assess and better understand the multi-hazard risk and impacts in Scandinavia during the 2018 multi-hazard event, we first identify past trends and patterns, as these provide essential context for evaluating the event's economic impacts. Our methodology includes the following steps: First, we define historical multi-hazard events using the ERA5 global climate and weather reanalysis (Hersbach et al., 2023) and a copula function describing the correlation structure between key variables (Sect. 2.1). The second part (Sect. 2.2) focuses on mapping multi-hazard risk, for which we will map different combinations of compound heatwave, droughts and wildfires events over the period 2000–2018, and, from this, map the 90th percentile of the compound multi-hazards. This will help visualize the spatial distribution of areas at high risk of multi-hazard events. Section 2.3 maps out Scandinavian land cover using data from the Copernicus Land Monitoring Service, and uses the multi-hazard risk maps and land cover maps to map the main land cover types at highest risk of multi-hazards. Lastly, Sect. 2.4 will cover the economic impacts of the 2018 multi-hazard event using GRACE. Together, these methods increase understanding of Scandinavian multi-hazard events in summer. The methods are illustrated in Fig. 1 below.
2.1 Definition of the 2018 multi-hazard event
We investigate the optimal objective definition of the heat wave and drought compound event that occurred across Europe in spring and summer 2018. As the area of interest is restricted to Northern European countries – namely Finland, Norway and Sweden – the domain is restricted to land masses of these three countries (below 67° N). The analysis is based on daily data from the ERA5 reanalysis during March–September 2018, while data for the same months between 1979 and 2023 is used to estimate climatological distributions.
To obtain the event definition, we adapt a procedure by Cattiaux and Ribes (2018), designed for single variable extreme events, to analyze compound events, here a combination of daily maximum surface temperature and daily total precipitation (Schuhen et al., 2025). The procedure is based on the maxime that the extreme nature of an event is best characterized by minimizing its rarity; this means in practice that we calculate the likelihood of occurrence p for the 2018 multi-hazard event and a large number of different event definitions, as described below. The minimum of these likelihoods then gives us the optimal event definition. Here, only the temporal event definition – in terms of its duration and timing – is of interest, as the spatial extent is fixed.
First, we average daily data over the entire time window of each event definition s, for each year in 1979–2023. To ensure a smoother and more robust estimation, these daily values are taken as the maximum (for temperature) and minimum (for precipitation) of a temporal neighborhood of 7 d on either side of the day of interest. From the 45 yearly values, the parameters of continuous climatological distributions are estimated, where we choose a Gaussian distribution N(μs,σs) for temperature and a generalized extreme value distribution GEV for precipitation.
Next, we combine these two marginal distributions to form a joint, bivariate distribution for temperature and precipitation by using a copula, which is a multivariate cumulative distribution function describing the correlation structure between the variables. In this case, we found that the symmetrical Frank copula is the best fit for our data set, by minimizing the Akaike Information Criteria across several copula families (as implemented in the R package VineCopula; Nagler et al., 2024). The copula parameters are determined using the inverse of the Kendall rank correlation coefficient. This approach allows us to select the marginal distributions and copula separately, thereby considerably simplifying the modelling process for the bivariate distribution.
Finally, the occurrence probability ρs of the compound heat (“higher than”) and drought (“lower than”) event, given the event definition s, can be calculated through the following equation based on Sklar's Theorem (Sklar, 1959):
with C denoting the copula function, u=FN(T) and v=FGEV(P) being the probability integral transforms of the marginal distributions, and being the temperature/precipitation thresholds in the year 2018. Once these probabilities are obtained for the whole range of potential dates and durations during March–September, it only remains to find their minimum and thus the optimal event definition.
2.2 Multi-hazard mapping of historical events
This study builds on and uses datasets previously generated by Sutanto et al. (2020) containing the required heatwave, drought and wildfire data that have been used for this analysis. Sutanto et al. (2020) analyzed drought, heatwave and wildfire events occurring in the months of June, July and August (JJA) from 1990 to 2018 at the pan-European scale. Weather data for heat waves was drawn from ERA5, soil moisture drought simulated through the LISFLOOD model, and wildfire estimated with the Fire Weather Index. They analyzed the frequency and spatial distribution of occurrences of these hazards, and created daily binary maps (0 indicating no risk, and 1 indicating a risk). This resulted in three hazard datasets of 2886 maps each (one map for each summer day of JJA over the period 1990–2018), which were provided for our analysis.
The Copernicus Land Monitoring Service inventories Scandinavian land cover starting in the year 2000. For consistency with the Corine Land Cover (CLC) datasets that are used in part 2.2, the study period for this research is thus 2000–2018. The hazard datasets were analyzed to create four compound hazards maps of the following combinations: drought and wildfire (DF), heatwave and wildfire (HF), heatwave and drought (HD), and drought, heatwave and wildfire (DHF) over the period 2000–2018. First, we developed maps indicating the percent of summer days at risk of the hazard combinations by adding for each hazard combination, the individual hazard maps together, and dividing by the amount of summer days over the period 1990–2018. To cover the study period, a subset was created from the period 1990–2018 to cover the period 2000–2018, for each hazard combination, and divided by the amount of summer days during the 2000–2018 period, which corresponds to 1656 summer days. The resulting maps indicated the percent of summer days at risk of each hazard combination.
To simplify the compound hazard maps, we calculated the 90th percentile of percent of days of each compound hazard map to produce binary compound risk maps, with 0 corresponding to no risk of a compound hazard combination, and 1 to a risk of a compound hazard combination. The above-mentioned percentile was chosen following Sutanto et al.'s (2020) calculations.
Lastly, compound hazard maps for the study area, Scandinavia, were generated by clipping the binary 90th percentile compound hazard maps with the region of Scandinavia, from Nuts-1 region maps provided by Eurostat, and extracting only the Scandinavian region.
2.3 Analysis of land cover type in areas at high risk of multi-hazard compound events
Next, we generated a land cover map of Scandinavia using data from the CORINE Land Cover (CLC) inventory provided by the Copernicus Land Monitoring Service. The raster files over the period 2000–2018 and CLC legend were used to classify land cover types, as seen in annex 1. Figure 2 below shows the percentage share of land cover in Scandinavia for the year 2018.
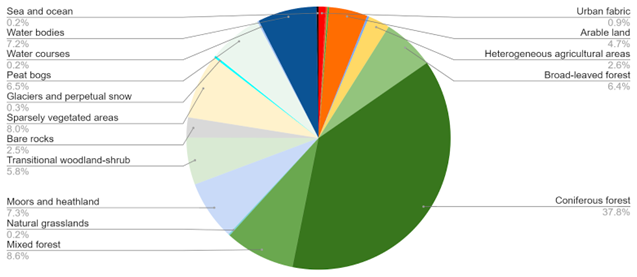
As seen in Fig. 2, coniferous forests cover the majority of Scandinavia, accounting for 37.8 % of the total surface area and mostly in Sweden and Finland where land cover is largely dominated by coniferous forests, as expected due to their economic reliance on the timber industry. Mixed forests and sparsely vegetated areas are the next most extensive land cover, accounting for 8.6 % and 8.0 % of the total surface area, respectively. In contrast to Sweden and Finland, Norway has a very high proportion of this sparsely vegetated area, and broad-leaved forests (6.4 % of Scandinavia) are also mainly found in Norway and along the Norwegian-Swedish border. Arable land and heterogeneous agricultural areas account for respectively 4.7 % and 2.6 % of total land cover. Urban fabric only accounts for 0.9 % of the total surface area in the region whilst the vast majority of arable land is located in Southern Sweden and Finland.
In order to produce the main land cover types affected by the studied compound hazard combinations, the multi-hazard maps of Scandinavia from Sect. 2.2.2 were overlaid with the land cover map of Scandinavia generated in Sect. 2.2.3, using the multi-hazard maps as references for resolution. Subsequently, we derived the amount of land affected by each hazard combination per land cover type with spatial analysis.
2.4 Assessing economic impacts of multi-hazard risk in Scandinavia
We define here direct economic loss as “monetary value of total or partial destruction of physical assets existing in the affected area” and indirect economic loss as ”a decline in economic value added as a consequence of direct economic loss and/or human and environmental impacts” (UNDRR, 2017).
2.4.1 Economic Model
To assess the economic impacts of multi-hazard risk, we employ a multi-region, multi-sector computable general equilibrium (CGE) model, Global Responses to Anthropogenic Changes in the Environment (GRACE) (Aaheim et al., 2018). The GRACE model follows the standard assumptions in most CGE models, including assumptions for producers, Regional Households (RH) and the market dynamics. In this paper, the parameters in the GRACE model are calibrated using the global social accounting data in 2014 in the Global Trade Analysis Project (GTAP) database version 10 (Aguiar et al., 2019). In order to address the impacts of the 2018 Scandinavia multi-hazards within the European area, we divided the global region into 33 European countries1 and the rest of the world. Each country and region is further divided into 11 sectors: agriculture, forestry, fishery, manufacturing, services, transportation, crude oil, coal, gas, refinery, and electricity. The static version of the GRACE model is solved at the country-sectoral level on an annual basis. With significant advantages in the GRACE model due to the multi-sector and multi-region setup, the model is able to provide a comprehensive analysis on how the sectoral-specific shocks, such as those caused by the natural hazards, transfer to other sectors and parts of the economy through the value chain effects. Meanwhile, it also reveals how country-specific effects due to hazard impacts spill over to other regions through the trade, making it particularly useful for assessing the broader economic consequences of multi-hazard events.
2.4.2 Sectoral context in Scandinavia
As discussed in the previous section, the direct impacts of the 2018 multi-hazards are mainly focused on agriculture, forestry, and energy. Therefore, in this research, we employ various methods to assess the direct physical impact of 2018 natural hazards on the production of these targeted sectors, which is the input of the macroeconomic model for evaluating the indirect impacts.
2.4.3 Estimating sectoral heat-induced impact
For estimating the direct sectoral impact functions, we employed the dataset on the annual production of agriculture goods in the Scandinavia region for the period 1961–2020 from Food and Agriculture Organization Corporate Statistical Database (FAOSTAT, 2023). This study approximates total hydroelectricity production using aggregate reservoir storage volume, as recommended by Norwegian Water Resources and Energy Directorate (NVE, 2018). Due to the limited availability of daily hydroelectricity production data, we use the weekly reservoir level for Norway for the period 1995–2022, collected from NVE (2024), as the representative of the region. This estimation employs climate data extracted from Lund et al. (2023)
We employ econometric models to assess the direct physical impacts of extreme weather events on agriculture and energy production following Aaheim et al. (2012). Initially, we estimate the relationship between climatic variables and sector-specific outputs, utilizing the observational data detailed in Sect. 2.3.2. For this analysis, a log-level model is employed. The model formulation is as follows:
where represents the production of sector i. denotes the vector of climate variables, which includes the average weekly temperature, precipitation and their interaction terms. It includes [ ]. denotes the vector of control variables. When estimating the impact function for the energy sector, comprises month and year variables. When estimating the impact function for the agriculture sectors, includes year and country dummy variables.
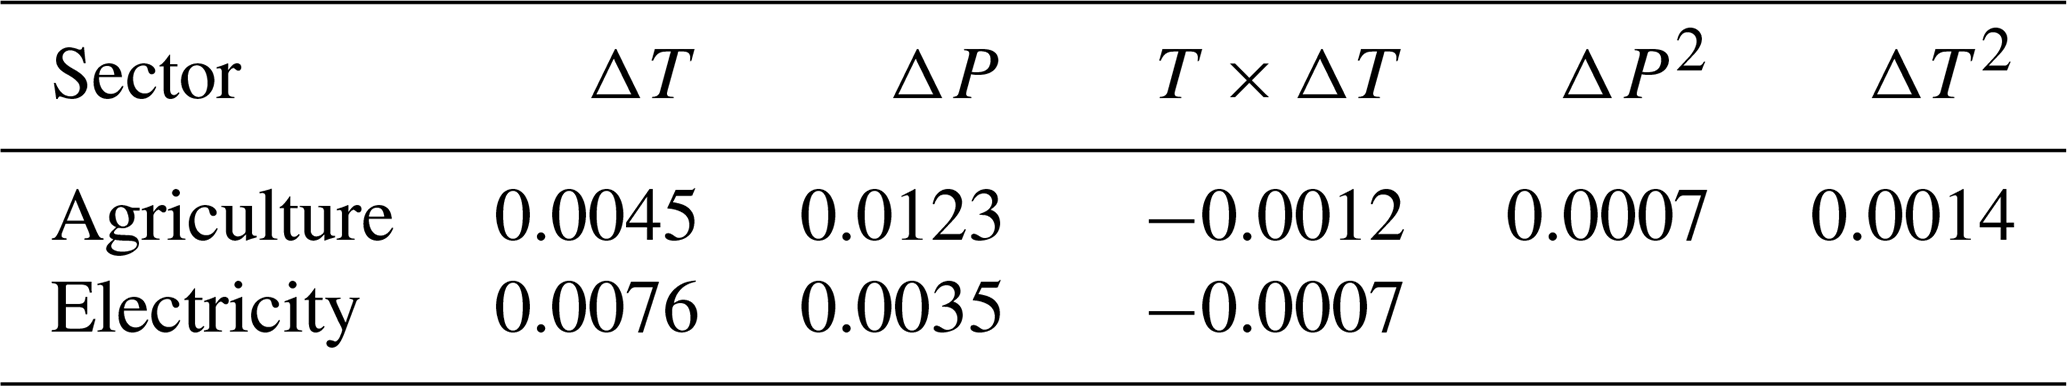
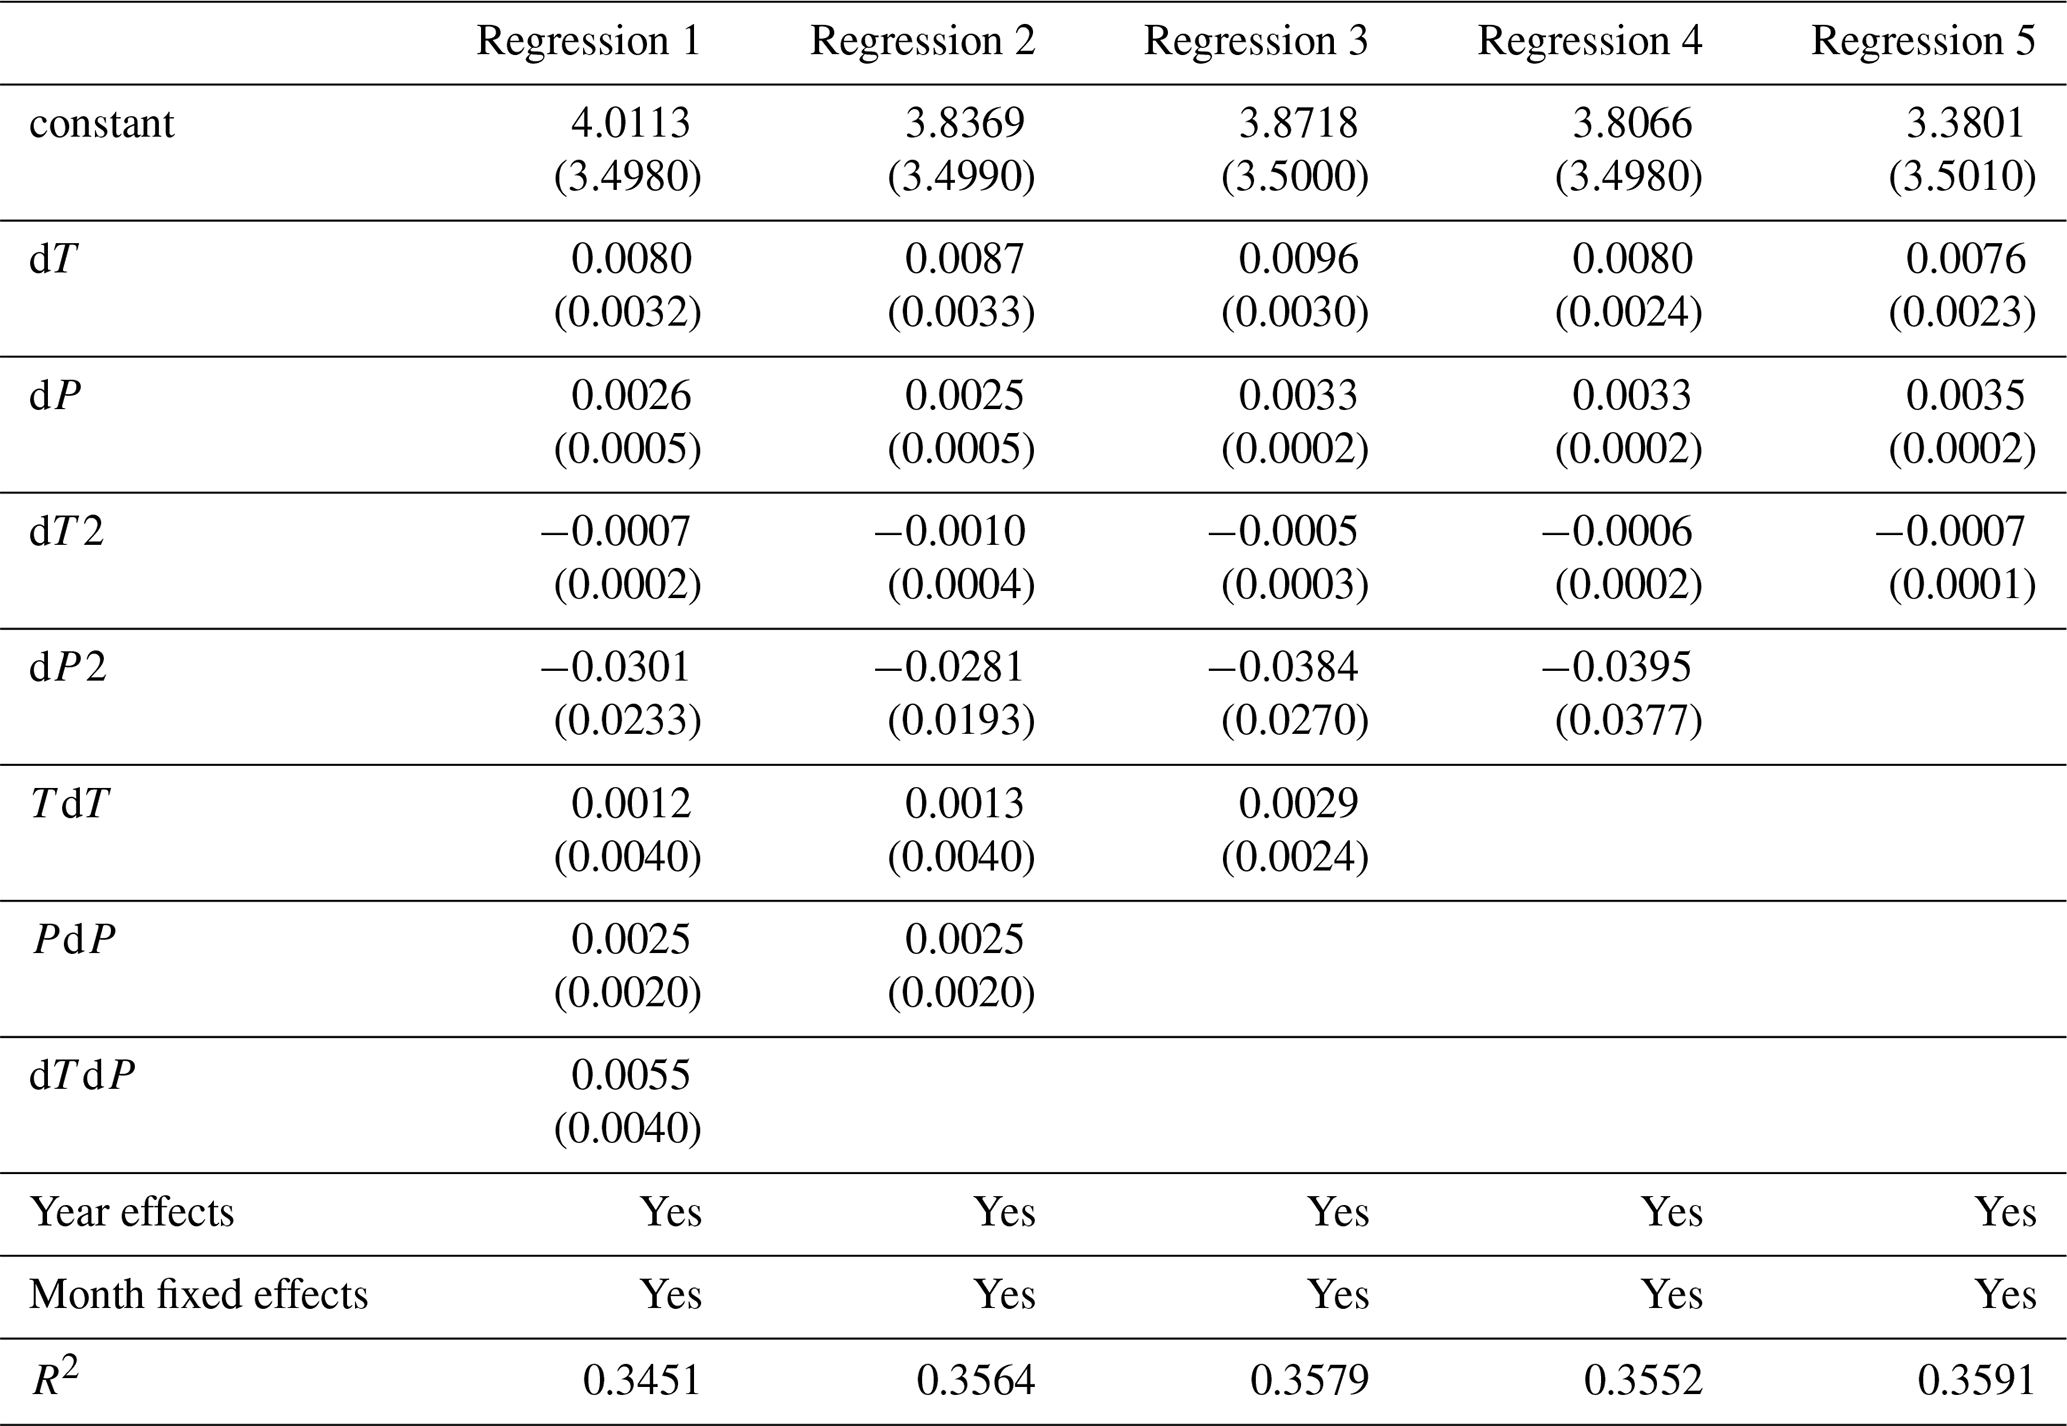
To estimate the impact functions, we utilize the forward selection method. This stepwise regression approach identifies the most significant variables for inclusion in our regression model. We selected the regression model that best fits the empirical data, as indicated by the highest R2 value. Table 1 reports the estimated percentage change of production of agriculture and electricity products, βi, in the climate-impact functions. Only estimates that are statistically significant at confidence level α= 0.05 are reported and employed in the GRACE model. All values have been adjusted to annualized measures for consistency used for the assessment of economic impacts in the GRACE. These results update the previous estimation outcome in Aaheim et al. (2012) for the Scandinavia region, and the magnitude of unit impacts remains consistent. The detailed stepwise regression estimation results are shown in Tables A1 and A2.
Table 1Estimated percentage change of sectoral production (annualized).
Next, we assess the direct physical impact on agricultural and energy production resulting from extreme weather events in 2018. To do this, we calculate the 95th percentile of climate variable deviations from their climatological norms for the year 2018. Our analysis reveals a significant deviation, indicating a temperature increase of 5.50 °C and a precipitation decrease of 170 mm.
Finally, we assess the impact on the forestry sector. We utilized the assessment detailed in Sect. 3.2, and computed 6 % of the forest area was affected by the multi-hazard event. We use the share of the area impacted by the drought-wildfire-heat events as a proxy to assess the effect on the production of forestry. However, this approach oversimplifies by not accounting for the heterogeneity of plant density and yield rates across different tree species. This could potentially lead to inaccuracies in our measurements, which could be extended for further research.
3.1 Spatial distribution of compound hazard events in Scandinavia
High risk drought-wildfire events occur twice as often as heat-wildfire, and heat-drought events, with occurrences up to 166 d of the summer seasons between 2000–2018, as seen on Fig. 3 below. The majority of areas across Scandinavia have low risk of compound combination hazards (from 0 to 41 d of the summer seasons as seen in Fig. 4 below). Heatwave, droughts and wildfires compound events affected the largest area of land (for a total of 8 d over the study period, Fig. 4) Although the likelihood is currently relatively low for most areas, with a low occurrence, droughts and wildfires in boreal ecosystems are expected to escalate with rising global temperatures (IPCC, 2021).
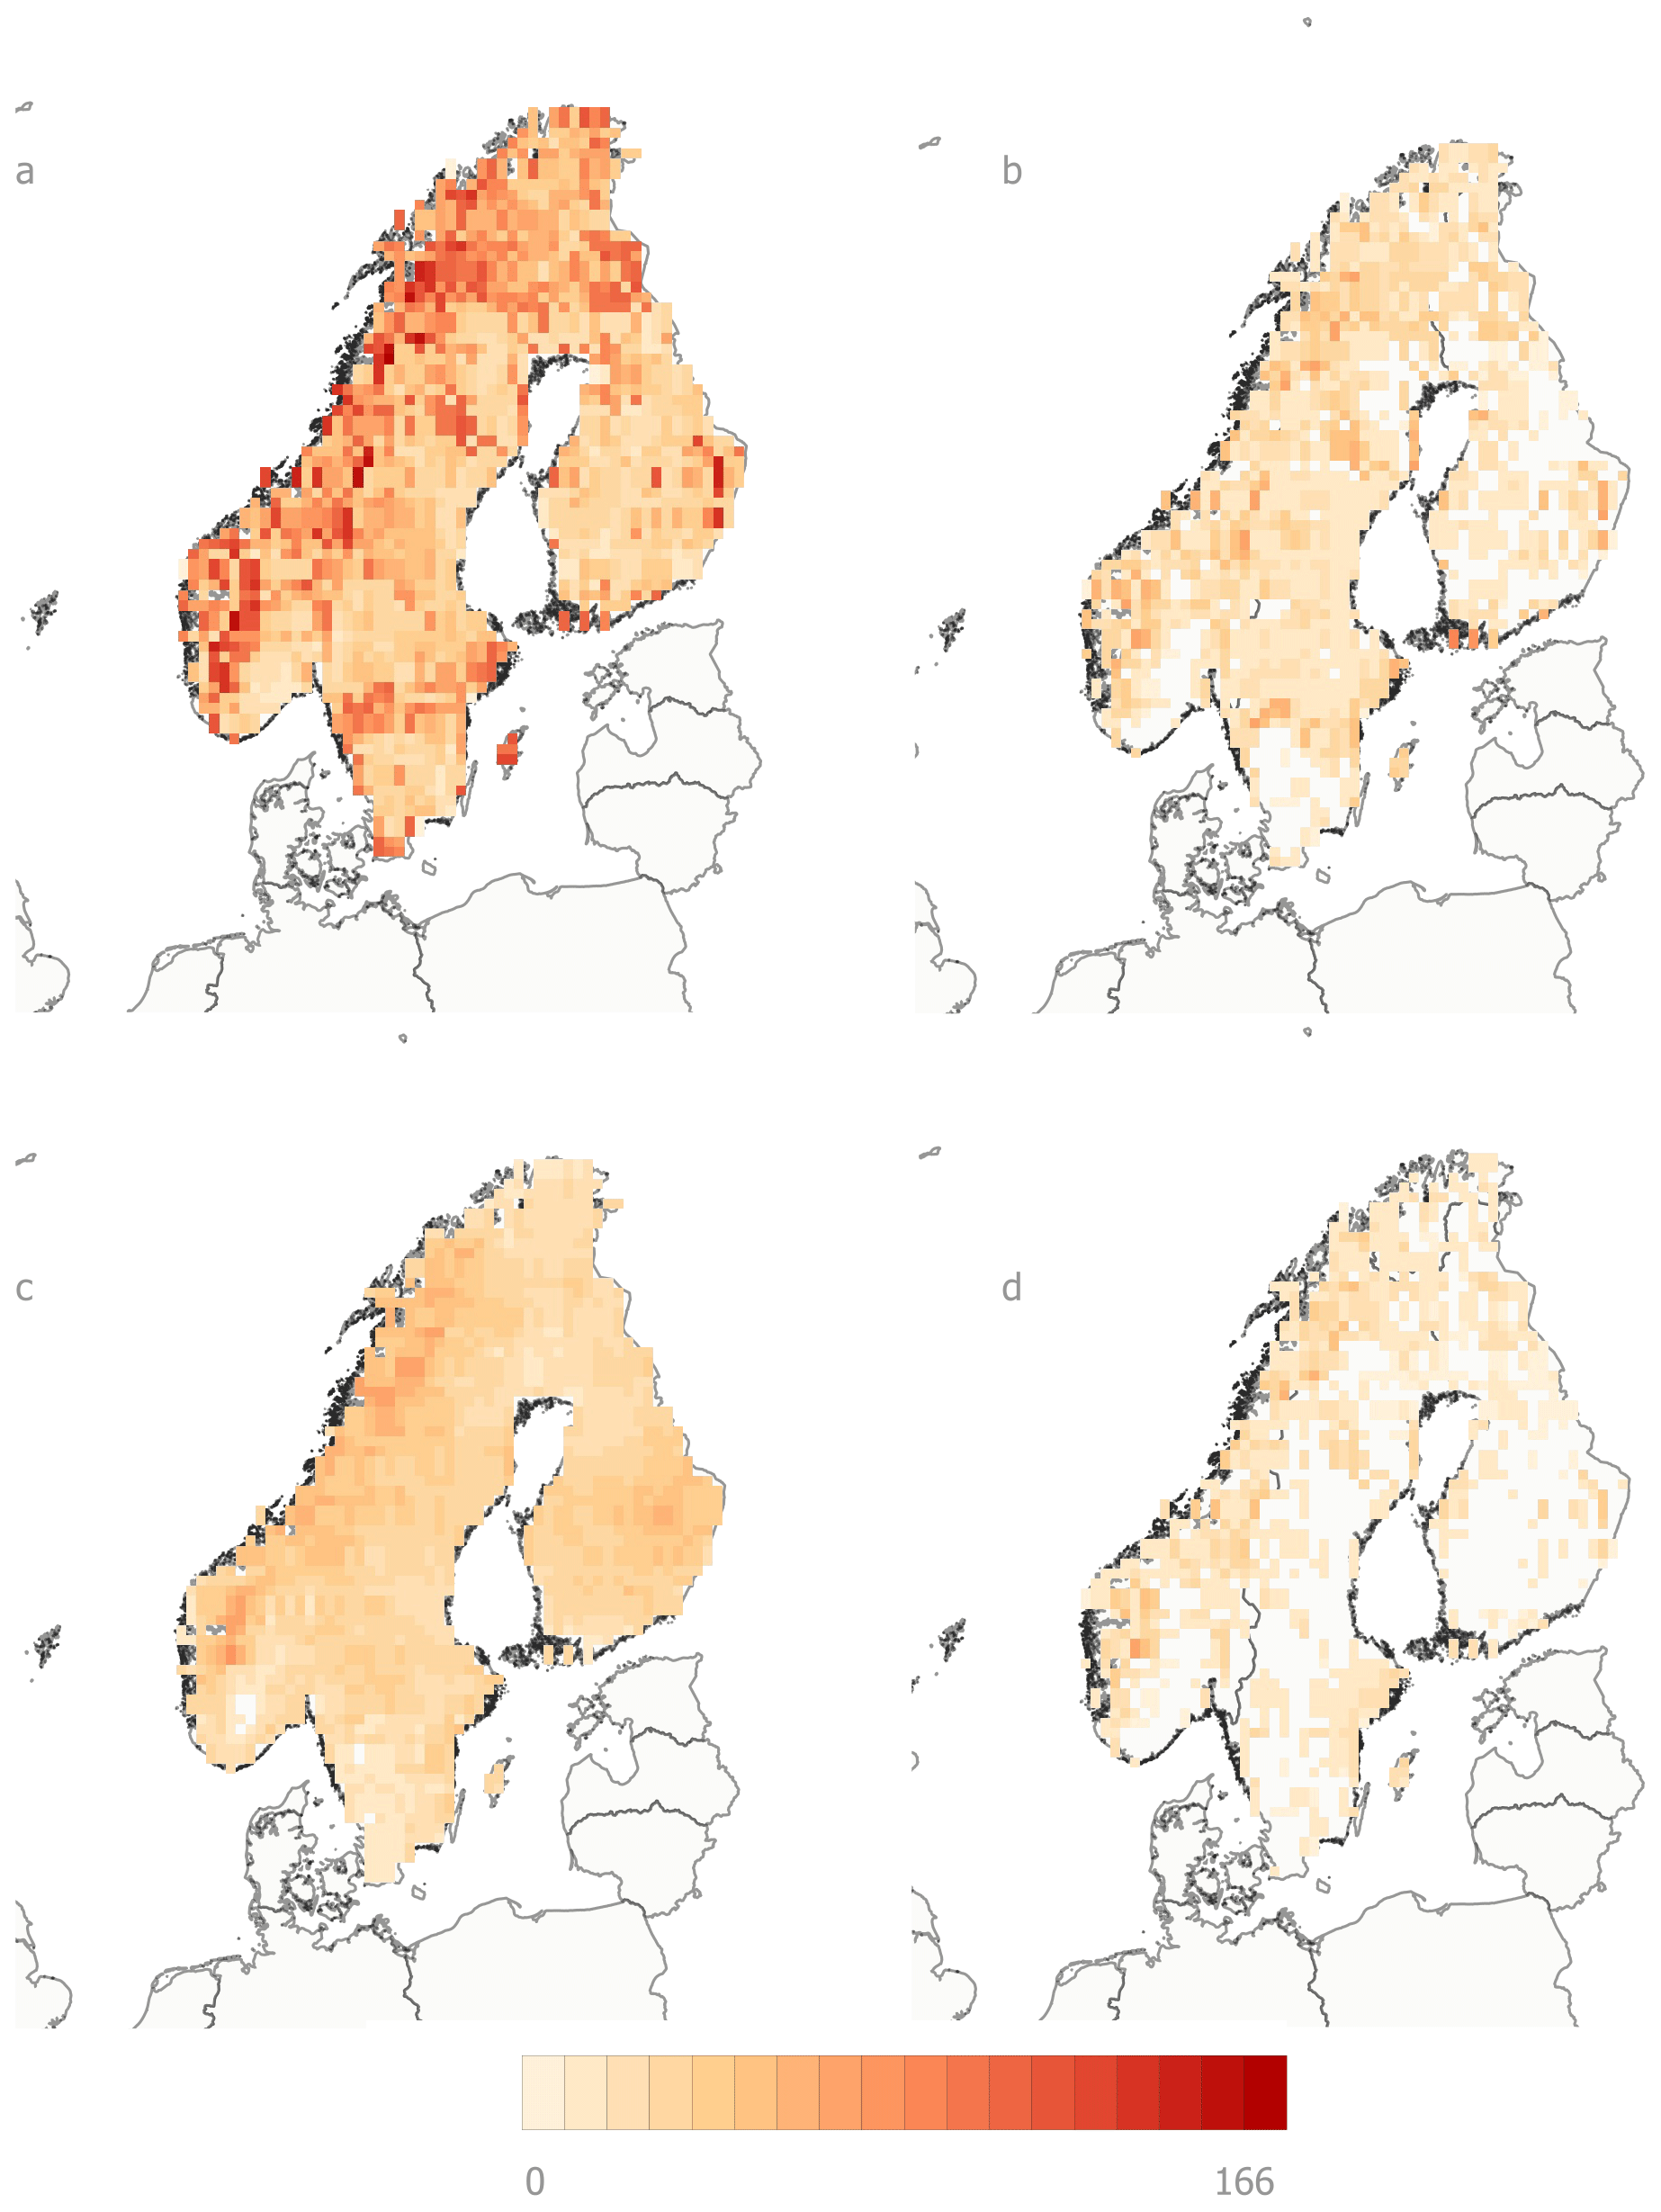
Figure 3Spatial distribution of compound heat-related events, in number of summer days, over the period 2000–2018. (a) Drought-wildfire, (b) Heat-drought, (c) Heat-wildfire, (d) Drought-wildfire-heat.
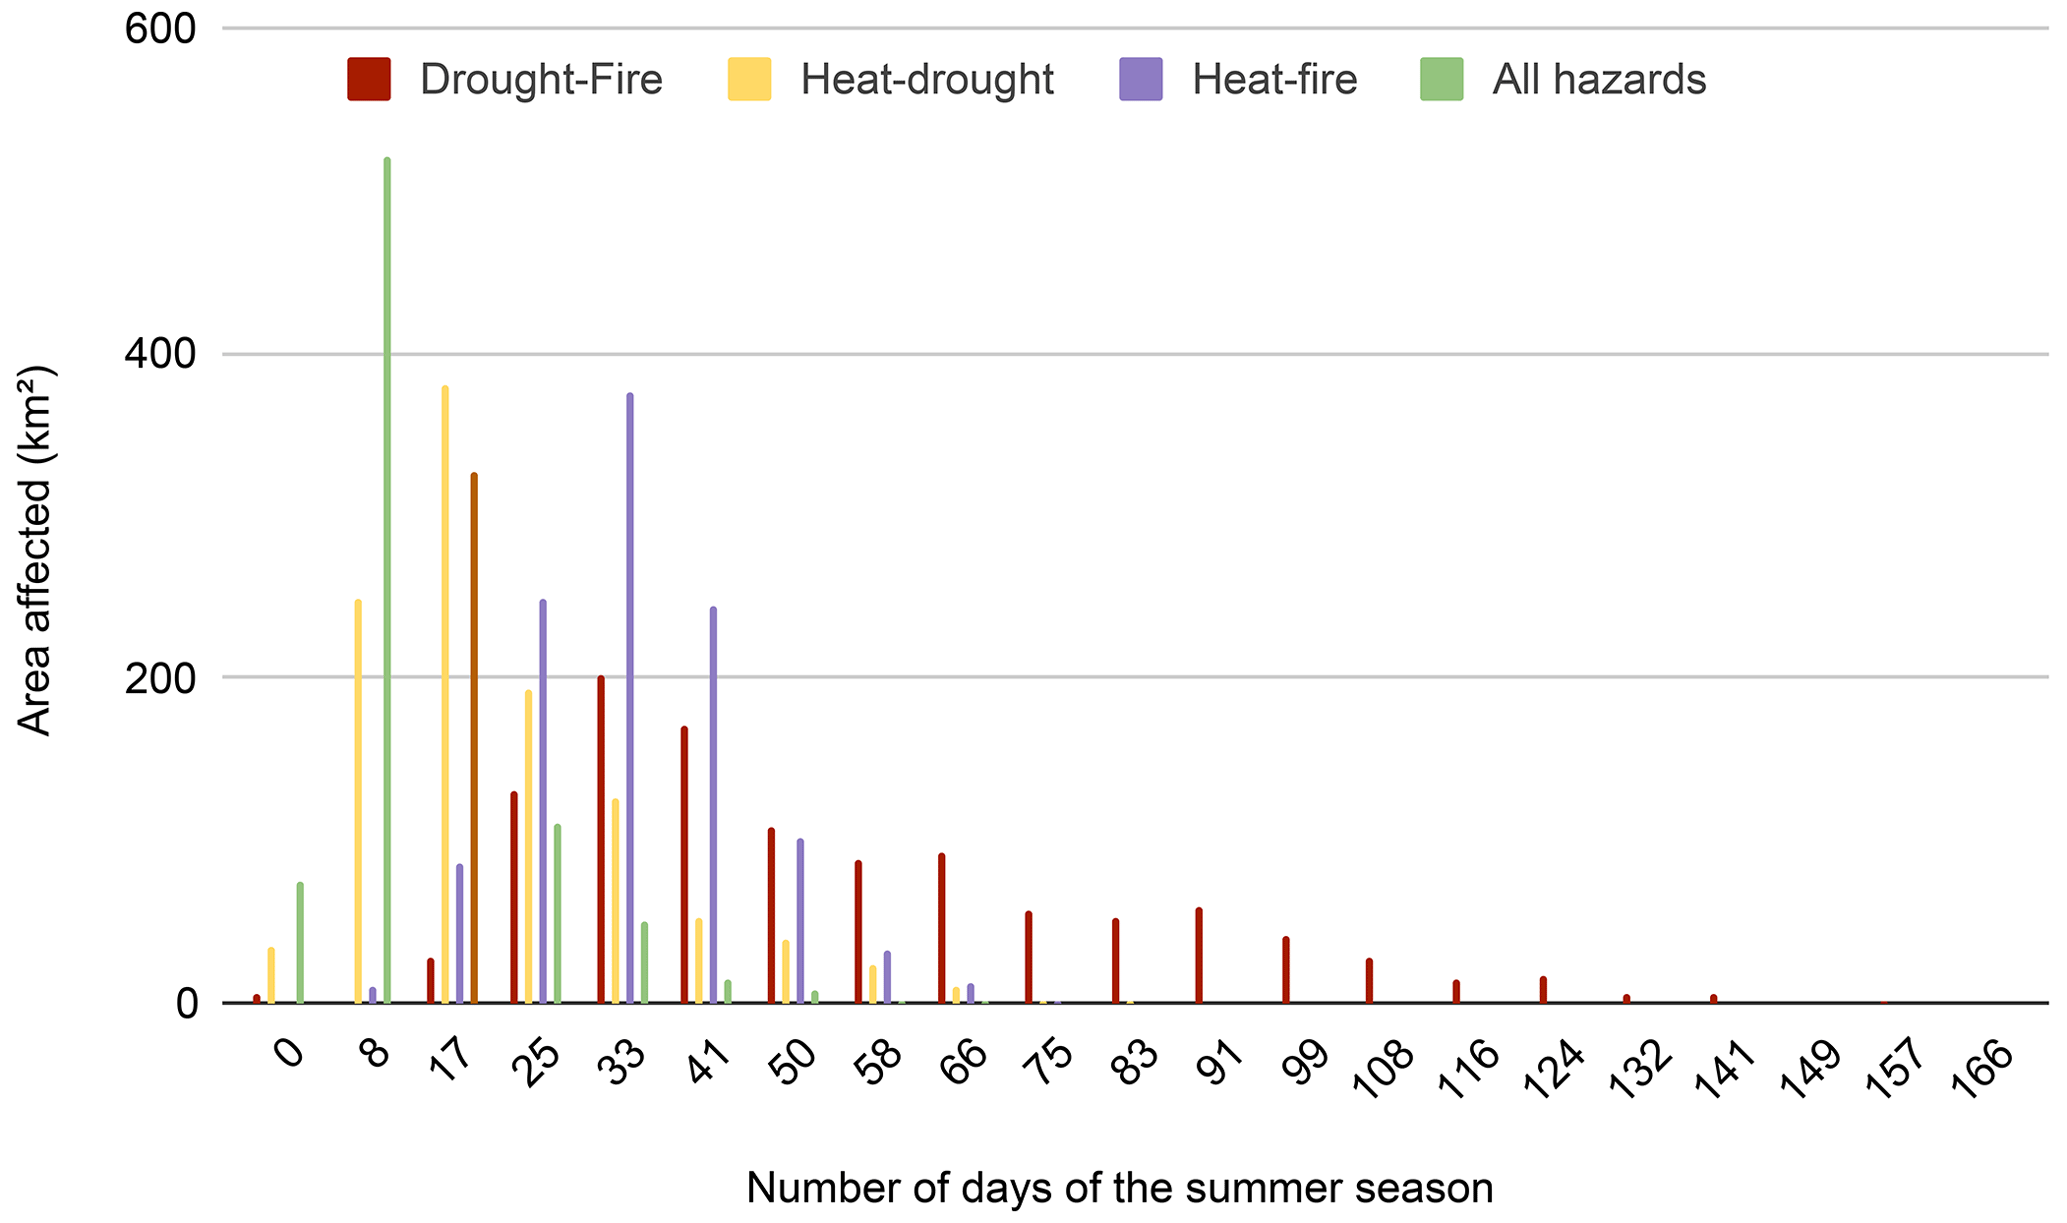
Figure 4Amount of land (in km2) affected by the compound hazard combinations, in number of days, over the period 2000–2018.
We located hotspots by calculating the 90th percentile of percent of days, which can be seen in Fig. 5 below. Drought and wildfire compound events are mainly located along the Norwegian coast (panel A). Heat and wildfire events are also mainly located along the Norwegian coast, and along the Norwegian-Swedish northern border (panel B). Heat and drought events are located along the Norwegian coast as well, though there are noticeably more hotspots more in-land (panel C). There is a lot of overlap in areas where conditions are conducive to multi-hazard heat-related events. These areas are at risk of all manner of compound events whereas most in-land regions are not at risk of any compound events.
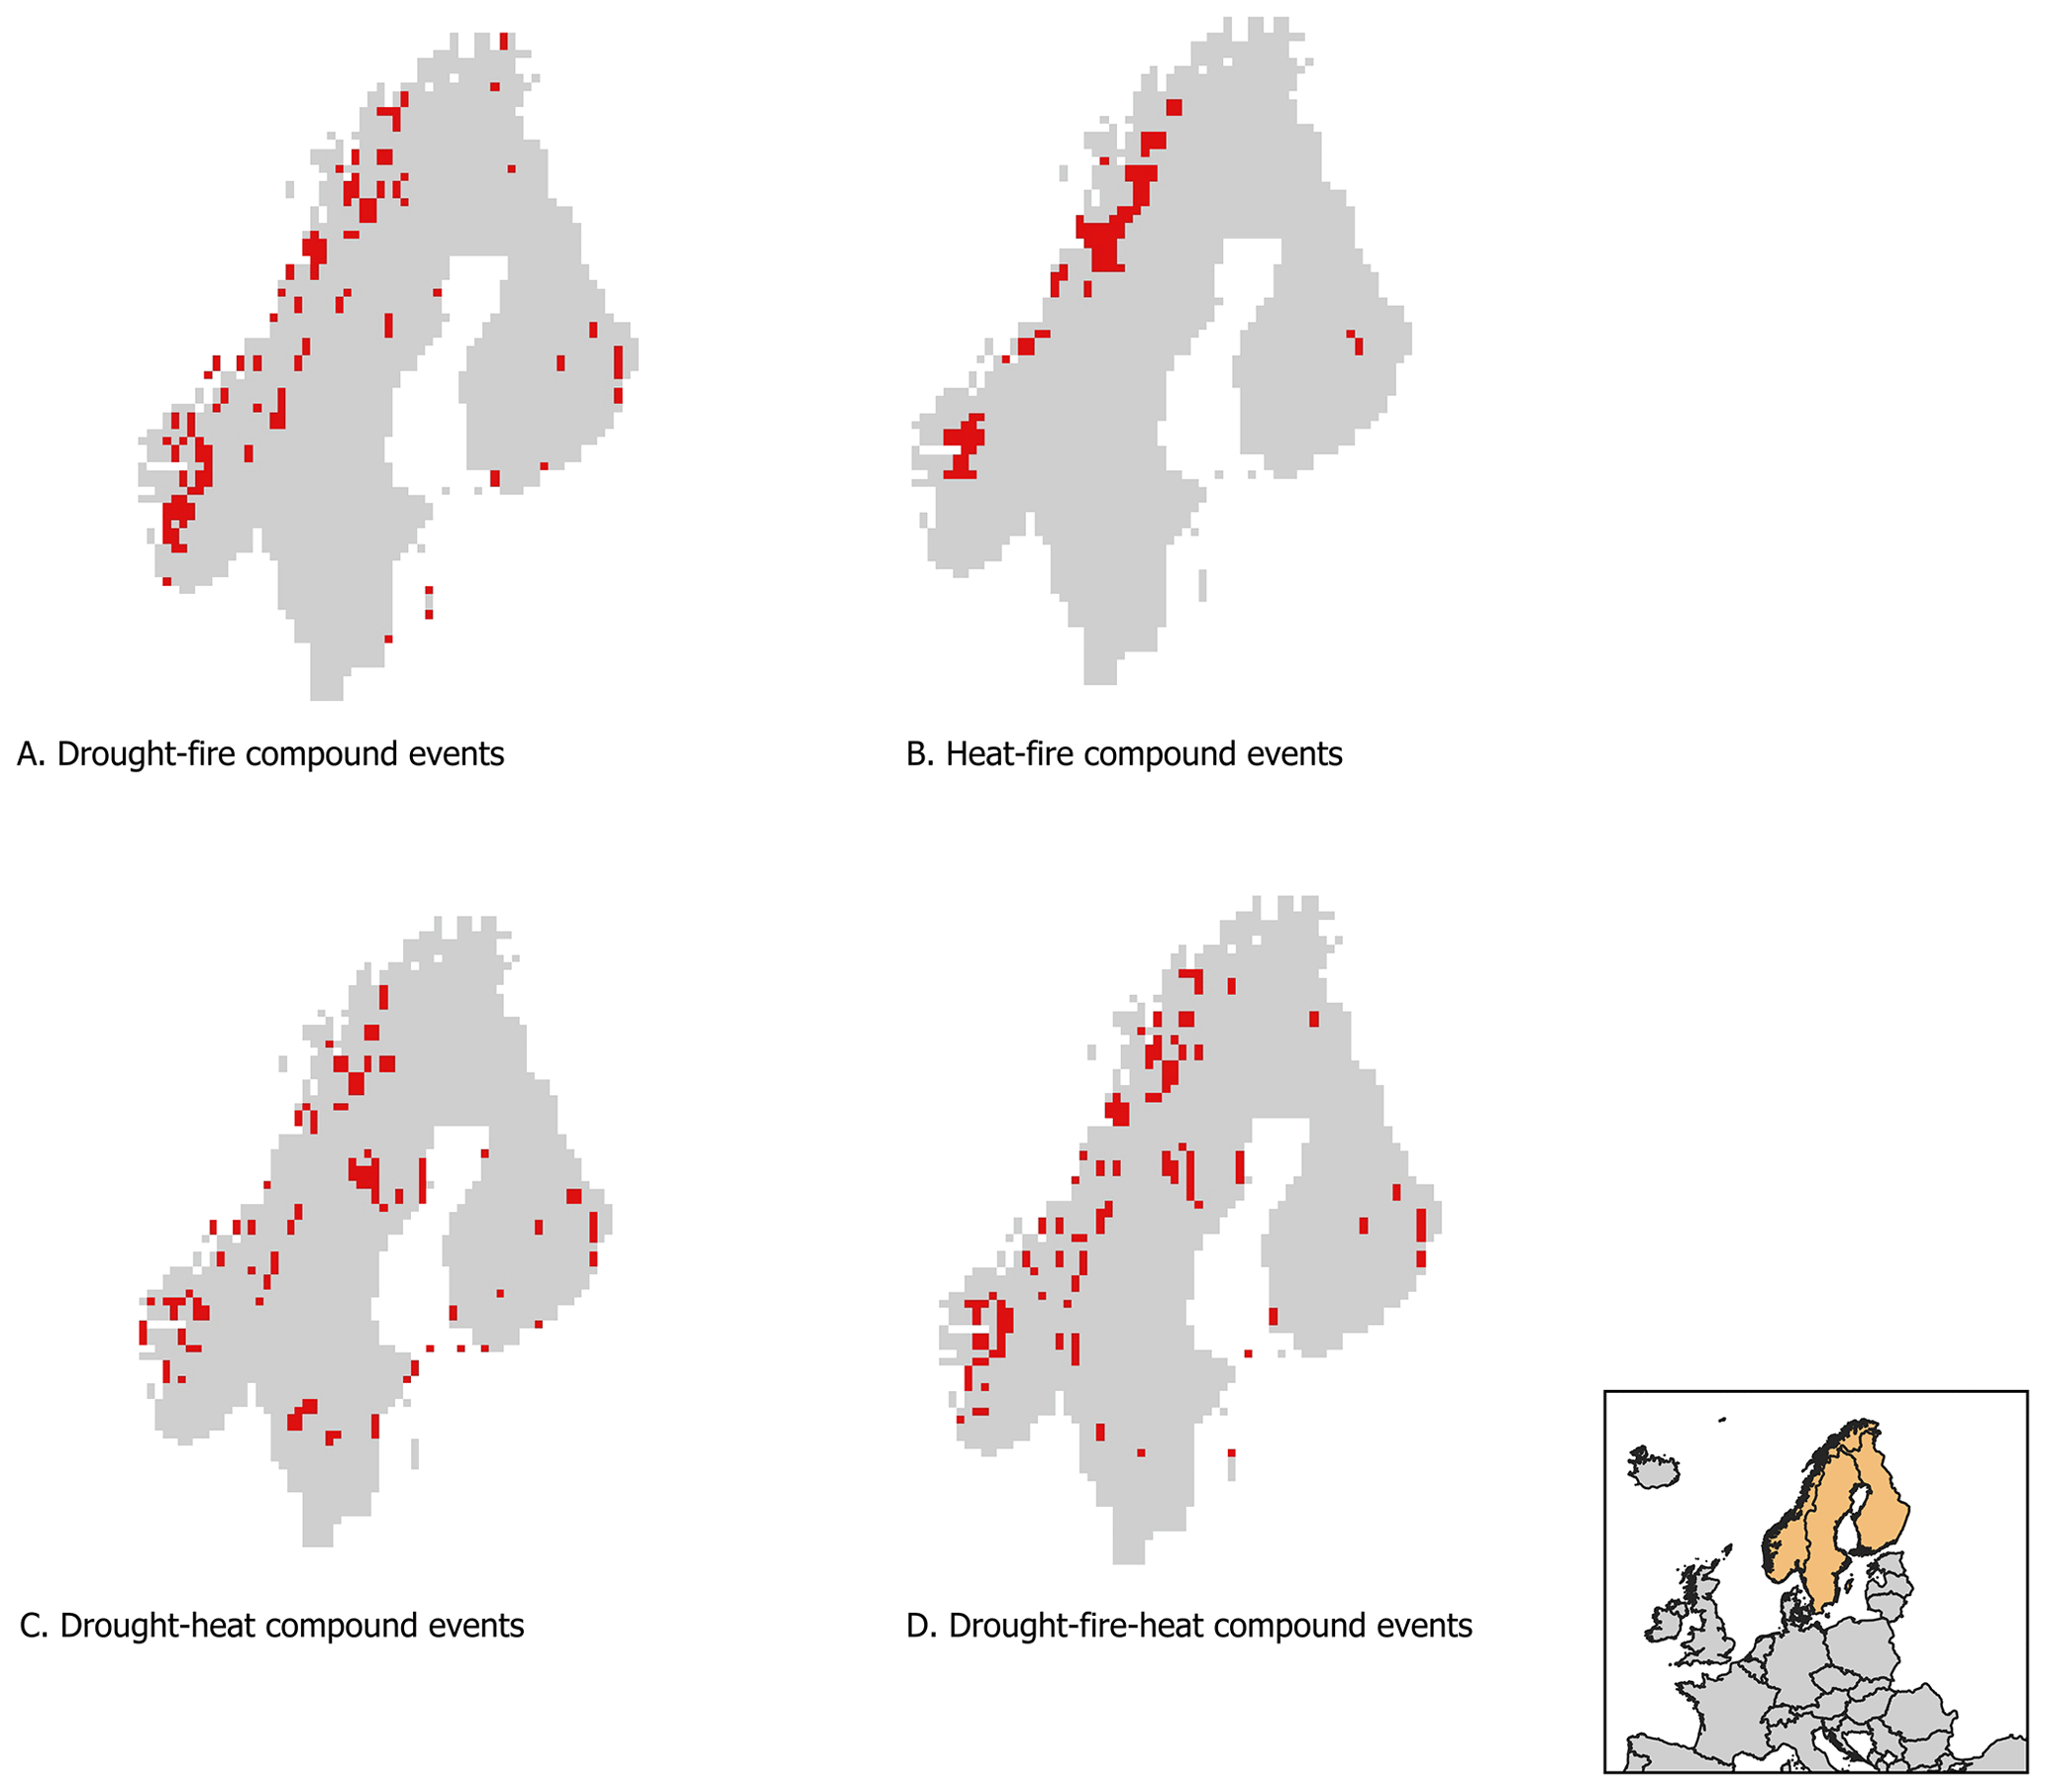
Figure 5Spatial distribution of compound multi-hazard risk in Scandinavia. Figure shows the 90th percentile of compound events over the JJA period of 2000–2018; (A) Drought-wildfire, (B) Heat-wildfire, (C) Drought-heat, (D) Drought-wildfire-heat.
3.2 Land cover of 90th percentile of percent of days
All hazard-combinations affect significantly moors and sparsely vegetated areas (Table 2). The moors are mainly located along the northern Norwegian-Swedish border and south-western region of Norway (Fig. 6 below). Broad-leaved forests are at high risk of all compound hazard combinations, and are found along the northern Norwegian-Swedish border and south-western region of Norway. Coniferous forests are at quite low risk of heat-wildfire compound events (only 5.5 % of total affected area), but are at significantly higher risk of heat-drought compound events (18.2 % of total affected area). These coniferous forests are located in the south-western region of Norway, along the northern Norwegian-Swedish border, central Sweden and in the south-eastern region of Finland. Water bodies are at higher risk of heat-drought events than the other compound combination events. These are mainly found in south-western Sweden (Fig. 6). Bare rocks are at high risk of all combinations of compound events. Bare rocks are classified by the CORINE Land Cover dataset as “naturally sparsely vegetated or non-vegetated areas where at least 90 % of the land surface is covered by rocks” (Copernicus Land Monitoring Service, 2025). These compound events occur along Sognefjord and Hardangerfjord, Norway, along which small rural communities and villages can be found, thus exposing local populations to these compound events.
Table 2Main land cover types affected by heatwave, droughts and wildfires compound events combinations, by percent of the total area affected.
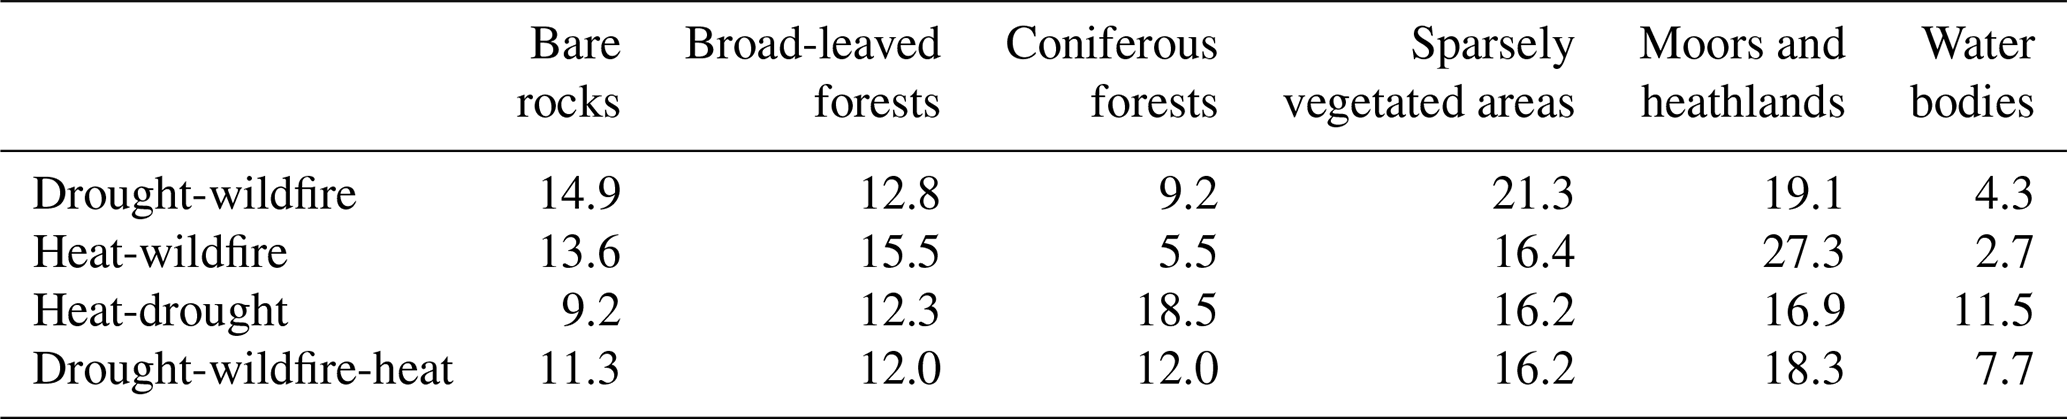
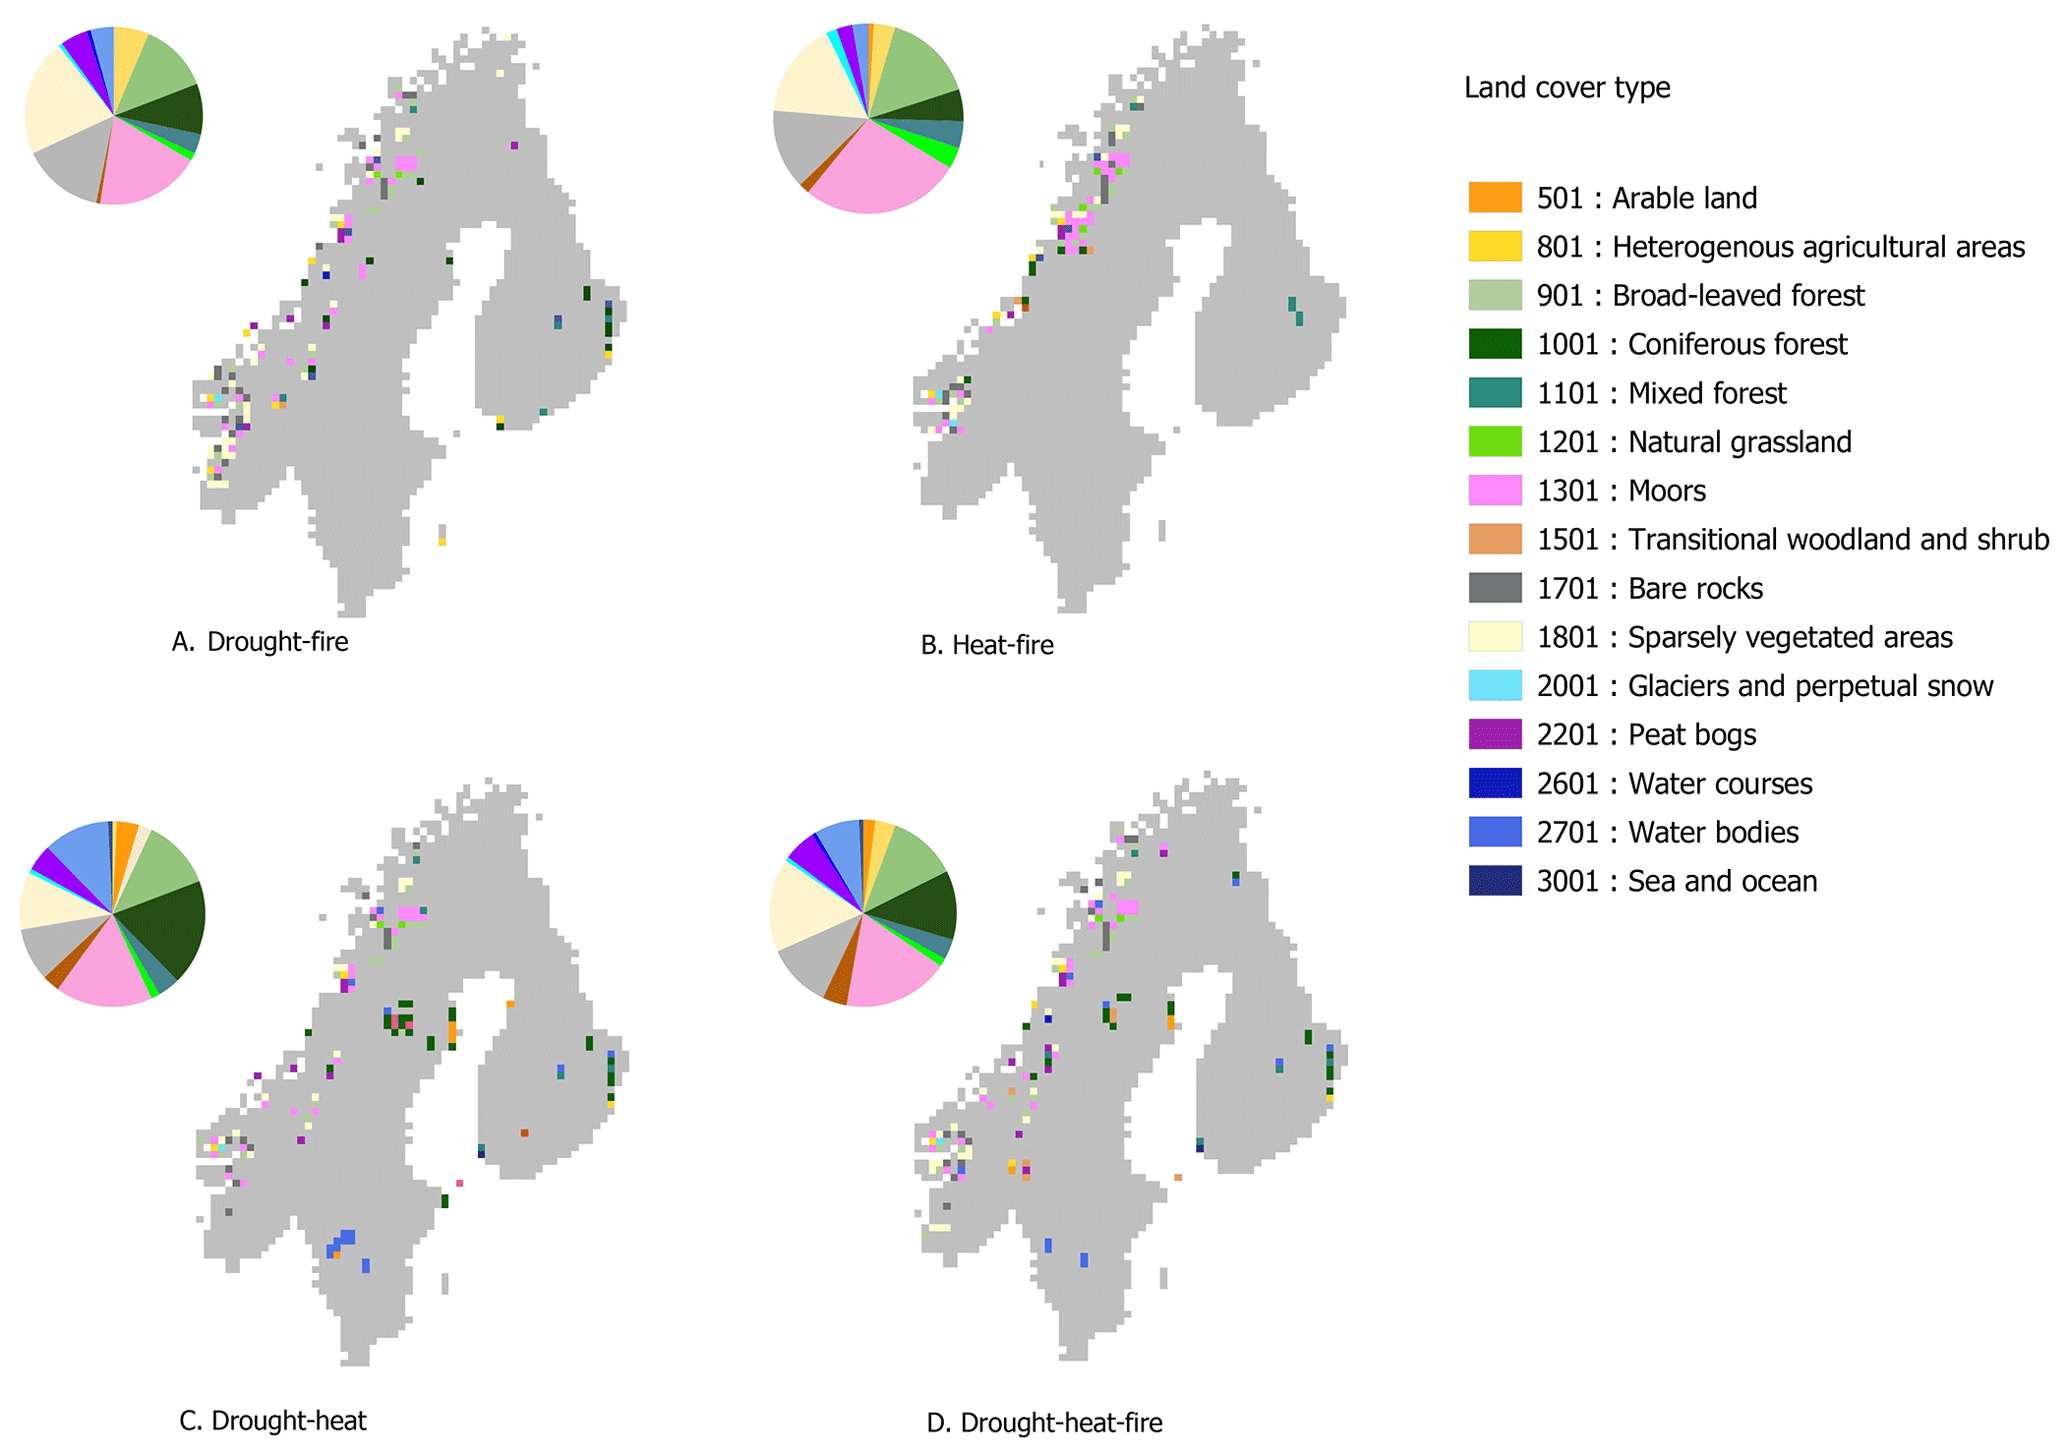
Figure 6Land cover type and land cover share of areas at high risk of compound events; (A) Drought-wildfire, (B) Heat-wildfire, (C) Drought-heat, (D) Drought-wildfire-heat.
3.3 Economic impact of multi-hazard on different sectors – the example of 2018
3.3.1 Definition of the compound event of 2018 from a Northern European perspective
Figure 7A shows the ERA5 maximum temperature values, averaged over the region of Finland, Norway and Sweden, for March to September. The thick black line is the daily climatological mean over 1979–2023 and the gray shaded area the central 90 % interval over the same period. The dots represent daily values for 2018. Figure 7B shows the equivalent for daily total precipitation. Overall, temperatures in spring and summer indicate several periods of higher-than-average temperature during 2018, which in April and May coincide with periods of low precipitation.
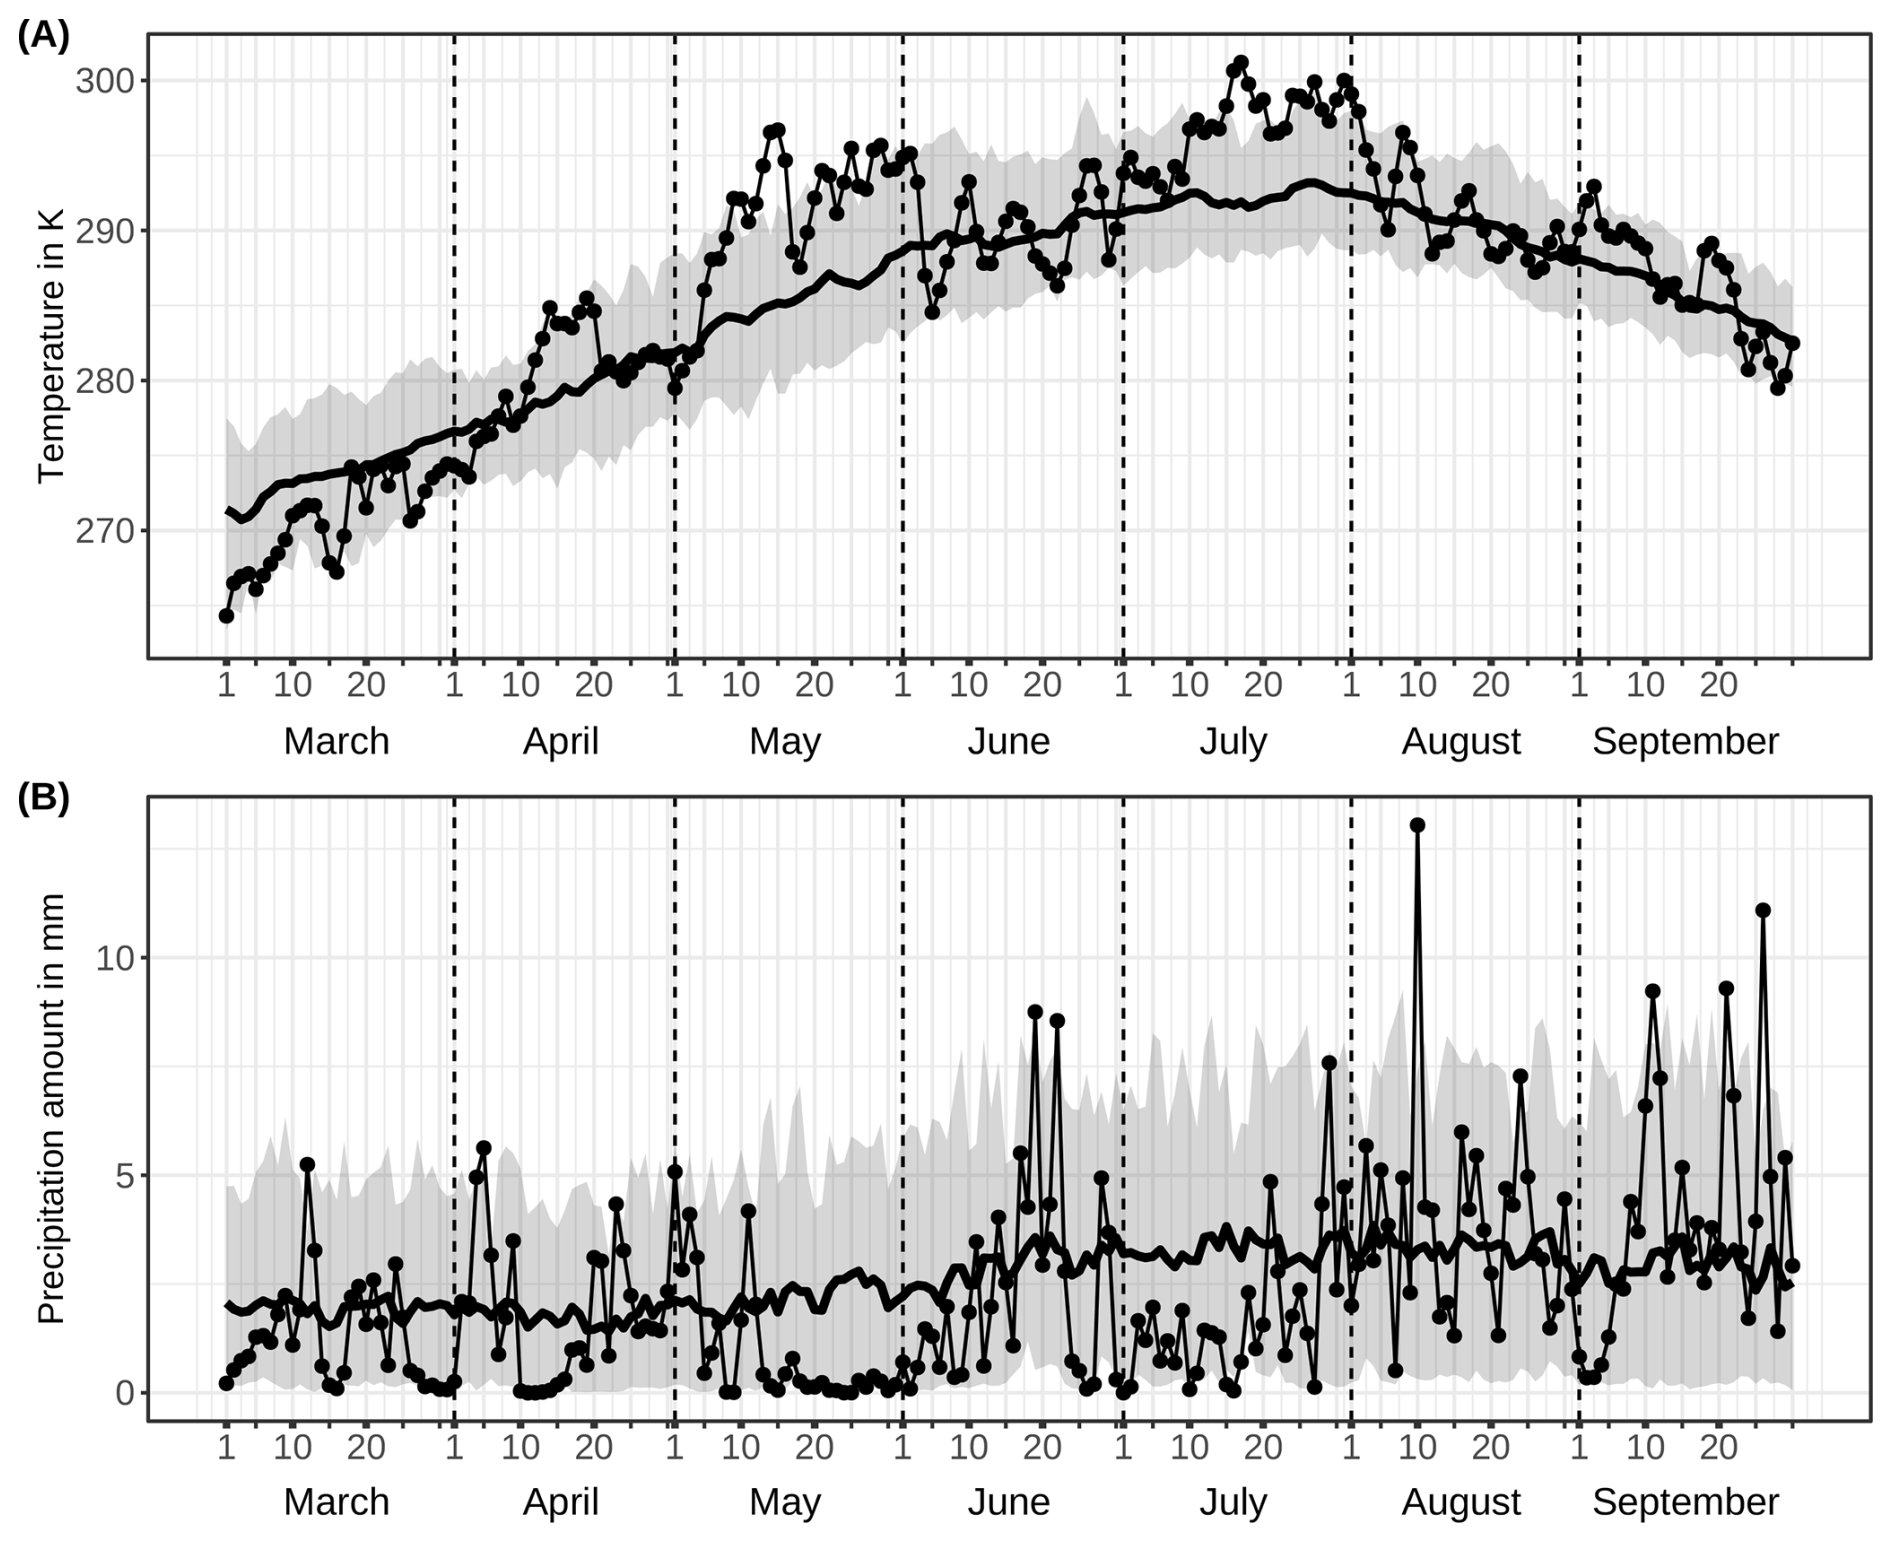
Figure 7ERA5 daily maximum (A) temperature and (B) total precipitation averaged over Norway, Sweden and Finland. 2018 values are denoted by connected dots, while the thick solid line and the gray shaded area are the mean and central 90 % interval over the years 1979–2023.
As described in Sect. 2.1, we establish an objective temporal event definition for the 2018 combined heatwave and drought by minimizing the event occurrence probability. These probabilities for all potential event definitions, ranging from very short (10 d) to the full period between March and September (214 d), are shown in Fig. 8. The central day of the respective event period is shown on the x axis, with the event duration on the y axis. The dots mark the event definition with the smallest probability for each duration and the X symbol the smallest probability across all definitions. Our results show that the 2018 compound heatwave and drought in Norway, Sweden and Finland occurred between 22 March and 29 July and lasted for 130 d, thus including most of the hot and dry periods seen in Fig. 7. This duration is used as a proportional weight while assessing the annual economic impact of the 2018 multi-hazard.
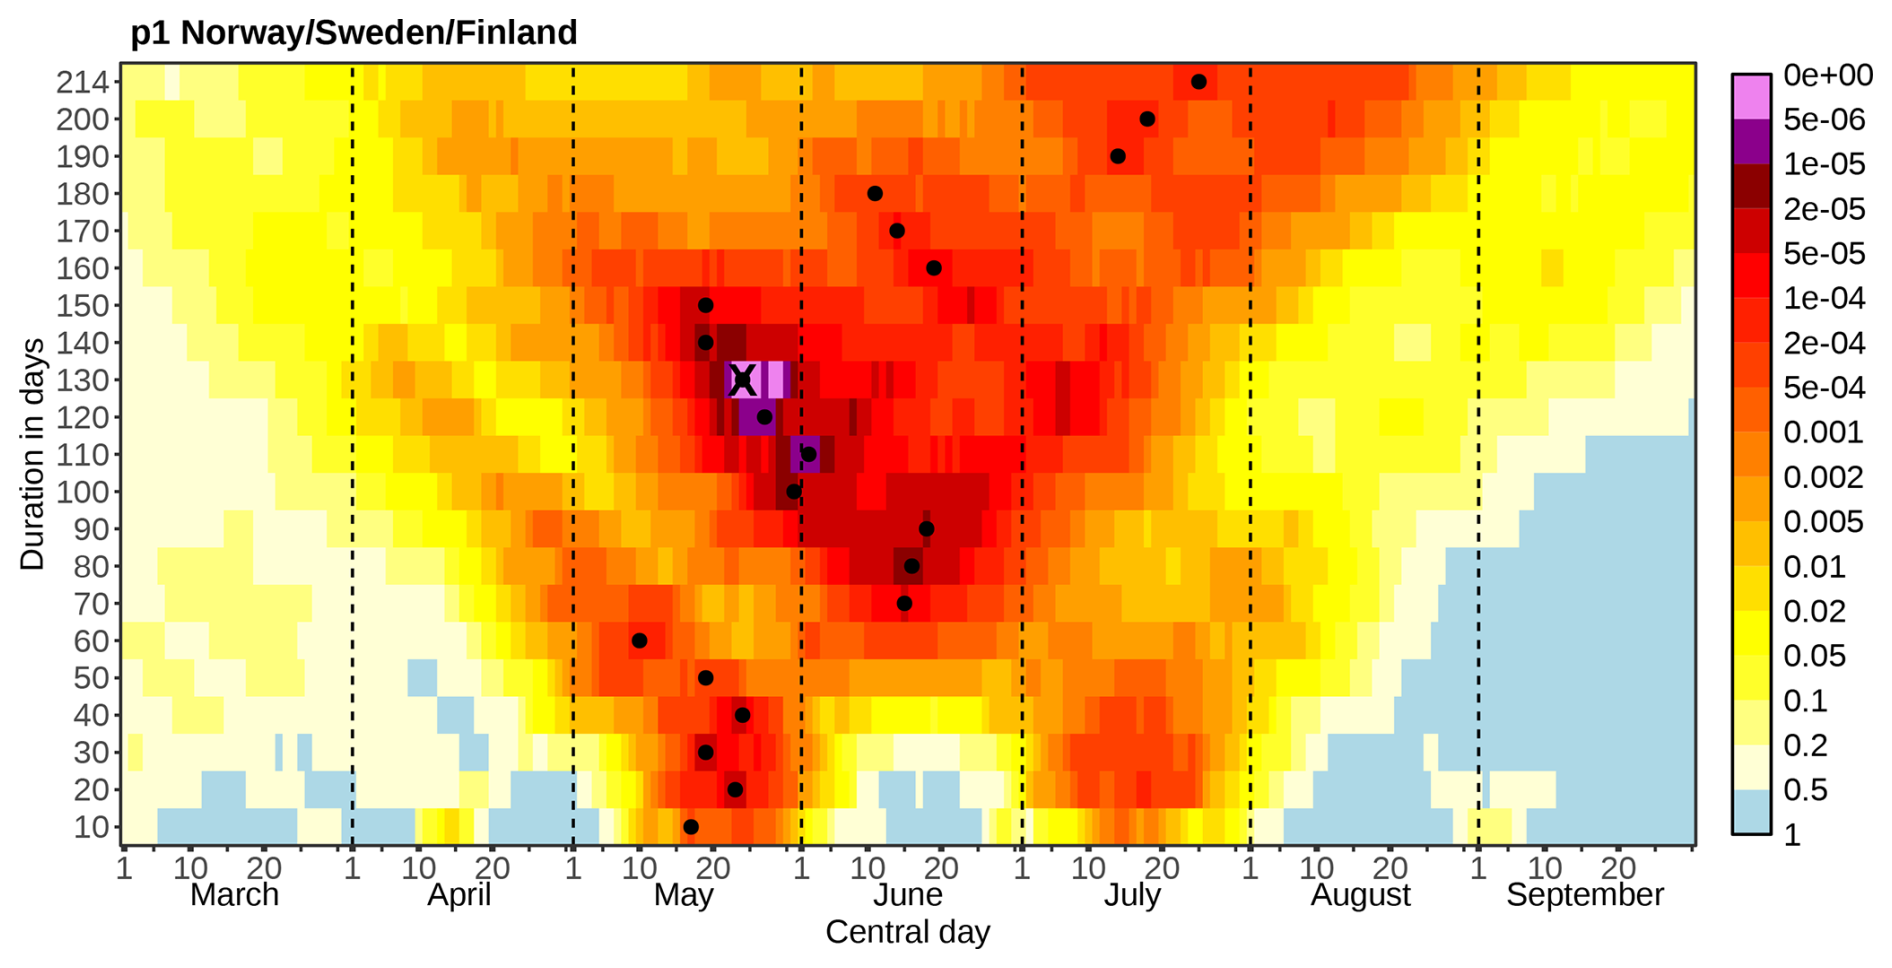
Figure 8Bivariate event probabilities for the compound heatwave and drought in 2018 for a range of event periods (central day on the x axis) durations (y axis). The smallest probability and therefore optimal definition is denoted by a cross, for an event between 22 March and 29 July 2018, lasting 130 d. The dots mark the lowest probabilities for each duration.
3.3.2 Economic impacts on the local economy
To understand the economic impacts of multiple hazards at the 2018 level, we solve the GRACE model by incorporating the impact within the model, especially in the energy, agriculture, and forestry sectors of Scandinavian countries for the year 2018, using estimates as shown in Table 2. The outcomes of sectoral production, prices, trade patterns and GDP are then compared to the “business-as-usual” (BAU) case, where no hazard events occurred. The results illustrate both the direct and indirect impact of 2018 compound events on the economy in a cross-sectoral and cross-regional context. The impacts are evaluated for 33 European countries, other developed countries and the rest of the world. The results presented in these subsections aggregate the impacts in Norway, Sweden and Finland.
In the Scandinavian region, the 2018 compound events contributed to an overall 0.08 % drop in GDP compared to the counterfactual scenario of BAU. It accounts for NOK 2.23 billion in 2018 value computed using 2018 GDP data collected from Statistics Norway (2024a). Although this decline in GDP was moderate, it was significant enough to draw attention and had broad impacts on the local economy.
Figure 9 depicts the changes in output by sector. Our findings reveal that the production in agriculture, forestry, and electricity sectors all experienced negative impacts due to the direct effects of multi-hazards. Among these sectors, the forestry sector suffered the most significant loss of 3.04 %. The production of electricity decreased by 0.50 % relative to the business-as-usual case, and the agriculture sector experienced a 0.51 % reduction. Meanwhile, the lowered output in these directly impacted sectors led to an increase in the prices of the products (Fig. 10). Notably, the domestic price of forestry goods increased by 1.64 %, electricity price increased by 0.93 %, and the prices of agricultural goods rose by 0.12 %.
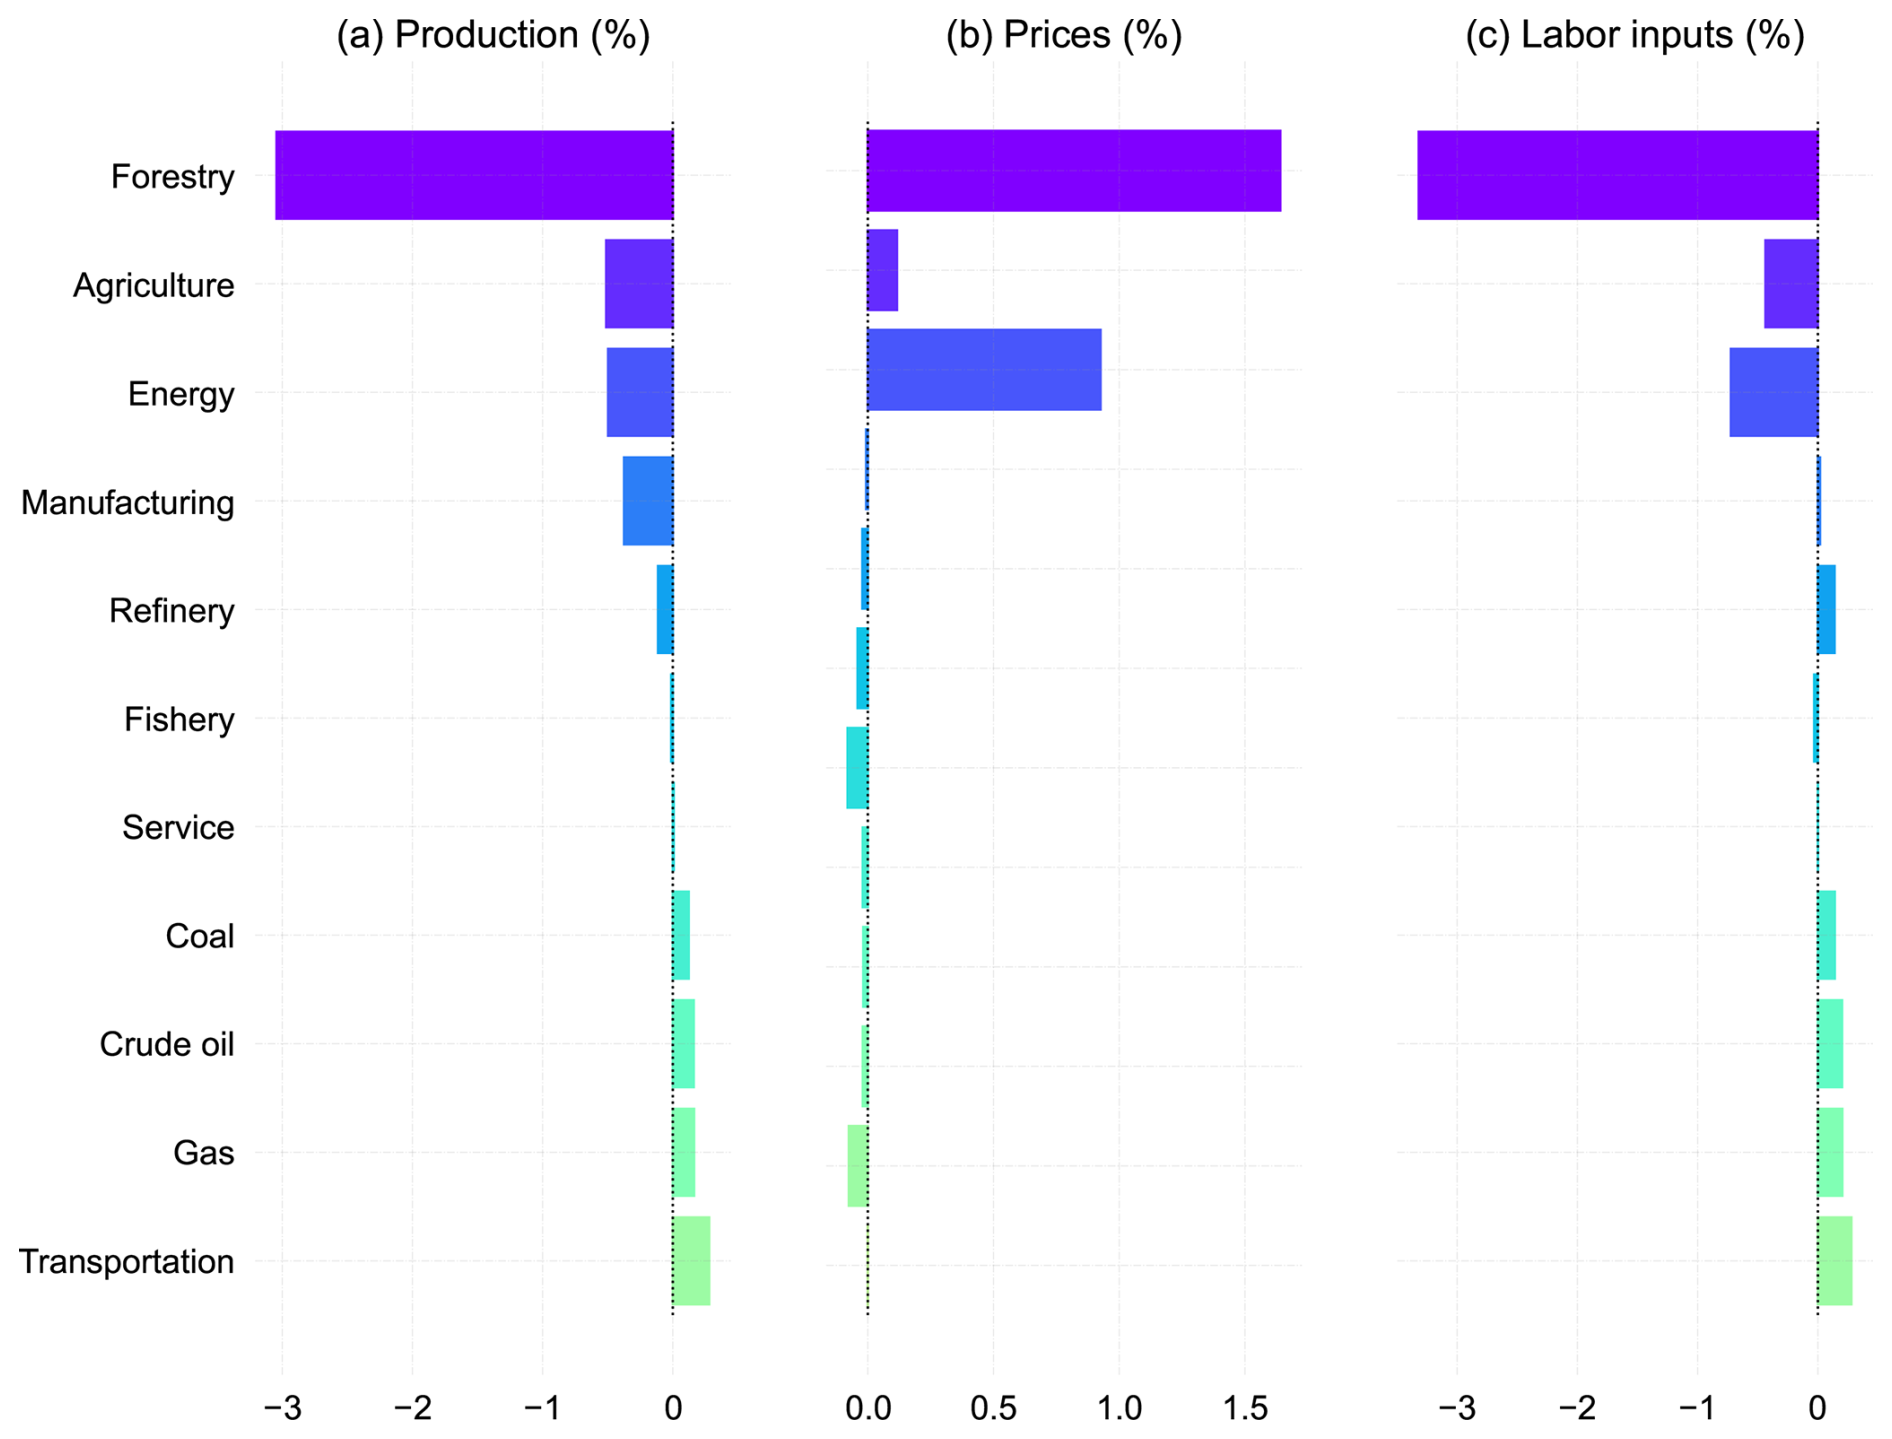
Figure 9Direct and indirect impacts on the domestic economy by sectors due to 2018 multi-events in Scandinavia.
The agriculture, forestry and electricity sectors are linked with other parts of the economy through their roles as intermediate inputs. Consequently, the reduction of production in specific sectors can trigger multiplier effects. This will result in cross-sectoral impacts beyond the initially affected sectors. Figure 9 also demonstrates the significant indirect impact of 2018 compound events on other sectors of the economy in the region. For instance, in panel a the production of manufacturing goods had a −0.37 % decline caused by the 2018 multi-hazard. It also shows that compound events in 2018 caused a considerable indirect impact on the refined oil sector, with production dropping by nearly −0.11 % due to disturbances in energy inputs in the production process. Simultaneously, the substitution effect resulted in an increased demand for crude oil and natural gas, boosting production in those sectors: a 0.16 % increase in crude oil production and a 0.17 % increase in natural gas production. Furthermore, in panel b, the domestic price of fossil fuel energy moderately decreased in equilibrium due to these effects (as shown in Fig. 9). Because of the effect on prices, the Scandinavian region would gain a comparative advantage in producing fossil fuels and exporting supplies. This potentially led to a carbon leakage in the region.
Additionally, the decreased production in sectors directly affected by climate change in the Scandinavia region has led to a reduction in labor demand. Consequently, there has been a decrease in labor allocated to these sectors. As shown in Fig. 9 panel c, labor input in the forestry sector declined by 3.32 %, in the agricultural sector by 0.44 %, and in the electricity sector by 0.72 %. However, there has been an observed increase in labor input in other sectors indirectly affected. While this allows for some mobility of labor within the region, the transfer of workers from negatively impacted sectors to others does not completely compensate for the overall decrease in labor demand based on the limitations of labor mobility. Thus, the lower labor inputs potentially lead to an increase in unemployment within the Scandinavia region.
3.3.3 Economic impacts in other regions
The 2018 multi-hazard had a widespread ripple effect on the global economy, especially within Europe2. This is particularly due to its significant impact on forestry goods production in the Scandinavian regions. The Scandinavian region has an important role in exporting forestry products. Thus, the 2018 events resulted in a 29.39 % reduction in the export of forestry goods, contributing to a 0.05 % drop in the trade balance, as indicated in Fig. 10a. Meanwhile, we found that five out of eight European regions, including the British Islands, Central Europe-East, Central Europe-North, Central Europe-West, and the Iberian countries, experienced a decline in their trade balance. These regions are important trading partners of Scandinavian forestry products which highlights the widespread economic impact of 2018 multi-hazards across Europe.
Despite having a strong forestry sector, the Baltic region is projected to see a 0.03 % decrease in its trade balance. This decline is largely due to the dominant position of Scandinavian forestry products in the global market. The reduced supply of forestry goods from Scandinavia could not fulfill the global demand and increased prices of wood products worldwide. As illustrated in Fig. 10b, wood products from the Baltic states have experienced a 0.39 % price increase, the second highest price increase after the Scandinavian region. The large surge in prices created a comparative disadvantage for Baltic forestry products in the global trade market, making them less competitive compared to alternatives. Consequently, this explains the negative ripple effect on the trade balance volume in the Baltic states.
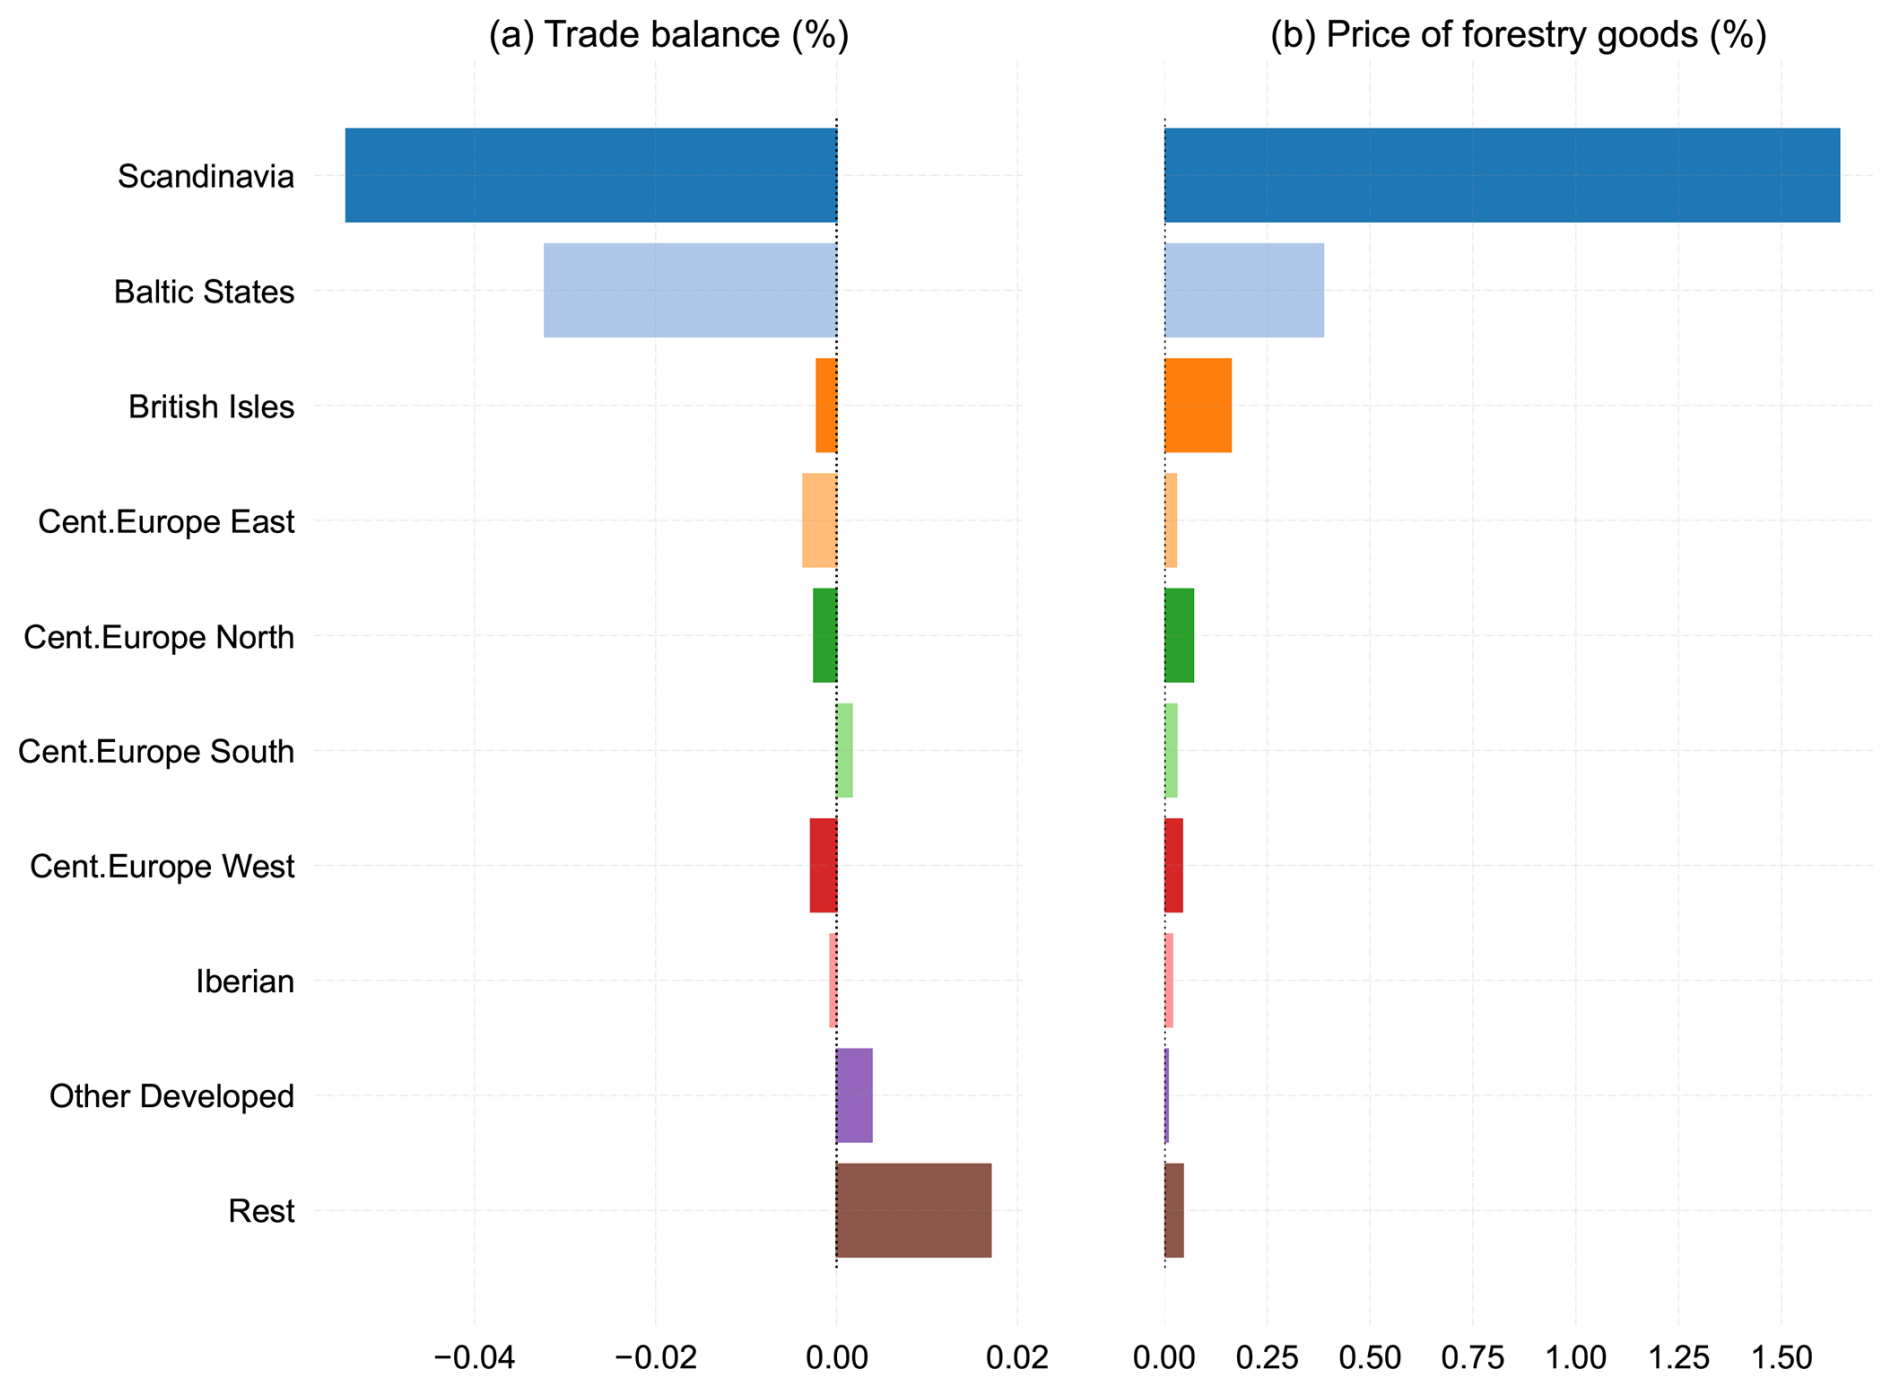
Interestingly, our findings indicate that the 2018 disturbances in Scandinavia have stimulated the export of forestry products from other developed countries and the various regions in the rest of the world. These areas have experienced more moderate price increases (as shown in Fig. 10b), leading to an implied comparative advantage. It motivated production and export from these remote countries to meet the global demand for forestry products. According to FAOSTAT (2024), the major exporters of forestry products aside from European countries, include developed countries such as the United States, Canada and Russia. The list also extends to other countries, including China and Brazil, among others. These countries also increased their market presence in the forestry sector and thus compensated for the reduced supply from the Scandinavian region.
Ultimately, the market effects and trade effects transform the direct, sector-specific impacts into broader cross-sectoral and cross-regional impacts. These cumulative effects contribute to the impact on the GDP of each region. Figure 11 presents the isolated impact on GDP due to the 2018 events in 33 European countries. As shown in Fig. 11, countries in the Baltic states, British Isles, and Central Europe-East have experienced GDP losses caused by 2018 compound events, mainly driven by inter-regional trade effects. In contrast, countries in Northern Central Europe, Southern Central Europe, and the Iberian regions have seen GDP growth during the period. The GDP growth in these regions is the result of the combined effects of changes in internal markets or trade patterns. Particularly, Fig. 10 shows that Southern Central Europe benefited from the remote impact in the Scandinavia region with an increase in the trade balance due to rising prices of forestry goods, leading to a positive GDP growth as shown in Fig. 11.
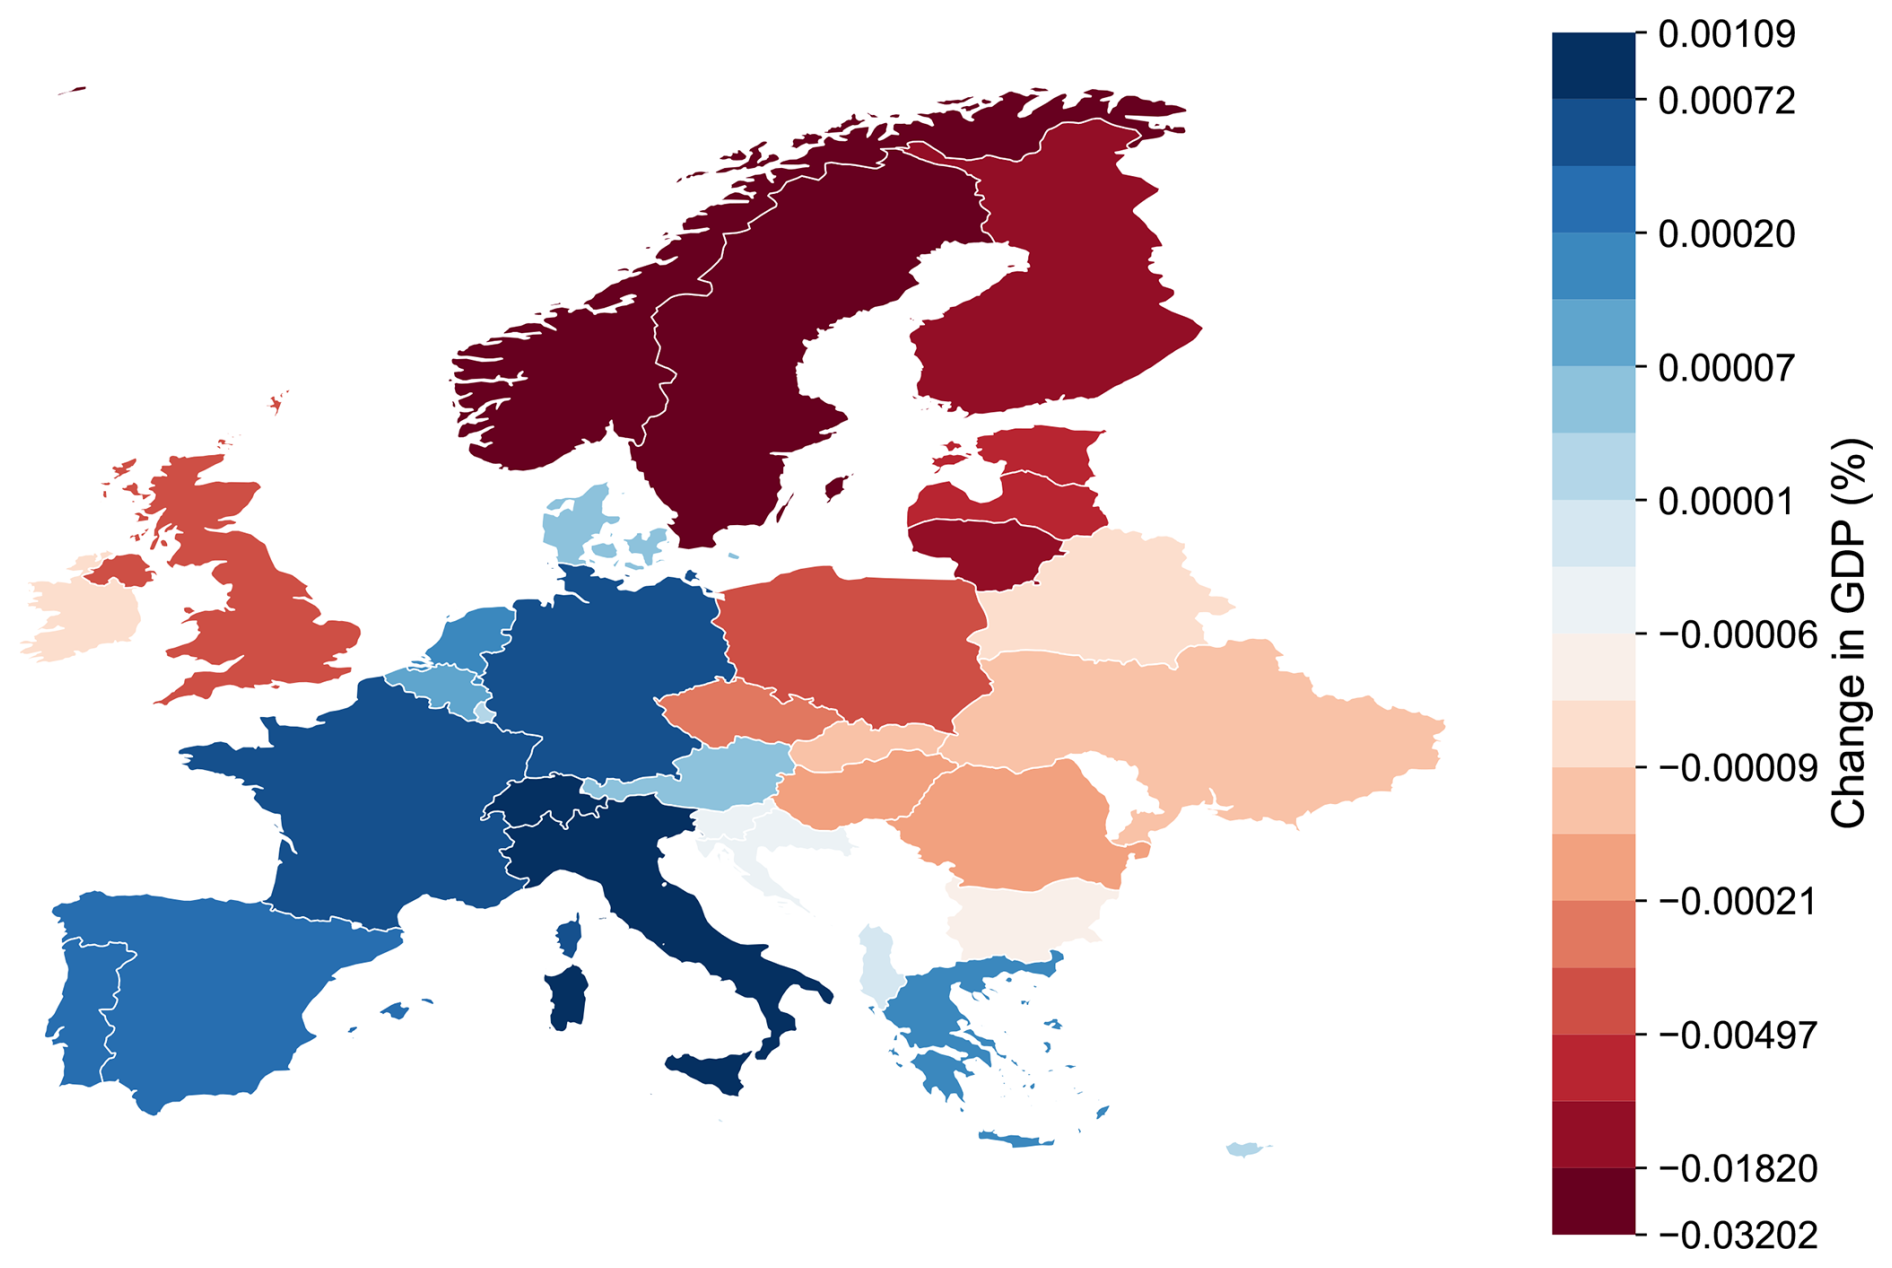
Figure 11Economic impacts of 2018 compound events: GDP impacts in 33 European countries.
This study aims to better understand the impacts and occurrences of multi-hazard events in summer (the occurrence of compounding heatwave, drought and wildfire events) in Scandinavia from a multidisciplinary perspective. High risk drought-wildfire events occur twice as often as heat-wildfire, and heat-drought events, with spatial patterns ranging primarily along the Norwegian coast, which is in accord with the results from Sutanto et al. (2020). Combinations of wildfire-hazard events primarily occur in Norway, with fewer occurrences in Finland, where several factors such as natural fire breaks and an extensive road network help maintain the fires small and at a low-intensity (Fernandez-Anez et al., 2021). Forest management in Finland is as such that a large majority of the biomass is removed during harvesting, decreasing the amount of available fuel (Fernandez-Anez et al., 2021), although it has been noted that an increase in prescribed burning would be beneficial in order to increase forest biodiversity in the country (Lindberg et al., 2020).
Drought-hazard events in Sweden appear to occur in the southern and central regions, where Teutschbein et al. (2022) found that southern catchments experienced more severe streamflow droughts than northern ones. Teutschbein et al. (2022) identified a wetting trend in Sweden during the winter months, with a minor drying trend during the spring and summer, which suggests that drought management measures should be put into place at a regional scale, where regional differences in climate might occur. Blauhut et al. (2022) also mention the urgency of an European drought governance approach in the form of a general framework permitting flexible regional management strategies.
All multi-hazard combinations affect moors and heathlands, mainly located along the northern Norwegian-Swedish border and south-western region of Norway (Fig. 5). Dead heather specimens in low humidity air were found by Log et al. (2017) to dry at a surprisingly fast rate, showing they were prone to fire “within two days during wintertime and well within one day in warm weather”. During the winter of 2014, after a 3-week period with no precipitation registered by the Norwegian Meteorological Institute and relatively windy weather, wildfires burned in 2014 a total 35 km2 surface area of heathlands (Log et al., 2017). Prescribed burnings had not been performed in the area over the last 50 years, and resulted in an accumulation of dead heather and thus vegetation susceptible to drying and wildfires (Log et al., 2017; Gjedrem and Metallinou, 2022). Unmanaged heathlands thus pose a fire risk in dry and windy weather, and would benefit from mitigation management measures, especially with fire and drought frequency expected to increase in boreal ecosystems.
The main land cover types at risk of heat-related multi-hazards in Scandinavia are vegetated (broad-leaved forests, coniferous forest, sparsely vegetated areas). In multi-hazard hotspots, namely along the northern Norwegian-Swedish border, south-western region of Norway, central Sweden and in the south-eastern region of Finland, forest management mitigation measures could be implemented to decrease this risk. Certain zones at high risk of multi-hazards have actually seen an expansion of a specific land cover (for example Norwegian broad-leaved forests). These regions would benefit from implementing suitable adaptation measures, to decrease the vulnerability of such areas. Not anticipating possible hazards could result in economic losses if a hazard does occur, for example California's timber production was severely affected by a forest die-off event attributed to the 2012–2015 drought (Sleeter et al., 2018). As Sweden's and Finland's economies rely on wood products production and export, it is important to ensure forested areas are adapted to droughts, wildfires and heat waves, particularly when anthropogenic climate change is predicted to intensify fire and drought frequency in boreal ecosystems (Girardin et al., 2010; IPCC, 2021). Especially, our economic assessment of the impact of 2018 multi-hazards reveals a varying and wide-spreading result across sectors and regions, particularly in Europe. Consistent with Beillouin et al. (2020), Bakke et al. (2020) and Gustafsson et al. (2019), our results include reduced agriculture, energy and forestry output in the Scandinavian region as the direct impacts. The sectoral-specific impacts also transfer to other sectors in the Scandinavian economy. For example, we find a decrease in manufacturing production caused by reduced intermediate inputs of agriculture, energy and forestry goods. At the same time, we also find an increase in the production of oil and gas due to the substitution effect of less electricity production. Furthermore, the compound event of 2018 also affected the trade of forestry goods because of the vital role of Scandinavia in the international wood market. This led to a moderate yet widespread effect on GDP losses, affecting not only the Scandinavian region but also trading patterns, particularly in Europe.
To validate the findings from the economic impact assessment, we compared our results with the observed price trends of electricity and forestry products. Since agricultural goods in Scandinavia tend to be more regulated (through subsidies and state-controlled food reserves) than other goods, the agricultural prices did not respond so much to extreme weather events. Collecting CPI from Statistics Sweden (2025b) and roundwood prices from Swedish Forest Agency (2025), we find in 2018 the average real price of sawlogs and pulpwood increased by 6 % and 12 % respectively. In Norway, the real price of timber products increased by 13 % in 2018, based on data from Statistics Norway (2025). In Finland, the real price of timber products increased by 4 % in 2018, using data from Natural Resources Institute Finland (2025). Similarly, the real price of electricity also surged, growing notably by 50 % in Norway (Statistics Norway, 2024b), 12 % in Sweden (Statistics Sweden, 2025a) and 5 % in Finland (Statistics Finland, 2025). Our study finds moderate yet consistent directional change in the prices of forestry products and electricity as shown in Fig. 9. The larger price changes observed in empirical data can be attributed to the broader market dynamics caused by the 2018 multi-hazard. At the same time, in the real world market, short-term speculative behavior can drive prices higher as traders and businesses anticipate future production disruptions, a feature not captured in the GRACE model.
We find it remains challenging to validate impacts on GDP levels using empirical observations. This is because our study isolates the effect of the 2018 events, whereas the observed values in the national accounts are influenced by various factors beyond the specific multi-hazard events in this study. However, we find that the growth of real GDP in Scandinavia showed down from 2.4 % in 2017 to 1.4 % in 2018, based on World Bank (2025). The reduced growth rate potentially reflects the extensive economic consequences of the 2018 events at the aggregate level.
Sparsely vegetated areas could also benefit from monitoring drought or fire risk in the area. Human activity is responsible for more than 80 % of wildfires in Europe, with data suggesting that about 60 % of fires are started deliberately (EEA, 2021), and human-induced fires spread faster than lightning-induced fires (Hantson et al., 2020). Awareness campaigns to reduce the risk of ignition in areas where vegetation is vulnerable to drought or fire could be carried out by regional governments. Bare rocks are at such a high risk of heat-related multi-hazards due to Sutanto et al. 's (2020) calculations being based on atmospheric data and soil moisture. Bare rocks have low moisture content compared to vegetation, which could explain that they cross the soil moisture drought threshold when only looking at soil moisture. However, as the CLC includes “naturally sparsely vegetated areas” in the classification, these sparsely vegetated areas could also be at risk of heat-related events.
Through the integration of different methodologies, including spatial analysis and the GRACE model, this research assesses the economic impacts of the 2018 heatwave, drought, and wildfires in Scandinavia. However, beyond applying these tools, one of our key contributions lies in the explicit multi-hazard perspective, as hazards rarely occur in isolation. Single climate events in Scandinavia, such as increased temperature, have been shown to enhance production in certain sectors. For instance, moderate warming may extend the growing season and can benefit the agriculture and forestry sectors (Maracchi et al., 2005). However, our study highlights that when extreme heat co-occurs with drought and fire, the overall economic impact is widespread across multiple sectors. This underscores the importance of analyzing multi-hazard dynamics rather than assuming independent effects.
This study has potential limitations for risk mapping, evaluating impacts, among others. The multi-hazard risk maps were put together using atmospheric data originally used for a heatwave, drought and wildfire risk analysis of continental Europe, which resulted in coarser resolution when cropping to the Scandinavian region. The aim of this study was not to generate new data but to use this previous research to produce multi-hazard risk maps of the selected regions. Due to the scope of this study, the land cover datasets were retrieved from Copernicus' Land Monitoring Service instead of national land cover datasets. This helped keep the land cover analysis consistent for all three countries included in the study, but also rendered a coarse land cover map of Scandinavia.
When assessing the economic impacts of 2018 multi-hazard, our approach also faces certain limitations. First, there is a lack of robust models capable of evaluating the physical impact of multi-hazards on energy and agriculture production. In this research, we employ historical data to estimate the direct impacts of climate change-relevant multi-hazards. Employing past events as a reference point for extreme scenarios could potentially lead to underestimations. Second, our current assessment does not include climate change impacts in regions outside the primary area of study, which may have a significant effect on the socioeconomic impact in the Scandinavia country. This highlights the need for more comprehensive data collection and modeling to assess the direct and indirect impact of multi-hazards in a broader scope.
Moreover, in this paper, we narrow our focus to the impacts of the multi-hazard event that directly affected Norway, Sweden, and Finland. However, empirically, the event spanned a broader geographic area, including other parts of Central and Northern Europe, such as Germany (Rousi et al., 2023). Therefore, this study aims to illustrate the economic impact of the 2018 multi-hazard event at a limited geographic scale, and the results may underestimate the full extent of the impact compared to the actual situation.
Three main extensions of this study could be potentially considered. Firstly, since drought risk was calculated by Sutanto et al. (2020) by looking at soil moisture data, which specifies soil moisture drought, this study could also be expanded to consider another type of drought (such as hydrological or meteorological drought) when calculating drought risk. Blauhut et al. (2022) recommend, to improve drought risk management, to look at different types of drought, which use different indicators and impact different sectors. For example, a study done by Asner et al. (2015) assessed the 2012-2015 drought in California by looking at forest canopy loss, which displayed a broader range of drought-affected forests than was seen with visual mapping approaches. Secondly, multi-hazard risk maps were generated using past atmospheric data, from 2000 to 2018; an extension of this study could be made by building multi-hazard risk maps on future climate scenarios. Various studies have looked at future drought risk in Europe, such as research conducted by Roudier et al. (2015) and Spinoni et al. (2017), which could provide geospatial data to map future drought risk. Third, we suggest a close investigation into how the stock and productivity of forestry were affected by the 2018 multi-hazards using land surface models, for example, Community Land Model (CLM) (Lawrence et al., 2019). The approach would provide a more accurate assessment of the losses in the forestry sector and also help to refine its spill-over effect on the broader economy. We also recommend extending similar sectoral-specific models for agriculture and energy sectors to capture the full scope of 2018 multi-hazard impacts.
Despite these limitations, by moving towards assessments that include compounding effects, modeling multi-hazards provides a more realistic representation of systemic risks, offering insights into indirect impacts that single-hazard models often overlook, and thereby improving the relevance of impact assessments.
Forest management and adaptation measures are crucial to reducing the risk of heat-related multi-hazards in vulnerable vegetated areas of Scandinavia, particularly in multi-hazard hotspots like the Norwegian-Swedish border, as droughts and wildfires, intensified by climate change, could severely impact timber production and regional economies reliant on wood exports. The findings of this study can provide guidance for policy makers regarding forest management in Scandinavia in the current context of anthropogenic climate change. By highlighting the interconnectedness of heat-related events, we aim to emphasize the importance of anticipating these hazards, particularly droughts and wildfires, ultimately mitigating their impacts on the environment and the economy.
To better understand the interplay of multi-hazard risk of heatwaves, droughts and wildfires in a multi-sectoral context and to improve disaster risk management in a multi-hazard setting, we assess the occurrence of these hazards using a spatial analysis of compound heatwave, droughts and wildfires events from 2000 to 2018 in Scandinavia. Our results show that high risk drought-wildfire events occur twice as often as heat-wildfire, and heat-drought events, with occurrences up to 166 d of the summer seasons between 2000–2018. Furthermore, our analysis suggests that hotspots for compound drought, heat, and wildfire events in Scandinavia are primarily concentrated along the Norwegian coast and the northern Norwegian-Swedish border, with significant overlap in areas prone to all multi-hazard combinations, while inland regions are generally not at risk. When looking at the economic impacts of the 2018 compound multi-hazard events, an 0.08 % GDP drop in Scandinavia was observed, primarily impacting the forestry sector, which saw a 3.04 % decline, alongside cross-sectoral effects and increased prices in agriculture, forestry, and electricity. Furthermore, the same event led to a 29.39 % reduction in Scandinavian forestry exports, causing a ripple effect across Europe, with trade balance declines in five European regions and a 0.05 % overall drop in the trade balance due to the disruption in the global supply of forestry products. Effective forest management and adaptation are key to reducing the risk of heat-related multi-hazards in vulnerable Scandinavian regions, especially along the Norwegian-Swedish border, where droughts and wildfires, exacerbated by climate change, threaten timber production and regional economies. This study offers guidance for policymakers on mitigating these interconnected hazards to protect both the environment and the economy.
The tables below represent the estimation results of the exposure-response function for the agriculture and energy production using stepwise selection process, respectively.
Table A1Estimates of exposure-response function of agriculture production.
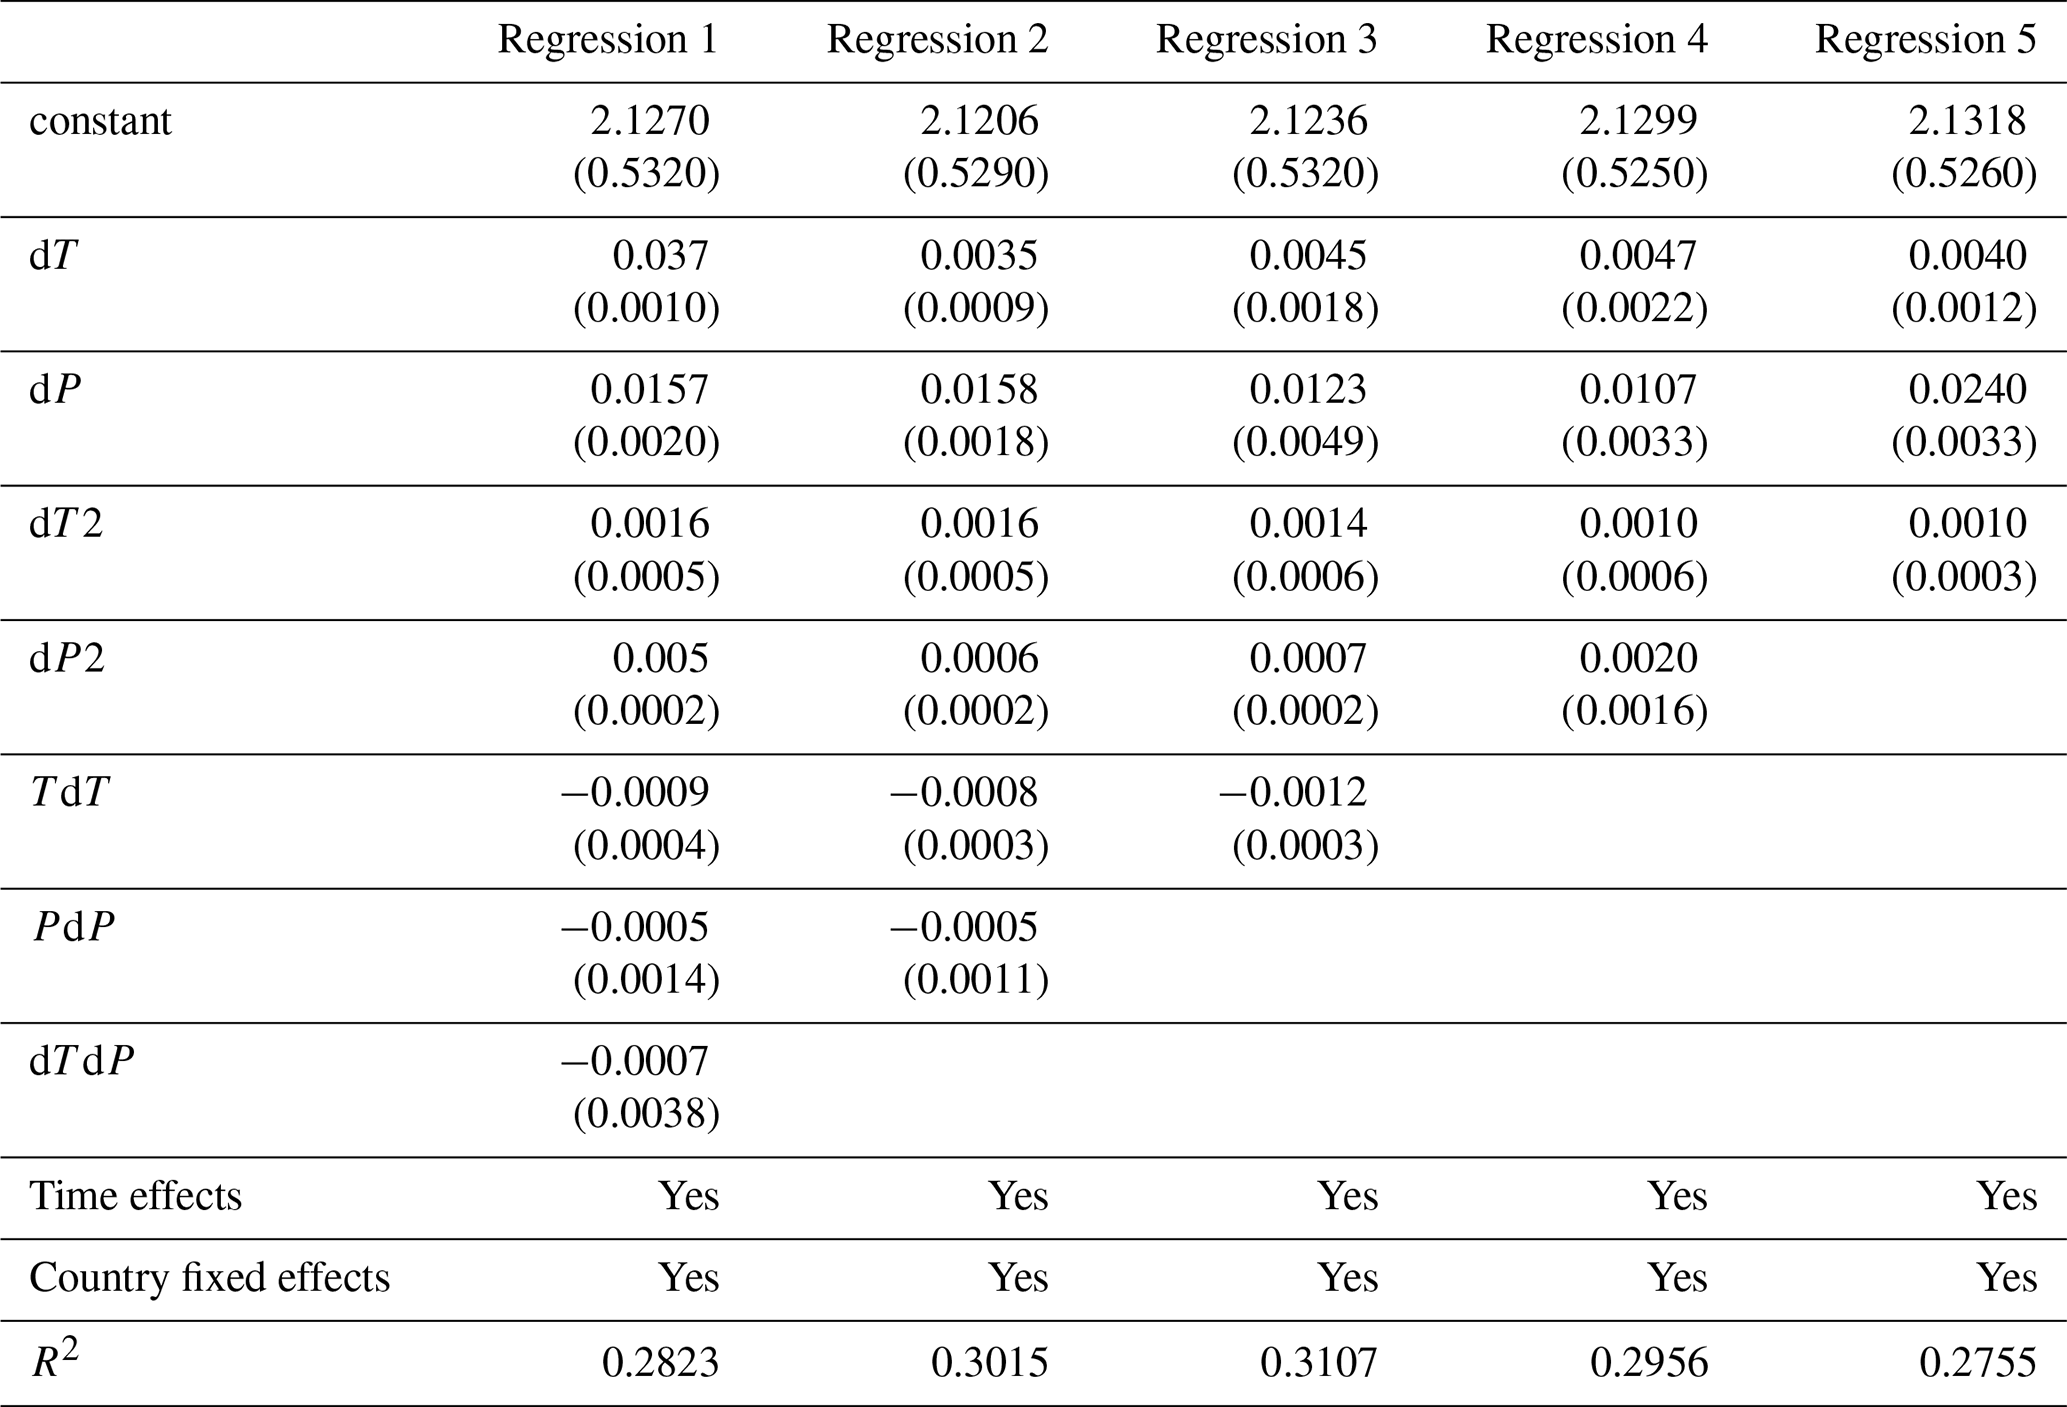
Table A2Estimates of exposure-response function of energy production.
ERA5 reanalysis data is openly available from the Copernicus Climate Change Service (C3S) Climate Data Store (CDS) at https://doi.org/10.24381/cds.adbb2d47 (Hersbach et al., 2023).
CORINE Land Cover data (CLC) is openly available from the Copernicus Land Monitoring Service at https://land.copernicus.eu/en/products/corine-land-cover (last access: 30 April 2025).
Author contributions follow the CRediT authorship categories.
GD: Conceptualization, Writing – Original Draft, Data Curation. TT: Conceptualization, Writing – Review and Editing, Supervision. LM: Software, Writing – Original Draft, Data Curation. ASD: Conceptualization, Writing – Review and Editing. NS: Investigation, Software, Writing – Original Draft. JC: Conceptualization, Writing – Review and Editing, Supervision. MdR: Conceptualization, Writing – Review and Editing, Supervision.
The contact author has declared that none of the authors has any competing interests.
This article is part of the special issue “Methodological innovations for the analysis and management of compound risk and multi-risk, including climate-related and geophysical hazards (NHESS/ESD/ESSD/GC/HESS inter-journal SI)”. It is not associated with a conference.
Publisher's note: Copernicus Publications remains neutral with regard to jurisdictional claims made in the text, published maps, institutional affiliations, or any other geographical representation in this paper. While Copernicus Publications makes every effort to include appropriate place names, the final responsibility lies with the authors. Views expressed in the text are those of the authors and do not necessarily reflect the views of the publisher.
TT, ASD, LM, and MdR were supported by the European Union's Horizon 2020 funded project MYRIAD-EU (grant no. 101003276). MCR also received support from the Netherlands Organisation for Scientific Research (NWO) (VENI; grant no. VI.Veni.222.169). Furthermore, this study was partially supported by the ACRoBEAR project, a project under the Belmont Forum Collaborative Research Action on Climate, Environment and Health.
This research has been supported by the European Union's Horizon 2020 funded project MYRIAD-EU (grant no. 101003276).
This paper was edited by Robert Sakic Trogrlic and reviewed by two anonymous referees.
Aaheim, A., Amundsen, H., Dokken, T., and Wei, T.: Impacts and adaptation to climate change in European economies, Global Environmental Change, 22, 959–968, https://doi.org/10.1016/j.gloenvcha.2012.06.005, 2012.
Aaheim, A., Orlov, A., Wei, T., and Glomsrød, S.: GRACE model and application, CICERO Report series 2018:1, CICERO, Oslo, https://pub.cicero.oslo.no/cicero-xmlui/handle/11250/2480843?locale-attribute=en (last access: 21 November 2025), 2018.
AghaKouchak, A., Chiang, F., Huning, L. S., Love, C. A., Mallakpour, I., Mazdiyasni, O., Moftakhari, H., Papalexiou, S. M., Ragno, E., and Sadegh, M.: Climate extremes and compound hazards in a warming world, Annu. Rev. Earth. Pl. Sc., 48, 519–548, https://doi.org/10.1146/annurev-earth-071719-055228, 2020.
Aguiar, A., Chepeliev, M., Corong, E. L., McDougall, R., and Van Der Mensbrugghe, D.: The GTAP data base: Version 10, Journal of Global Economic Analysis, 4, 1–27, https://doi.org/10.21642/jgea.040101af, 2019.
Asner, G. P., Brodrick, P. G., Anderson, C. B., Vaughn, N., Knapp, D. E., and Martin, R. E.: Progressive forest canopy water loss during the 2012–2015 California drought, Proceedings of the National Academy of Sciences, 113, https://doi.org/10.1073/pnas.1523397113, 2015.
Åström, C., Bjelkmar, P., Forsberg, B.: Attributing summer mortality to heat during 2018 heatwave in Sweden, Environmental Epidemiology, 3, 16–17, https://doi.org/10.1097/01.ee9.0000605788.56297.b5, 2019.
Bakke, S. J., Ionita, M., and Tallaksen, L. M.: The 2018 northern European hydrological drought and its drivers in a historical perspective, Hydrol. Earth Syst. Sci., 24, 5621–5653, https://doi.org/10.5194/hess-24-5621-2020, 2020.
Beillouin, D., Schauberger, B., Bastos, A., Ciais, P., and Makowski, D.: Impact of extreme weather conditions on European crop production in 2018, Philos. Trans. R. Soc. Lond. B Biol. Sci., 375, 20190510, https://doi.org/10.1098/rstb.2019.0510, 2020.
Berrang-Ford, L., Siders, A. R., Lesnikowski, A., Fischer, A. P., Callaghan, M. W., Haddaway, N. R., Mach, K. J., Araos, M., Shah, M. a. R., Wannewitz, M., Doshi, D., Leiter, T., Matavel, C., Musah-Surugu, J. I., Wong-Parodi, G., Antwi-Agyei, P., Ajibade, I., Chauhan, N., Kakenmaster, W., Grady, C., Chalastani, V., Jagannathan, K., Galappaththi, E., Sitati, A., Scarpa, G., Totin, E., Davis, D., Hamilton, N. C., Kirchhoff, C.J., Kumar, P., Pentz, B., Simpson, N. P., Theokritoff, E., Deryng, D., Reckien, D., Zavaleta-Cortijo, C., Ulibarri, N., Segnon, A. C, Khavhagali, V., Shang, Y., Zvogbo, L., Zommers, Z., Xu, J., Williams, P. A., Canosa, I. V., van Maanen, N., van Bavel, B., van Aalst, M., Turek-Hankins, L. L., Trivedi, H., Trisos, C. H., Thomas, A., Thakur, S., Templeman, S., Stringer, L. C., Sotnik, G., Sjostrom, K. D., Singh, C., Siña, M. Z., Shukla, R., Sardans, J., Salubi, E. A., Chalkasra, L. S. S., Ruiz-Díaz, R., Richards, C., Pokharel, P., Petzold, J., Penuelas, J., Avila, J. P., Murillo, J. B. P., Ouni, S., Niemann, J., Nielsen, M., New, M., Schwerdtle, P. N., Alverio, G. N., Mullin, C. A., Mullenite, J., Mosurska, A., Morecroft, M. D., Minx, J. C., Maskell, G., Nunbogu, A. M., Magnan, A. K., Lwasa, S., Lukas-Sithole, M., Lissner, T., Lilford, O., Koller, S. F., Jurjonas, M., Joe, W. T., Huynh, L. T. M., Hill, A., Hernandez, R. R., Hegde, G., Hawxwell, T., Harper, S., Harden, A., Haasnoot, M., Gilmore, E. A., Gichuki, L., Gatt, A., Garschagen, M., Ford, J. D., Forbes, A., Farrell, A. D., Enquist., C. A. F., Elliott, S., Duncan., E., Coughlan de Perez, E., Coggins, S., Chen, T., Campbell, D., Browne, K. E., Bowen, K. J., Biesbroek, R., Bhatt, I. D, Kerr, R. B., Barr, S. L., Baker, E., Austin, S. E., Arotoma-Rojas, I., Anderson, C., Ajaz, W., Agrawal, T., and Abu, T. Z. : A systematic global stocktake of evidence on human adaptation to climate change, Nat. Clim. Change, 11, 989–1000, https://doi.org/10.1038/s41558-021-01170-y, 2021.
Blauhut, V., Stoelzle, M., Ahopelto, L., Brunner, M. I., Teutschbein, C., Wendt, D. E., Akstinas, V., Bakke, S. J., Barker, L. J., Bartošová, L., Briede, A., Cammalleri, C., Kalin, K. C., De Stefano, L., Fendeková, M., Finger, D. C., Huysmans, M., Ivanov, M., Jaagus, J., Jakubínský, J., Krakovska, S., Laaha, G., Lakatos, M., Manevski, K., Neumann Andersen, M., Nikolova, N., Osuch, M., van Oel, P., Radeva, K., Romanowicz, R. J., Toth, E., Trnka, M., Urošev, M., Urquijo Reguera, J., Sauquet, E., Stevkov, A., Tallaksen, L. M., Trofimova, I., Van Loon, A. F., van Vliet, M. T. H., Vidal, J.-P., Wanders, N., Werner, M., Willems, P., and Živković, N.: Lessons from the 2018–2019 European droughts: a collective need for unifying drought risk management, Nat. Hazards Earth Syst. Sci., 22, 2201–2217, https://doi.org/10.5194/nhess-22-2201-2022, 2022.
Brown, R. D. and Mote, P. W.: The response of northern hemisphere snow cover to a changing climate, Journal of Climate, 22, 2124–2145, https://doi.org/10.1175/2008jcli2665.1, 2008.
Buras, A., Rammig, A., and Zang, C. S.: Quantifying impacts of the 2018 drought on European ecosystems in comparison to 2003, Biogeosciences, 17, 1655–1672, https://doi.org/10.5194/bg-17-1655-2020, 2020.
Cattiaux, J. and Ribes, A.: Defining single extreme weather events in a climate perspective, B. Am. Meteorol. Soc., 99, 1557–1568, https://doi.org/10.1175/bams-d-17-0281.1, 2018.
Christensen, O. B., Kjellström, E., Dieterich, C., Gröger, M., and Meier, H. E. M.: Atmospheric regional climate projections for the Baltic Sea region until 2100, Earth Syst. Dynam., 13, 133–157, https://doi.org/10.5194/esd-13-133-2022, 2022.
Copernicus Land Monitoring Service: 3.3.2 Bare rock, CORINE Land Cover nomenclature guidelines, https://land.copernicus.eu/content/corine-land-cover-nomenclature-guidelines/html/index-clc-332.html, last access: 21 November 2025.
Couasnon, A., Eilander, D., Muis, S., Veldkamp, T. I. E., Haigh, I. D., Wahl, T., Winsemius, H. C., and Ward, P. J.: Measuring compound flood potential from river discharge and storm surge extremes at the global scale, Nat. Hazards Earth Syst. Sci., 20, 489–504, https://doi.org/10.5194/nhess-20-489-2020, 2020.
de Ruiter, M. C., Couasnon, A., Van Den Homberg, M. J. C., Daniell, J. E., Gill, J. C., and Ward, P. J.: Why we can no longer ignore consecutive disasters, Earth's Future, 8, https://doi.org/10.1029/2019ef001425, 2020.
de Ruiter, M. C., de Bruijn, J. A.,Englhardt, J., Daniell, J. E., deMoel, H., and Ward, P. J.: The synergies of structural disaster risk reduction measures: Comparing Floods and earthquakes, Earth's Future, 9, e2020EF001531, https://doi.org/10.1029/2020EF001531, 2021.
European Commission: Joint Research Centre, Cammalleri, C., Naumann, G., Mentaschi, L., Formetta, G., Forzieri, G., Gosling, S., Bisselink, B., De Roo, A., and Feyen, L.: Global warming and drought impacts in the EU: JRC PESETA IV project: Task 7, Publications Office, https://data.europa.eu/doi/10.2760/597045 (last access: 30 April 2025), 2020.
European Environmental Agency (EEA): Forest fires in Europe, https://www.eea.europa.eu/en/analysis/indicators/forest-fires-in-europe?activeAccordion=546a7c35-9188-4d23-94ee-005d97c26f2b, last access: 21 November 2025, 2021.
FAOSTAT: Forestry Production and Trade, https://www.fao.org/faostat/en/#data/FO (last access: 30 April 2025), 2024
Fernandez-Anez, N., Krasovskiy, A., Müller, M., Vacik, H., Baetens, J., Hukić, E., Solomun, M. K., Atanassova, I., Glushkova, M., Bogunović, I., Fajković, H., Djuma, H., Boustras, G., Adámek, M., Devetter, M., Hrabalikova, M., Huska, D., Barroso, P. M., Vaverková, M. D., Zumr, D., Jõgiste, K., Metslaid, M., Koster, K., Köster, E., Pumpanen, J., Ribeiro-Kumara, C., Di Prima, S., Pastor, A., Rumpel, C., Seeger, M., Daliakopoulos, I., Daskalakou, E., Kotroulis, A., Papadopoulo, M. P., Stampoulidis, K., Xanthopoulos, G., Aszalós, R., Balázs, D., Kertész, M., Valkó, O., Finger, D. C., Thorsteinsson, T., Till, J., Bajocco, S., Gelsomino, A., Amodio, A. M., Novara, A., Salvati, L., Telesca, L., Ursino, N., Jansons, A., Kitenberga, M., Stivrins, N., Brazaitis, G., Marozas, V., Cojocaru, O., Gumeniuc, I., Sfecla, V., Imeson, A., Veraverbeke, S., Mikalsen, R. F., Koda, E., Osinski, P., Castro, A. C. M., Nunes, J. P., Oom, D., Vieira, D., Rusu, T., Bojović, S., Djordjevic, D., Popovic, Z., Protic, M., Sakan, S., Glasa, J., Kacikova, D., Lichner, L., Majlingova, A., Vido, J., Ferk, M., Tičar, J., Zorn, M., Zupanc, V., Hinojosa, M. B., Knicker, H., Lucas-Borja, M. E., Pausas, J., Prat-Guitart, N., Ubeda, X., Vilar, L., Destouni, G., Ghajarnia, N., Kalantari, Z., Seifollahi-Aghmiuni, S., Dindaroglu, T., Yakupoglu, T., Smith, T., Doerr, S., and Cerda, A. : Current wildland fire patterns and challenges in Europe: A synthesis of national perspectives. Air, Soil and Water Research, 14, 117862212110281, https://doi.org/10.1177/11786221211028185, 2021.
Gjedrem, A. M. and Metallinou, M. M.: Wildland-urban interface fires in Norwegian coastal heathlands – Identifying risk reducing measures, Safety Science, 159, 106032, https://doi.org/10.1016/j.ssci.2022.106032, 2022.
Girardin, M. P., Ali, A. A., and Hély, C.: Wildfires in boreal ecosystems: past, present and some emerging trends, Int. J. Wildland Fire, 19, 991, https://doi.org/10.1071/wfv19n8_fo, 2010.
Gustafsson, L., Berglind, M., Granström, A., Grelle, A., Isacsson, G., Kjellander, P., Larsson, S., Lindh, M., Pettersson, L. B., Strengbom, J., Stridh, B., Sävström, T., Thor, G., Wikars, L., and Mikusiński, G.: Rapid ecological response and intensified knowledge accumulation following a north European mega-fire, Scand. J. Forest. Res., 34, 234–253, https://doi.org/10.1080/02827581.2019.1603323, 2019.
Hantson, S., Andela, N., Goulden, M. L., and Randerson, J. T.: Human-ignited fires result in more extreme fire behavior and ecosystem impacts, Nat. Commun., 13, https://doi.org/10.1038/s41467-022-30030-2, 2022.
Hersbach, H., Bell, B., Berrisford, P., Biavati, G., Horanýi, A., Muñoz Sabater, J., Nicolas, J., Peubey, C., Radu, R., Rozum, I., Schepers, D., Simmons, A., Soci, C., Dee, D., and Thépaut, J.-N.: ERA5 hourly data on single levels from 1940 to present, Copernicus Climate Change Service (C3S) Climate Data Store (CDS) [data set], https://doi.org/10.24381/cds.adbb2d47, 2023.
IPCC: Summary for Policymakers, in: Managing the Risks of Extreme Events and Disasters to Advance Climate Change Adaptation, edited by: Field, C. B., Barros, V., Stocker, T. F., Qin, D., Dokken, D. J., Ebi, K. L., Mastrandrea, M. D., Mach, K. J., Plattner, G.-K., Allen, S. K., Tignor, M., and Midgley, P. M.: A Special Report of Working Groups I and II of the Intergovernmental Panel on Climate Change, Cambridge University Press, Cambridge, UK, and New York, NY, USA, 19 pp., https://www.ipcc.ch/site/assets/uploads/2018/03/SREX_FD_SPM_final-2.pdf (last access: 21 November 2025), 2012.
IPCC: Climate Change 2021: The Physical Science Basis. Contribution of Working Group I to the Sixth Assessment Report of the Intergovernmental Panel on Climate Change, edited by: Masson-Delmotte, V., Zhai, P., Pirani, A., Connors, S. L., Péan, C., Berger, S., Caud, N., Chen, Y., Goldfarb, L., Gomis, M. I., Huang, M., Leitzell, K., Lonnoy, E., Matthews, J. B. R., Maycock, T. K., Waterfield, T., Yelekçi, O., Yu, R., and Zhou, B., Cambridge University Press, Cambridge, United Kingdom and New York, NY, USA, in press, https://doi.org/10.1017/9781009157896, 2021.
Kueh, M. and Lin, C.: The 2018 summer heatwaves over northwestern Europe and its extended-range prediction, Sci. Rep.-UK, 10, https://doi.org/10.1038/s41598-020-76181-4, 2020.
Lawrence, D. M., Fisher, R. A., Koven, C. D., Oleson, K. W., Swenson, S. C., Bonan, G., Collier, N., Ghimire, B., van Kampenhout, L., Kennedy, D., Kluzek, E., Lawrence, P. J., Li, F., Li, H., Lombardozzi, D., Riley, W. J., Sacks, W. J., Shi, M., Vertenstein, M., Wieder, W. R., Xu, C., Ali, A. A., Badger, A. M., Bisht, G., van den Broeke, M., Brunke, M. A., Burns, S. P., Buzan, J., Clark, M., Craig, A., Dahlin, K., Drewniak, B., Fisher, J. B., Flanner, M., Fox, A. M., Gentine, P., Hoffman, F., Keppel-Aleks, G., Knox, R., Kumar, S., Lenaerts, J., Leung, L. R., Lipscomb, W. H., Lu, Y., Pandey, A., Pelletier, J. D., Perket, J., Randerson, J. T., Ricciuto, D. M., Sanderson, B. M., Slater, A., Subin, Z. M., Tang, J., Thomas, R. Q., Val Martin, M., and Zeng, X.: The Community Land Model Version 5: Description of new features, benchmarking, and impact of forcing uncertainty: Journal of Advances in Modeling Earth Systems, 11, 4245–4287, https://doi.org/10.1029/2018ms001583, 2019.
Log, T., Thuestad, G., Velle, L. G., Khattri, S. K., and Kleppe, G. : Unmanaged heathland – A fire risk in subzero temperatures?, Fire Safety J., 90, 62–71, https://doi.org/10.1016/j.firesaf.2017.04.017, 2017.
Lindberg, H., Punttila, P., and Vanha-Majamaa, I.: The challenge of combining variable retention and prescribed burning in Finland, Ecological Processes, 9, https://doi.org/10.1186/s13717-019-0207-3, 2020.
Lund, M. T., Nordling, K., Gjelsvik, A. B., and Samset, B. H.: The influence of variability on fire weather conditions in high latitude regions under present and future global warming, Environmental Research Communications, 5, 065016, https://doi.org/10.1088/2515-7620/acdfad, 2023.
Maracchi, G., Sirotenko, O. and Bindi, M.: Impacts of Present and Future Climate Variability on Agriculture and Forestry in the Temperate Regions, Europe. Climatic Change 70, 117–135, https://doi.org/10.1007/s10584-005-5939-7, 2005.
Manuel, L., Chiziane, O., Mandhlate, G., Hartley, F., and Tostão, E.: Impact of climate change on the agriculture sector and household welfare in Mozambique: an analysis based on a dynamic computable general equilibrium model, Climatic Change, 167, https://doi.org/10.1007/s10584-021-03139-4, 2021.
Matano, A., Van Loon, A., de Ruiter, M., Koehler, J., de Moel, H., and Ward, P.: Compound Drought-Flood Events in Fragile Contexts: Examples from the Horn of Africa, EGU General Assembly 2021, online, 19–30 Apr 2021, EGU21-10148, https://doi.org/10.5194/egusphere-egu21-10148, 2021.
Mazdiyasni, O. and AghaKouchak, A.: Substantial increase in concurrent droughts and heatwaves in the United States, Proceedings of the National Academy of Sciences, 112, 11484–11489, https://doi.org/10.1073/pnas.1422945112, 2015.
Moftakhari, H., Schubert, J. E., AghaKouchak, A., Matthew, R. A., and Sanders, B. F.: Linking statistical and hydrodynamic modeling for compound flood hazard assessment in tidal channels and estuaries, Adv. Water Resour., 128, 28–38, https://doi.org/10.1016/j.advwatres.2019.04.009, 2019.
Nagler, T., Schepsmeier, U., Stoeber, J., Brechmann, E., Graeler, B., and Erhardt, T.: VineCopula: Statistical Inference of Vine Copulas. R package version 2.6.0, https://CRAN.R-project.org/package=VineCopula (last access: 30 April 2025), 2024.
National Report 2018: Report Nr. 74/2018, https://publikasjoner.nve.no/rapport/2018/rapport2018_74.pdf (last access: 21 November 2025), 2018.
Natural Resources Institute Finland: Volumes and prices in industrial roundwood trade, https://www.luke.fi/en/statistics/volumes-and-prices-in-industrial-roundwood-trade (last access: 30 April 2025), 2025.
Ntombela, C., Nyhodo, B., Ngqangweni, S., and Phahlane, H.: Economy-wide effects of drought on South African Agriculture: A computable general equilibrium (CGE) analysis, Journal of Development and Agricultural Economics, 9, 46–56, https://doi.org/10.5897/jdae2016.0769, 2017.
NVE: Electricity disclosure 2018, https://www.nve.no/norwegian-energy-regulatory-authority/retail-market/electricity-disclosure-2018/ (last access: 18 November 2025), 2018.
NVE: Magasinstatistikk, https://www.nve.no/energi/analyser-og-statistikk/magasinstatistikk/ (last access: 30 April 2025), 2024.
Paprotny, D., Kreibich, H., Morales-Nápoles, O., Castellarin, A., Carisi, F., and Schröter, K.: Exposure and vulnerability estimation for modelling flood losses to commercial assets in Europe, Sci. Total Environ., 737, 140011, https://doi.org/10.1016/j.scitotenv.2020.140011, 2020.
Raymond, C., Horton, R. M., Zscheischler, J., Martius, O., AghaKouchak, A., Balch, J., Bowen, S. G., Camargo, S. J., Hess, J., Kornhuber, K., Oppenheimer, M., Ruane, A. C., Wahl, T., and White, K.: Understanding and managing connected extreme events, Nat. Clim. Change, 10, 611–621, https://doi.org/10.1038/s41558-020-0790-4, 2020.
Roudier, P., Andersson, J. C. M., Donnelly, C., Feyen, L., Greuell, W., and Ludwig, F.: Projections of future floods and hydrological droughts in Europe under a +2 °C global warming, Climatic Change, 135, 341–355, https://doi.org/10.1007/s10584-015-1570-4, 2015.
Rousi, E., Fink, A. H., Andersen, L. S., Becker, F. N., Beobide-Arsuaga, G., Breil, M., Cozzi, G., Heinke, J., Jach, L., Niermann, D., Petrovic, D., Richling, A., Riebold, J., Steidl, S., Suarez-Gutierrez, L., Tradowsky, J. S., Coumou, D., Düsterhus, A., Ellsäßer, F., Fragkoulidis, G., Gliksman, D., Handorf, D., Haustein, K., Kornhuber, K., Kunstmann, H., Pinto, J. G., Warrach-Sagi, K., and Xoplaki, E.: The extremely hot and dry 2018 summer in central and northern Europe from a multi-faceted weather and climate perspective, Nat. Hazards Earth Syst. Sci., 23, 1699–1718, https://doi.org/10.5194/nhess-23-1699-2023, 2023.
Schipper, E. L. F.: Maladaptation: When adaptation to climate change goes very wrong, One Earth, 3, 409–414, https://doi.org/10.1016/j.oneear.2020.09.014, 2020.
Schuhen, N., Iles, C. E., Cattiaux, J., and Sillmann, J.: Defining compound extreme events on objective spatiotemporal scales, in preparation, 2025.
Scolobig, A., Komendantova, N., and Mignan, A.: Mainstreaming Multi-Risk Approaches into Policy, Geosciences, 7, 129, https://doi.org/10.3390/geosciences7040129, 2017.
Sklar, A.: Fonctions de répartition à n dimensions et leurs marges, Publications de l'Institut de statistique de l'Université de Paris, 8, 229–231, 1959.
Sleeter, B., Loveland, T. R., Domke, G. M., Herold, N., Wickham, J., and Wood, N. J.: Chapter 5: Land Cover and Land Use Change, edited by: Reidmiller, D. R., Avery, C. W., Easterling, D. R., Kunkel, K. E., Lewis, K. L. M., Maycock, T. K., and Stewart, B. C., Impacts, Risks, and Adaptation in the United States: The Fourth National Climate Assessment, Washington, DC: U.S. Global Change Research Program, 2, 202–231, https://doi.org/10.7930/nca4.2018.ch5, 2018.
Spensberger, C., Madonna, E., Boettcher, M., Grams, C. M., Papritz, L., Quinting, J. F., Röthlisberger, M., Sprenger, M., and Zschenderlein, P.: Dynamics of concurrent and sequential Central European and Scandinavian heatwaves, Q. J. R. Meteorol Soc., 146, 2998–3013, https://doi.org/10.1002/qj.3822, 2020.
Solomon, R., Simane, B., and Zaitchik, B. F.: The impact of climate change on agriculture production in Ethiopia: Application of a Dynamic Computable general equilibrium model, American Journal of Climate Change, 10, 32–50, https://doi.org/10.4236/ajcc.2021.101003, 2021.
Spinoni, J., Vogt, J. V., Naumann, G., Barbosa, P., and Dosio, A.: Will drought events become more frequent and severe in Europe?, Int. J. Clim. Change Str., 38, 1718–1736, https://doi.org/10.1002/joc.5291, 2017.
Statistics Finland: 13rb – Price of electricity by type of consumer, https://pxdata.stat.fi/PxWeb/pxweb/en/StatFin/StatFin__ehi/statfin_ehi_pxt_13rb.px/ (last access: 30 April 2025), 2025.
Statistics Norway: National Accounts, https://www.ssb.no/en/nasjonalregnskap-og-konjunkturer/nasjonalregnskap/statistikk/nasjonalregnskap (last access: 30 April 2025), 2024a.
Statistics Norway: Electricity prices, https://www.ssb.no/en/statbank/table/09364 (last access: 30 April 2025), 2024b.
Statistics Norway: Commercial roundwood removal, https://www.ssb.no/en/statbank/table/07413 (last access: 30 April 2025), 2025.
Statistics Sweden: Electricity prices and electricity contracts, https://www.statistikdatabasen.scb.se/pxweb/en/ssd/START__EN___EN0301/SSDManadElhandelpris/ (last access: 30 April 2025), 2025a.
Statistics Sweden: Statistical database: Consumer Price Index (CPI), https://www.scb.se/en/finding-statistics/statistics-by-subject-area/prices-and-economic-trends/price-statistics/consumer-price-index-cpi/ (last access: 30 April 2025), 2025b.
Sutanto, S. J., Vitolo, C., Di Napoli, C., D'Andrea, M., and Van Lanen, H. A.: Heatwaves, droughts, and fires: Exploring compound and cascading dry hazards at the pan-European scale, Environ. Int., 134, 105276, https://doi.org/10.1016/j.envint.2019.105276, 2020.
Swedish Forest Agency: Statistical Database: Price on roundwood, https://pxweb.skogsstyrelsen.se/pxweb/en/Skogsstyrelsens%20statistikdatabas/?rxid=03eb67a3-87d7-486d-acce-92fc8082735d (last access: 18 November 2025), 2025.
Teutschbein, C., Montano, B. Q., Todorović, A., and Grabs, T.: Streamflow droughts in Sweden: Spatiotemporal patterns emerging from six decades of observations, Journal of Hydrology Regional Studies, 42, 101171, https://doi.org/10.1016/j.ejrh.2022.101171, 2022.
Tilloy, A., Malamud, B. D., Winter, H., and Joly-Laugel, A.: A review of quantification methodologies for multi-hazard interrelationships, Earth-Science Reviews, 196, 102881, https://doi.org/10.1016/j.earscirev.2019.102881, 2019.
United Nations Office for Disaster Risk Reduction (UNDRR): The Sendai Framework Terminology on Disaster Risk Reduction, “Economic loss”, https://www.undrr.org/terminology/economic-loss (last access: 21 November 2025), 2017.
United Nations Office for Disaster Risk Reduction (UNDRR): Sendai Framework for Disaster Risk Reduction 2015-2030, https://www.preventionweb.net/media/16176/download?startDownload=20251121, last access: 21 November 2025.
Wahl, T., Jain, S., Bender, J., Meyers, S. D., and Luther, M. E.: Increasing risk of compound flooding from storm surge and rainfall for major US cities, Nat. Clim. Change, 5, 1093–1097, https://doi.org/10.1038/nclimate2736, 2015.
Ward, P. J., De Ruiter, M. C., Mård, J., Schröter, K., Van Loon, A., Veldkamp, T., Von Uexkull, N., Wanders, N., AghaKouchak, A., Arnbjerg-Nielsen, K., Capewell, L., Llasat, M. C., Day, R., Dewals, B., Di Baldassarre, G., Huning, L. S., Kreibich, H., Mazzoleni, M., Savelli, E., Teutschbein, C., van den Berg, H., van der Heijden, A., Vincken, J. M. R., Waterloo, M. J., and Wens, M.: The need to integrate flood and drought disaster risk reduction strategies, Water Security 11, 100070, https://doi.org/10.1016/j.wasec.2020.100070, 2020.
Wilcke, R. A. I., Kjellström, E., Lin, C., Matei, D., Moberg, A., and Tyrlis, E.: The extremely warm summer of 2018 in Sweden – set in a historical context, Earth Syst. Dynam., 11, 1107–1121, https://doi.org/10.5194/esd-11-1107-2020, 2020.
World Bank: GDP (constant 2015 US$), https://data.worldbank.org/indicator/NY.GDP.MKTP.CD (last access: 30 April 2025), 2025.
Zscheischler, J. and Seneviratne, S. I. : Dependence of drivers affects risks associated with compound events, Sci. Adv., 3, e1700263, https://doi.org/10.1126/sciadv.1700263, 2017.
The European countries are Austria, Belgium, Bulgaria, Croatia, Cyprus, Czech Republic, Denmark, Estonia, Finland, France, Germany, Greece, Hungary, Ireland, Italy, Latvia, Lithuania, Luxembourg, Malta, Netherlands, Poland, Portugal, Romania, Slovakia, Slovenia, Spain, Sweden, United Kingdom, Switzerland, Norway, Albania, Belarus, Ukraine.
The results on the country level impacts are aggregated into 8 sub-regions within Europe. Scandinavia includes Norway, Sweden and Finland. Baltic States include Estonia, Latvia, Lithuania. The British Isles include Ireland and the United Kingdom. Eastern Central Europe includes Denmark, Germany, Netherlands, Belgium and Luxembourg. Eastern Central Europe includes the Czech Republic, Hungary, Poland, Slovakia, Slovenia, Albania, Bulgaria, Belarus, Croatia, Romania, and Ukraine. Iberian Peninsula includes Spain and Portugal. Southern Central Europe includes Cyprus, Greece, and Italy. Western Central Europe includes Malta, Austria, and France.
- Abstract
- Introduction
- Data and Methods
- Results
- Discussion
- Limitations and outlook
- Conclusions
- Appendix A: Exposure-response function estimation
- Data availability
- Author contributions
- Competing interests
- Special issue statement
- Disclaimer
- Acknowledgements
- Financial support
- Review statement
- References