the Creative Commons Attribution 4.0 License.
the Creative Commons Attribution 4.0 License.
 | 18 Nov 2025
Flood hazard mapping and disaster prevention recommendations based on detailed topographical analysis in Khovd City, Western Mongolia
Serdyanjiv Narangerel
Yasuhiro Suzuki
Tomonori Hasegawa
Yoshiyuki Takaichi
The impacts of climate change manifest heterogeneously across regions, and in Khovd City, a semi-arid area in Western Mongolia, the escalating threat of flooding is evident through the occurrence of 10 flash floods in the last 30 years. The risk zone, encompassing rivers and flash floods, endangers ca. 32 000 residents, with 750–1800 traditional nomadic dwellings (gers) located on the floodplain of the Buyant River during the summer. Furthermore, prolonged rains pose a flash flood risk to households in the province's center. Therefore, flood disaster prevention strategies must be tailored to semi-arid regions, as they differ significantly from those employed for river flooding in humid areas. In Khovd, residential areas are limited, and land use is not highly dense. In addition, since flood water levels are not high, knowledge of the location and direction of flood flow paths and places where water is likely to be collected in advance is essential for disaster risk reduction. Under these conditions, mapping using detailed DEM and identifying the extent of past floods using satellite images are important. We measured by Real-Time Kinematic on 22 Ground Control Points and collected 15 206 aerial photos for drone mapping under Unmanned Aerial Vehicle in Khovd City. This is an example of how to create a hazard map for a remote area based on a topographical analysis of detailed Digital Elevation Model, and discusses a methodology for using this map to help prevent flooding disasters. The resulting flood hazard map identified four flood risk areas based on flood flow direction and topographical features.
- Article
(11110 KB) - Full-text XML
- BibTeX
- EndNote


Most cities worldwide are located within the basins of large rivers (Tanaka et al., 2017), and this is also true for cities and provincial centers in Mongolia that traditionally chose areas with abundant surface water, despite the associated high risk of flooding (Narangerel and Suzuki, 2024; Oyunbaatar, 2004). The flood risk is of particular concern in climates characterized by short-term but intense rainfall events and significant snowmelt potential. One major indicator of climate change is the distribution and intensity of precipitation in semi-arid regions (Groisman et al., 2005; Sato et al., 2007). Generally, there has been a decrease in mild rain and an increase in extreme and heavy rainfall events in Mongolia (Goulden et al., 2016; Ministry of Environment and Tourism, 2018). The escalating frequency of sudden floods in semi-arid zones, attributed to global climate change (Sato et al., 2007; Suzuki et al., 2019), poses a particularly high risk to cities in the semi-arid and mountainous regions of Western Mongolia. If climate change and warming continue to increase steadily, the frequency of heavy rainfall is expected to rise nearly fourfold, and the likelihood of flood disasters is high, as stated in both international and domestic reports (IPCC AR6 2022).
In general, Western Mongolia refers to the territory of the western part of Mongolia including 5 provinces (Aimags) such as Bayan-Ulgii, Uvs, Zavkhan, Gobi-Altai, and Khovd. Recent flood events in the Bayan-Ulgii aimag in 2016 and 2018 (Mongolian Red Cross Society, 2019) and Uvs aimag in 2016 and 2020 have had severe consequences, with casualties and damage to both households and local infrastructure. A study by Narangerel et al. (2024) highlighted that Khovd City of Western Mongolia is highly susceptible to flash floods and river floods, with 10 floods in the last 30 years. Notably, floods in 2018 and 2022 affected more than 230 families, causing damage to homes and belongings. The floods in the mountainous regions of Western Mongolia exemplify the significant vulnerability of Western Mongolia to climate change (Ministry of Environment and Tourism, 2018). The increased occurrence and intensity of floods in the region can be explained by the increase of summer rainfall (Goulden et al., 2016) and melting of glaciers in the Altai Mountains (Pan et al., 2019). The Meteorological Organization of Mongolia has conducted several studies in this field (Ministry of Environment and Tourism, 2018). A recent example of disastrous consequences of changing hydrological condition is the landslide of Mount Tsambagarav (4208 m a.s.l.) in Western Mongolia in 2021. Zagdsuren et al. (2021) linked the flood in the Khusni River valley to the melting of glaciers in Mount Tsambagarav.
Mongolia currently lacks natural hazard maps for high-risk areas, making it imperative to conduct flood hazard mapping through detailed topographical analysis. Recent technological advancements have enabled the use of Unmanned Aerial Vehicles (UAVs) to produce high-precision topographic maps and support flood estimation in the study and assessment of natural disasters (Restas, 2015; Weintrit et al., 2018; Yang et al., 2022). In Mongolia, UAVs are widely used in agricultural quality assessment, mining geodesy research, detailed analysis of natural disaster processes and damage, as well as data collection in emergency areas. However, the use of this technology for developing flood hazard maps is an area where experience has yet to be fully established.
The present study examines hazard areas associated with rainfall-derived river floods and flash floods affecting Khovd City. It takes into account geomorphological elements such as terrace profiles, floodplains, riverbeds, gullies, and depressions to generate detailed topographical and directional hazard maps. This flood hazard mapping study complements previous research on flood occurrences and historical floods in Khovd City, offering valuable insights to the Administration of Government and the Emergency Department of Khovd for protecting citizens from flood hazards. As extreme weather events increase in frequency, determining the direction of floodwaters through topographic analysis is essential for making scientifically informed decisions regarding the construction of new buildings, road development, and drainage planning.
In addition, Narangerel and Suzuki (2024) identified historical floods that occurred in the last 30 years in Khovd City. Using assessments of the damage caused by those floods and surveys among local residents, the authors proposed strategies to improve flood protection facilities and necessary countermeasures future. Building on previous research, the current study emphasizes the need for flood hazard assessment and mapping in Khovd City. The recent expansion of residential areas and the growing number of households approximately 1800 in the flood-prone Buyant River valley have significantly increased the area's vulnerability to flooding. With Khovd city's population exceeding 32 000 and expected growth, a detailed flood hazard map becomes crucial for implementing effective prevention and response measures.
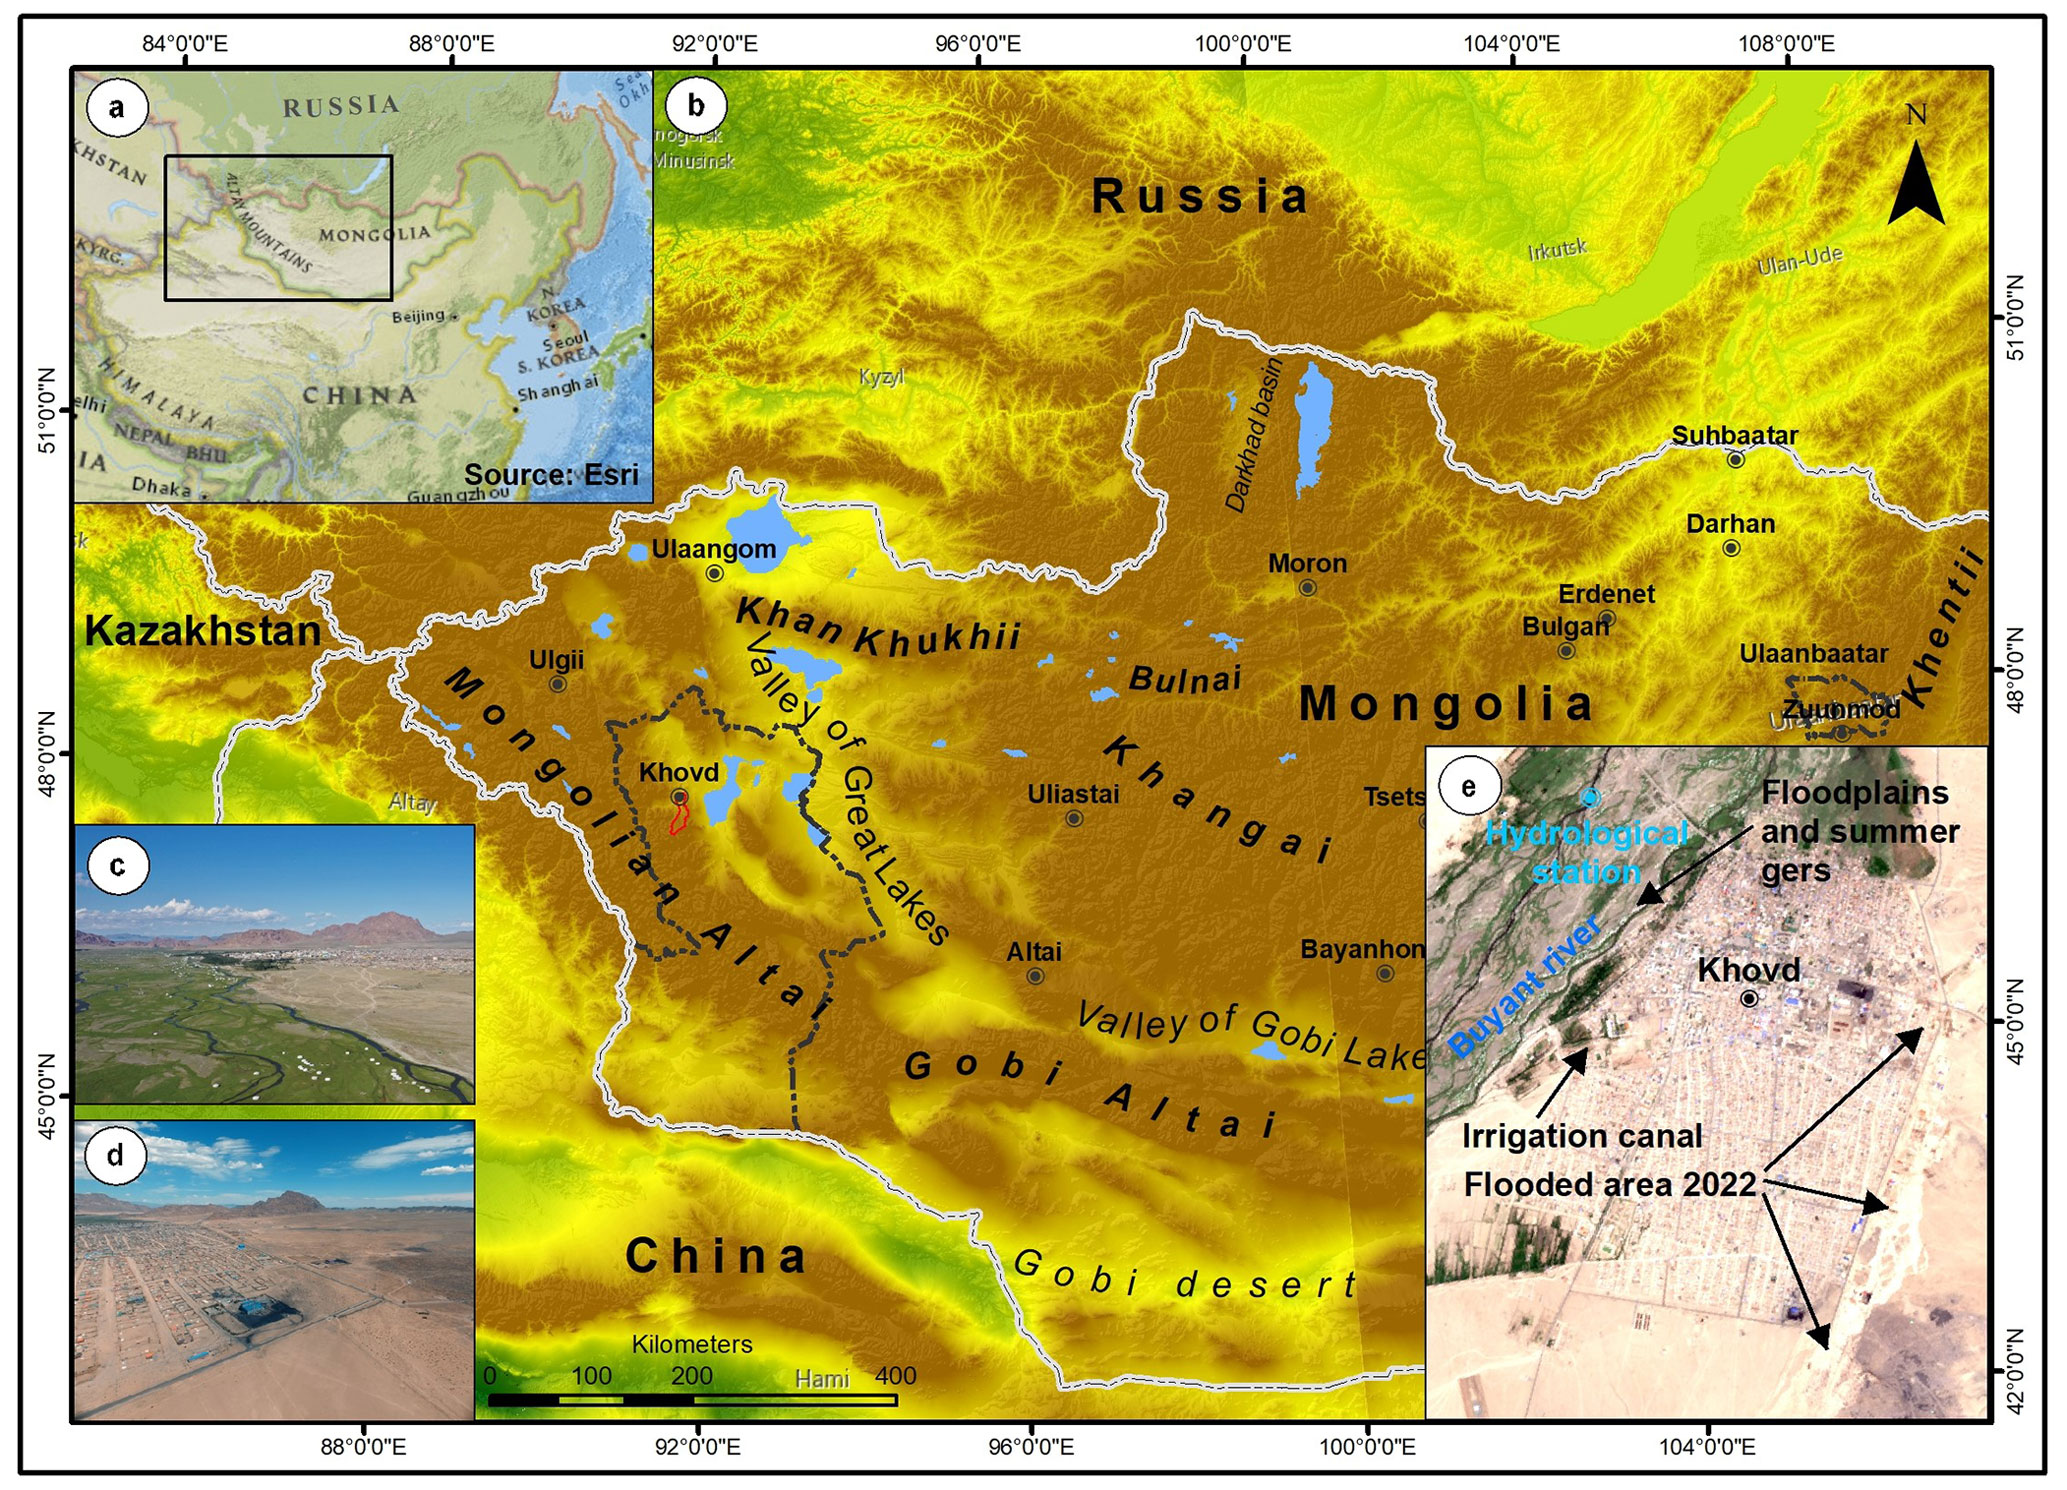
Figure 1Geographical settings and location of the study area of Khovd aimag in Western Mongolia (a, b). The red area shows the exact study area, including a western (c) and eastern (d) side. Photo of Khovd City, highlighting features such as the Buyant River floodplain, branches, streams (e), and the Khovd City area (e-Sentinel 2 satellite image).
The Khovd aimag (province), is located in the Mongolian-Altai mountain range, which constitutes a unique part of the Central Asian mountain system, representing the highest and longest young tectonic mountain systems in the country (Kor Heerema, 2013). Geographically, Khovd aimag shares borders with Bayan-Ulgii aimag to the west, Uvs aimag to the north, Zavkhan and Govi-Altai aimags to the east, and China to the south (Fig. 1). The aimag hosts diverse natural zones, with the northeastern part characterized by the lowlands of the Khyargas and Khar-Us lake depressions, desert steppes, and a dry semi-arid desert subzone. The central region features the mountain steppes of the southern part of the Mongolian Altai, while the southern part is marked by the desert depression of “Baruun Khuurain”. The provincial capital, Khovd City, is located in the valley of the Buyant River, a significant river in Western Mongolia (Kor Heerema, 2013; Nara and Battulga, 2019). Khovd City, with its distinctive geographic structure is home to diverse ethnic groups and recognized as one of the historical cities (Nara and Battulga, 2019; Suzuki et al., 2019).
Khovd City, located at 1405 m a.s.l. and 1487 km from the capital city Ulaanbaatar, serves as our research site and encomasses the Jargalant soum (within a province) with a total area of 70 km2. The Jargalant soum experiences an extremely continental climate, characterized by dry temperate and mountainous conditions (Beher, 2014). The catchment area of the flash flood gully spans 338 km2, and water accumulated in this region can flow into the eastern part of Khovd City. Located at the bottom of a large floodplain within a gully, Khovd City is vulnerable to both flash and river floods. The Buyant River valley, which passes near Khovd City, is 1.5 to 2.5 km wide and contains 2 to 3 branches. It experiences spring and summer floods from snow melt water. Flash floods in the Mongolian Altai typically begin in mid-April and peak in late June. Summer runoff in the rivers of the Mongolian Altai mountain range ends by mid-September, and during the winter season, the river is covered by a stable ice cover that lasts for 4 to 5 months. Due to minimal runoff in winter, some large rivers freeze to the bottom. The annual maximum runoff of the Buyant River gradually increased between 1980 and 2009, with a significant intensification over the last decade due to increased summer rainfall. Despite this trend, ca. 750 to 1800 gers and residents continue to spend their summers in the flood risk zone, exposing them to higher risks (Narangerel et al., 2024).
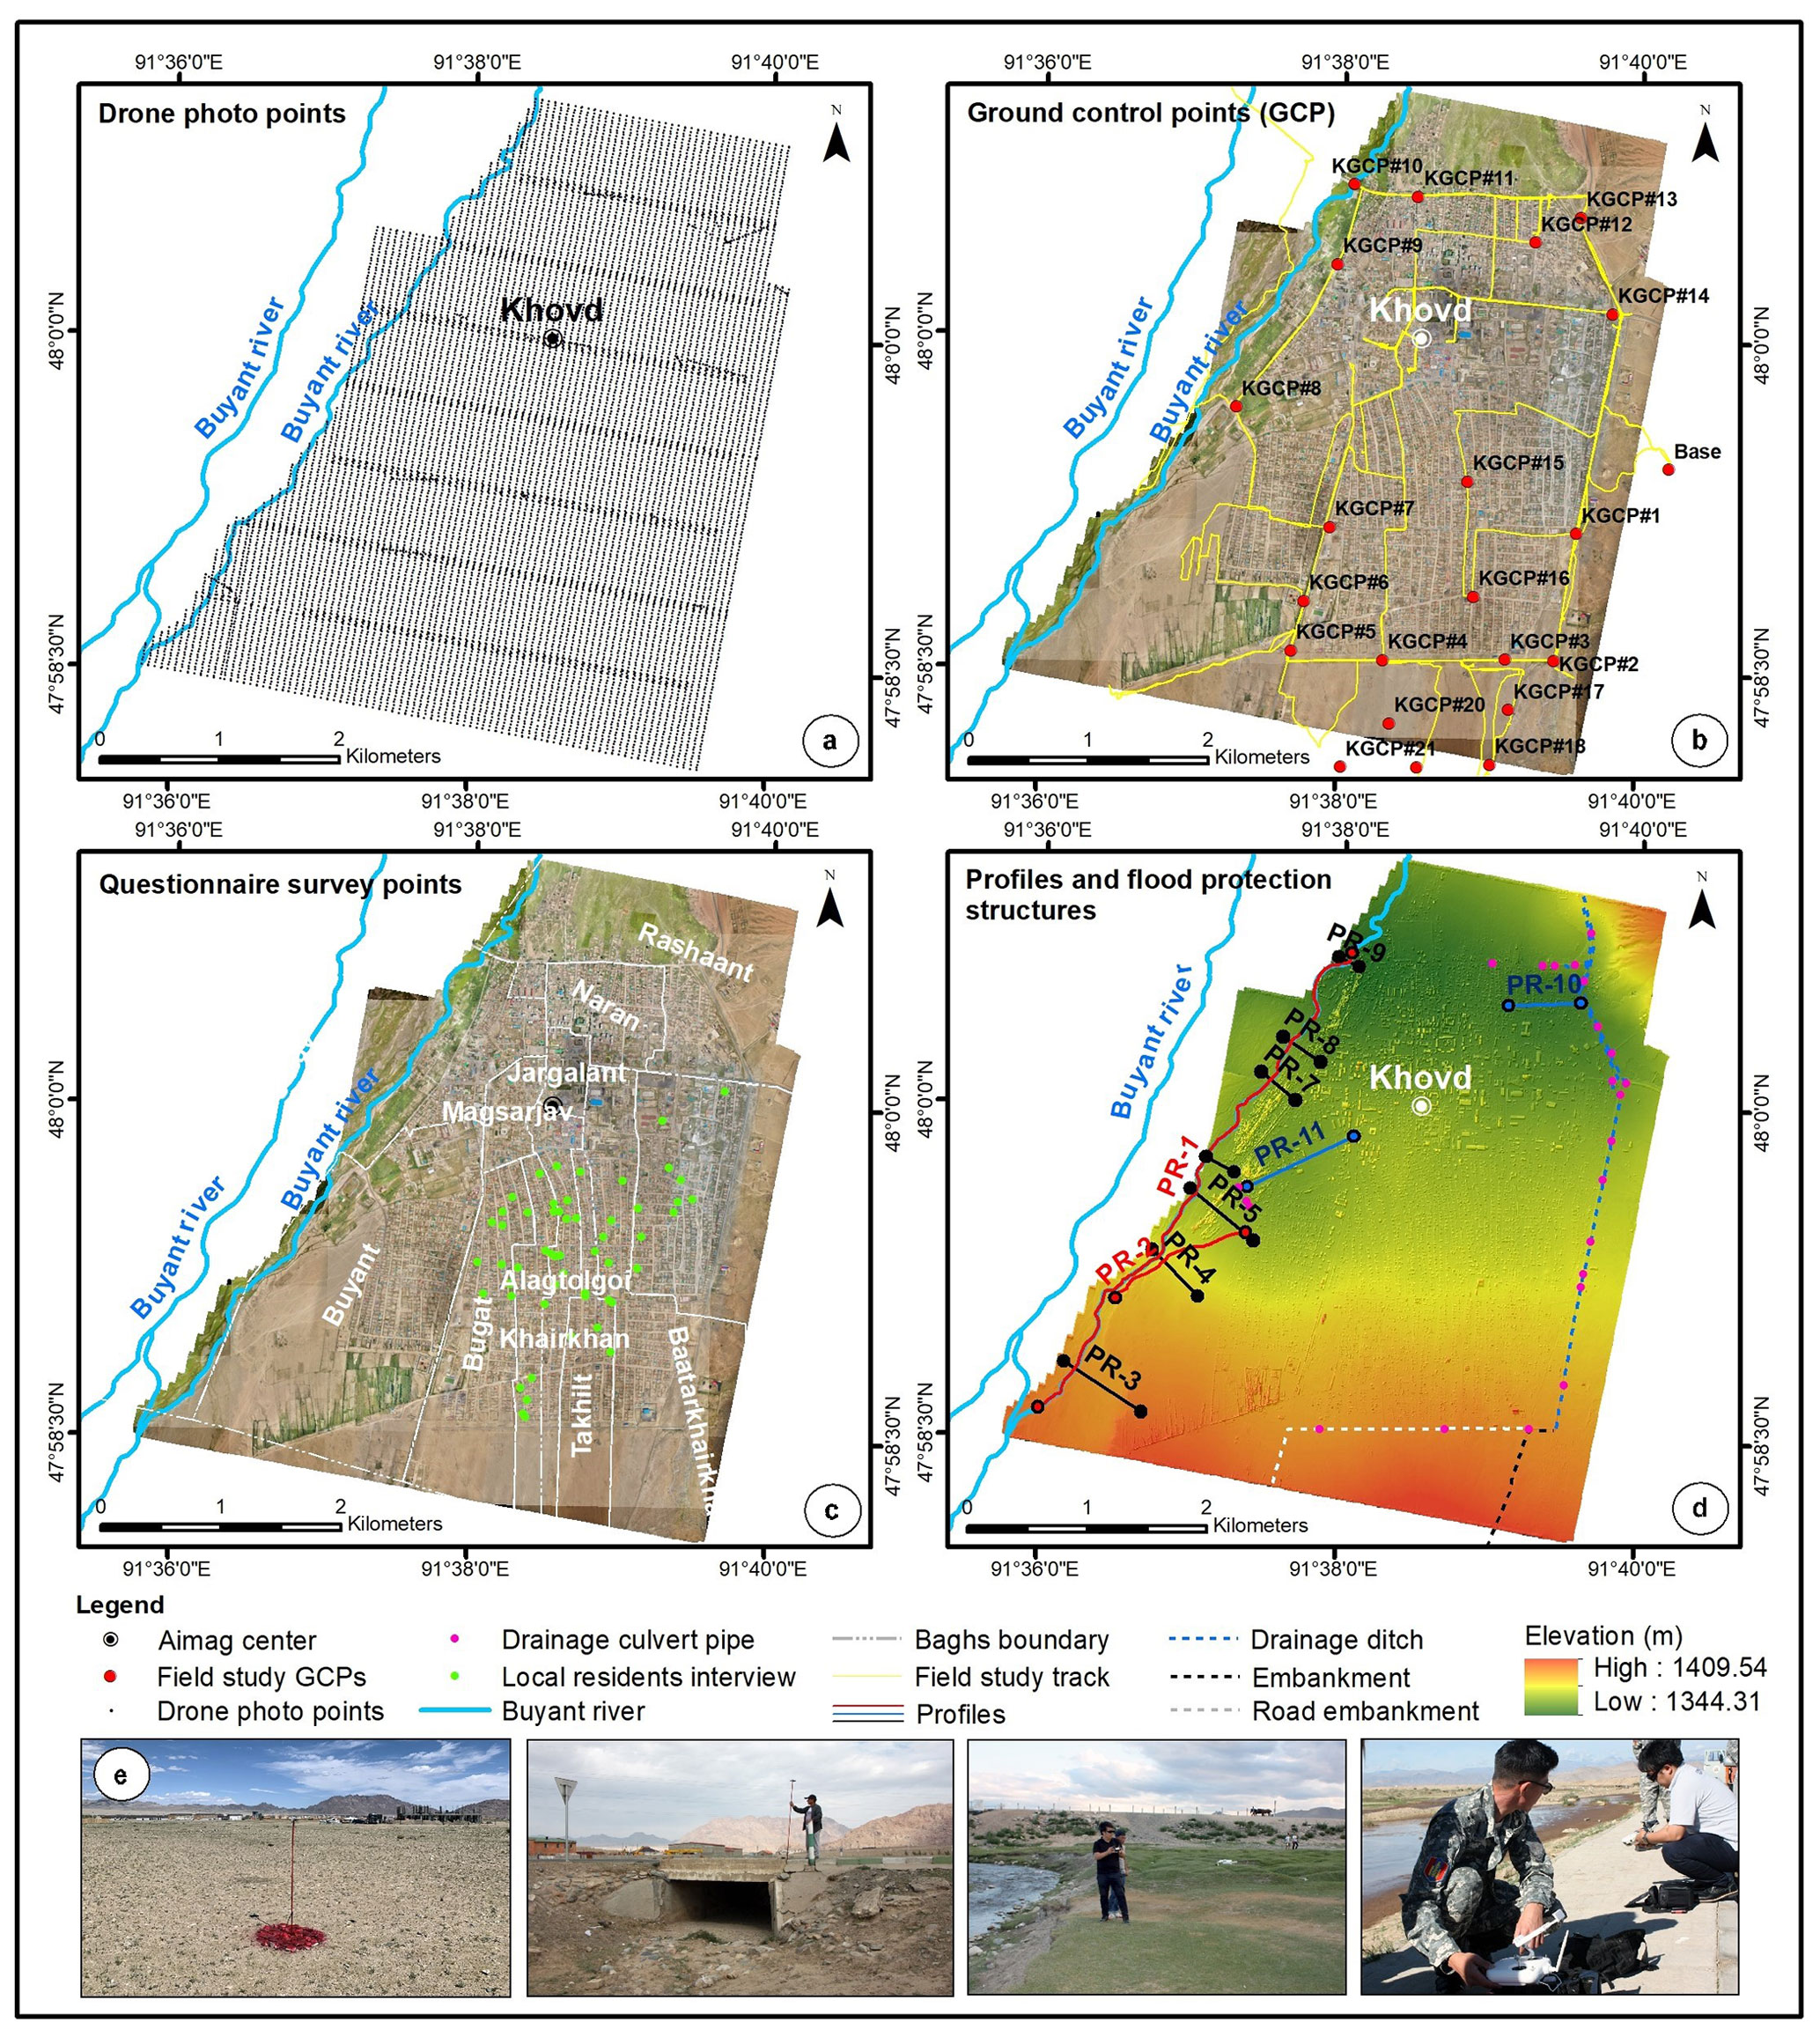
Figure 2Field study works and observation (a, b, c, d, e). There were included drone photo points by UAV (a), ground control points (GCP) by Real-time Kinematic (RTK) measurement (b, e), interview locations with local residents (c) and geomorphological profile points and flood protection structures (d).
The Jargalant soum of Khovd aimag consists of 12 baghs (within soum, the lowest administrative units in Mongolia), with ca. 32 000 people residing in Khovd City. In the coming years, the population is expected to grow, and the city will continue to expand. The city itself is situated on a relatively flat surface, formed by an alluvial fan with a low slope. Notably, a large mountain gully carries floodwaters from the southeastern part of the city, and historical records indicate that 10 flash floods have occurred through this gully, causing damage to numerous households (Nara and Battulga, 2019). Due to the city's surface conditions, the impact of flash floods varies by location, and the resulting damage depends on the area affected. After the flood of 1994, the Khovd administration constructed the initial embankment to block the main channel, redirecting floodwater through the eastern part of the city. The local government renovated the embankment in 2014, resulting in a 4.12 km protective embankment on the front side of Khovd City, extending from the airport to the east side of the city, reaching heights of 0.6–1.8 m and widths of 0.8–2.8 m. Furthermore, a 4.24 km drainage channel/ditch, 0.8–2.0 m deep and 1–3 m wide (shallow and narrow in some parts), connects with the embankment. Additionally, a 2.24 km drainage ditch was constructed on the opposite side of the road, serving as a supplementary protection measure in some areas. Around the city center, ca. 20 drainage structures with diameters ranging from 1–1.5 m are mostly located on the east side of Khovd city's flood channel (Fig. 2d). These flood protection structures were not built according to standards, making them poorly equipped to withstand major floodwaters and ineffective in providing adequate flood protection.
3.1 Photogrammetry by drone
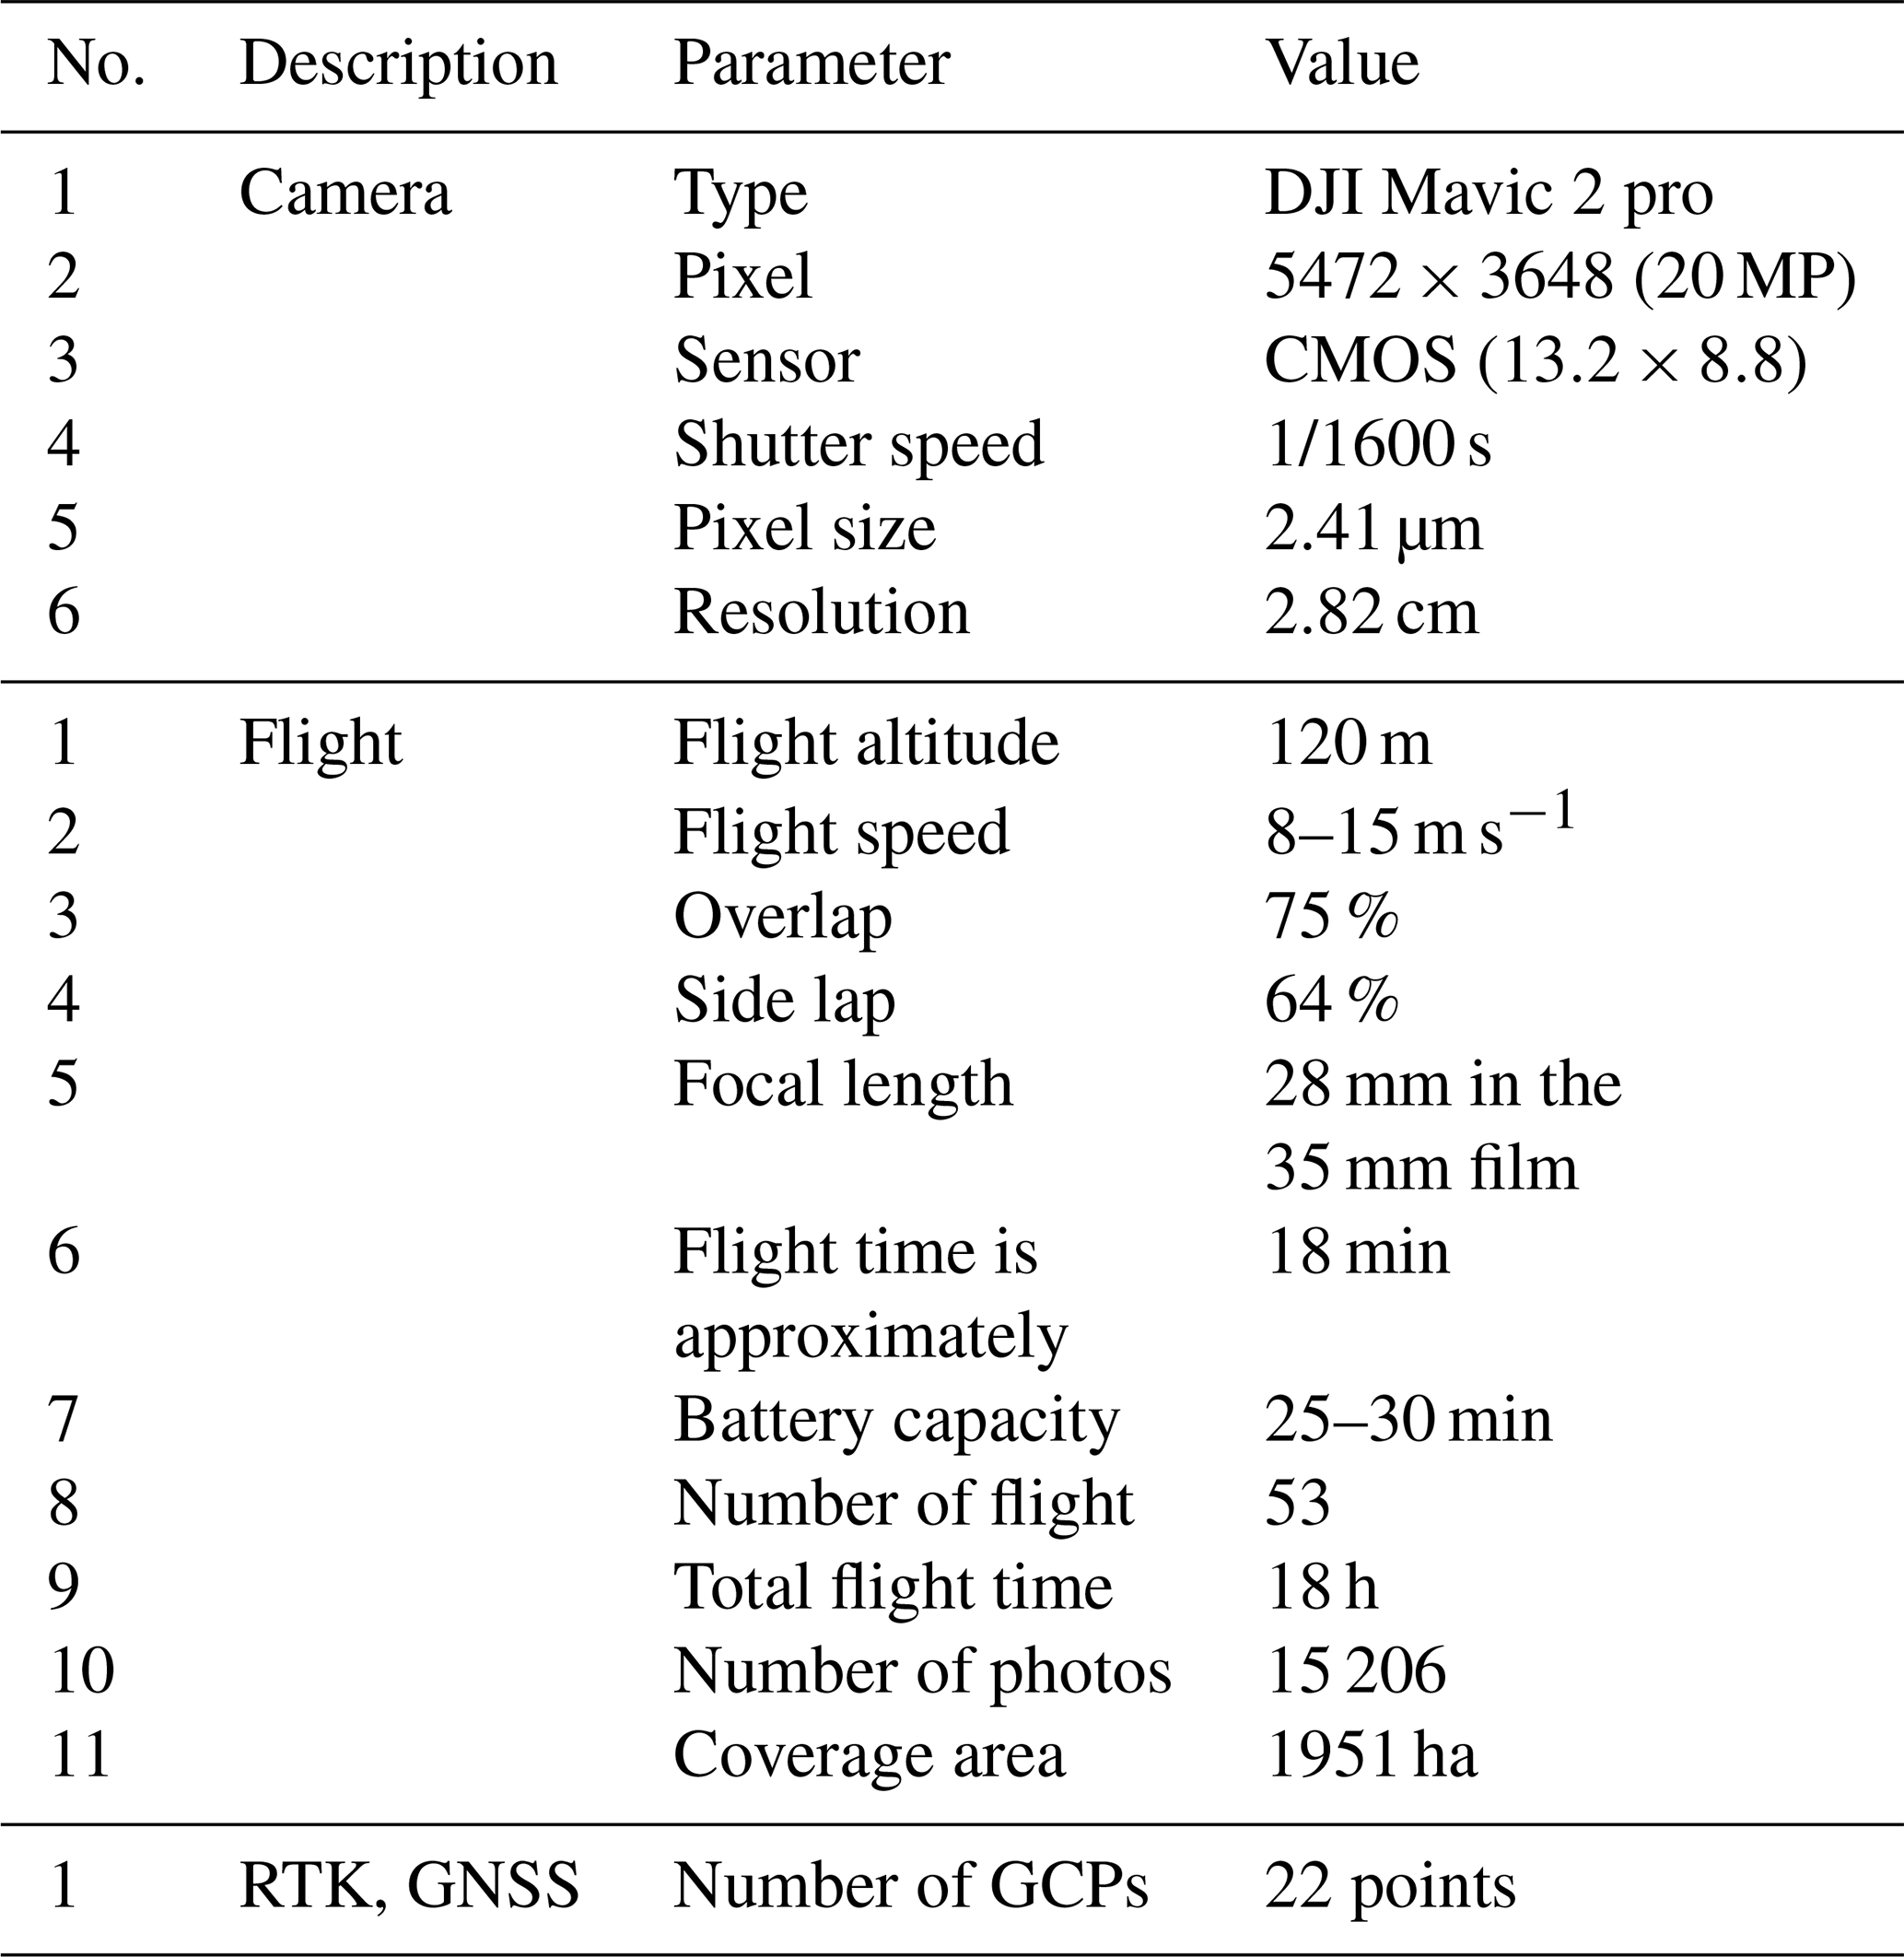
Unmanned aerial vehicles (UAV) are used to develop high-precision topographic maps that enable flood risk calculations (Remondino et al., 2011; Restas, 2015; Weintrit et al., 2018; Yang et al., 2022). Specifically, UAVs have proven to be highly suitable for detailed mapping of small-scale flood processes and have gained popularity in flood research due to their ability to efficiently capture high-resolution imagery (Bilaşco et al., 2022; Diakakis et al., 2019; Yang et al., 2022). In August 2019, as part of our field study, we captured 15 206 aerial photographs using the DJI Mavic 2 Pro UAV (Fig. 2a) and analyzed them with the Structure from Motion (SfM) program. The specifications of the UAV are detailed in Table 1.
To ensure the accuracy of Structure from Motion (SfM) models, we validated relative and absolute accuracy using Ground Control Points (GCP) collected through a Real-Time Kinematic (RTK) surveying system. RTK positioning is a satellite-based technique used to obtain high-precision, real-time geospatial data. It operates using a base station with known coordinates and a mobile receiver (rover). The base station calculates correction data from GNSS signals and transmits it to the rover, enabling centimeter-level accuracy. RTK is widely applied in topographic mapping, UAV surveys, construction, agriculture, and flood risk analysis (Schumann et al., 2019). RTK measurements were conducted at 22 GCPs, and the data was processed using the “RTK conv, RTK post, and RTK plot” software, thereby providing detailed location and altitude information for GIS analysis (Fig. 2b, e).
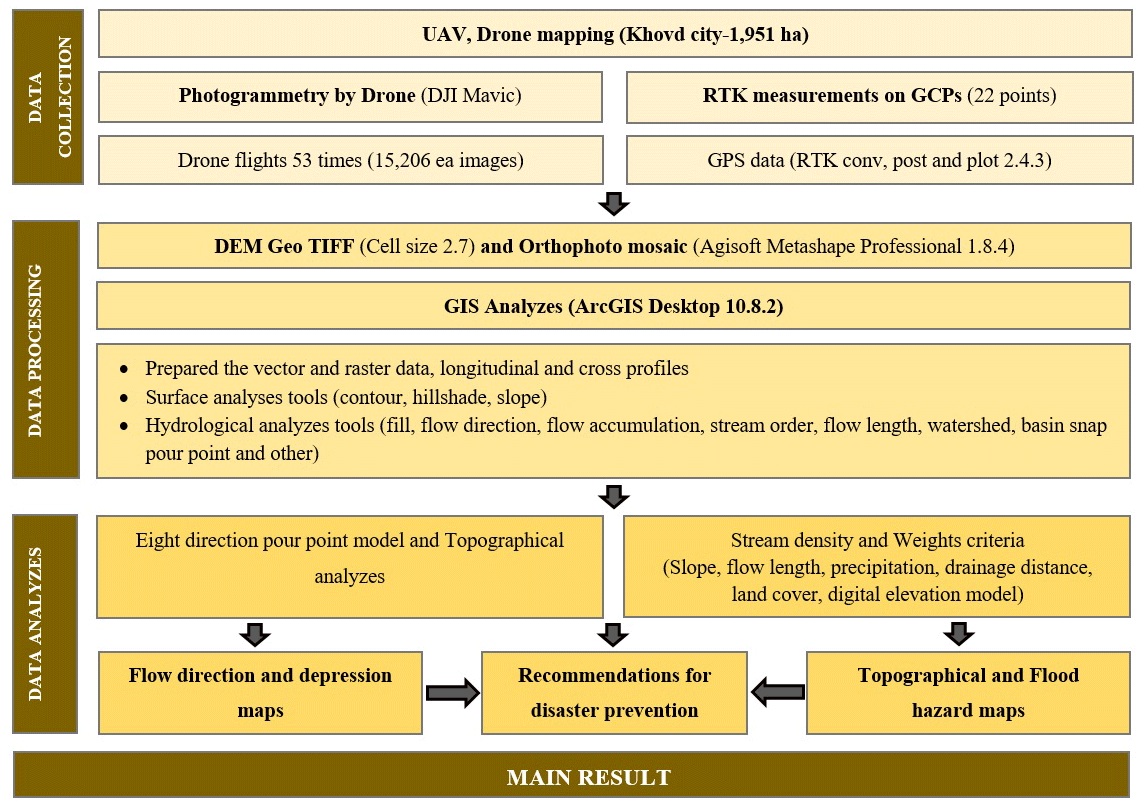
The cartographic processing of this study was carried out following the steps shown in Fig. 3.
As shown in the method workflow, we utilized Agisoft Metashape Professional 1.8.4 software to convert aerial photos into Orthophoto and Digital Elevation Models (OPM and DEM). Agisoft Metashape is an advanced image-based 3D modeling solution designed for professional 3D content creation from still images, offering photogrammetric processing of digital images, including aerial and close-range photography and satellite imagery. The RTK-derived measurements were integrated with aerial imagery to produce a high-precision Digital Elevation Model (DEM). This UAV-derived DEM was subsequently utilized in conjunction with the analytical methods described previously. The integration of these data with remote sensing, simulation modeling, and complementary approaches facilitates a comprehensive and spatially extensive assessment of flood hazards, which is critical for the development of effective flood risk management strategies. During the field survey, flood embankments, ditches, and water pipes were identified and mapped on-site (Fig. 2d). Additionally, during the field mapping process, flood hazard areas were verified using questionnaires from local residents (Fig. 2c).
3.2 Topographic and morphometrical survey for estimated flood channel
We employed UAV-generated DEM (Khatami and Khazaei, not documented; Leitão and de Sousa, 2018; Li, 2014; Turcotte et al., 2001) data to assess topographic and hydrological conditions. As shown in the Fig. 3, flow direction and stream network density mapping were based on fieldwork and UAV-generated DEM (2.7 m). An orthoimage and a DEM were created using the UAV data and a flood hazard map was developed for Khovd City. Catchment area and stream calculations were performed using ArcGIS Desktop (10.8.2), with thematic images developed using DEM data in ArcGIS. We employed the “Spatial Analyst tool”, “Surface” (Contour, Hillshade, Slope), and “Hydrology” (Fill, Flow direction, Flow accumulation, Stream order, Flow length, Watershed Basin, Snap pour point and others) functionalities in the ArcGIS software for flood risk contour and flow direction map development (Eight Direction Pour Point Model) (Castelltort and Simpson, 2006; Khatami and Khazaei, not documented; Leitão and de Sousa, 2018; Li, 2014; Turcotte et al., 2001; Xu et al., 2001). Based on the newly developed DEM we generated geomorphological longitudinal section profiles at two points along the Buyant River and irrigation canal and cross-section profiles at nine points from the Buyant River to the city center. Additionally, geomorphological cross-sections were created in the depression areas using ArcGIS to identify flood risk areas (Fig. 2d).
3.3 Topographic numerical information analysis
Topography plays a crucial role in cartographic science, providing a quantitative assessment of the shape and landform of the surface relief, commonly depicted through contour lines. The digitalization of topographic maps is of great importance for the analysis of topographic numerical information (Govedarica and Borisov, 2011; Ruhoff et al., 2011).
Here, we developed topographical maps using UAV-generated DEM data for Khovd City. To analyze flow direction, we applied the “Eight Direction Pour Point Model”, which facilitated the creation of flood hazard maps for Khovd City. The flow method necessitates two high-resolution topographic datasets – a flow direction map and a surface elevation map – at the same resolution to generate a lower-resolved river network map and supplementary maps of river network parameters (Yamazaki et al., 2009). The eight-direction (D8) flow direction coding was applied by considering that the stream flows from the center cell to its eight neighboring cells, and assigning a number to each of the eight neighboring cells based on the direction of flow. For an input D8 flow direction raster, a cell is considered to have an undefined flow direction if its value in the flow direction raster is anything other than 1 (eastward), 2 (southeastward), 4 (southward), 8 (southwestward), 16 (westward), 32 (northwestward), 64 (northward), or 128 (northeastward). Output cells with a high flow accumulation are areas of concentrated flow and can be used to identify stream channels. We determined the drainage structure of a watershed using DEM and a digital river network. While it is relatively straightforward to estimate natural flow direction from DEM, deriving accurate flow direction is challenging for artificially modified river channels and human-made structures based on DEM alone. Our topographic map facilitated the creation of cross-sections and longitudinal profiles along the Buyant River. Additionally, we analyzed terraces in areas where water could enter Khovd City, determined the flow direction of rivers and flash floods, and examined water accumulation depressions in the center of Khovd City.
4.1 Topographic maps and flow direction analysis
According to the derived topographical maps of Khovd City, it is located in an alluvial fan with an elevation ranging from 1344 to 1410 m a.s.l. and very shallow surface slopes of ca. 2–4°. The alluvial fan is characterised by a total elevation difference of about 60 m with the eastern part of the city area meeting the foothills of the Ulaan (2026.4 m) and Tsahir (1642.0 m) of the mountains and the western part directly connecting to the floodplain of the Buyant River valley (Fig. 4). The northern section of the study area converges with the Buyant River wetlands and represents the lowest point where all runoff from higher elevations collects. Although surface water can accumulate from the catchment area, the gentle slope of the terrain results in relatively low flow intensity.
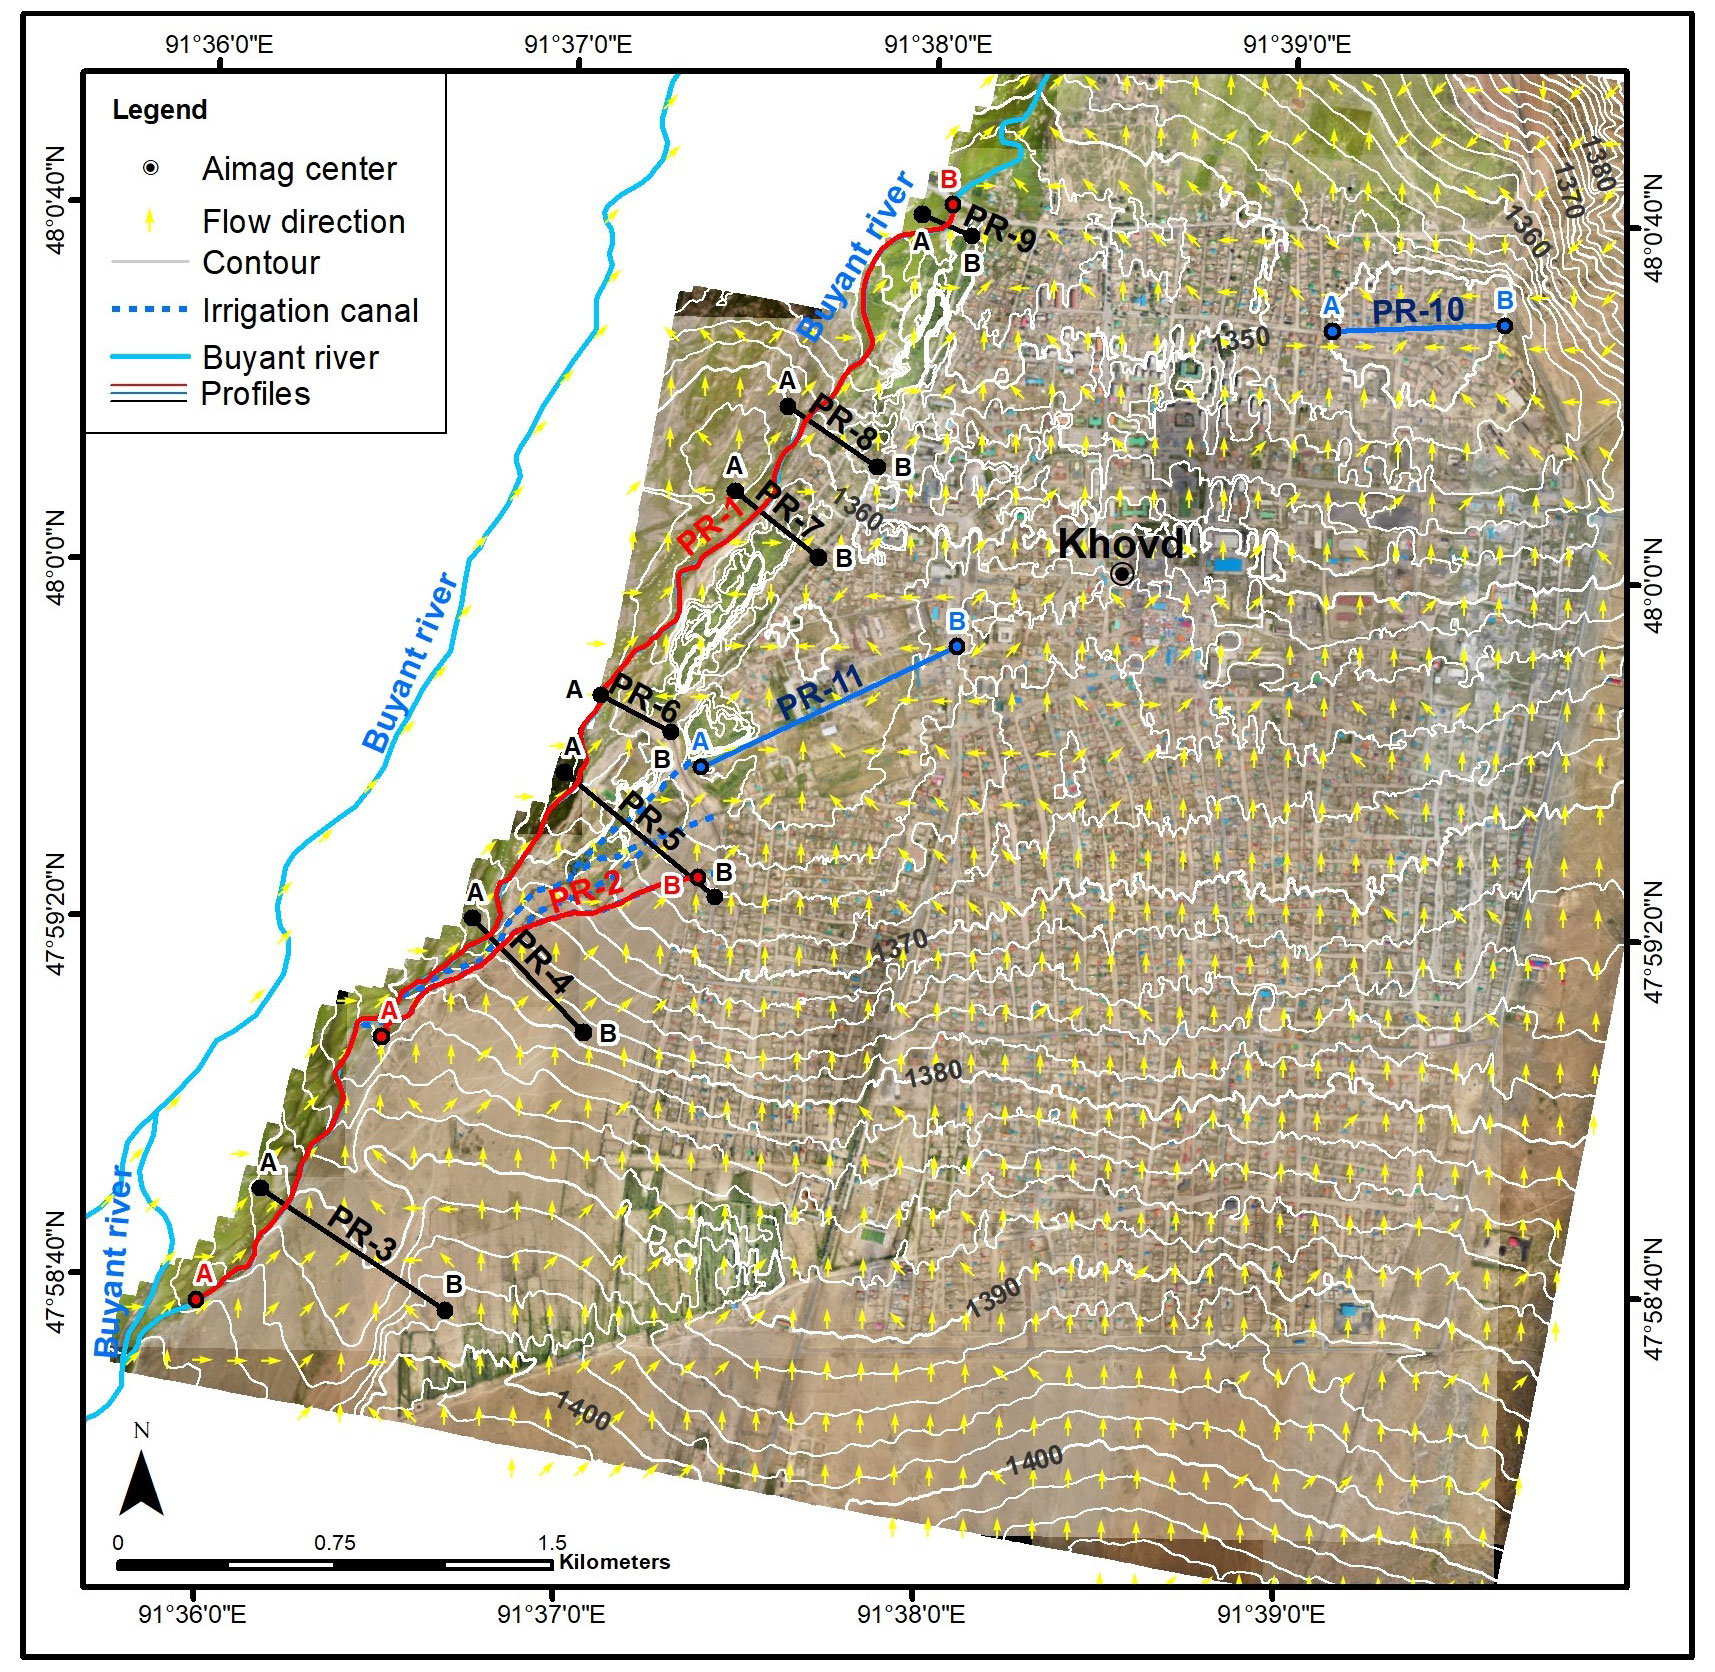
Figure 4The map shows the topographical conditions and flow directions of Khovd City, featuring a total of 11 profiles. These profiles include two longitudinal profiles (PR-1, PR-2 along the red line) following the course of the Buyant River and an irrigation canal. Additionally, there are nine cross profiles (PR-3–PR-9 along the black line, and PR-10, PR-11 along the blue line) encompassing the Buyant River and two depressions.
Regarding the surface water catchment area, the primary flow follows the flood embankment and drainage ditches in the eastern part of Khovd City. This area has experienced numerous floods in the past, affecting households in the Baatarkhairkhan, Bichigt, Naran, and Rashaant baghs. The density of the flood drainage network in this area is the highest, ca. 6.5 km km2. The analysis, based on a cell size of 2.7 m grouped into 120 m cells, identified a total of 980 cells with distinct flow directions. When examining the flow directions as a percentage of the study area, we found that 1.3 % of the flow is southward, 56.5 % northward, 4.9 % westward, 3.6 % eastward, 4.0 % southwestward, 0.4 % southeastward, 11.3 % northwestward, and 18.0 % northeastward. According to the Eight Direction Pour Point Model, the majority (85.8 %) of the flow is directed south to north, northwest, and northeast (Fig. 4). This result indicates that, in the event of rainfall in Khovd City, most runoff will flow towards the wetland in the low-lying area of the Buyant River valley. The flow direction map reveals that high-risk flow originates from flash floods on the eastern side of Khovd City. Our study identifies two depressions in the center of Khovd City, where the flow can enter from all directions (Figs. 4, 5). Floodwater tends to accumulate in these depressions. The topographical map also shows that floodwater can flow towards the center via the irrigation canal sourced from the Buyant River, a topic that will be discussed in next subchapter.
4.2 Topographic depressions and floodwater accumulation
Climatic factors play a significant role in the formation of micro-landforms, particularly in the low-lying areas of wetland river valleys. Surface depressions, commonly caused by the thawing of permafrost and enhanced by global warming, are prevalent in these regions (Jones, 1993; Karjalainen et al., 2020; Twidale, 2002). Yamkhin et al. (2022) estimated that permafrost covers 29.3 % of Mongolia's total territory, with Khovd City situated in the seasonal frost zone.
The topographical analysis conducted in this study identified two depressions in the center of Khovd City, specifically in the areas of Buyant, Naran, and Rashaant baghs, as shown in Figs. 4 and 5 (profiles 10 and 11). Profile PR-10, located in the Rashaant bagh area, indicates a surface elevation of ca. 1350 m a.s.l., with a depression depth of 1.5–1.7 m. Similarly, profile PR-11, located in the Buyant bagh area, exhibits an elevation of ca.1362 m a.s.l., with a depression depth of 2–2.5 m.
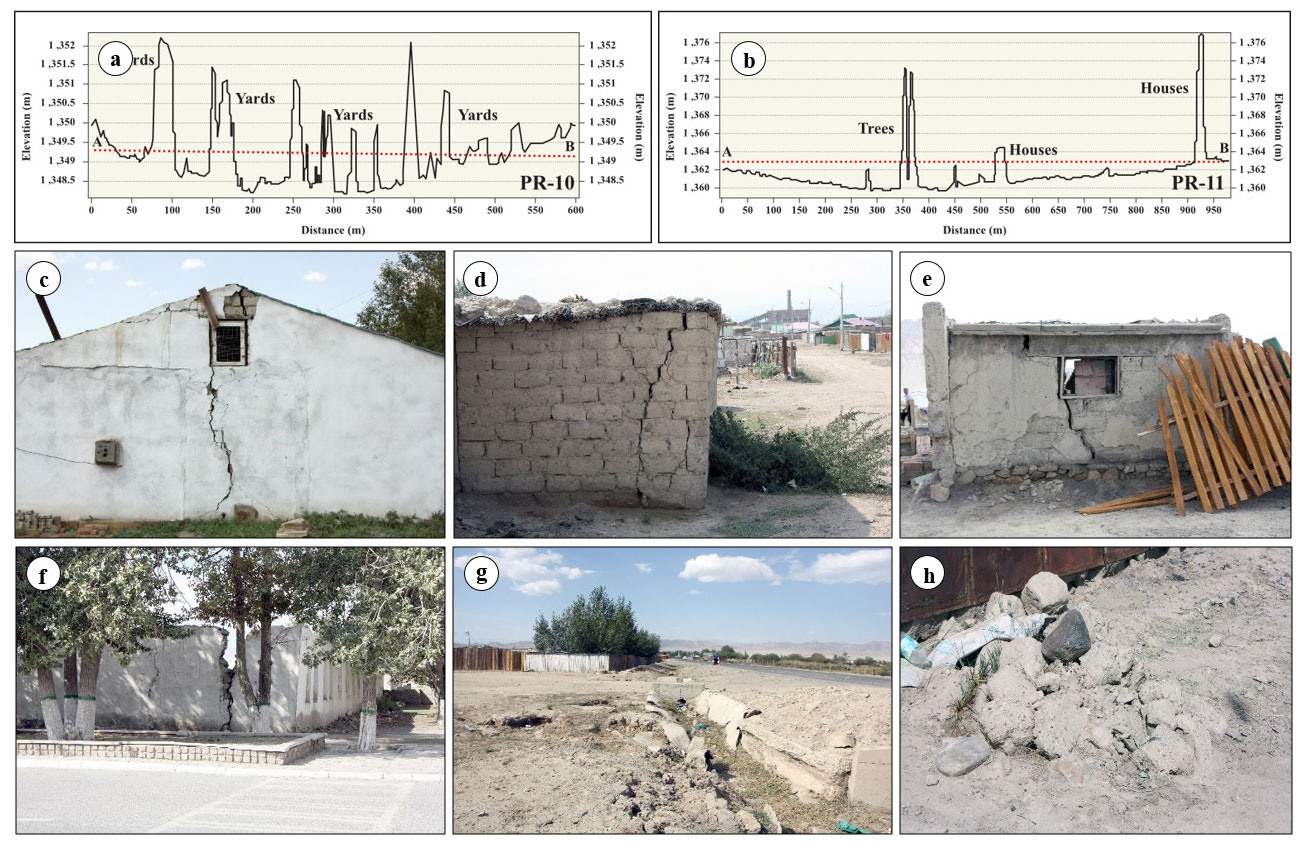
Figure 5The depression profiles PR-10 (a) and PR-11 (b). Broken buildings (c, d, e, f) and permafrost sediment (g, h) on the depressions in Khovd City. The red dashed line shows the profile slope.
The proximity of the soil water level to the surface in this region may have contributed to the development of depression microrelief through frost action (thaw-freeze cycles). The high soil water table is confirmed by private wells in this area. The observed collapse or destruction of houses and buildings (Fig. 5a, c, d, e, f), in the Naran and Rashaant bagh areas (profile PR-10), along with sediment features in these areas, suggest that these depressions are likely the result of permafrost degradation over the last few decades (Fig. 5g, h) (Walther and Kamp, 2023). There are no comprehensive studies on the origin and freeze characteristics of these depressions, so our interpretation is based on the available imagery. Furthermore, if flash and river floodwaters enter the city center, the low-lying areas and depressions in profiles PR-10 and PR-11 will be more severely affected, with sustained damage. The topographical and flow direction maps (Figs. 4, 5a, b) illustrate that rain and floodwaters tend to accumulate in these areas. According to residents, many families located in the depression (profile PR-10) experienced flooding in July 2018. Together, these factors create conditions in which floodwaters not only accumulate but also remain in depression areas for extended periods, increasing the risk of localized flooding and contributing to sustained waterlogging. Thus, understanding these processes is crucial for flood risk assessment and the development of effective water management strategies.
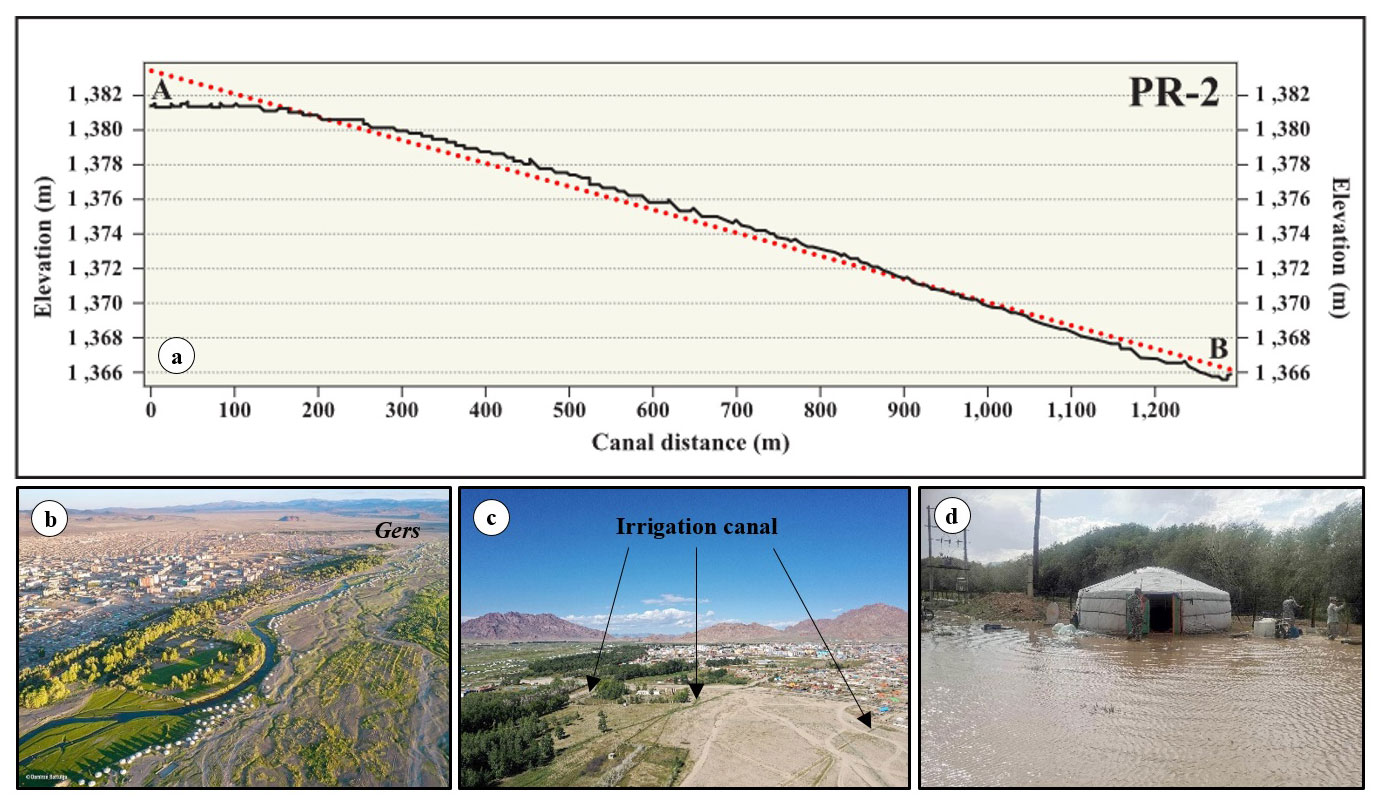
Figure 6The images depict the longitudinal profile PR-2 of a vegetable irrigation canal (a). The red dashed line shows the profile slope. The Buyant River valley and summer gers near Khovd City are shown in (b). Additionally, there are artificial irrigation canals/channels leading into the city, as seen in images (c, d).
4.3 Impact of Buyant River floods
The Buyant River's hydrology is driven by spring snowmelt, summer precipitation, and permafrost/glacier melt water from the Altai Mountains. Peak spring floods occur between late April and June, while summer rainfall-induced floods subside by mid-September. Extreme precipitation events, such as in August 2019, caused water levels to exceed long-term averages by 22 cm. Within Khovd City, the river bifurcates and forms tributaries during flood events, intensifying flood hazards. Irrigation canals from the western branch increase runoff towards urban areas, elevating flood risk. Consequently, both riverbank and central urban settlements are vulnerable to inundation under prolonged rainfall and flood conditions (Figs. 4, 6).
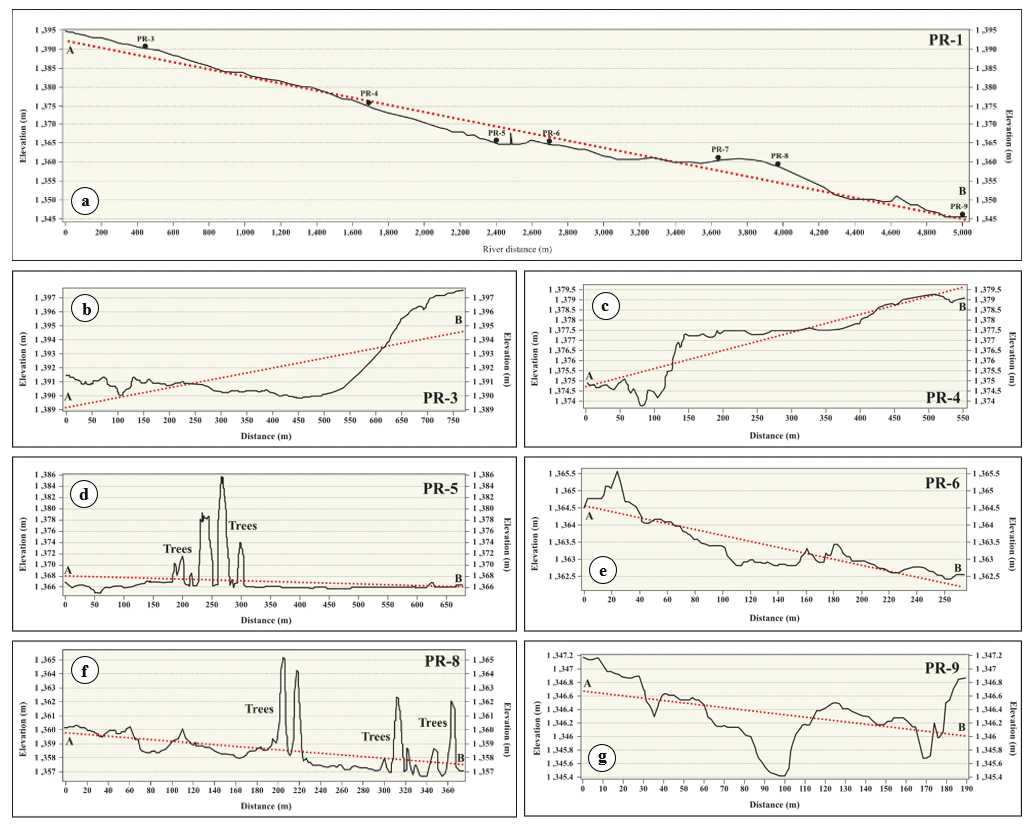
Figure 7The longitudinal (a) and cross profiles (b–g) of Buyant River near Khovd City area. The red dashed line shows the profile slope.
The longitudinal profiles shown in Fig. 6a and c indicate a notable elevation gradient, which facilitates the flow of floodwater into the center of Khovd City via the irrigation canals. Local farmers have constructed three surface irrigation canals extending from the Buyant River toward the city center, as clearly illustrated in Fig. 6c. In addition, the longitudinal section of the Buyant River west of the city, represented by profile PR-1, is characterized by a relative elevation difference of 50 m, ranging from 1395 to 1345 m a.s.l., with a river gradient of 0.01 (Fig. 7a). In the upstream segment of this longitudinal section, fluvial terraces No. 1 and 2 are identified within the river valley. These terraces exhibit heights of approximately 4–6 m, as shown in profiles PR-3 and PR-4 (Fig. 7b, c). The relatively high elevation of these terraces acts as a natural barrier, constraining floodwaters from the Buyant River in this area and preventing direct floodwater flow into the city of Khovd (Fig. 8a, b).
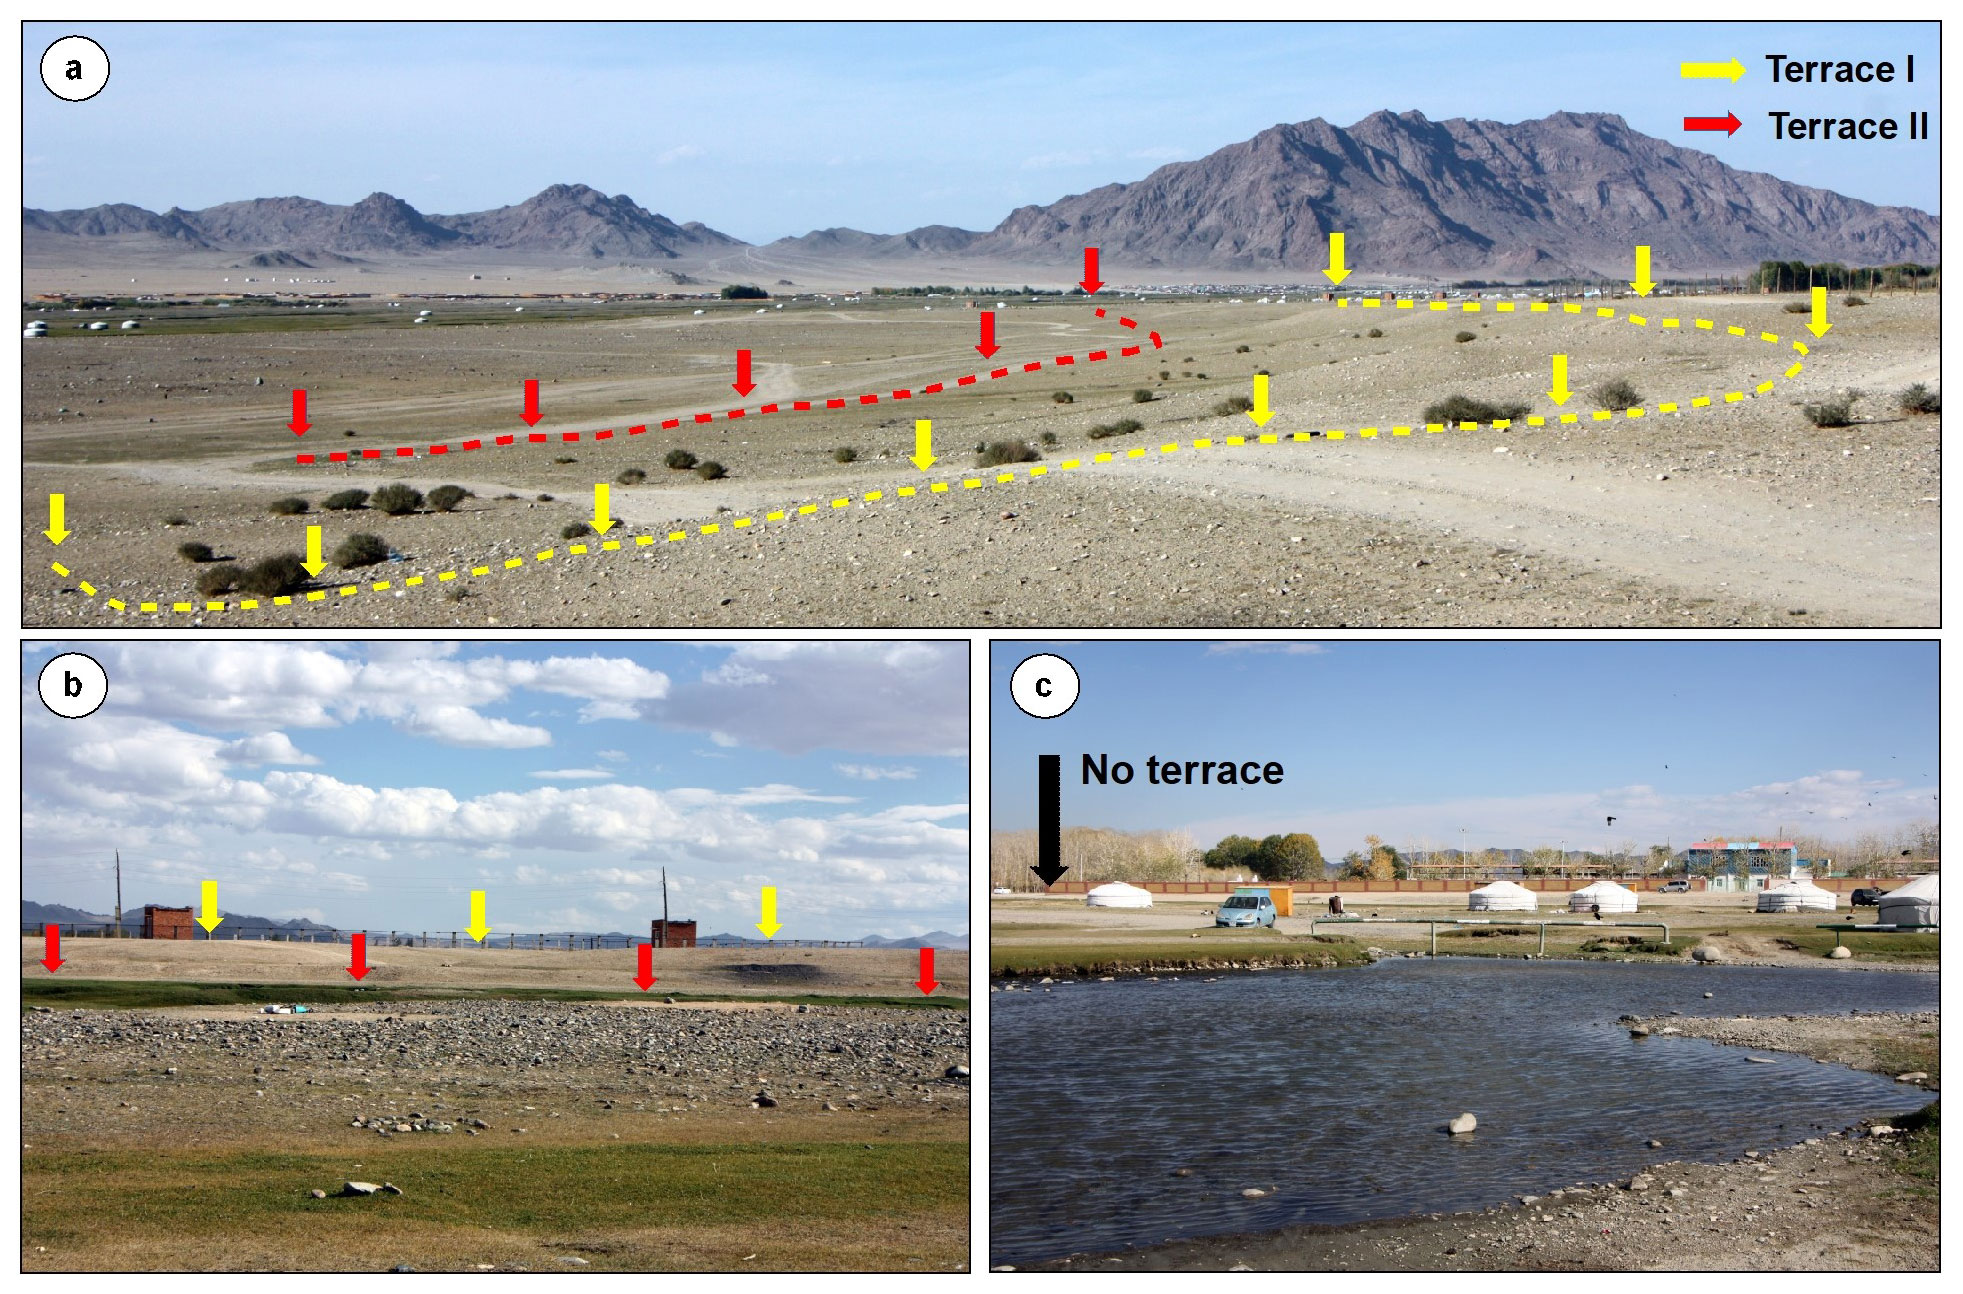
Figure 8Elevation changes of the Buyant River terraces at PR-4 (Fig. 7b) and PR-5 (Fig. 7d).
However, at the level of cross-section PR-5 (Fig. 7d), the terrace elevation gradually subsides and eventually disappears. From this point onward, the surface elevation in the central part of Khovd City decreases by 1–3 m relative to the river valley bottom (1367–1366 m a.s.l.), creating favorable conditions for floodwater to flow toward the city (Figs. 7e, f, g and 8c). Notably, ancient river terraces are absent below this section of the valley.
The study identifies critical geomorphological features such as river terraces, floodplains, gullies, and depressions that influence floodwater accumulation and flow. River terraces are a crucial natural component of flood protection, playing a key role in preventing and limiting the direct entry of floodwaters into the city, as well as directing their flow. Therefore, the drone mapping we created is scientifically significant for studying surface morphometry as well as changes in terrace position and elevation.
5.1 Potential topographical analysis based on drone mapping
This study investigates the flood hazard mapping of Khovd City, focusing on the use of Unmanned Aerial Vehicle (UAV) technology and drone-generated Digital Elevation Models (DEMs) for topographical analysis and flood risk assessment. Khovd City, located in a flood-prone area of the Buyant River valley in Western Mongolia, has seen an increase in flood risk due to rapid urbanization, climate change, and increased precipitation. Khovd City currently sustains a population of approximately 32 000 residents, with a density of 440 people per square kilometer (Khovd Statistical Office, 2020). Drone-generated imagery and DEM data were used to assess the topographic and hydrological conditions, identify flood hazard areas, and generate flood risk maps. Flow direction and stream network density maps were created to determine potential flood pathways, and cross-sectional and longitudinal profiles were developed to assess flood risks along the Buyant River and its tributaries. Overall, UAV technology enhances the accuracy, efficiency, and accessibility of flood risk assessments in small areas, making it an invaluable tool for environmental monitoring and disaster management. The study demonstrates the value of UAV technology in producing reliable flood hazard maps, which can be crucial for urban planning and disaster risk management. The research provides a deeper understanding through detailed topographic analysis, flow direction modeling, and geomorphological profiling, which markedly improve the precision of flood hazard mapping. Based on the results of this study, cross-sectional and longitudinal profiles were generated along the Buyant River, offering a comprehensive understanding of floodwater dynamics and accumulation patterns. This detailed insight is crucial for local authorities to formulate effective flood risk mitigation and urban planning strategies.
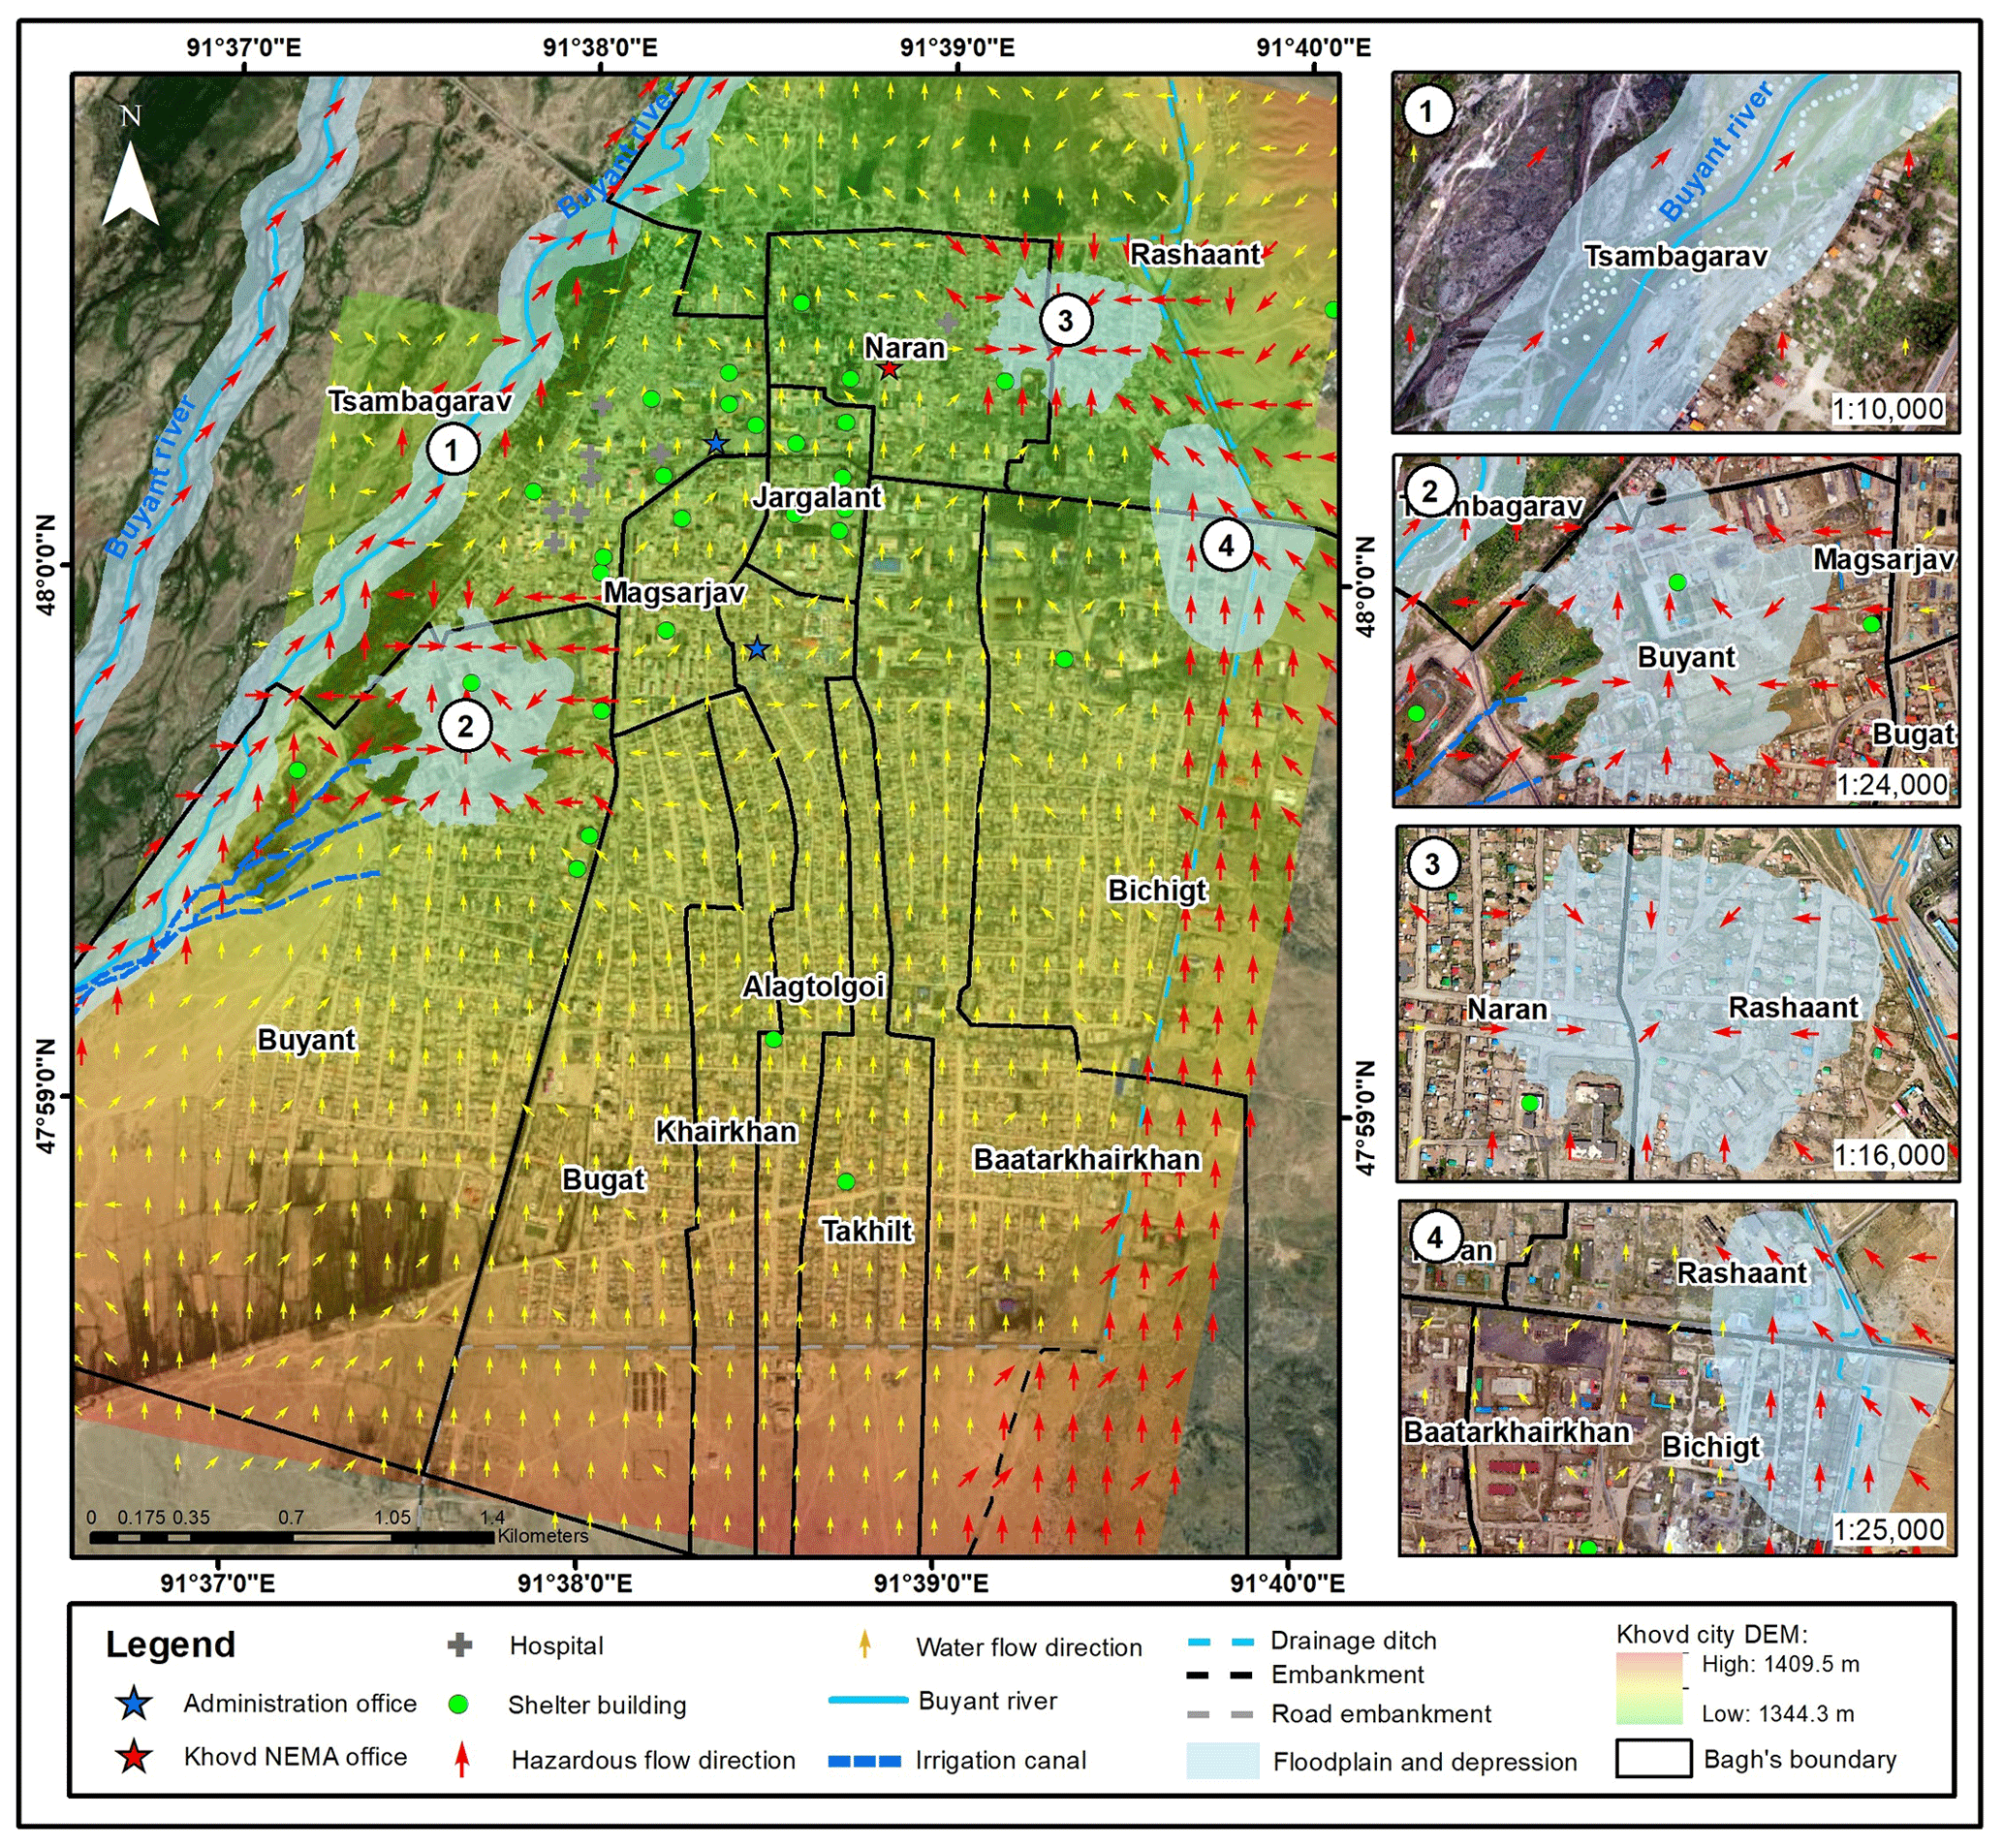
Figure 9The maps are showing flood hazard places in Khovd City. And those maps show a flood flow direction and depressions of the study area.
5.2 Flood hazard mapping
Based on the results of this study, we created a flood hazard map using information on topographical conditions, flow direction, residential settlement areas, household distribution, and previously flooded zones. As a result, we identified four hazardous and vulnerable areas within Khovd City (Fig. 9), including:
-
The Buyant River, which bifurcates into 2–3 branches near Khovd City, gains additional tributaries during flood events, significantly elevating water levels. Summer gers located on the floodplains between these river branches are at high risk of inundation. The expanding residential area of Khovd City-currently with approximately 1800 households situated within the flood hazard zone-further increases vulnerability to flooding. Recent studies have reported a rise in the Buyant River's maximum runoff, indicating an increased risk of rain-induced floods (Narangerel et al., 2024).
-
The westernmost tributary, which runs along the city border, is part of the local irrigation network that supplies water for vegetable production through 2–3 canals. These canals are connected to an irrigation channel sourced from the Buyant River and pose a potential flood risk to the city center. The flood hazard also affects households in the Buyant, Tsambagarav, and Jargalant baghs, particularly those located in the depression areas of Buyant bagh (see profile PR-11).
-
Flow direction analysis in the center of Khovd City reveals two depressions with elevated flood risk. The depression areas in the Naran and Rashaant baghs are particularly prone to frequent flooding. Flash floods entering the city center may impact the depression highlighted in section PR-10 more severely, resulting in greater damage (Fig. 9). Households in this area experience flooding annually.
-
According to the eight-direction pour point model, most water in Khovd City flows northward, meaning that during rainfall events, much of the runoff is directed toward the wetlands and lower parts of the Buyant River valley. Due to the wide catchment area, narrow outlet, and limited capacity of water culvert pipes, flash floods originating from the dry valley and gullies of “Dan Usnii Khundii” which begin at “Khar Tsohio” in the southeastern part of the city pose a significant risk. There is a high likelihood of floodwaters overflowing, threatening households in the Baatharkhairkhan, Bichigt, Rashaant, and Naran baghs. Notably, this area has the highest density of flood drainage network, measured at 6.5 km km−2.
In Khovd City, 72 % of the population resides in gers (traditional nomadic dwellings), 26.5 % in houses, 1.2 % in apartments, 0.2 % in independent comfortable houses, and 0.1 % in public housing (Khovd Statistical Office, 2020). Notably, residents living in gers are particularly susceptible to higher risks and damages, as these traditional dwellings are highly vulnerable to floodwaters and can be easily penetrated during flooding events. Past experiences with flash floods in the city indicate that urban residents have suffered significant harm and property damage (Narangerel et al., 2024). In this context, local elders recall the flood of 1994, during which many gers were inundated.
The study provides a clear basis for identifying high-risk zones, evaluating the vulnerability of local communities, and informing infrastructure development to minimize flood damage. Moreover, the study advocates for the use of UAV-based flood hazard mapping as a tool for future flood risk assessments in other regions with similar topographical and climatic conditions.
5.3 Recommendations for disaster prevention
Geomorphological hazard mapping of this area can alert residents to potential unknown risks. Specifically, it solves the following problems: (1) Because the area is semi-arid and there is no running water, residents do not recognize the risk of flooding. (2) Because the terrain is generally flat, residents do not know where the water will flow during floods. (3) After an artificial embankment was built in the 1990s, the flood flow path changed, but residents cannot predict what will happen if the embankment breaks. (4) The Buyant River flows at a low level on the west side of the city, but the residents of Khovd have never experienced floods there historically, so they are completely unaware of the risk of flooding. Building upon the topographical analysis conducted, we propose the following general flood prevention measures:
-
Urgent action is required for flood prevention, protection, and disaster management, with special emphasis on the four identified points in the new flood hazard map. Key recommendations are (i) enhancing flood protection facilities, (ii) providing regular warnings to residents in flood-prone regions or river valleys, and (iii) implementing local disaster management initiatives. Additionally, efforts should be made to improve the quality of weather prevention information, to organize training sessions, and raise awareness about natural disasters among the citizens.
-
Given the increasing frequency of floods in the Buyant River in recent decades and the likelihood of further aggravation associated with ongoing climate change local authorities should take proactive measures to ensure the safety of the 1800 families residing in vulnerable areas of the river floodplain. It is paramount to establish a comprehensive rescue preparedness plan for sudden natural disasters and particularly floods. Distributing informative materials to raise awareness and equip local administrative bodies and residents to protect themselves from floods is crucial.
-
Long-term changes in local rainfall pattern pose a risk of flash floods and the potential inundation of the two depressions in the city center by the Buyant River. It is imperative to safeguard households in these areas and to construct flood protection structures based on robust flood protection design. A detailed study of the seasonal frozen ground and permafrost dynamics in these depressions should be conducted and measures informed by this study should be urgently implemented.
-
The flood protection structures erected in 1994 and 2014 have experienced serious deterioration and require urgent reconstruction and improvement. To protect Khovd City from flash floods, a total length of 14 km of flood protection embankments and ditches and drainage system should be constructed with standard.
Given its location in a semi-arid region and its status as a provincial centre in western Mongolia, our paper emphasises the pressing requirement for Khovd City to be safeguarded against potential future flooding. We demonstrated how unmanned aerial vehicle (UAV) technology and topographical analysis can considerably improve flood hazard mapping and risk management. By integrating advanced data collection techniques with detailed geomorphological studies, the research offers a comprehensive framework for understanding flood dynamics in Khovd City. We identified four flood-prone areas within the city and discuss them here to propose targeted flood prevention recommendations
In the event of flash floods or river inundation in the city center, the depressions are expected to suffer more significant damage. The Khovd City administration should prioritize flood disaster management education for residents and improve flood protection infrastructure to enhance climate change adaptation and disaster resilience.
Currently, there is no detailed flood risk assessment or hazard map for the 21 provinces of Mongolia. Ultimately, the study emphasizes the importance of ongoing research and the adoption of innovative technologies to mitigate flood hazards effectively and support sustainable urban planning. Flood hazard maps are essential tools for understanding and mitigating flood risks nationwide. These maps help identify flood-prone areas and are critical for disaster risk management, urban planning, and infrastructure development.
Data will be made available upon request.
SN conducted field research, analyzed data, and wrote the manuscript. YS planned and supervised the research project. TH and YT provided drone photos. All authors read and approved the final manuscript.
The contact author has declared that none of the authors has any competing interests.
This article is part of the special issue “Strengthening climate-resilient development through adaptation, disaster risk reduction, and reconstruction after extreme events”. It is not associated with a conference.
Publisher's note: Copernicus Publications remains neutral with regard to jurisdictional claims made in the text, published maps, institutional affiliations, or any other geographical representation in this paper. While Copernicus Publications makes every effort to include appropriate place names, the final responsibility lies with the authors. Views expressed in the text are those of the authors and do not necessarily reflect the views of the publisher.
Appreciation is extended to the staff of Khovd NEMA and the government office of Jargalant soum in Khovd aimag for their support during fieldwork. We thank Associate Professor Sebastian Breitenbach of Northumbria University for reviewing the English. Special thanks are given to the Asian Satellite Campuses Institute (ASCI) Program of the Graduate School of Environmental Studies (GSES) at Nagoya University for their support in the doctoral program. The authors also thank all stakeholders involved in the study for their cooperation.
This research has been supported by the Japan International Cooperation Agency (grant no. JPJSBP120209913).
This paper was edited by Marvin Ravan and reviewed by Andrei Urzica and four anonymous referees.
Beher, J.: Pasture Characteristics in Three Different Ecotypes at Khovd Aimag, Western Mongolia, PLoS ONE, 9, e102892, https://doi.org/10.1371/journal.pone.0102892, 2014.
Bilaşco, Ş, Hognogi, G.-G., Roşca, S., Pop, A.-M., Iuliu, V., Fodorean, I., Marian-Potra, A.-C., and Sestras, P.: Flash Flood Risk Assessment and Mitigation in Digital-Era Governance Using Unmanned Aerial Vehicle and GIS Spatial Analyses Case Study: Small River Basins, Remote Sens., 14, 2481, https://doi.org/10.3390/rs14102481, 2022.
Castelltort, S. and Simpson, G.: River spacing and drainage network growth in widening mountain ranges: River spacing and drainage network growth, Basin Res., 18, 267–276, https://doi.org/10.1111/j.1365-2117.2006.00293.x, 2006.
Diakakis, M., Andreadakis, E., Nikolopoulos, E. I., Spyrou, N. I., Gogou, M. E., Deligiannakis, G., Katsetsiadou, N. K., Antoniadis, Z., Melaki, M., Georgakopoulos, A., Tsaprouni, K., Kalogiros, J., and Lekkas, E.: An integrated approach of ground and aerial observations in flash flood disaster investigations. The case of the 2017 Mandra flash flood in Greece, Int. J. Disaster Risk Reduct., 33, 290–309, https://doi.org/10.1016/j.ijdrr.2018.10.015, 2019.
Goulden, C. E., Mead, J., Horwitz, R., Goulden, M., Nandintsetseg, B., McCormick, S., Boldgiv, B., and Petraitis, P. S.: Interviews of Mongolian herders and high resolution precipitation data reveal an increase in short heavy rains and thunderstorm activity in semi-arid Mongolia, Clim. Change, 136, 281–295, https://doi.org/10.1007/s10584-016-1614-4, 2016.
Govedarica, M. and Borisov, M.: Analiza kakovosti podatkov na topografskih kartah, Geod. Vestn., 55, 713–725, https://doi.org/10.15292/geodetski-vestnik.2011.04.713-725, 2011.
Groisman, P. Y., Knight, R. W., Easterling, D. R., Karl, T. R., Hegerl, G. C., and Razuvaev, V. N.: Trends in Intense Precipitation in the Climate Record, J. Clim., 18, 1326–1350, https://doi.org/10.1175/JCLI3339.1, 2005.
Jones, D. K. C.: Global Warming and Geomorphology, Geogr. J., 159, 124, https://doi.org/10.2307/3451402, 1993.
Karjalainen, O., Luoto, M., Aalto, J., Etzelmüller, B., Grosse, G., Jones, B. M., Lilleøren, K. S., and Hjort, J.: High potential for loss of permafrost landforms in a changing climate, Environ. Res. Lett., 15, 104065, https://doi.org/10.1088/1748-9326/abafd5, 2020.
Khovd Statistical Office: Housing conditions, Ulaanbaatar, Mongolia, https://khovd.nso.mn/ (last access: 27 October 2023), 2020.
Leitão, J. P. and de Sousa, L. M.: Towards the optimal fusion of high-resolution Digital Elevation Models for detailed urban flood assessment, J. Hydrol., 561, 651–661, https://doi.org/10.1016/j.jhydrol.2018.04.043, 2018.
Li, Z.: Watershed modeling using arc hydro based on DEMs: a case study in Jackpine watershed, Environ. Syst. Res., 3, 11, https://doi.org/10.1186/2193-2697-3-11, 2014.
Ministry of Environment and Tourism: Mongolia Third National Communication (UNFCCC), The Ministry of Environment and Tourism of Mongolia, Mongolia, 346 pp., https://unfccc.int/sites/default/files/resource/06593841_Mongolia-NC3-2-Mongolia TNC 2018 pr.pdf (last access: 27 October 2023), 2018.
Mongolian Red Cross Society: Emergency Plan of Action Final Report, Mongolian Red Cross Society, Mongolia, https://reliefweb.int/report/mongolia/mongolia-flash-floods-emergency-plan-action-final-report-dref-operation-mdrmn008 (last access: 27 October 2023), 2019.
Nara, Y. and Battulga, S.: Observations on Residents' Risk Awareness and Practice of Countermeasures against Natural Disasters in Mongolia: Questionnaire Survey Data of Khovd Citizens, Procedia Comput. Sci., 159, 2345–2354, https://doi.org/10.1016/j.procs.2019.09.409, 2019.
Narangerel, S. and Suzuki, Y.: Historic Flood Events and Current Flood Hazard in Ulaanbaatar City, Central Mongolia, J. Disaster Res., 19, 691–704, https://doi.org/10.20965/jdr.2024.p0691, 2024.
Narangerel, S., Suzuki, Y., Taniguchi, K., Hasegawa, T., Enkhtaivan, D., Narmandakh, B., and Batnyam, T.: Floods and related problems after the 1980s in Khovd, Western Mongolia, Nat. Hazards, https://doi.org/10.1007/s11069-024-07033-x, 2024.
Oyunbaatar, D.: Floods in Mongolia, Hydrol. Sect. Inst. Meteorol. Hydrol., https://www.restec.or.jp/geoss_ap3/pdf/day2/WG/WG2/Short_Country_Reports/08_Mongolia.pdf (last access: 27 October 2023), 2004.
Pan, C. G., Kamp, U., Munkhjargal, M., Halvorson, S. J., Dashtseren, A., and Walther, M.: An Estimated Contribution of Glacier Runoff to Mongolia's Upper Khovd River Basin in the Altai Mountains, Mt. Res. Dev., 39, https://doi.org/10.1659/MRD-JOURNAL-D-18-00059.1, 2019.
Remondino, F., Barazzetti, L., Nex, F., Scaioni, M., and Sarazzi, D.: UAV PHOTOGRAMMETRY FOR MAPPING AND 3D MODELING – CURRENT STATUS AND FUTURE PERSPECTIVES, Int. Arch. Photogramm. Remote Sens. Spatial Inf. Sci., XXXVIII-1/C22, 25–31, https://doi.org/10.5194/isprsarchives-XXXVIII-1-C22-25-2011, 2011.
Restas, A.: Drone Applications for Supporting Disaster Management, World J. Eng. Technol., 03, 316–321, https://doi.org/10.4236/wjet.2015.33C047, 2015.
Ruhoff, A. L., Castro, N. M. R., and Risso, A.: Numerical Modelling of the Topographic Wetness Index: An Analysis at Different Scales, Int. J. Geosci., 02, 476–483, https://doi.org/10.4236/ijg.2011.24050, 2011.
Sato, T., Kimura, F., and Kitoh, A.: Projection of global warming onto regional precipitation over Mongolia using a regional climate model, J. Hydrol., 333, 144–154, https://doi.org/10.1016/j.jhydrol.2006.07.023, 2007.
Schumann, G. J.-P., Muhlhausen, J., and Andreadis, K. M.: Rapid Mapping of Small-Scale River-Floodplain Environments Using UAV SfM Supports Classical Theory, Remote Sens., 11, 982, https://doi.org/10.3390/rs11080982, 2019.
Suzuki, Y., Ishii, S., Inamura, T., Nara, Y., Takahashi, H., Battulga, S., Enkhtaivan, D., Narangerel, S., Ariunaa, C., Serjmyadag, D., Altanbadralt, B., and Badral, T.: Enhancing Citizens' Disaster Resilience through an International Transdisciplinary Research Project in Mongolia, Geogr. Rev. Jpn. Ser. B, 92, 1–9, https://doi.org/10.4157/geogrevjapanb.92.1, 2019.
Tanaka, T., Tachikawa, Y., Ichikawa, Y., and Yorozu, K.: Impact assessment of upstream flooding on extreme flood frequency analysis by incorporating a flood-inundation model for flood risk assessment, J. Hydrol., 554, 370–382, https://doi.org/10.1016/j.jhydrol.2017.09.012, 2017.
Turcotte, R., Fortin, J.-P., Rousseau, A. N., Massicotte, S., and Villeneuve, J.-P.: Determination of the drainage structure of a watershed using a digital elevation model and a digital river and lake network, J. Hydrol., 240, 225–242, https://doi.org/10.1016/S0022-1694(00)00342-5, 2001.
Twidale, C. R.: The two-stage concept of landform and landscape development involving etching: origin, development and implications of an idea, Earth-Sci. Rev., 57, 37–74, https://doi.org/10.1016/S0012-8252(01)00059-9, 2002.
Walther, M. and Kamp, U.: Mountain Permafrost: A Reflection on the Periglacial Environment in Mongolia, Geosciences, 13, 274, https://doi.org/10.3390/geosciences13090274, 2023.
Weintrit, B., Bakuła, K., Jędryka, M., Bijak, W., Ostrowski, W., Zelaya Wziątek, D., Ankowski, A., and Kurczyński, Z.: EMERGENCY RESCUE MANAGEMENT SUPPORTED BY UAV REMOTE SENSING DATA, Int. Arch. Photogramm. Remote Sens. Spat. Inf. Sci., XLII-3/W4, 563–567, https://doi.org/10.5194/isprs-archives-XLII-3-W4-563-2018, 2018.
Xu, Z. X., Ito, K., Schultz, G. A., and Li, J. Y.: Integrated Hydrologic Modeling and GIS in Water Resources Management, J. Comput. Civ. Eng., 15, 217–223, https://doi.org/10.1061/(ASCE)0887-3801(2001)15:3(217), 2001.
Yamazaki, D., Oki, T., and Kanae, S.: Deriving a global river network map and its sub-grid topographic characteristics from a fine-resolution flow direction map, Hydrol. Earth Syst. Sci., 13, 2241–2251, https://doi.org/10.5194/hess-13-2241-2009, 2009.
Yamkhin, J., Yadamsuren, G., Khurelbaatar, T., Gansukh, T., Tsogtbaatar, U., Adiya, S., Yondon, A., Avirmed, D., and Natsagdorj, S.: Spatial distribution mapping of permafrost in Mongolia using TTOP, Permafr. Periglac. Process., 33, 386–405, https://doi.org/10.1002/ppp.2165, 2022.
Yang, K., Zhang, S., Yang, X., and Wu, N.: Flood Detection Based on Unmanned Aerial Vehicle System and Deep Learning, Complexity, 2022, 1–9, https://doi.org/10.1155/2022/6155300, 2022.
Zagdsuren, S., Nyambayar, T., and Ganzorig, B.: Landslide assessment of Mount Tsambagarav, Disaster Stud. Innov., 7, 28–37, 2021.