the Creative Commons Attribution 4.0 License.
the Creative Commons Attribution 4.0 License.
 | 30 Oct 2025
Kinetic characteristics investigation of the Yingxingping rockslide based on discrete element method combined with discrete fracture network
Yufang Zhang
Xiewen Hu
Jian Li
Kun Yuan
Kun He
Jian Cui
Zhenhua Yin
The development of rock fractures on the mountain ridge in meizoseismal area may lead to fatal rockslides. This study focused on a catastrophic post-earthquake rockslide case in Wenchuan, Southwestern China. On-site investigation and aerial photography were used to ascertained the basic characteristics and determine three regions: the source area, transitional area, and depositional area. A three-dimensional discrete element method (DEM) with the discrete fracture network (DFN) was employed to assess the dynamic process of the rockslide. The sliding mass disintegrated quickly into smaller blocks, with those in the front-edge reaching the bottom of the slope earlier and experiencing higher acceleration. The maximum velocity and displacement of the sliding blocks were found to be 56.75 m s−1 and 508.61 m, respectively, lasting for approximately 104.45 s. The effects of fractures density and friction angle on the kinetic characteristics of rockslide were analysed, and the check dam was utilized to prevent the rockslide deposit in the debris flow gully. This study provides referenced information for assessing the kinetic process and preventing post-earthquake rockslides in meizoseismal areas.
- Article
(18518 KB) - Full-text XML
- BibTeX
- EndNote


The northwest of the Sichuan Basin is recognised as one of the regions with high frequency of geo-hazards in the world (Wu et al., 2012). After a strong earthquake, the number and scale of geo-hazards in meizoseismal areas exhibit obvious increase (Huang et al., 2012). As the result of the earthquake, cracks are formed in the rock mass within mountain ridges, which are often difficult to identify due to vegetation restoration, making the disasters that are triggered by them more devastating (Yan et al., 2020). The development process of cracks can be classified into two types, one type is retrogressive development, resulting in small-scale landslides that can be easily predicted and prevented, and integral sliding that creates large-scale landslides which are difficult to prevent due to their suddenness (Fan et al., 2019a). For instance, the Yigong rock avalanche in 2000 caused the damming of the Yigong Zangpo River. Although it was initially contained, the dam eventually failed after 62 d of outburst, leading to a major outburst flood downstream in the Yarlung Zangpo rivers (Delaney and Evans, 2015). Another example is the 2017 Xinmo landslide that occurred in the intense tectonic area causing serious casualties and the loss of properties (Fan et al., 2017). For this type of landslide occurred in meizoseismal area, scholars have conducted extensive research using theoretical analysis, rock mechanics tests and indoor physical model tests (Okura et al., 2000; Evans et al., 2001; Mangeney et al., 2010). However, due to the complex distribution characteristics of the sliding mass fractures, it is difficult to accurately reveal the initiation mechanisms and dynamic disaster-causing pattern of rockslides using conventional methods.
With the development of computer technology, numerical simulation has become an important tool in landslide research, especially its three-dimensional visualization simulation capabilities, as well as its outstanding computing power in failure mechanisms research, stability analysis, and dynamic process simulation. Such as, the finite difference method has been employed for landslide simulation in several studies (Yin et al., 2015; Longoni et al., 2014). Wei et al. (2019) employed PFC3D to analyze the unstable slope in Mabian and obtained consistent results. However, the failure mechanism of rock mass remained unexplored. In contrast, while two-dimensional discrete element method (DEM), DDA2D, used by Huang et al. (2019) to simulate the Xinmo landslide, easily revealed dynamic characteristics, certain details such as movement pathways were lost. There are often a large number of structural planes in the sliding mass of a rock landslide. These structural planes vary in location, size and occurrence, and their spatial distribution is often random, which will control the landslide instability mode (Muaka et al., 2017). Hence, three-dimensional DEM has been proposed as a more realistic method for simulation, allowing for the exploration of failure mechanics, pathway, and dynamic characteristics of sliding mass (Corkum and Martin 2004; Espada et al., 2018; Fan et al., 2019b; Verma et al., 2019). Widely used for dynamic characteristics studies of rockslide, 3DEC, as a representative three-dimensional DEM, has been used to demonstrate the applicability and effectiveness of DEM. For instance, Liu et al. (2021a) employed the discrete fracture network (DFN) in 3DEC to investigate the effects of fracture density on movement patterns. Similarly, Wu et al. (2018) studied the erosion effect of Hsien-Du-Shan landslide on materials along the pathway. Therefore, the DEM has more advantages in simulating the instability and movement process of rockslides and is most suitable for post-earthquake rockslides with a large number of rock fractures.
In previous studies, the conventional modelling approach for rock fractures often involved uniform subdivision of the sliding mass into cubes. Although this method can provide relatively accurate estimates of the accumulation range, it neglects the influence of the actual rock structure on the initiation and instability process of the landslide (Wu et al., 2018). In contrast, DFN models treat rock mass fracture groups as a group of discrete, planar, finite-size fractures, emphasizing the role of the kinematic and spatial variability of discontinuity characteristics on the slope failure mechanism and the size and shape of the failure block. The DFN generator can generate random fractures based on the controlled fracture group, providing a more realistic fractured rock mass representation for the discontinuity (Itasca Consulting Group, Inc. 2016). At the same time, it can also use random vector distribution functions to generate other joints that cannot be fully measured (Havaej et al., 2016; Medici et al., 2023; Kolapo et al., 2023). For example, Muaka et al. (2017) used the DFN-3DEC method to simulate the failure characteristics of fractured pillars, and Salvini et al. (2014) used the UDEC-DFN method to study the slope stability of the Carrara marble quarry in Italy. Therefore, the research objective of this paper is to use the discrete element method combined with discrete fracture network to achieve accurate inversion of rock landslides with fractures, reveal the instability mechanism and dynamic characteristics of a rockslide and the controlling effect of rock mass fracture parameters on rockslide, and explore the feasibility of using check dams to prevent such disasters.
In this paper, the Yinxingping (YXP) rockslide in Wenchuan was studied through field investigations and geological analysis firstly, which allowed for the identification of the failure mechanism. Then, we constructed a realistic 3D model of the YXP rockslide based on aerial photography and established the rock mass fractures of source area through discrete fracture networks (DFN) model. The simulation results provided insight into the movement mode and dynamic characteristics of the YXP rockslide in terms of velocity and displacement of all the blocks. Additionally, the influence of friction angle and density of the fractures on the kinetic process of sliding mass was discussed. Furthermore, a check dam was implemented to test the feasibility of preventing the movement of the rockslide materials in the YXP debris flow gully. This study contributes to a better understanding of the disaster mechanism and movement mode of the rockslides and can serve as a reference for the prevention and control of similar rockslides in meizoseismal areas.
2.1 Geological setting and the rockslide event
The YXP rockslide, located in Yinxing village of Wenchuan County, Sichuan Province, China (Fig. 1). It is situated in the north-western region of the Sichuan Basin and is influenced by three major thrust faults of Wenchuan earthquake, including Wenchuan-Maoxian fault, Beichuan-Yingxiu fault and Anxian-Guanxian fault. YXP rockfall is located in a meizoseismal area where many earthquakes with a magnitude greater than 6 occurred before, including the 2008 Wenchuan earthquake, whose epicenter is 25 km away from the rockslide. The mountainous terrain in this region is extremely fragmented, and often after a collapse occurs, there is still a large amount of potentially unstable rock mass at the trailing edge of the collapse, which still poses a potential sliding hazard (Fig. 2a). This kind of disaster are widely distributed, such as Daguangbao rockslide (Zhang et al., 2013), Xinmo Rockslide (Fan et al., 2017) and Sanxicun landslide (Pei et al., 2022). According to the in-site investigation, the terrain in the study area is steep and deep-cutting with mainly Proterozoic granite, diorite, and some hard rocks. The lithology of the area is relatively broken. The average annual precipitation in the study area is 1253.1 mm with a maximum daily precipitation of 269.8 mm based on the data from nearby rainfall station. The incident occurred on 20 July 2018, during a strong rainstorm, causing the YXP rockslide to accumulate in the nether YXP gully, subsequently leading to the material sources for the debris flow in YXP gully.
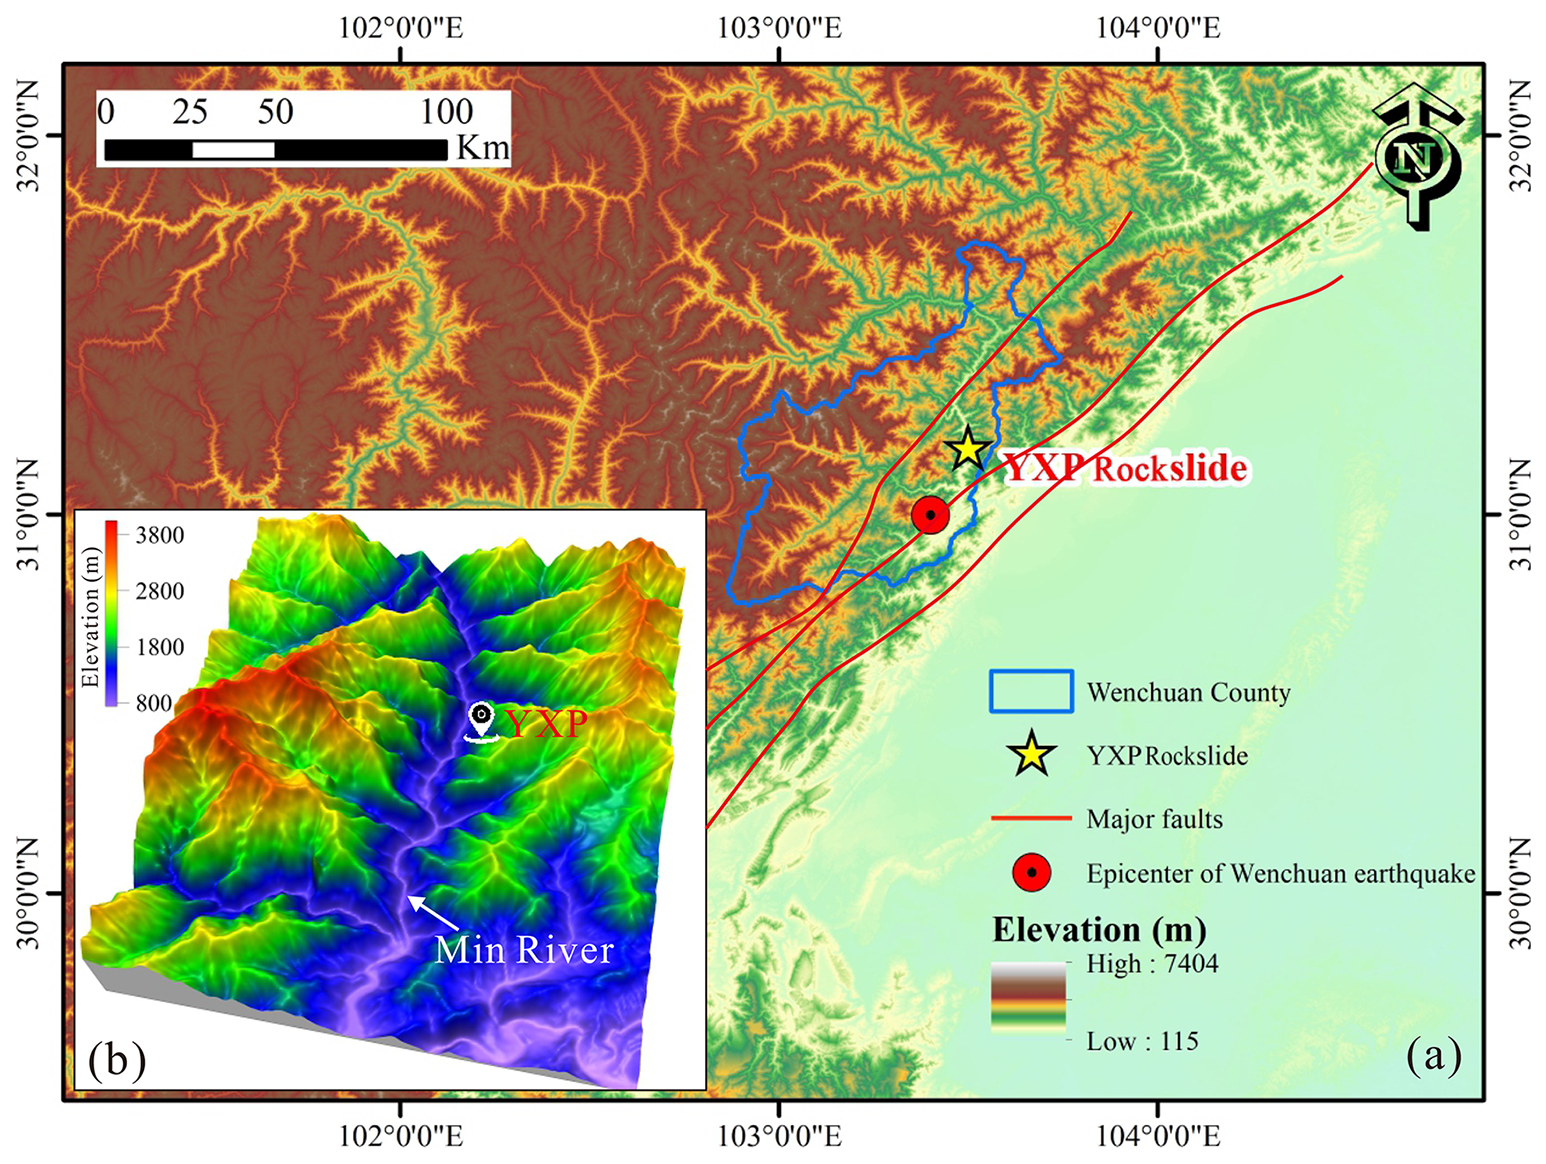
Figure 1The location (a) and landform (b) of the YXP rockslide.
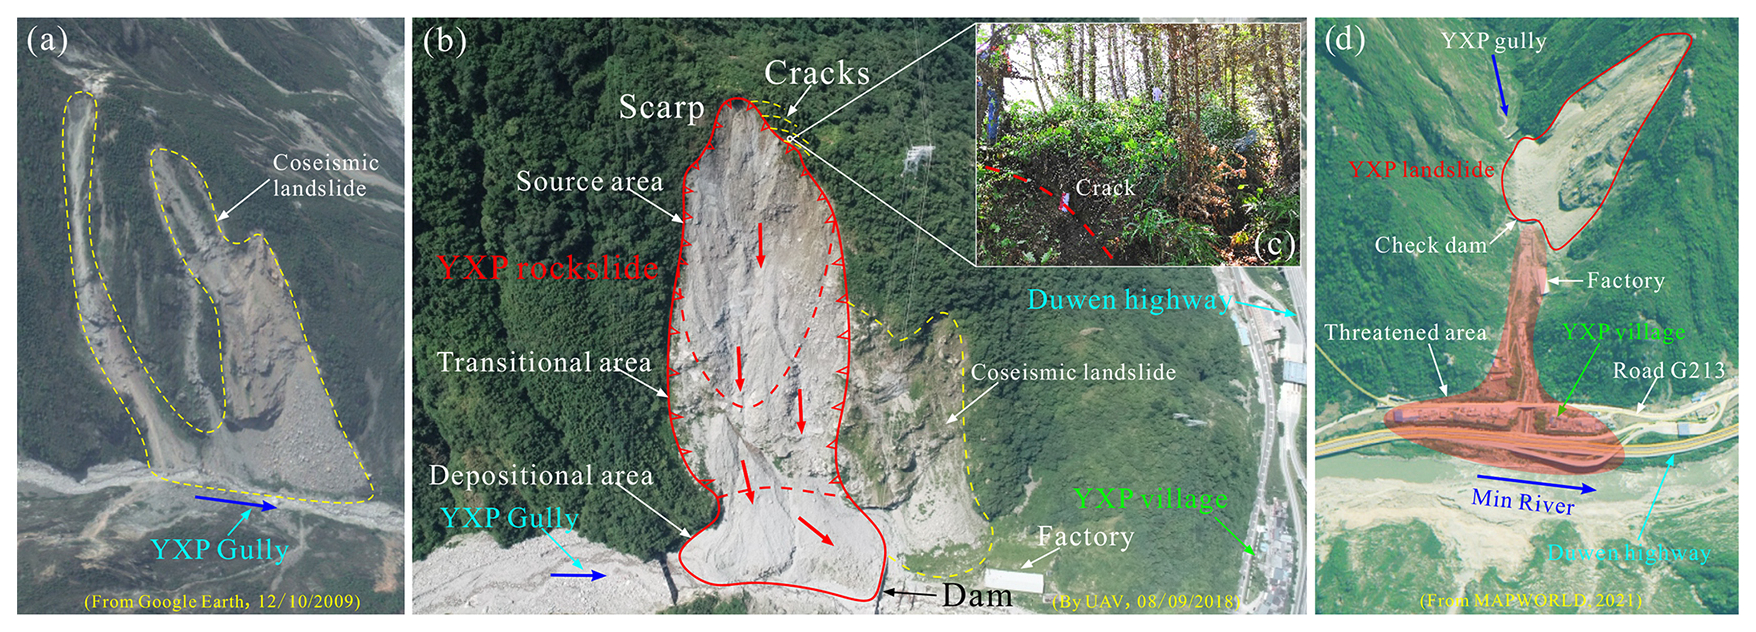
Figure 2(a) The YXP area affected by Wenchuan Ms 8.0 earthquake from © Google Earth in 2009; (b) The top view of YXP rockslide taken by UAV in 2018; (c) The cracks in rear edge of YXP rockslide; (d) The threatened area of YXP rockslide from MAPWORLD in 2021.
YXP rockslide is situated approximately 800 m away from the gully mouth of YXP debris flow gully, where the G213 national highway and Dujiangyan-Wenchuan expressway are positioned. As shown in Figs. 2b and 3, the YXP rockslide can be subdivided into three areas: the source area characterized by a steep slope of approximately 60°, the transitional area with a slope angle of 47° and a length of around 120 m, and the depositional area where the sliding mass converges. According to the difference result of elevation data between UAV ariel photography model and the ALOS satellite, the source area had a total area of 31 419 m2 and an average thickness of 5.8 m, resulting in a total volume of approximately 18.22×10⁴ m3 (Figs. 3 and 4a). During the Wenchuan Ms 8.0 earthquake, the source area experienced a significant number of cracks formations (Fig. 2c). Subsequently, under rainfall, the rainwater infiltrated the fractures and increased the pore water pressure, eventually leading to instability and sliding of the mass (He et al., 2021). The deposition of rockslide materials in the gully of YXP debris flow inclined downstream due to the configuration of the bottom of the depositional area. Fortunately, most of the materials were entrapped by a check dam built in the gully beforehand. This event resulted in traffic interruption of the downstream National Road G213 and the blockage of the river, causing the loss of lives and property of the downstream residents (Fig. 2d).
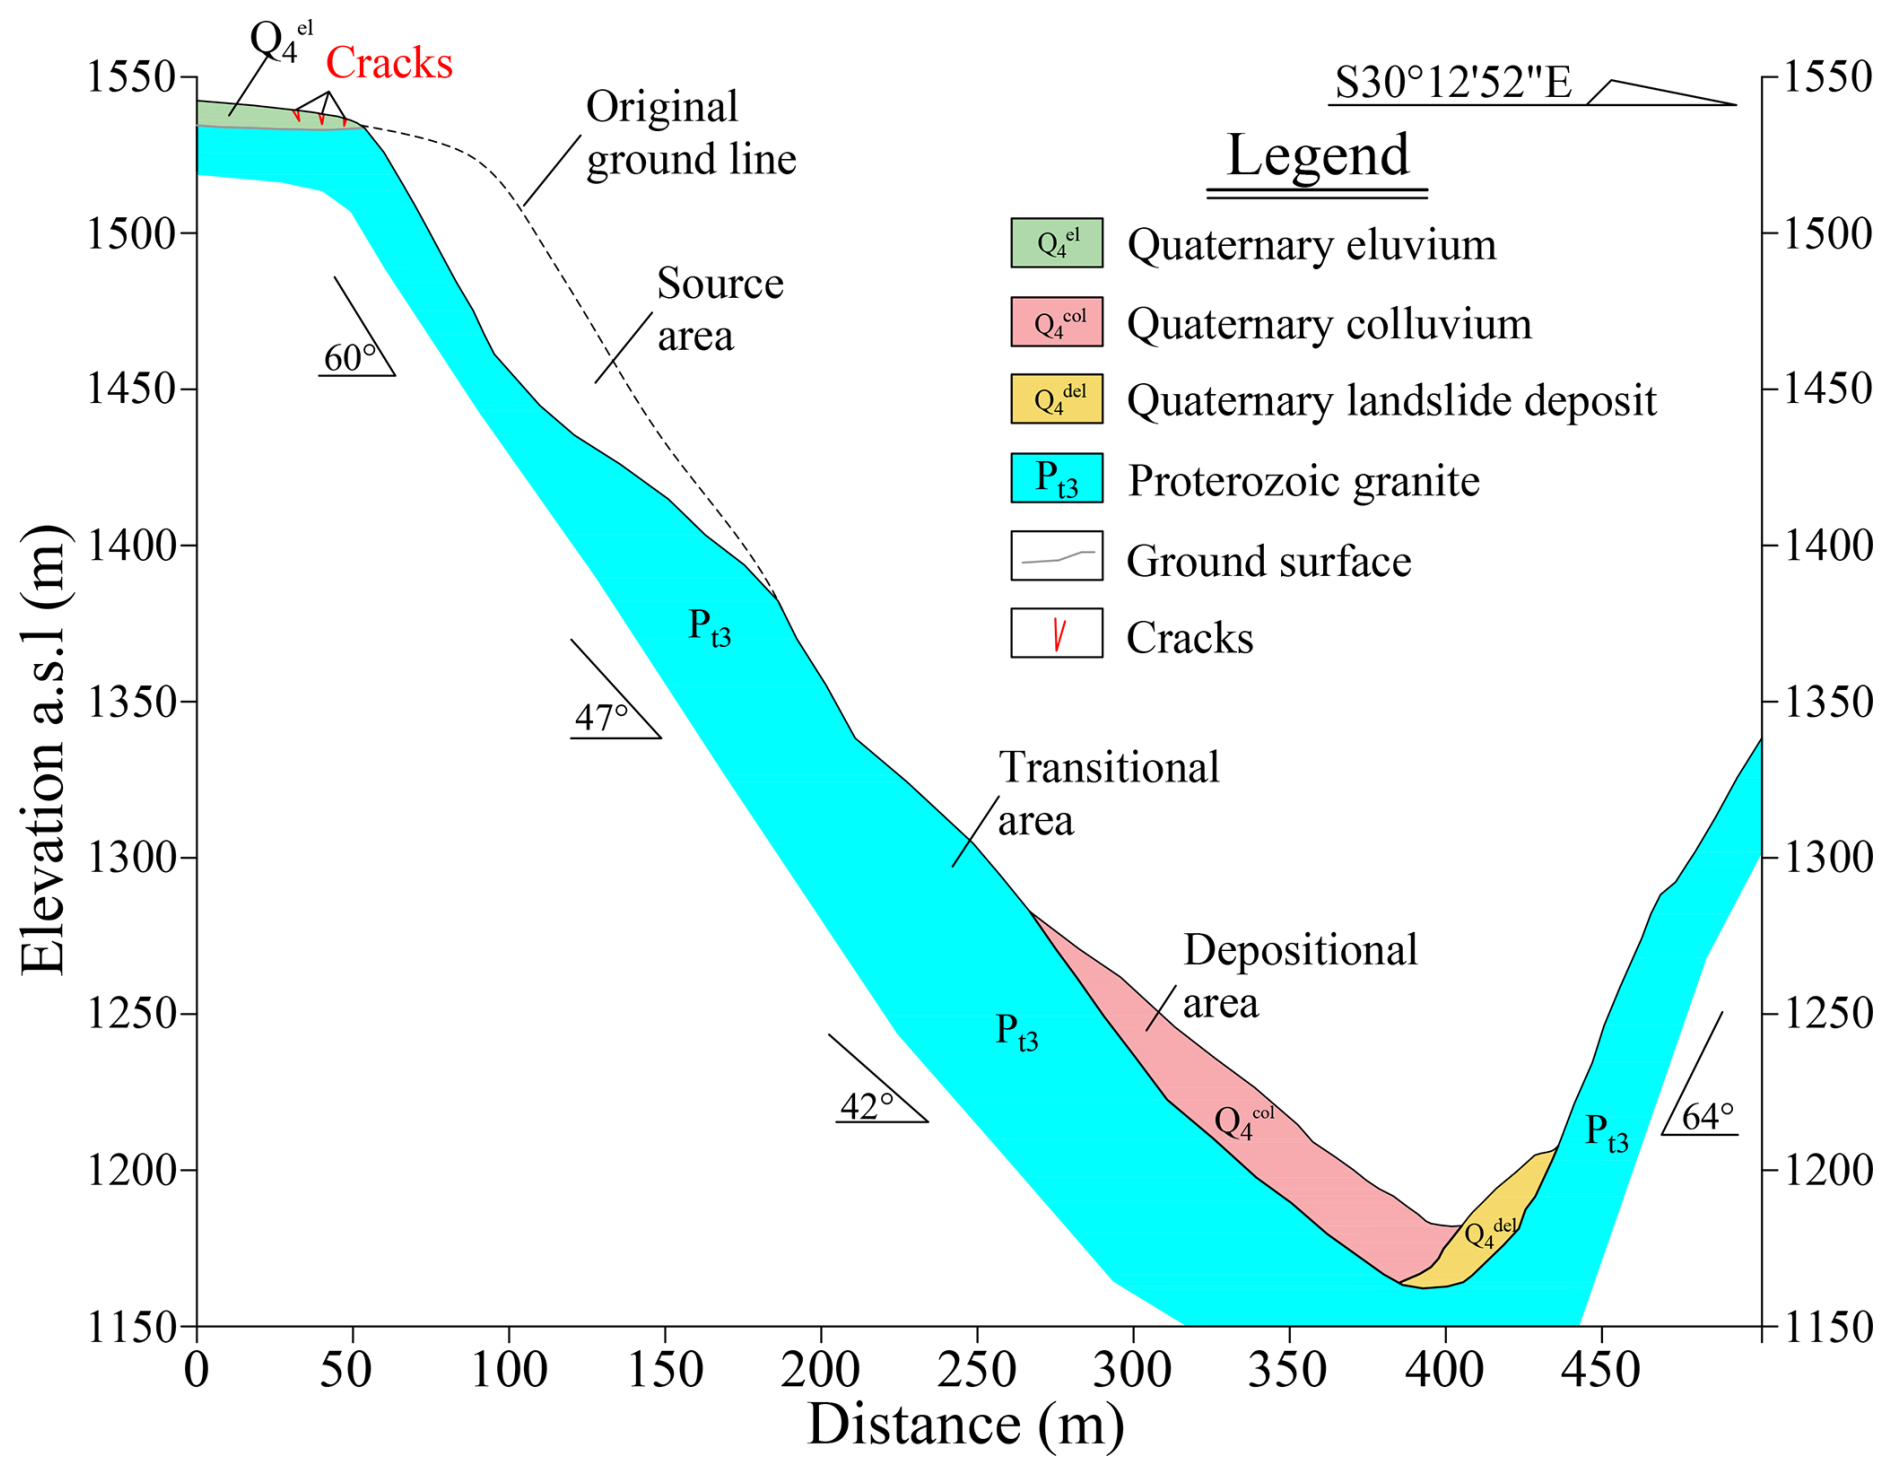
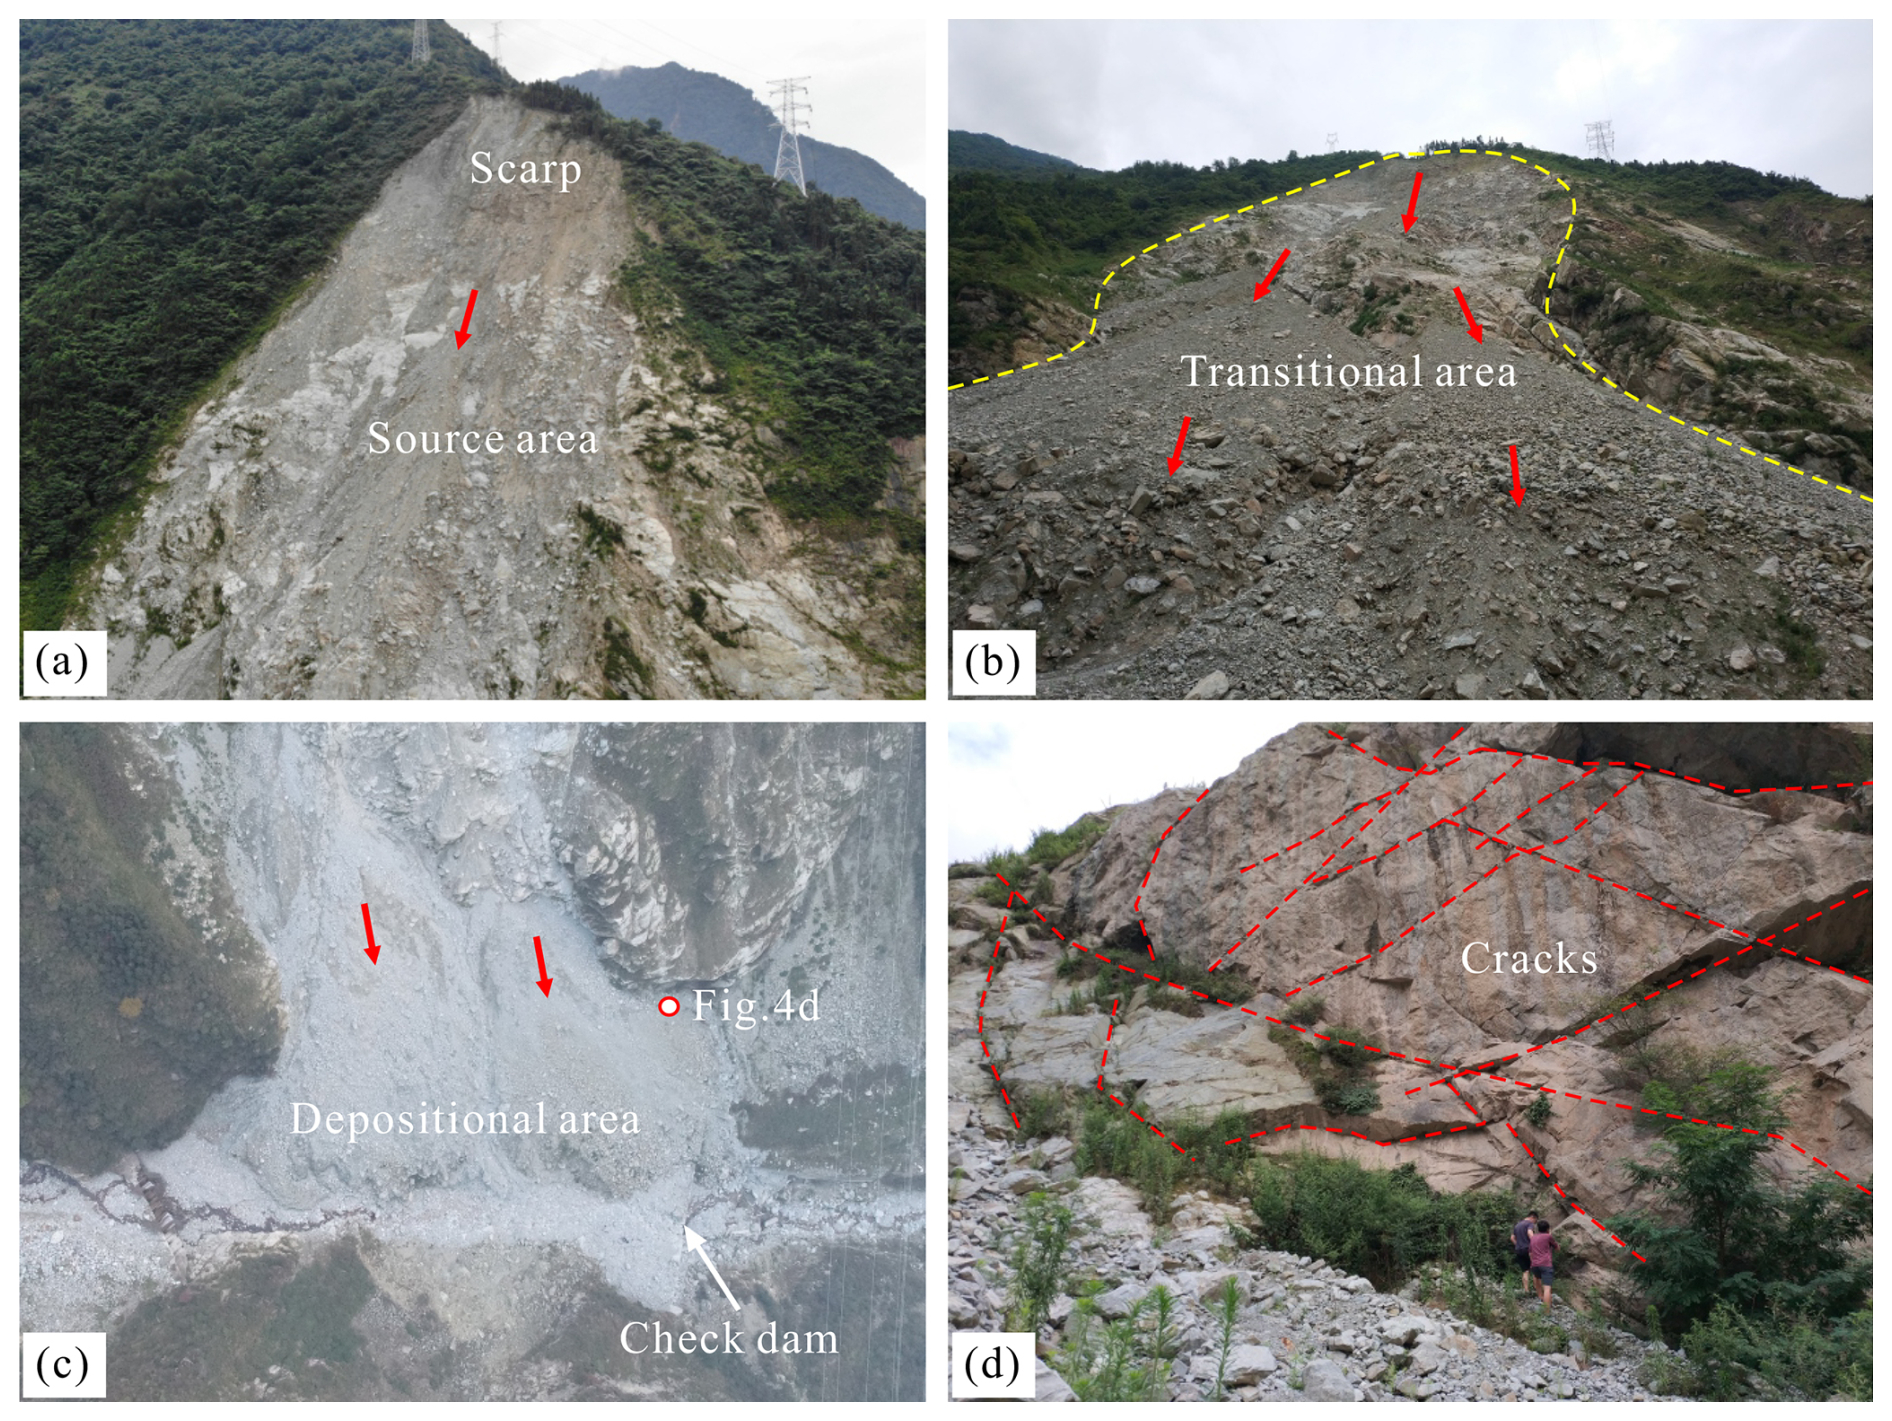
Figure 4A series of photographs include the scarp (a), transitional area (b), depositional area (c), and fractures (d).
2.2 Formation mechanism
Affected by the previous earthquake, the rock mass of YXP rockslide was seriously broken, and the two sets of controlled fractures provided the material source for the rockslide (Fig. 4d). In addition, the hard and soft rocks in the study area were affected by weathering, erosion and other factors, which also create conditions for the occurrence of geo-hazards such as collapse, landslide and debris flow (Zhou et al., 2014). The climate in landslide area was subtropical monsoon climate, the distribution of annual precipitation was uneven, which was mainly concentrated in summer. The accumulated rainfall in July 2018 reached the peak of 203.3 mm. As the slope was softened by continuous heavy rainfall, the shear strength of the rock mass decreased, the slope was more prone to slip (Liu et al., 2021b). Based on the findings from the field investigation, the obvious sliding surface located at the rear edge of the YXP landslide was observed (Fig. 4a and b). Consequently, the deposit from the sliding considerably obstructed the gully situated at the foot of the slope (Fig. 4c). An in-depth examination of the landslide revealed that it was mainly comprised of quartzite gravel, which had minimal impact on the small-discharge stream in the YXP gully due to its large particle size and large aperture gaps. Nonetheless, if a massive debris flow ensues, the discharge will increase significantly, resulting in the obstruction effect, ultimately leading to severe damage to buildings situated downstream (Hu and Huang, 2017).
To construct a discrete element model, it is first necessary to obtain terrain data and fracture parameters, and its core lies in the construction of the fracture network. Through field investigations, we acquired 423 sets of fracture data and identified two dominant joint sets from this dataset via projection analysis. Subsequently, we introduced the Monte Carlo stochastic fracture network method and generated a random joint network primarily based on these two dominant joint sets. Then, we used the generated joint network to discretize the sliding mass, thereby establishing a 3D model that closely approximates the characteristics of real rock masses. Finally, employing the discrete element method (DEM), we defined models and assigned parameters separately for block units and joint units, conducting simulation studies according to different required working conditions.
3.1 The discrete element method
The three-dimensional DEM has a rapid development with the researchers' efforts around the world (Kim et al., 2007; Lemos et al., 2015; Ma et al., 2021). It is appropriate for simulating highly nonlinear behavior because an explicit solution was utilized (Wang et al., 2006). The built-in discrete fracture networks are employed to simulate fractures in rock mass. Each block could be discretized into many tetrahedral elements (Einstein and Baecher, 1983). The contacts in 3DEC were modelled scientifically. The fracture normal stiffness, Kn, is parallel with the normal contact damper in the normal direction. In addition, the fracture tangential stiffness, Ks, is parallel with the tangential contact damping connected with Mohr–Coulomb slider, Sm–c, in the tangential direction (Fig. 5).
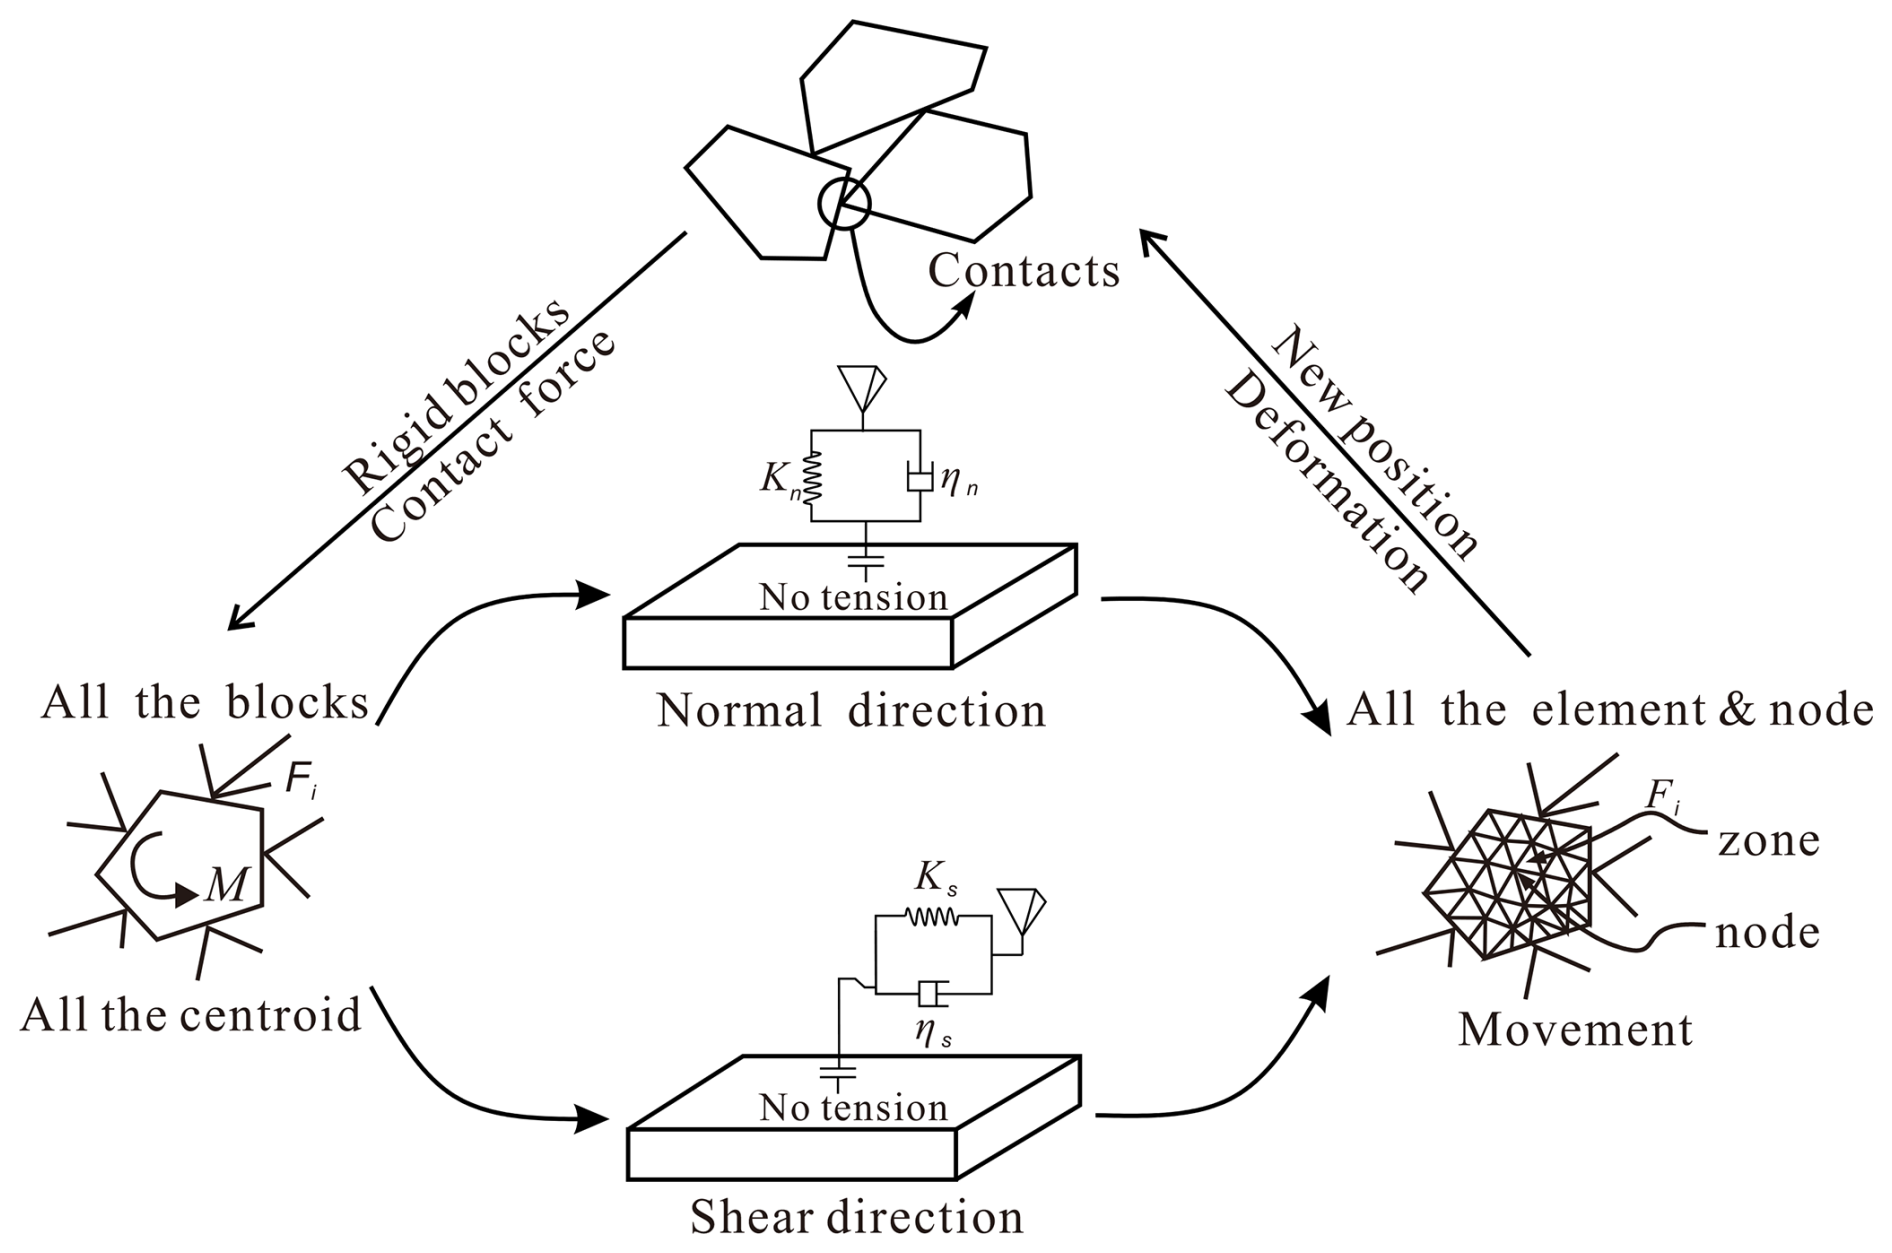
A fundamental equation of motion in 3DEC has been formulated, as stated in (Itasca Consulting Group, Inc. 2016):
where m is the mass; u is the displacement; t is the timestep; c is the viscous damping coefficient; k is the stiffness coefficient; f is the external force of the element. When the block motion update is completed, the sum of all block forces and moments, the force and the moment of bending in each cycle will be reset to zero for the next calculation (Liu et al., 2020).
3.2 Model setting
We established a three-dimensional model of the rockslide through the UAV aerial photography and digital elevation model of ALOS satellite in Japan. The model was 1320 m long, 1065 m wide and 700 m high (Fig. 6a). According to the measurement, the longitudinal gradient of YXP gully in the landslide depositional area was about 14°. In order to understand the kinetic characteristics of different regions of the sliding mass in the movement process, we set 10 monitoring points on the section A–A′ and B–B′, and monitored the velocity, total displacement and horizontal displacement at the same time (Fig. 6b and d).
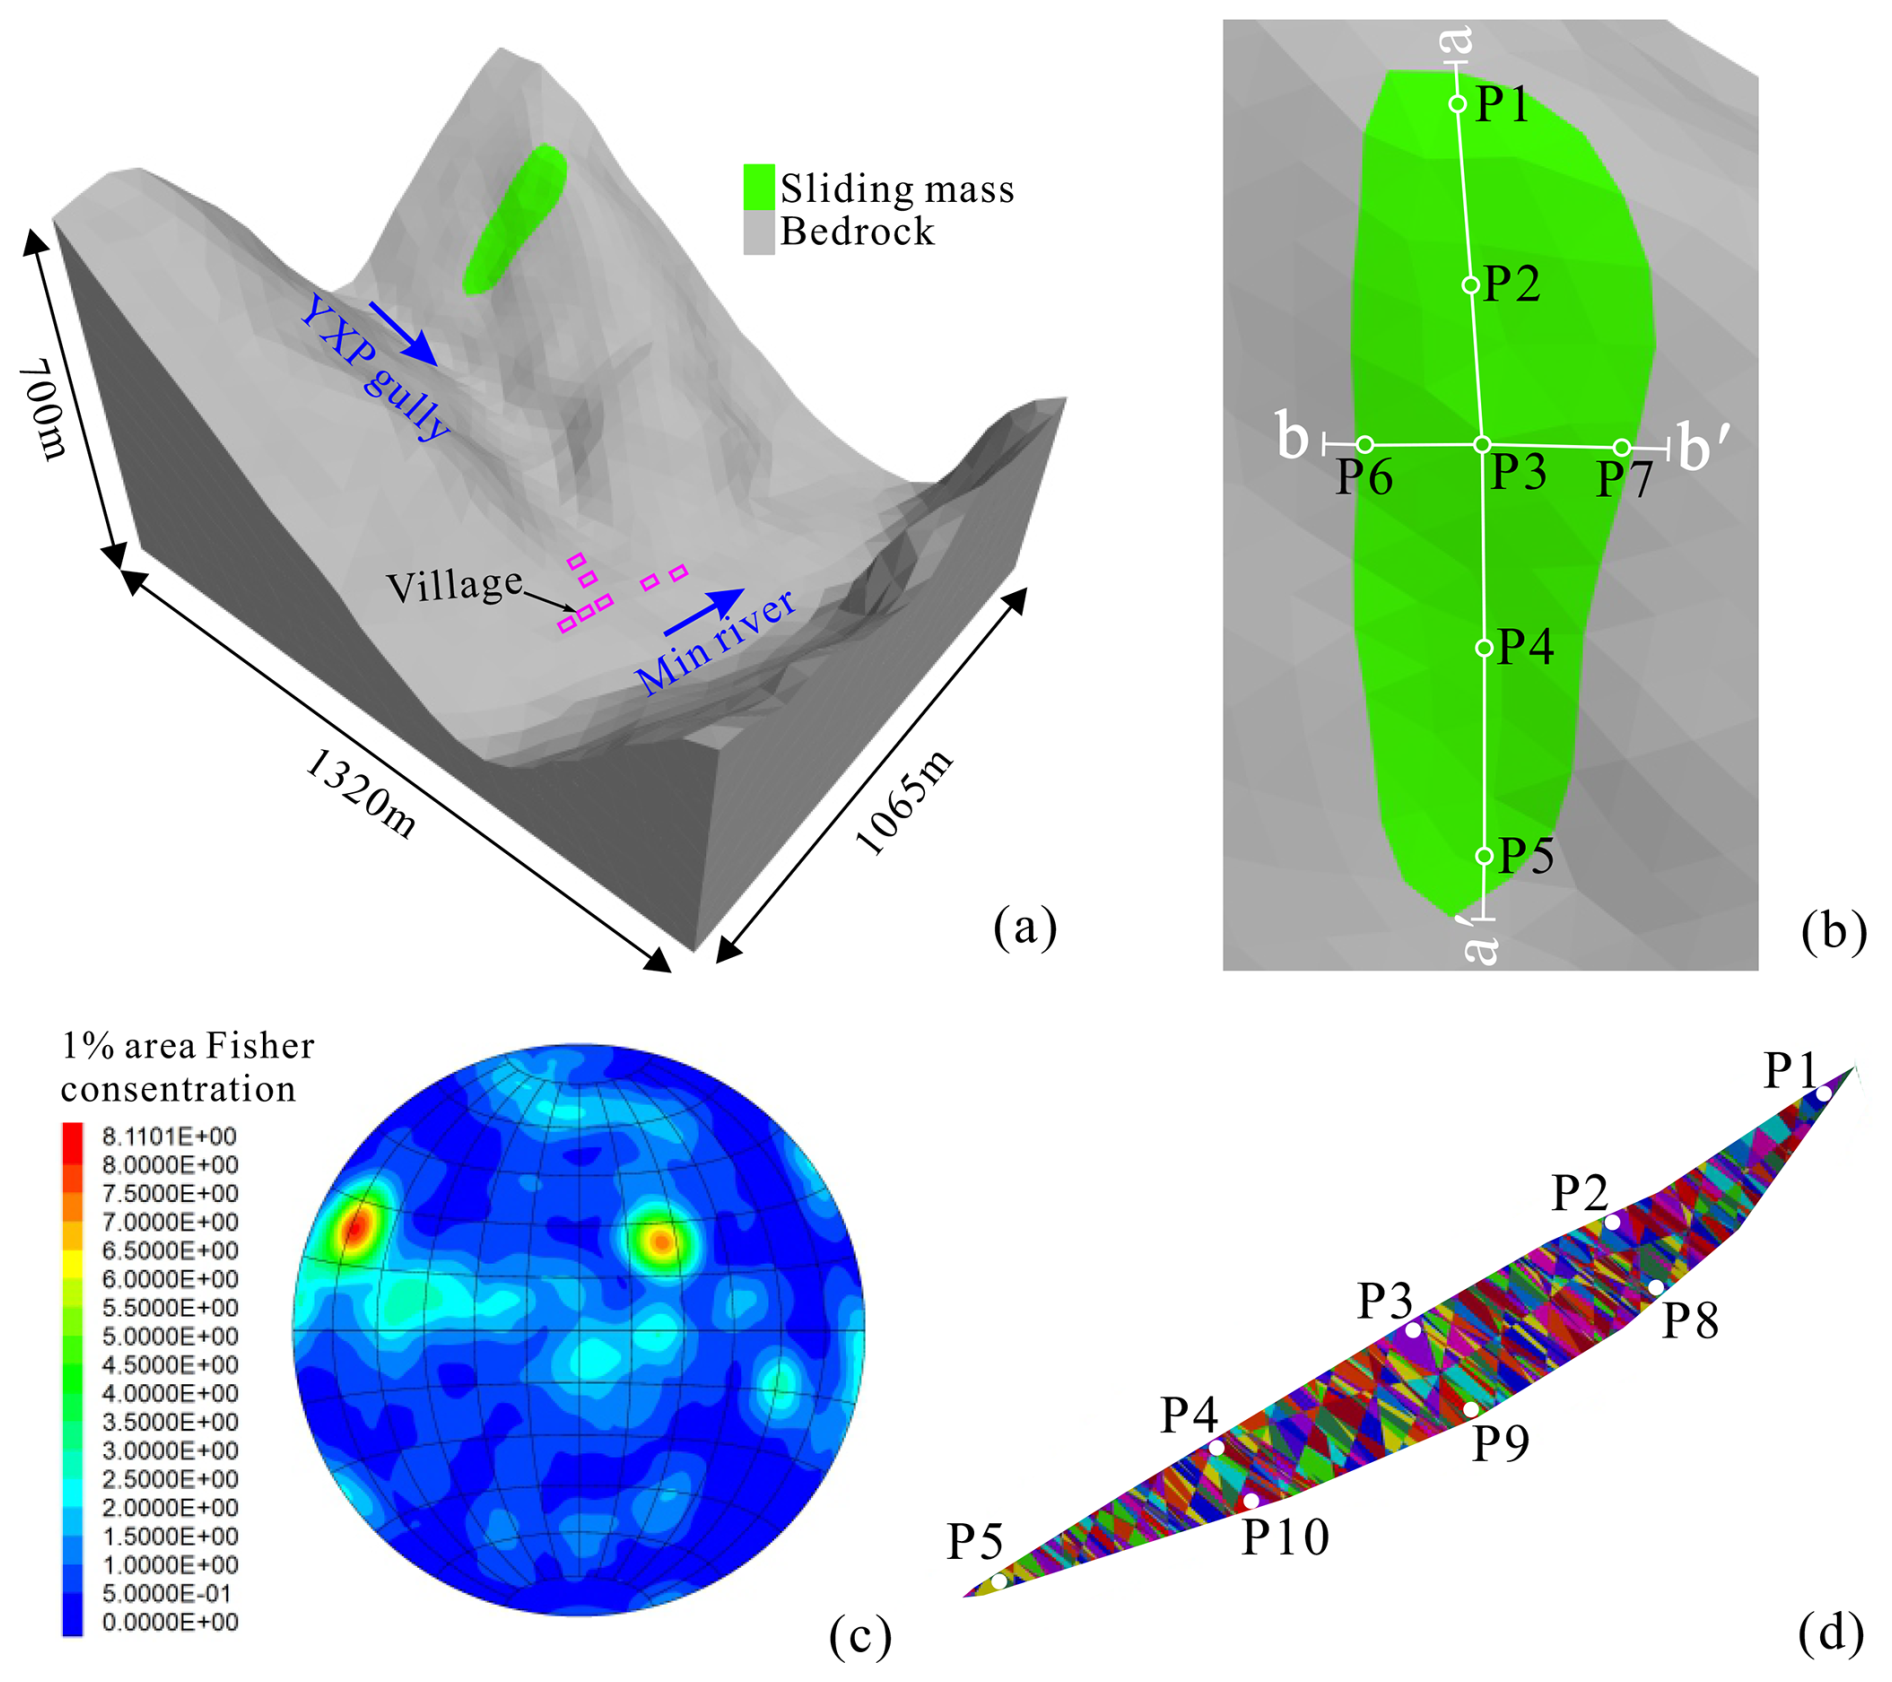
Figure 6(a) The three-dimensional model of YXP rockslide; (b) The monitoring points in source area; (c) Fisher distribution of in-site measured rock fractures; (d) Sliding mass cut by DFN.
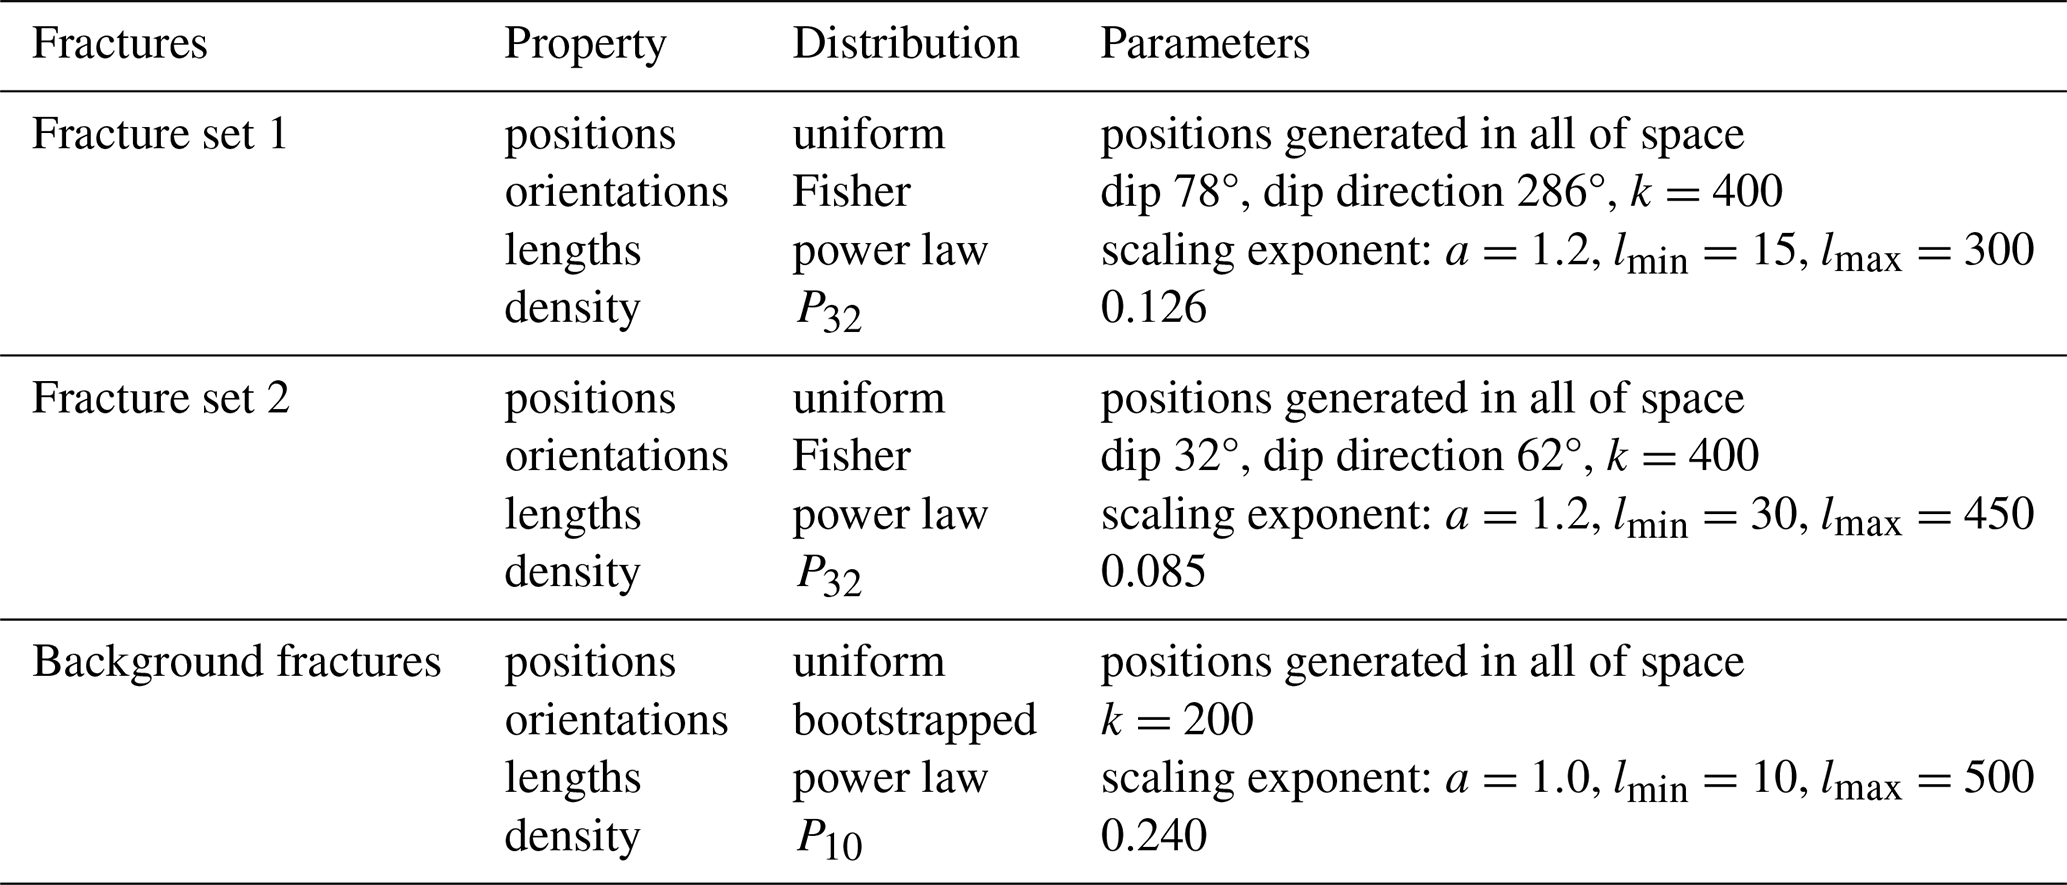
According to the field investigation, we measured the dips and dip directions of 423 groups of rock mass fractures, and drew the corresponding Fisher distribution map. Based on the stereographic projection of all the fractures, we found that there are two sets of controlling fractures in the YXP rockslide. The dip direction and dip angle of one set are 286 and 78°, and another set are 62 and 32°, respectively (Fig. 6c). Then, we established a DFN model using built-in Fish language based on the collected data (Havaej et al., 2016), and the parameter settings of fracture sets are shown in Table 1.
Table 1Summary of parameters used to generate the fractures of YXP rockslide. Where k is the Fisher constant. P32 is volumetric density of fractures. P10 is linear density of fractures. a is the scaling exponent. The length is in the range of lmin to lmax.
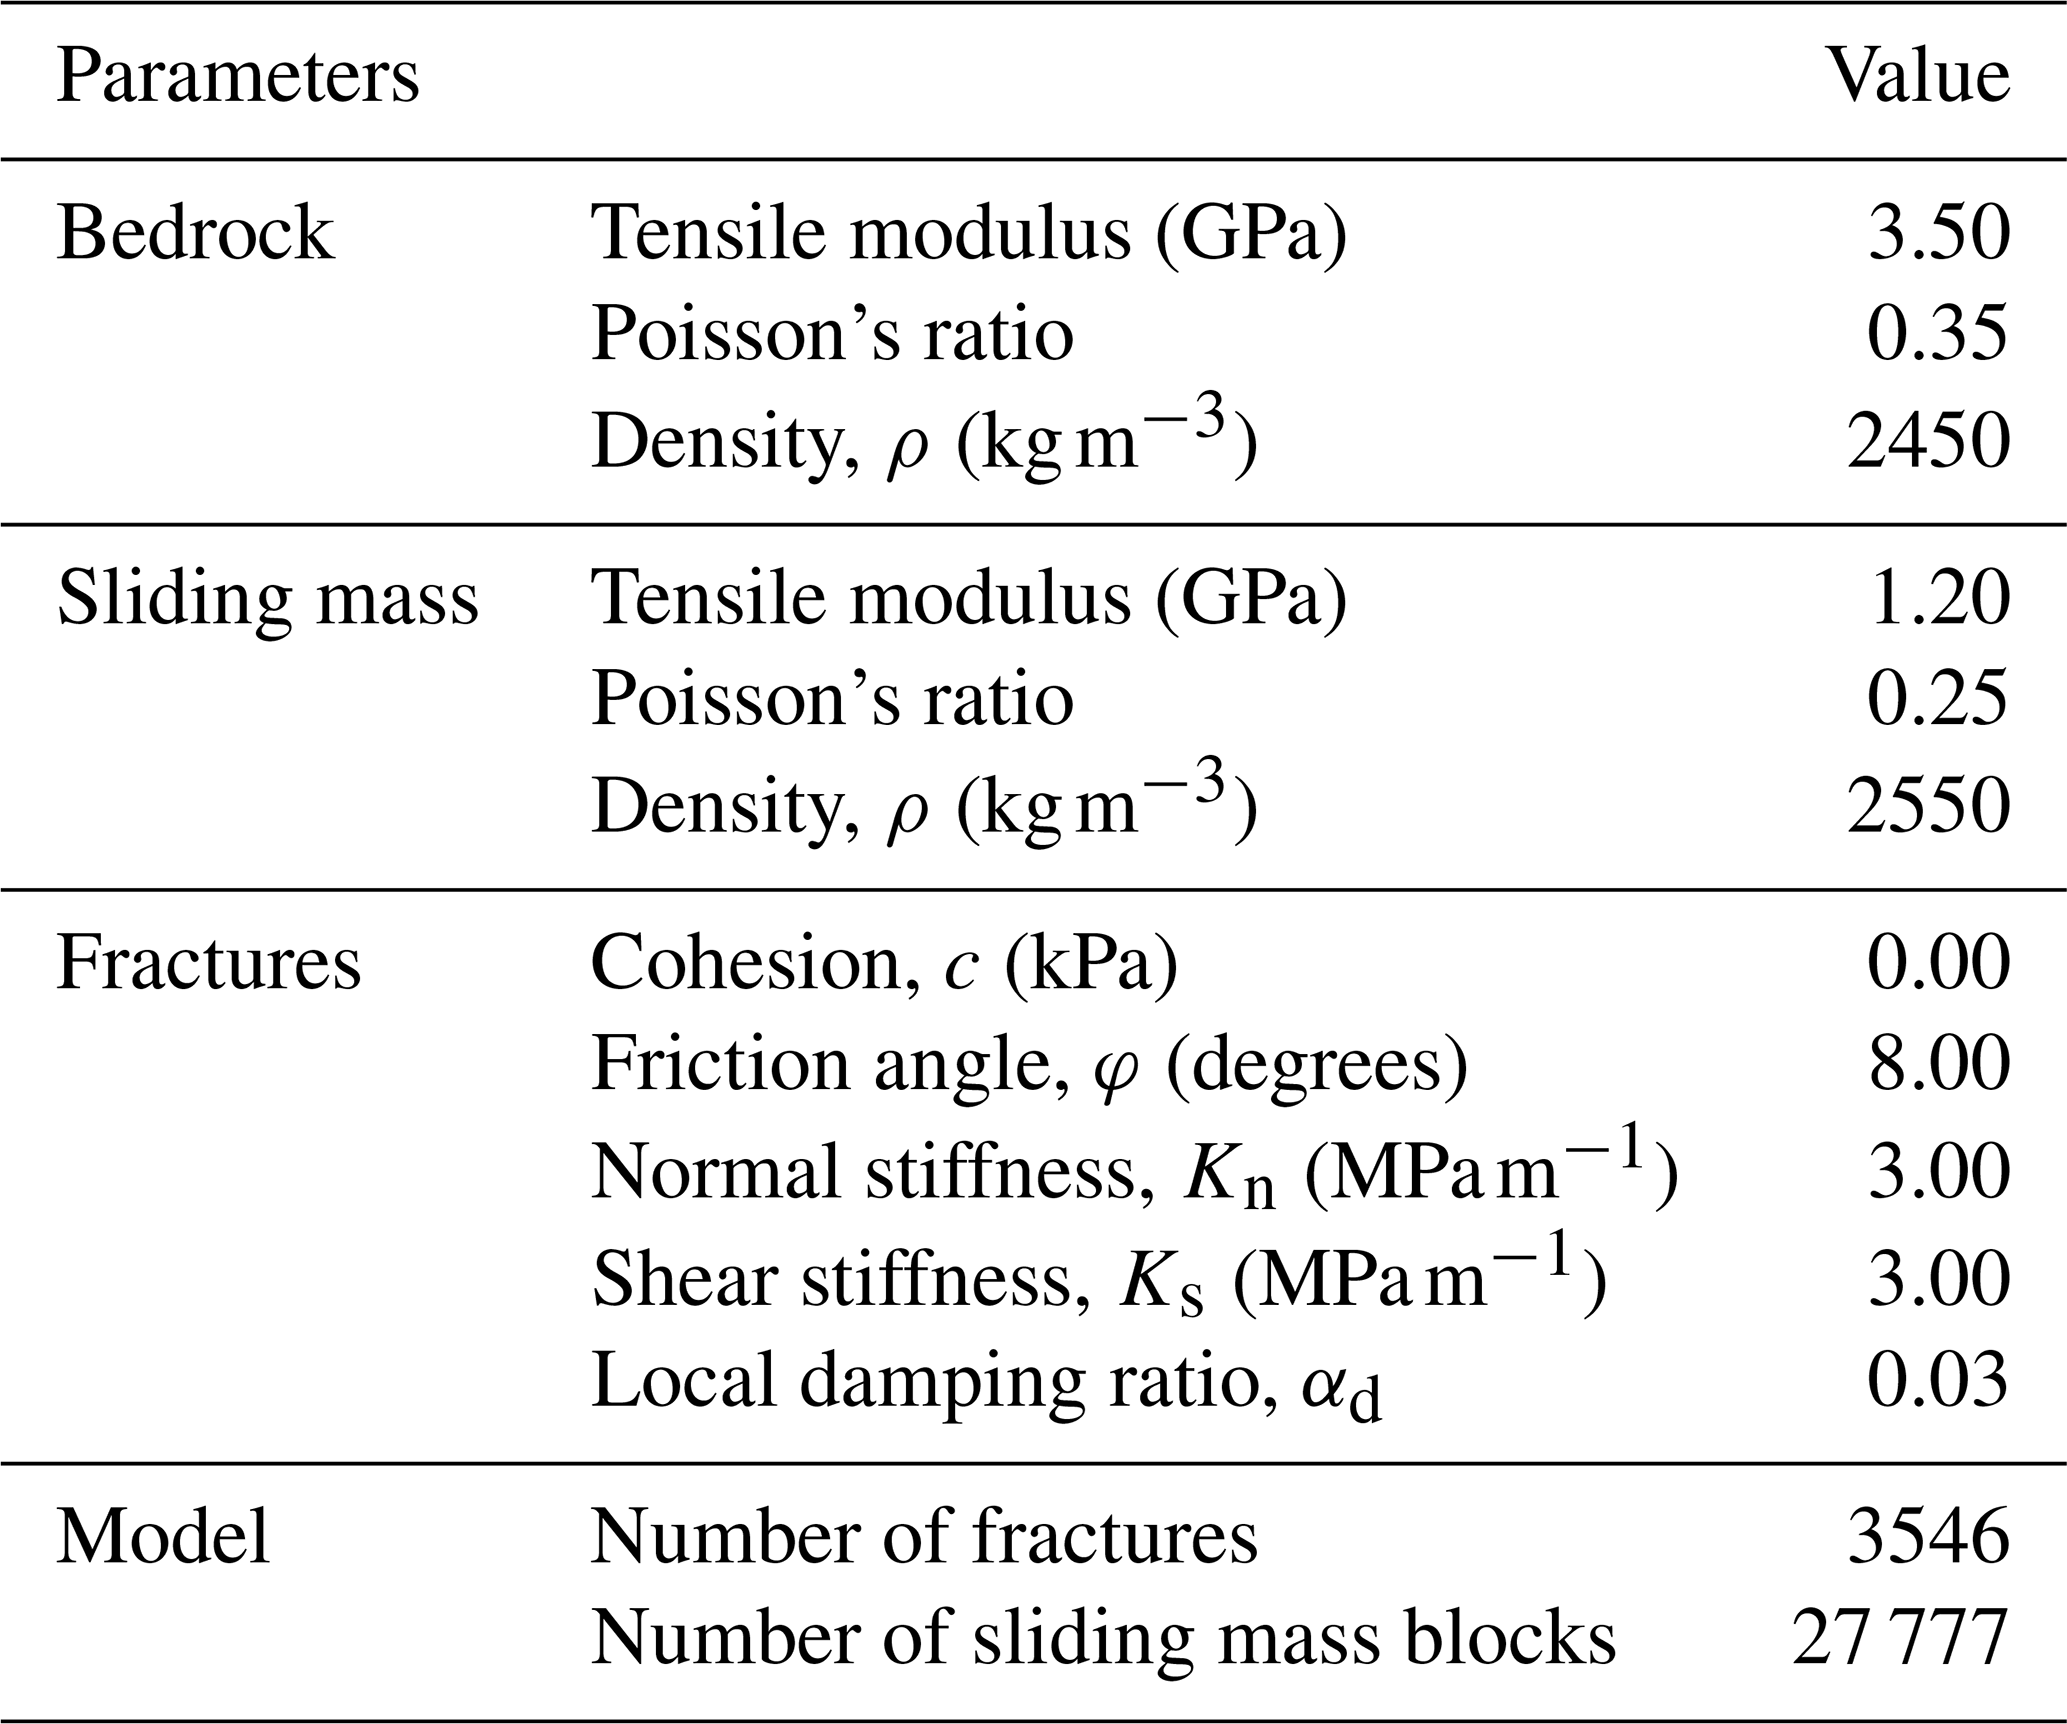
After that, the DFN model was used to cut the rock mass to form a fractured rock mass (Fig. 6d). The number of fractures and cut blocks were 3546 and 27 777, respectively. The bedrock was fixed in the calculation to simplify the simulation process. Because the sliding mass and the bedrock were hard rocks, we set their constitutive models as elastic models. For the internal fractures in the rock mass, we adopted the Mohr–Coulomb joint model, which is based on the Mohr–Coulomb strength criterion and can judge the shear failure of the joints. It is suitable for joint slip simulation in rock mass stability analysis. Since our primary focus is on the kinematic behavior of the sliding mass, we applied the “fix” command to the underlying bedrock to constrain its movement in all directions. This treatment is consistent with real-world conditions, as bedrock typically remains stable during slope failures. The bedrock and sliding mass exhibit intrinsic differences in mechanical properties, with the latter having significantly lower shear strength. This strength disparity naturally exists between the two materials. A structural plane (discontinuity) exists between the sliding mass and the slip surface. The stability of the overlying geomaterials is predominantly governed by the interface parameters, including Cohesion (c), Friction angle (φ), Normal stiffness (Kn), Shear stiffness (Ks). Then, according to the experience of similar areas, the value of parameters of sliding mass, bedrock and fractures were assigned before the simulation (Liu et al., 2021a), and the finally values of parameters through trial and error are shown in Table 2. Since the YXP rockslide was triggered by rainstorm, we assume that it was fully saturated when it initiates, so the parameters of the model were all saturation parameters.
Table 2The simulation parameters used in the kinetic characteristic analysis.
4.1 Characteristic of initiation and movement process
The displacement of landslides is a significant feature that can provide information about the position and movement of the sliding mass over time, as well as the accumulation characteristics of the sliding mass (Wang et al., 2020a). The displacement characteristics of the YXP rockslide are showed in Fig. 7. The middle part of the sliding mass start moving in a saturated condition, reaching the maximum displacement of 41.4 m at 7.46 s (Fig. 7a). At 13.99 s, the sliding mass has completely disintegrated and move in a large scale, achieving the displacement of 207.87 m (Fig. 7b). At 21.45 s, the rocks in the front edge of the sliding mass began to accumulate at the foot of the slope, which facilitated the movement of the middle and rear blocks into the deposition area with acceleration and collision resulting in a significant increase in deposition volume (Fig. 7c and d). The displacement of the rocks at t=39.17 s reached 457.93 m. The displacement distribution in the depositional area indicated that the material at the front edge of the sliding mass reached the trench bottom and accumulated earlier, and the material at the rear edge accumulated upward in turn (Fig. 7e). When t=104.45 s, most of the rocks had completed their movement, while a few rocks remained in the source area. The left edge of the fan-shaped deposit inclined toward the downstream (Fig. 7f).
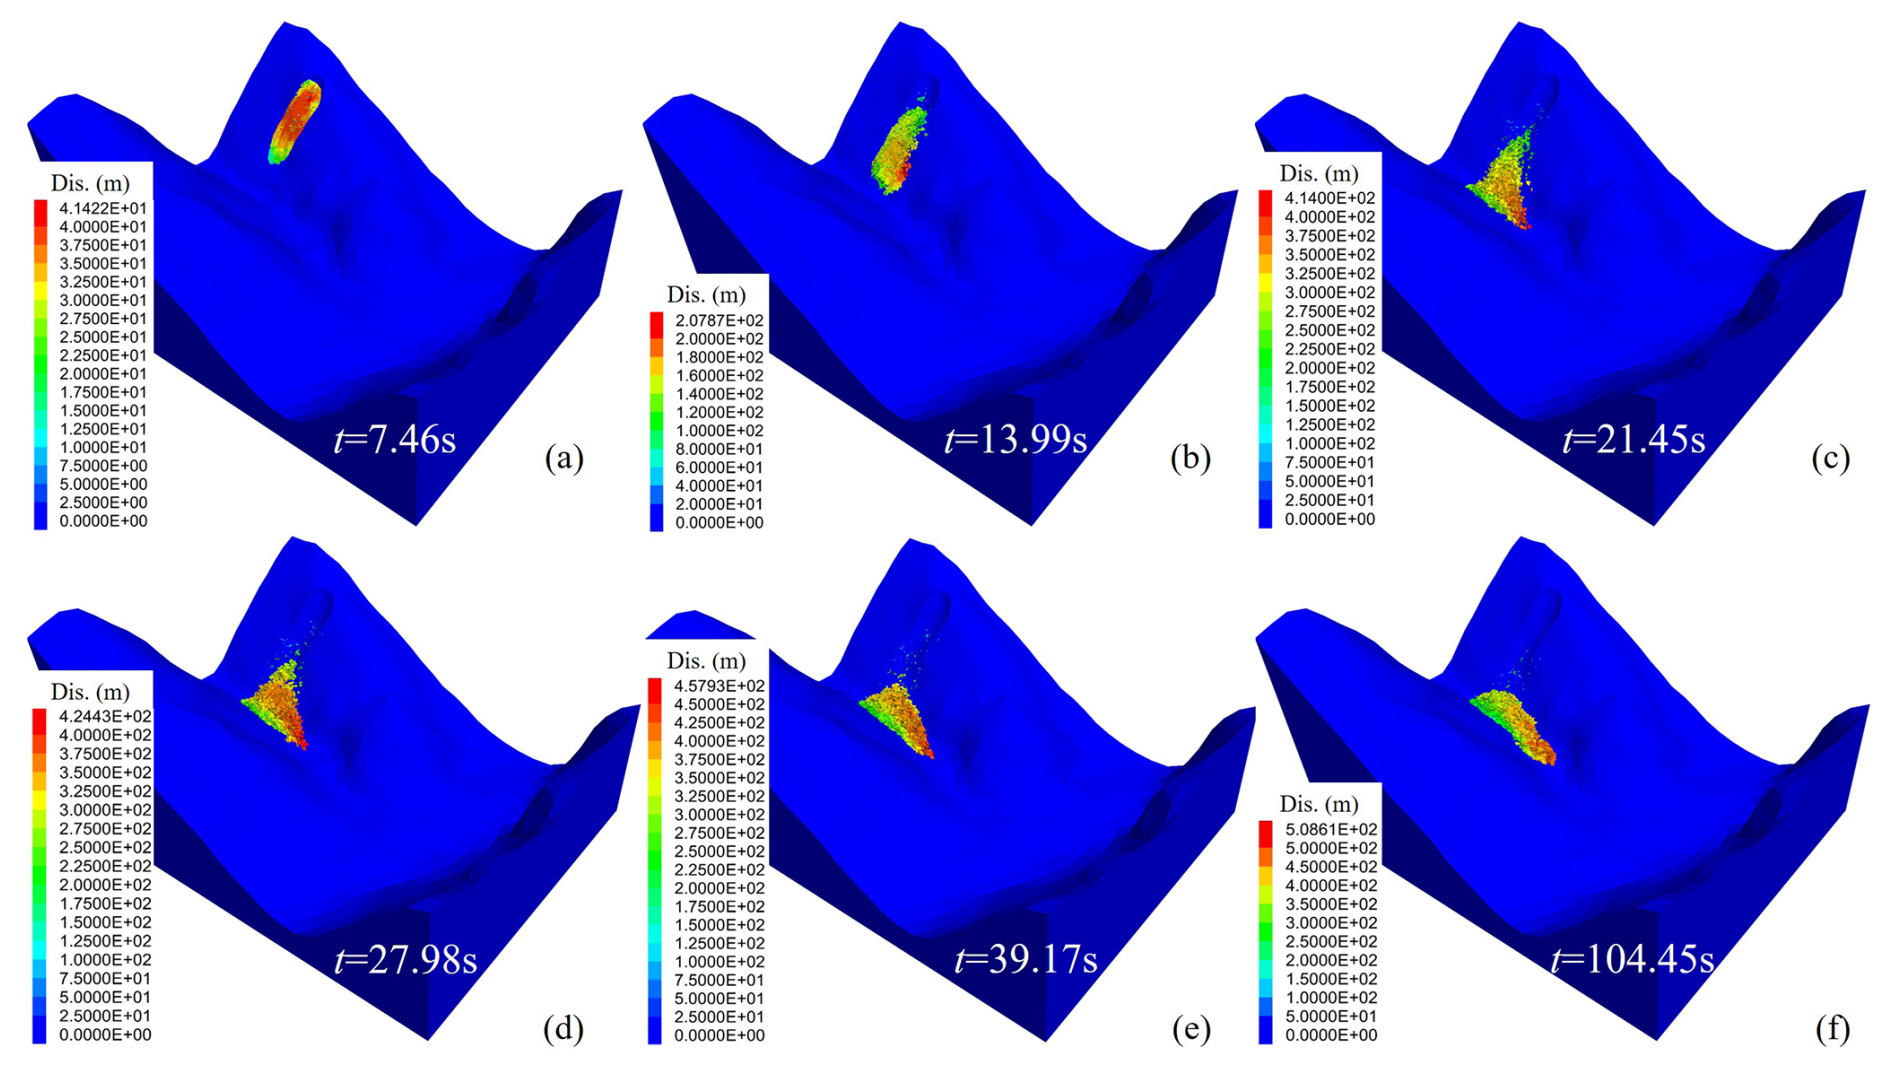
Figure 7The displacement figures of YXP rockslide when the time reached 7.46 s (a), 13.99 s (b), 21.45 s (c), 27.98 s (d), 39.17 s (e), 104.45 s (f).
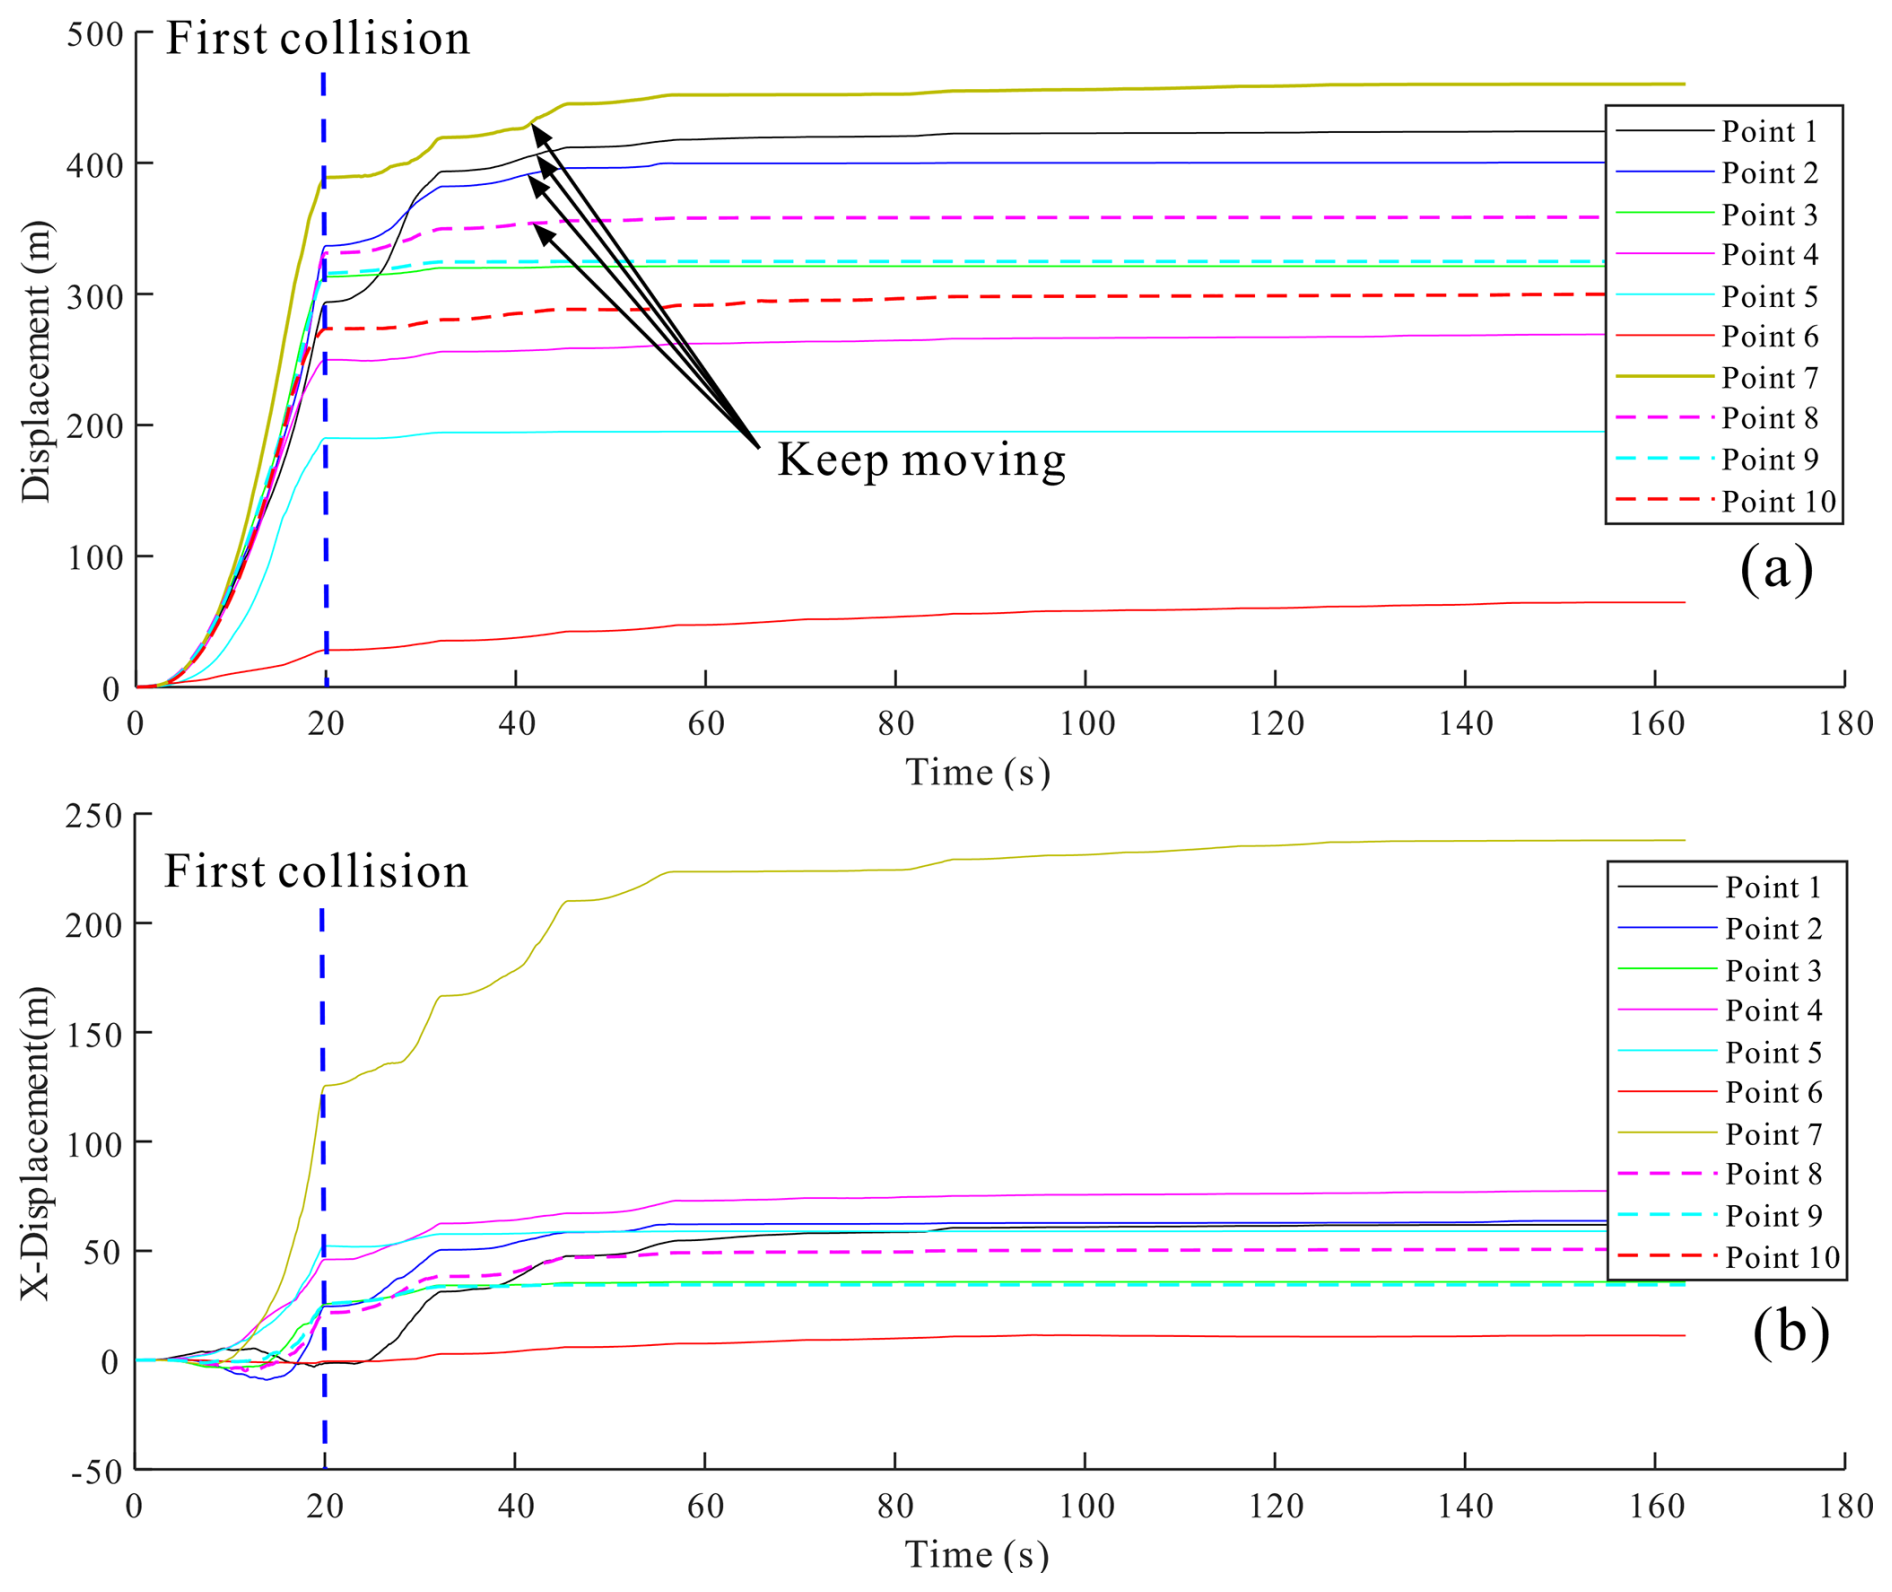
The displacement monitoring results of different points are shown in Fig. 8. The displacement of the monitoring points at the front edge and right side of the sliding mass had no obvious increase after reaching the bottom of the gully at about 20 s, indicating that was close to stop. However, the displacement of monitoring points 1, 2, 8 on rear edge and point 7 on left sides of the sliding mass still increased gradually after reached the bottom of the gully (Fig. 8a). As the monitoring point 7 was located at the left side of the sliding mass, it does not stop when reached the bottom of the gully lately because of the oblique terrain. Influenced by the inherent slope of deposit and gully, the horizontal X-direction displacement of monitoring point 7 was larger than other points (Fig. 8b). These results indicated that the depositional blocks will keep moving to the downstream of the YXP gully because of the slope of the gully. If there were no prevention works, these materials will not stop until reaching a gentle region.
4.2 Characteristic of velocity
The velocity of rockslides is a critical parameter as it reflects the energy exchange of rock blocks during dynamic processes (Wang et al., 2020b). The initial velocity after 6 s of the rockslide was measured at a maximum of 16.34 m s−1 for single surface blocks, with an average velocity of under 10 m s−1 (Fig. 9a). At 13.99 s, sliding rocks disintegrated to form a scarp at the rear edge (Fig. 9b). As time progressed to 21.45 s, the sliding mass showed downstream diffusion with increasing velocity (Fig. 9c). The maximum measured velocity reached 56.75 m s−1, and the overall average velocity was close to 30 m s−1. The sliding mass began to accumulate by the 27.98 s. Consequently, the velocity of material that previously reached lower regions of the gully rapidly decreased to zero, whereas the material at the rear edge continued to slide to the bottom (Fig. 9d). At 39.17 s, the deposition near the downstream began to expand, with occasional scattered falling blocks from the rear edge. The maximum velocity of these blocks was 8.94 m s−1. By the 104.45nd second, the deposit near the downstream region exhibited a velocity of less than 0.25 m s−1, indicating the sliding materials will stop here.
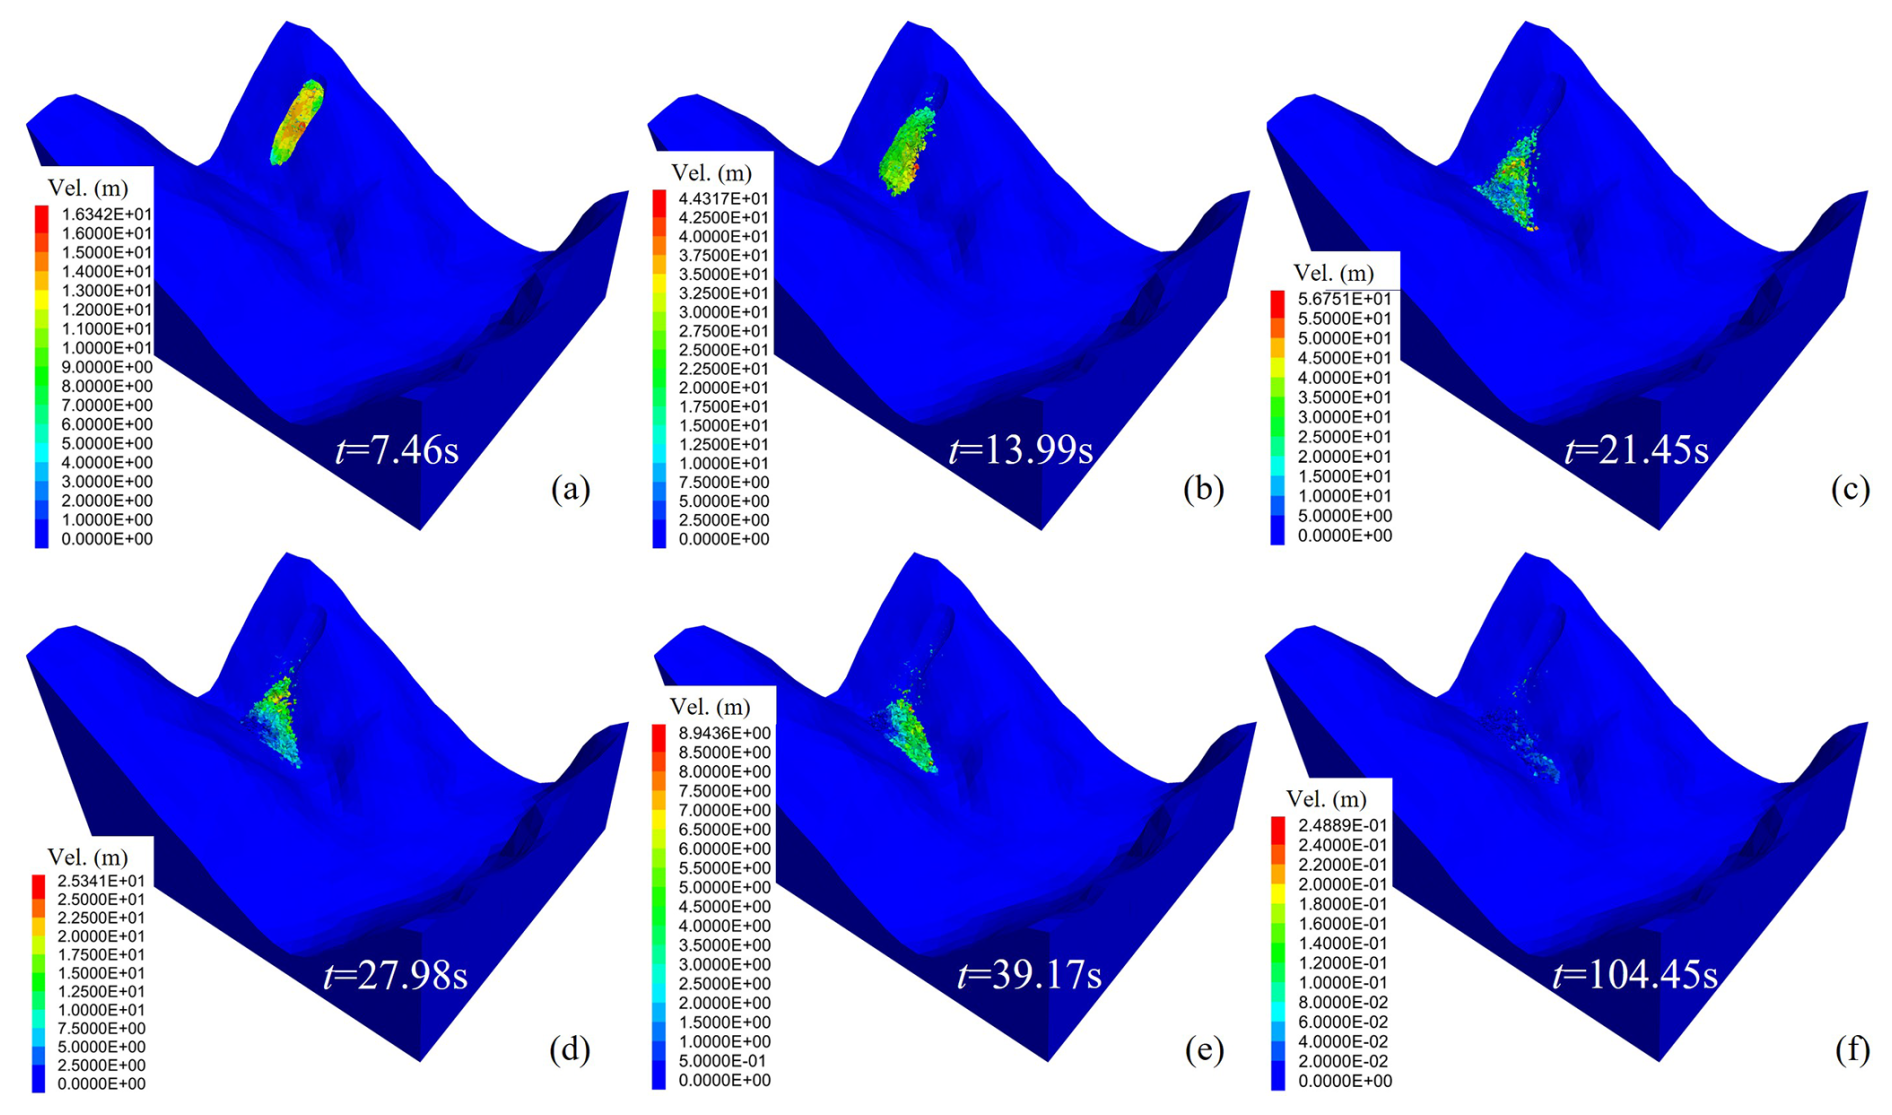
Figure 9The velocity figures of YXP rockslide when the time reached 7.46 s (a), 13.99 s (b), 21.45 s (c), 27.98 s (d), 39.17 s (e), 104.45 s (f).
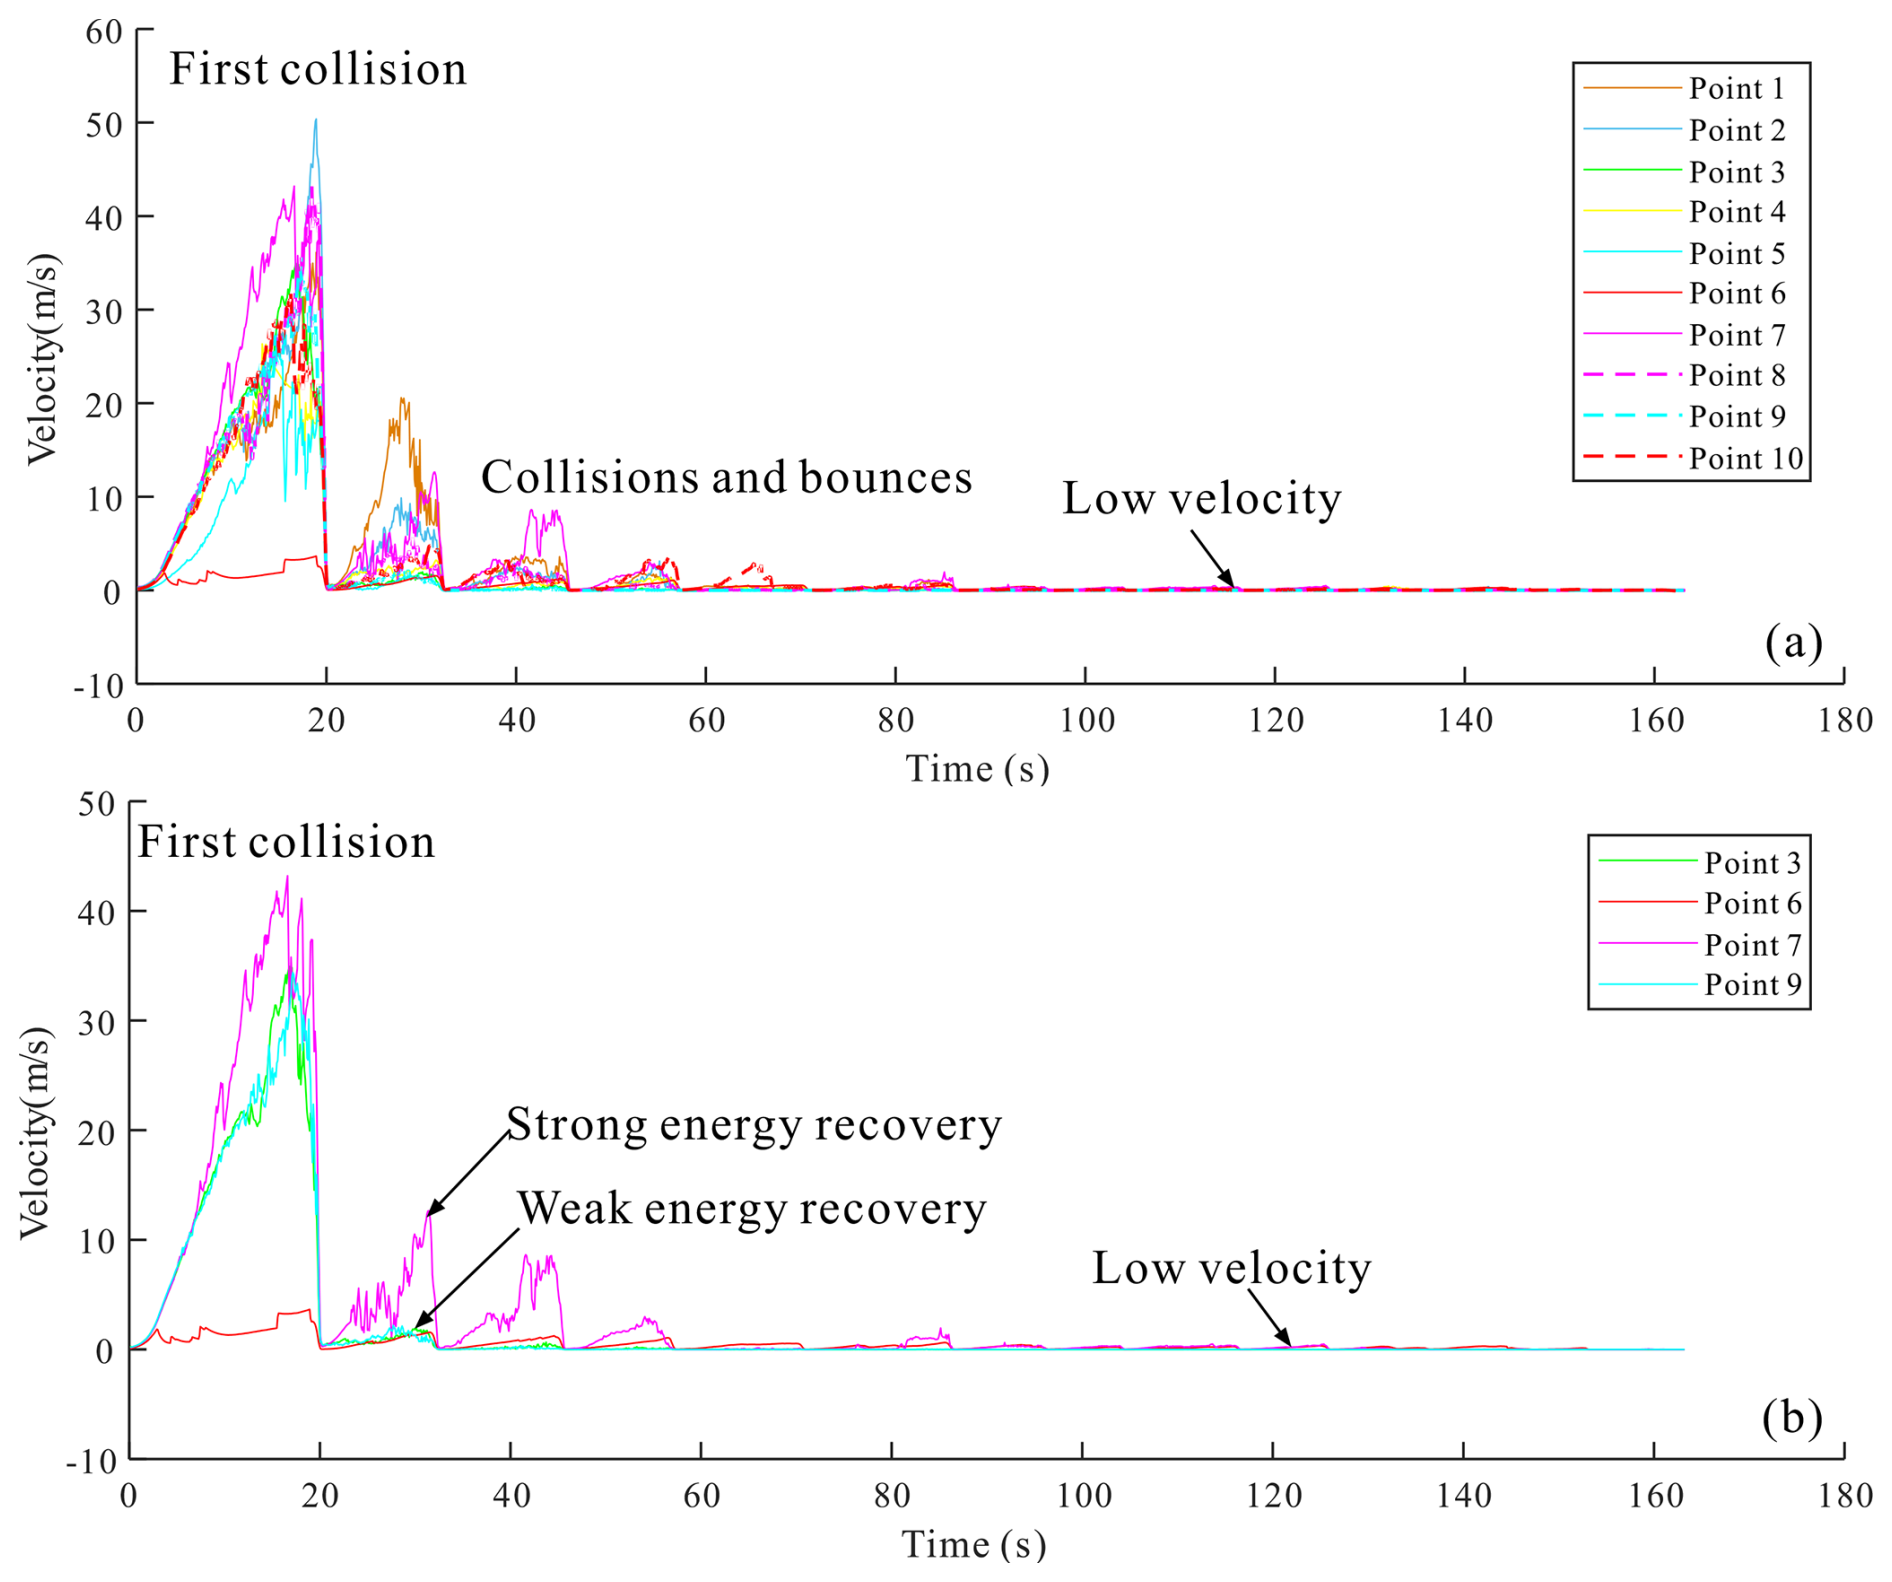
The monitoring results of profile showed that the maximum velocity of the monitoring points located in the middle and rear edge of the landslide was higher (such as point 3, 8 and 9), reaching 50.25 m s−1, and the initiation time of these blocks was also earlier (Fig. 10a). However, it should be noted that although the maximum velocity of monitoring points 1 and 2 was small, their velocity recovery ability after collision was strong. The reason was that it was located on the surface of the rear edge of the sliding mass and kept above of the deposit during the movement, so its recovery ability was less limited. The monitoring results of section show that the kinetic energy loss of the blocks in the middle sliding mass was large after the collision because they arrived at the slope bottom and accumulate earlier (such as monitoring points 3 and 9) (Fig. 10b). The energy recovery of the left and right blocks was faster after the collision (monitoring points 6 and 7), the reason might be that the blocks on both sides arrived at the foot of the slope later and accumulated in the upper layer of the deposit. Therefore, the maximum velocity of the blocks initiated earlier was higher, while the velocity recovery ability of the blocks arriving at the foot of the slope earlier was weak due to the influence of the overburden (Fig. 10b). The kinetic energy recovery of the blocks in rear edge was stronger because it stopped and accumulated on the surface of the deposit.
In this section, we discussed the effect of the internal fraction angle and the distribute density of rock fractures on the kinetic characteristics of rockslide. In DEM numerical simulations, many parameters may have varying degrees of impact on the simulation results, but these factors could be divided into controlling factors and general factors. Through literature research and preliminary simulation experiments (Havaej et al., 2016; Wu et al., 2018; Fan et al., 2019b), we believe that for rockslides with developed fractures, the controlling factors are the parameters related to the fracture surface, among which the inner friction angle of the fracture surface and the density of fracture are particularly important. Therefore, choosing these two factors for comparative analysis, further research is needed on other factors in the future. Besides, the discussion on the use of blocking dams for debris flow is based on the fact that conventional blocking measures are difficult to control such high-position rockslide disasters. Therefore, protection was chosen at the end of the movement path and compared with the actual situation.
5.1 Effect of internal fraction angle of fractures
The kinetic energy loss of sliding mass is mainly affected by the collision and friction, so it is necessary to analyze the sensitivity of internal friction angle of fractures to simulation results (Lin et al., 2022). Keeping other conditions unchanged, we set the internal friction angle to 8, 12, and 16°, respectively, and monitored the velocity of point 9. Figure 11 exhibits the simulation results with different internal friction angles. The movement time of sliding mass increased with the increase of fractures internal friction angle, which were 58.64, 75.42, and 104.75 s, respectively. As the increase of the internal friction angle, the depositional area also increased. When φ = 8°, the maximum movement distance of the sliding mass reached about 753 m due to the low internal friction angle and low slope of the depositional area (Fig. 11a and d), reaching the residential area at the outlet of the YXP gully. Under rainfall conditions, due to the water-convergence effect, these loose solid materials will be transformed into debris flows, causing devastating damage to the villages. When φ = 16°, the velocity of blocks at the front edge of the deposit decelerate to zero (Fig. 11f), and only a small number of blocks at the rear edge continued to move towards the deposit (Fig. 11c and f). When φ = 12°, the simulation results were consistent with the actual situation. the front blocks still had a velocity of less than 0.25 m s−1 at 104.45 s (Fig. 11b and e).
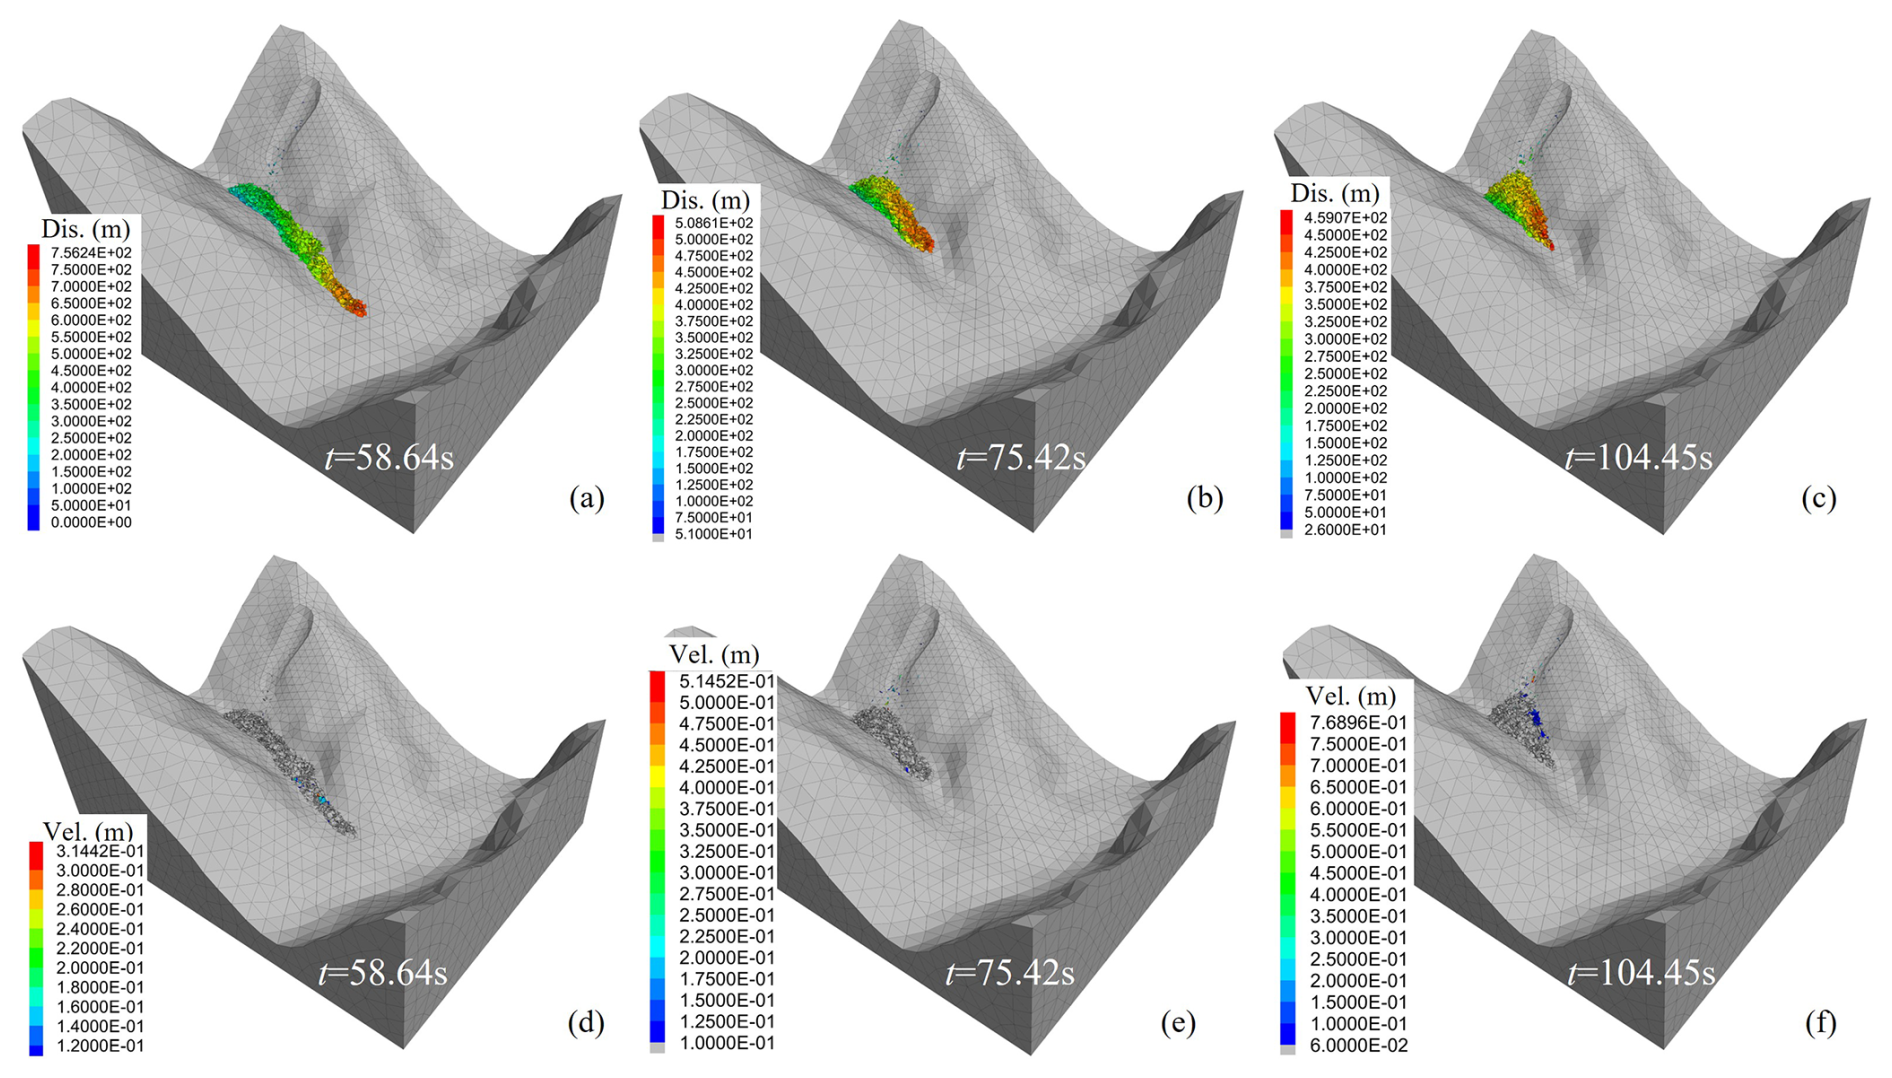
Figure 11The displacement and velocity of YXP rockslide with the internal friction angle of fractures of 8° (a, d), 12° (b, e) and 16° (c, f).
The monitoring results of blocks in middle sliding mass show that the maximum velocity increased with the decrease of internal friction angle, the bigger is, and it moves to the foot of the slope earlier. The maximum velocities of monitoring point 9 were 58.74, 42.35, and 33.46 m s−1, respectively under different internal friction angles. In addition, when the angle is 8°, the velocity recovery degree of the monitored block is the largest after the first collision. Then the rock mass continues to slide along the gully until it finally stops (Fig. 12). In the other two conditions, the energy of the monitored block is almost lost after the first collision, and only in condition 2, the block still has a weak velocity. In the other two cases, the energy recovery of the monitored block is weak after the first collision.
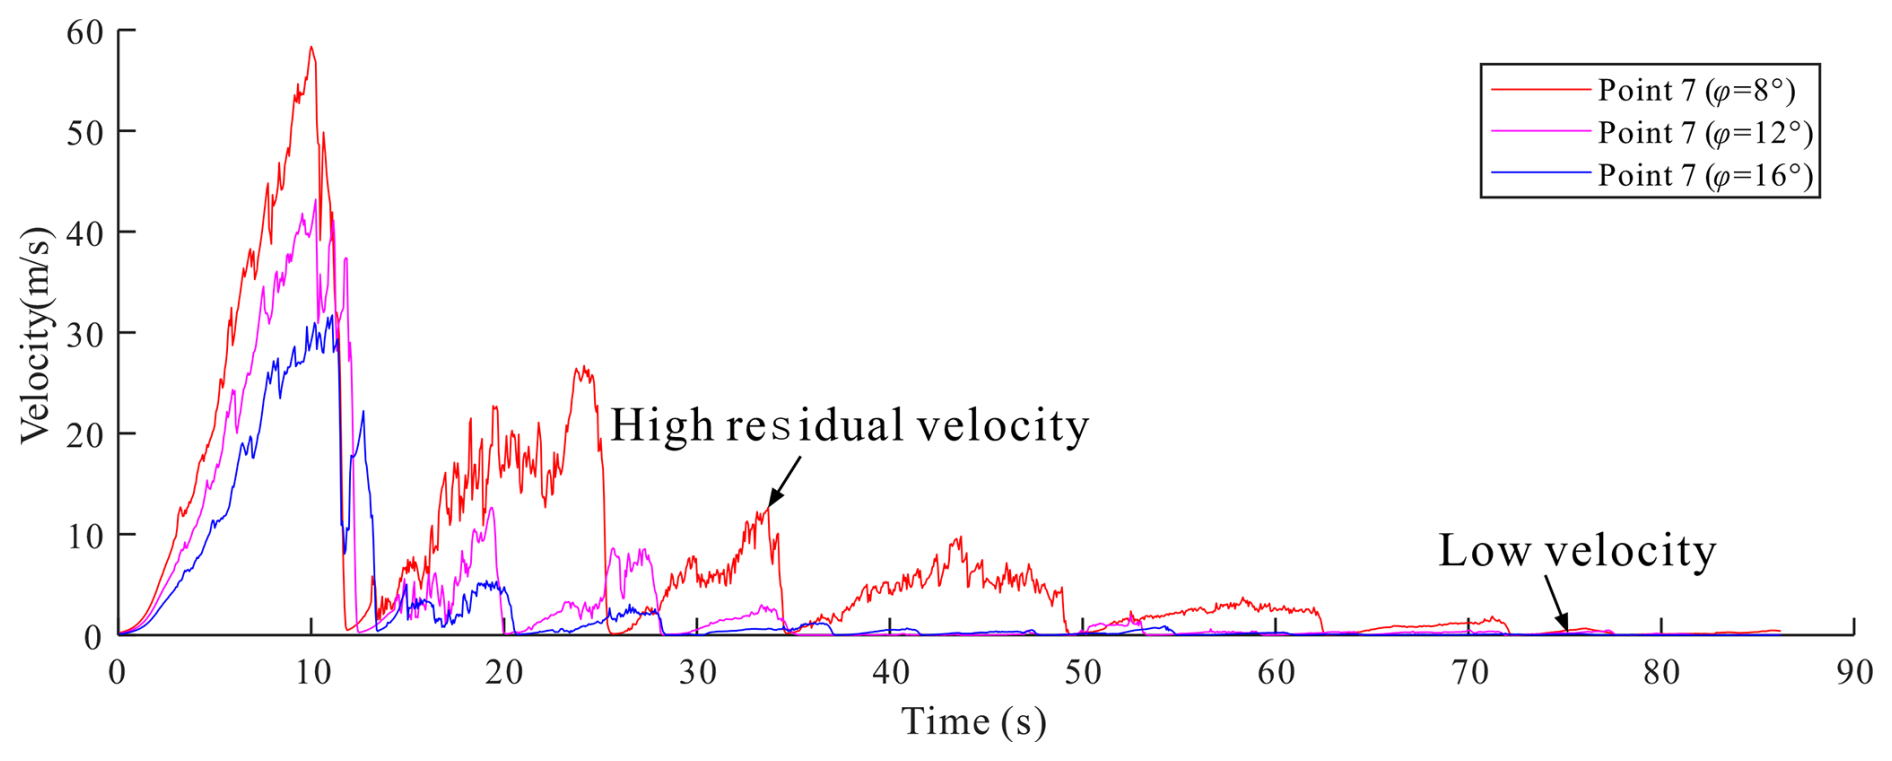
Figure 12The velocity monitoring results of point 9 under different internal fraction angle of fractures.
5.2 Effect of fracture density
Fractures control the structure of rock mass, and the fractures density controls the size of rock cut by fractures. Physical experiments showed that different block sizes may have effects on the movement process and accumulation range of blocks (Lin et al., 2022; Lei and Loew, 2021). In order to study this effect, we set up four groups of fractures densities, which were , , and 1 times of the original fracture density. For these models, the friction angle was set to 12°. The simulation results are shown in Fig. 13. The larger the fracture density was, the more compact the deposit was, which was determined by the size of the blocks. With the increase of fractures density, the size of rock blocks decreased significantly. Due to the mutual restriction between large blocks, the movement time of the model with smaller fracture density was longer, and the duration was 158.26, 141.17, 125.33 and 104.45 s, respectively (Fig. 13a–d). According to the previous analysis, when the fracture density was the original value, the rock blocks would still move downward along the gully with a slope of 14° (Fig. 9f). When the fractures density was , and of the original value, the deposit could stop in place, which showed that the size of the rock block of the deposit can affect the stability of the deposit, and the larger the rock block, the more stable the deposit. Therefore, the larger the fracture density, the faster the rock mass movement after failure. At the same time, the stability of the deposits is worse, which is easily taken by the debris flow.
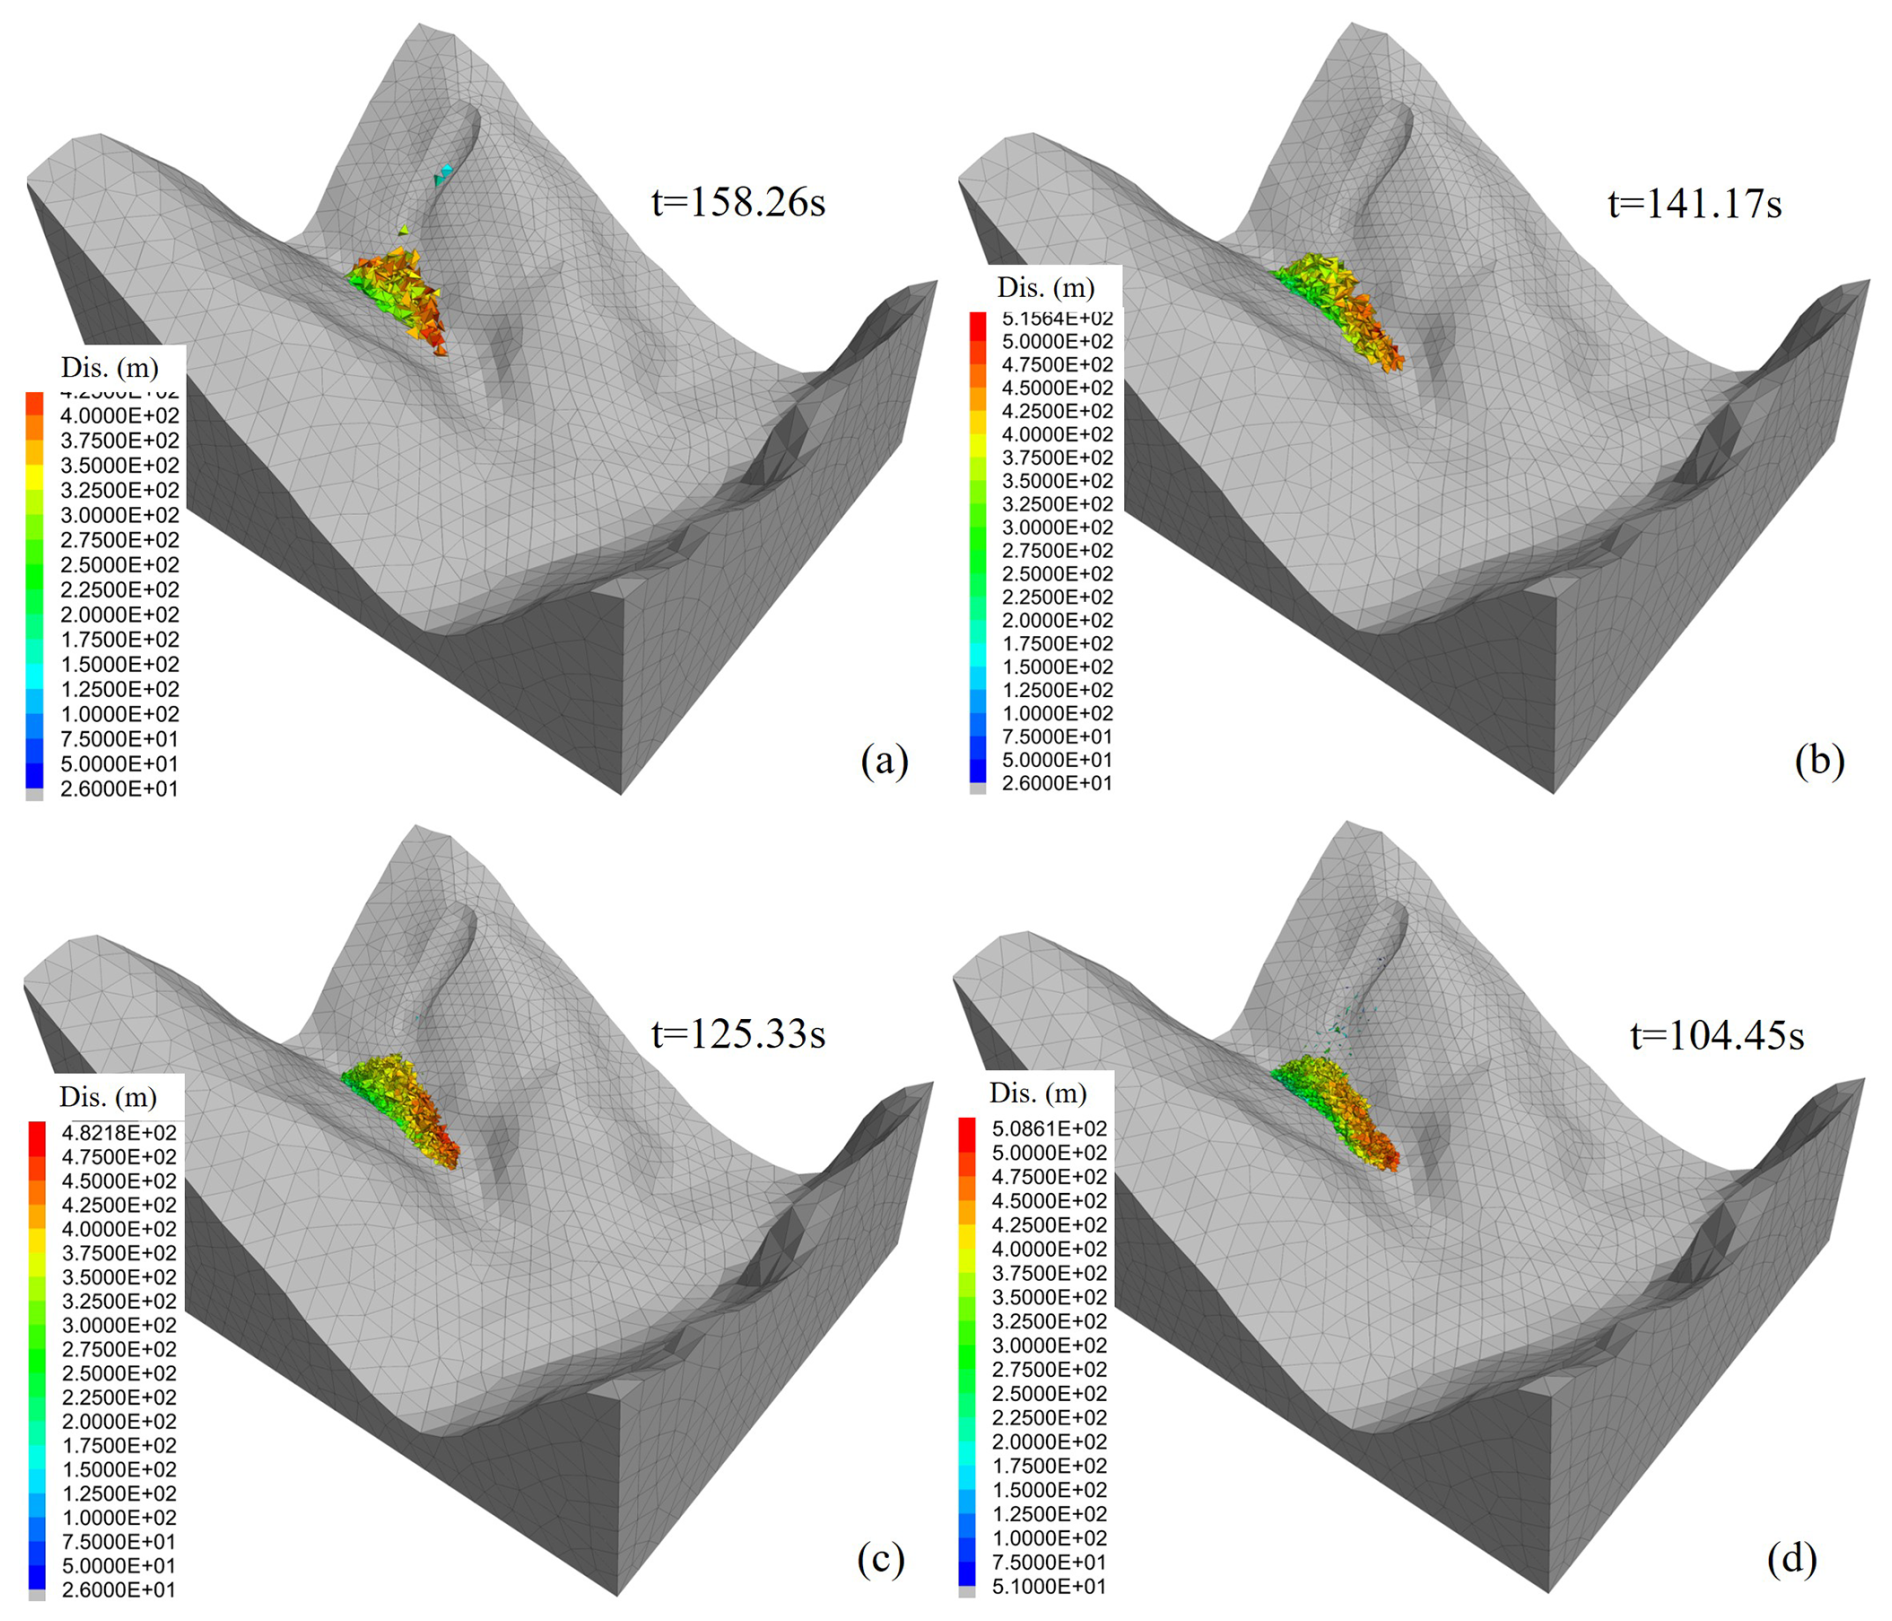
Figure 13The displacement and accumulation of YXP rockslide with fracture density of (a), (b), (c) and 1 (d) times of the original value.
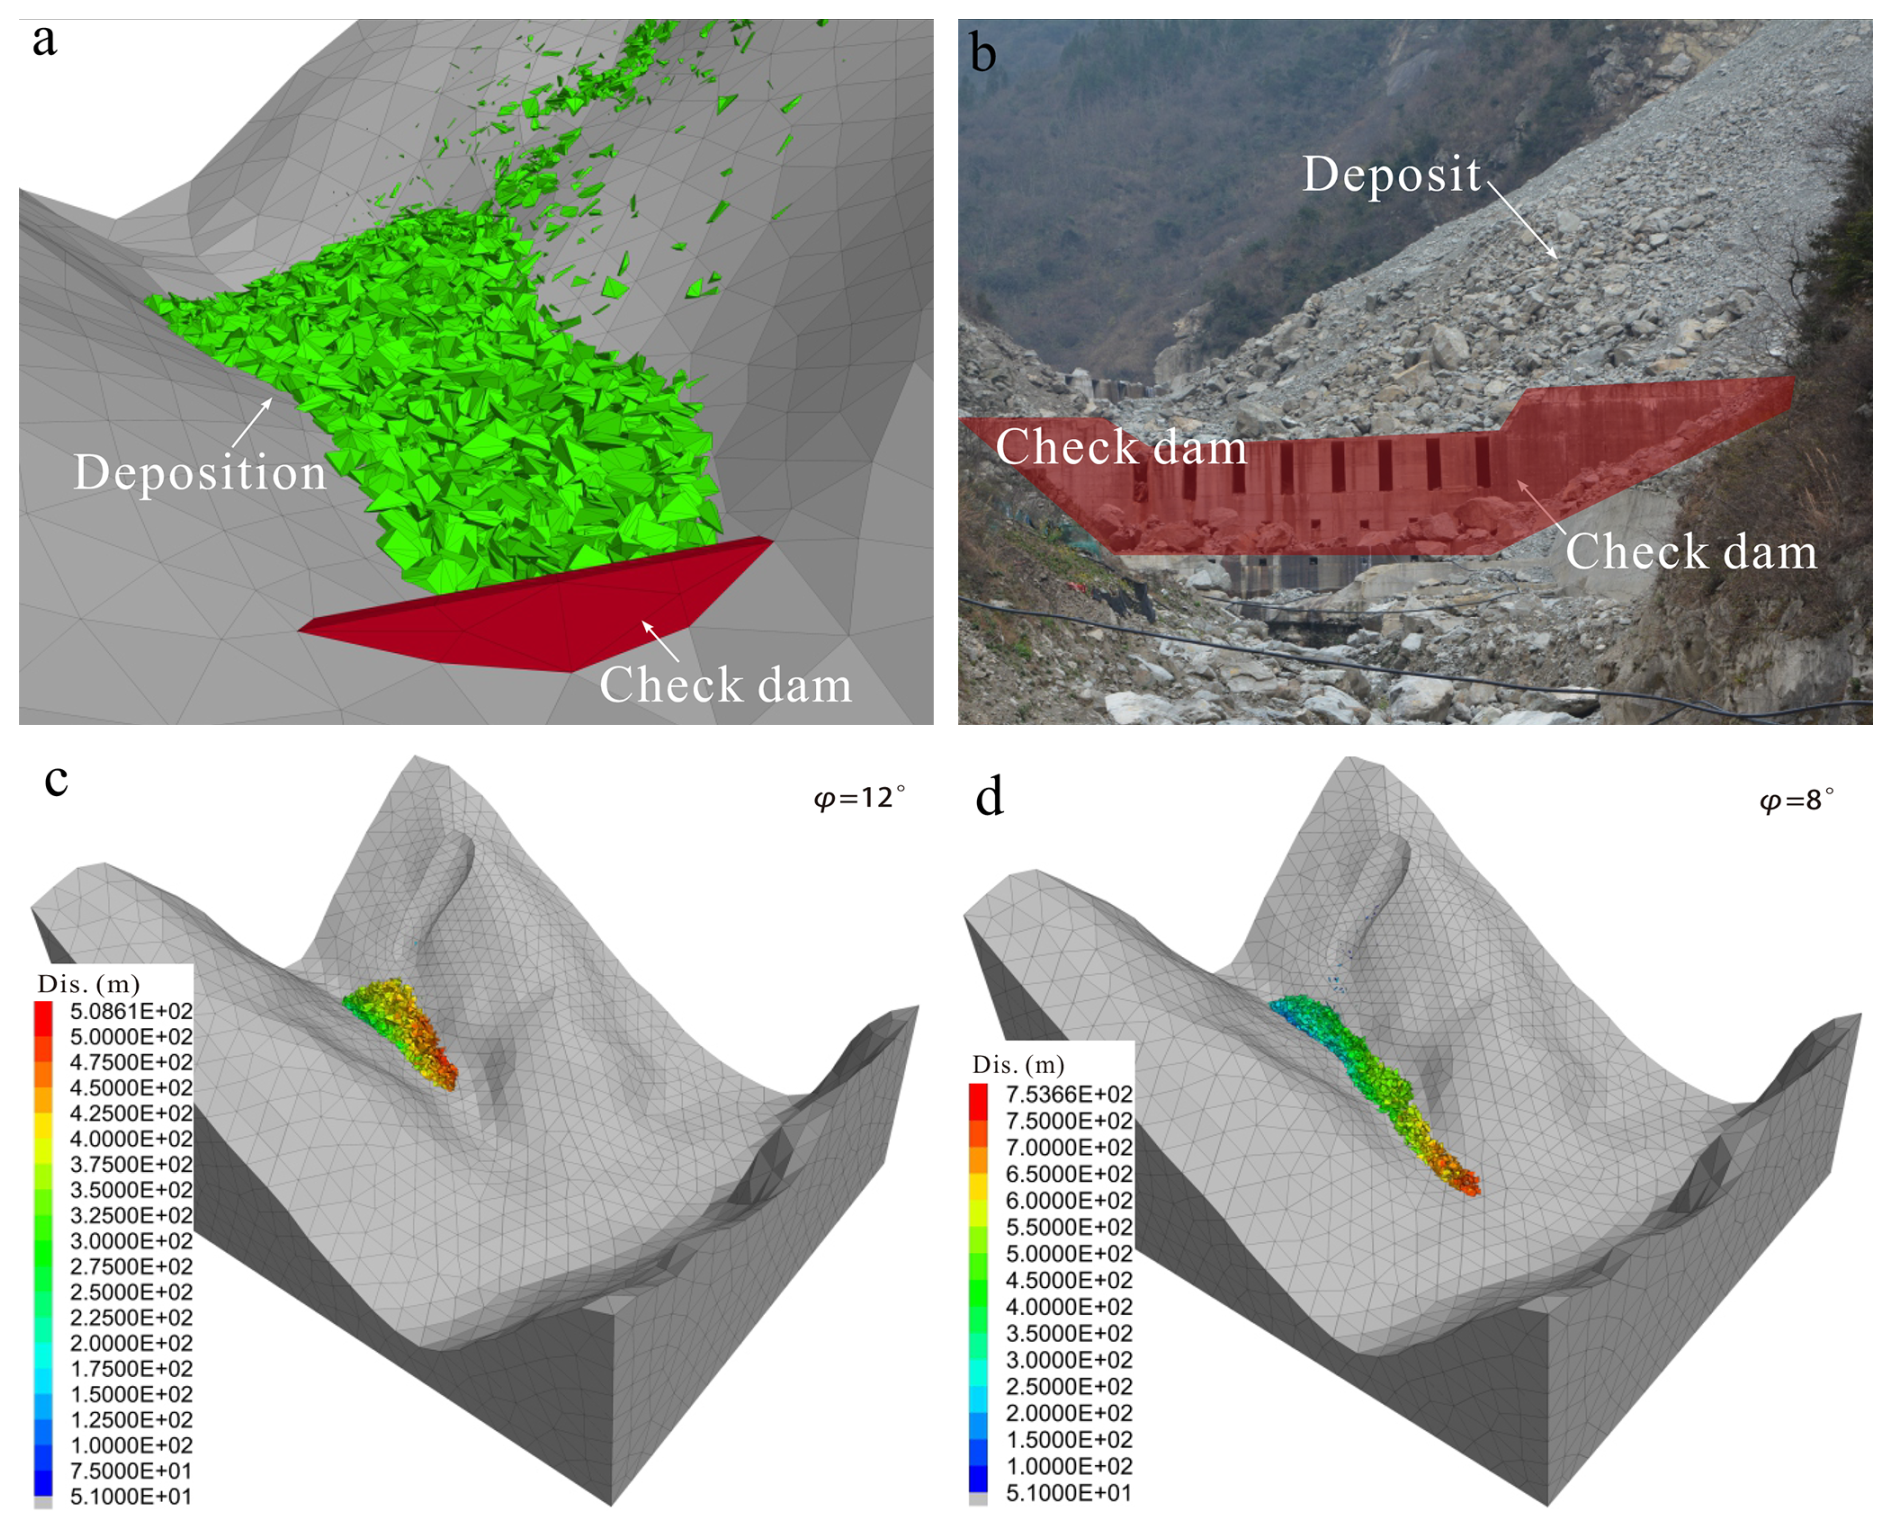
Figure 14(a) The deposition characteristic of XYP rockslide simulation result at 104.45 s with setting check dam; (b) The check dam prevented the rockslide deposition materials; (c, d) are the deposition characteristics of YXP rockslide under the condition that the friction angle of the fracture is 12 and 8° respectively.
5.3 The prevention work of check dam
The source area of post-earthquake rockslide is mostly located at the ridge of mountain. Therefore, the traditional prevention works such as setting lattice structure and bolt are not only expensive but also difficult to conduct. When the landslide materials reach the bottom of the gully, the kinetic energy is obviously lost and easier to prevent these materials. Based on the numerical simulation, we can determine the deployment location of the prevention and control project. Secondly, the simulation results of the velocity of rockfall impact can provide a basis for the energy level of the prevention and control project, and the depositional range can provide a basis for the interception height of the prevention and control project. Based on this guiding ideology, we set up a check dam at the downstream of the landslide deposit to prevent the further downward movement of the material. It can be seen from Fig. 14a that after setting the check dam, the landslide materials were obviously prevented in the gully. The field investigation also showed that check dam had good feasibility (Fig. 14b). If there is no this dam, the accumulation will continue to move down the debris flow gully for a long distance and accumulate in the gully, and its movement distance becomes farther as the internal friction angle of the crack decreases (Fig. 14c and d). Due to its location within the debris flow gully, its shear strength and stability may rapidly decrease under heavy rainfall conditions and flow into downstream villages along with the debris flow. Therefore, it should be noted that if the inner side of check dam is full of rocks, the timely clean is essential. Otherwise, the whole gully will be blocked. The check dam proposed provided a novel perspective for prevention works of landslide on both sides of similar gully in meizoseismal area.
This paper presents a comprehensive study of the failure mechanism and dynamic characteristics of the YXP rockslide. A field investigation and three-dimensional DEM were employed to analyse the effects of internal friction angle and fractures density on the simulation results. The main findings are summarized below.
-
The YXP rockslide failed and initiated due to the decrease of rock strength under heavy rainfall. The maximum velocity of the local block was 56.75 m s−1, and the maximum displacement was and 508.61 m due to the steep terrain. Thus, the YXP rockslide can be classified as a high-speed short-distance landslide.
-
By combining the discrete element method with discrete fracture networks, it is possible to accurately simulate and back-analyze the instability and movement processes of fractured rock landslides. In DEM simulation, the internal friction angle of fractures and fracture density significantly influence the movement velocity and deposit extent of rock landslides. A higher fracture density leads to faster instability of rock blocks, but it has no pronounced effect on travel distance.
-
The check dam is proposed as an appropriate prevention measure for the rockslide developed in debris flow gully. By setting the check dam at the downstream of the deposit, the rock materials will be prevented from moving along the debris flow gully under the gravity.
The computer code that supports the findings of this study is not publicly available due to it being built upon a proprietary framework from commercial software, and public distribution would violate the licensing agreement. But it is available from the corresponding author on reasonable request.
The data generated during this study are available from the corresponding author upon reasonable request.
Conceptualization, KH, BL; methodology, JL; software, KY; validation, KH, JC; formal analysis, YZ; investigation, BL, JL, ZY; resources, XH; data curation, JC, BL; writing – original draft preparation, BL, KH; writing – review and editing, BL, JC; visualization, KH; supervision, XH; project administration, BL, XH; funding acquisition, BL, YZ. All authors have read and agreed to the published version of the manuscript.
The contact author has declared that none of the authors has any competing interests.
Publisher's note: Copernicus Publications remains neutral with regard to jurisdictional claims made in the text, published maps, institutional affiliations, or any other geographical representation in this paper. While Copernicus Publications makes every effort to include appropriate place names, the final responsibility lies with the authors. Views expressed in the text are those of the authors and do not necessarily reflect the views of the publisher.
This article is part of the special issue “Methodological innovations for the analysis and management of compound risk and multi-risk, including climate-related and geophysical hazards (NHESS/ESD/ESSD/GC/HESS inter-journal SI)”. It is not associated with a conference.
The authors would like to acknowledge the National Natural Science Foundation of China (42507203), the China Postdoctoral Science Foundation (2024M753629), and the Fund Project of the China Academy of Railway Sciences Group Corporation Limited (2024YJ246).
This research has been supported by the National Natural Science Foundation of China (grant no. 42507203), the China Postdoctoral Science Foundation (grant no. 2024M753629), and the Fund Project of the China Academy of Railway Sciences Group Corporation Limited (grant no. 2024YJ246).
This paper was edited by Marleen de Ruiter and reviewed by three anonymous referees.
Corkum, A. G. and Martin, C. D.: Analysis of a rock slide stabilized with a toe-berm: a case study in British Columbia, Canada [J], Int. J. Rock Mech. Min., 41, 1109–1121, https://doi.org/10.1016/j.ijrmms.2004.04.008, 2004.
Delaney, K. B. and Evans, S. G.: The 2000 Yigong landslide (Tibetan Plateau), rockslide-dammed lake and outburst flood: Review, remote sensing analysis, and process modelling, Geomorphology, 246, 377–393, https://doi.org/10.1016/j.geomorph.2015.06.020, 2015.
Einstein, H. H. and Baecher, G. B.: Probabilistic and statistical methods in engineering geology: Specific methods and examples part I: Exploration, Rock Mechanics and Rock Engineering, 16, 39–72, https://doi.org/10.1007/BF01030217, 1983.
Espada, M., Muralha, J., Lemos, J. V., Jiang, Q., Feng, X. T., Fan, Q., and Fan, Y.: Safety analysis of the left bank excavation slopes of Baihetan arch dam foundation using a discrete element model, Rock Mechanics and Rock Engineering, 51, 2597–2615, https://doi.org/10.1007/s00603-018-1416-2, 2018.
Evans, S. G., Hungr, O., and Clague, J. J.: Dynamics of the 1984 rock avalanche and associated distal debris flow on Mount Cayley, British Columbia, Canada; implications for landslide hazard assessment on dissected volcanoes, Eng. Geol., 61, 29–51, https://doi.org/10.1016/S0013-7952(00)00118-6, 2001.
Fan, X., Xu, Q., Scaringi, G., Dai, L., Li, W., Dong, X., Zhu, X., Pei, X., Dai, K., and Havenith, H. B.: Failure mechanism and kinematics of the deadly 24 June 2017 Xinmo landslide, Maoxian, Sichuan, China, Landslides, 14, 2129–2146, https://doi.org/10.1007/s10346-017-0907-7, 2017.
Fan, X., Scaringi, G., Korup, O., West, A. J., van Westen, C. J., Tanyas, H., Hovius, N., Hales, T. C., Jibson, R. W., Allstadt, K. E., Zhang, L., Evans, S. G., Xu, C., Li, Gen., Pei, X., Xu, Q., and Huang, R.: Earthquake-induced chains of geologic hazards: Patterns, mechanisms, and impacts, Rev. Geophys., 57, 421–503, https://doi.org/10.1029/2018RG000626, 2019a.
Fan, W., Lv, J., Cao, Y., Shen, M., Deng, L., and Wei, Y.: Characteristics and block kinematics of a fault-related landslide in the Qinba Mountains, western China, Eng. Geol., 249, 162–171, https://doi.org/10.1016/j.enggeo.2018.12.019, 2019b.
Havaej, M., Coggan, J., Stead, D., and Elmo, D.: A combined remote sensing – numerical modelling approach to the stability analysis of Delabole Slate Quarry, Cornwall, UK, Rock Mechanics and Rock Engineering, 49, 1227–1245, https://doi.org/10.1007/s00603-015-0805-z, 2016.
He, K., Li, Y., Ma, G., Hu, X., Liu, B., Ma, Z., and Xu, Z. (2021). Failure mode analysis of post-seismic rockfall in shattered mountains exemplified by detailed investigation and numerical modelling, Landslides, 18, 425–446, https://doi.org/10.1007/s10346-020-01532-1, 2021.
Hu, T. and Huang, R. Q.: A catastrophic debris flow in the Wenchuan Earthquake area, July 2013: characteristics, formation, and risk reduction, Journal of Mountain Science, 14, 15–30, https://doi.org/10.1007/s11629-016-3965-8, 2017.
Huang, D., Li, Y. Q., Song, Y. X., Xu, Q., and Pei, X. J.: Insights into the catastrophic Xinmo rock avalanche in Maoxian county, China: combined effects of historical earthquakes and landslide amplification, Eng. Geol., 258, 105158, https://doi.org/10.1016/j.enggeo.2019.105158, 2019.
Huang, R., Pei, X., Fan, X., Zhang, W., Li, S., and Li, B.: The characteristics and failure mechanism of the largest landslide triggered by the Wenchuan earthquake, 12 May 2008, China, Landslides, 9, 131–142, https://doi.org/10.1007/s10346-011-0276-6, 2012.
Itasca Consulting Group, Inc.: 3DEC 5.2 Command Reference, Minneapolis, Minnesota, USA, 2016.
Kim, B. H., Cai, M., Kaiser, P. K., and Yang, H. S.: Estimation of block sizes for rock masses with non-persistent joints, Rock Mechanics and Rock Engineering, 40, 169–192, https://doi.org/10.1007/s00603-006-0093-8, 2007.
Kolapo, P., Ogunsola, N. O., Munemo, P., Alewi, D., Komolafe, K., and Giwa-Bioku, A.: DFN: an emerging tool for stochastic modelling and geomechanical design, Eng, 4, 174–205, https://doi.org/10.3390/eng4010011, 2023.
Lei, Q. and Loew, S.: Modelling coseismic displacements of fracture systems in crystalline rock during large earthquakes: Implications for the safety of nuclear waste repositories, Int. J. Rock Mech. Min., 138, 104590, https://doi.org/10.1016/j.ijrmms.2020.104590, 2021.
Lemos, J. V., Oliveira, C. S., and Navarro, M.: 3-D nonlinear behavior of an obelisk subjected to the Lorca 11 May 2011 strong motion record, Engineering Failure Analysis, 58, 212–228, https://doi.org/10.1016/j.engfailanal.2015.09.001, 2015.
Lin, Q., Wang, Y., Xie, Y., Cheng, Q., and Deng, K.: Multiscale effects caused by the fracturing and fragmentation of rock blocks during rock mass movement: implications for rock avalanche propagation, Nat. Hazards Earth Syst. Sci., 22, 639–657, https://doi.org/10.5194/nhess-22-639-2022, 2022.
Liu, B., Hu, X. W., He, K., He, S. H., Shi, H. B., and Liu, D. Y.: The starting mechanism and movement process of the coseismic rockslide: A case study of the Laoyingyan rockslide induced by the “5.12” Wenchuan earthquake, Journal of Mountain Science, 17, 1188–1205, https://doi.org/10.1007/s11629-019-5775-2, 2020.
Liu, B., He, K., Han, M., Hu, X., Wu, T., Wu, M., and Ma, G.: Dynamic process simulation of the Xiaogangjian rockslide occurred in shattered mountain based on 3DEC and DFN, Comput. Geotech., 134, 104122, https://doi.org/10.1016/j.compgeo.2021.104122, 2021a.
Liu, J., Jiao, L., Yang, H., You, Y., and Zhang, W.: Numerical simulation for viscous debris flows passing through dams – a case study of the Wenchuan Yinxingping gully, Landslides, 18, 3255–3267, https://doi.org/10.1007/s10346-021-01708-3, 2021b.
Longoni, L., Papini, M., Arosio, D., Zanzi, L., and Brambilla, D.: A new geological model for Spriana landslide, Bulletin of Engineering Geology and the Environment, 73, 959–970, https://doi.org/10.1007/s10064-014-0610-z, 2014.
Ma, K., Liu, G., Xu, N., Zhang, Z., and Feng, B.: Motion characteristics of rockfall by combining field experiments and 3D discontinuous deformation analysis, Int. J. Rock Mech. Min., 138, 104591, https://doi.org/10.1016/j.ijrmms.2020.104591, 2021.
Mangeney, A., Roche, O., Hungr, O., Mangold, N., Faccanoni, G., and Lucas, A.: Erosion and mobility in granular collapse over sloping beds, J. Geophys. Res.: Earth Surface, 115, https://doi.org/10.1029/2009JF001462, 2010.
Medici, G., Ling, F., and Shang, J.: Review of discrete fracture network characterization for geothermal energy extraction, Frontiers in Earth Science 11, 1328397, https://doi.org/10.3389/feart.2023.1328397, 2023.
Muaka, J. M., Duma, S., Mushangwe, P., Gardner, L., Chindedza, T., Walls, J., and Joughin, W. C.: Modelling hard rock jointed pillars using a distinct element and discrete fracture network approach considering the effect of a clay-filled shear structure, in Deep Mining 2017: Proceedings of the Eighth International Conference on Deep and High Stress Mining, Australian Centre for Geomechanics, edited by: Wesseloo, J., Perth, 311–328, https://doi.org/10.36487/ACG_rep/1704_22_Muaka, 2017.
Okura, Y., Kitahara, H., Sammori, T., and Kawanami, A.: The effects of rockfall volume on runout distance, Eng. Geol., 58, 109–124, https://doi.org/10.1016/S0013-7952(00)00049-1, 2000.
Pei, X., Cui, S., Zhu, L., Wang, H., Luo, L., and Zhang, X.: Sanxicun landslide: an investigation of progressive failure of a gentle bedding slope, Nat. Hazards 111, 51–78, https://doi.org/10.1007/s11069-021-05044-6, 2022.
Salvini, R., Vanneschi, C., and Riccucci, S.: The use of remote sensing for discontinuity mapping and analysis in a large marble quarry, Carrara, Italy[C], DFNE 2014, the 1st International Conference on Discrete Fracture Network Engineering, https://hdl.handle.net/11365/960664 (last access: 28 October 2025), 2014.
Verma, A. K., Sardana, S., Sharma, P., Dinpuia, L., and Singh, T. N.: Investigation of rockfall-prone road cut slope near Lengpui Airport, Mizoram, India, Journal of Rock Mechanics and Geotechnical Engineering, 11, 146–158, https://doi.org/10.1016/j.jrmge.2018.07.007, 2019.
Wang, H., Liu, S., Xu, W., Yan, L., Qu, X., and Xie, W. C.: Numerical investigation on the sliding process and deposit feature of an earthquake-induced landslide: a case study, Landslides, 17, 2671–2682, https://doi.org/10.1007/s10346-020-01446-y, 2020a.
Wang, W., Yin, Y., Yang, L., Zhang, N., and Wei, Y.: Investigation and dynamic analysis of the catastrophic rockslide avalanche at Xinmo, Maoxian, after the Wenchuan Ms 8.0 earthquake, Bulletin of Engineering Geology and the Environment, 79, 495–512, https://doi.org/10.1007/s10064-019-01557-4, 2020b.
Wang, W. H., Li, X. B., Zuo, Y. J., Zhou, Z. L., and Zhang, Y. P.: 3DEC modeling on effect of joints and interlayer on wave propagation, Transactions of Nonferrous Metals Society of China, 16, 728–734, https://doi.org/10.1016/S1003-6326(06)60129-5, 2006.
Wei, J., Zhao, Z., Xu, C., and Wen, Q.: Numerical investigation of landslide kinetics for the recent Mabian landslide (Sichuan, China), Landslides, 16, 2287–2298, https://doi.org/10.1007/s10346-019-01237-0, 2019.
Wu, J. H., Lin, W. K., and Hu, H. T.: Post-failure simulations of a large slope failure using 3DEC: the Hsien-du-shan slope, Eng. Geol., 242, 92–107, https://doi.org/10.1016/j.enggeo.2018.05.018, 2018.
Wu, Z., Barosh, P. J., Zhang, Z., and Liao, H.: Effects from the Wenchuan Earthquake and seismic hazard in the Longmenshan Mountains at the eastern margin of the Tibetan Plateau, Eng. Geol., 143, 28–36, https://doi.org/10.1016/j.enggeo.2012.06.006, 2012.
Yan, Y., Cui, Y., Guo, J., Hu, S., Wang, Z., and Yin, S.: Landslide reconstruction using seismic signal characteristics and numerical simulations: Case study of the 2017 “6.24” Xinmo landslide, Eng. Geol., 270, 105582, https://doi.org/10.1016/j.enggeo.2020.105582, 2020.
Yin, Y., Li, B., and Wang, W.: Dynamic analysis of the stabilized Wangjiayan landslide in the Wenchuan Ms 8.0 earthquake and aftershocks, Landslides, 12, 537–547, https://doi.org/10.1007/s10346-014-0497-6, 2015.
Zhang, Y., Chen, G., Zheng, L., Li, Y., and Wu, J.: Effects of near-fault seismic loadings on run-out of large-scale landslide: a case study, Eng. Geol., 166, 216–236, https://doi.org/10.1016/j.enggeo.2013.08.002, 2013.
Zhou, W., Tang, C., Van Asch, T. W., and Zhou, C.: Rainfall-triggering response patterns of post-seismic debris flows in the Wenchuan earthquake area, Nat. Hazards, 70, 1417–1435, https://doi.org/10.1007/s11069-013-0883-8, 2014.