the Creative Commons Attribution 4.0 License.
the Creative Commons Attribution 4.0 License.
 | 23 Sep 2025
The Parraguirre ice–rock avalanche 1987, semi-arid Andes, Chile – a holistic revision
David Farías-Barahona
Thomas Bruckner
Lucia Scaff
Martin Mergili
Santiago Montserrat
Humberto Peña
Chile is particularly exposed to mountain hazards along the Andean Cordillera. The impact and frequency of devastating debris flows are expected to increase in the future under climatic warming and urban expansion. To inform monitoring, mitigation and adaptation measures, it is crucial to understand the characteristics of past events in this region. The Parraguirre rock avalanche of 29 November 1987 is a prominent example as it developed into a devastating debris flow, reaching 50 km downvalley and causing severe damage and loss of human lives. Its destructive power is related to the large water volume involved. The origin of this water is largely unknown – so is the initial trigger volume and the total mass transfer downvalley. We therefore retrace the past event using data and techniques that are now at hand. These include historic topographic maps, aerial imagery, meteorological and hydrological records, and multi-phase mass-flow modelling. We find a trigger volume of m3 and a total fluid flood volume of 16.0×10⁶ m3 – both significantly larger than previous estimates. Moreover, a first estimate of the solid mass transfer exported from the Parraguirre catchment of m3 is presented. The high water content cannot be explained by entrainment of soil water and snow cover alone but requires a substantial contribution from glacier ice. Furthermore, our simulations corroborate the damming hypothesis of Río Colorado and, thereby, reconcile the observed wave pulses, arrival times and run-out distance. Apart from the geo-tectonic preconditioning, we define the Parraguirre rock avalanche as a meteorological compound event. The reason for this is that the spring of 1987 was outstanding in terms of the snowpack height, which preconditioned high snowmelt rates during particularly anomalous warm days at the end of November. Such preconditioning can be readily accounted for in monitoring and early warning procedures for mountain hazards.
- Article
(17056 KB) - Full-text XML
-
Supplement
(23945 KB) - BibTeX
- EndNote


Intensified warming, precipitation extremes, permafrost loss and glacier retreat increase the risk of natural hazards in high-mountain regions (e.g. Gruber and Haeberli, 2007; Biskaborn et al., 2019; Moreiras et al., 2021; Thackeray et al., 2022; Rounce et al., 2023). Steep slopes and high-relief topography make mountain regions prone to massive and destructive mass movements (Huggel et al., 2012; Kargel et al., 2016). Climatic changes exacerbate these hazards (Gariano and Guzzetti, 2016; Stoffel et al., 2024). Hazards comprise direct events, such as slope instabilities and landslides, as well as secondary events, such as catastrophic lake outburst floods (e.g. Iribarren Anacona et al., 2018; Mergili et al., 2020). Landslides are one of the most common natural hazards in the world and have severe impacts on many components of the high-mountain environment. Run-out distances become particularly large when large amounts of water are involved. In this regard, debris flows are a particular destructive type of landslide, as they consist of water-saturated, unsorted, non-cohesive material (Hungr et al., 2001; Hungr, 2005).
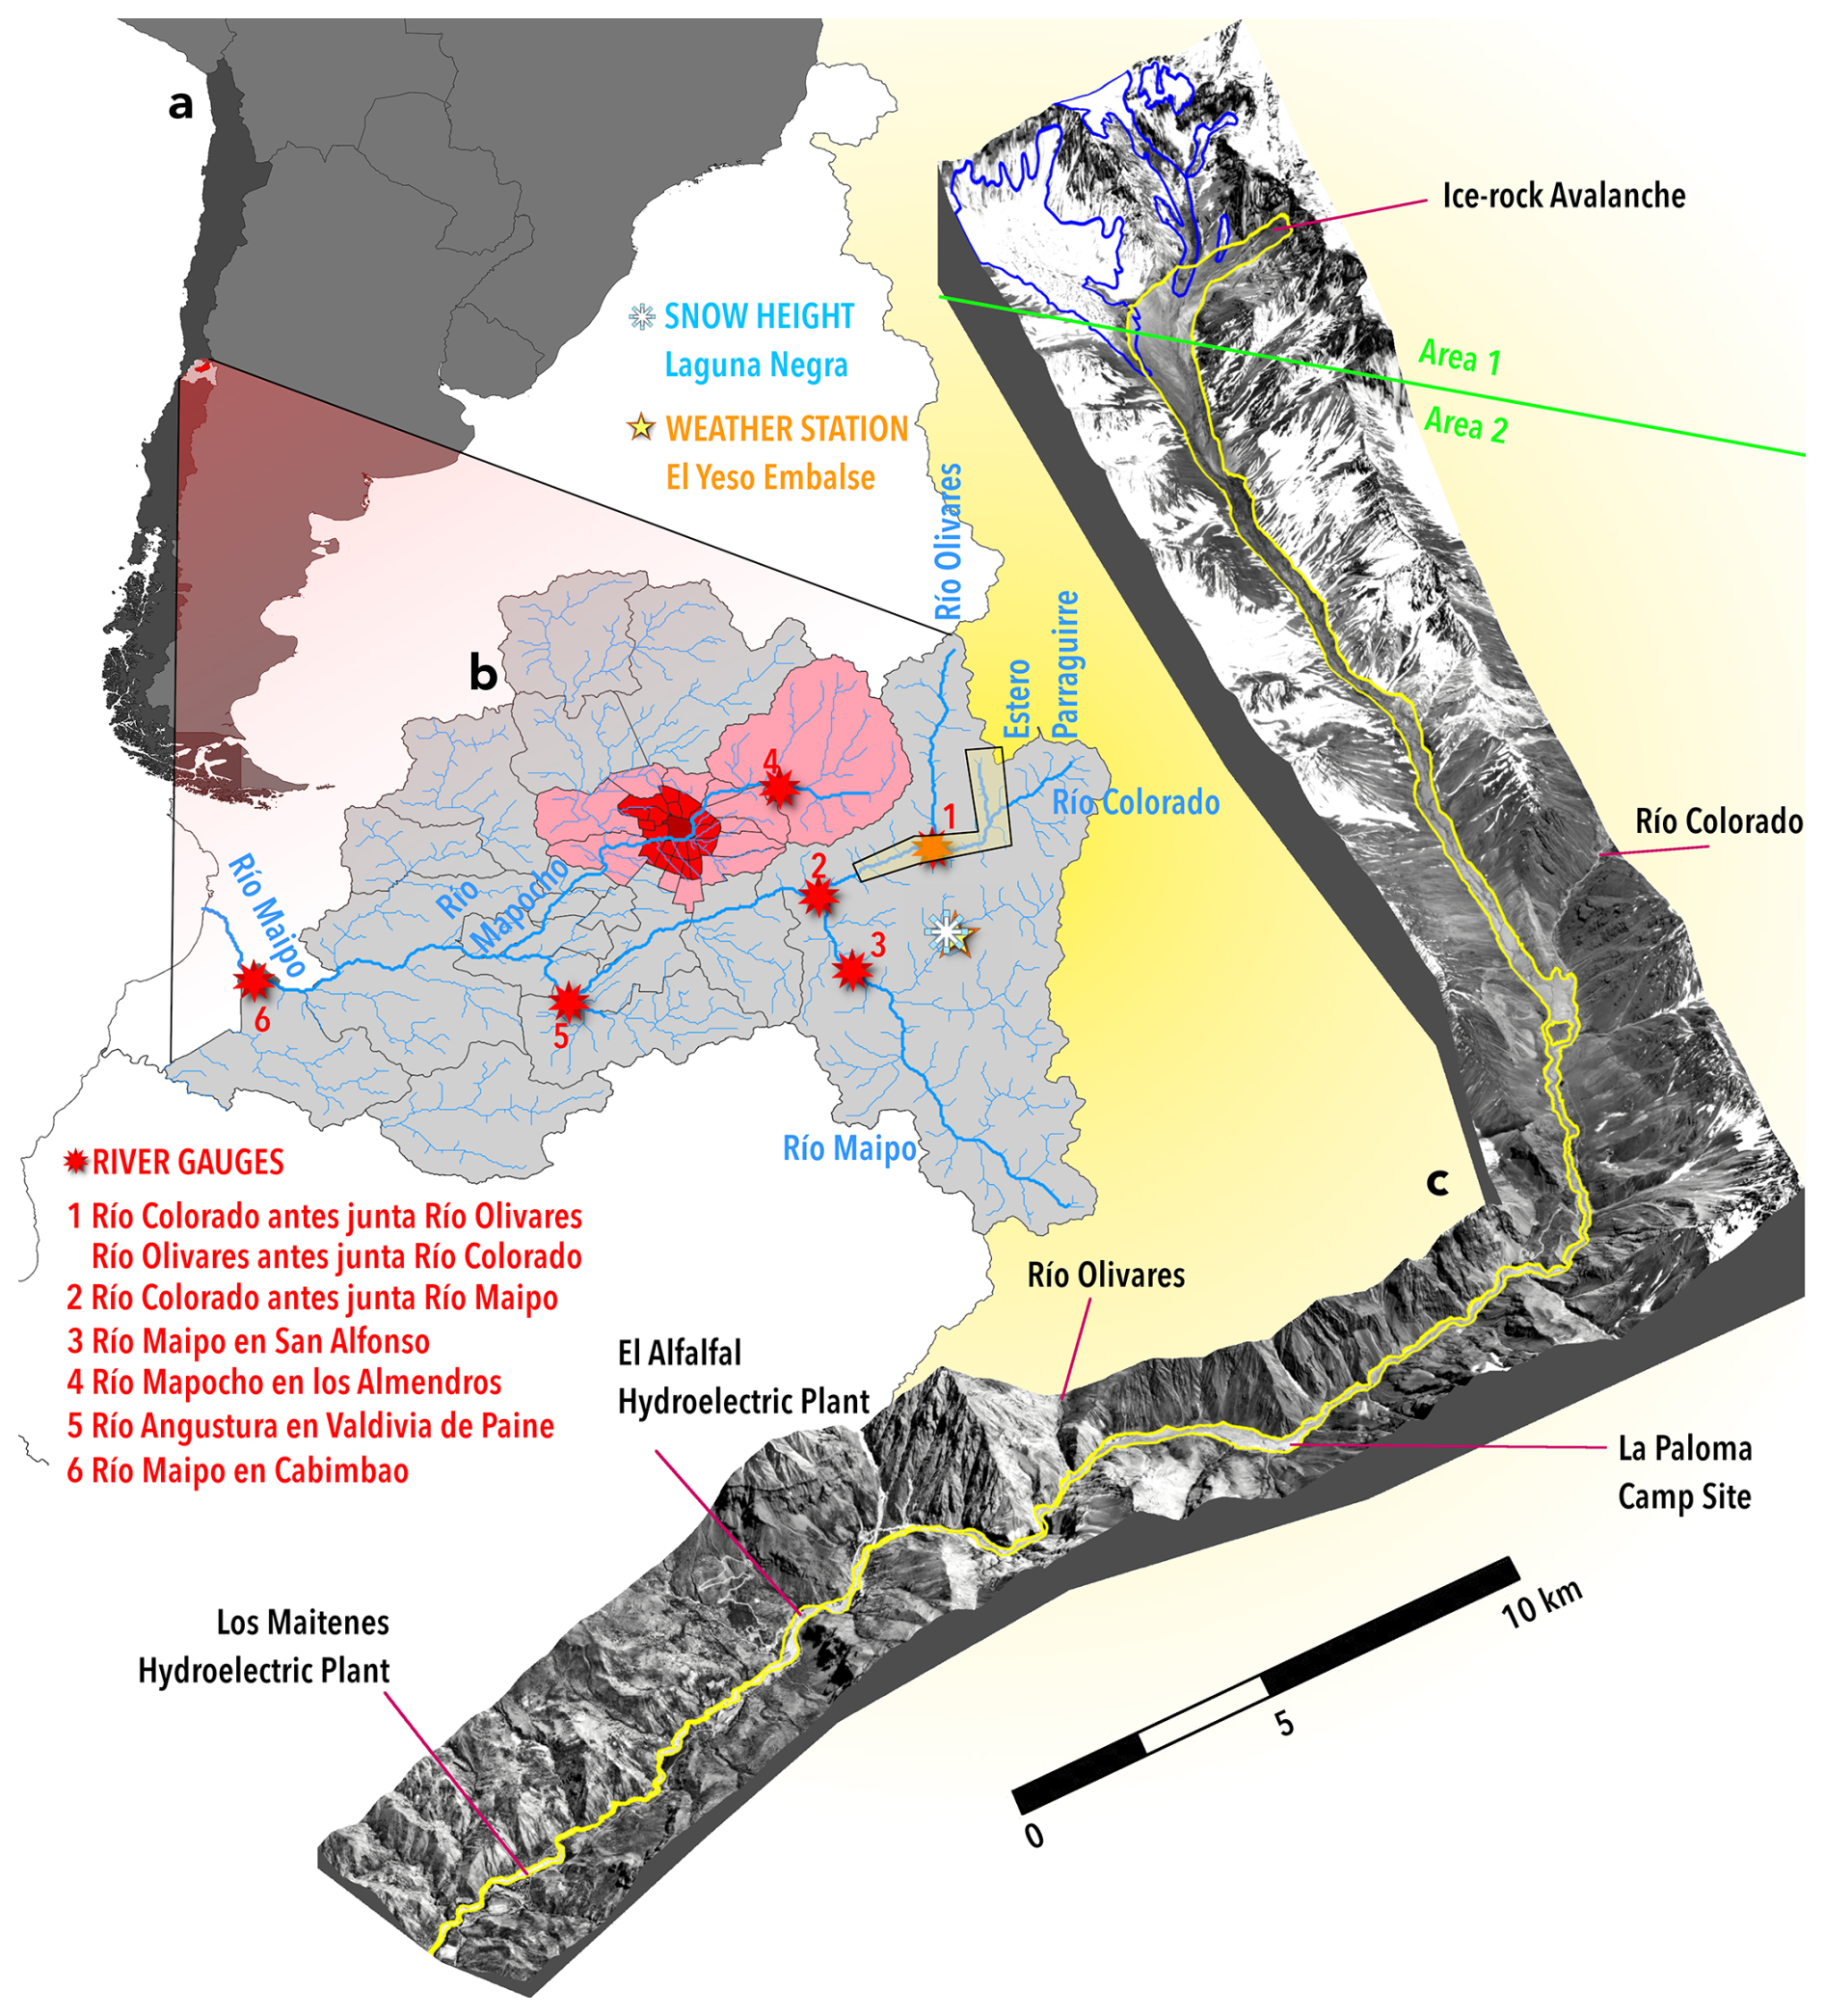
Figure 1Overview of the Estero Parraguirre and Río Colorado catchments. (a) Southern South America and (b) inset of the Metropolitan Region of Santiago de Chile. Different red shading indicates the commune area of Santiago. The main rivers in the Maipo catchment (blue) are highlighted. Also shown are river gauges (red stars), a weather station (yellow star) and snow measurements (snowflake symbol). All had coverage in 1987. The yellow-shaded polygon indicates the extent of the Parraguirre debris-flow event. (c) The 3D representation is produced from 1987 aerial images. The yellow outline indicates the observed impact area. Blue outlines represent glacierised areas. For the r.avaflow simulations, friction coefficients are calibrated in two distinct areas (divided by green line, Area 1 and Area 2 in green font). Aerial photos (c) credit to and courtesy of SAF, Chilean Air Force, 1987.
The high-relief topography of the Andean Cordillera makes Chile especially prone to debris flows – occurring in all of its climatic zones (Sepúlveda et al., 2006a; Bronfman et al., 2021; Moreiras et al., 2021). Near the capital, a very common trigger is heavy or persistent rainfall (Sepúlveda et al., 2006b). In 1987, the Parraguirre rock avalanche detached from Cerro Rabicano and developed into a destructive debris flow with a run-out distance of about 50 km (Fig. 1). On its way, more than 29 fatalities were reported and the total damage was estimated to exceed USD 40 million (Casassa and Marangunic, 1993; Hauser, 2002). A detailed description of the debris-flow propagation is presented in Sect. 2. Here, we want to briefly sketch speculations on the main mechanism triggering the initial rock-slab failure. Hypotheses range from geological, via volcano-seismic and meteorological, to hydrological factors. The geological setting near Cerro Rabicano is characterised by sedimentary rocks from the Cretaceous consisting of limestone with intercalations of gypsum and andesite, which are prone to chemical and mechanical disintegration (Hauser, 2002). Disintegration is promoted by almost vertical rock tilt dipping 70–80° to the west (Casassa and Marangunic, 1993) and periglacial environment processes at these altitudes. The poor mechanical properties of the rocks were undoubtedly a key factor in the initial failure. Volcano-seismic factors have been excluded as an explanation because no important seismic activity was reported in the days preceding the Parraguirre rock avalanche (Eisenberg and Pardo, 1988). In terms of meteorology, 1987 was the fifth rainiest year of a 138-year record, with 712.2 mm in Santiago as compared to the long-term average of 352.7 mm (Casassa and Marangunic, 1993). The same is seen for snowfall in the Andes west of Santiago, with 1473 mm water equivalent (w.e.) in 1987 above the long-term values of 566 mm (Hauser, 2002). It is further known that the days preceding the rock avalanche were particularly warm, causing significant snowmelt. In terms of the hydrological effect, surface waters must have quickly been incorporated into rocks through cracks and stratification planes of the limestone sequence. Persistent loss of shear strength of the rock subsurface was a consequence, and the resultant gradual weakening is considered another key factor in the debris-flow initiation (Hauser, 2002). We abide by the fact that it is virtually impossible to attribute a certain landslide to a “single definite cause” (Varnes, 1978).
The Parraguirre rock avalanche has received abundant attention in the scientific community (e.g. Eisenberg and Pardo, 1988; Peña and Klohn, 1988; Ugarte, 1988; Valenzuela and Varela, 1991; Casassa and Marangunic, 1993; Naranjo et al., 2001; Hauser, 2002; Sepúlveda et al., 2023). These studies are based on field visits, aerial imagery, and historical photographs as well as meteorological and hydrological observations. Yet several questions remain unanswered to this day:
-
Gauge stations report an important flood volume, for which the source remains largely unexplained (Casassa and Marangunic, 1993).
-
Existing estimates of the initial rock-slab volume show large discrepancies (Naranjo et al., 2001; Hauser, 2002).
-
No estimate of the total debris-flow volume was reported – let alone its partitioning into fluid and solid portions.
-
The multiple waves that were observed nourished the hypothesis that the debris flow did temporarily stop and was re-activated after a dam breach of Río Colorado.
Here, we pursue a first attempt to answer the above four questions associated with the 1987 Parraguirre debris flow. We combine existing records with hydro-meteorological data (stations and reanalysis data), remote-sensing observations and multi-phase mass-flow modelling. Previous efforts only relied on individual records from river gauges or weather stations. In the following, we first re-draw the event history by compiling the available information (Sect. 2). Thereafter, we present the utilised data sources from remote sensing as well as from atmospheric and hydrological monitoring (Sect. 3). Subsequently, the applied analysis methods and model experiments are specified (Sect. 4). Dedicated sections then present our results (Sect. 5), which are carefully put into perspective (Sect. 6).
2.1 Initial rockfall and ice–rock avalanche
On 29 November 1987, a massive ice–rock avalanche occurred in the Central Andes of Chile (Fig. 1, Table 1). The avalanche originated from the northwestern slopes of Cerro Rabicano (33.3236° S, 70.0027° E; Piderit, 1940; Ambrus, 1967) at an altitude between 4000 and 4500 m above sea level (m a.s.l.) (Fig. 2c). The avalanche descended westwards and hit the valley bottom (3500 m a.s.l.) at 10:33 LT (all times are given in local time throughout; Casassa and Marangunic, 1993; Hauser, 2002). The timing is well known as the impact was recorded by several seismographs in the Maipo River catchment (Eisenberg and Pardo, 1988). At about the same time, a dust cloud was visible to the southeast from Farellones – at a distance of 25 km (Casassa and Marangunic, 1993). Estimates of the initial volume of this rock avalanche range from 5×10⁶ to 6×10⁶ m3 (Valenzuela and Varela, 1991; Casassa and Marangunic, 1993; Hauser, 2002). Previous studies have speculated that the average thickness of the initial slab of rock that detached was between 20 and 40 m. Also, the release area was discussed and found to be controversial. Casassa and Marangunic (1993) proposed 0.1 km2, whereas Hauser (2002) suggested 0.5 km2. The impact area was located in the headwaters of Estero Parraguirre at the valley head. From there, the landslide first overran a glacier tongue (Glacier No. 24) and then climbed a 50 m ridge before it followed a sharp 90° turn south into Estero Parraguirre. To overcome this ridge, minimum speeds of 31 m s−1 were necessary (Hauser, 2002). Observed mudline marks on both valley sides of the 90° turn suggest similar speeds of 24 m s−1 (Casassa and Marangunic, 1993). It is further assumed that, at the time of failure, snowmelt and ice melt were elevated, resulting in saturation of the deposits that formed the valley fill (Hauser, 2002). As a consequence, the initial rockfall was quickly transformed into a powerful debris flow, likely within the first 5 km of its source.
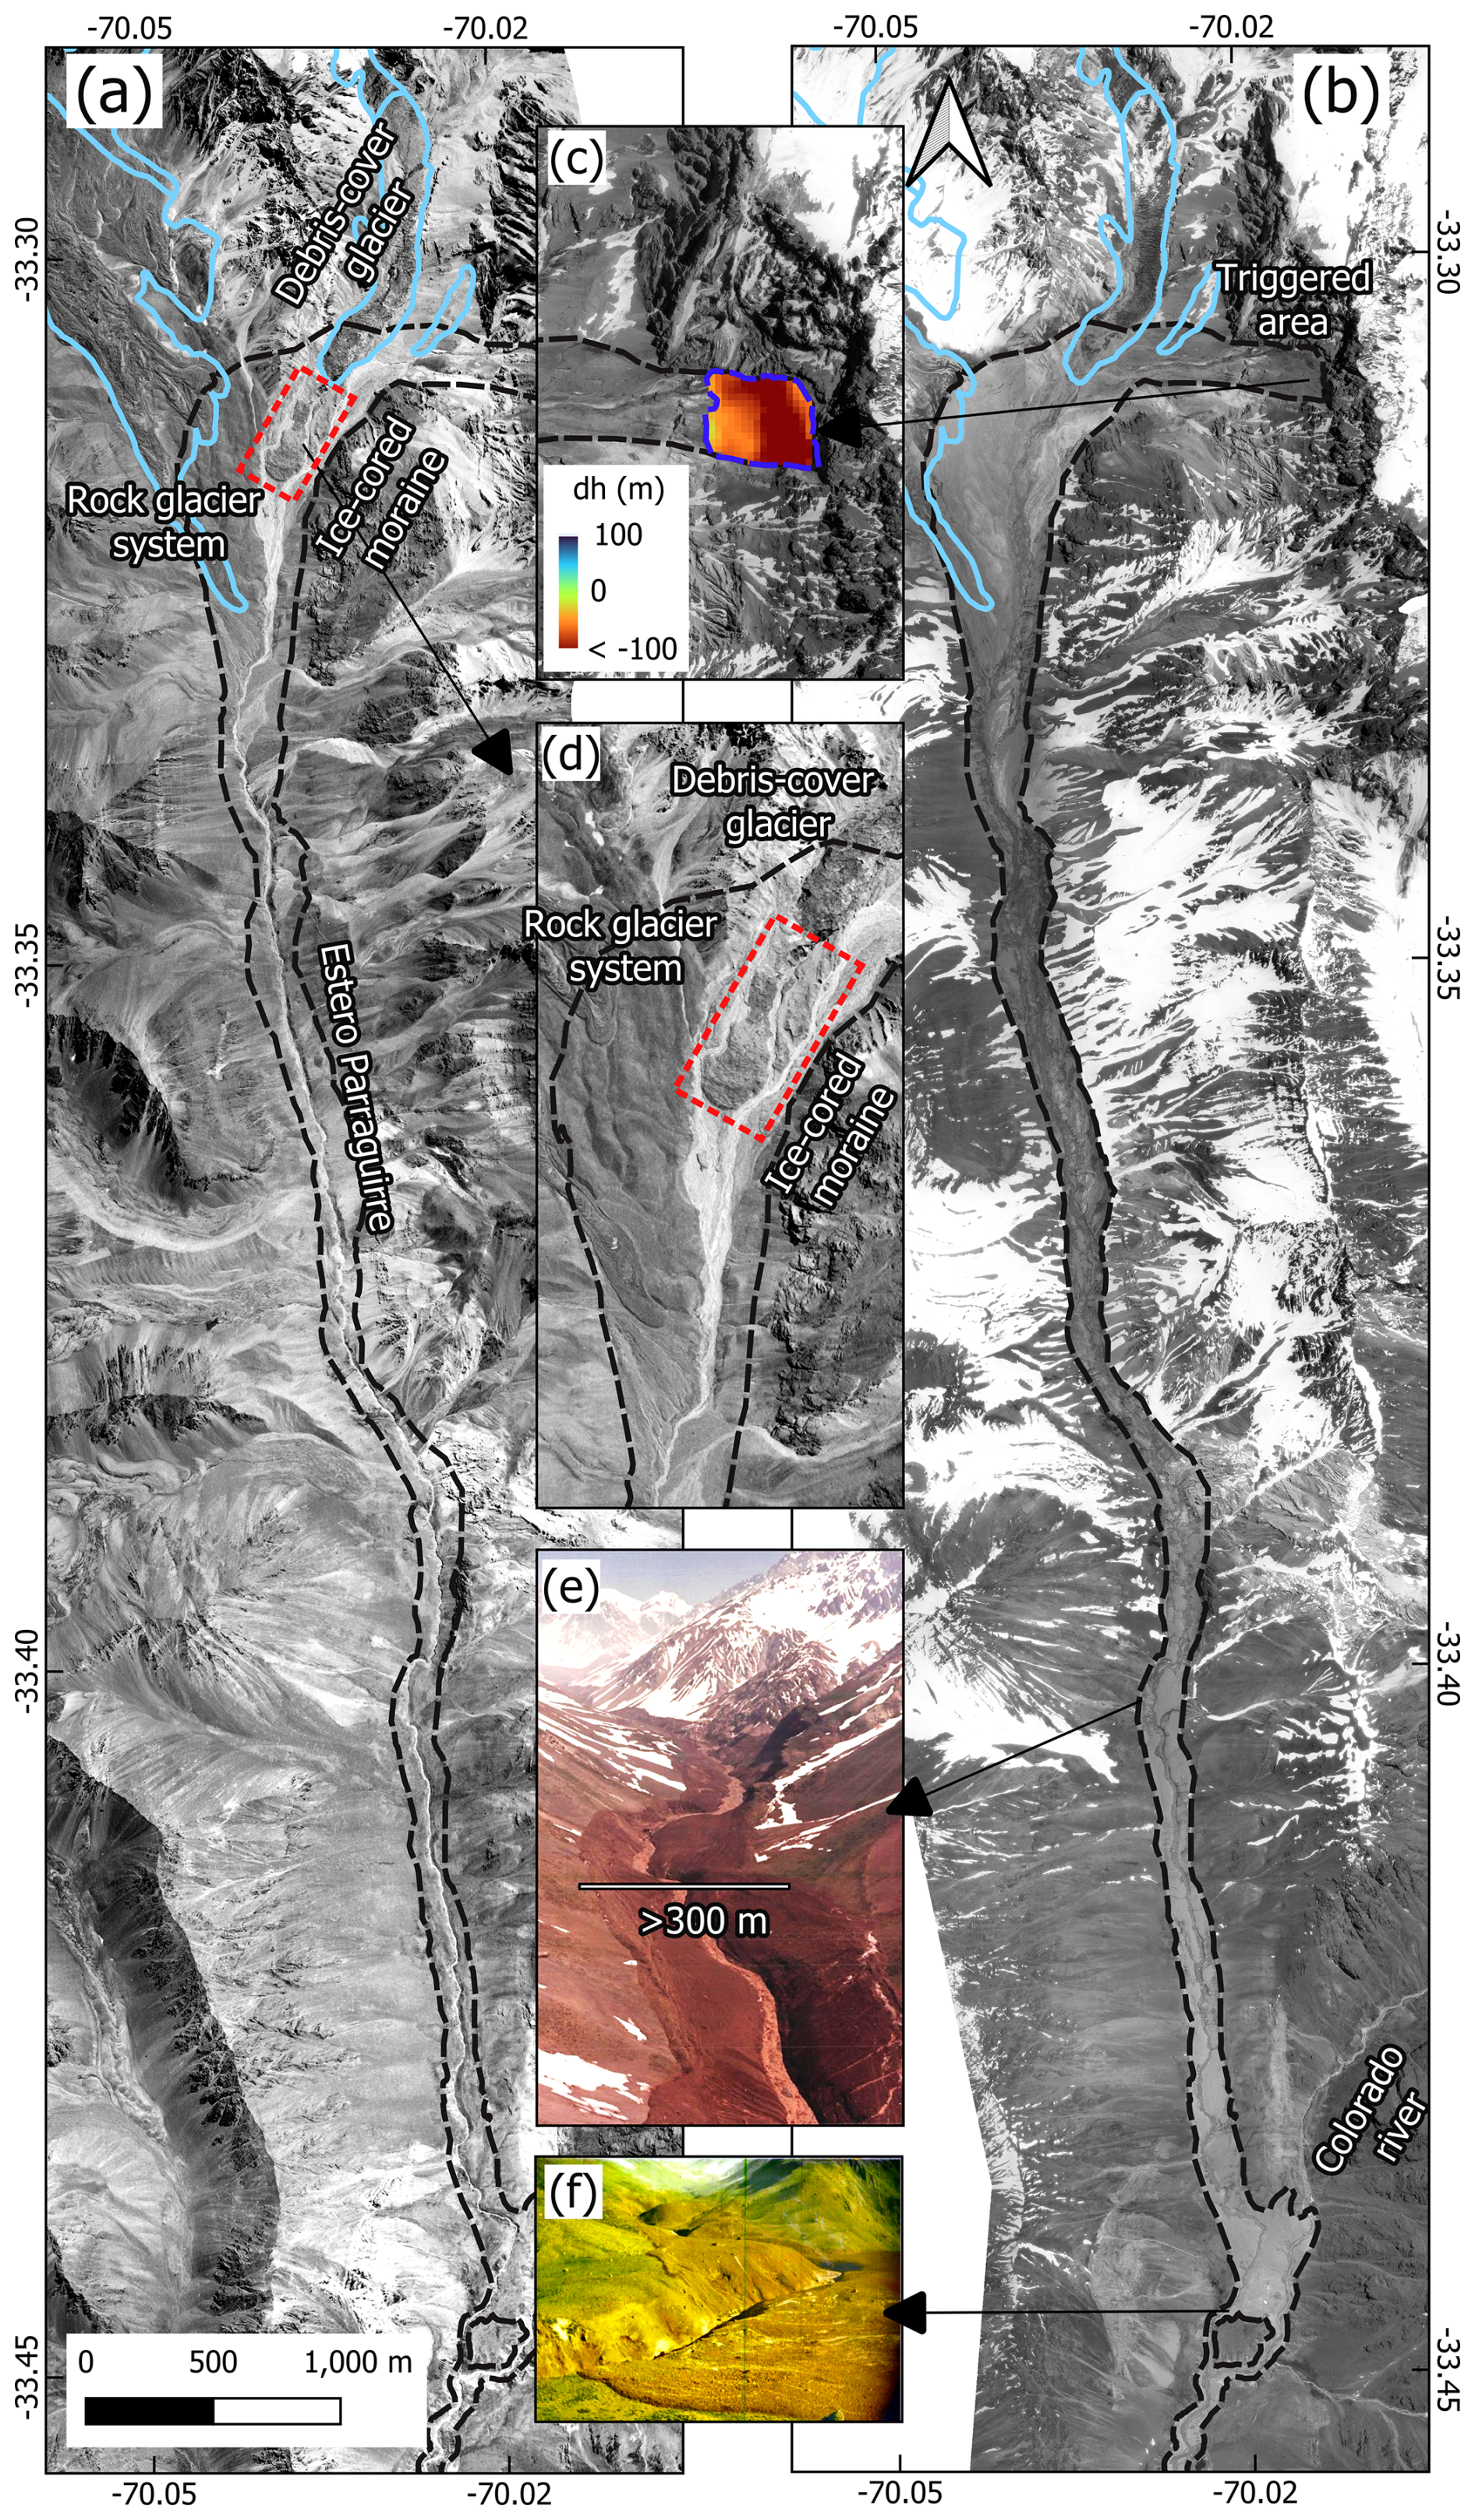
Figure 2Orthomosaics and digital elevation models prior to and after the debris flow. (a) Orthomosaic from 1955 depicting pre-event conditions. The dashed black line indicates the impacted area. (b) Post-event orthomosaic showing the impacted area. (c) Elevation changes (in m) in the triggered region. (d) Zoomed-in view of panel (a). Several glacial landforms are visible, including a debris-covered glacier (Glacier No. 24) and an ice-cored moraine near the 1955 glacier terminus. Additionally, a rock glacier system (Glacier No. 22) is observable, captured 5 d after the event. In situ photographs (looking north) showing the debris-flow path and its consequences (e) along Estero Parraguirre and (f) at the confluence. In situ photos (e, f): credit to and courtesy of Humberto Peña, 1987. Aerial photos (a–d): credit to and courtesy of IGM Chile, 1955, and SAF, Chilean Air Force, 1987.
2.2 Debris flow in Estero Parraguirre
The debris flow then made its way southwards along Estero Parraguirre. Along its path, it was suggested that it incorporated considerable amounts of solid and fluid material (Casassa and Marangunic, 1993; Hauser, 2002). From aerial photographs acquired a few days after the event, patchy snow cover is visible up to 11 km away from the source (Fig. 2e). Mud splashes and superelevation of the debris line along the valley confirm the high mobility of the landslide in this part – evidence for high water saturation.
Table 1Overview table of event history. The distance from the trigger area, elevation and slope were re-determined (normal font) and are compared to values reported in previous studies (italic). For consistency, we mostly rely on our estimates. For timing, velocities, deposition and flow heights, we entirely rely on previous reports. Inconsistent or less reliable timing values are indicated in italic. Subscripts for timing indicate elapsed minutes after 10:33. Superscripts point to references.
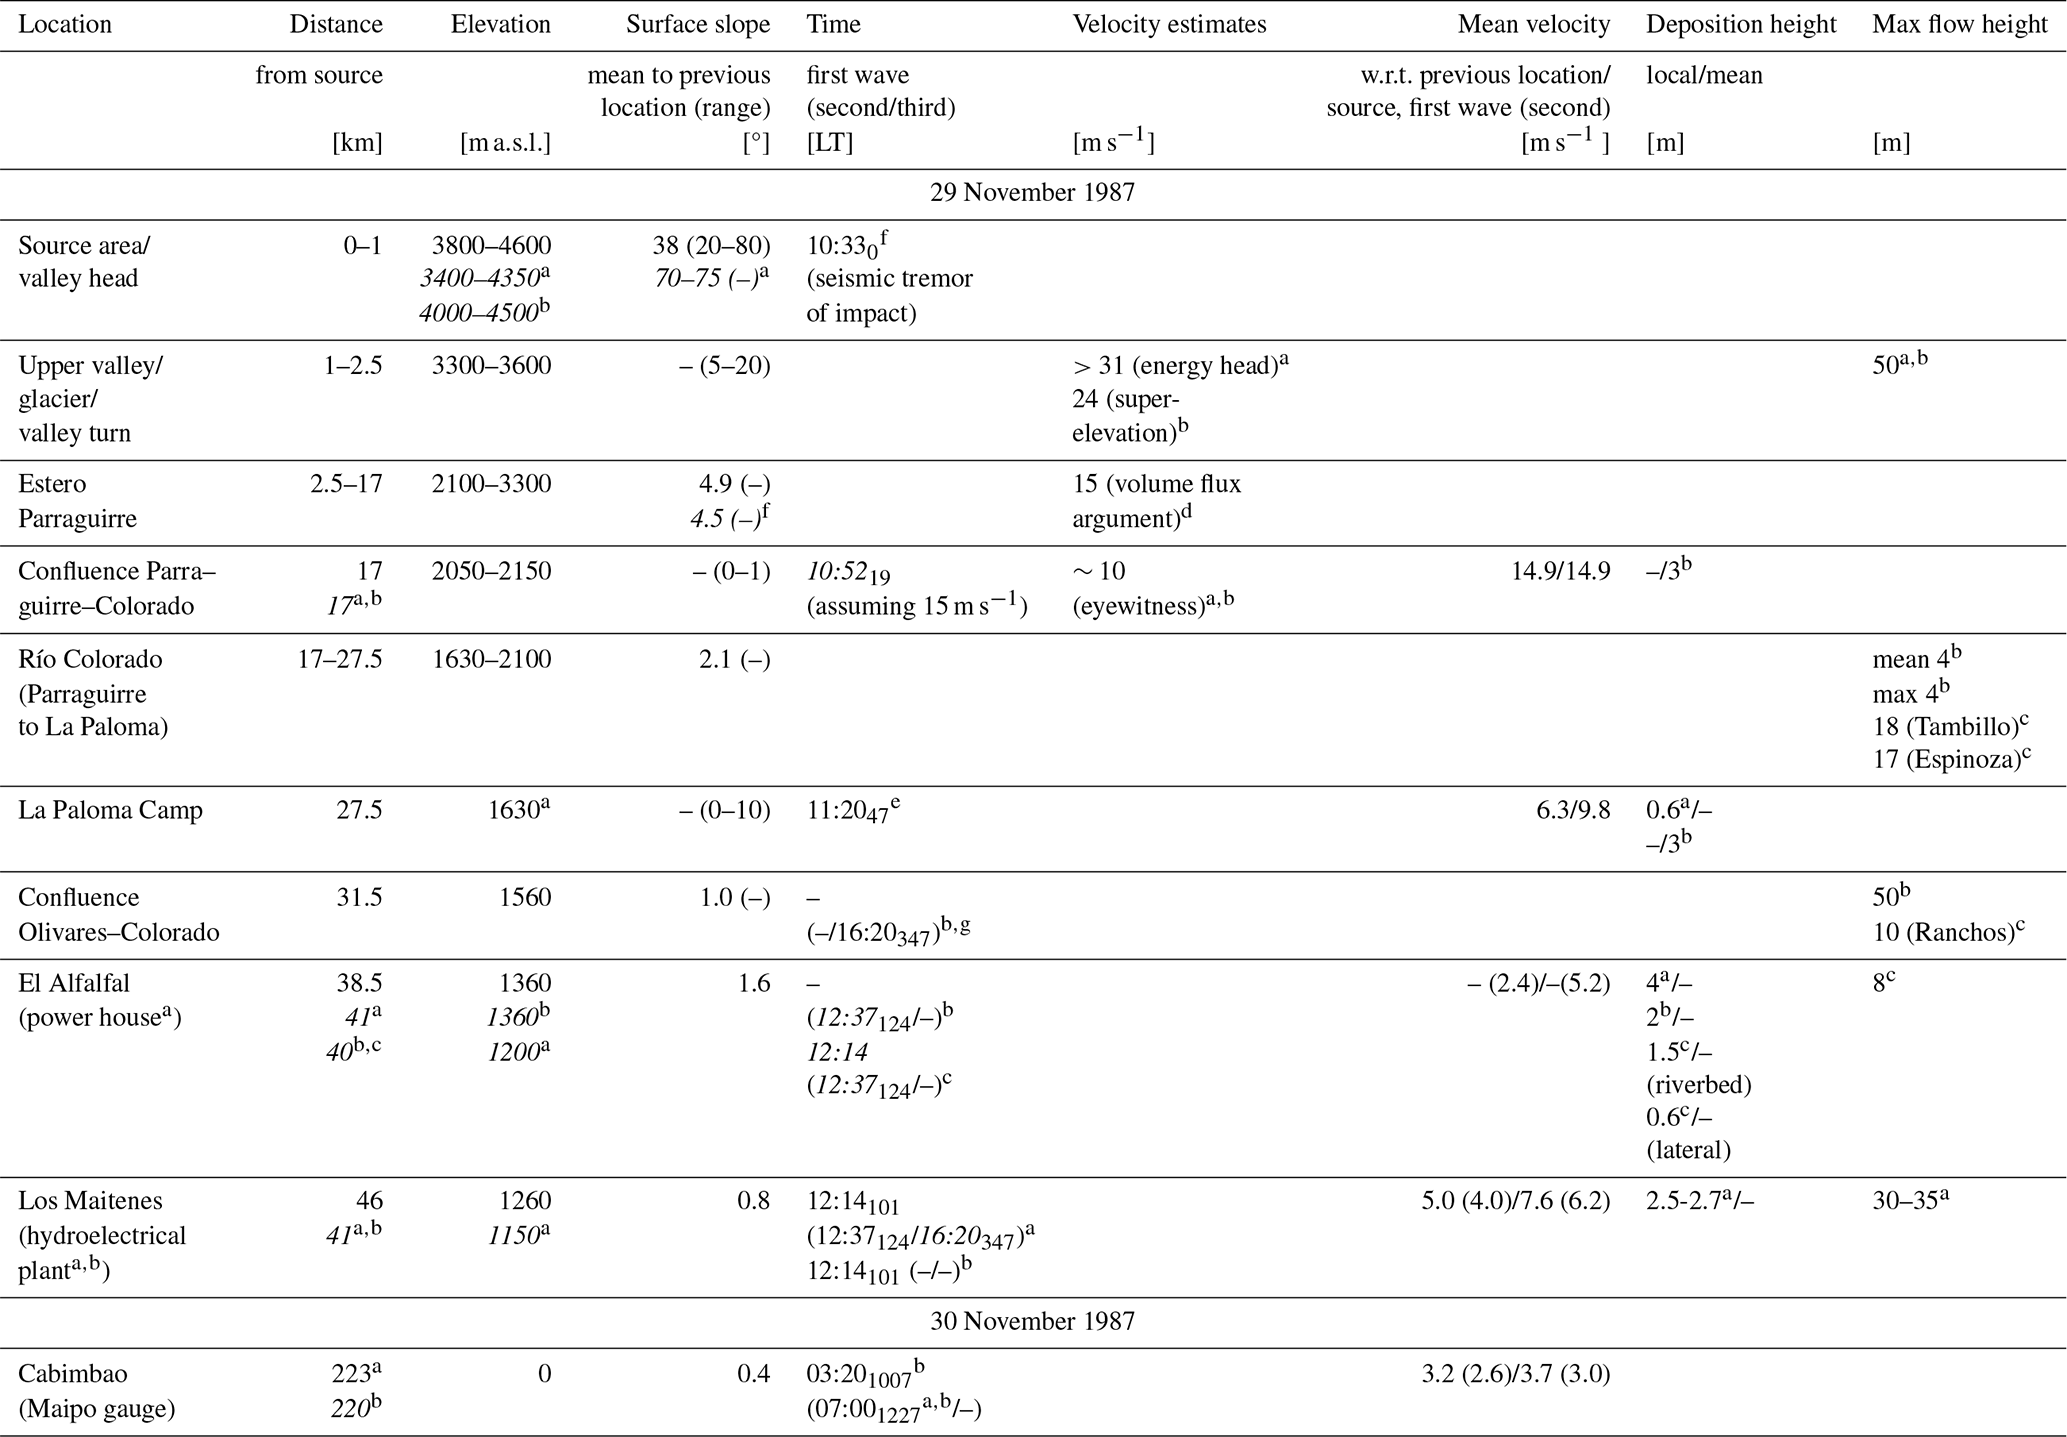
a Hauser (2002). b Casassa and Marangunic (1993). c Naranjo et al. (2001). d Peña and Klohn (1988). e Valenzuela and Varela (1991). f Eisenberg and Pardo (1988). g Ugarte (1988).
At 1 km before reaching the confluence with Río Colorado, the primary debris flow left the narrow riverbed of Estero Parraguirre and overran 10 to 15 m high fluvial terraces towards the east (Fig. 2a). This overspill occurred along 100–400 m and across a width of 600–800 m and left deposits of as much as 3 m in height (Casassa and Marangunic, 1993), before finally discharging into Río Colorado. Speculations on the immense flow volume in this area nourished the hypothesis of a temporary damming of Río Colorado (Hauser, 2002). A smaller secondary flow followed the Parraguirre channel and joined Río Colorado some distance downstream. The high energy of the debris flow in the confluence area is illustrated by the displacement of a huge 1000 m3 boulder. While presumably located upstream of the confluence prior to the debris flow, the boulder was retrieved several kilometres downvalley (Casassa and Marangunic, 1993; Hauser, 2002).
2.3 Debris flow in Río Colorado
Downvalley of the confluence, the debris flow became diluted in the Río Colorado. A truck driver observed the flow event and estimated a 10 m s−1 propagation speed. Along the following section, observed superelevation of debris lines suggests maximum flow heights of about 4 m on average. In bends, however, mud splashes reached 40 m high, indirectly indicating the flow ferocity. In this section, maximum deposition heights of 3 m were reported (Casassa and Marangunic, 1993).
The next evidence for the progression is from 11:20 (Table 1) at about 27.5 km from the source (Valenzuela and Varela, 1991), where the debris flow reached and destroyed the construction camp near Estero La Paloma. At La Paloma, the narrow Colorado valley (50–100 m) opens again into a larger plain of 200–300 m in width. There, average deposition heights only reached about 0.6 m (Hauser, 2002).
In the literature, there is some timing confusion regarding the El Alfalfal powerhouse and the Los Maitenes hydroelectric plant (cf. Table 1). We adopt Hauser (2002) and assume that a first small wave hit Los Maitenes at around 12:14. This wave alerted many people (shutdown and evacuation) before the second more destructive wave hit the facilities at 12:37. During this event, maximum flow heights in the river channel reached 30 m. The thickness of debris-flow deposits along this section ranged between 2–4 m (Casassa and Marangunic, 1993), with a typical value of 2.5 m (Hauser, 2002). These deposits typically consisted of unstratified mud-rich clast conglomerates (42 %–44 % fine grained) bearing sandstones, red shales, andesites, magnetite-bearing dacites, limestones and gypsum (Naranjo et al., 2001). Downstream of Los Maitenes and towards Río Maipo, no significant damage was reported as the debris flow became increasingly diluted, the riverbed widened and the slopes reduced. In a 50 m wide gorge – just before Río Maipo is reached – flow heights of 4 m were observed.
2.4 Debris flow in Río Maipo
Unfortunately, the first gauge station downstream of the Colorado–Maipo confluence (El Manzano) was destroyed, and no measurements were available from 3 November until 27 May. The only station that remained operational was at Cabimbao, close to the Pacific and about 220 km from the debris-flow onset. It recorded the full event on 30 November (Fig. 1), with two discharge peaks. The main one arrived at 07:00 showing 175 m3 s−1 above a baseline value of about 700 m3 s−1 (Peña and Klohn, 1988). From this a total floodwater volume of 7×10⁶ m3 was estimated. Casassa and Marangunic (1993) speculated that this water volume must have already been mobilised in the Parraguirre catchment. Accounting for extensive 1 m snow cover (3.5×10⁶ m3), pore water in the rock slab (0.1×10⁶ m3) and saturated soil (0.6×10⁶ m3) along the valley bottom, about half of the observed flood volume can be explained. Yet, this value is further called into question because no closed snow cover was observed during the helicopter survey a day after the event (Fig. 2).
3.1 Digital elevation models, orthomosaics and reconnaissance photographs
We generated two orthomosaic images and their corresponding digital elevation models (DEMs) from aerial photographs acquired before (1955) and after the 1987 event (Figs. 2a–d and S1a, b in the Supplement). In 1955, aerial photographs were acquired during the HYCON aerial survey conducted over Central Chile. These archival images were obtained from the Instituto Geográfico Militar (IGM) of Chile. A few days after the debris flow, the Chilean Air Force's Aero-photogrammetric Service (SAF) conducted a dedicated survey of the Parraguirre debris-flow impact area. These photographs allow, first, a precise delineation of both the trigger and the impact zones and, second, the derivation of pre- and post-event DEMs.
The digitised 1955 and 1987 aerial photographs were orthorectified and georeferenced using structure from motion (SfM) techniques (Farías-Barahona et al., 2020). To do so, ground control points in non-glacierised areas were extracted from an IGM topographic map (1:50 000 scale) and PlanetScope satellite imagery (Planet Labs Research and Education Initiative). The SfM workflow involved an iterative routine of block bundle adjustments and refined camera calibration.
The day following the event, the Water Directorate (DGA) conducted a reconnaissance flight to assess the extent of the damage along Estero Parraguirre and Río Colorado (Figs. 2e, f and S1c). A series of in situ photographs taken during this flight were made available to us, providing valuable data to enhance our interpretation of the trigger site of the ice–rock avalanche and the area affected by the resultant debris flow.
3.2 Meteorological data
The first source of meteorological information is station data from El Yeso Embalse (70°5′19′′ W, 33°40′33′′ S; national station ID: 330149). The station is located at 2475 m a.s.l., about 20 km south of Río Colorado (∼ 40 km from the trigger area). The Chilean Water Directorate (Dirección General de Aguas de Chile; DGA) provided daily temperatures and precipitation data from 1977 to 1993 and 1962 to 2020. DGA also operates stations for snow height in the Maipo Canyon. For this study, we analysed the observed snow water equivalent at Laguna Negra (70°6′28′′ W, 33°39′57′′ S; national station ID: 330146) within 2 km distance (NW) of the weather station at El Yeso Embalse.
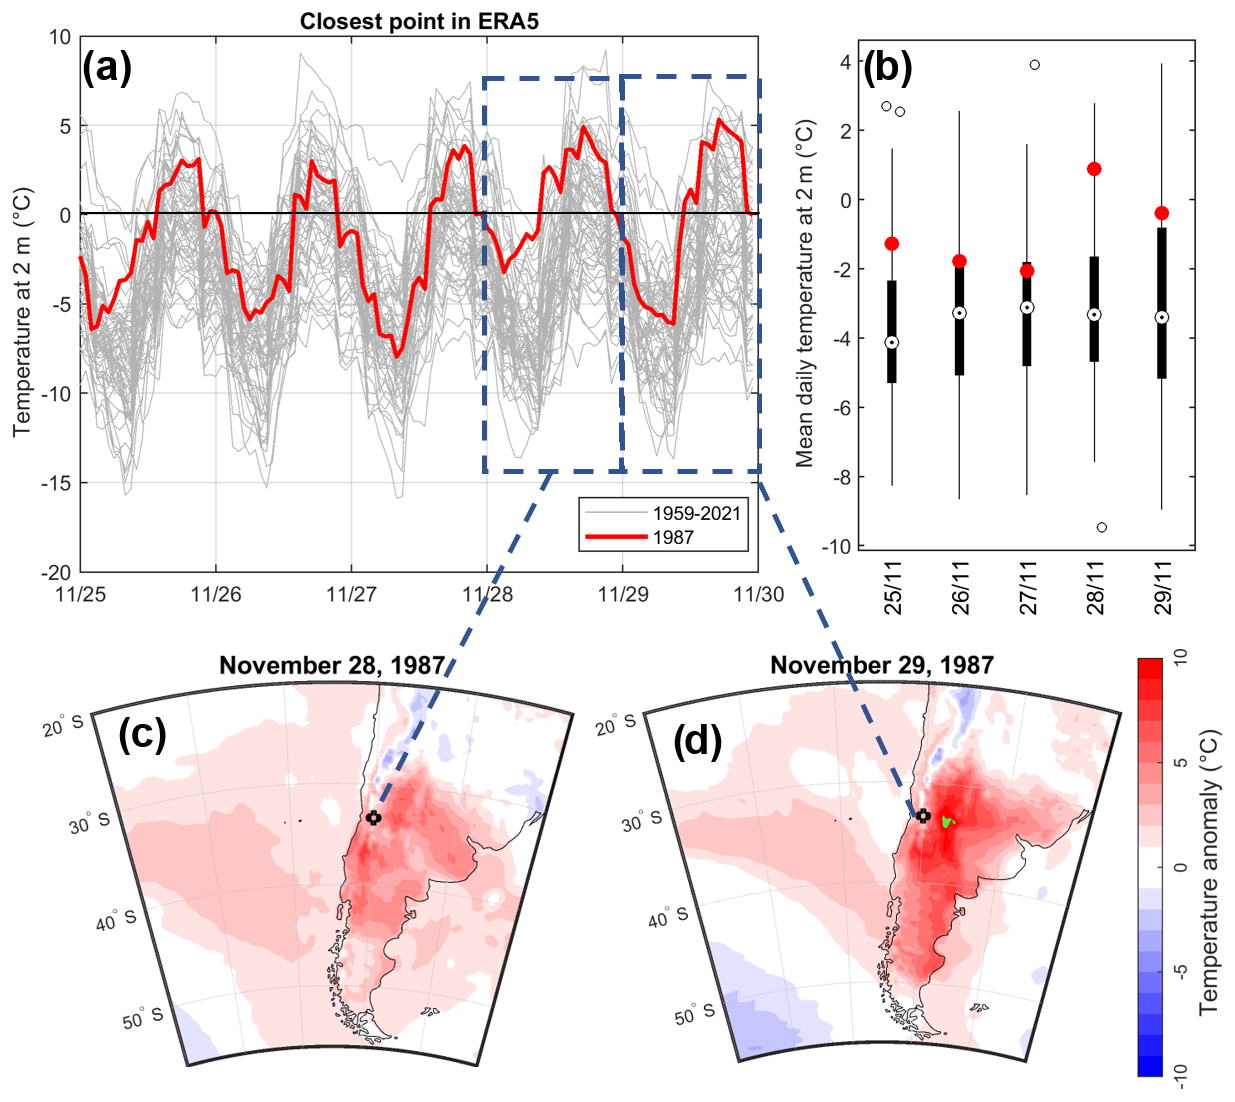
Figure 3Reanalysis air temperatures. (a) Hourly air temperature from reanalysis data between 25 and 30 November for 1959–2021. (b) Box plots of the 63 years of daily air temperature between 25 and 29 November. Red dots indicate the year 1987. Panels (c) and (d) show the air temperature anomaly on a synoptic scale on 28 and 29 November, respectively.
Apart from in situ observations, reanalysis data from ERA5 (Hersbach et al., 2020) are selected to evaluate the synoptic and meteorological conditions during the event. ERA5 provides atmospheric data at ∼ 30 km grid spacing for the entire globe in hourly time steps. In this study, we analysed ERA5 from 1959 until 2021 during the months between September and December, which is considered the period of snowmelt onset. The data are used to identify anomalies in daily mean and maximum air temperatures at 2 m above ground and the daily snow depth and the maximum snow depth in the accumulation season anomalies.
3.3 Hydrological data
Gauge-station data are publicly available from the Chilean Ministry for Public Works (Ministerio de Obras Públicas, MOP) and more specifically from the DGA directorate. Time series of river discharge observations were retrieved for 7 stations in the Maipo catchment area (Fig. 1): Río Maipo at Cabimbao, El Manzano and San Alfonso; Río Colorado (before Olivares and before Maipo); Río Olivares; Río Mapocho (Almendros); and Río Angostura (Valdivia en Paine). These stations were selected because data reach back to 1989 and often many years further back in time.
4.1 Remote sensing and photogrammetry
To estimate the total release volume and elevation changes in the impacted area, the DEMs were initially resampled and co-registered both horizontally and vertically using the method developed by Nuth and Kääb (2011). This co-registration process ensured a high level of cross-alignment and effectively eliminated outliers. The elevation changes from the trigger point to the impacted area were then determined by subtracting the 1987 DEM from the 1955 topographic DEM. These elevation changes serve to quantify the initial trigger volume and the downvalley mass transport. To calculate volume uncertainties, we follow Farías-Barahona et al. (2019). In this way, we account for uncertainties in the DEM differencing over stable areas and for uncertainties in areal extents. To quantify the impacted and triggered areas, we manually digitised both regions from the mosaic generated using 1987 aerial photographs, following standard procedures. The manual digitisation was supported by in situ photographs taken in the days following the event, which allowed us to photo-interpret specific areas.
4.2 Multi-phase mass-flow modelling
4.2.1 r.avaflow
We retrace the mass movement in Estero Parraguirre with the multi-phase mass-flow model r.avaflow (version 3.0), an open-source model integrated into GRASS GIS as a raster module (Mergili et al., 2017). In general, r.avaflow computes the propagation of rapid mass movements and is capable of simulating a mixture of fluid, fine-solid and solid phases (Mergili et al., 2017, 2018a, b; Pudasaini and Mergili, 2019; Mergili et al., 2020; Vilca et al., 2021). We only employ the fluid- and solid-phase capabilities. The fluid phase represents a mixture consisting mainly of water and very fine particles, e.g. clay and silt. Its deformation is described as non-viscous and shear-rate-dependent. The solid phase contains the largest grain sizes like boulders, cobbles and gravel. Deformation is assumed to be non-frictional and shear-independent. The model solves for mass and momentum conservation in an efficient way, relying on the Total Variation Diminishing Non-Oscillatory Central Differencing Scheme (Wang et al., 2004). Momentum transfer between the phases considers viscous drag, buoyancy and virtual mass induced by acceleration differences. This transfer is key to producing concurrent deformation, mixing and separation of the phases (Mergili et al., 2017).
Integral input variables and decisive control parameters are provided as raster maps. These comprise a digital elevation model (DEM) of the pre-event situation, the fluid and/or solid release volumes, maximum entrainment heights, and the solid entrainment fraction as well as internal and basal friction coefficients for the solid phase. For further customisation, r.avaflow allows for timed volume release rates in the form of phase-specific hydrographs placed at predefined locations. For validation, diverse scores are computed to assess the accuracy of the modelled mass movement against the observed impact area. Scores are computed from the percentage of correctly and incorrectly identified points.
4.2.2 Experimental setup
In all experiments, a 30 m resolution is used and the release volume is prescribed from the observed elevation change, giving 17×106 m3. Moreover, the region is divided into two sub-domains: Area 1 and Area 2 (Fig. 1). In each region, specific values are set for the friction coefficients, the maximum entrainment height and the solid entrainment fraction. Entrainment is constrained to the observed impact area.
Calibration experiment 1 (CAL1): entering Estero Parraguirre
In this first set of experiments, the target was to infer optimal friction parameters such that the debris flow follows the sharp 90° turn southwards into the main valley of Estero Parraguirre (Fig. 1). For our assessment, we used the match with the observed impact area and the criterion that the simulated debris flow does not overrun the glacier in the west. For this purpose, the internal (PHI1) and basal friction (DELTA1) parameters for the solid phase were varied according to Table 2. Furthermore, the maximum entrainment height (HENTR1) along the valley bottom (Area 1) was prescribed from the observed elevation change. The rectangular domain spans the trigger site and La Paloma camp.
Calibration experiment 2 (CAL2): Parraguirre–Colorado–La Paloma
The primary targets in this second calibration step are threefold. First, we require the resultant debris flow to reach the confluence with Río Colorado and, according to the reported timing, to arrive in time at La Paloma camp. Second, we assume that the fluid volume exiting Estero Parraguirre fully explains the flood volume inferred from the Cabimbao gauge station. The specific target value is presented in the Results section, Sect. 5. The third calibration target relates to the net solid mass export out of the Estero Parraguirre catchment as inferred from observed elevation changes (Sect. 4.1). For the purpose of calibration, friction parameters were adjusted in Area 2 following Table 2. For the admissible range in these target values, please refer to the Results section. The spatial domain is the same as in CAL1.
Calibration experiment 3 (CAL3): damming experiments
The admissible parameters after calibration in CAL2 enter our final simulations, for which a damming of Río Colorado is prescribed. We assume above-average river discharge of about 28.0 m3 s−1 upstream of the confluence with Estero Parraguirre. We infer this number from a simple scaling argument. Hauser (2002) reported typical November discharge values of Río Colorado above the confluence with Estero Parraguirre of 13.3 m3 s−1. As data from the gauge station at Colorado upstream of the Maipo confluence are available until 28 November, we compute a monthly mean and compare it to the multi-annual average (cf. Table 3). The resultant scaling factor is 2.1. We estimate the damming time to be about 30 min. In the model, the dammed water volume is released at 11:10 (2220 s) for a duration of 1, 2, 5 or 10 min at constant rates at a location just upstream of the confluence (33.42934° S, 70.01346° W). This breaching time is chosen such that the main wave of the debris flow reaches La Paloma at around 11:20. For these simulations, deposition and stopping of the debris flow were deactivated. The timing choices are motivated by the results of CAL2 and explained in the Results (Sect. 5). The domain size spans a rectangle from Los Maitenes to the trigger site.
5.1 Mass movement and volume estimation
Aerial images and DEM differencing reveal a triggered volume of m3, impacting a total area of 12 km2. Figure 2 illustrates the affected region in the upper Parraguirre before and after the event, highlighting the extensive mass movement that occurred. Not only did this triggered volume significantly impact both the debris-covered glacier and a rock glacier in the vicinity, but it also removed a nearby ice-cored moraine. connected to the debris-covered glacier. The contribution from the ice that melted from these landforms played a crucial role in the liquid phase of the subsequent debris flow, enhancing its mobility and destructive potential. Furthermore, DEM differencing suggests a mass transfer out of the Parraguirre catchment of m3, leading to significant landscape alterations. In several sections, the displaced material notably altered water flow, which in turn considerably increased sedimentation in downstream areas.
5.2 Pre-event meteorological conditions
In the last week of November 1987, the synoptic conditions showed an intense Eastern Pacific anticyclone (high-pressure system at the surface) off the coast of Chile along with strong southerly flow parallel to the mountains, following the anticyclonic circulation (Fig. S2a). It appears that the reanalysis was able to capture a large-scale forced easterly flow across the upper part of the Andes near Central Chile (Fig. S2b). The associated downward flow across the eastern mountain slopes, produced foehn-type conditions. This implies warming via the descending wind (subsidence) at around 700 hPa, thus intensifying the warming at high elevations in the Andes.
Figure 4Snow depth information from reanalysis and station data. (a, b) Snow depth anomaly over southwest South America from the reanalysis ERA5. Panel (c) presents a box plot of mean daily snow depth for the 63 years (1959 to 2021), and the year 1987 is highlighted in red. Panel (d) shows the Laguna Negra observations of snow water equivalent. The years 1982 and 1987 are highlighted (red and blue).
The meteorological conditions resulted in a positive temperature anomaly of the reanalysis over most of Southern South America (Fig. 3c, d). In addition, it is clear that the day before the avalanche (28 November), the minimum temperature was especially high (Fig. 3a). Absolute values are more difficult to interpret. We therefore consult the temperature observations at high elevation, i.e. at the El Yeso Embalse weather station (Fig. S3). There, daily near-surface air temperatures exceeded 0 °C for the whole of October and November. This station is at a similar elevation to Estero Parraguirre (Table 1). After a step increase in daily temperature of 5–10 °C between 5 and 10 November, snowmelt did likely start at the trigger site (∼ 4200 m a.s.l.). After some warmer days between 14 and 22 November, an extraordinary warm spell was experienced on 28 and 29 November 1987 with average daily temperatures exceeding 5 °C. The warm anomaly on 28 November is also confirmed in ERA5 (Fig. 3a). Daily mean temperatures of 5 °C can cause snowmelt of up to 3–10 cm d−1 (considering ranges for snow density of 300–500 kg m−3 and for snowmelt degree-day factors of to m w.e. °C−1 d−1).
Considering precipitation measurements, no rainfall was recorded after 15 October, more than a month before the debris flow (Fig. S3). However, snow-height observations and reanalysis data indicate a particularly high snowpack in 1987 over the Andes in Central Chile (Fig. 4a, b) because of a wet winter season. This likely produced the unique antecedent conditions for the avalanche on 29 November. Looking at the closest point of ERA5 (at 3906 m a.s.l.) to the avalanche location (Fig. 4c) and the observations of maximum snow water equivalent at Laguna Negra (30 km south of the Parraguirre creek headwater), the snow depth showed clear positive anomalies in 1982 and 1987 (Fig. 4d). Looking in more detail at the year 1982, a clear high snowpack is recorded and simulated by ERA5. However, in 1982 there was a cold spring, without any positive temperature anomaly to trigger rapid snowmelt (Fig. 5).
Figure 5Maximum snow depth, mean warm-spell magnitude and duration in spring. This figure exclusively displays the years that contain a warm spell during spring. The circle diameter scales with the mean duration of warm spells.
To highlight the extraordinary meteorological conditions of 1987, we quantify the warm-spell magnitudes and durations for each year over the ERA5 historical data (from 1959 to 2021) as well as the maximum snow depth (Fig. 4). All three quantities show elevated values in 1987 (Fig. 5). For the entire record, we find the second largest snowpack, the second longest duration of warm spells and the third warmest warm-spell magnitude.
5.3 Hydrological conditions preceding the Parraguirre ice–rock avalanche
The typical November situation of the river discharge in the Maipo system is characterised by about 150 m3 s−1 near the ocean outflow (Table 3). The main input (∼ 70 %) originates from the headwater of Maipo itself. Sorted by importance, additional input comes from Colorado, Angostura and Mapocho. November values in 1987 show a more than 2-fold increase in all gauge stations. This appears to be highly atypical because these extremes exceed 2 standard deviations.
Table 3Typical river discharge regime for the Maipo catchment. For the multi-annual discharge estimates, standard deviations are indicated together with the respective time period (subscripts). The 1987 values are highlighted in bold if they exceed these standard deviations.
At the Cabimbao and San Alfonso gauging stations of Río Maipo, a gradual increase in discharge is observed after 8 November (Fig. 6a). At Maipo, values increase from 250 to about 400 m3 s−1 as typical discharge prior to the flood. From the Maipo hydrograph at Cabimbao, we confirm the Parraguirre flood event by a peak discharge on 30 November between 03:00 and 13:00. A clear maximum is visible at 08:03 of 956.8 m3 s−1. Afterwards discharge values settled at 650 m3 s−1. This step increase of 250 m3 s−1 is independent of the debris flow and is largely explained by the headwaters of Río Maipo itself, where an increase of 150 m3 s−1 is visible at San Alfonso. As no liquid precipitation was recorded, melting of the extensive snow cover remains the main explanation. Considering a typical range of positive degree-day factors for snow between 3 and 7 mm w.e. °C−1 d−1, a warm spell of a few degrees Celsius could explain this increase in river discharge. At Alfonso the increase is recorded between 28 and 30 November, a perfect match with the observed warm spell on 28 and 29 November.
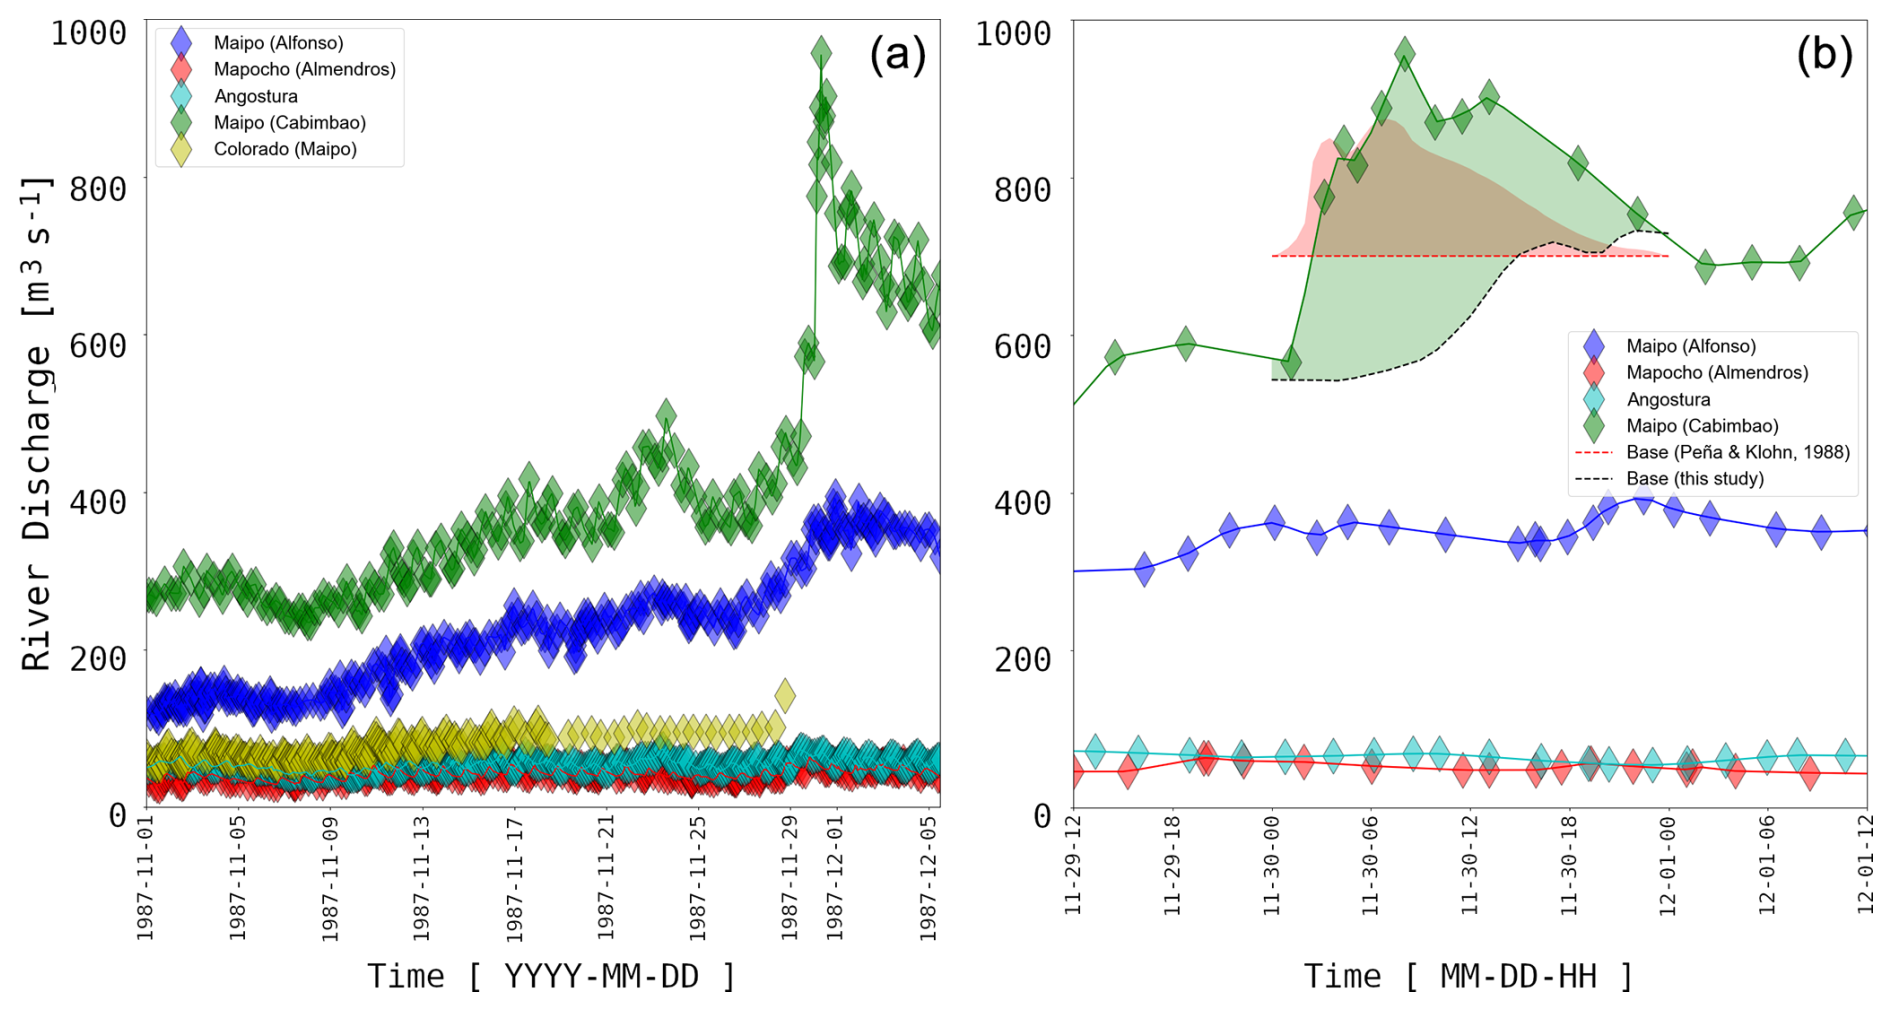
Figure 6Hydrographs from four gauge stations in the Maipo catchment. For locations refer to Fig. 1. Shown is the record (a) for the period from 15 November to 5 December 1987 and (b) for the event period. Also indicated are the baseline discharge (dashed red) assumed by Peña and Klohn (1988) as well as our baseline estimate (dashed black). The red shading indicates the Cabimbao hydrograph as reported by Peña and Klohn (1988) above a 700 m3 s−1 baseline. For this study, the flood volume – associated with the Parraguirre debris-flow event – is estimated from our baseline (green shading).
The Cabimbao discharge record of Río Maipo is further utilised to infer a new volume estimate of the flood event associated with the Parraguirre debris flow (Fig. 6). The reason for this new estimate is that the earlier baseline discharge of 700 m3 s−1 appears to be too high, resulting in a low-biased flood volume estimate of 7×10⁶ m3 (Peña and Klohn, 1988). The idea is to reconstruct a more reliable baseline discharge from the upstream discharge records at the Alfonso, Almendros and Angostura stations. First the travel times between these upstream stations and the Cabimbao reference are computed from a correlation analysis. We find delays of 17, 19 and 6 h for Alfonso, Almendros and Angostura, respectively. Subsequently, upstream time series are temporally aligned and discharge values are summed. This bulk discharge is then scaled to match the Cabimbao reference on 29 November and 1 December, respectively. Scaling factors for these two dates were linearly interpolated during the peak discharge period on 30 November The resultant background discharge (Fig. 6, dashed black line) was subtracted from the actually observed values at Cabimbao. A total flood volume of 16.0×10⁶ m3 was retrieved, more than twice the value previously reported (Peña and Klohn, 1988).
5.4 Simulations of the Parraguirre debris-flow propagation
5.4.1 Experiment CAL1
We identify basal friction (DELTA1) as the controlling parameter for this first calibration experiment in Area 1. An ideal value of 20 is found. Internal friction (PHI1) shows no significant impact and was therefore kept at the default value of 35.
5.4.2 Experiment CAL2
For this experiment, we first present results without deposition. The simulated arrival times at the confluence of Parraguirre and Colorado range between 5 and 8 min (10:38–10:41). This timing is much earlier than loosely indicated by an eyewitness (Table 1). If this early arrival at the confluence was true, the average propagation speed to La Paloma (4.3 m s−1) would be smaller than from there to further downvalley (Table 1). This seems implausible considering the decreasing slopes and the widening of the Colorado valley. We consider this the first evidence that the Parraguirre debris flow might not have been a single-stage trigger run-out event. As arrival times are also much too early at La Paloma (30–40 min) compared to the reported time of 11:20, deposition is activated in our simulations to allow for temporal interruption of the flow propagation.
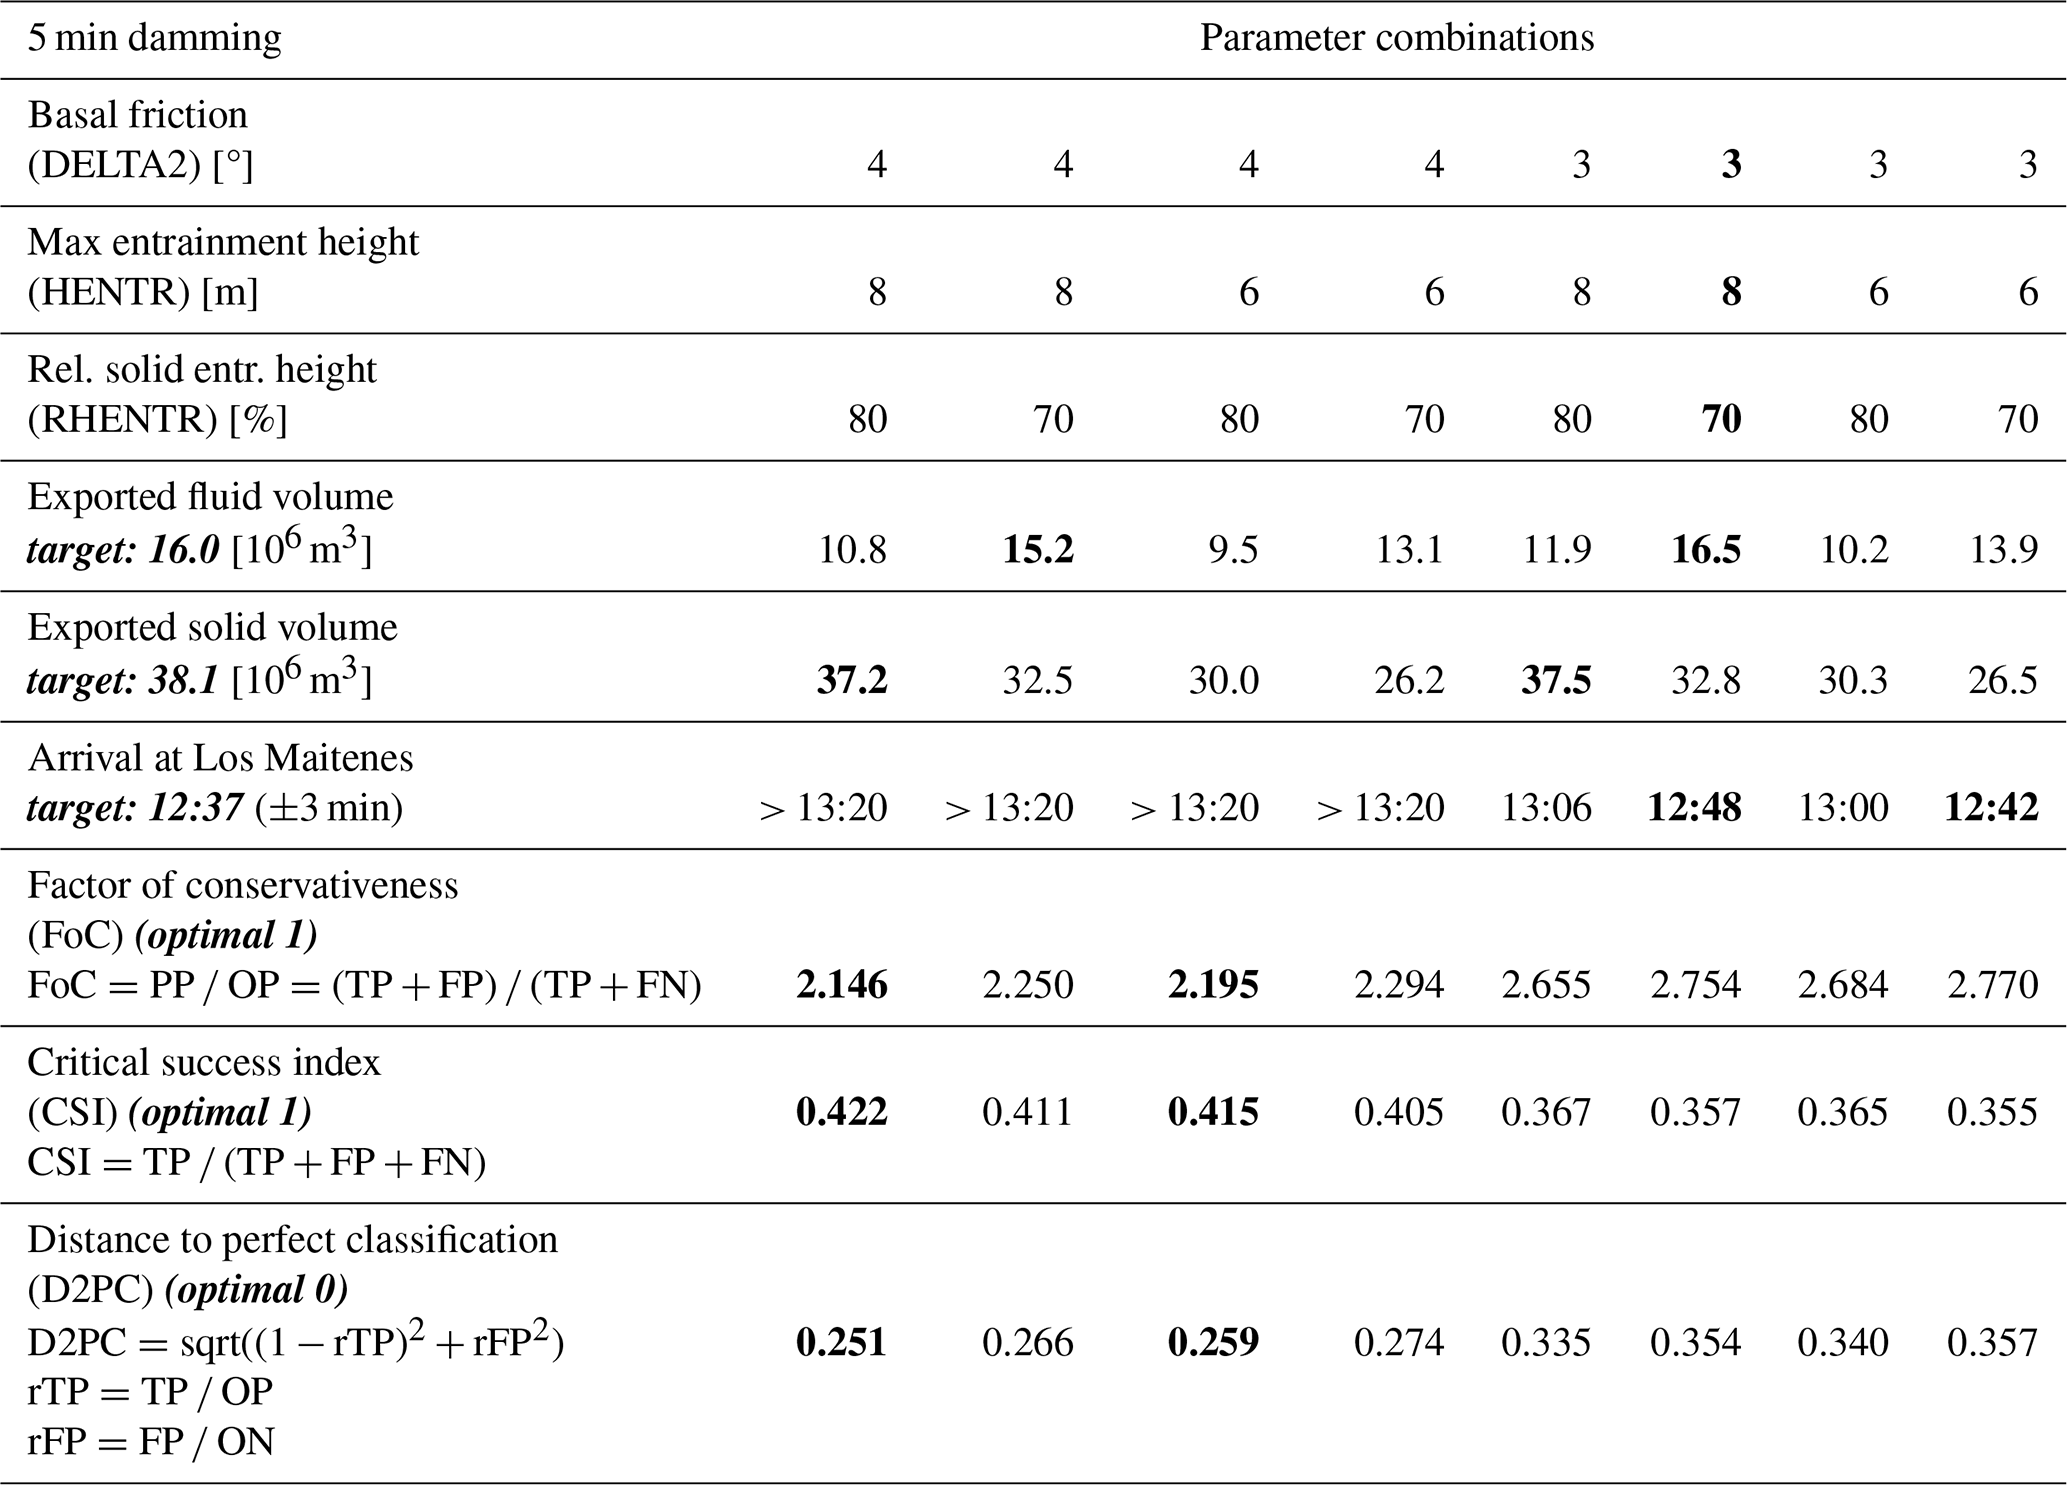
A total of 90 ensemble members are started with active deposition. Again, all show early arrival at the confluence with Río Colorado. We only retain 48 simulations and discard those that overrun La Paloma because all these show arrival that is too early. In the majority of the remaining simulations, the debris flow stops and heavy deposition occurs at the confluence with Río Colorado. This corroborates the damming theory. For our ensemble, we further consider constraints from our estimates of both the total fluid water volume and the solid mass export from Estero Parraguirre. Admissible ranges are 16.0×10⁶ m3 (±66 %) and 38.1×10⁶ m3 (±66 %), respectively (cf. Sect. 5.1, 5.3). In this way, we reduce our ensemble size via 38 to 12 members using the fluid and solid volume constraints, consecutively. In Area 2, basal friction coefficients (DELTA2) are constrained to 3 or 4. After ranking the remaining 12 simulations according to the above fluid and solid volume constraints (sum of relative difference), the preferable values for the maximum entrainments height (HENTR in Area 2) are expected to fall between 6 and 8 m, while the preferred solid fraction (RHENTR) is 70 % or 80 %. With this ranking, we reduce the final ensemble to 8 retained members.
Table 4Results and performance from the damming experiments. Simulations are based on CAL3 using the calibration results from CAL2. The best two parameter combinations per performance criterion are marked in bold, and so is the best overall parameter combination. For the performance metrics (Formetta et al., 2016; Mergili et al., 2017), we define areas with observed mass-flow impact as observed positives (OP) and the ones without observed mass-flow impact as observed negatives (ON). Predicted positives (PP) and predicted negatives (PN) are areas with and without simulated mass-flow impact, respectively. From these quantities, we infer true positive (TP), true negative (TN), false positive (FP) and false negative (FN) predictions. For all performance metrics, optimal or target values are given in bold italic font.
5.4.3 Experiment CAL3
In the final calibration step during which temporary damming of Río Colorado is active, the 8 retained members are evaluated against the appropriate arrival at Los Maitenes as well as against the observed impact area. Decisive are the basal friction and the damming duration. The longer the breach duration, the later the arrival at Los Maitenes and the smaller the impact area (results not shown). To meet both targets, a compromise is required. We deem DELTA2 =3 and a breaching duration of 5 min to be optimal (Table 4). The fluid and solid volume export from Estero Parraguirre are virtually independent of these two parameters, and we can use these values to constrain the maximum entrainment height to 8 m. For the reasonable partitioning of the solid and fluid volume, a relative solid entrainment height of 70 % appears appropriate.
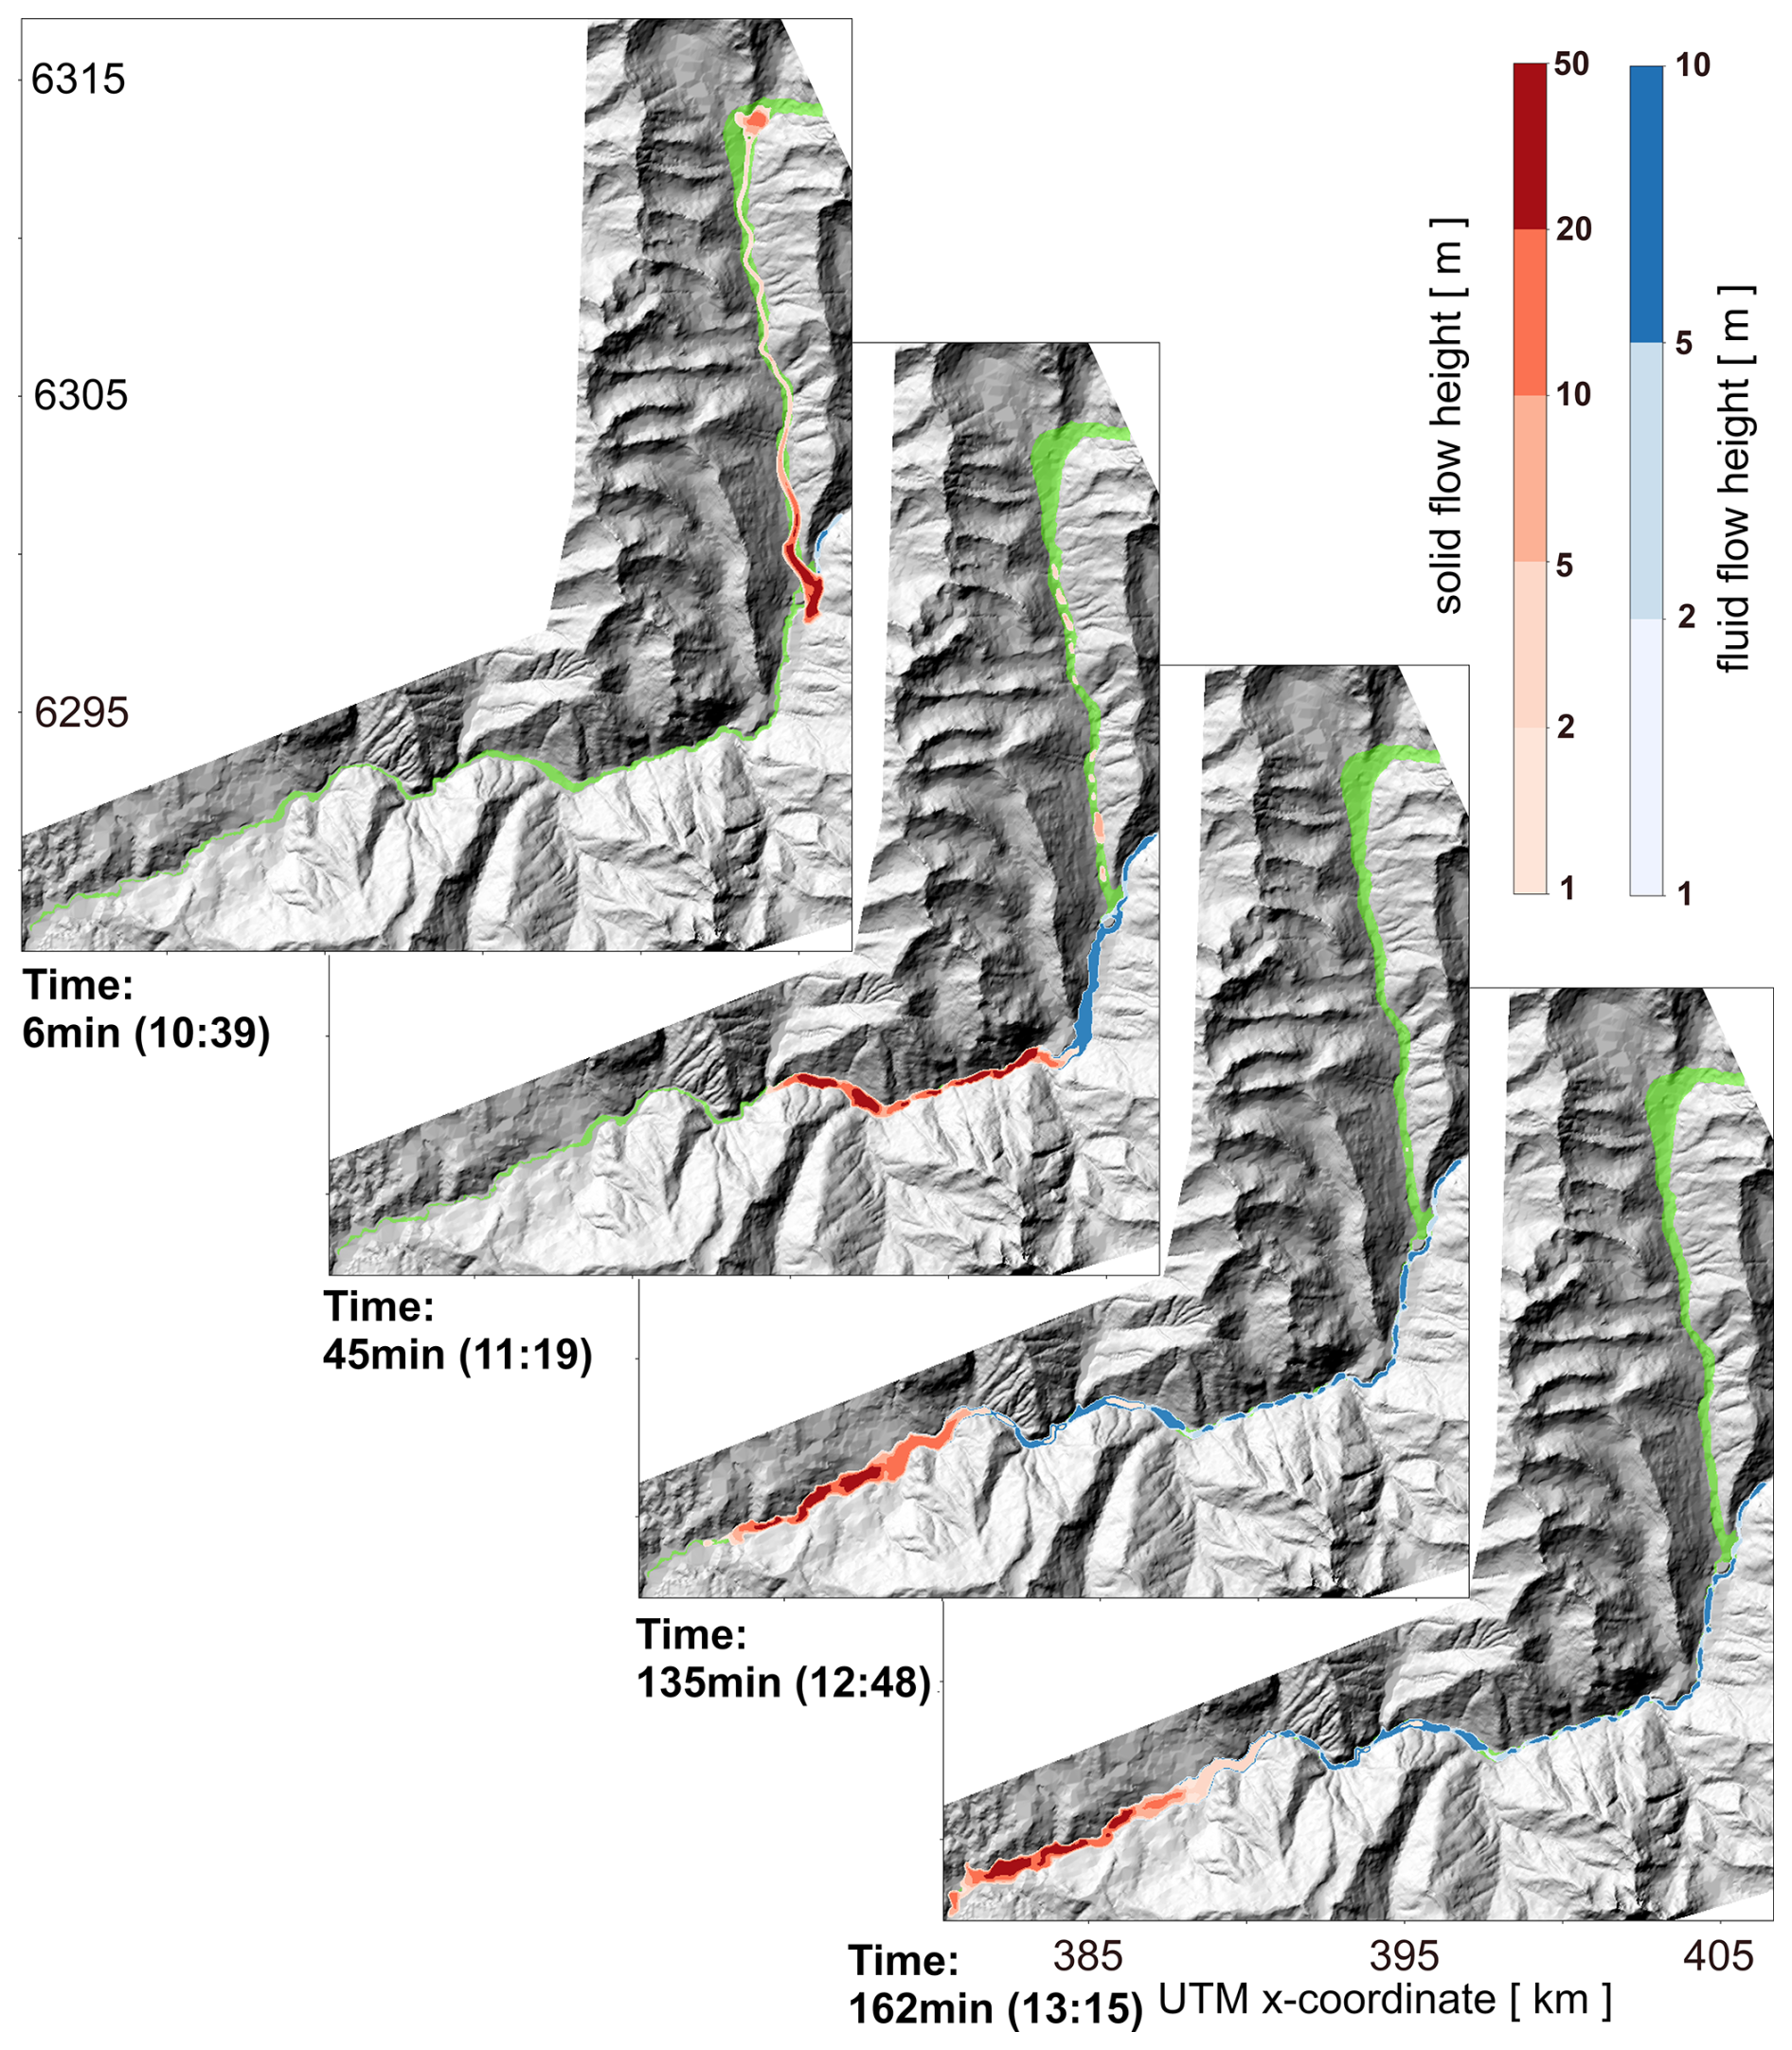
Figure 7Fluid and solid flow heights of the Parraguirre debris flow. Shown are results for experiment 3 (CAL3) using PHI1 =35°, PHI2 =6°, DELTA1 =20°, DELTA2 =3°, HENTR =8 m and RHENTR =70 %. Panels show moments when the debris flow reaches prominent sites: the confluence with Río Colorado, La Paloma camp and Los Maitenes. The last panel shows the final flow height after 10 000 simulation seconds. Red and blue colours indicate solid and fluid flow heights, respectively. The green-shaded area represents the observed impact area. Background: hillshade historic DEM 1955.
In terms of performance, we opted for three metrics: the factor of conservativeness (FoC), the critical success index (CSI) and the distance to perfect classification (D2PC). The latter two quantify the degree of overlay between the simulated and the observed impact area. FoC, however, also measures if the predictions over- or underestimate the observed impact area. In our case, all measures remain far from their optimum. Values indicate at best moderate performance (cf. Mergili et al., 2018a, b). FoC indicates that the impact area is significantly overestimated by a factor of 2 to 3. Unfortunately, these performance metrics cannot serve for further calibration. The best values also conflict with the arrival time at Los Maitenes.
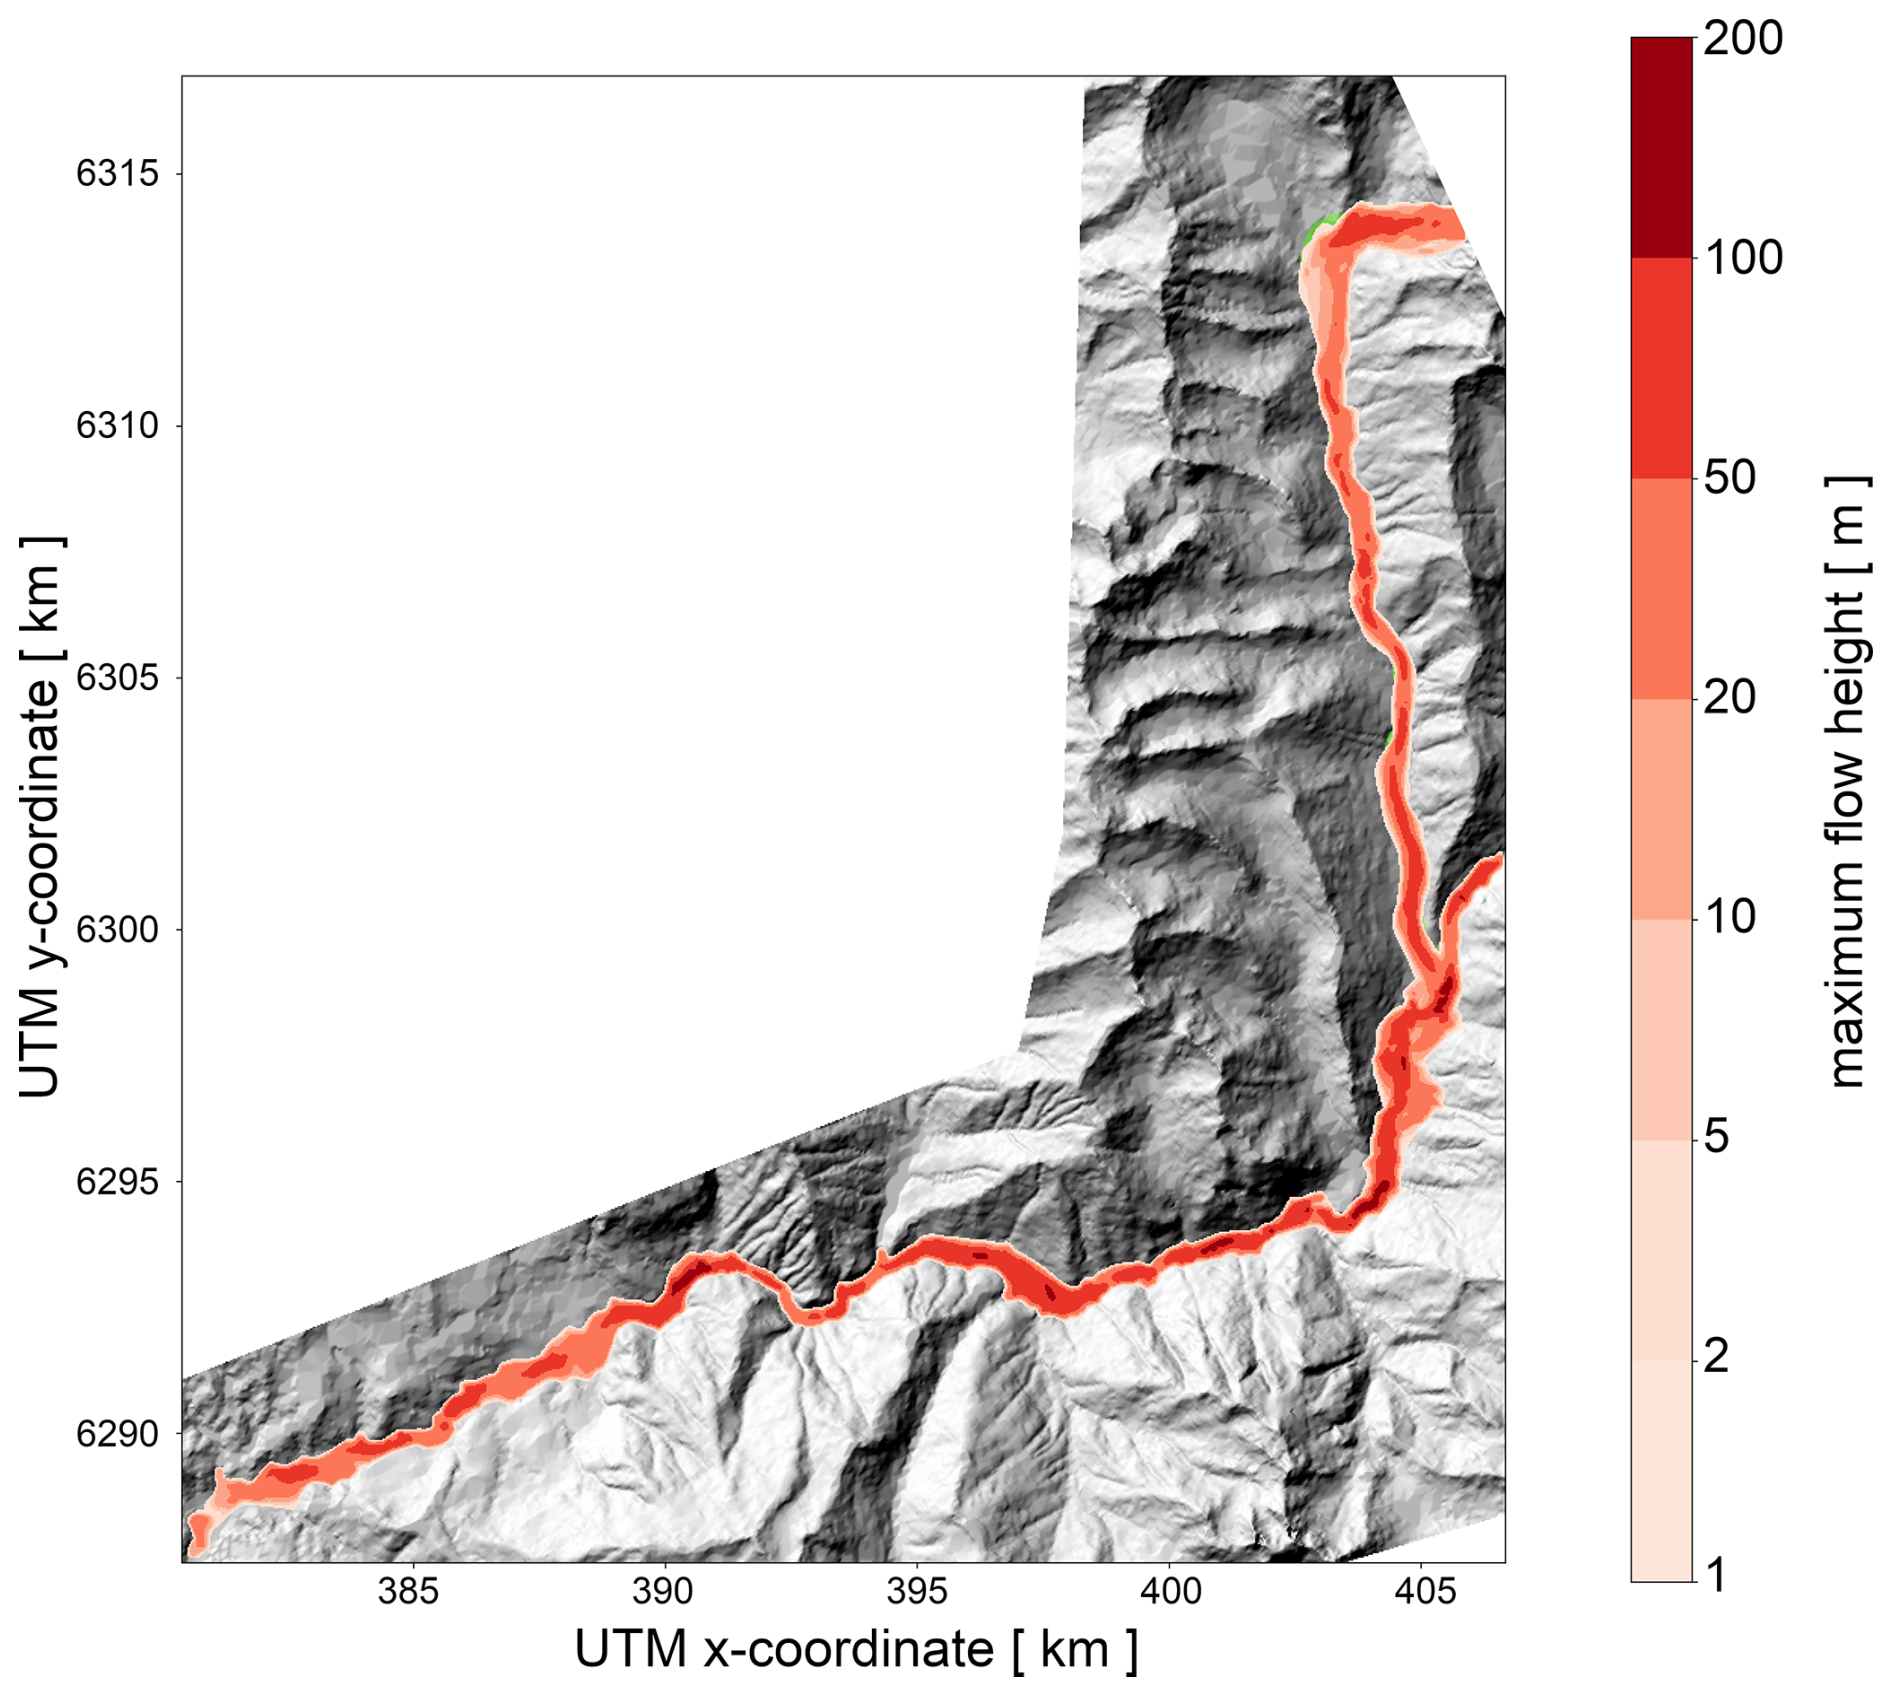
Figure 8Maximum flow height of the Parraguirre debris flow. Shown are results for experiment 3 (CAL3) using PHI1 =35°, PHI2 =6°, DELTA1 =20°, DELTA2 =3°, HENTR =8 m and RHENTR =70 %. Background: hillshade historic DEM 1955.
5.4.4 Simulated debris-flow propagation
In terms of the spatio-temporal progression of the simulated debris flow (Fig. 7), we re-confirm that the arrival time agrees fairly well with the few available observations (Tables 1, 4). The spatial flow-height pattern shows that the main wave front of the debris flow exceeds the observed impact area at all times. The resultant maximum flow-height map (Fig. 8) was used to compute the above performance metrics (Table 4) – confirming the overestimation of the actual debris-flow extent. After the first wave passes, the debris flow is rather well confined and closely follows the deepest valley sections. Downstream of El Alfalfal, the valley floor is characterised by wide and flat plains. There the observed impact area is confined to the narrow riverbed. The simulated debris flow occupies, however, most of the valley floor.
6.1 Meteorological preconditioning
6.1.1 Climate reanalysis and station data
We deliberately do not interpret absolute values of atmospheric variables either in the climate reanalysis or in the distant station data. We limit ourselves to relative comparisons in terms of changes, trends and outliers. The 60-year reanalysis data reveal that the year 1987 stands out in terms of both anomalously high snow cover and particularly long and strong warm spells. In situ observations confirm the unusually high snow cover, showing the second largest values over a 50-year period. Reanalysis 2 m temperatures and weather-station data also show a consistent picture of a warm spell hitting the study region a day before the debris flow. The warm spell arrived abruptly after a cold period had prevailed for several weeks. It is the only year on record in which anomalous snow cover coincided with exceptional warm periods in spring. On the basis of reanalysis and station data, we therefore declare that the Parraguirre ice–rock avalanche was a meteorological compound event (e.g. Zscheischler et al., 2020).
6.1.2 Hydrological record
The observed temperature increase after mid-November perfectly matches a first increase in the river discharge of Río Maipo (Fig. 6). Also the warming peak on 28 and 29 November is well imprinted in the gauge records. As a result, the November discharge value in 1987 for Río Colorado was twice as high as on average (Table 3). As no rainfall was recorded, these elevated values likely resulted from extensive snowmelt. Assuming that continuous snow cover is limited to areas above 3000 m a.s.l., an additional 40 m3 s−1 discharge can only be sustained by extra snowmelt of 5–10 mm d−1 (20–30 cm per month) above the annual average. This extra snowmelt requires positive anomalies in monthly mean temperatures between 0.5 and 1 °C. The weather station at El Yeso Embalse recorded a monthly temperature anomaly of about 1.2 °C in 1987 against the long-term mean for November (1970–1999). From these considerations, elevated river discharge can consistently be explained by snowmelt. We are therefore convinced that the subsurface of mountain flanks and valley floors was highly water saturated prior to the Parraguirre debris-flow event. This is especially true for the 2 very warm days preceding the event (Fig. S3a). Both the gauge measurements and the meteorological record draw a consistent picture of anomalous meteorological conditions in 1987 and further substantiate the hypothesis of the Parraguirre rock avalanche being a meteorological compound event.
6.2 Experimental setup
6.2.1 Trigger volume
Our estimate of the trigger volume is based on DEM differencing and amounts to 17×106 m3. Previous estimates of about 6×10⁶ m3 are significantly smaller (Casassa and Marangunic, 1993; Hauser, 2002). Yet these were loosely inferred from visual inspection during field visits. Hauser (2002) describes the initial extent of the destabilised rock slab as a rectangle with a length of 1000 m, a width of 500 m and a mean thickness of 20 m. This description already indicates a larger initial volume of about 10×106 m3. Naranjo et al. (2001) estimated 14×106 m3 from an extent of . From DEM differencing, we confirm the rectangular shape of the trigger area, but we find a slightly larger extent than both field inspections: about 1100 m along and 600 m across. The average thickness is 26 m. We are convinced that the larger horizontal extent is well constrained by remote sensing (Sect. 4.1). The absolute slab thickness, as inferred from DEM differencing, is certainly less reliable. The main reason is the 30 m resolution being rather coarse for the steep topography at the trigger site. Other parts of the uncertainty stem from difficulties in co-registration of the aerial photographs and from the fact that the reference DEM dates back to 1955.
6.2.2 Calibration targets
The impact area is key for all calibration steps and is well constrained by the aerial images acquired at the time. Concerning timing, the late arrival at La Paloma leads us to discard about half of the simulations (CAL2). The exact timing is not critical as the discarded simulations show significantly earlier arrival (30–40 min). We are therefore confident that our simulations point at a multi-stage debris-flow event in Parraguirre. The final calibration also considers the fluid content of the debris flow on arrival at the confluence with Río Colorado as well as the solid mass export from Estero Parraguirre. For both, we have to accept an ample uncertainty umbrella (±66 %). The former relies on streamflow observations that become delicate to interpret during extreme streamflow. The latter solid volume transfer is based on elevation differencing. Hereby, uncertainties cumulate over the Estero Parraguirre catchment. The more decisive calibration target is the solid mass transfer providing strong constraints on the friction coefficients. This friction range is supported by CAL3 to assure an appropriate arrival time of around 12:37 at Los Maitenes (Table 4). Without damming, additional experiments with identical friction coefficients show no arrival before 13:20 at Los Maitenes (results not shown). The water pulse from the dam breach of Río Colorado – though small in volume – is therefore essential for realistic debris-flow propagation. As a secondary target, the total fluid flood volume provides the means to further reduce the accessible parameter space for the relative and maximum entrainments heights.
6.2.3 Water budgeting
The immense fluid water volume involved in the Parraguirre debris flow gave rise to speculation about potential sources being extensive snow cover, pre-existent waterbodies and damming, glacier ice and water-saturated soils. We want to briefly comment on these source terms.
-
Snow cover. Valenzuela and Varela (1991) reported a 5–10 m layer at the time (ρsnow=300–500 kg m3). This could explain the total fluid flood volume. Unfortunately, the DGA photographs along the Parraguirre valley from just 2 d after the rock avalanche disprove extensive snow cover. Even the 1 m snow-cover estimate, which was proposed by Casassa and Marangunic (1993), appears unlikely, and it would only explain a 20 % fraction of the mobilised water volume.
-
Pre-existent waterbodies and damming. No persistent waterbodies are visible in optical imagery (Landsat 5) from February through November 1987 in Estero Parraguirre or in the pro-glacial area. Englacial or subglacial waterbodies cannot be excluded, but a substantial size would have been required. Water heights of several tens of metres would have been needed beneath the portion of Glacier No. 24 that would have been removed during the event. This seems unlikely as it would have implied pro-glacial water. Finally, the assumed 30 min damming of Río Colorado explains not even 1 % of the total water volume.
-
Glacier ice. Glacier No. 24 lost about 0.3 km2 of its area, which is well imprinted in the elevation change map. This shows an average surface lowering of 32 m, translating into a low-end estimate of released water volume of 8×10⁶ to 9×10⁶ m3. The associated melt energy is, however, substantial, and it seems unlikely that the melting was completed within Estero Parraguirre. The reason for this is that the total displaced solid material was only 2.5 times larger than the total flood volume. Heat transfer within the solid–fluid–frozen mixture sufficient for melting would imply that the solid material was significantly warmer (>10 °C).
-
Soil water. Considering the warm atmospheric conditions and the elevated rates of snow melting, the soil and subsurface must have been saturated with water. Global mapping of available soil water indicates 10 %–20 % potential plant-available soil water in the capital region of Santiago (e.g. Zhang et al., 2018; Gupta et al., 2023). Field capacity values are even slightly higher. On the basis of a total solid material export of 38.1×10⁶ m3, we would expect at most 8×10⁶ m3 additional water in the soil. This is 10 times larger than a previously estimated 0.6×10⁶ m3 (Casassa and Marangunic, 1993). The latter was based on expert judgement.
In summary, we propose the following closure of the water budget associated with the Parraguirre debris flow. The total flood volume of 16×106 m3 is explained in equal share by highly saturated soils in the Estero Parraguirre valley and the entrainment of glacier ice. A smaller contribution is expected to have come from remnant snow cover. Other sources including precipitation appear to be negligible.
6.2.4 Experimental design
An asset of our simulations is the simplicity of the setup. We only require a partitioning of the impact area into two sub-regions with distinct friction coefficients. These consistently explain both fluid and solid mass transfer as well as the observed arrival times at two locations. Nonetheless, we admit that our experimental setup remains highly idealistic – specifically with respect to three aspects: fluid entrainment, temporal damming, and deposition and resolution.
First, our simulations by no means adequately represent the actual entrainment pattern or distinguish between the water sources. Water and solid uptake is determined by a simple entrainment map with a fixed maximum height and a prescribed relative fluid portion. The best simulation suggests a maximum entrainment height of 8 m including about 2 m of water (ρwater=1000 kg m3). Unfortunately the coarse resolution in the simulation and the quality of the elevation change map do not allow for quantitative comparison of the transfer pattern of solid mass. Moreover, ice entrainment is impractical to directly incorporate into the mass-flow model as the removed ice volume is unknown and the representation of gradual melting during debris-flow propagation exceeds the current capabilities of r.avaflow.
The second idealised aspect concerns the hypothesis for the damming of Río Colorado. Hauser (2002) used the argument of the late arrival at La Paloma to substantiate his hypothesis. Here, we can use a model that describes this damming as a temporal water release (i.e. input hydrograph). The damming is defined by three parameters: the released water volume, the timing and the duration. The released water volume stated above was determined by the damming time and the discharge estimate of Río Colorado based on a scaling argument (see Sect. 5.3). Both seem moderately well constrained. As the model suggests much faster propagation speeds along Estero Parraguirre, we propose a damming time of 30 min, rather than the 15–20 min suggested by Hauser (2002). The duration of the water release is set to 5 min. This duration is a compromise to reproduce the arrival time at Los Maitenes as well as the impact area. Without damming, the debris flow barely reaches El Alfalfal by around 12:37. At that time it had already been observed 7–8 km downstream at Los Maitenes – impossible to reach in time with typical propagation speeds of about 4–5 km h−1 (not shown). The proposed damming time and breached water volume should serve as a first orientation to constrain the multi-stage debris-flow event, which we deem necessary for the late arrival at La Paloma camp.
The third aspect relates to the idealistic decision to deactivate deposition (i.e. a stopping criterion) for the simulation in CAL3. This was necessary to ensure arrival at Los Maitenes. Admittedly, the details of the stopping criterion could be adjusted as a remedy. However, we did not have a specific interest in the final deposition along the narrow Río Colorado for validation, as values there appear to be questionable (also see the next paragraph).
The fourth and last idealised aspect relates to the model resolution of 30 m. This resolution might well be adequate to describe the first phase of the debris flow until deposition and the damming of Río Colorado. There, the impact area is well resolved (Fig. 8). Yet further downstream, it is largely overestimated. The reason for this is that the impact area closely follows the river and its direct vicinity. In most of the river sections with a flat and wide valley floor, this area is, however, entirely occupied by the simulated debris flow. Along Estero Parraguirre, a resolution increase from 60 to 30 m was key to better reproducing the impact area (results not shown).
6.3 Overarching targets
The intention of our experimental design is not to put forward a best simulation that claims to represent the most realistic scenario of the Parraguirre debris flow. Our modelling efforts remain idealised and are limited both by observational evidence and the DEM resolution. Our main motivation is to scrutinise specific aspects of the event cascade relying on mass-flow modelling. Our experimental setup provides evidence to answer the following questions:
-
Is our trigger volume plausible? Here, DEM differencing suggests a trigger volume more than twice as large as previously assumed. A first line of support is that resultant simulated debris flow can be reconciled with the observed impact area. Second, a large trigger volume facilitates the closure of the water budget along Estero Parraguirre. Smaller trigger volumes require increasingly large entrainment along Estero Parraguirre to explain the total solid mass export.
-
Where did the important amount of floodwater come from? Another high-end estimate is proposed for the fluid flood volume from our analysis of the river gauge stations. Despite the idealistic character of the entrainment process in our simulations (Sect. 4.2), a realistic amount of water and solid material is exported from Estero Parraguirre. Primary water sources are glacier ice, soil water and snow cover. Water input from glaciers is mandatory to keep assumed soil-water saturation values in a realistic range. Our simulations therefore corroborate that water availability in the Estero Parraguirre catchment sufficed to explain the total monitored flood volume.
-
Was the Parraguirre debris flow a multi-stage event? Despite the first speculations from Hauser (2002), more robust evidence was missing for the damming hypothesis of Río Colorado. Our simulations offer a first remedy hinging upon the two available observations of arrival times (La Paloma, Los Maitenes). Assuming that these observations are dependable, our simulations show that on-time arrival at La Paloma is not reconcilable with the observed timing at Los Maitenes and vice versa. Temporal cessation and re-activation of the debris flow provide a simple and convincing explanation. Respective simulations can reproduce run-out distances and arrival times. Temporal damming of the deeply incised Río Colorado is further supported by locally observed deposition heights (Table 1; Casassa and Marangunic, 1993) and the immense solid material export from Estero Parraguirre.
-
Can observations of impact area and maximum flow heights be explained? Both quantities are overestimated in our simulations. The unknown release time after damming exerts the primary control on these quantities. Without damming, maximum flow heights of 17 and 18 m (Naranjo et al., 2001) and superelevation marks of 40 m (Casassa and Marangunic, 1993) can be well reproduced along Río Colorado upstream of La Paloma (Table 1). Yet the impact area remains overestimated, particularly along the incised valley of Río Colorado. In this regard the DEM resolution appears to be the main limitation.
Finally, we see several leads to further improve our best simulations in terms of reproducing timing and impact area. We suggest refined partitioning of the region with regard to friction and entrainment maps. Moreover, these final simulations did not include deposition. Therefore elevation changes further downvalley could not directly be considered for calibration and validation.
6.4 Mass movement and future challenges across the semi-arid Andes
The Parraguirre ice–rock avalanche was one of the most catastrophic events in the semi-arid region of Chile. While several other landslides have occurred in the area (Moreiras et al., 2021), none exhibited a magnitude comparable to that of the Parraguirre event. A smaller debris flow was detected in the La Difunta Correa catchment (30° S), near the Aguas Negras mountain pass. There, the seasonal snow and shallow ice within the active layer played a pivotal role (Vergara Dal Pont et al., 2020). The majority of other documented events in the region are linked to heavy precipitation during positive phases of El Niño–Southern Oscillation (ENSO) or the passage of prominent weather fronts.
Mass movements can have important consequences for the mountain environment and landscape, with direct impact on local communities. In a warming climate, the frequency and intensity of extreme weather events are likely to increase. The rising occurrence of heatwaves and warm spells is expected to alter mountain environments with regard to slope stability as well as to rock and debris mobilisation. For instance, mountain permafrost, one of the essential climate variables, has shown a marked decline due to global atmospheric warming (Chen et al., 2021). Occurring in a mountain permafrost region (Gruber, 2012), the Parraguirre ice–rock avalanche provides valuable information on the severe consequences of climate change in susceptible areas. The degradation of mountain permafrost is becoming a growing concern worldwide, as it directly affects local populations through increased hazard susceptibility (Chen et al., 2021).
The main motivation for this review of the 1987 Parraguirre rock avalanche on 29 November is threefold. First, meteorological and hydrological station data as well as atmospheric reanalysis products have become publicly available. Second, aerial images from within 2 weeks of the event shed new light on the debris-flow extent. Third, state-of-the-art mass-flow modelling tools can be employed to constrain the propagation of past multi-phase gravitational mass movements. Many of these records and methods were not available at the time of previous studies (Ugarte, 1988; Valenzuela and Varela, 1991; Casassa and Marangunic, 1993; Naranjo et al., 2001; Hauser, 2002). The combination of these methods allows us to better re-draw the debris-flow event from its initiation at 4200 m a.s.l. to its termination at 1100 m a.s.l. – about 50 km away from the source.
7.1 Debris-flow extent and volume
We present the first estimate of the total debris-flow volume of 54.1×10⁶ m3, including fluid and solid material. It comprises a solid portion of 38.1×10⁶ m3 exported from Estero Parraguirre and a fluid volume of 16.0×10⁶ m3. The latter presents a significant upward correction of the mobilised flood volume. For closure of the water budget, entrainment of glacier ice is paramount. Another notable upward correction is for the trigger volume, amounting to 17.0×10⁶ m3. Lastly, the full areal extent could be delineated and covers 12.1 km2.
7.2 Multi-stage debris-flow propagation
Our model simulations strongly suggest that the event history has to be rewritten. Observed arrival times can only be reconciled by assuming temporary damming of Río Colorado. This hypothesis was first put forward by Hauser (2002) and is finally corroborated by multi-phase mass-flow modelling. The limited 30 m DEM resolution inhibits, however, accurate reproduction of the impact area as well as of observations of maximum flow heights.
7.3 Meteorological preconditioning
In situ station data and climate reanalysis independently indicate the extraordinary atmospheric conditions in 1987, with significantly elevated snow depths and unusually long and pronounced warm spells in spring – also during the days preceding the event. Monthly temperature anomalies and snow extent caused melt magnitudes that are consistent with the elevated river runoff observed at Río Colorado. Resultant soil-water saturation preconditioned the high mobility of the debris flow, and we therefore propose that the Parraguirre ice–rock avalanche was a meteorological compound event.
7.4 Outlook
Finally, the Parraguirre debris-flow event provides valuable insights for future landslide hazard assessments. Operational warning services need to account for the longer-term meteorological preconditioning. The seasonal snowfall build-up and the sudden and intense melting were crucial for both the initiation and the high flow mobility. Moreover, temporary river damming – although adding minimal extra water – can be an effective catalyser for the destructive power of debris flows. River confluences and valley junctions in the vicinity of potential trigger sites in the headwaters of river networks deeply incised in steep mountain topography therefore require particular attention in hazard assessments.
The r.avaflow code, including a detailed manual, is available for download at https://www.avaflow.org/ (Mergili and Pudasaini, 2024).
Analysis and simulation data can be acquired on request from the corresponding author. Input data are either publicly available or under copyright. In the following, we point the interested reader to the respective data holders and pertinent repositories.
Publicly available data sets are available as follows: ERA5 data are available from the Copernicus Climate Data Store (https://doi.org/10.24381/cds.adbb2d47, Hersbach et al., 2023). Weather-station, gauge-station and snow-height data are freely distributed via open repositories administered by the “Dirección Meteorológica de Chile”, being integrated in the “Dirección General De Aeronáutica Civil” (DGAC) and the “Dirección General de Aguas” (DGA) as part of the “Ministerio de Obras Públicas” (MOP) of Chile. Three overview data portals – https://www.arcgis.com/apps/OnePane/basicviewer/index.html?appid=d508beb3a88f43d28c17a8ec9fac5ef0 (last access: 3 September 2025), https://mapas2.mop.gob.cl (last access: 3 September 2025) and https://climatologia.meteochile.gob.cl/application/informacion/buscadorEstaciones (last access: 3 September 2025) – give information on station locations and operational details. Specific variables can be retrieved from the https://snia.mop.gob.cl/dgasat/pages/dgasat_main/dgasat_main.htm (last access: 3 September 2025) and https://snia.mop.gob.cl/BNAConsultas/reportes (last access: 3 September 2025) data sets.
Proprietary data sets are available as follows: historical elevation models are administered by and can be requested or purchased from the Geographical Military Institute (IGM) of Chile. The aerial imagery used in this study was provided on request from the “Servicio Aerofotogramétrico” (https://www.saf.cl/, last access: 3 September 2025) of the Chilean Air Force.
The supplement related to this article is available online at https://doi.org/10.5194/nhess-25-3559-2025-supplement.
DF-B had the idea to overhaul the history of the Parraguirre event. JJF and DF-B designed the study together. Aerial imagery was analysed and processed by DF-B to infer the impact area and elevation changes. TB and DF-B conducted the first experiments with r.avaflow, which were subsequently refined in the following aspects by JJF: resolution increase, domain extension, calibration strategy and damming experiments. The analysis of climatic conditions was led by LS and supported by DF-B, TB and JJF. Hydrological observations were compiled and assessed by JJF. SM and HP supported the overall analysis with their long track record of expertise in mountain hydrology and mountain hazards of the capital region of Chile. All authors contributed to the interpretation of the results and to the writing of the manuscript, both under the coordination of JJF and DF-B.
The contact author has declared that none of the authors has any competing interests.
Neither the European Commission nor ECMWF is responsible for any use that may be made of the Copernicus Climate Change Service information or data it contains.
Publisher’s note: Copernicus Publications remains neutral with regard to jurisdictional claims made in the text, published maps, institutional affiliations, or any other geographical representation in this paper. While Copernicus Publications makes every effort to include appropriate place names, the final responsibility lies with the authors.
The main author Johannes J. Fürst received primary funding from the European Union's Horizon 2020 research and innovation programme via the European Research Council (ERC) as a Starting Grant (FRAGILE project) under grant agreement no. 948290. David Farías-Barahona was funded by the MAGIC project financed by the German Research Foundation (DFG) within the MAGIC and ITERATE projects (FU1032/5-1, BR2105/28-1, FU1032/12-1) as well as the Programa Postdoctorado, VRID Universidad de Concepción, ANID Subvención a la instalación a la academia 2022 (PAI85220007) and Fondecyt 3230146. Lucia Scaff acknowledges the Anillos de Investigación en Areas Temáticas, Cold-Blooded: Drivers of Climate Change Refugia for Glaciers and Streamflow Responses, ACT-210080. Lucia Scaff also acknowledges the support of the supercomputing infrastructure of the NLHPC (CCSS210001) to develop this research, Powered@NLHPC. Santiago Montserrat acknowledges financial support from ANID-PIA Project AFB230001 (AMTC). Moreover, we greatly acknowledge the Geographical Military Institute (IGM) of Chile and the “Servicio Aerofotogramétrico” for historical maps and aerial photographs, respectively. The results contain modified Copernicus Climate Change Service (C3S) information. Finally, the authors gratefully acknowledge the scientific support and HPC resources provided by the Erlangen National High Performance Computing Center (NHR@FAU) of the Friedrich-Alexander-Universität Erlangen-Nürnberg (FAU). The hardware is funded by the German Research Foundation (DFG).
This research has been supported by the H2020 European Research Council (grant no. 948290), the Deutsche Forschungsgemeinschaft (grant nos. FU1032/5-1, BR2105/28-1 and FU1032/12-1), the Agencia Nacional de Investigación y Desarrollo (grant nos. PAI85220007, ACT210080, CCSS210001 and AFB230001) and the Fondo Nacional de Desarrollo Científico y Tecnológico (grant no. 3230146).
This paper was edited by Bayes Ahmed and reviewed by three anonymous referees.
Ambrus, J.: Guía de los Andes Centrales, Parte X - Zona de las Lagunas, Obra inédita, p. 10, https://doi.org/10.1029/2009JF001405, 1967. a
Biskaborn, B., Smith, S., Noetzli, J., Matthes, H., Vieira, G., Streletskiy, D., Schoeneich, P., Romanovsky, V., Lewkowicz, A., Abramov, A., Allard, M., Boike, J., Cable, W., Christiansen, H., Delaloye, R., Diekmann, B., Drozdov, D., Etzelmüller, B., Grosse, G., Guglielmin, M., Ingeman-Nielsen, T., Isaksen, K., Ishikawa, M., Johansson, M., Johannsson, H., Joo, A., Kaverin, D., Kholodov, A., Konstantinov, P., Kröger, T., Lambiel, C., Lanckman, J., Luo, D., Malkova, G., Meiklejohn, I., Moskalenko, N., Oliva, M., Phillips, M., Ramos, M., Sannel, A., Sergeev, D., Seybold, C., Skryabin, P., Vasiliev, A., Wu, Q., Yoshikawa, K., Zheleznyak, M., and Lantuit, H.: Permafrost is warming at a global scale, Nat. Commun., 110, 264, https://doi.org/10.1038/s41467-018-08240-4, 2019. a
Bronfman, N., Repetto, P., Guerrero, N., Neda, J. C., and Cisternas, P.: Temporal evolution in social vulnerability to natural hazards in Chile, Nat. Hazards, 107, 1757–1784, https://doi.org/10.1007/s11069-021-04657-1, 2021. a
Casassa, G. and Marangunic, C.: The Río Colorado rockslide and debris flow, Central Andes, Chile, Bulletin of the Association of Engineering Geologists, 30, 321–330, 1993. a, b, c, d, e, f, g, h, i, j, k, l, m, n, o, p, q, r, s, t, u, v, w
Chen, D., Rojas, M., Samset, B., Cobb, K., Diongue Niang, A., Edwards, P., Emori, S., Faria, S., Hawkins, E., Hope, P., Huybrechts, P., Meinshausen, M., Mustafa, S., Plattner, G.-K., and Tréguier, A.-M.: Framing, Context, and Methods, in: Climate Change 2021: The Physical Science Basis. Contribution of Working Group I to the Sixth Assessment Report of the Intergovernmental Panel on Climate Change, edited by: Masson-Delmotte, V., Zhai, P., Pirani, A., Connors, S. L., Péan, C., Berger, S., Caud, N., Chen, Y., Goldfarb, L., Gomis, M. I., Huang, M., Leitzell, K., Lonnoy, E., Matthews, J. B. R., Maycock, T. K., Waterfield, T., Yelekçi, O., Yu, R., and Zhou, B., 147–286, IF-2018-23356401-APN-DNGAAYEA#MAD, Cambridge University Press, Cambridge, United Kingdom and New York, NY, USA, https://doi.org/10.1017/9781009157896.003, 2021. a, b
Eisenberg, A. and Pardo, M.: Report on seismic activity related to debris flow, Estero Parraguirre, Central Chile, Scientific Event Alert Network Bulletin, 13, 15–16, 1988. a, b, c, d
Farías-Barahona, D., Vivero, S., Casassa, G., Schaefer, M., Burger, F., Seehaus, T., Iribarren-Anacona, P., Escobar, F., and Braun, M.: Geodetic Mass Balances and Area Changes of Echaurren Norte Glacier (Central Andes, Chile) between 1955 and 2015, Remote Sens., 11, 260, https://doi.org/10.3390/rs11030260, 2019. a
Farías-Barahona, D., Wilson, R., Bravo, C., Vivero, S., Caro, A., Shaw, T., Casassa, G., Ayala, A., Mejías, A., Harrison, S., Glasser, N., McPhee, J., Wündrich, O., and Braun, M.: A near 90-year record of the evolution of El Morado Glacier and its proglacial lake, Central Chilean Andes, J. Glaciol., 66, 846–860, https://doi.org/10.1017/jog.2020.52, 2020. a
Formetta, G., Capparelli, G., and Versace, P.: Evaluating performance of simplified physically based models for shallow landslide susceptibility, Hydrol. Earth Syst. Sci., 20, 4585–4603, https://doi.org/10.5194/hess-20-4585-2016, 2016. a
Gariano, S. and Guzzetti, F.: Landslides in a changing climate, Earth-Sci. Rev., 162, 227–252, https://doi.org/10.1016/j.earscirev.2016.08.011, 2016. a
Gruber, S.: Derivation and analysis of a high-resolution estimate of global permafrost zonation, The Cryosphere, 6, 221–233, https://doi.org/10.5194/tc-6-221-2012, 2012. a
Gruber, S. and Haeberli, W.: Permafrost in steep bedrock slopes and its temperature-related destabilization following climate change, J. Geophys. Res.-Earth, 112, F02S18, https://doi.org/10.1029/2006JF000547, 2007. a
Gupta, S., Lehmann, P., Bickel, S., Bonetti, S., and Or, D.: Global Mapping of Potential and Climatic Plant-Available Soil Water, J. Ad. Model. Earth Sy., 15, e2022MS003277, https://doi.org/10.1029/2022MS003277, 2023. a
Hauser, A.: Rock avalanche and resulting debris flow in Estero Parraguirre and Río Colorado, Region Metropolitana, Chile, in: Catastrophic Landslides: Effects, Occurrence, and Mechanisms, edited by: Evans. S. G. and Degraff, J. V., Geological Society of America Reviews in Engineering Geology, 15, 135–148, 2002. a, b, c, d, e, f, g, h, i, j, k, l, m, n, o, p, q, r, s, t
Hersbach, H., Bell, B., Berrisford, P., Hirahara, S., Horányi, A., Muñoz Sabater, J., Nicolas, J., Peubey, C., Radu, R., Schepers, D., Simmons, A., Soci, C., Abdalla, S., Abellan, X., Balsamo, G., Bechtold, P., Biavati, G., Bidlot, J., Bonavita, M., De Chiara, G., Dahlgren, P., Dee, D., Diamantakis, M., Dragani, R., Flemming, J., Forbes, R., Fuentes, M., Geer, A., Haimberger, L., Healy, S., Hogan, R. J., Hólm, E., Janisková, M., Keeley, S., Laloyaux, P., Lopez, P., Lupu, C., Radnoti, G., de Rosnay, P., Rozum, I., Vamborg, F., Villaume, S., and Thépaut, J.-N.: The ERA5 global reanalysis, Q. J. Roy. Meteor. Soc., 146, 1999–2049, https://doi.org/10.1002/qj.3803, 2020. a
Hersbach, H., Bell, B., Berrisford, P., Biavati, G., Horányi, A., Muñoz Sabater, J., Nicolas, J., Peubey, C., Radu, R., Rozum, I., Schepers, D., Simmons, A., Soci, C., Dee, D., and Thépaut, J.-N.: ERA5 hourly data on single levels from 1940 to present, Copernicus Climate Change Service (C3S) Climate Data Store (CDS) [data set], https://doi.org/10.24381/cds.adbb2d47, 2023. a
Huggel, C., Khabarov, N., Korup, O., and Obersteiner, M.: Physical impacts of climate change on landslide occurrence and related adaptation, 121–133, Cambridge University Press, https://doi.org/10.5167/uzh-68356, 2012. a
Hungr, O.: Classification and terminology, in: Debris-flow Hazards and Related Phenomena, Springer Praxis Books, Springer, Berlin, Heidelberg, ISBN 10.1007/3-540-27129-5_2, 2005. a
Hungr, O., Evans, S., Bovis, M., and Hutchinson, J.: A review of the classification of landslides of the flow type, Environ. Eng. Geosci., 7, 221–238, https://doi.org/10.2113/gseegeosci.7.3.221, 2001. a
Iribarren Anacona, P., Norton, K., Mackintosh, A., Escobar, F., Allen, S., Mazzorana, B., and Schaefer, M.: Dynamics of an outburst flood originating from a small and high-altitude glacier in the Arid Andes of Chile, Nat. Hazards, 94, 93–119, https://doi.org/10.1007/s11069-018-3376-y, 2018. a
Kargel, J. S., Leonard, G. J., Shugar, D. H., Haritashya, U. K., Bevington, A., Fielding, E. J., Fujita, K., Geertsema, M., Miles, E. S., Steiner, J., Anderson, E., Bajracharya, S., Bawden, G. W., Breashears, D. F., Byers, A., Collins, B., Dhital, M. R., Donnellan, A., Evans, T. L., Geai, M. L., Glasscoe, M. T., Green, D., Gurung, D. R., Heijenk, R., Hilborn, A., Hudnut, K., Huyck, C., Immerzeel, W. W., Liming, J., Jibson, R., Kääb, A., Khanal, N. R., Kirschbaum, D., Kraaijenbrink, P. D. A., Lamsal, D., Shiyin, L., Mingyang, L., McKinney, D., Nahirnick, N. K., Zhuotong, N., Ojha, S., Olsenholler, J., Painter, T. H., Pleasants, M., Pratima, K. C., Yuan, Q. I., Raup, B. H., Regmi, D., Rounce, D. R., Sakai, A., Donghui, S., Shea, J. M., Shrestha, A. B., Shukla, A., Stumm, D., van der Kooij, M., Voss, K., Xin, W., Weihs, B., Wolfe, D., Lizong, W., Xiaojun, Y., Yoder, M. R., and Young, N.: Geomorphic and geologic controls of geohazards induced by Nepal's 2015 Gorkha earthquake, Science, 351, aac8353, https://doi.org/10.1126/science.aac8353, 2016. a
Mergili, M. and Pudasaini, S.: r.avaflow – The mass flow simulation tool. r.avaflow 2.4 User manual (2014–2020), https://www.avaflow.org (last access: 3 September 2025), 2024. a
Mergili, M., Fischer, J.-T., Krenn, J., and Pudasaini, S. P.: r.avaflow v1, an advanced open-source computational framework for the propagation and interaction of two-phase mass flows, Geosci. Model Dev., 10, 553–569, https://doi.org/10.5194/gmd-10-553-2017, 2017. a, b, c, d
Mergili, M., Emmer, A., Juricová, A., Cochachin, A., Fischer, J., Huggel, C., and Pudasaini, S.: How well can we simulate complex hydro-geomorphic process chains? The 2012 multi-lake outburst flood in the Santa Cruz Valley (Cordillera Blanca, Perú), Earth Surf. Proc. Land., 43, 1373–1389, https://doi.org/10.1002/esp.4318, 2018a. a, b
Mergili, M., Frank, B., Fischer, J., Huggel, C., and Pudasaini, S.: Computational experiments on the 1962 and 1970 landslide events at Huascarán (Peru) with r.avaflow: Lessons learned for predictive mass flow simulations, Geomorphology, 322, 15–28, https://doi.org/10.1016/j.geomorph.2018.08.032, 2018b. a, b
Mergili, M., Pudasaini, S. P., Emmer, A., Fischer, J.-T., Cochachin, A., and Frey, H.: Reconstruction of the 1941 GLOF process chain at Lake Palcacocha (Cordillera Blanca, Peru), Hydrol. Earth Syst. Sci., 24, 93–114, https://doi.org/10.5194/hess-24-93-2020, 2020. a, b
Moreiras, S., Sepúlveda, S., Correas-González, M., Lauro, C., Vergara, I., Jeanneret, P., Junquera-Torrado, S., Cuevas, J., Maldonado, A., Antinao, J., and Lara, M.: Debris Flows Occurrence in the Semiarid Central Andes under Climate Change Scenario, Geosciences, 11, 43, https://doi.org/10.3390/geosciences11020043, 2021. a, b, c
Naranjo, J., Fernández, J., and Santiano, J.: Estudio de peligros de flujos de detritus en el area de el Alfalfal, cuenca del Rio Colorado, comuna San Jose de Maipo, Servicio Nacional de Geologia y Mineria, Santiago, Colección BSNGM 11237, https://catalogobiblioteca.sernageomin.cl/cgi-bin/koha/opac-detail.pl?biblionumber=271315&query_desc=kw%2Cwrdl%3A%20alfalfal, 2001. a, b, c, d, e, f, g
Nuth, C. and Kääb, A.: Co-registration and bias corrections of satellite elevation data sets for quantifying glacier thickness change, The Cryosphere, 5, 271–290, https://doi.org/10.5194/tc-5-271-2011, 2011. a
Peña, H. P. and Klohn, W.: Non-meteorological flood disasters in Chile, Proceedings, Technical Conference on the Hydrology of Disasters: Geneva, World Meteorological Organization, 243–258, https://doi.org/10.4324/9781315073583, 1988. a, b, c, d, e, f, g
Piderit, C.: Primera Ascensión al Monte Rabicano, Revista Andina No. 20, Club Andino de Chile, 7–14, https://www.andeshandbook.org/media/documents/Andina_N_20_1940_Mar.pdf, 1940. a
Pudasaini, S. and Mergili, M.: A multi-phase mass flow model, J. Geophys. Res.-Earth, 124, 2920–2942, https://doi.org/10.1029/2019JF005204, 2019. a
Rounce, D. R., Hock, R., Maussion, F., Hugonnet, R., Kochtitzky, W., Huss, M., Berthier, E., Brinkerhoff, D., Compagno, L., Copland, L., Farinotti, D., Menounos, B., and McNabb, R. W.: Global glacier change in the 21st century: Every increase in temperature matters., Science, 379, 78–83, https://doi.org/10.1126/science.abo1324, 2023. a
Sepúlveda, S., Rebolledo, S., and Vargas, G.: Recent catastrophic debris flows in Chile: Geological hazard, climatic relationships and human response, Quatern. Int., 158, 83–95, https://doi.org/10.1016/j.quaint.2006.05.031, 2006a. a
Sepúlveda, S., Rebolledo, S., Lara, M., and Padilla, C.: Landslide hazards in Santiago, Chile: An overview, International Association for Engineering Geology and the Environment, 105, https://media.geolsoc.org.uk/iaeg2006/ (last access: 3 September 2025), 2006b. a
Sepúlveda, S., Tobar, C., Rosales, V., Ochoa-Cornejo, F., and Lara, M.: Megalandslides and deglaciation: modelling of two case studies in the Central Andes, Nat. Hazards, 118, 1561–1572, https://doi.org/10.1007/s11069-023-06067-x, 2023. a
Stoffel, M., Allen, S., Ballesteros-Cánovas, J., Jakob, M., and Oakley, N.: Climate Change Effects on Debris Flows, in: Advances in Debris-flow Science and Practice, edited by: Jakob, M., McDougall, S., and Santi, P., Geoenvironmental Disaster Reduction, Springer, https://doi.org/10.1007/978-3-031-48691-3_10, 2024. a
Thackeray, C., Hall, A., Norris, J., and Chen, D.: Constraining the increased frequency of global precipitation extremes under warming, Nat. Clim. Change, 12, 441–448, https://doi.org/10.1038/s41558-022-01329-1, 2022. a
Ugarte, G.: Causas y efectos del aluvión en río Colorado, sector El Alfalfal: Santiago, Chile, Cámara Chilena de la Construcción, unpublished report, p. 56, 1988. a, b, c
Valenzuela, L. and Varela, J.: El Alfalfal rock fall and debris flow in Chilean Andes Mountains, Proceedings, Panamerican Conference on Soil Mechanics and Foundation Engineering, Vina del Mar, Chile, 1, 357–371, 1991. a, b, c, d, e, f
Varnes, D.: Slope Movement Types and Processes, in: Landslides, Analysis and Control, Transportation Research Board, edited by: Schuster, R. L. and Krizek, R. J., Special Report, 11–33, https://trid.trb.org/View/86168, 1978. a
Vergara Dal Pont, I., Moreiras, S. M., Santibañez Ossa, F., Araneo, D., and Ferrando, F.: Debris flows triggered from melt of seasonal snow and ice within the active layer in the semi-arid Andes, Permafrost Periglac., 31, 57–68, https://doi.org/10.1002/ppp.2020, 2020. a
Vilca, O., Mergili, M., Emmer, A., Frey, H., and Huggel, C.: The 2020 glacial lake outburst flood process chain at Lake Salkantaycocha (Cordillera Vilcabamba, Peru), Landslides, 18, 2211–2223, https://doi.org/10.1007/s10346-021-01670-0, 2021. a
Wang, Y., Hutter, K., and Pudasaini, S.: The Savage-Hutter theory: A system of partial differential equations for avalanche flows of snow, debris, and mud, J. Appl. Math. Mech., 84, 507–527, https://doi.org/10.1002/zamm.200310123, 2004. a
Zhang, Y., Schaap, M., and Zha, Y.: A high-resolution global map of soil hydraulic properties produced by a hierarchical parameterization of a physically based water retention model, Water Resour. Res., 54, 9774–9790, https://doi.org/10.1029/2018WR023539, 2018. a
Zscheischler, J., Martius, O., Westra, S., Bevacqua, E., Raymond, C., Horton, R., van den Hurk, B., AghaKouchak, A., Jézéquel, A., Mahecha, M., Maraun, D., Ramos, A., Ridder, N., Thiery, W., and Vignotto, E.: A typology of compound weather and climate event, Nat. Rev. Earth Environ., 1, 333–347, https://doi.org/10.1038/s43017-020-0060-z, 2020. a