the Creative Commons Attribution 4.0 License.
the Creative Commons Attribution 4.0 License.
 | 08 Sep 2025
Impacts of barrier-island breaching on mainland flooding during storm events applied to Moriches, New York
Robert Weiss
Jennifer L. Irish
Kyle Mandli
Barrier islands can protect the mainland from flooding during storms through reduction of storm surge and dissipation of storm-generated wave energy. However, the protective capability is reduced when barrier islands breach and a direct hydrodynamic connection between the water bodies on both sides of the barrier island is established. Breaching of barrier islands during large storm events is complicated, involving nonlinear processes that connect water, sediment transport, dune height, and island width, among other factors. In order to assess how barrier-island breaching impacts flooding on the mainland, we used a statistical approach to analyze the sensitivity of mainland storm surge to barrier-island breaching by randomizing the location, time, and extent of a breach event. We created a framework that allows breaching to develop during the course of a simulation and imposes a breach in an approximation of a Gaussian bell curve that deepens over time. We show that simulating a storm event and varying the size, location, and number of breaches in the barrier island that mainland storm surge and horizontal inundation is affected by breaching; total inundation has a logarithmic relationship with total breach area which tapers off after the entire island is removed. Breach location is also an important predictor of inundation and bay surge. The insights we have gleaned from this study can help prepare shoreline communities for the differing ways that breaching affects the mainland coastline. Understanding which mainland locations are vulnerable to breaching, planners and coastal engineers can design interventions to reduce the likelihood of a breach occurring in areas adjacent to high flood risk.
- Article
(6089 KB) - Full-text XML
- BibTeX
- EndNote


Barrier islands are long, shore-parallel, low-relief land masses that are adjacent to approximately 6.5 % of the world's coastlines (Oertel, 1985; Stutz and Pilkey, 2001). According to Oertel (1985) barrier-island systems consist of six sedimentary environments; proximity to the mainland, a back-barrier region (bay or lagoon), an inlet and inlet delta, the barrier island, the barrier platform, and the shoreface. Barrier islands are protective structures that help dissipate wave energy and storm surge approaching the mainland from the ocean. Barrier-island dunes that are higher than the approaching storm surge cause wave breaking, which reduces the impact of the surge when it reaches the back-barrier bay (Oertel, 1985; Irish et al., 2010). Vegetated low-lying dunes are more resistant to erosion and will absorb some of the seaward driven surge and wave energy. The dissipation of wave energy ensures that barrier islands undergo significant changes during storms and hurricanes, one of which is breaching. A breach is an opening in a narrow landmass, such as a barrier island, that allows a direct hydrodynamic connection between the ocean and the back-barrier bay or lagoon (Kraus, 2003; Wamsley and Kraus, 2005). Naturally occurring breaching is a complex process that involves the interaction of storm surge, waves, and their resulting overwash with barrier-island width, height, sediment characteristics, vegetation, and underlying geological structures. Storm forcing combined with local bathymetry is necessary to initiate the conditions that lead to breaching. Variations in storm size, intensity, and locale may cause breaches in some locations but not in others.
Large storms, such as hurricanes, can devastate barrier islands and the mainland coastline. One of the many hazards presented by such storms is storm surge, an abnormal rise in sea level driven by wind and atmospheric pressure changes. Storm surge that creates a water level gradient between the ocean and back-barrier region forces water to flow rapidly over the barrier island. This flow erodes sediment in an effort to equalize the water levels. The water level gradient involves a critical elevation of water that can cause significant erosion without inundating the island (Kraus et al., 2002; Kraus, 2003). Storm surge and wave setup increase water elevation in the ocean and the back-barrier region; these water levels along with wave action, reduce the stability of the barrier-island dune slope (Kraus, 2003; Kraus et al., 2002; Novak et al., 2024). However, wave attack alone, while weakening the dune slope, is unlikely to induce breaching because the net erosion is seaward and does not push erosion landward (Pierce, 1970).
During storm-induced overwash and inundation, water flowing across the island can scour a channel between the sea and the back-barrier region (Kraus, 2003; Pierce, 1970; Roelvink et al., 2009). This scouring requires strong flow and sustained inundation. Breaching can occur from both the seaward and landward side of the barrier island, but field data are limited in showing the direction of breach initiation (Kraus, 2003; Pierce, 1970; Smallegan and Irish, 2017). However, Smallegan and Irish (2017) show that bay surge following peak ocean surge is more likely to cause breaching from the landward side, as peak ocean surge already weakened the dune through erosion caused by wave attack and swash (Kraus, 2003; Smallegan and Irish, 2017). Identifying breach locations is challenging; localized lows for dune height and narrower portions of the island are more likely potential breach locations (Kraus, 2003; Kraus and Wamsley, 2003). One study by van der Lugt et al. (2019) simulated Hurricane Sandy (2012) using surge-tide levels, two-dimensional wave-spectra, and sediment transport to model barrier-island morphodynamics with pre-storm lidar bathymetric grids. The sediment transport model generated two breaches at peak erosion sites, but neither breach location matched the observed breach that opened during Hurricane Sandy (van der Lugt et al., 2019).
Studies focusing on coastal barrier morphodynamics during storms provide valuable insights into the erosion processes that can lead to breaching. Novak et al. (2024) demonstrate how the angle at which the storm surge and waves approach the island can exploit existing barrier vulnerabilities, resulting in extensive overwash deposits at the Paraíba do Sul River Delta Complex along the northern coast of Rio de Janeiro, Brazil. Their work emphasizes that vulnerability assessment must consider both event-scale storm characteristics and longer-term barrier evolution patterns, as areas weakened by previous storms or longer-term barrier morphological changes can create points along the barrier that are more vulnerable to breaching and overwash. Similarly, analysis of a large breach along the Trabucador Bar in Spain led researchers to develop an erosion susceptibility index for different portions of coastal barriers, which incorporates barrier height, width, and offshore bathymetry to identify locations vulnerable to overwash and breaching (Sánchez-Arcilla and Jiménez, 1994). However, such indices require calibration for specific barrier geometries and wave climates, limiting their transferability across different coastal systems. The distinction between overwash and breaching represents a critical threshold in barrier response to storms. Analysis of overwash deposits serves as a critical tool for understanding storm-sediment dynamics in regions where direct storm observations are limited (Soria et al., 2021; Novak et al., 2024; Zăinescu et al., 2019; Donnelly et al., 2006; Houser et al., 2008; Matias et al., 2008). While these morphodynamic studies improve our understanding of where breaching may occur, we are still limited in data of breaching during actual storm events.
Quantifying breach dimensions during hurricanes is challenging. While breach growth over time has been documented (Kraus and Wamsley, 2003; Schmeltz et al., 1982), these studies focus on days to months post-storm. Predicting breach locations and tracking their growth during a hurricane is not feasible. Lab and field experiments by Visser (1999) for breaches in dikes are useful but the breach is initiated with a pre-drilled hole in the dike and does not simulate exactly what occurs to barrier islands during storms. Buynevich and Donnelly (2006) performed geological mapping of some New England, USA, barrier islands and found geological signatures to indicate the islands' past history with breaching and overwash. Buynevich and Donnelly (2006) found ephemeral breaches with widths of 10–30 m before closing and breach depths of 1–3 m below the dune crest. Some post-storm surveys have defined breach sizes before natural or forced closing. Kraus and Wamsley (2003) discusses Pike's Inlet on Long Island, New York, USA, which was initially measured after the hurricane at 304.8 m wide and a nearby breach named Little Pike's Inlet was initially 30.48 m wide but over several months grew to over 914.4 m before it was closed. A breach near Moriches Inlet on Long Island studied by Schmeltz et al. (1982) had an initial size of 91.4 and 0.61 m depth. This breach expanded to 885 m with a depth of 3 m before it was mechanically closed. The uncertainties in breach dimensions and in where, how, and when breaches occur remains one of the many issues facing coastal communities today, due to the inability to predict or plan for the probable impacts of a breach forming where populations are highest.
Barrier islands are found along the coasts of 18 US states bordering the Atlantic Ocean and Gulf of Mexico (Zhang and Leatherman, 2011). As coastal populations have increased significantly in recent decades, the protective nature of barrier islands has become more crucial (Zhang and Leatherman, 2011). According to the US National Hurricane Center (NHC), storm surge is the leading cause of loss of life and property damage during hurricanes (National Hurricane Center, 2006). Storm surge can cause flooding that damages structures, closes roads, and disrupts coastal communities. It can also accelerate erosion on barrier islands and the mainland, increasing flood risk. Understanding how barrier-island breaching affects coastal flooding from storm surge is vital for risk assessment and mitigation. A hydrodynamic connection between the ocean and back-barrier region can lead to increased flooding and wave action during hurricanes, heightening risks to populations and property. However, there is little information on how different breach morphodynamics affect the mainland.
In this paper, we explore the different inundation patterns and surge depths at Moriches, New York, USA, for a storm that approximates the 1938 Hurricane. Using GeoClaw, software capable of modeling storm surge, we artificially alter the bathymetry of a barrier island during a storm simulation to create breaches in the barrier island (Mandli et al., 2016). This method removes the complexities of modeling the morphological processes driving breach formation so we can purely study the coastal response to these breaches. We randomized the number, width, and depth of these synthetic breaches to gain a statistical understanding of how these parameters influence coastal inundation and bay storm surge.
2.1 Study area – 1938 hurricane
Our study focuses on Moriches, NY, a section of the barrier island that spans Long Island, New York, USA, along the Atlantic Ocean. This region is heavily populated and is regularly impacted by storms, in particular, the 1938 hurricane caused extensive damage at Moriches, NY. The barrier island that runs roughly parallel to the mainland at Moriches Bay comprises two segments of a larger barrier-island system that is adjacent to the southern portion of Long Island, NY. Fire Island, the center island in this system, connects to Westhampton Beach via Moriches Inlet and is the region we are studying. This segment of the barrier system is approximately 20 km long with a width that varies from 0.25 to 0.50 km between the ocean and bay and has a dune height ranging from 0 to 9 m above mean sea level () (Leatherman, 1999; Cooperative Institute for Research in Environmental Sciences, 2021).
The 1938 Hurricane made landfall as a category 3 hurricane near Moriches, NY, on 21 September 1938. The maximum sustained wind speed recorded during this hurricane was 178 km h−1 at Blue Hill Observatory, MA (Brooks, 1939). The center of the storm passed over the western side of Great South Bay, less than 75 km from Moriches Bay. Figure 1 illustrates the location of Moriches Bay, NY, and the storm's location as it made landfall. The storm generated 10 breaches across the barrier-island system and caused widespread damage (Morang, 1999; Coch, 1994; Cañizares and Irish, 2008). The impact of this hurricane included 564 deaths, widespread flooding from both storm surge and high rainfall amounts, thousands of structures were damaged or destroyed and widespread power outages across southern New England (Vallee and Dion, 1997). Six breaches were opened during the hurricane at Moriches, NY, specifically, three each on either side of the inlet (Howard, 1939). Aerial photographic evidence illustrates that widespread breaching of the island occurred during the storm and described the breaches as widening of the original inlet which was opened in 1931 (Howard, 1939). These breaches were closed after the storm but the timeline and method for closure is unclear from the literature (Cañizares and Irish, 2008; Howard, 1939).
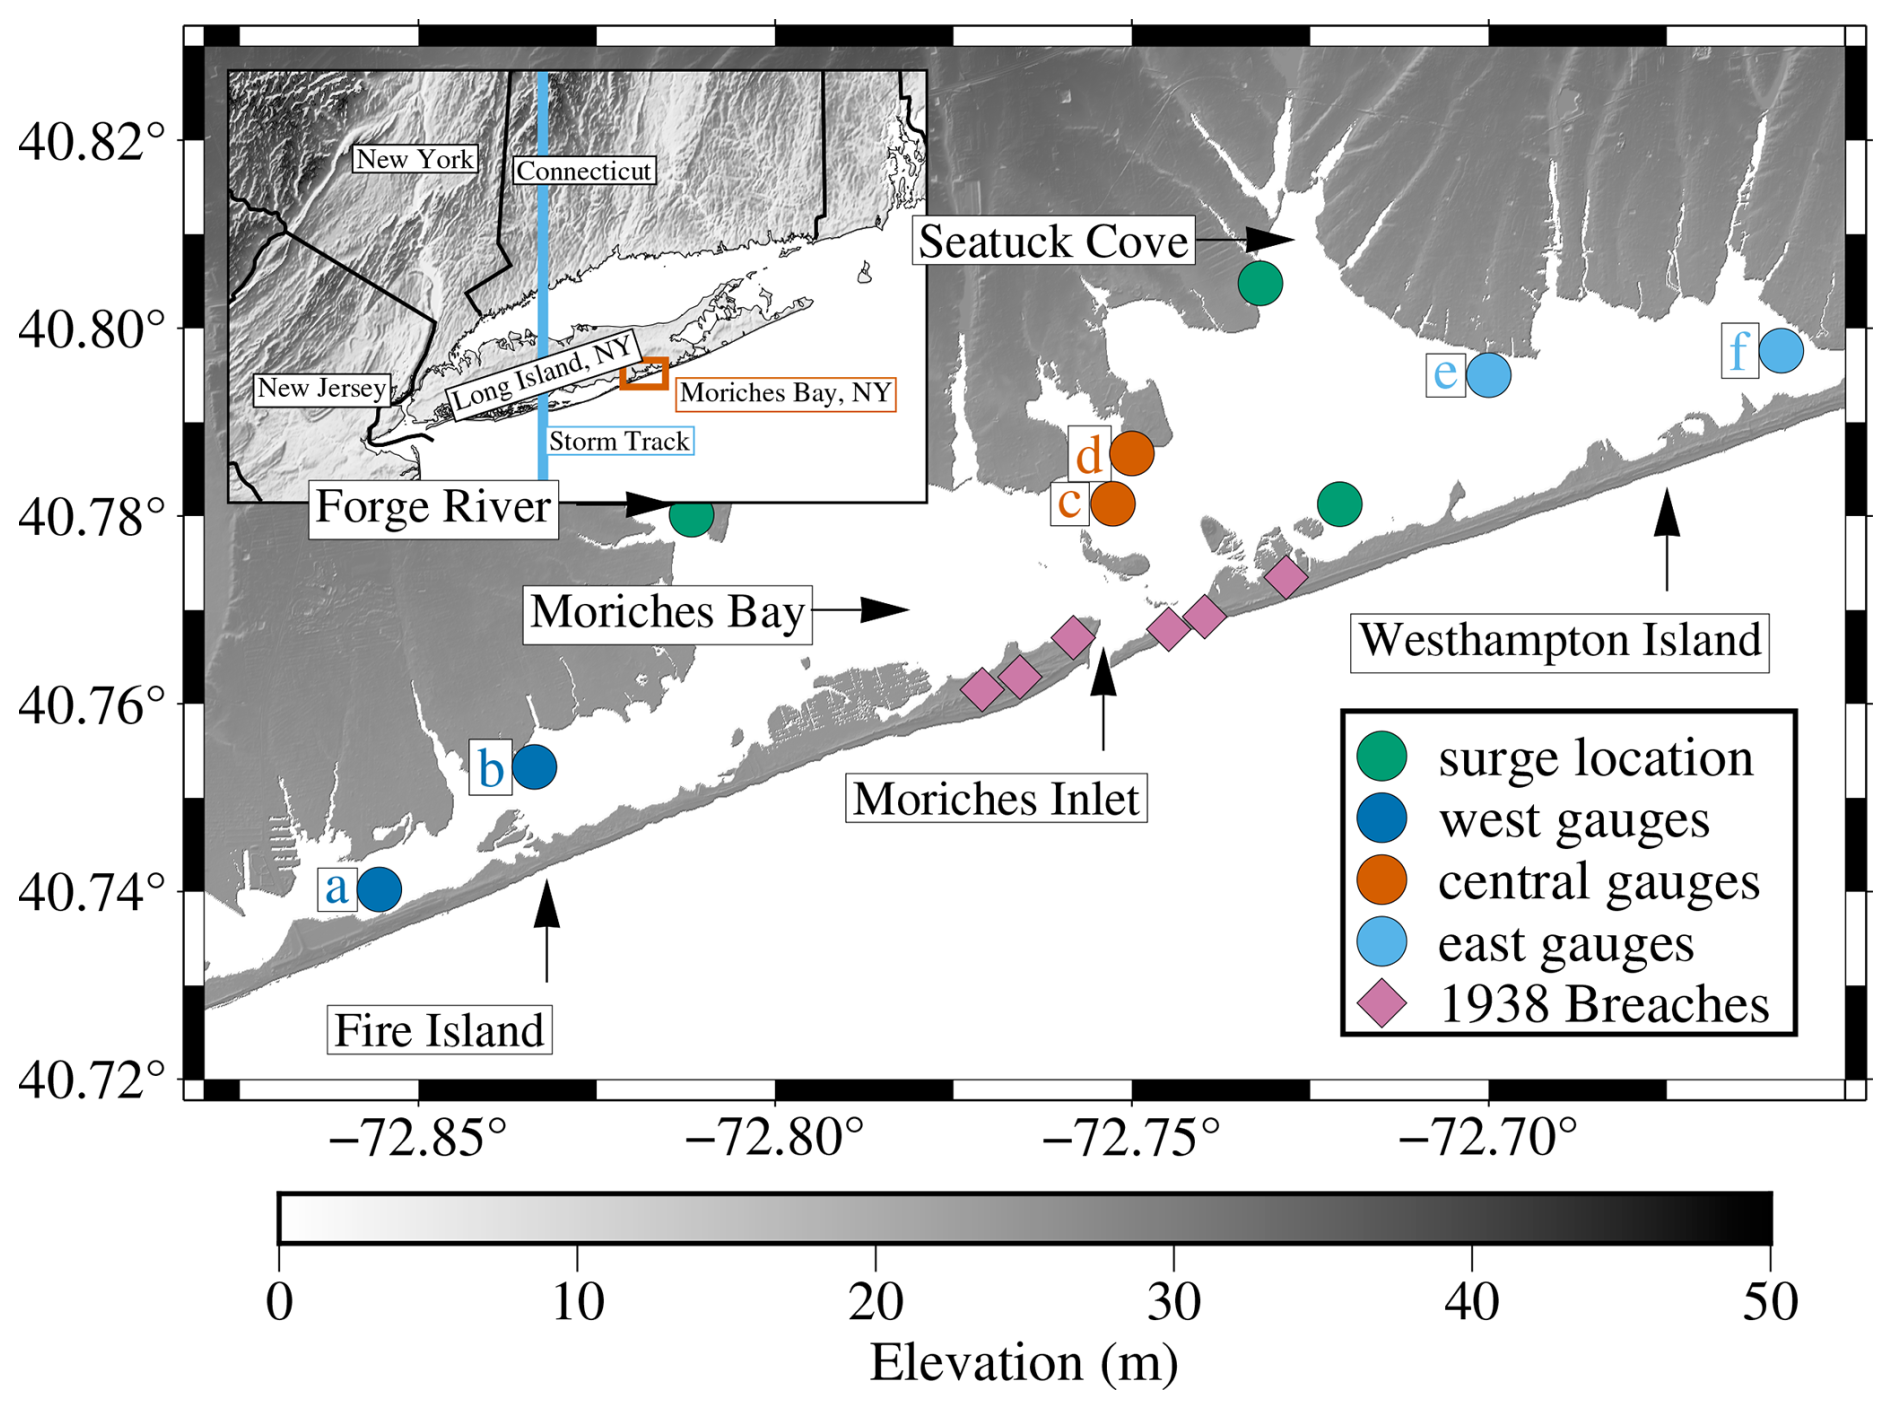
Figure 1Map of study area Moriches Bay, NY. Inset shows region surrounding Moriches Bay, NY (orange box). Storm track for the 1938 Hurricane (light blue line) and our simulated storm. Green circles are locations of surge measurements from Table 2. Remaining circles are locations of synthetic water level gauges illustrated in Fig. 4.
2.2 GeoClaw
Our goal for this study is to quantify the differences in coastal and bay flooding if breaching occurs during a hurricane. To simulate the storm, we used GeoClaw, a software package that solves depth-averaged fluid equations in one and two dimensions to model geophysical events (Clawpack Development Team, 2020; Mandli et al., 2016). GeoClaw employs adaptive mesh refinement (AMR) that allows for increasing resolution where and when it is needed, reducing computational overhead while providing an accurate solution (Berger et al., 2011). GeoClaw has been validated by the US National Tsunami Hazard Mitigation Program (NTHMP) for tsunami modeling. González et al. (2011) describes the benchmarking process used to validate GeoClaw.
Storm surge modeling with GeoClaw has been proposed to provide a robust but less computationally expensive model than the ADvanced CIRCulation model (ADCIRC), a commonly utilized finite-element model (Westerink et al., 2008; Mandli and Dawson, 2014; Bates et al., 2021). Mandli and Dawson (2014) compared GeoClaw with ADCIRC in a simulation of Hurricane Ike and verified the accuracy of the solution against in situ water level gauges that recorded data during the hurricane. GeoClaw calculates storm surge with a two-dimensional model averaged in depth that solves the shallow water equations with source terms for bathymetry, bottom friction, Coriolis forcing, surface pressure, and wind friction (see Mandli and Dawson, 2014 for further details). GeoClaw's default storm surge modeling does not provide tidal, riverine, or wave-stress calculations that are included in other models currently used in practice, such as ADCIRC (Westerink et al., 2008; Mandli and Dawson, 2014). For the purposes of solely studying the impact of breach dimensions and locations on the mainland flooding, we did not seek to add tidal or wave-induced surge to our simulations.
2.3 Storm forcing
The storm we used to simulate storm surge is a proxy for the 1938 New England Hurricane. The storm data were generated for the US Army Corps of Engineers (USACE) North Atlantic Comprehensive Coast Survey (NACCS) (Cialone et al., 2015; Nadal-Caraballo et al., 2015). The suite of synthetic tropical cyclones developed for the NACCS study were generated with a planetary bound layer (PBL) model that utilizes six storm parameters: the storm track, the heading direction, the central pressure deficit, the radius of max winds, and the translational speed. Each parameter was sampled from historical tropical cyclones from the National Oceanographic and Atmospheric Administration (NOAA) National Hurricane Center HURDAT2 (HURricane DATa 2nd generation) (Landsea and Franklin, 2013) database and then were used to generate probability distributions. The probability distributions provided combinations of parameters that were used as input to the PBL model, which calculated the wind and pressure data for use in simulations. These data were validated post simulation using several historical hurricanes and given an uncertainty of 0.39 m for the region covering New York and New Jersey (Nadal-Caraballo et al., 2015).
The storm forcing is provided by wind and pressure fields with data in 15 min increments and at 0.25° spatial resolution. GeoClaw's AMR algorithms require data to be integrated both temporally and spatially over the course of the simulation. This ensures that the solution evolves in space and time as the hurricane progresses (Mandli and Dawson, 2014; Berger et al., 2011). We utilized linear interpolation of the wind and pressure data between time steps calculated by GeoClaw's AMR module (Mandli and Dawson, 2014). To define the wind and pressure forcing inside the AMR grids, we employed bi-linear interpolation when and where required. The chosen storm has a track and intensity similar to that of the 1938 Hurricane. We verified the accuracy of the solution using a water level gauge (Station ID: 8531680) at Sandy Hook, NJ with data recorded from 1938 (Center for Operational Oceanographic Products and Services (CO-OPS), 2007). Figure 2 illustrates our validation of the storm forcing. The original data recorded during the hurricane are referenced to local of the time, with the tidal component removed. We adjusted the data upwards 0.239 m to match the modern datum used by NOAA (Center for Operational Oceanographic Products and Services (CO-OPS), 2007), accounting for sea-level rise at that station. Our synthetic water level gauge data are calculated with bathymetry that uses NAVD88 as the vertical datum, which is 0.073 m above the local for Sandy Hook. We reduced the synthetic gauge data to bring both the synthetic and original data to the same datum. As shown in Fig. 2 the water level from the simulation increases similarly to the recorded data, although the peak occurs 1.30 h earlier, with a 0.05 m difference from the recorded data. However, given the changes in local bathymetry since 1938, we feel confident this is a reasonable approximation of the 1938 Hurricane.
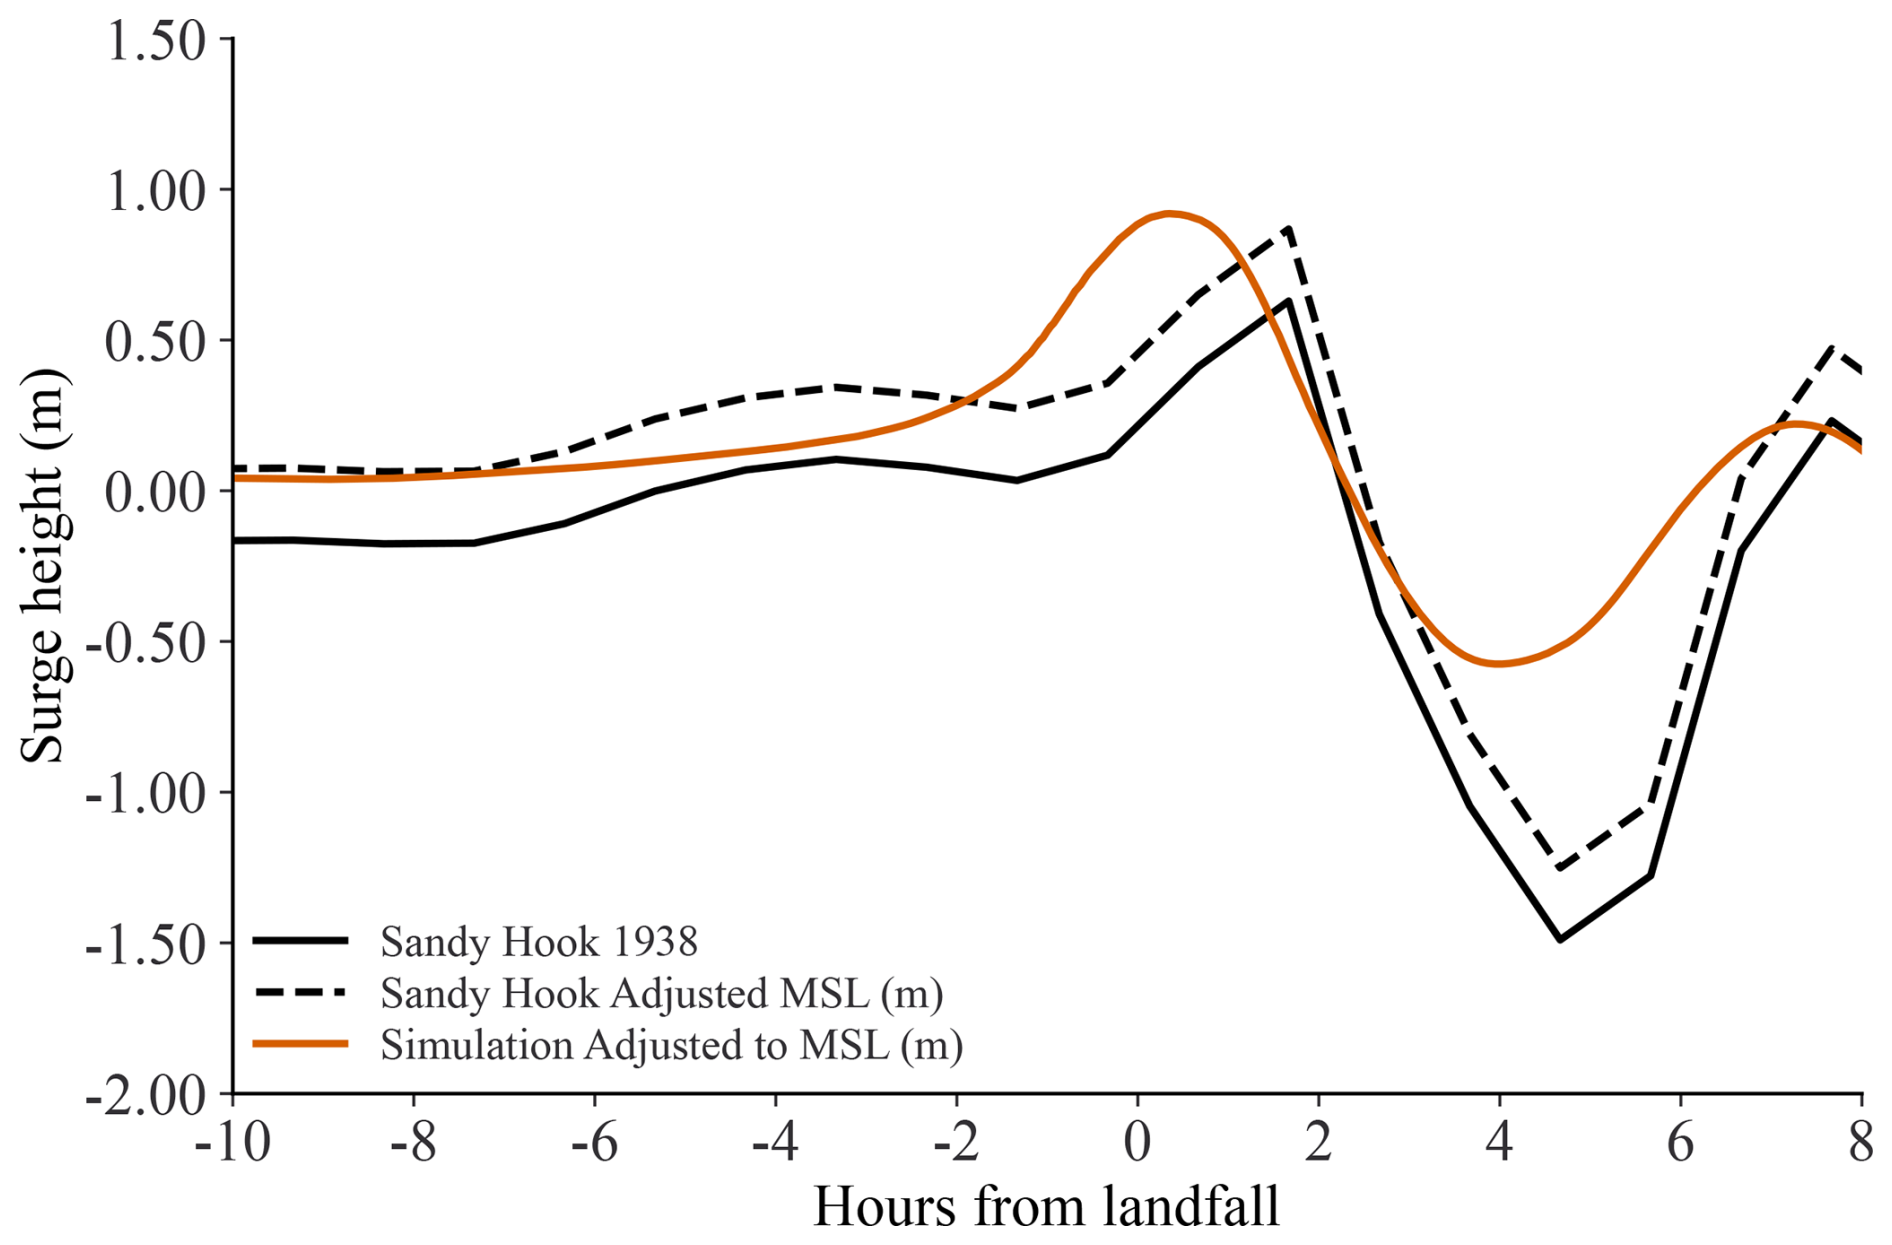
Figure 2NOAA water level gauge data from the 1938 hurricane compared with simulated water level gauge data at Sandy Hook, NJ. Black line is original data before adjusting for modern mean sea levels. Dotted black lines are the data adjusted 0.239 to match the datum used by NOAA. Orange line is the simulation output adjusted −0.073 for the difference between NAVD88 and local
The storm approached Long Island, NY, directly from the south. The track is illustrated with a blue line on the inset of Fig. 1. As the storm approached, storm surge seaward of the barrier island began to rise from southwest to northeast starting approximately 18 h before landfall. The timing of the peak ocean surge varies along the barrier island, with the peak occurring in the northeast approximately 10 min after the southwest, which occurred within minutes of landfall. Inside the bay, a local wind setup occurred from northeast to southwest before landfall. After peak surge, water was pushed into the southwest of the bay from Great South Bay. A small setdown then occurred 3 h after landfall as the storm continued north.
2.4 Breaching
Due to breaching's complex nature and the lack of studies that define breaching during hurricanes, we applied a simple framework to reduce dune height at specified locations that take the shape of a Gaussian function. During the storm simulation we apply Eq. (1) to reduce the height of the barrier island at a selected location, where dt is the height of the breach location at time t, X is the alongshore coordinate of the location being reduced, μ is the center of the breach location, and tT is a timing factor that controls how quickly the breach opens:
The timing factor for these simulations allows for the breach to open fully in an hour – after the experiments performed by Visser (1999). The calculation to reduce the dune height is controlled in the cross shore by the latitudes that are the transition between land and water for the bay and ocean. Figure 3 is a schematic to illustrate Eq. (1).
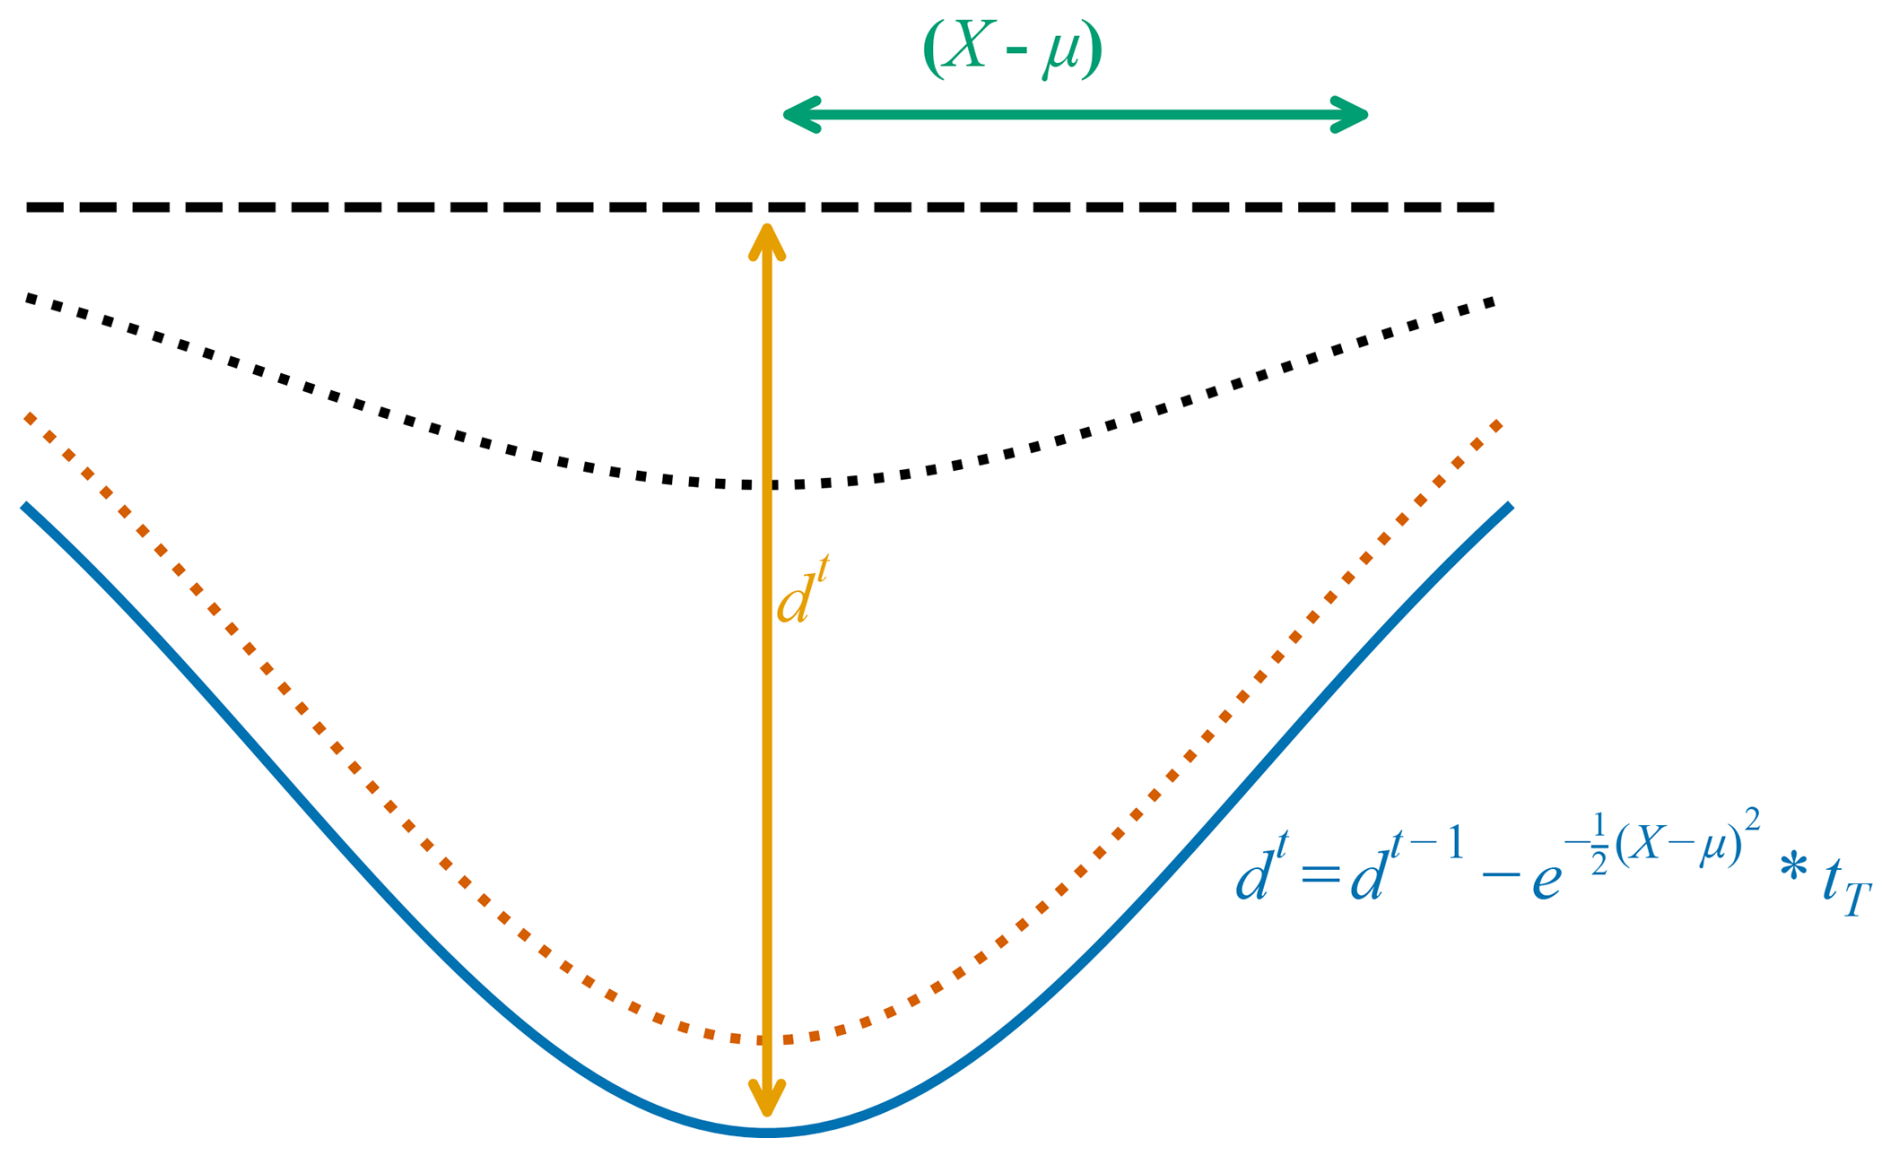
Figure 3Schematic of breach growth based on Eq. (1) (X−μ) is width of breach for each location lowered. dt is the total depth of the center of the breach. Black dashed line indicates original barrier height. Black dotted line indicates breach growth at an intermediate time t. Orange dotted line is breach growth at nearly final time t. Blue line is final breach.
2.5 Simulations
We used the GEBCO 30 arcsec (Weatherall et al., 2015) bathymetry for the region covering 98–57 ° W and 5–45 ° N with a maximum resolution of 6750 m. For Moriches, NY, we also used NOAA's continuously updated arcsec topobathy dataset (Cooperative Institute for Research in Environmental Sciences, 2021). We restricted GeoClaw's adaptive refinement for Moriches Bay and its adjacent barrier island to an 18 m×18 m grid, balancing resolution with computation time. The refinement begins well before the storm arrives to more accurately simulate the surge as it enters the bay. We placed synthetic water level gauges in the bay using the NACCS project maximum surge locations (Cialone et al., 2015) with additional gauges on the seaward side of the barrier every 2 km to verify nearshore surge height for breach initiation.
To create a baseline for quantifying the flooding and inundation changes in different simulations, we ran a no-breach scenario. This was necessary to observe how the storm impacts the barrier island, bay, and coastline in the absence of breaching. The water level gauges we placed in the bay and on the seaward side of the barrier island help discern differences in surge height and timing compared to the other simulations. A challenge of this study is that the barrier island at Moriches, NY, has undergone significant topographic and morphological changes since 1938. To ensure that the original breaches would open under these changed conditions we decided that a water level gauge near the seaward side of the island must record a water level that is a percentage of the modern dune height. The highest offshore water level recorded for all six breach locations was 24 % of the dune height, which we used as a criterion for identifying sites that could be breached throughout the barrier island.
Our simulations vary the width, depth, location, and number of breaches. For the first group of scenarios, we used the original breach locations formed during the 1938 Hurricane. We estimated the original breach dimensions from observations reported in Cañizares and Irish (2008) and references therein. The specified locations used a single longitude as a center point (μ) from Eq. (1). We used the latitudes that touch the bay and ocean directly north and south from μ. We created a Monte Carlo framework that employs a random, uniform distribution for each breach's width and depth. The initiation time for each breach was chosen using the no-breach simulation results for the nearest synthetic water level gauge seaward of the island. The first time the nearest water level gauge reached 24 % of the maximum dune height at each location was set as the breach initiation time. We chose to have the breaches fully open within 1 h after initiation.
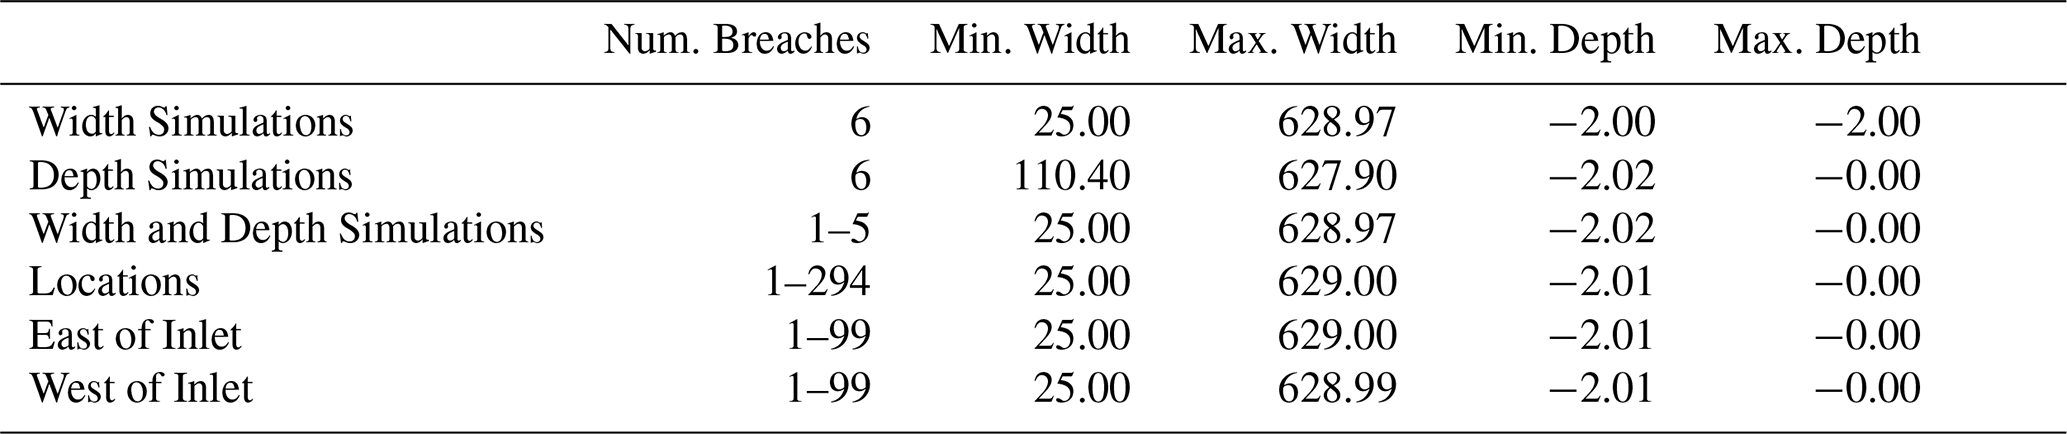
We created six broad categories of simulations as listed in Table 1, Width, Depth, Width and Depth, Locations, East of Inlet, and West of Inlet. In Width we randomized the width of the breaches, held the depth at 2 m below , and used the original six breach locations from the 1938 Hurricane. Each breach used boundary values between 25 and 630 m, reflecting the few details on initial breach size found in the literature (Schmeltz et al., 1982; Kraus and Wamsley, 2003; Visser, 1999; Cañizares and Irish, 2008). For the Depth simulations we kept the 1938 breach width estimates and varied depths between 0 and 2 m below In Width and Depth we randomized both dimensions and varied the number of breaches from one to five, with each breach at one of the original locations randomly chosen. The Location, East of Inlet, and West of Inlet categories varied all breach parameters, including the number, dimensions, and locations of breaches. Our Monte Carlo framework selected alongshore coordinates from a full list for the Location category, while for the East and West categories, we restricted breach locations to sections on either side of the inlet. After selecting the alongshore coordinate our algorithm verified that the maximum surge height at the nearest ocean gauge reached 24 % of the dune height. If no gauges within 2 km met that threshold, a new location was chosen. This ensures a reasonable estimate of breach-inducing conditions, as locations where the offshore water levels do not reach that critical elevation are unlikely to breach. We constrained the maximum number of breaches using a nearshore surge height of 24 % of the dune height, identifying up to 295 viable breach locations along the island. This high number compared to the six original breaches from 1938 underscores the nonlinearity and stochastic nature of breaching processes. For the East and West simulations, we limited breaches to fewer than 100 per section.
Table 1Breach input data for the 1900 simulations for our study. Each category of simulation's widths and depths were chosen by Monte Carlo methods using a random uniform distribution between endpoints identified from literature.
2.6 Data analysis
We evaluated our results using the total horizontal inundation along the mainland coastline and the maximum surge height data recorded by GeoClaw for the entire bay, at specific points within the bay (green circles in Fig. 1), and the surge time series generated at select synthetic water level gauges (blue and orange circles on Fig. 1).
2.6.1 Water level gauges
GeoClaw records time-series data from synthetic water level gauges at 5 min intervals during the storm simulation. We gathered data from these gauges for each portion of the bay and calculated the mean, median, 5th, and 95th percentiles for each simulation category to visualize trends in surge timing and location. These data allowed us to observe local changes, such as wind setup and setdown where each water level gauge is located.
2.6.2 Inundation
We calculated inundation differences by first identifying the grid cells above in the bathymetry (dry cells) that were inundated (wet cells) in our baseline no-breach scenario. We used these wet cells to identify inundation changes for each simulation. The changes in wet cells from our baseline scenario allowed us to see differences in inundation directly caused by island breaching. Each cell covers 324 m2 (18 m×18 m). We used GeoClaw's fgmax functionality, which tracks and updates the maximum surge in each cell until it reaches a peak. Unlike synthetic water level gauge data, these maximum surge and inundation values are snapshots in time and do not allow for dynamic analysis.
2.6.3 Bay surge
We divided the bay into three sections (west, central, and east) and used our recorded maximum surge data to create surge distributions for each section by simulation category. We also analyzed the overall maximum surge for each bay section and generated maps that illustrate the flooding patterns across the entire region.
We analyzed surge height and timing using synthetic water level gauges at specific bay locations. We divided the bay into three approximately equal longitudinal sections with two randomly chosen water level gauges per section shown as lettered circles in Fig. 1. Figure 4 presents these results showing the mean (solid lines), median (dashed lines) and 5th-95th percentiles (shaded areas) for each simulation category at each gauge location.
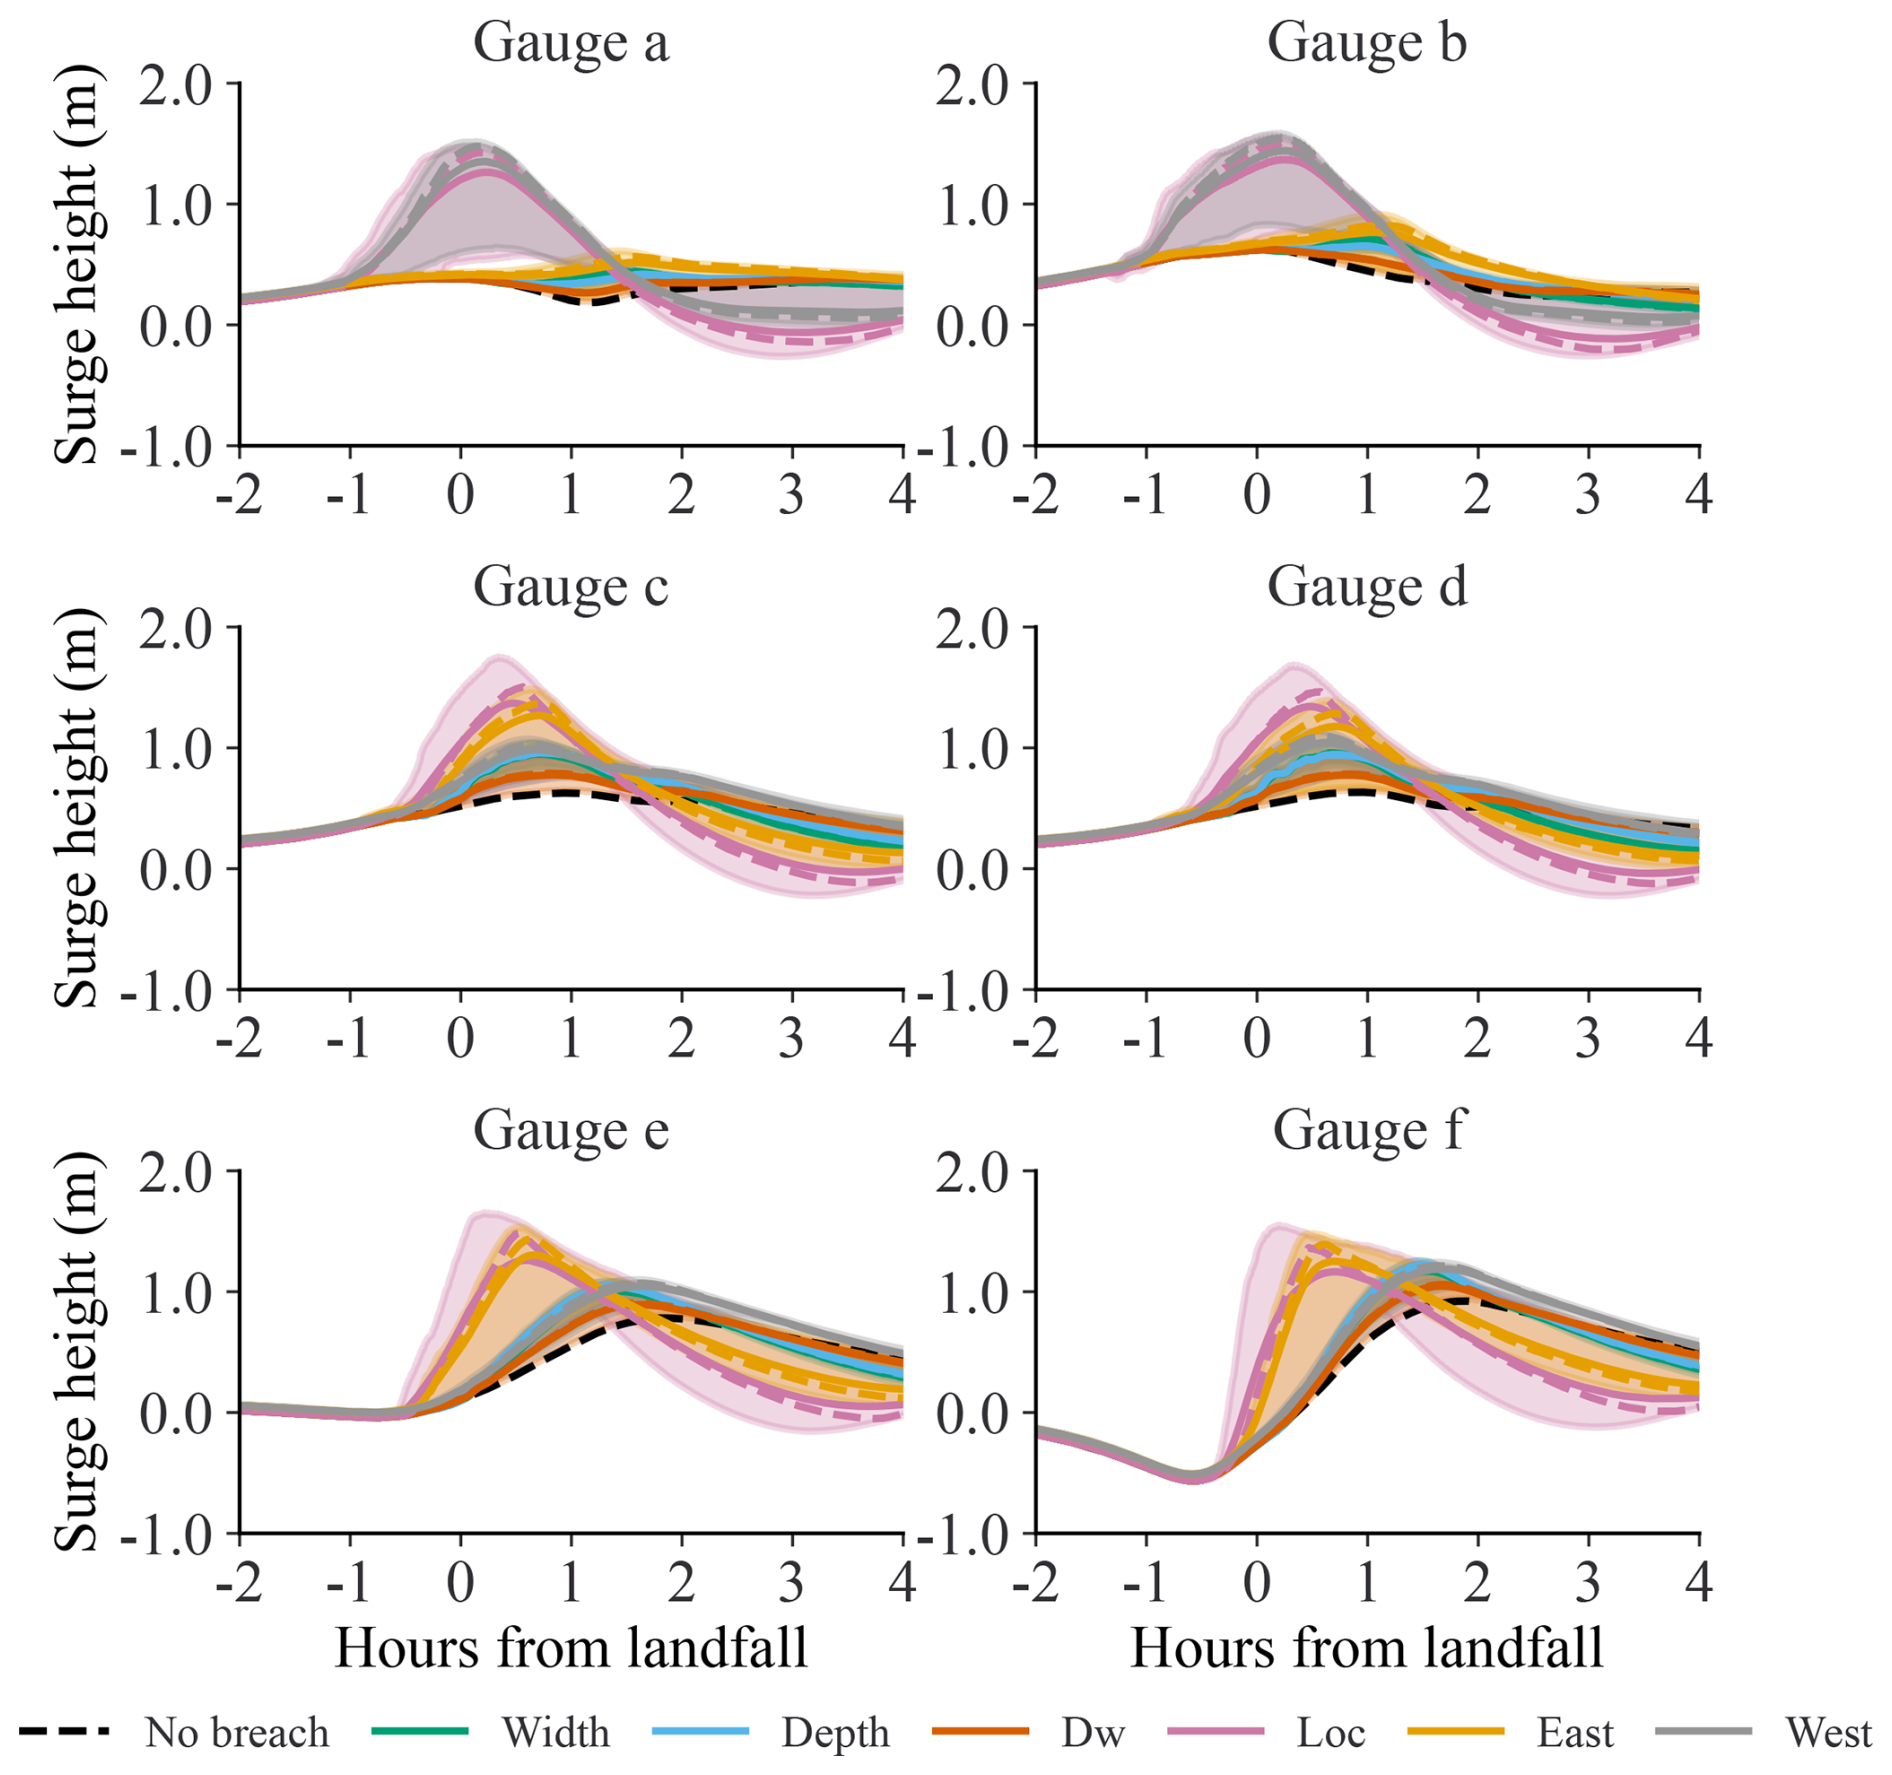
Figure 4Synthetic water level gauges for each section of the bay. See Fig. 1 for locations. Each dark line is the mean of all of the simulations in that category, the dotted lines in each color represent the median of that category. Each shaded area covers the 5th–95th percentile of the category.
In all three bay sections, the peak surge arrives earliest in the Location scenarios, followed by the West scenarios in the west segment and the East scenarios in the central and east segments. The peak surge arrival time for each scenario and gauge is listed in Table 2. With the exception of the Width and Depth scenarios for Gauge b the Location surge arrives first. The Location surge is also larger for all gauges as seen in Fig. 4. In the west portion of the bay the Location and West of Inlet scenarios have similar maximum surge. Last, the maximum surge recorded by the eastern gauges is more consistent across all scenarios. In all cases the breaching simulations differ from the no-breach case.
Table 2Peak surge arrival time in minutes from landfall for each synthetic water level gauge in Fig. 1 for each category of simulation.
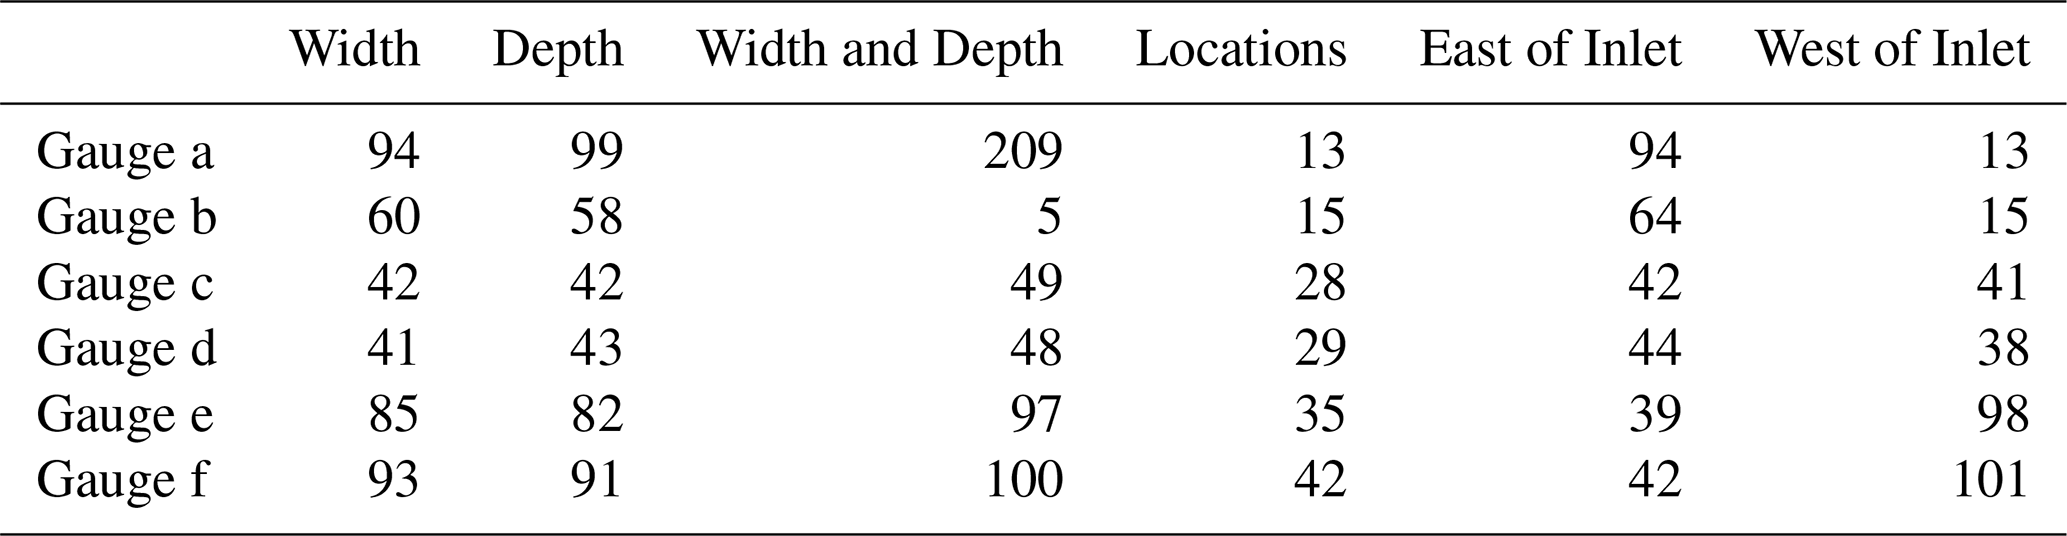
Table 3 lists a comparison of the L2 norms for the water level differences across gauge locations. To highlight the magnitude of variability in simulation category we calculated the differences between the 5th and 95th percentiles. The Width and Depth simulations showed the least variability in the west segment, while the Location simulations have the greatest variability across all gauge locations. The East of Inlet and West of Inlet water levels exhibit the least variability in the regions opposite the breaches.
Table 3Comparison of L2 norms representing the differences in water level percentiles (5th and 95th) across different gauge locations.
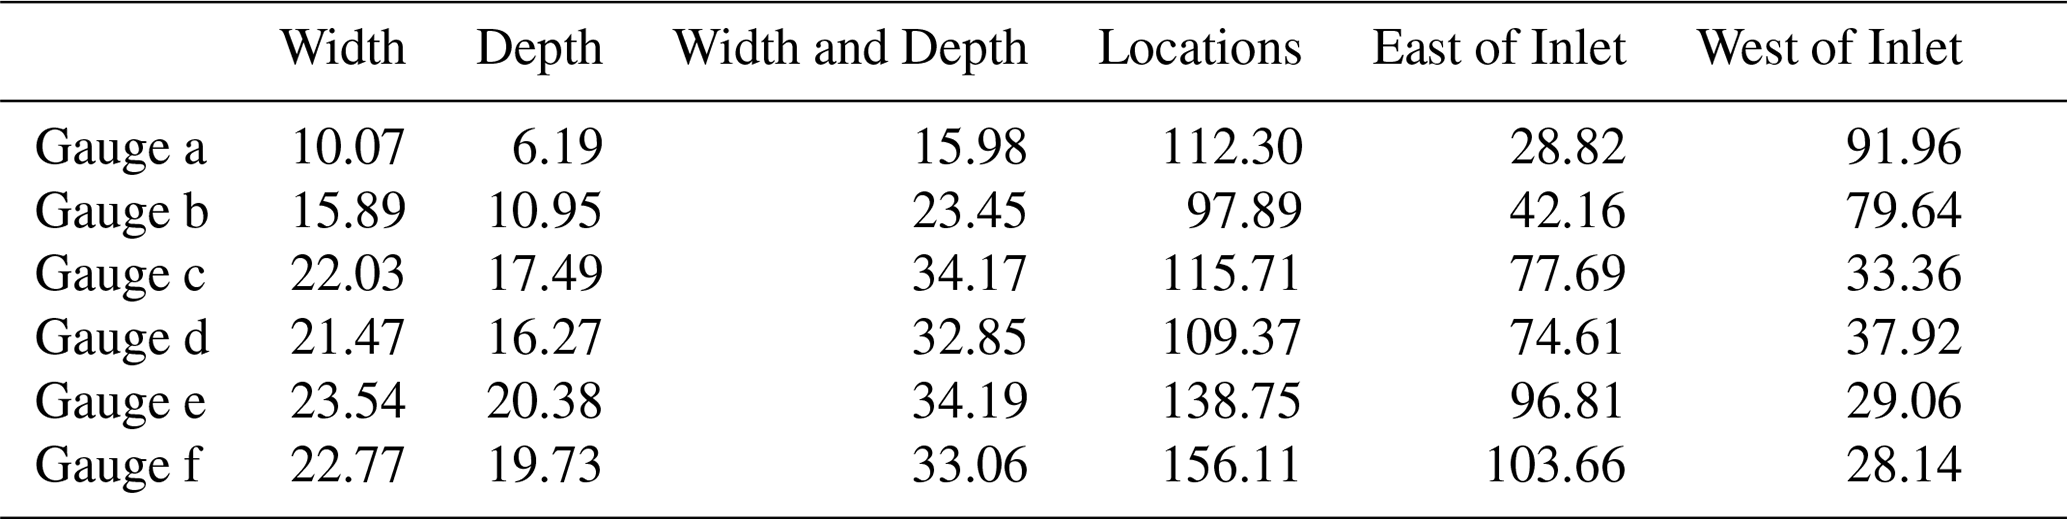
Figure 5 illustrates the maximum surge heights for each category of simulation at locations shown as green circles in Fig. 1. The Location simulations have the highest surge with density peaks at 1.85, 1.75, and 1.51 m for west, central, and east bay, respectively.
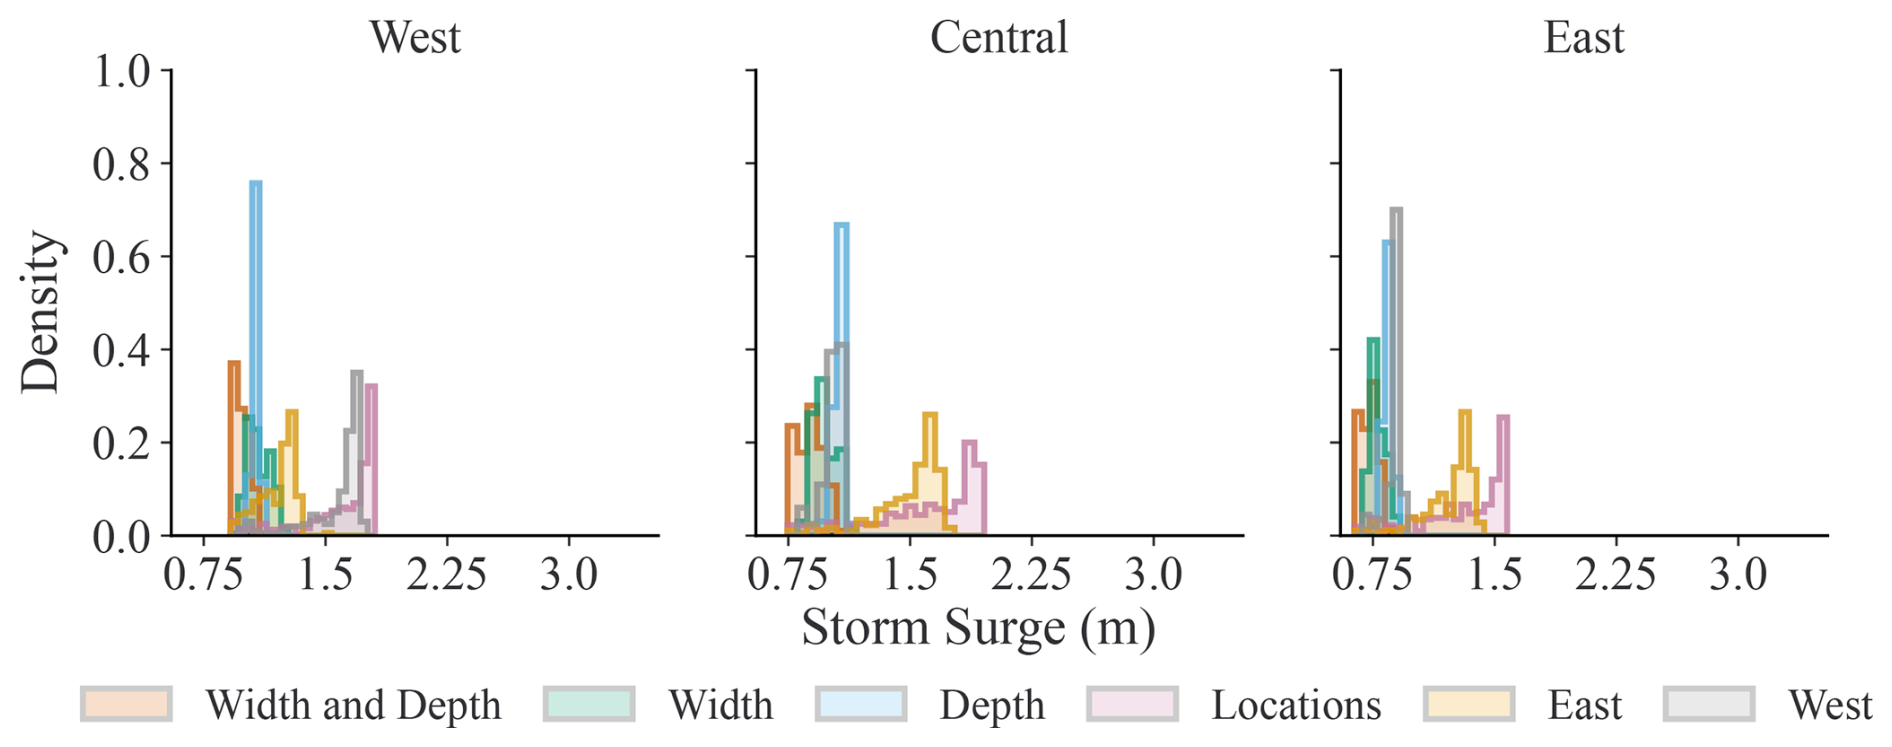
Figure 5Maximum surge height in meters for each selected location shown in Fig. 1 (green dots). Data shows 1900 scenarios split into six categories. Six breaches where width is randomized (blue) (464 scenarios), six breaches where depth is randomized (green) (424 scenarios). Varying width, depth, and number of breaches up to six breaches (orange) (297 scenarios). Varying width, depth, location, and number of breaches up to 295 breaches (315). Varying width, depth, number of breaches up to 100 but limiting breach location to the east of the inlet (yellow) (200) and west of the inlet (gray).
The standard deviation is also large at 0.32, 0.24, 0.26 m compared to the other simulations. When constrained to the original six breaches the Depth variations have the largest mean surge height at 1.06, 1.07, 0.84 m, with medians similar to the mean for all scenarios. The Width scenarios mean surge height is 0.97, 1.09, 0.78 m and the Width and Depth simulations have a mean surge height of 0.88, 0.98, 0.72 m. The East of Inlet simulations mean is 1.49, 1.20, 1.21 m, and the mean of the West of Inlet simulations is 1.02, 1.57, 0.88 m. Excluding the Location, West, and East simulations the largest standard deviation varies between the categories. The largest standard deviation is 0.08 m at the west location for the Width and Depth, the central standard deviation is 0.07 for the Width category, and East has a maximum standard deviation of 0.05 m which includes both Width and Depth and Width. Table 4 lists all of the results for the surge calculated by GeoClaw.
Table 4Maximum surge height (m) for each category of breach simulations at each of the three points shown on Fig. 5.
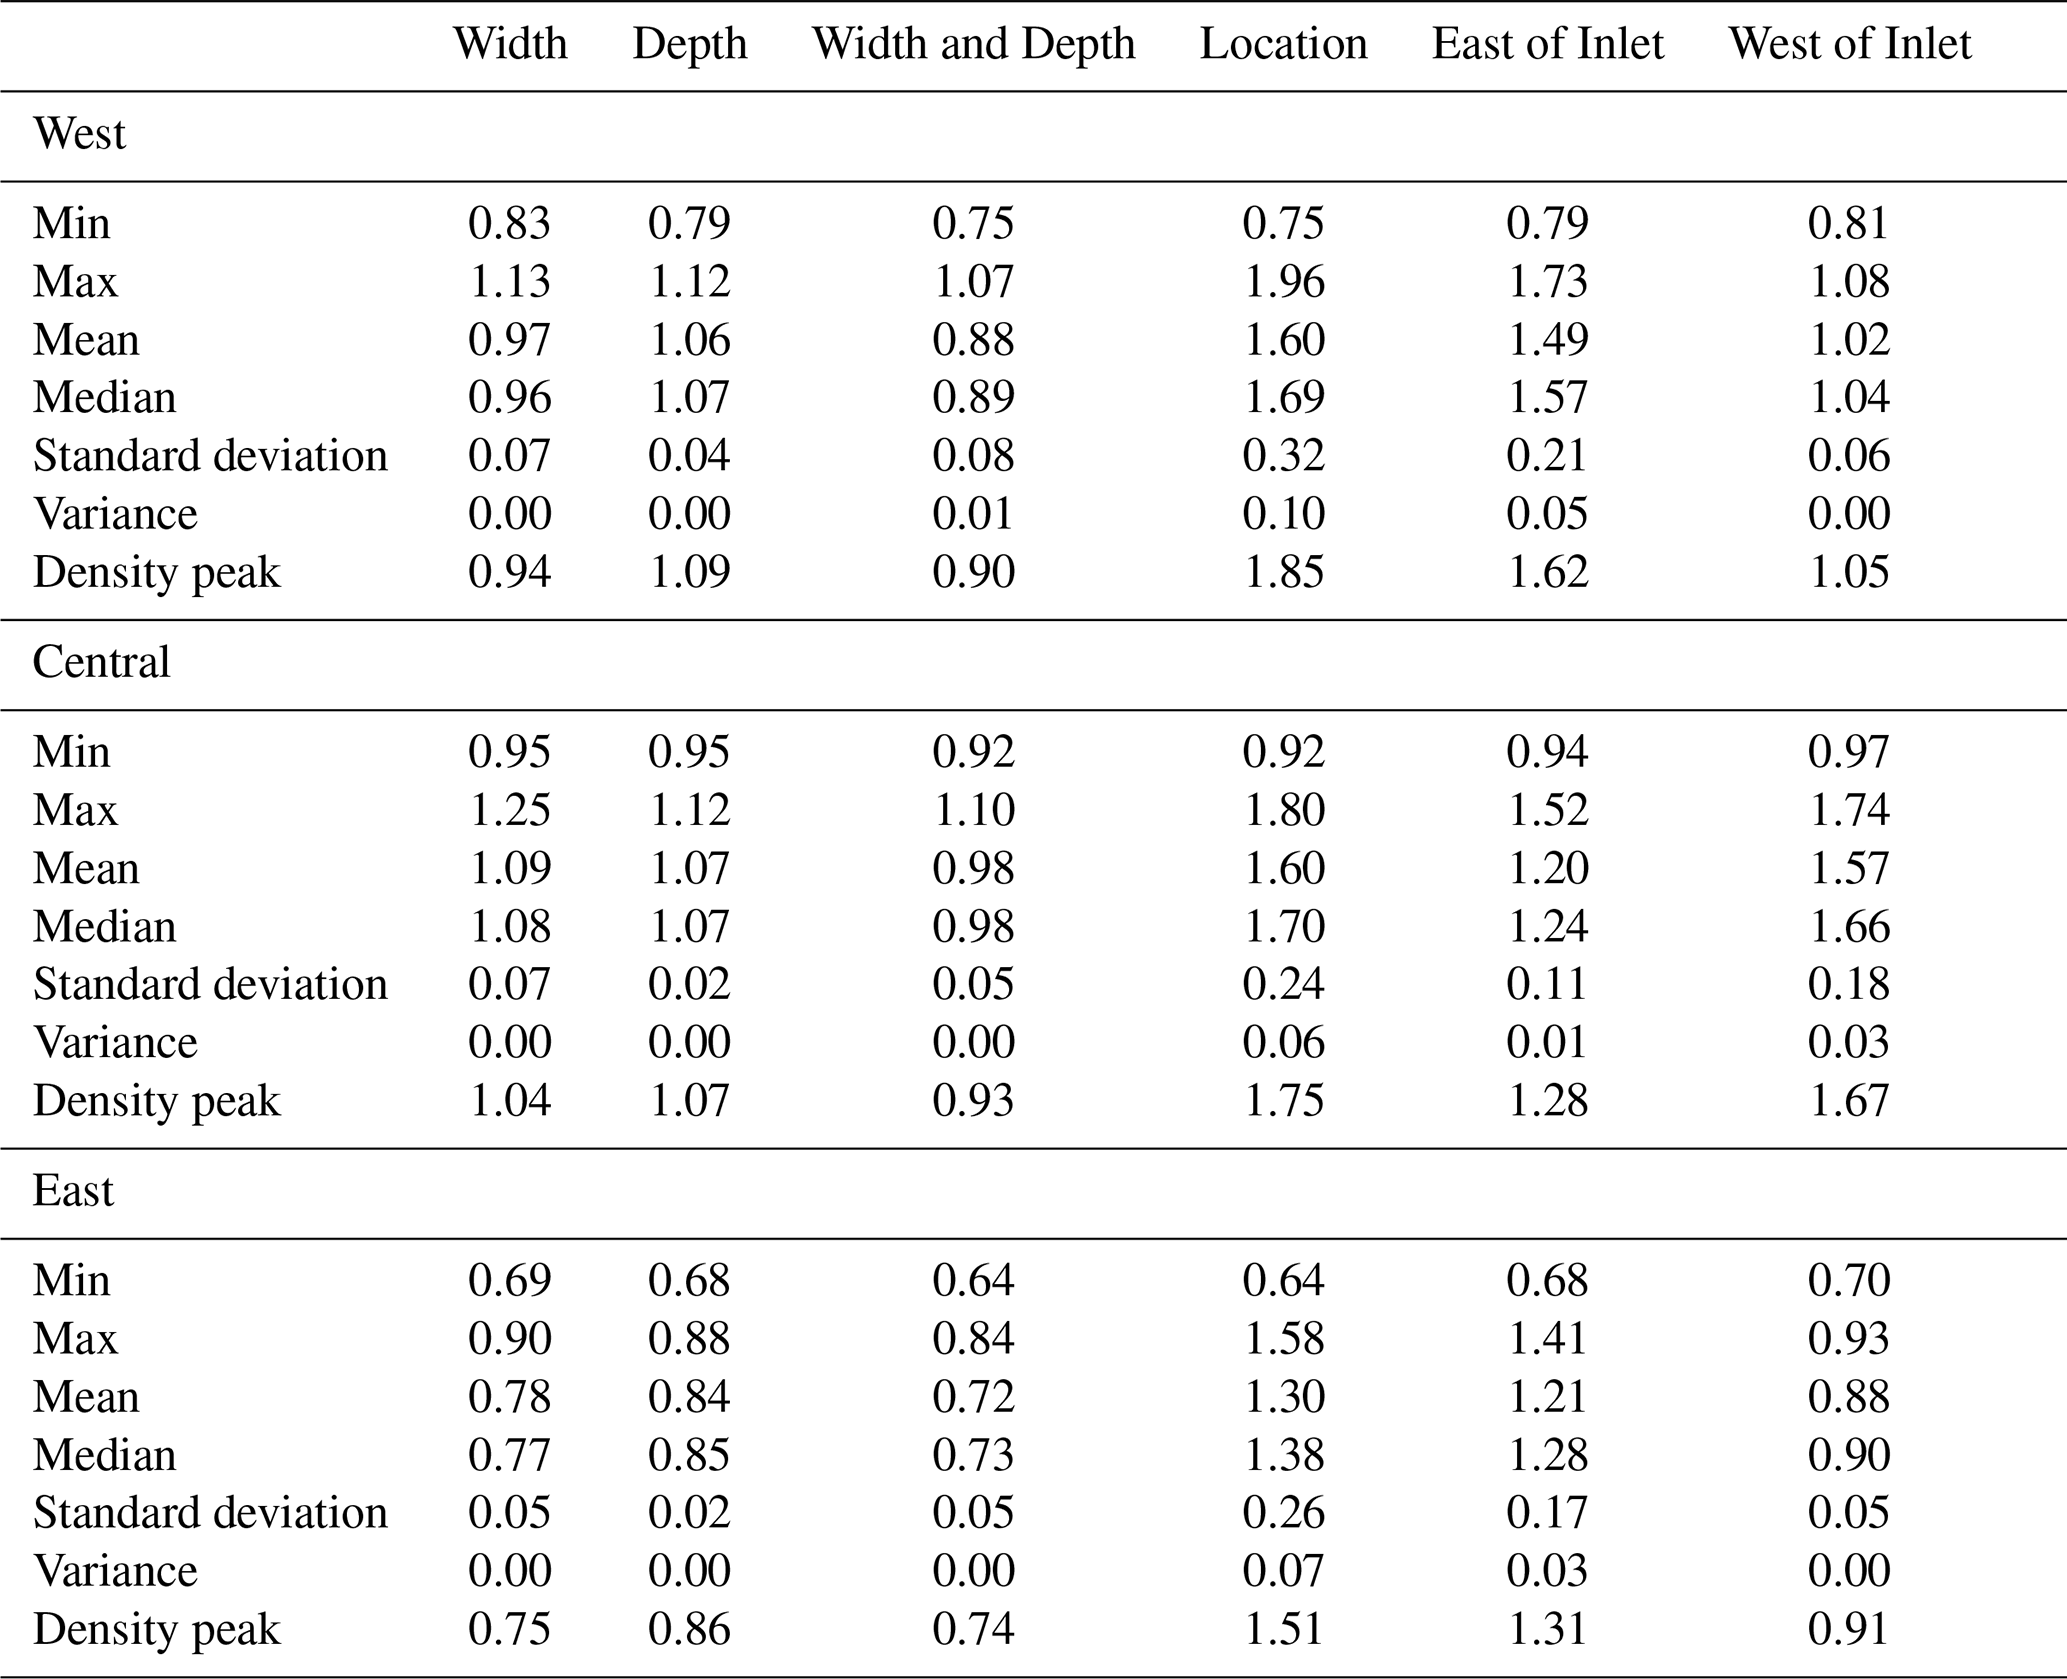
Figure 6 compares the maximum surge for each section of the bay. The overall surge distribution pattern is similar to those at the specific bay locations in Fig. 5. The Location simulations have the largest impact on surge for each bay section. The next largest surge vary by bay section with West of Inlet having the largest surge in the west and the Width scenarios dominating the central and east regions.
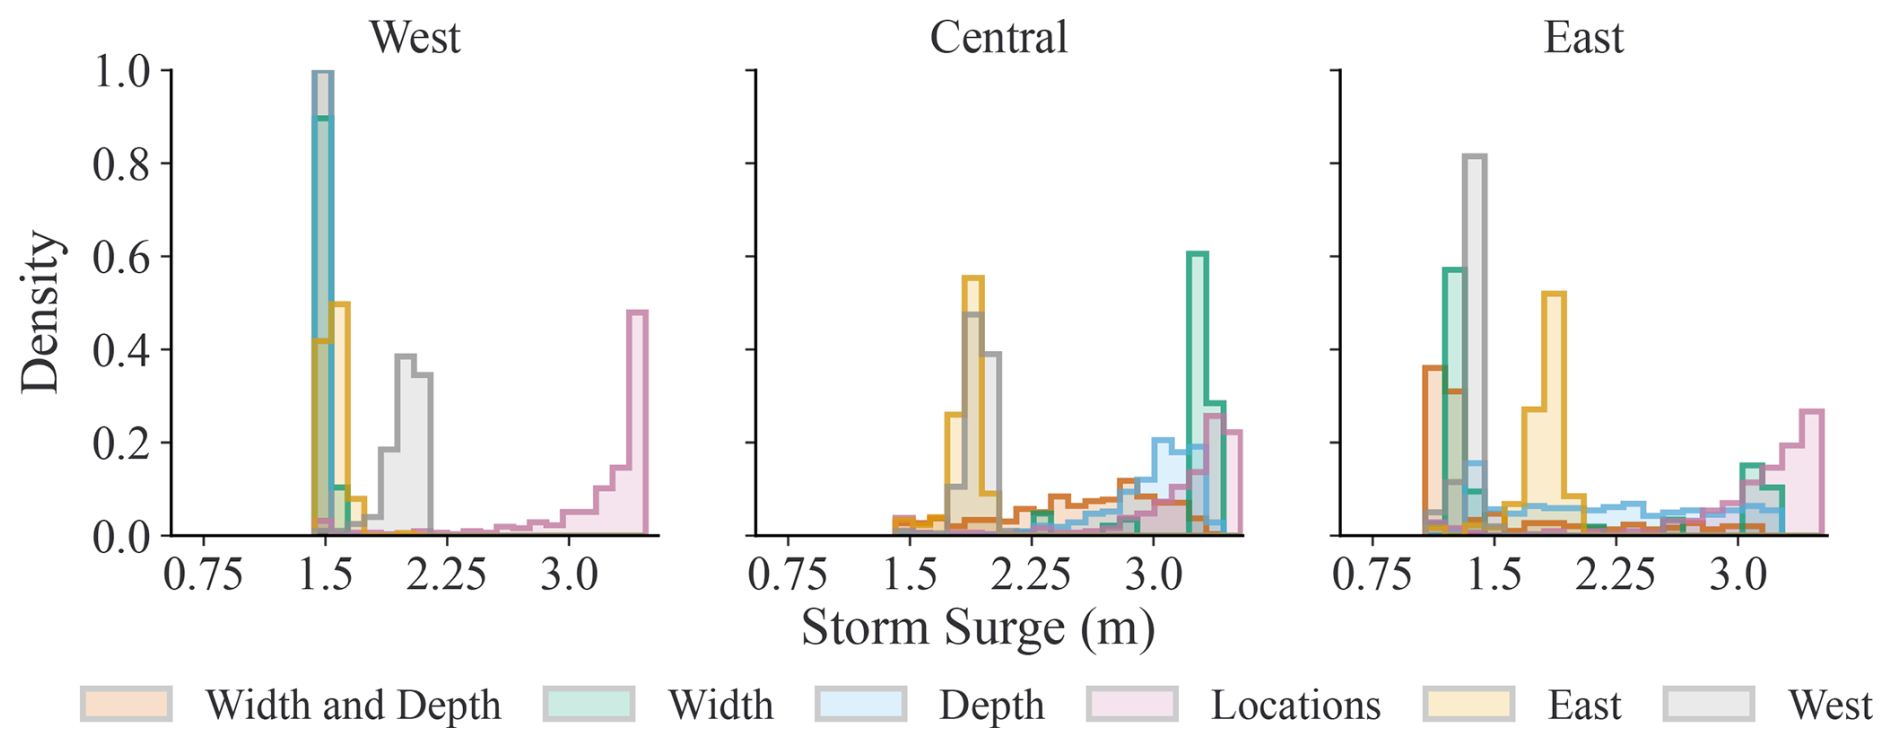
Figure 6Maximum surge height (m) for each category of breach simulations across each entire section of the bay.
Figure 7 illustrates the relationship between total breach area (km2) and total inundation change from a no-breach simulation. All simulations except for East of Inlet and West of Inlet exhibit a logarithmic relationship that starts with a minimum inundation of 0.1632 km2 and illustrates that a larger breach area leads to more inundation up to approximately 75 breaches where the curve levels off at a total breach area of 0.035 km2 and a maximum inundation area around 40.1 km2. Beyond this point, inundation change increases more slowly to a maximum of 49.06 km2. The second curve from the top represents the West of Inlet scenarios. These simulations still show a logarithmic trend, but level off at a lower total inundation. The third curve is for the East of Inlet simulations, also leveling off at a lower total inundation.
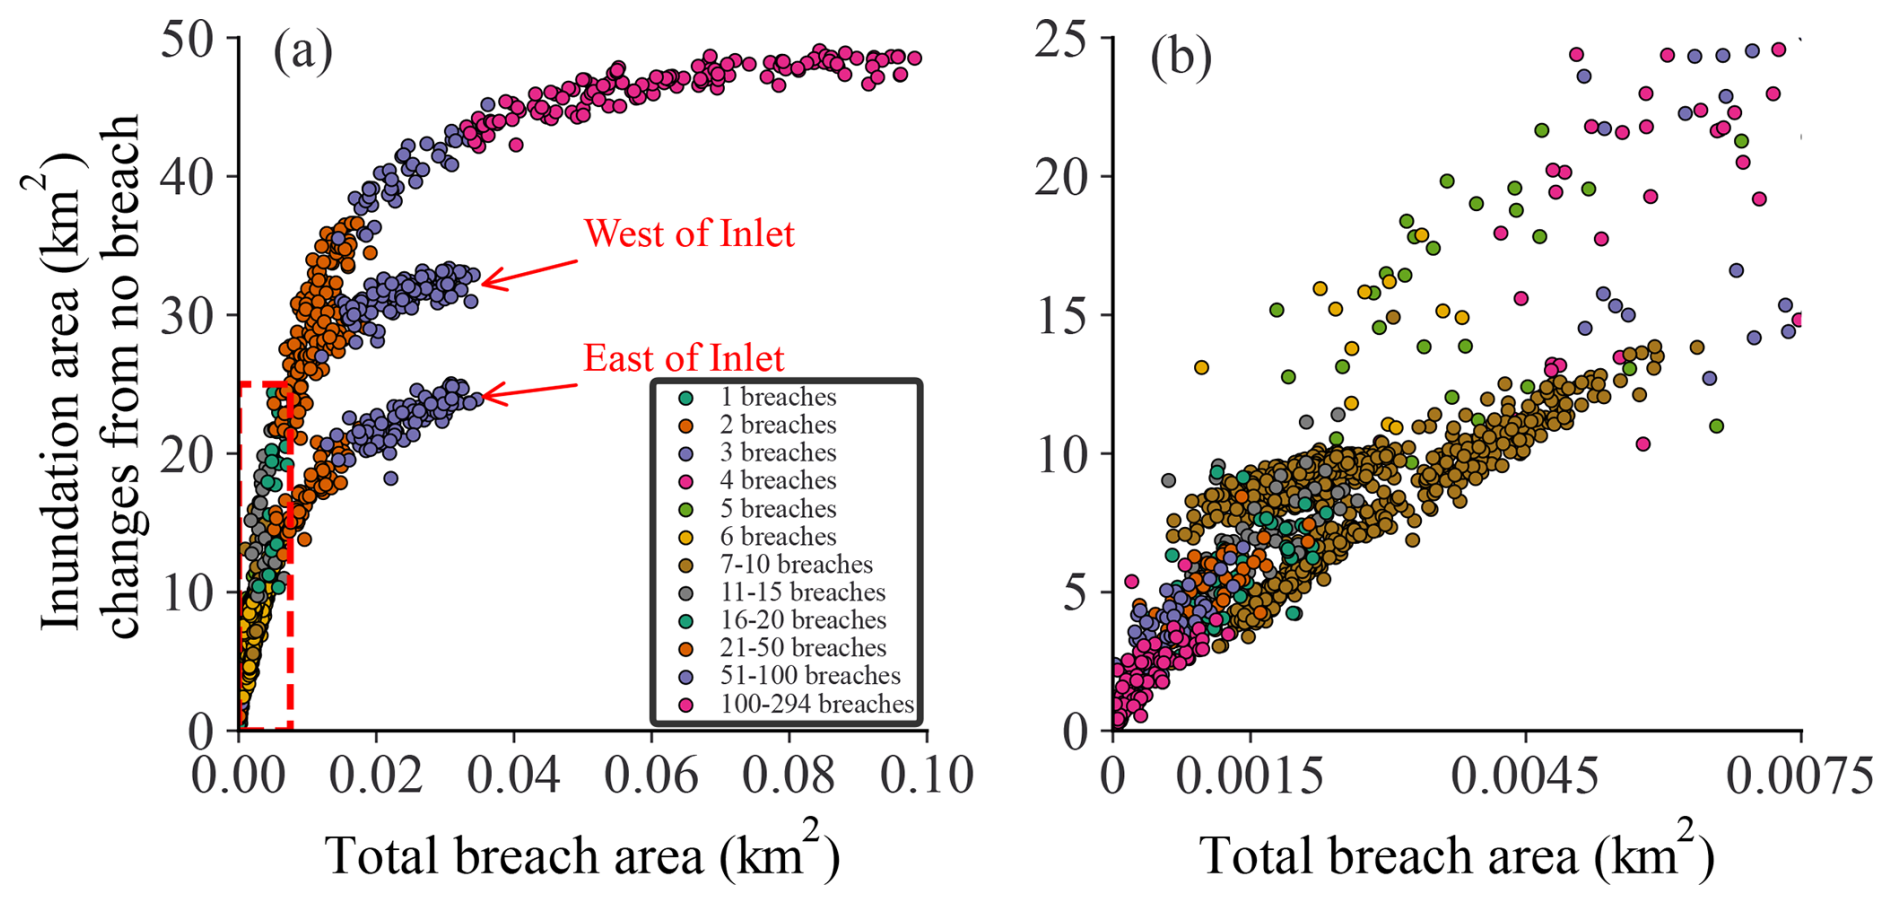
Figure 7(a) Total inundation vs. total breach size for all 1900 scenarios, points are colored per number of breaches. Panel (b) zoom in of panel (a) to show differentiation of breach area and number of breaches and how the inundation can vary.
The results of this study show that the location, size, and number of breaches affect coastal flooding. There is a clear relationship between total breach area and flooding in the bay and on the mainland coastline. The histograms in Fig. 5 illustrate various bay locations. The west surge point near the Forge River mouth shows that, with the original breach locations, the surge distribution is clustered and overlaps across scenarios. However, when breach locations vary, the maximum surge is much higher from nearby breaches. This location initially experiences surge from the eastern side of the bay, and after landfall, surge is pushed again from the western connection to Great South Bay and the nearby breaches. Figures 8 and 9 further illustrate that the maximum surge in the bay and along the mainland alters due to breach location. We further discuss the surge patterns of Figs. 8 and 9 below.
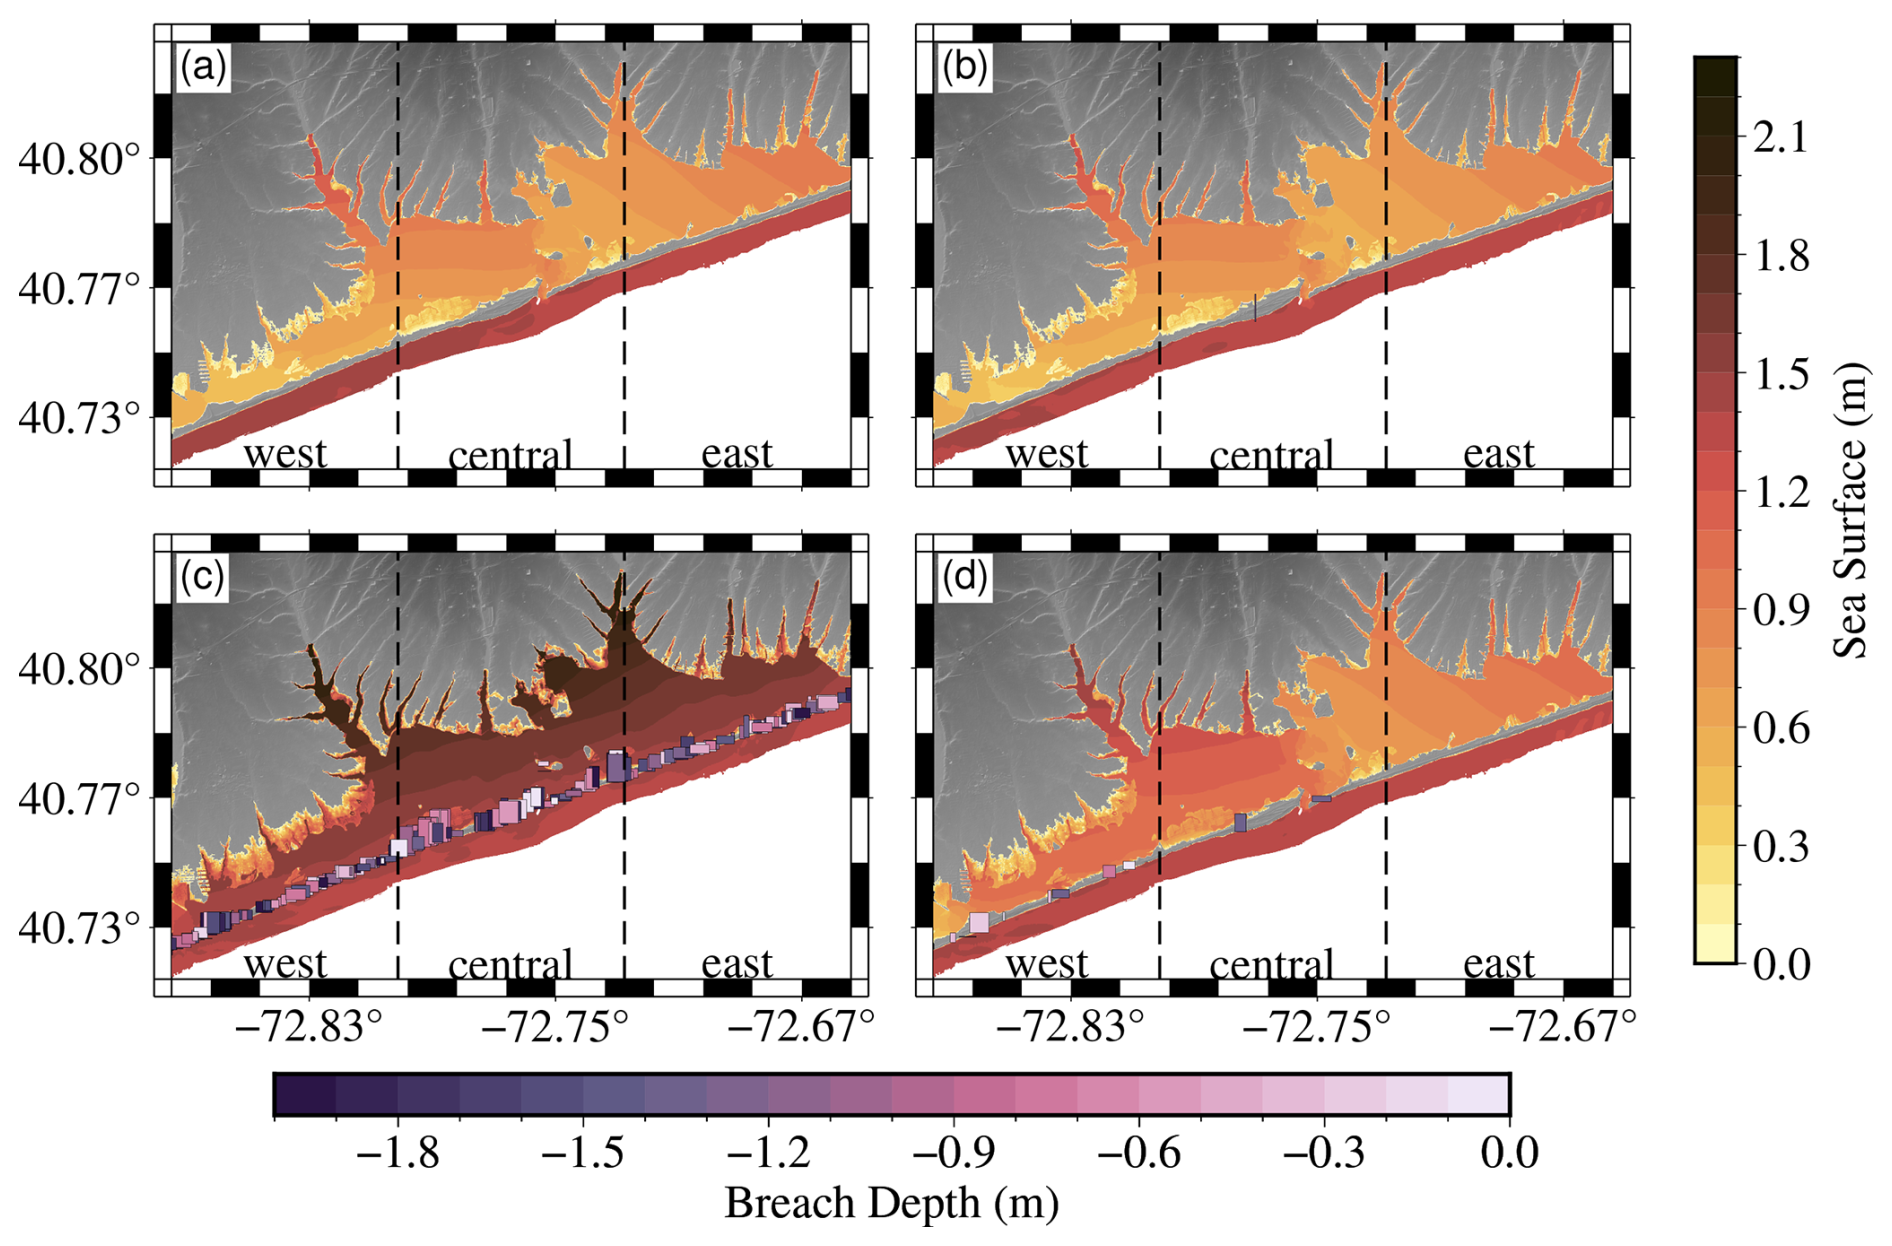
Figure 8Maps Moriches Bay, NY. Each panel is a separate simulation representing different values of storm surge inundation. Panel (a) is our no-breach scenario. Panel (b) is the minimum inundation of 0.162 km2 with a single small breach. Panel (c) is the largest inundation scenario of 49.06 km2 with 259 breaches. Panel (d) is a simulation that has the closest inundation to the mean of all 1900 simulations 14.54 km2, with 11 breaches.
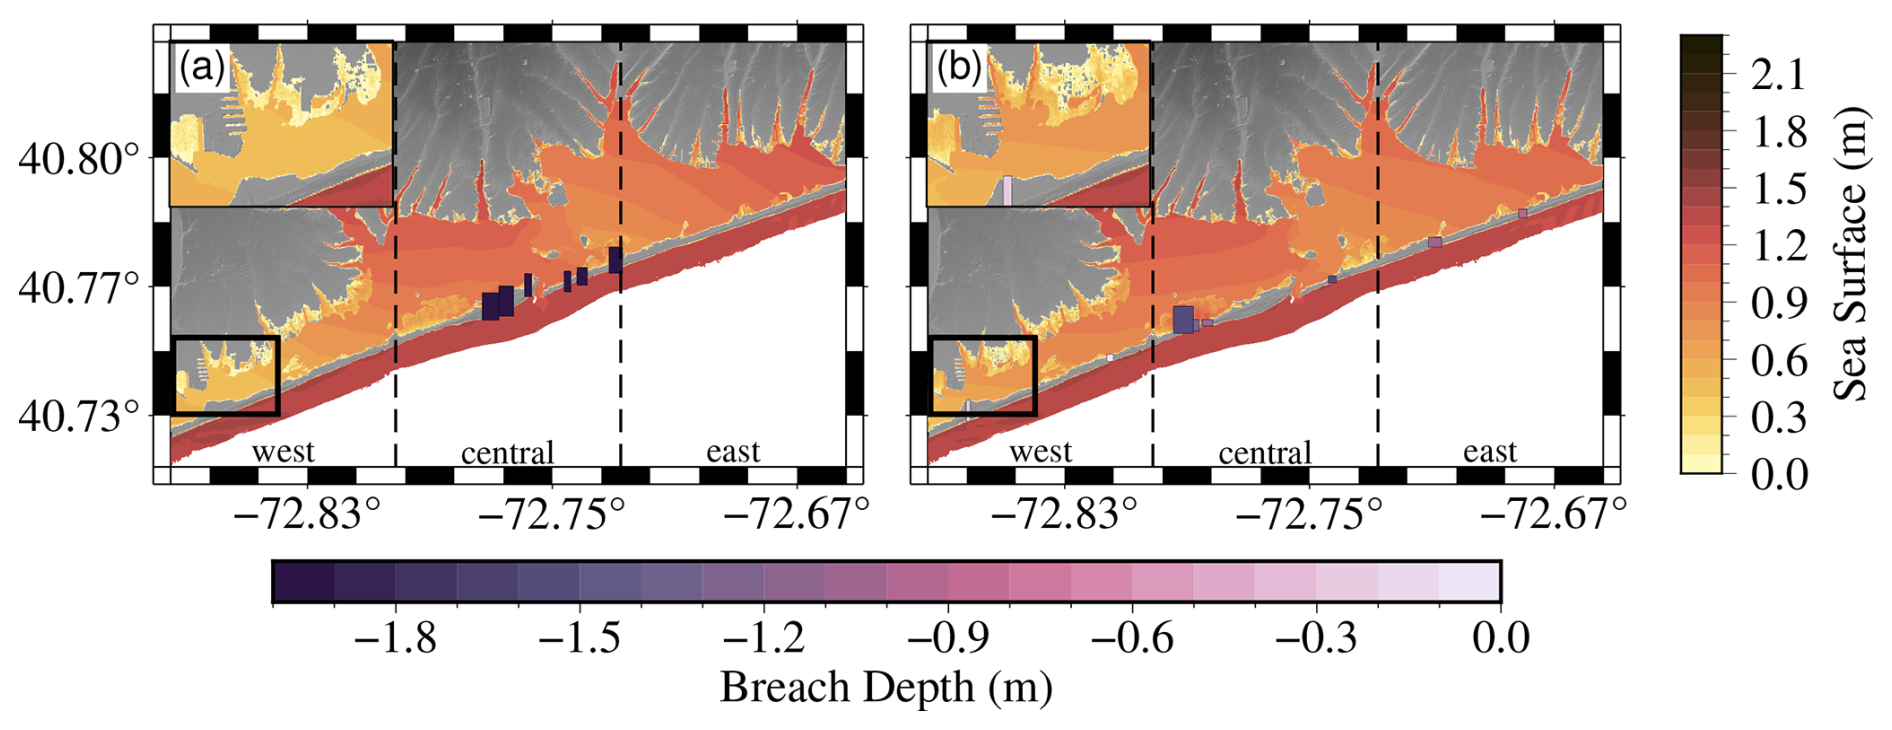
Figure 9(a) Maximum surge and inundation for simulations with 6 breaches and total breach area 0.0039 km2. (b) Maximum surge and inundation for simulation that has 11 breaches and a total breach area of 0.0036 km2.
The central location is adjacent to the mainland coastline near Seatuck Cove. Varying breach locations and numbers increases surge, but to a smaller degree than in the west. The maximum surge here is lower than in the west, probably due to its proximity to the inlet. The peak surge from western breaches reaches the inlet before Seatuck Cove, allowing water to exit the bay and reducing the surge. In addition, the coastline's shape helps protect this location from surge coming from the southwest. However, East of Inlet breaching is the second largest contributor of surge at this location. Surge from eastern breaches is directed westward by hurricane wind circulation impacting the central location. Figure 10a displays surge patterns from eastern island breaching.
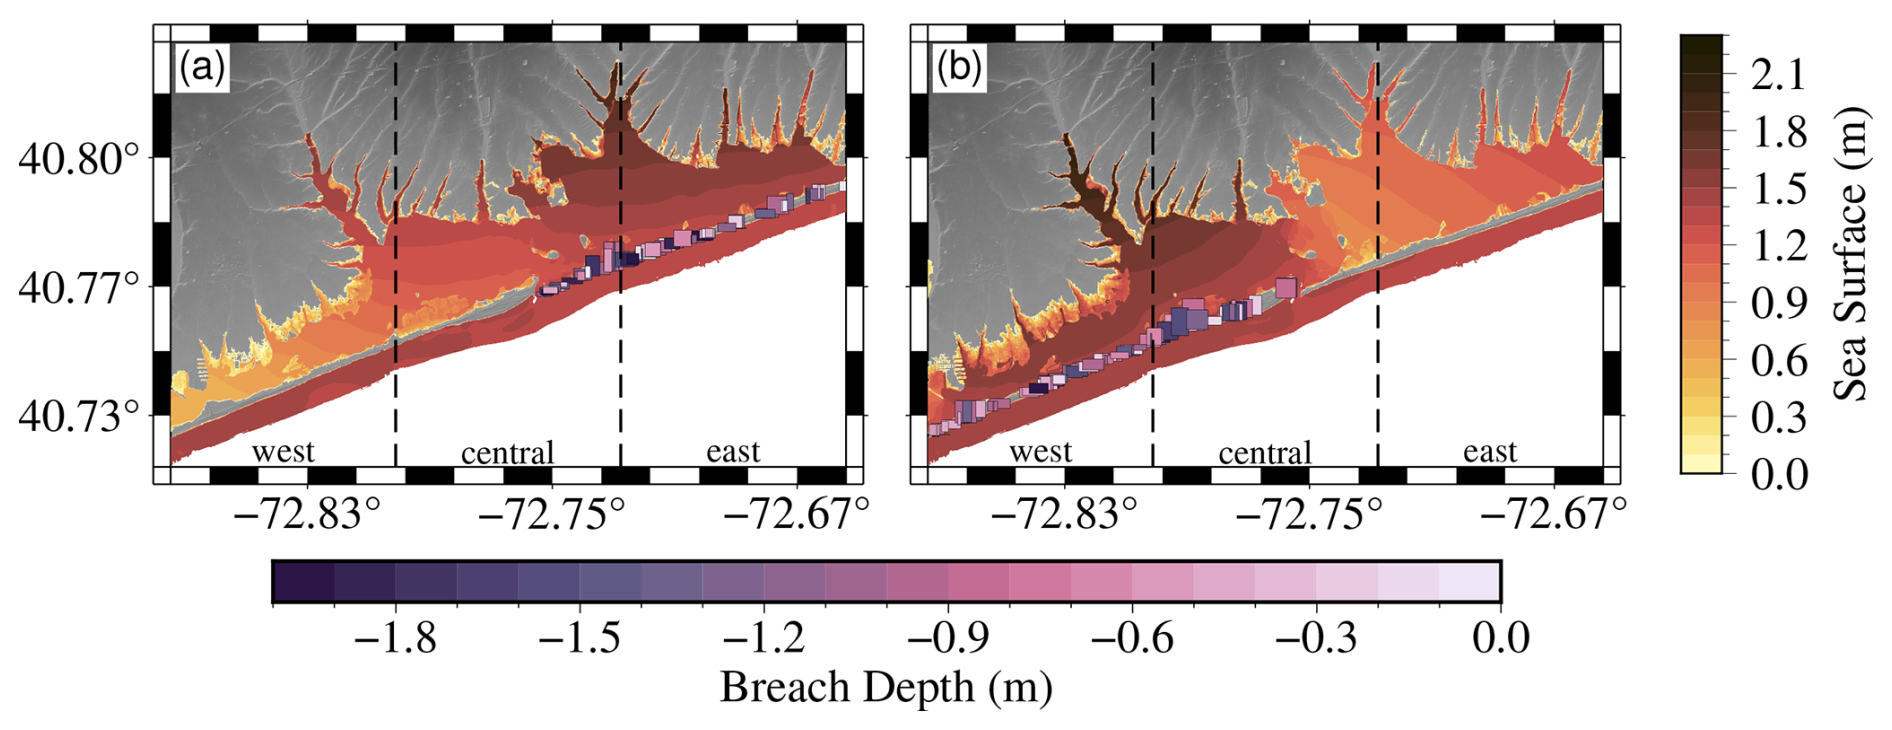
Figure 10(a) Maximum surge and inundation for East of Inlet simulations with a total inundation of 24.87 km2. (b) Maximum surge and inundation for West of Inlet simulation that has a total breach area of 26.85 km2.
The east location, which is closest to the barrier island, has the smallest maximum surge in the bay. Breaches formed eastward of the original locations do bring more surge to this location. However, its proximity to the inlet means that bay surge traveling east after peak ocean surge flows out of the inlet, reducing the total surge. In addition, wind pushes the eastern surge towards the southwest, further reducing the total surge.
Figure 4 shows how surge timing and maximum surge vary across scenarios for each bay section. Many Location simulations have breaches in the southwest portion of the barrier island. The peak ocean surge spreads from the southwest to northeast before landfall, causing these breaches to open earlier than in other scenarios. This pattern is most evident in west gauges (a and b), where the surge arrives earlier and is larger than simulations with breaches closer to the inlet. The central gauges illustrate that while the Location surge remains larger, its timing is more aligned with other scenarios. The eastern gauges maximum surge is not much higher than the other categories, but the surge still arrives earlier due to water entering the bay from the southwest breaches. The strong correlation between breach locations and surge direction aligns well with findings from other coastal barrier studies. Novak et al. (2024), explain that surge and wave angles approaching the barrier can exploit local topographic lows and thin sections of the dune system, leading to an increased probability of overwash and breaching. Once breached the wave and surge angle can increase flooding landward of the barrier (Novak et al., 2024; Sánchez-Arcilla and Jiménez, 1994; Houser et al., 2008).
Figure 4 shows a change in surge direction in the no-breach scenario. Around landfall, the surge direction is from northeast to southwest, and reversed shortly after where water is pushed from the connection to Great South Bay. This created a local setdown for gauges not protected by the mainland's contours. This setdown is observed on gauges a, e, and d at approximately 1 h after landfall on gauge a, and 30 min later on gauges e and d. The Width and Depth simulations also exhibit this setdown, having the least impact on bay surge. Two to three hours post-landfall, the breaches allow water to flow back into the ocean, leading to a more rapid reduction in bay flooding than in the no-breach scenario. We see this especially in the Location, East of Inlet, and West of Inlet simulations where the water recorded at the gauges are reduced below the no-breach scenario.
In Fig. 7a we show that the total breach dimensions are related to the total area of inundation, with larger and more numerous breaches bringing more water inland. Total breach area across all breaches is the strongest predictor of coastal inundation, until the island is significantly eroded, after which inundation growth slows considerably. Figure 7b adds nuance to this relationship. While there is a stronger correlation between breach width and inundation than depth and inundation, the maximum breach depth of 2 m is at least a factor of 20 smaller than total width for these scenarios, reducing the impact of depth on the hydrodynamics of each breach. Experiments on breach growth in dikes also illustrated this order of magnitude difference between breach width and depth (Visser, 1999, 2001). The cluster of breaches above the main group are the Depth scenarios, whereas the Width scenarios exhibit a more linear relationship with total inundation area. The secondary and tertiary curves in Fig. 7a show that inundation is capped if half of the barrier island still exists. These simulations were isolated to only the west and east sides of the inlet. Both scenarios have a smaller total impact on inundation; however, the West of Inlet scenarios contribute to a larger total inundation than the East of Inlet breaches. This is because breaching starts earlier in the west due to the storm's approach direction, and water moving southwest out of the inlet relieves some of the inundation that accumulates on the east.
Figure 8 illustrates that different inundation and bay surge patterns correlate with the number and size of breaches. Panel a depicts a no-breach scenario, which is similar in surge and inundation distribution to the minimum inundation (panel b) featuring a single small breach. The difference between these simulations is approximately 500 wet vs. dry cells, which is 163 200 m2 (0.1632 km2) of inundation. Panel d represents a simulation with 11 medium-sized breaches, totaling 0.0029 km2 in breach area and 14.54 km2 in inundation change, closely approximating the mean inundation change from all 1900 simulations. The simulation closest to the median of the scenarios (not shown) has six medium-sized breaches and 9.36 km2 of inundation. The surge contours in the bay and the total horizontal coastal inundation are very different from the no-breach or minimum inundation scenarios, with higher flooding potential in the coves, creeks, and rivers that border the bay and along the lower elevation coastlines. The maximum inundation scenario (panel c) where most of the island has been breached, shows a bay surge of approximately 2 m resulting in complete flooding of the lowest elevation areas of the coastline.
The impact of differing breach locations on inundation as illustrated in Fig. 8c, can be further seen in Fig. 9, which compares two simulations with a similar total breach area, but different total inundation. Figure 9a, shows a scenario with six moderately sized breaches in the locations from the 1938 hurricane, with a total breach area of 0.0039 km2, and total inundation of 10.44 km2. In contrast, Fig. 9b, shows a smaller total breach area of 0.0036 km2 but a larger inundation at 12.03 km2. In this scenario the breaches are generally smaller but more spread out across the barrier island, with breaches closer to Great South Bay in the western portion. While the bay surge patterns are similar, the surge contours differ, and the breaches between Great South Bay and Moriches Bay allow more water to flow in from the southwest prior to peak ocean surge. This results in more coastal inundation along the western coastline (see inset of Fig. 9a and b). The Forge River surge is higher in Fig. 9b and the inlet region has a lower total water depth. The eastern portion of the bay has less inundation in Fig. 9b, probably due to most breaches being in the west, the inlet allowing water to flow out, and the lower elevation of the western half of the bay's coastline.
Breaching isolated to one side of the inlet creates notable changes in bay surge and total inundation, as shown in Fig. 10. As Fig. 7 indicates, the West of Inlet scenarios result in higher total coastal inundation which is evident in Fig. 10b where the western mainland coastline is significantly inundated compared to other scenarios. In contrast, the East of Inlet simulations can push the surge further down the bay. As the storm continues past landfall the surge is pushed southwest and not all of it floods out through the inlet.
Figures 8–10 highlight the key findings from our simulations. Total breach area is a strong predictor of total inundation; however, breach location is also crucial, especially given the storm's forcing dynamics and surge direction. Similarly, a study by Gharagozlou et al. (2021) on breaching's impact on lagoon circulation during Hurricane Isabel illustrates how breaches alter flow patterns and introduce larger volumes of ocean water into the lagoon. These findings can be compared to our results, which demonstrate that breach location significantly influences storm surge behavior and its subsequent effects on coastal flooding (Gharagozlou et al., 2021). While this study does not include tides and waves, they significantly influence bay surge dynamics and contribute strongly to breach initiation and growth as described in Smallegan and Irish (2017); Sherwood et al. (2014); Safak et al. (2016); Sánchez-Arcilla and Jiménez (1994). The stochastic nature to these processes makes them difficult to model, and much of our understanding relies on empirical observations from geological studies or post-storm surveys of barrier-island systems (Kraus et al., 2002; Buynevich and Donnelly, 2006; Soria et al., 2021; Novak et al., 2024; Sánchez-Arcilla and Jiménez, 1994). Incorporating tidal or wave components into our simulations could result in different patterns of breaching and inundation. Our use of offshore water levels to model breaching assumes wave action contributes to breach initiation, based on prior studies and observations.
The breaching of a barrier island during a hurricane shows a strong impact on mainland inundation. The number, locations, and size of the breaches can significantly alter the inundation pattern along the mainland coastline. While the impact of barrier-island breach during storms is unquestionable, more research is needed to better quantify the uncertainties of the breaching process. In particular, the statistical distribution of the breach parameters might vary for different barrier-island systems. This is particularly important for barrier-island systems that lack extensive datasets on past storms and breaching events, or for storm conditions that have yet to be observed. In this context, our work is categorized as preliminary and highlights the importance of understanding how barrier-island breaching affects the vulnerability of mainland coastal areas to storm impacts.
The global prevalence of coastal barrier systems presents numerous opportunities to advance our understanding of breaching's impacts across diverse coastlines and storm conditions. This understanding offers opportunities to enhance infrastructure resilience, reduce potential loss of life, and minimize community disruptions caused by storms.
The code is available as follows:
-
BarrierIslandBreachProject developer: Catherine R. Jeffries
-
Contact: catherinej@vt.edu
-
Program language: Python and FORTRAN
-
Software required: GeoClaw, Linux, or MacOS
The source codes are available for download at the following links:
Code for preparation and analysis is available at https://github.com/cjeffr/BarrierIslandBreachProject and https://doi.org/10.5281/zenodo.16986816 (Jeffries, 2025, last access: 28 August 2025).
GeoClaw v5.9.2 (2023) is available at https://www.clawpack.org/installing.html (Jeffries, 2025, last access: 28 August 2025).
Modifications to GeoClaw to run breaching and storm inputs are available at https://github.com/cjeffr/geoclaw/tree/OWI_integration (Jeffries, 2025, last access: 28 August 2025).
The data underlying this paper are accessible from the Virginia Tech Data Repository at https://doi.org/10.7294/29991334 (Jeffries et al., 2025).
RW, JLI, and KM conceptualized this research, provided supervision, and reviewed and edited the manuscript. CRJ developed the methodology and software needed for this project, performed the validation, formal analysis, and figure creation, and wrote the original draft of the manuscript.
The contact author has declared that none of the authors has any competing interests.
Any opinions, findings, and conclusions or recommendations expressed in this material are those of the authors and do not necessarily reflect the views of the National Science Foundation.
Publisher's note: Copernicus Publications remains neutral with regard to jurisdictional claims made in the text, published maps, institutional affiliations, or any other geographical representation in this paper. While Copernicus Publications makes every effort to include appropriate place names, the final responsibility lies with the authors.
The authors would like to acknowledge the US Army Corps of Engineers (USACE) for providing the storm forcing data used in this study.
The authors acknowledge Advanced Research Computing at Virginia Tech for providing computational resources and technical support, which contributed to the results reported within this paper (https://arc.vt.edu/, last access: February 2024).
During the preparation of this work, the authors used ChatGPT in order to reduce the word count of the document to fit the journal's length restrictions. After using this tool, the authors reviewed and edited the content as needed and take full responsibility for the content of the publication.
This work was supported in part by the National Science Foundation (grant no. 1735139) and the Institute for Critical Technology and Applied Sciences (ICTAS), Virginia Tech.
This paper was edited by Mauricio Gonzalez and reviewed by Adam Switzer and one anonymous referee.
Bates, P. D., Quinn, N., Sampson, C., Smith, A., Wing, O., Sosa, J., Savage, J., Olcese, G., Neal, J., Schumann, G., Giustarini, L., Coxon, G., Porter, J. R., Amodeo, M. F., Chu, Z., Lewis-Gruss, S., Freeman, N. B., Houser, T., Delgado, M., Hamidi, A., Bolliger, I., E. McCusker, K., Emanuel, K., Ferreira, C. M., Khalid, A., Haigh, I. D., Couasnon, A., E. Kopp, R., Hsiang, S., and Krajewski, W. F.: Combined modeling of US fluvial, pluvial, and coastal flood hazard under current and future climates, Water Resour. Res., 57, e2020WR028673, https://doi.org/10.1029/2020WR028673, 2021. a
Berger, M. J., George, D. L., LeVeque, R. J., and Mandli, K. T.: The GeoClaw software for depth-averaged flows with adaptive refinement, Adv. Water Resour., 34, 1195–1206, 2011. a, b
Brooks, C. F.: Hurricanes into New England: meteorology of the storm of September 21, 1938, Geogr. Rev., 29, 119–127, 1939. a
Buynevich, I. and Donnelly, J.: Geological signatures of barrier breaching and overwash, southern Massachusetts, USA, J. Coast. Res., http://www.jstor.org/stable/25741544 (last access: 28 August 2025), 112–116, 2006. a, b, c
Cañizares, R. and Irish, J. L.: Simulation of storm-induced barrier island morphodynamics and flooding, Coast. Eng., 55, 1089–1101, 2008. a, b, c, d
Center for Operational Oceanographic Products and Services (CO-OPS): CO-OPS 1-minute Tsunami Water Level Data, NOAA National Centers for Environmental Information [data set], https://doi.org/10.7289/V59884XF, 2007. a, b
Cialone, M. A., Massey, T. C., Anderson, M. E., Grzegorzewski, A. S., Jensen, R. E., Cialone, A., Mark, D. J., Pevey, K. C., Gunkel, B. L., and McAlpin, T. O.: North Atlantic Coast Comprehensive Study (NACCS) coastal storm model simulations: Waves and water levels, Tech. rep., Engineer Research and Development Center, 2015. a, b
Clawpack Development Team: Clawpack software, version 5.9.2, Zenodo [code], https://doi.org/10.5281/zenodo.4025432, 2020. a
Coch, N. K.: Hurricane hazards along the northeastern Atlantic coast of the United States, J. Coast. Res., 115–147, ISSN 0749-0208, e-ISSN 1551-5036, http://www.jstor.org/stable/25735594, 1994. a
Cooperative Institute for Research in Environmental Sciences: Continuously updated digital elevation model (CUDEM) – arc-second resolution bathymetric-topographic tiles, NOAA National Centers for Environmental Information, https://doi.org/10.25921/ds9v-ky35, 2021. a, b
Donnelly, C., Kraus, N., and Larson, M.: State of knowledge on measurement and modeling of coastal overwash, J. Coast. Res., 22, 965–991, https://doi.org/10.2112/04-0431.1, 2006. a
Gharagozlou, A., Dietrich, J. C., Massey, T. C., Anderson, D. L., Gorski, J. F., and Overton, M. F.: Formation of a barrier island breach and its contributions to lagoonal circulation, Estuar. Coast. Shelf S., 262, 107593, https://doi.org/10.1016/j.ecss.2021.107593, 2021. a, b
González, F. I., LeVeque, R. J., Chamberlain, P., Hirai, B., Varkovitzky, J., and George, D. L.: Validation of the geoclaw model, in: NTHMP MMS Tsunami Inundation Model Validation Workshop, University of Washington, GeoClaw Tsunami Modeling Group, 1–84, 2011. a
Houser, C., Hapke, C., and Hamilton, S.: Controls on coastal dune morphology, shoreline erosion and barrier island response to extreme storms, Geomorphology, 100, 223–240, https://doi.org/10.1016/j.geomorph.2007.12.007, 2008. a, b
Howard, A. D.: Hurricane modification of the offshore bar of Long Island, New York, Geogr. Rev., 29, 400, https://doi.org/10.2307/209881, 1939. a, b, c
Irish, J. L., Frey, A. E., Rosati, J. D., Olivera, F., Dunkin, L. M., Kaihatu, J. M., Ferreira, C. M., and Edge, B. L.: Potential implications of global warming and barrier island degradation on future hurricane inundation, property damages, and population impacted, Ocean Coast. Manage., 53, 645–657, 2010. a
Jeffries, C. R.: cjeffr/BarrierIslandBreachProject: Barrier Island Breach codes (0.0.1), Zenodo [code], https://doi.org/10.5281/zenodo.16986816, 2025.
Jeffries, C., Weiss, R., and Irish, J.: Data associated with “Impacts of barrier-island breaching on mainland flooding during storm events applied to Moriches, NY”. University Libraries, Virginia Tech. Dataset [data set], https://doi.org/10.7294/29991334, 2025.
Kraus, N. C.: Analytical model of incipient breaching of coastal barriers, Coast. Eng. J., 45, 511–531, 2003. a, b, c, d, e, f, g
Kraus, N. C. and Wamsley, T. V.: Coastal barrier breaching, Part 1: Overview of breaching processes, US Army Corps of Engineers, Washington, DC, 2003. a, b, c, d
Kraus, N. C., Militello, A., and Todoroff, G.: Barrier breaching processes and barrier spit breach, Stone Lagoon, California, Shore and Beach, 70, 21–28, 2002. a, b, c
Landsea, C. W. and Franklin, J. L.: Atlantic hurricane database uncertainty and presentation of a new database format, Mon. Weather Rev., 141, 3576–3592, https://doi.org/10.1175/MWR-D-12-00254.1, 2013. a
Galgano, F. A. and Leatherman, S. P.: Beach erosion, tidal inlets and politics: the Fire Island story, Shore and Beach, 67, 26–32, 1999. a
Mandli, K. T. and Dawson, C. N.: Adaptive mesh refinement for storm surge, Ocean Model., 75, 36–50, 2014. a, b, c, d, e, f
Mandli, K. T., Ahmadia, A. J., Berger, M., Calhoun, D., George, D. L., Hadjimichael, Y., Ketcheson, D. I., Lemoine, G. I., and LeVeque, R. J.: Clawpack: building an open source ecosystem for solving hyperbolic PDEs, PeerJ Computer Science, 2, e68, 2016. a, b
Matias, A., Óscar Ferreira, Vila-Concejo, A., Garcia, T., and Dias, J. A.: Classification of washover dynamics in barrier islands, Geomorphology, 97, 655–674, https://doi.org/10.1016/j.geomorph.2007.09.010, 2008. a
Morang, A.: Shinnecock Inlet, New York, Site Investigation Report 1 Morphology and Historical Behavior (No. WESCHL9832), US Army Corps of Engineers Waterways Experiment Station, 1999. a
Nadal-Caraballo, N. C., Melby, J. A., Gonzalez, V. M., and Cox, A. T.: Coastal storm hazards from Virginia to Maine, Tech. rep., https://hdl.handle.net/11681/7715, 2015. a, b
National Hurricane Center: Hurricane Preparedness – Hazards, https://www.nhc.noaa.gov/prepare/hazards.php (last access: 2019), 2006. a
Novak, L. P., da Rocha, T. B., Fernandez, G. B., de Oliveira Filho, S. R., de Mello Filho, M. E. T., and Pereira, T. G.: Regional assessment of overwash processes in a retrograding sand barrier (Paraíba do Sul River Deltaic Complex, Rio de Janeiro, Brazil), Regional Studies in Marine Science, 78, 103733, ISSN 2352-4855, https://doi.org/10.1016/j.rsma.2024.103733, 2024. a, b, c, d, e, f
Oertel, G. F.: The barrier island system, J. Mar. Geol., 63, 1–18, https://doi.org/10.1016/0025-3227(85)90077-5, 1985. a, b, c
Pierce, J.: Tidal inlets and washover fans, J. Geol., 78, 230–234, 1970. a, b, c
Roelvink, D., Reniers, A., Van Dongeren, A., De Vries, J. V. T., McCall, R., and Lescinski, J.: Modelling storm impacts on beaches, dunes and barrier islands, Coast. Eng., 56, 1133–1152, 2009. a
Safak, I., Warner, J. C., and List, J. H.: Barrier island breach evolution: alongshore transport and bay-ocean pressure gradient interactions, J. Geophys. Res.-Oceans, 121, 8720–8730, 2016. a
Sánchez-Arcilla, A. and Jiménez, J. A.: Breaching in a wave-dominated barrier spit: the Trabucador Bar (north-eastern Spanish coast), Earth Surf. Proc. Land., 19, 483–498, 1994. a, b, c, d
Schmeltz, E. J., Sorensen, R. M., McCarthy, M. J., and Nersesian, G.: Breach/inlet interaction at Moriches inlet, in: 18th International Conference on Coastal Engineering, Cape Town, South Africa, 1062–1077, 1982. a, b, c
Sherwood, C. R., Long, J. W., Dickhudt, P. J., Dalyander, P. S., Thompson, D. M., and Plant, N. G.: Inundation of a barrier island (Chandeleur Islands, Louisiana, USA) during a hurricane: Observed water-level gradients and modeled seaward sand transport, J. Geophys. Res.-Earth, 119, 1498–1515, https://doi.org/10.1002/2013JF003069, 2014. a
Smallegan, S. M. and Irish, J. L.: Barrier island morphological change by bay-side storm surge, J. Waterw. Port C., 143, 04017025, https://doi.org/10.1061/(ASCE)WW.1943-5460.0000413, 2017. a, b, c, d
Soria, J. L. A., Switzer, A. D., Pile, J., Siringan, F. P., Brill, D., and Daag, A.: Geomorphological and sedimentological records of recent storms on a volcaniclastic coast in Bicol, Philippines, Geomorphology, 386, 107753, ISSN 0169-555X, https://www.sciencedirect.com/science/article/pii/S0169555X21001616, https://doi.org/10.1016/j.geomorph.2021.107753, 2021. a, b
Stutz, M. L. and Pilkey, O. H.: A Review of Global Barrier Island Distribution, J. Coast. Res., ISSN 0749-0208, e-ISSN 1551-5036, http://www.jstor.org/stable/25736270 (last access: 28 August 2025), 15–22, 2001. a
Vallee, D. R. and Dion, M. R.: Southern New England tropical storms and hurricanes: a ninety-seven year summary, 1900–1996, including several early American hurricanes, 1997. a
van der Lugt, M. A., Quataert, E., van Dongeren, A., van Ormondt, M., and Sherwood, C. R.: Morphodynamic modeling of the response of two barrier islands to Atlantic hurricane forcing, Estuar. Coast. Shelf S., 229, 106404, ISSN 0272-7714, https://www.sciencedirect.com/science/article/pii/S0272771419305207, https://doi.org/10.1016/j.ecss.2019.106404, 2019. a, b
Visser, P. J.: Breach erosion in sand-dikes, in: Coastal Engineering 1998, 3516–3528, https://ascelibrary.org/doi/pdf/10.1061/9780784404119.267, https://doi.org/10.1061/9780784404119.267, 1999. a, b, c, d
Visser, P. J.: A model for breach erosion in sand-dikes, in: Coastal Engineering 2000, 3829–3842, https://doi.org/10.1061/40549(276)299, 2001. a
Wamsley, T. V. and Kraus, N. C.: Coastal barrier island breaching, Part 2: Mechanical breaching and breach closure, Coastal and Hydraulic Laboratory Technical Note ERDC/CHL CHETN IV-65, US Army Engineer Research and Development Center, Vicksburg, MS, 21, 2005. a
Weatherall, P., Marks, K. M., Jakobsson, M., Schmitt, T., Tani, S., Arndt, J. E., Rovere, M., Chayes, D., Ferrini, V., and Wigley, R.: A new digital bathymetric model of the world's oceans, Earth and Space Science, 2, 331–345, 2015. a
Westerink, J. J., Luettich, R. A., Feyen, J. C., Atkinson, J. H., Dawson, C., Roberts, H. J., Powell, M. D., Dunion, J. P., Kubatko, E. J., and Pourtaheri, H.: A basin-to channel-scale unstructured grid hurricane storm surge model applied to southern Louisiana, Mon. Weather Rev., 136, 833–864, 2008. a, b
Zăinescu, F., Vespremeanu-Stroe, A., Anthony, E., Tătui, F., Preoteasa, L., and Mateescu, R.: Flood deposition and storm removal of sediments in front of a deltaic wave-influenced river mouth, Mar. Geol., 417, 106015, ISSN 0025-3227, https://www.sciencedirect.com/science/article/pii/S0025322719301781, https://doi.org/10.1016/j.margeo.2019.106015, 2019. a
Zhang, K. and Leatherman, S.: Barrier island population along the US Atlantic and Gulf Coasts, J. Coast. Res., 27, 356–363, 2011. a, b