the Creative Commons Attribution 4.0 License.
the Creative Commons Attribution 4.0 License.
 | 25 Aug 2025
Long-term hazard of pyroclastic density currents at Vesuvius (Southern Italy) with maps of impact parameters
Pierfrancesco Dellino
Fabio Dioguardi
Roberto Sulpizio
Daniela Mele
The hazard of pyroclastic density currents (PDCs) at Vesuvius is investigated by analysing deposits from past eruptions. No specific eruption was chosen as representative of the hazard of PDCs, and the analysis is extended to all the eruptions that left substantial deposits on the ground. Based on the stratigraphic evidence, we assume that at Vesuvius the currents are bipartite, with a highly concentrated basal part, which was fed from the collapse of the eruptive fountain on the ground, and an overlying part generated by the expulsion of gas and fine particulate matter that fed a dilute and turbulent shear flow. Dynamic pressure, particle volumetric concentration, temperature, and flow duration are hazardous characteristics of PDCs that can impact buildings and population and are defined here as impact parameters. They have been calculated by means of an implementation of the PYFLOW code, which uses the deposit particle characteristics as input. The software searches for the probability density function of impact parameters. The 84th percentile has been chosen as a safety value of the expected impact in the long term (50 years). There is no correlation between eruption size and impact parameters. Maps have been constructed by interpolation of the safety values calculated at various points over the dispersal area, and they show how impact parameters change as a function of distance from the volcano. The maps are compared with the red zone, which is the area that the National Department of the Italian Civil Protection has declared to be evacuated under conditions of an impending eruption. The capacity of currents to damage buildings and population is discussed for both the highly concentrated part and the diluted one.
- Article
(10335 KB) - Full-text XML
- BibTeX
- EndNote


Pyroclastic density currents (PDCs) originate from a variety of processes during explosive volcanic eruptions, e.g. the fountaining of the gas–particle mixture (a.k.a. eruption column) issuing from a crater or the avalanching of a volcanic dome. In the first case, the parent current can evolve into a highly concentrated, poorly sorted underflow and an overlying, dilute, fully turbulent current (Sulpizio et al., 2014). PDCs represent the most hazardous events of volcanic eruptions, with historic cases causing destruction and deaths over large areas (Baxter et al., 1998; Cao et al., 2003; Sulpizio et al., 2014). Understanding the processes characterizing PDCs, such as transport and deposition of pyroclastic particles, from the study of deposits emplaced by PDCs is essential for developing effective hazard assessment and risk management strategies (Jones et al., 2023).
Various attempts have been made to define specific flow characteristics that are useful for evaluating the damaging capacity of PDCs, such as dynamic pressure, which is a measure of the impact force per unit area of a current that can exert lateral loads onto buildings (Valentine, 1998; Spence et al., 2004; Zuccaro et al., 2008). Other damaging factors, which we define here as impact parameters, are the flow temperature, the content of ash particles, projectiles carried by the current, and the duration of the flow, which directly or indirectly affect the survivability of people caught unprotected by a PDC (Horwell and Baxter, 2006; Jenkins et al., 2013; Baxter et al., 2017). Duration and concentration become important especially over distal areas, where the strength of the current decays but the lethal effect of the gas–particle mixture remains, as occurred at Pompeii during the historical eruption of 79 CE (Dellino et al., 2021), which represents an invaluable source of information of the actual impact of PDCs.
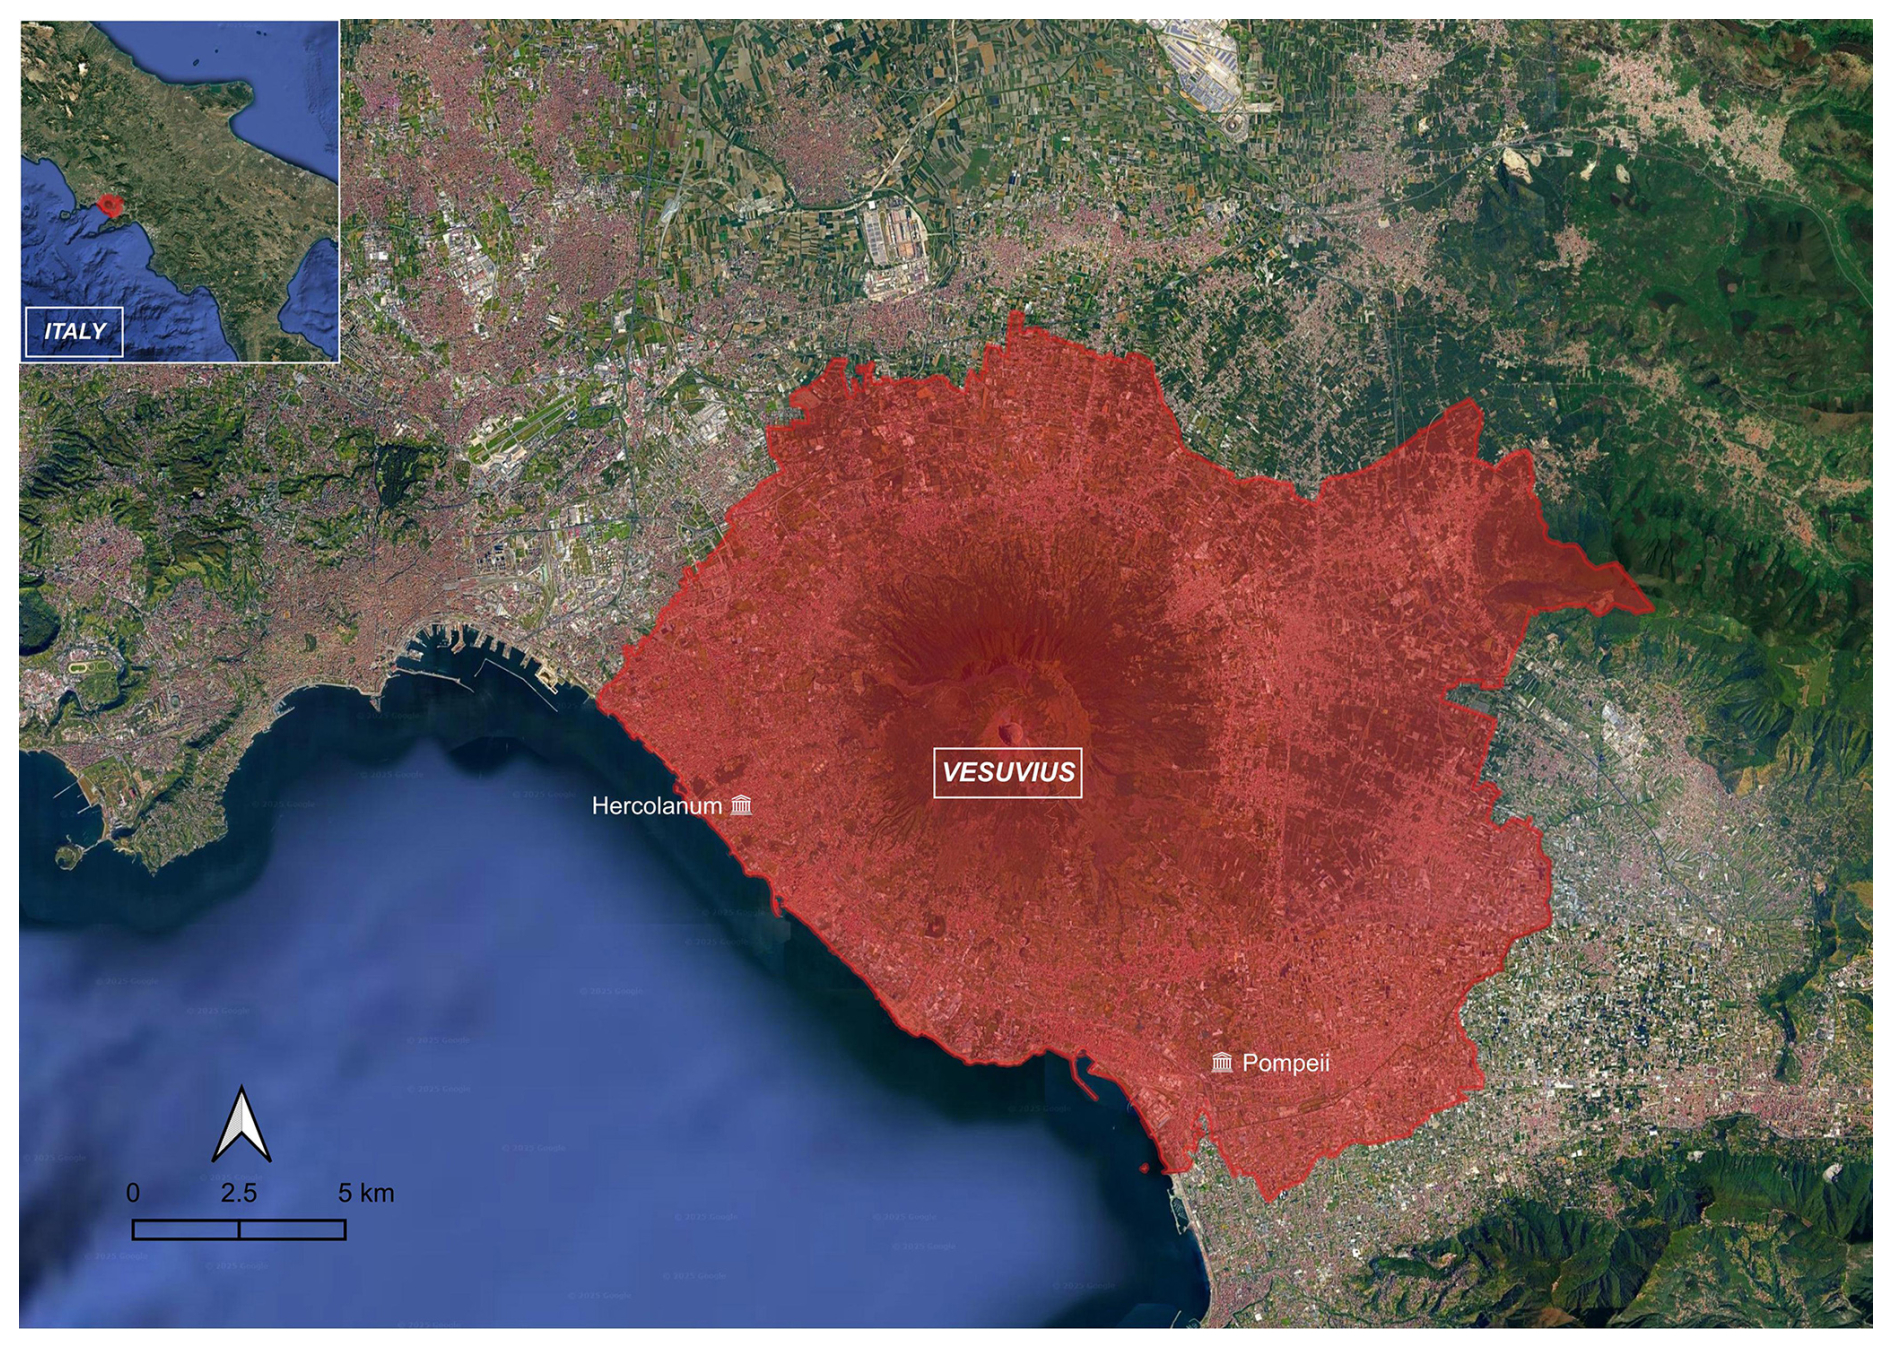
Figure 1The red zone of the evacuation plans for Vesuvius (from https://www.protezionecivile.gov.it/it/approfondimento/aggiornamento-del-piano-nazionale-di-protezione-civile-il-vesuvio/, last access: 19 March 2025; base map is from © Google Earth).
No systematic analysis of these flow characteristics as deduced from deposit properties has been made so far for assessing quantitatively the PDCs' hazard around a volcano. At Vesuvius, PDC deposits have been studied in previous papers (Cioni et al., 2004; Neri et al., 2007; Sulpizio et al., 2007; Esposti Ongaro et al., 2008; Dellino et al., 2008; Zanella et al., 2008; Sulpizio et al., 2010a; Gurioli et al., 2010; Mele et al., 2011; Zanella et al., 2015; Giordano et al., 2018; Dellino et al., 2021; Pensa et al., 2023), but a detailed investigation of the impact parameters with the aim of making a probabilistic hazard assessment is still not available. PDCs at Vesuvius represent a significant source of risk because the area surrounding the volcano is highly populated, with around 700 000 inhabitants living in the red zone, the area to be evacuated in the case of an impending eruption (Fig. 1; Civil Protection Department, 2014). The impacts that the PDCs could have on buildings or people are not quantified on the red-zone map. In this paper, we try to fill this gap and investigate the distribution of the impact parameters over the volcano's surroundings, including the red zone. PDC deposits from previous Vesuvius eruptions provide key information that can be used to deduce impact parameters from potential future eruptions. To follow this line, it is necessary to investigate the PDC deposits first, then define a general model of the current that links deposit characteristics to flow dynamics, and finally reconstruct the impact parameters that better represent flow intensity in terms of damage potential.
Stratigraphic evidence of volcanism at Vesuvius dates back to around 39 cal. kyr BP (Brocchini et al., 2001; Santacroce et al., 2008), with predominantly effusive eruptions forming the Monte Somma volcano. At about 22 cal. kyr BP, the activity changed into largely explosive eruptions, which formed the summit caldera complex of Mt Somma (Cioni et al., 1999). After the Pompeii eruption's Plinian event of 79 CE, volcanism continued mainly within the Mt Somma caldera, with the construction of modern Mount Vesuvius. The most recent eruption occurred in 1944 CE (Cole and Scarpati, 2010). The best-preserved PDC deposits are from the eruptions of Pomici di Mercato (8.9 cal. kyr BP; Santacroce et al., 2008; Mele et al., 2011), Pomici di Avellino (3.9 cal. kyr BP; Sulpizio et al., 2010b; Sevink et al., 2011), AP2 (3.5 cal. kyr BP; Cioni et al., 2008), Pompeii (79 CE; Sigurdsson et al., 1985; Cioni et al., 1992), Pollena (472 CE; Sulpizio et al., 2005), and 1631 CE (Rosi et al., 1993). PDC deposits from other eruptions can be found (i.e. Pomici di Base and Greenish; Bertagnini et al., 1998; Cioni et al., 2003) but do not have the sufficient continuity of exposure that is necessary for the hazard analysis of the present research. According to Selva et al. (2022), there is around a 34 % probability of an eruption at Vesuvius in the next 50 years, which we consider a reference time for the long-term hazard. Spotty data about the intensity of PDCs at Vesuvius in terms of potential damage have been published in the past using both geological data (Sulpizio et al., 2010a; Mele et al., 2011; Dellino et al., 2021) and numerical simulations (e.g. Neri et al., 2007; Esposti Ongaro et al., 2008), but a comprehensive assessment of the expected intensity, i.e. a quantification of the impact parameters, of PDCs in the Vesuvius area is still not available.
To take the eruptive history of Vesuvius into account and get an unbiased range of the variation in impact parameters, all the eruptions that show well-preserved deposits in the field are considered in this paper. This means that no particular event is used to propose a specific hazard scenario but that all the suitable PDC-forming eruptions are considered in order to obtain a representative sample of the impact parameters of PDCs. It is worth noting that our approach may be biased towards the larger PDCs, which are better represented in the geological record. However, these are the flows that can have a significant impact in the area under analysis. Our assessments are not based on the calculation of probability of occurrence, which would require thorough knowledge of all the PDC events. This means that the probabilistic information presented here is conditional upon an eruption occurring.
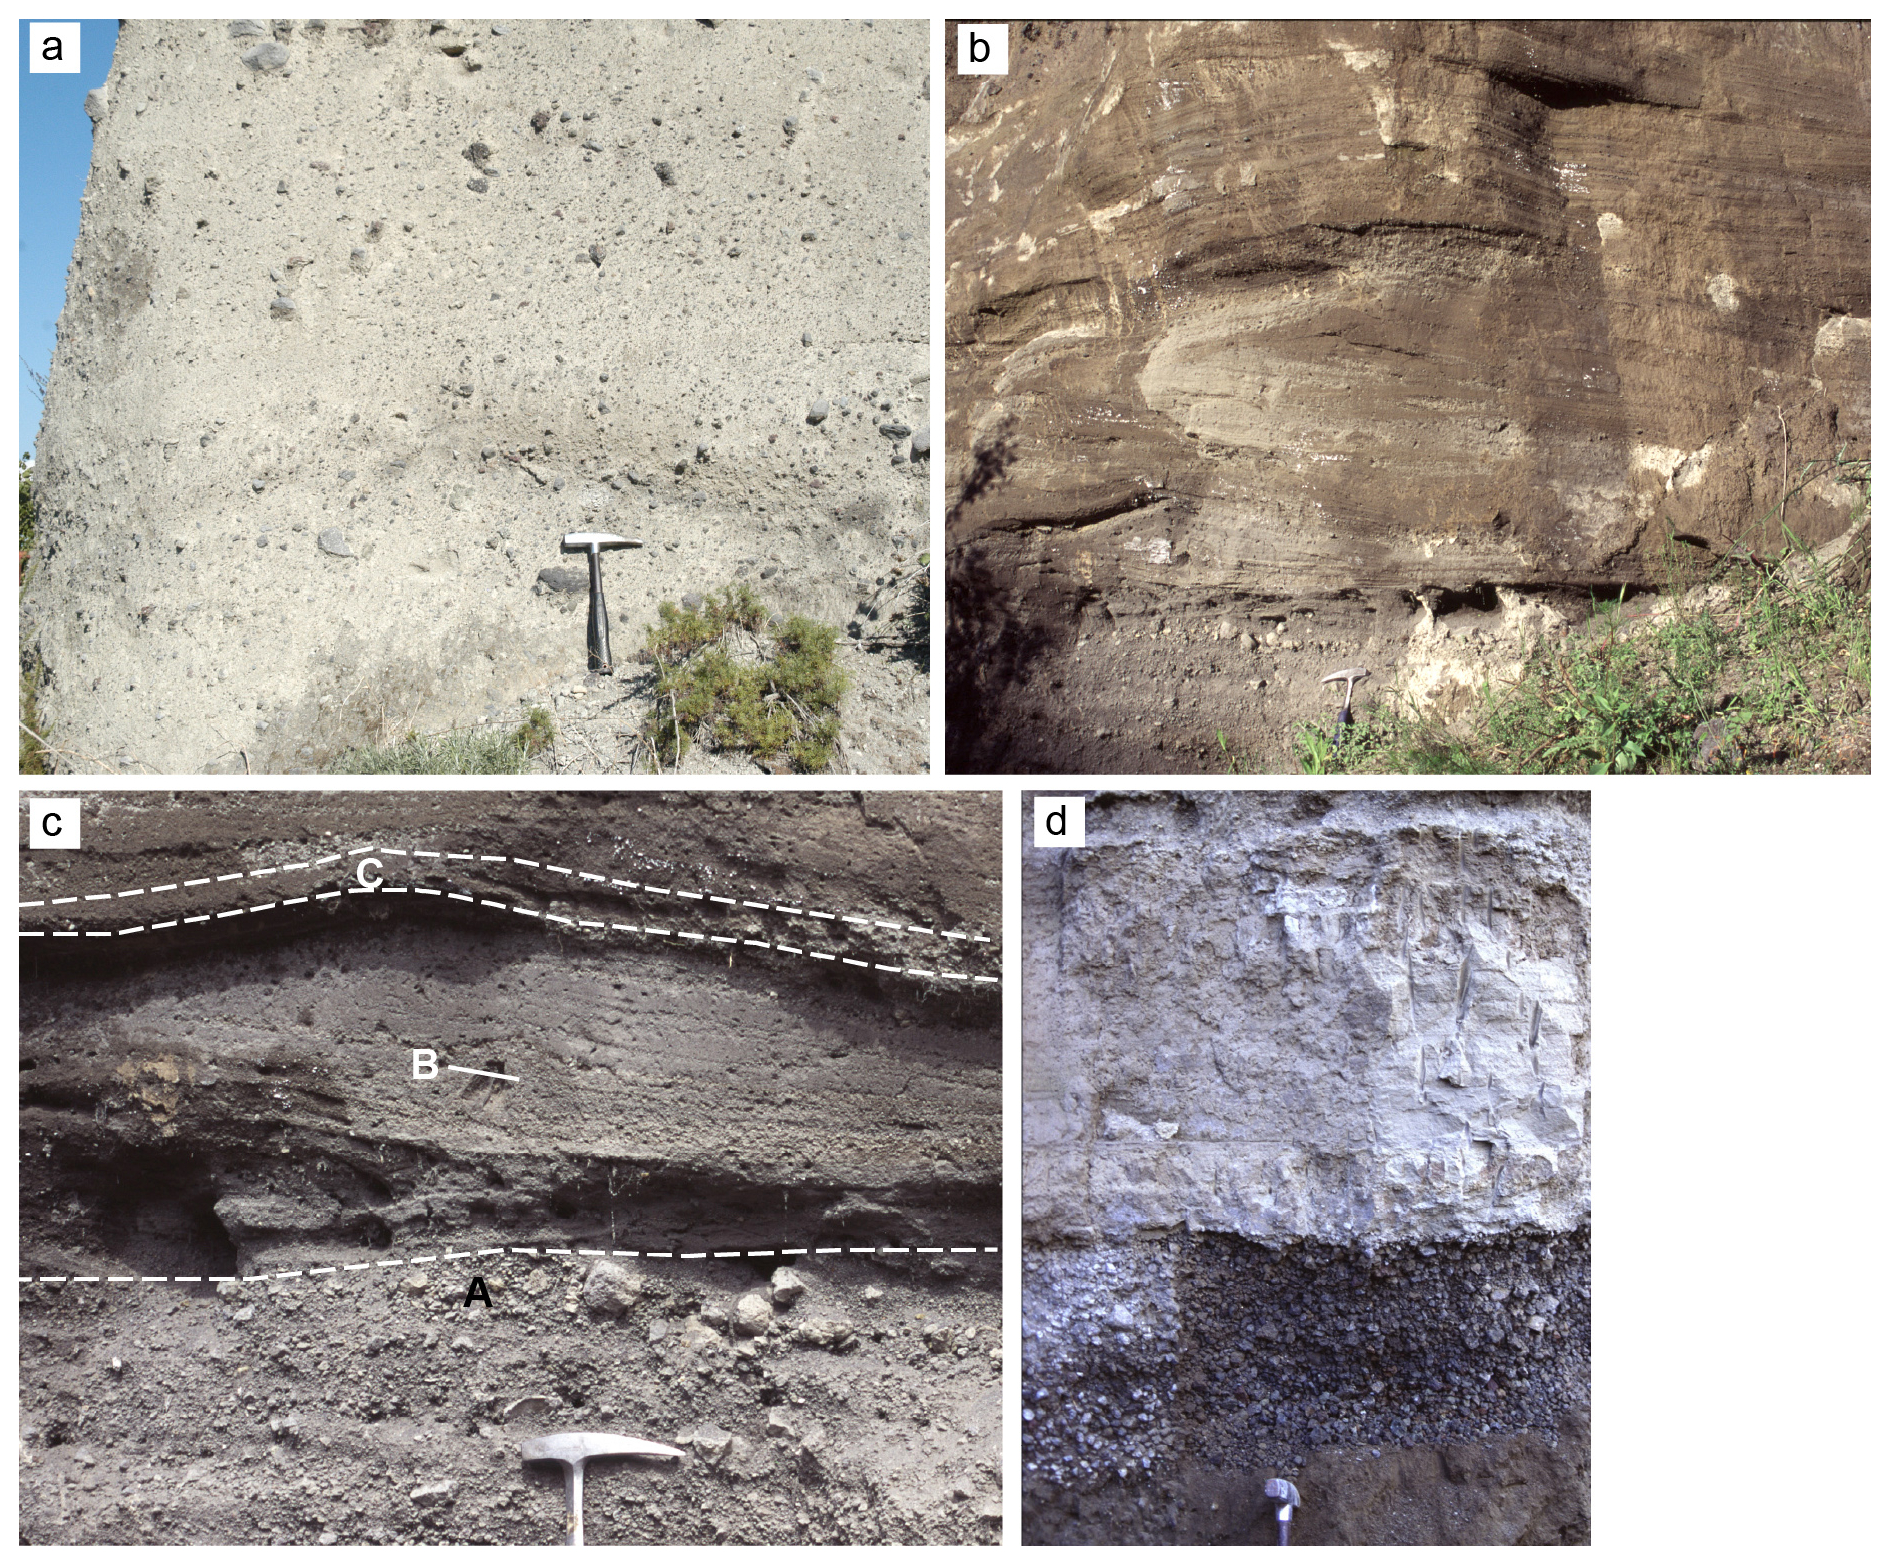
Figure 2Deposits of pyroclastic density currents at Vesuvius. (a) A massive, structureless deposit of ash, lapilli, and bombs. (b) A decimetre-to-metre-thick dune-bedded layer of ash and lapilli with internal lamination and traction structures. (c) The fining upward succession formed by the passage of a PDC: A = coarse clast entrained at the base of the current; B = laminated layer; and C = thin fine-ash layer. The dashed lines separate the three layers. (d) Fine-ash deposit (white layer).
Field studies, which extended from the gullies on the volcano flank to the plain surrounding Vesuvius, show that a PDC deposit is commonly composed of a repetitive succession of beds with stratigraphic continuity. Combining observations of all deposits, a general “facies architecture” has been defined, synthesizing the lateral and vertical succession of beds associated with a current (Fig. 2). The general facies architecture records the common behaviour of PDC emplacement at Vesuvius.
In the proximal area, along the gullies that cut the volcano slope, the vertical facies architecture is generally composed of a metres-thick, poorly sorted massive layer of ash, lapilli, and bombs (Fig. 2a). It is overlain by a decimetre-to-metre thick stratified, sometimes dune-bedded, horizon of ash and lapilli with internal lamination and traction structures (Fig. 2b, c). The facies architecture is capped by fine-grained ash layer(s) of centimetric thickness (Fig. 2d). Coarse-grained massive facies occur close to the break in slope between the volcano and the surrounding apron, at the mouth of the main valleys draining the volcano slopes. Stratified facies predominate in interfluve deposits, and, for Avellino and Pompeii eruptions, this stratified facies occurs also beyond the break in slope up to the distal area (tens of kilometres from the volcano). As a general rule, the stratified facies decreases in thickness and grain size with distance from the source, while the fine-grained ash facies remains almost constant in grain size and thickness (Fig. 2d).
In the volcanological literature, massive and stratified deposits have been interpreted either in terms of distinct flows or in terms of bipartite currents in which the massive part refers to a highly concentrated undercurrent and the stratified one to the overlying dilute turbulent current (commonly referred to as ash-cloud surge). In other cases, the massive deposit has been interpreted as syn-sedimentation reconcentration and/or rapid remobilization of material first deposited by a primary stratified current (Druitt et al., 2002; Valentine et al., 2022). In the case of Vesuvius, we interpret the deposits as the result of a bipartite current because the massive deposit and the overlying stratified one are always in stratigraphic continuity, which means that no erosional surfaces are found in between layers; hence no temporal breaks are associated with the layers' emplacement. Following this interpretation, the facies cropping out along the gullies are the result of a highly concentrated basal underflow, which forms the massive facies, and an overlying stratified facies resulting from the dilute current and the capping fine ash that records the settling of lingering ash after passage of the current. The contemporaneous occurrence of a massive underflow together with a dilute overcurrent has already been reported (Fisher, 1979; Cas and Wright, 1987; Gernon et al., 2013; Breard and Lube, 2017). This deposit architecture can be interpreted in terms of a current that in its early phase of development was separated into two parts, depending on a different balance between the sedimentation rate and the bedload flux (Dellino et al., 2019, 2020).
Our interpretation is that the massive layer was fed directly from the collapse of the eruptive fountain on the ground, which was characterized by a high sedimentation rate that damped turbulence due to a high particle concentration. It has already been demonstrated that thick massive deposits can be formed because of a high sedimentation rate, which inhibits traction at the bedload (Lowe, 1982, 1988; Fisher, 1990; Druitt, 1992; Kneller and Branney, 1995; Branney and Kokelaar, 2002; Woods et al., 2002; Postma et al., 2009). Furthermore, experiments show that massive beds are formed from suspension where the sedimentation rate exceeds the bedload flux by 2 orders of magnitude (Dellino et al., 2010, 2019). The underflow was channelized along the volcano valleys and stopped abruptly at the break in slope (Fig. 2a).
The lateral stress generated by the collapse on the ground of the eruption fountain led to the expulsion of part of the collapsed material and fed an overlying shear flow decoupled from the massive flow (Sweeney and Valentine, 2017; Valentine and Sweeney, 2018; Dellino et al., 2020; Valentine, 2020). It evolved laterally into a highly expanded, fully turbulent gas–particle current that formed both the stratified facies (Fig. 2b, c) and the fine-grained ash from gentle settling of the suspended material during the waning phase of the current. The fine ash has a sedimentation time and can easily drift away from the lower-atmosphere winds over the plain surroundings of Vesuvius.
Before showing the hazard intensity maps obtained by integrating data from all eruptions, the approach used in the reconstruction of the impact parameters is illustrated by the example of one PDC deposit of the Pomici di Mercato eruption. The stratigraphy of this eruption (Mele et al., 2011) is made up of alternating fallout and PDC deposits that are well-exposed in the northern sector of the volcano (Fig. 3a). The massive bed and the overlying stratified one are in stratigraphic continuity and can be traced for a sufficient distance without showing erosional contact. Therefore, we interpret them as the result of a bipartite current. The PDC deposits considered here are from the first phase of the eruption and were generated by the collapse on the ground of an eruptive fountain, whose tentative location is represented by the black dot at the rim of Fig. 3a, as deduced by the maximum thickness (2 m) of deposits. The deposit sequence consists of a metre-thick, poorly sorted massive layer of lapilli and scattered bombs and blocks set in an ash matrix (Fig. 3b, c), which is related to the highly concentrated underflow, and a dune-bedded, stratified layer (Fig. 3c, d), which is related to the overlying dilute current (Mele et al., 2011; Dellino et al., 2019). When cropping out on the gentle slope of the volcano flank, the stratified layer shows a thickness of 0.5 m with small dunes of lapilli and ash of 1 m wavelength and 0.1 m in height (Fig. 3c).
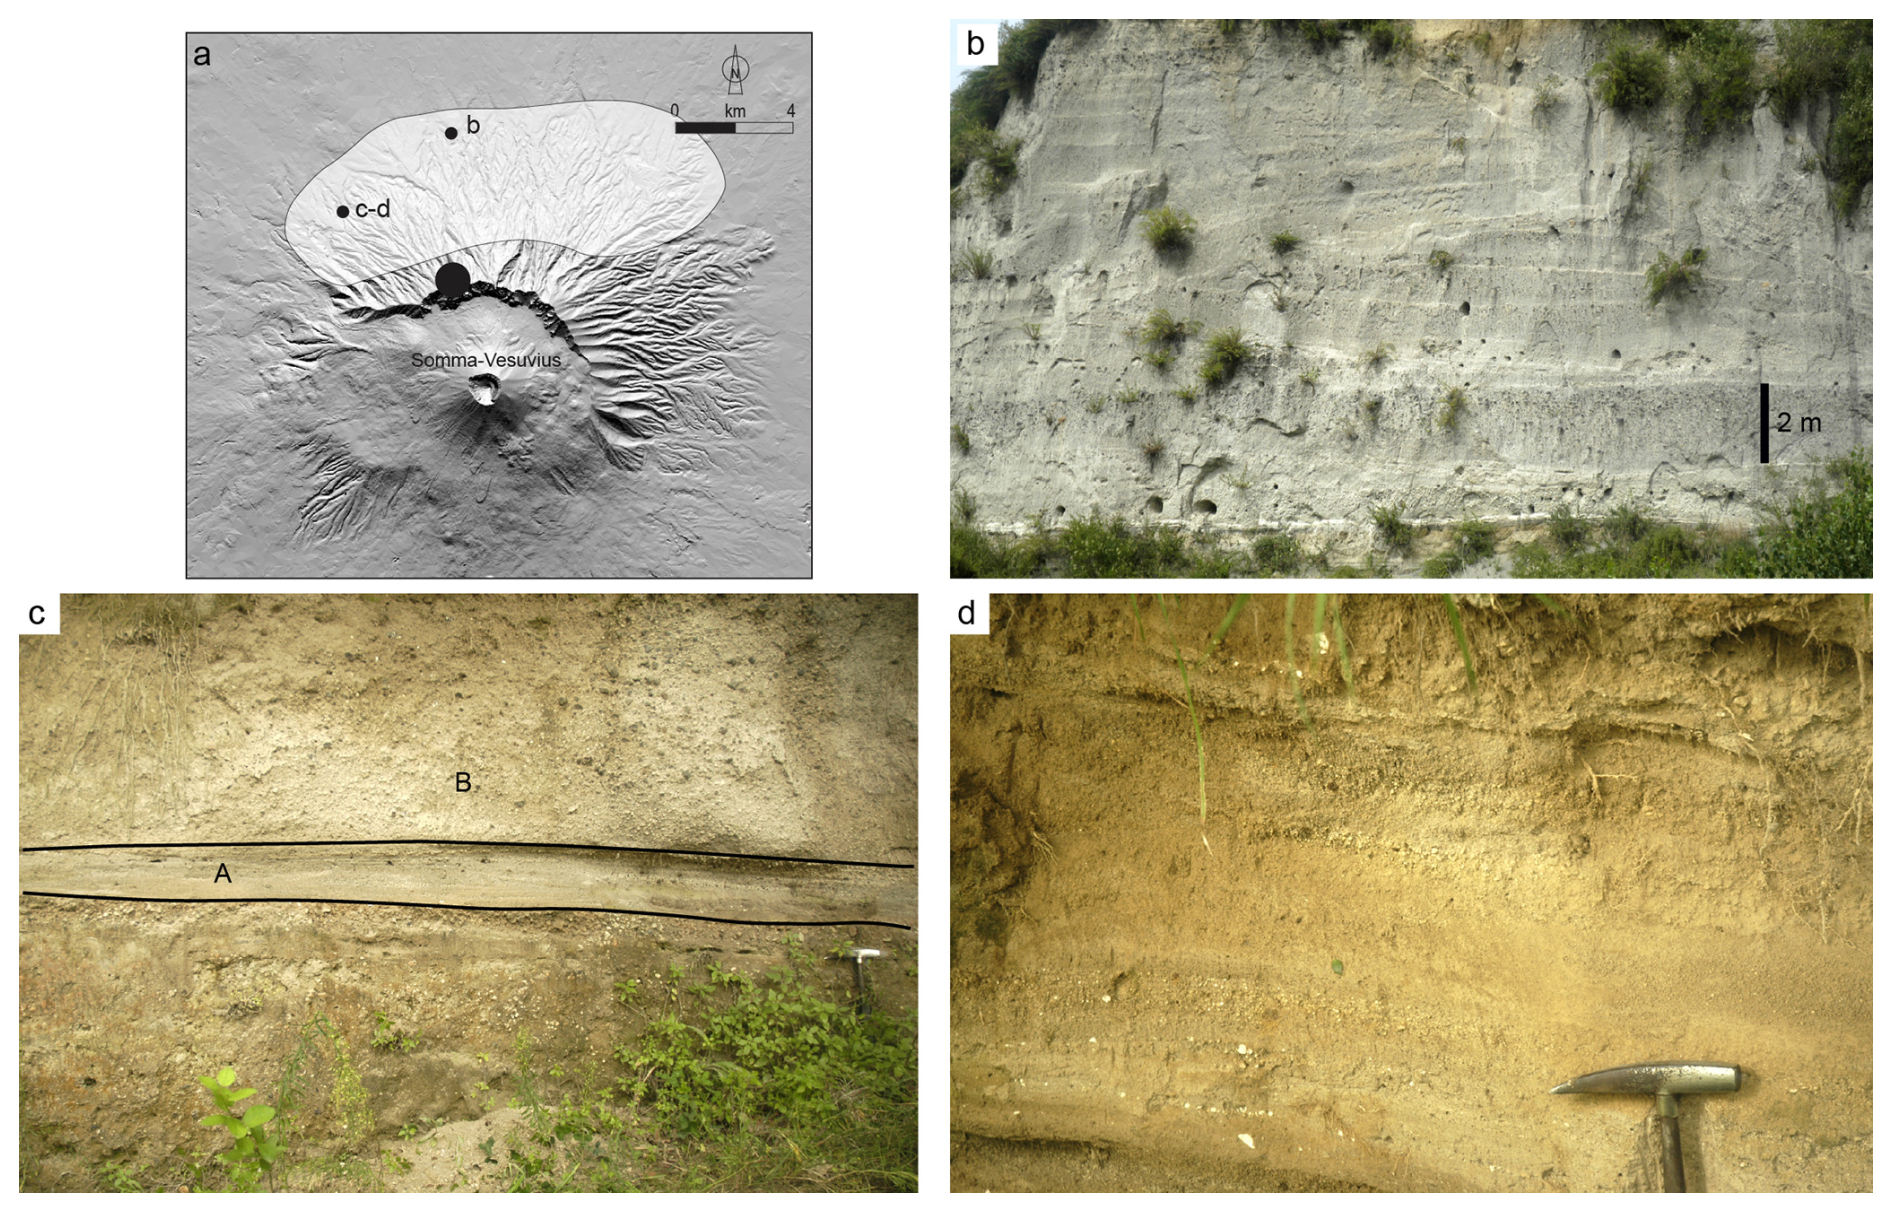
Figure 3Field pictures showing the Pomici di Mercato eruption deposits used as a case study. (a) The labels b, c, and d refer to the deposits shown in (b), (c), and (d). The c–d location corresponds to the MC13/4 massive and MC13/4 samples in Table 2. The large black circle represents the zone of impact of the eruptive fountain (the digital elevation model by Tarquini et al., 2023). The white shaded area represents the dispersal area of the PDCs. (b) The massive deposit emplaced by freezing at the break in slope, indicated by the scale bar. (c) The stratified layer (A) that, being faster, arrived before the massive layer (B) at the split location. (d) The hammer points at the stratified layer on top of the massive layer at the split location.
The physical characteristics of the bipartite current need to be reconstructed by means of two separate models.
In the following, the model of the overlying dilute current, which represents the deposition of the dune-bedded layer, is discussed first. Afterwards, the model of the highly concentrated undercurrent forming the massive bed is presented. This order is justified by the fact that data from the overlying dilute current provide information on the underlying concentrated one.
3.1 Model of the overlying dilute current forming the dune-bedded layer
The overlying dilute current, which formed the stratified dune-bedded layer, is modelled as a turbulent boundary layer shear flow (Furbish, 1997; Dellino et al., 2008) that carries solid particles into suspension. Flow movement is initiated by the gravity acting on the current along the volcano slope, which is due to the density difference between the volcanic gas–particle mixture and the surrounding atmosphere. The current is made up of a mixture of magmatic gas, volcanic particles, and air entrained by turbulence during runout. It is stratified in terms of velocity and particle concentration, hence density (Middleton and Southard, 1984; Valentine, 1987). As a consequence of sedimentation and air entrainment, the volumetric particle concentration decreases along the flow path down to a point where the density difference with atmosphere is nullified, and the current stops its lateral movement and may become buoyant. The final deposition from the buoyant part of the current forms the fine-ash layer that closes the layer sequence.
The distribution of particles of different size, density, and shape in the PDC deposit suggests that a link exists between current flow dynamics and particles that are first taken into suspension, then sedimented into a bed load, and finally moved by traction on the ground. Such links allow the use of particle characteristics (size, density, and shape), as measured in the laboratory on sediment samples, for constraining the flow model and calculating the impact parameters.
A detailed formulation of the physical model (Dellino et al., 2008) and the numerical software code PYFLOW v2.5 (Dioguardi and Dellino, 2014; Dioguardi and Mele, 2018) is deferred to Appendix A. The main data used as input are reported in the Zenodo repository (Mele et al., 2024). Here, only the main principles of the probabilistic approach are summarized.
The basic assumption is that, at sedimentation, the settling velocity of particles equals the current shear velocity (Middleton and Southard, 1984; Dellino et al., 2008), which is a quantity that, together with flow density, allows estimation of the impact parameters (dynamic pressure, particle concentration, temperature, flow duration). The settling velocity depends on the particle characteristics, mainly grain size, density, and aerodynamic coefficients. Deposits are characterized by a broad distribution of particle sizes and densities, which can result from unsteady flow fluctuations that, upon sedimentation, affect shear velocity and settling velocity. In order to take such unsteadiness into account, solutions are provided in terms of the probability density function (PDF) of the grain-size distribution of deposit samples. In this paper, the solution corresponding to the 84th percentile of the PDF is used in the maps of impact parameters. It is considered a safety value for evaluating the damaging effect of the impact parameters. The method has been validated by large-scale experiments (Dellino et al., 2010), where values of the impact parameters measured by sensors fell well within the range of solutions of the probability density function. Also, it was demonstrated that the solid particles temperature did not change much before the experiment and in the deposits after the experiment. This means that the simple model of flow temperature we used, which takes into consideration only the gas–particle average mixture temperature and not the interphase heat exchange between phases, is an acceptable approximation of the average temperature of the gas–particle mixture. In the following, the results of flow dynamic pressure, particle volumetric concentration, temperature, and flow duration, which represent the impact parameters, are illustrated for an example of the Pomici di Mercato eruption.
3.1.1 Flow dynamic pressure and particle volumetric concentration
In order to illustrate how the calculated flow characteristics vary vertically in the stratified current, the profiles of particle concentration, density, velocity, and dynamic pressure calculated from a single outcrop of a Pomici di Mercato's PDC deposit are shown in Fig. 4. Results are presented by means of the 84th, 50th, and 16th percentiles of the PDF, which were calculated with the method of Dioguardi and Dellino (2014; see the method in Appendix A) and show the statistical variability in terms of percentiles. Here, we present the vertical profiles up to 50 m above the ground level (a.g.l.), which is the minimum estimate of the total flow thickness calculated by PYFLOW.
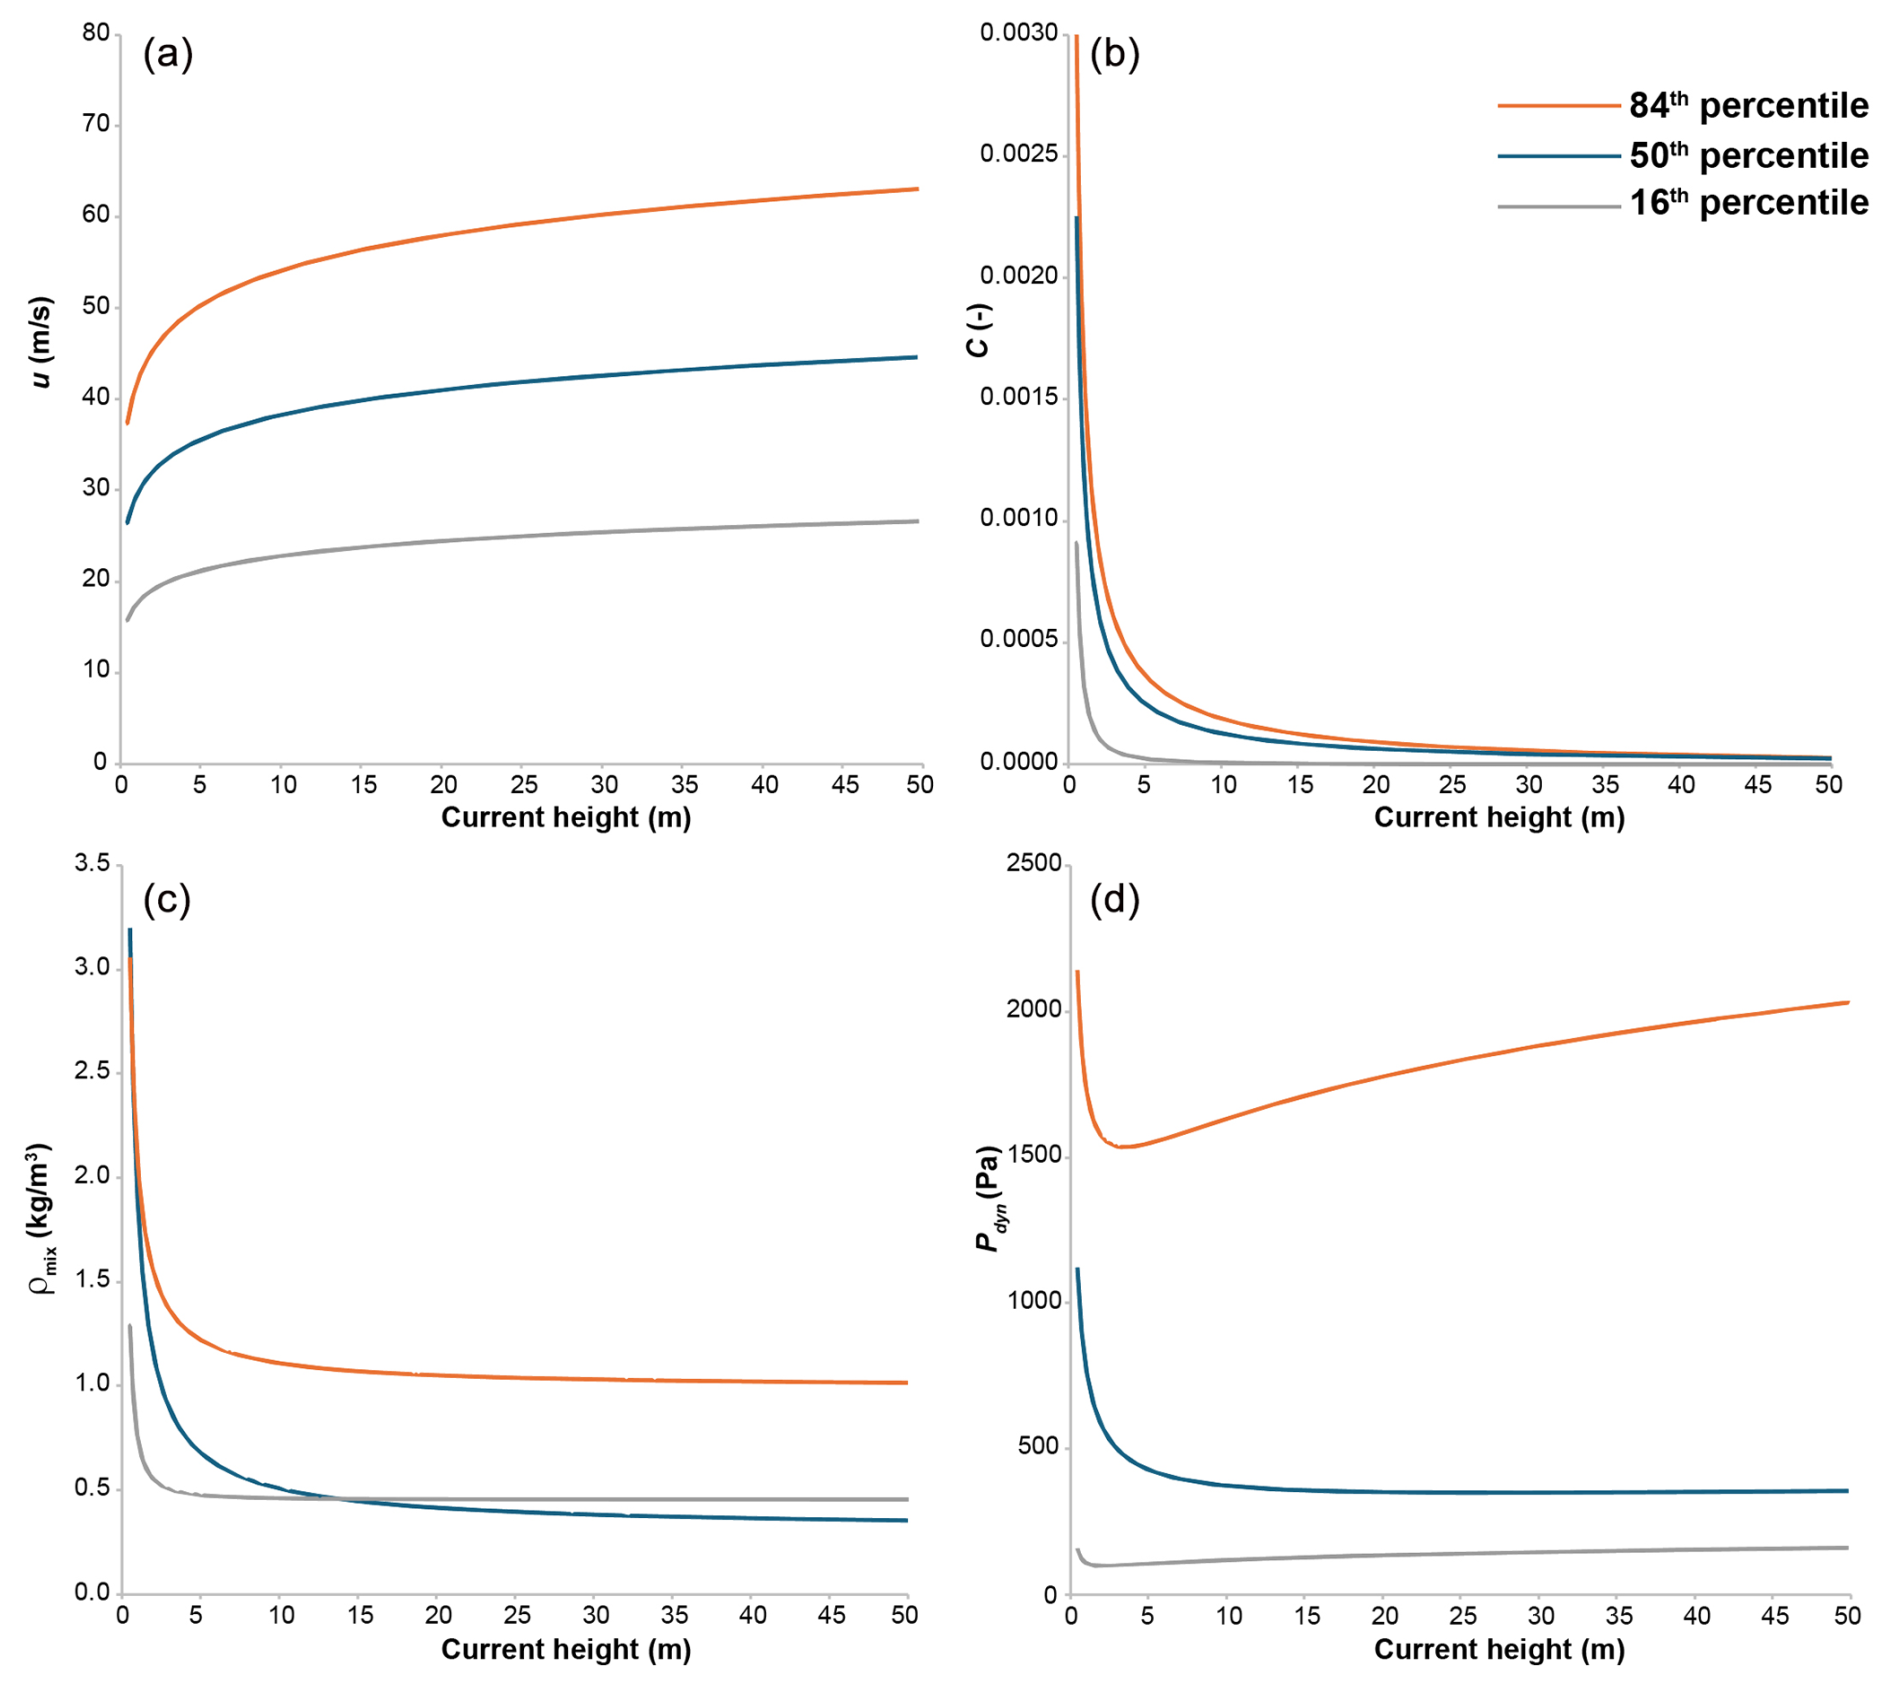
Figure 4Example of parameter calculation of a PDC of the Pomici di Mercato eruption. The curves refer to the minimum (16th percentile), the average (50th percentile), and the maximum (84th percentile) of the probabilistic model solution. (a) Velocity profiles. (b) Particle volumetric concentration profiles. (c) Density profiles. (d) Dynamic pressure profiles.
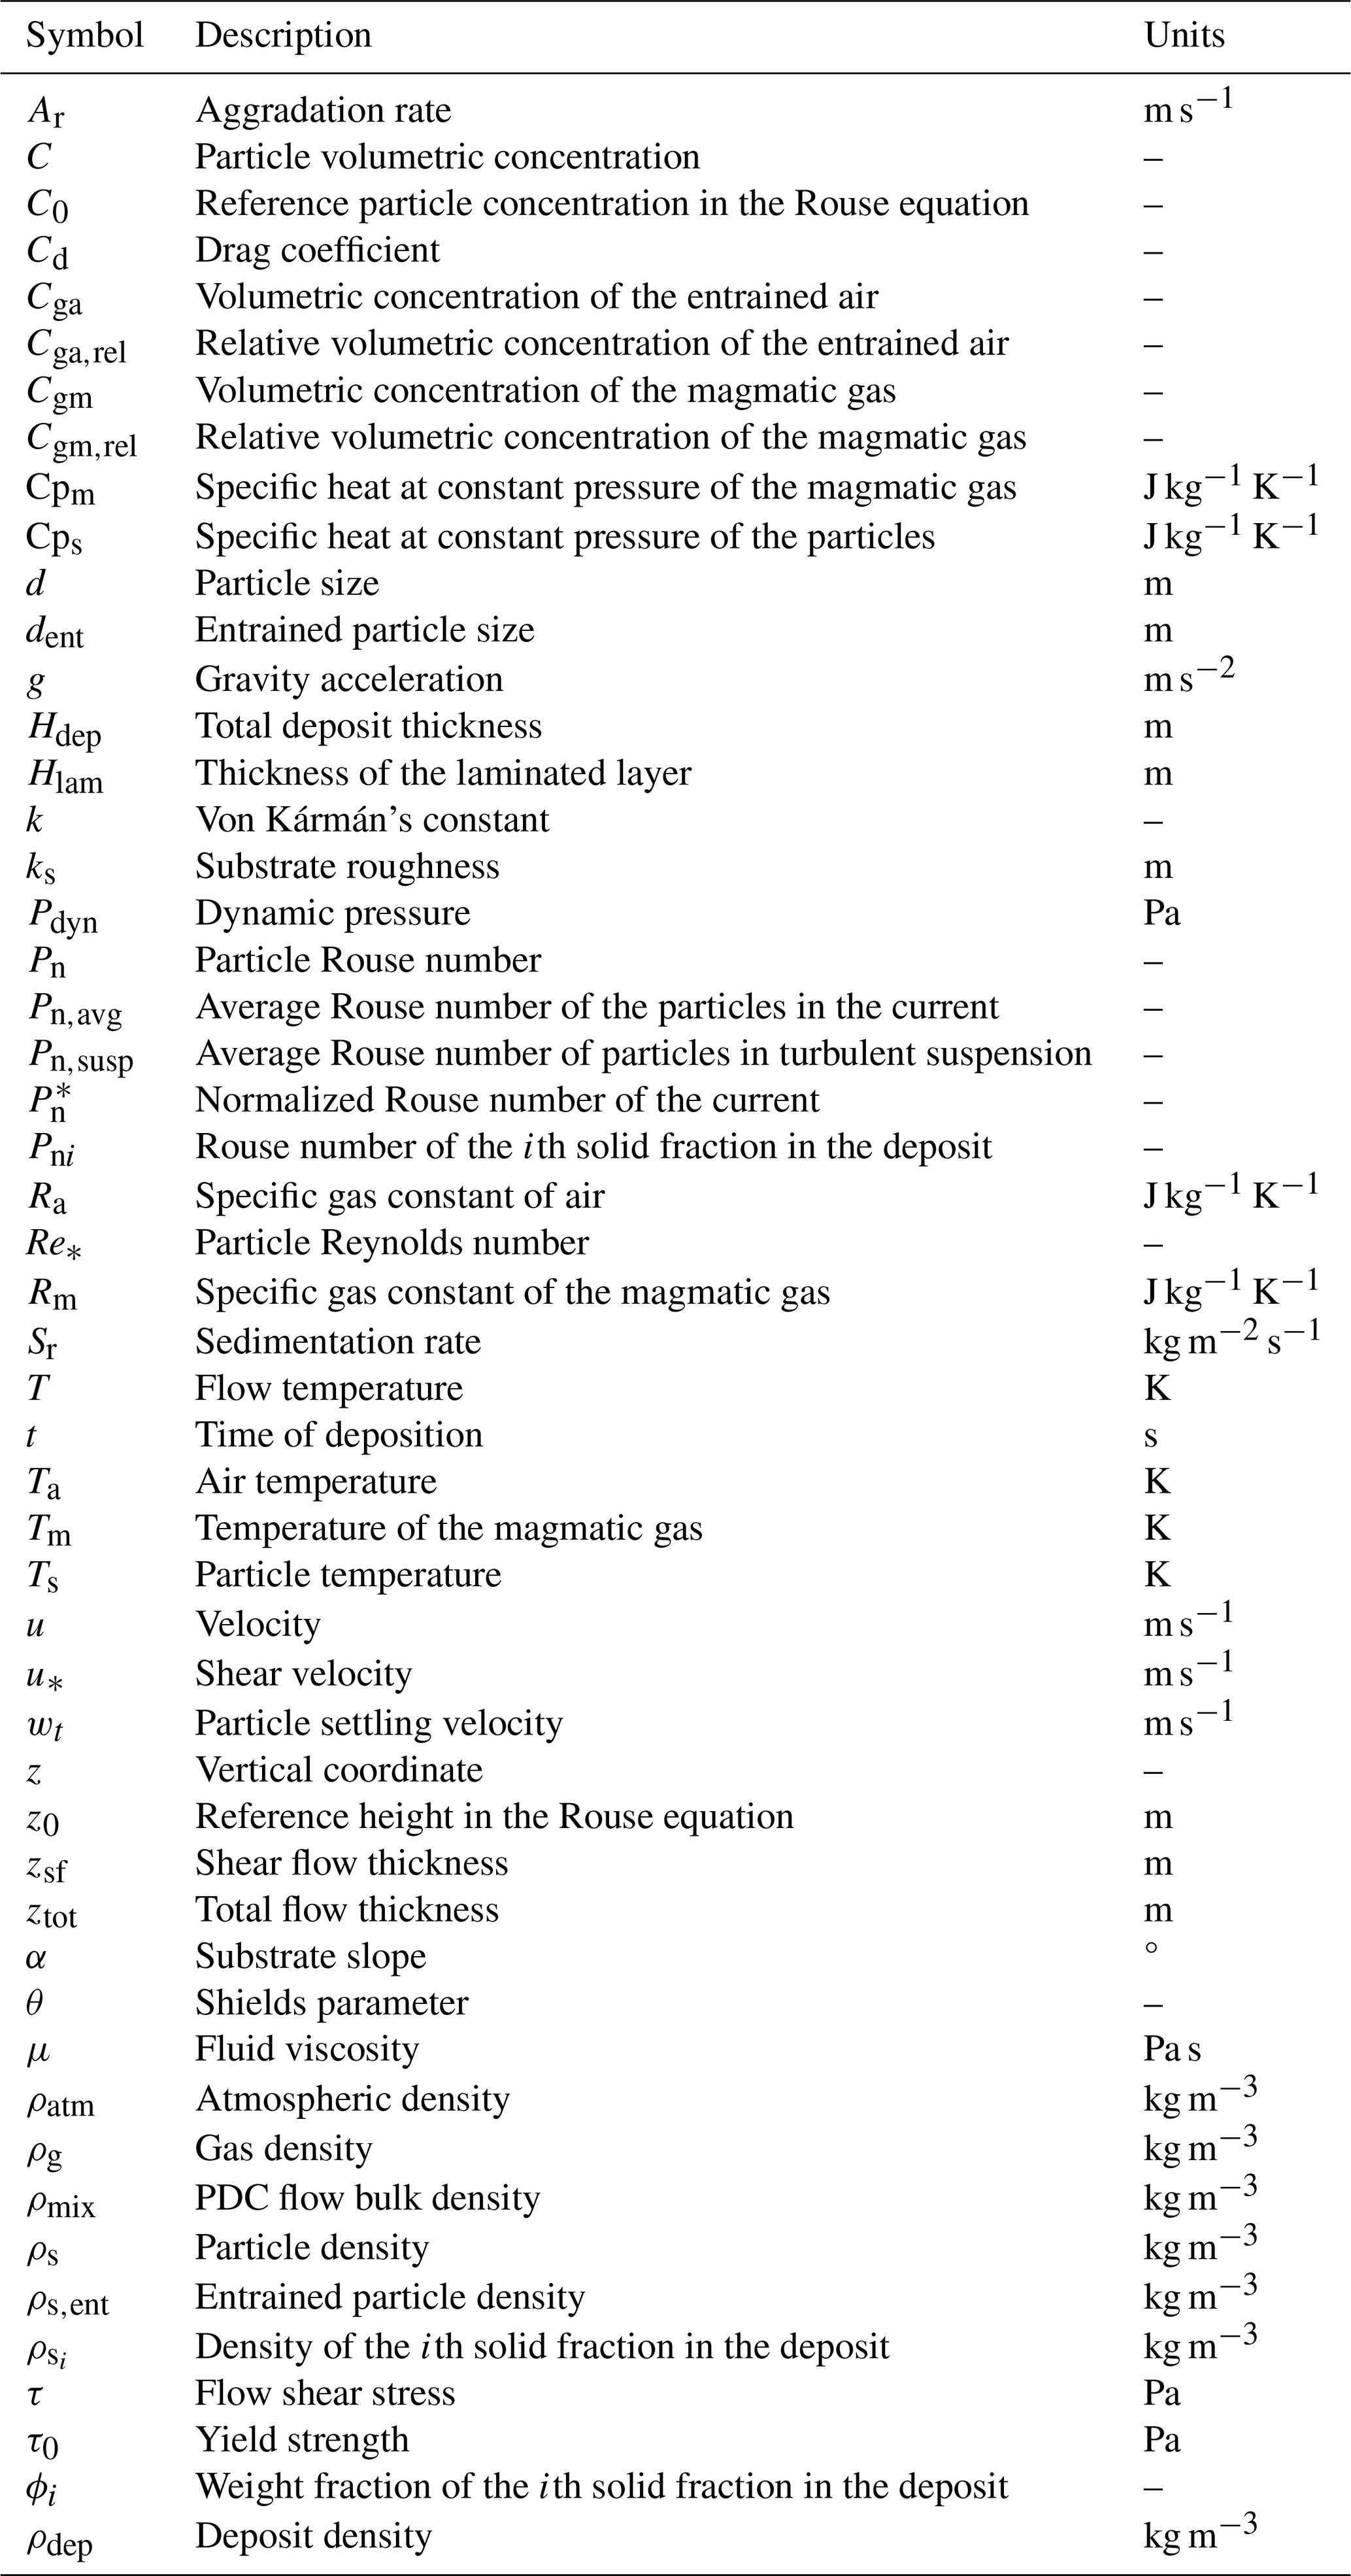
Velocity (u) logarithmically increases upwards in the flow (Fig. 4a), reaching values in the range of tens of m s−1 (a list of symbols is provided in Table 1). Particle volumetric concentration (C) decreases with height (Fig. 4b) and already in the first few metres is lower than 0.001. The density profile (ρmix) mimics the trend of the concentration profile (Fig. 4c) and rapidly decreases down to a value lower than atmosphere (which is reached, typically, at a concentration about 0.0001), making the upper part of the current buoyant. The dynamic pressure Pdyn has a maximum in the first few metres (Fig. 4d). Higher in the current, dynamic pressure ranges around 1 kPa. The Pdyn value integrated over the first 10 m of the current, which we consider helpful for representing the stress acting on a typical building, is 1.7 kPa, in the 84th-percentile curve for this example. With such a value, moderate mechanical damage is expected (Zuccaro et al., 2008; Zuccaro and Leone, 2012).
3.1.2 Flow temperature
Flow temperature was calculated using, as input in Eq. (A17) (see Appendix A), the values of density, concentration, temperature, and specific heat of the three components of the gas particle mixture, namely magmatic gas, air, and volcanic particles. The temperature of magmatic gas Tm and of volcanic particles was set to 850 °C, which is compatible with the temperature of Vesuvius magmas (Cioni et al., 2004). Average density was set to 1700 kg m−3 for the volcanic particles, to 0.2 kg m−3 for volcanic gas at 850 °C, and to 1.2 kg m−3 for air at 18 °C. The specific heat values were set to 2200 J kg−1 K−1 for volcanic gas, 700 J kg−1 K−1 for the volcanic particles, and 1005 J kg−1 K−1 for air. As for the particle concentration, an average value of 0.001 was set, which was obtained by integrating the concentration profile over flow height from the ground to 10 m a.g.l. (see Fig. 4b) by means of Eq. (A7). The relative concentrations of air and magmatic gas were obtained by the method illustrated in Appendix A and resulted in 0.941 and 0.058, respectively. A temperature of about 500 °C was obtained in the first few metres of the current by solving Eq. (A17). The low temperature obtained in the distal areas for other deposits (sometimes lower than 200 °C) is due to the very low content of solid particles and a high content of cold atmosphere air in the current, which is attributed to the air entrainment process that characterizes PDCs along runout (Dellino et al., 2019). We consider this a minimum value, since in our model no heat transfer between phases is considered, assuming that the time of mixing was relatively low and did not allow rapid heat exchange. This is also confirmed by experiments, as reported in a previous section.
3.1.3 Flow duration
Based on the assumption that the sedimentation rate of a stratified layer is almost constant during aggradation, flow duration was calculated by dividing layer thickness (Hdep) by the sedimentation rate (Sr) (Lajoie et al., 1998). The method is described in Appendix A and is derived by Dellino et al. (2021). The input data (particle concentration, Rouse number, and settling velocity) are all functions of the shear flow density, which was calculated in terms of a PDF with PYFLOW v2.5 (Dioguardi and Mele, 2018). As a consequence, flow duration is also expressed in terms of probabilities. The average flow duration was about 20 min, representing the case study of the Pomici di Mercato eruption. The duration is quite long when compared to the couple of minutes considered a survivable time for people engulfed in a PDC, even at low temperature (Horwell and Baxter, 2006; Baxter et al., 2017).
3.2 Model of the highly concentrated undercurrent that formed the massive bed
In order to constrain the general model of the basal part of PDCs that forms the massive deposits, we can start from the experimental data on granular flows of volcanic material passing over a break in slope (Sulpizio et al., 2016). The method was successfully tested against granular avalanches of the 1944 eruption at Vesuvius and for some of the volcaniclastic flows that occurred on 5–6 May 1998 in the Sarno area. In particular, Sulpizio et al. (2016) provided an equation linking velocity and distance travelled beyond the break in slope, using different slope ratios:
Here vmax is the velocity at the break in slope; D is the distance beyond the break in slope; and m, n, and p are parameters depending on ΔH, defined as the difference in height between the source area and the front of the deposit:
Here a, b, and c are parameters depending on the slope ratio (SR), defined as the ratio between the slope downvalley and upvalley of the break in slope:
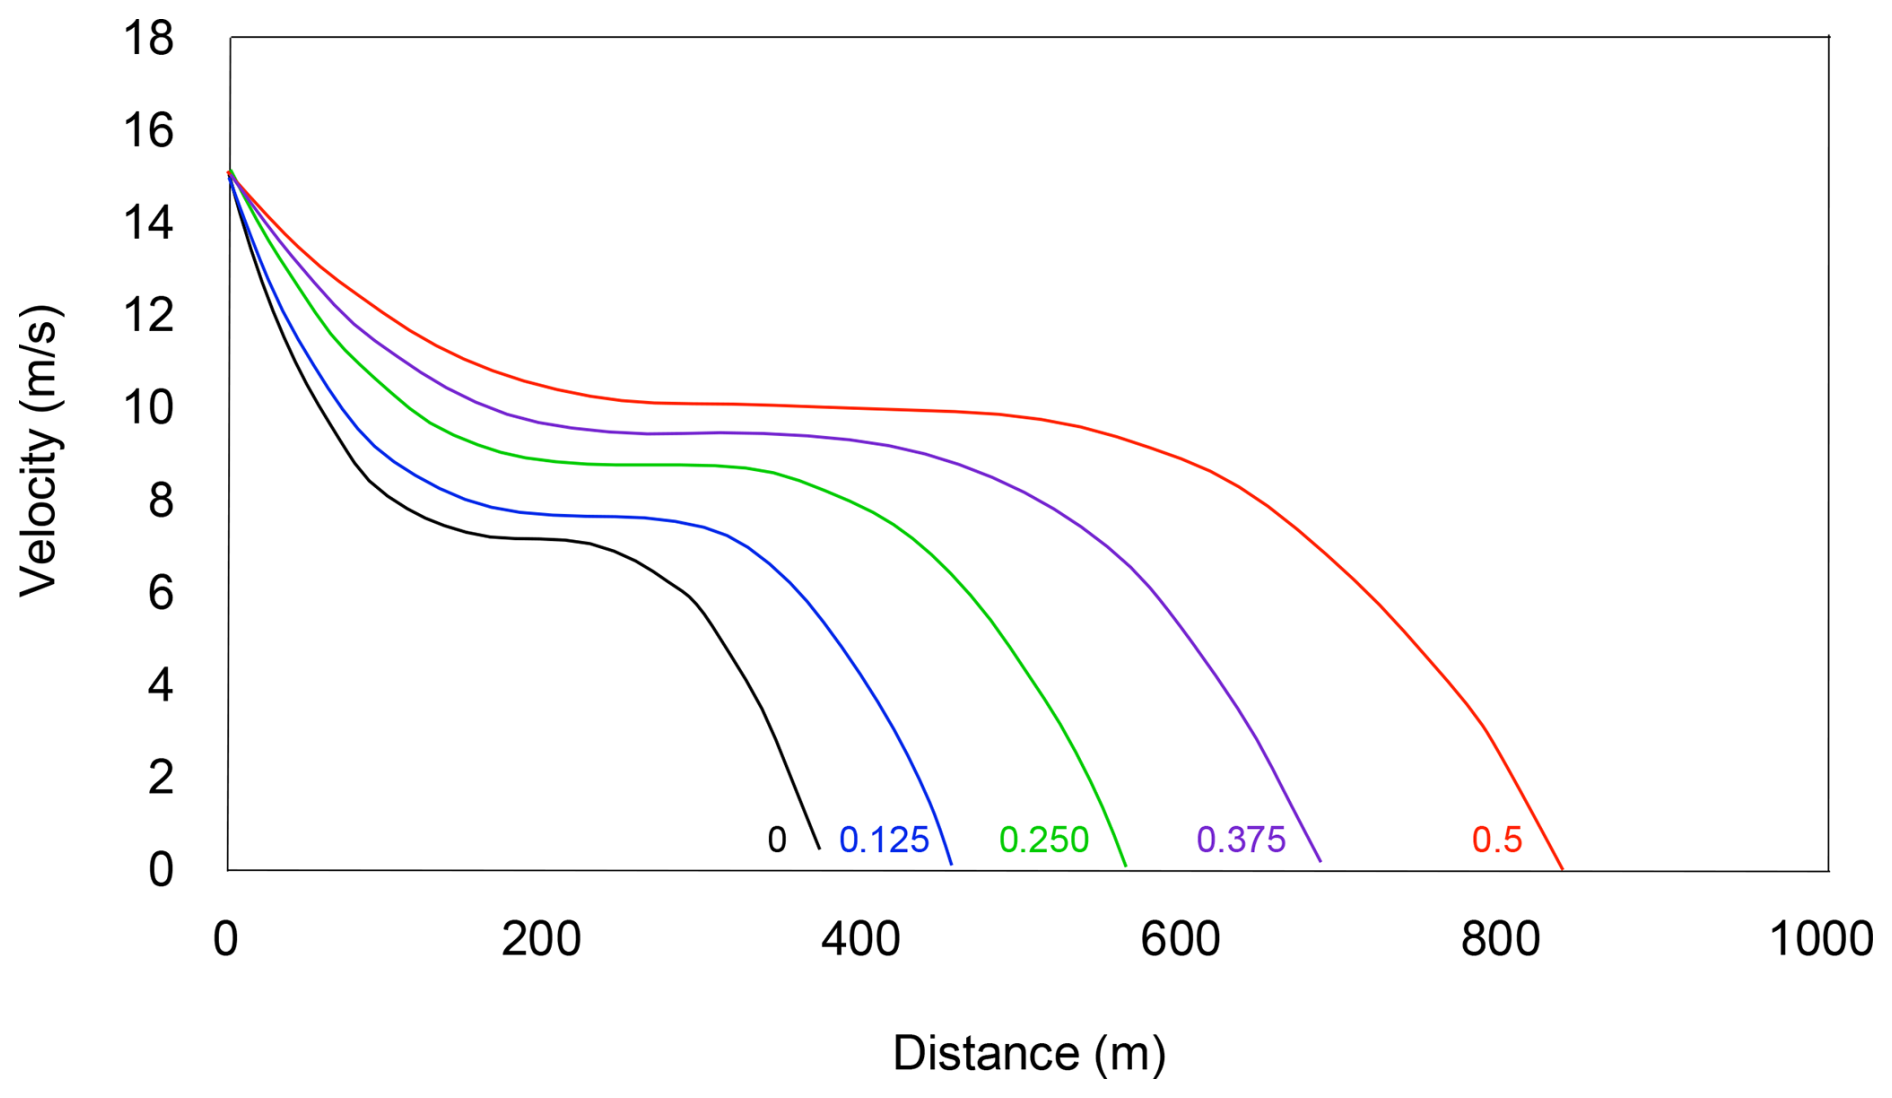
In order to get the velocity at different distances beyond the break in slope, we have to set ΔH and vmax. For the case under consideration, the elevation of impact on the ground of the collapsing pyroclastic material was set at around 800–900 m (the hypothetical height of collapse from the Plinian column; Wilson, 1980; Woods, 1995) and the elevation of deposit occurrence was set around 200–300 m, which resulted in a ΔH of 600–700 m. The velocity at the break in slope can be set at around 15 m s−1, similar to that measured for volcaniclastic flows of 5–6 May 1998 in the Sarno area (Zanchetta et al., 2004). The present-day SR around Vesuvius is close to 0.5, which has been used as an input value in Eq. (3). Figure 5 shows the results for a ΔH of 600 m. It is worth noting that the deposit lateral extent from the break in slope, for SR = 0.5, is around 800–900 m, in quite good agreement with the field data (Gurioli et al., 2010).
In order to constrain the specific flow model of Pomici di Mercato eruption, we used data from the stratified layer formed by the overlying current. When cropping out on the gentle slope of the volcano flank, the stratified layer is 0.5 m thick. When it occurs along the slopes of the gullies departing from the crater rim, it is split into two parts by the intercalated massive layer of the underflow. The split consists of a 0.15 m thick basal part (Fig. 3c) and a 0.35 m thick top part (Fig. 3d). The intercalated massive layer is 1.6 m thick (Fig. 3c). The different speeds of the two flows moving downslope justify such interpenetrating stratigraphy between the massive and the dune-bedded layer. The dilute current, being faster, overtook the slower basal flow and started forming the dune-bedded layer by aggradation at the split location. After the concentrated flow passed over, the aggradation of the dune-bedded layer continued as long as the current was fed from the source. This kind of sandwiching stratigraphy is quite common for sedimentary deposits formed by density currents, as reported for turbidites (e.g. Talling et al., 2004).
The speed of the underflow can be estimated by the ratio between the distance from the crater rim (Mount Somma) and the total time the underflow took to reach the dune-bedded layer at the “split” location. The total time is evaluated by summing the time the overcurrent took to reach the split location plus the time that the overcurrent took to accumulate, by aggradation, the part of the stratified layer found under the massive one (0.15 m). The time the overcurrent took to reach the split location, 95 s, was calculated by the distance, 4 km, and divided by the speed of the overcurrent, ca. 42 m s−1, which was calculated by means of the turbulent boundary layer shear flow approximation (Eq. A6) using PYFLOW v2.5 (see sample 13/4 in Table 2 and Mele et al., 2024). With the software, the time of aggradation of the stratified layer found under the massive layer was calculated and was found to be 1140 s. The total time that the underflow took to reach the split location was 1235 s, corresponding to a velocity of the massive undercurrent of 3.23 m s−1, which is much slower than that of the overcurrent, as is expected for a highly concentrated massive flow moving downslope.
The concentrated undercurrent stops at the base of the volcanic cone, where, as a consequence of the decrease in the slope angle, it freezes in a 2 m thick massive layer (Fig. 3b). Such a behaviour is typical of particulate material with a high internal yield strength that does not allow downslope flowage until a minimum shear stress is overcome, similarly to a Bingham plastic (Furbish, 1997). Such flows stop when the slope decreases, and the yield strength equals shear stress. Assuming that flow density was not much different from that of the deposit, i.e. 1400 kg m−3 (as calculated by considering a known volume of deposits and weighing it), the yield strength τ0 can be equated to the shear stress acting on the slope, which results in the minimum stress for the downslope movement of the massive flow:
with a slope angle α of 1.5° and a deposit thickness Hdep of 2 m, giving a yield strength of 700 Pa.
By inverting the equation of the height-averaged velocity of a Bingham plastic,
and using the value of yield strength τ0 previously obtained, the thickness H of the massive layer, and a slope angle at the split location of 6.5°, a viscosity μ of 200 Pa s results, which completes the rheological characterization of the massive underflow. Such a rheology is compatible with other massive sedimentary flows to which massive pyroclastic flows have already been compared in the literature (Fink et al., 1981; Major and Pierson, 1992; Palladino and Valentine, 1995; Major and Iverson, 1999; Capra et al., 2018). While such types of flows maintain mobility only inside channels and stop at the gully apron, they are still destructive at the foot of the volcano because of a dynamic pressure of over 7 kPa and high temperature, which is due to the high particle concentration.
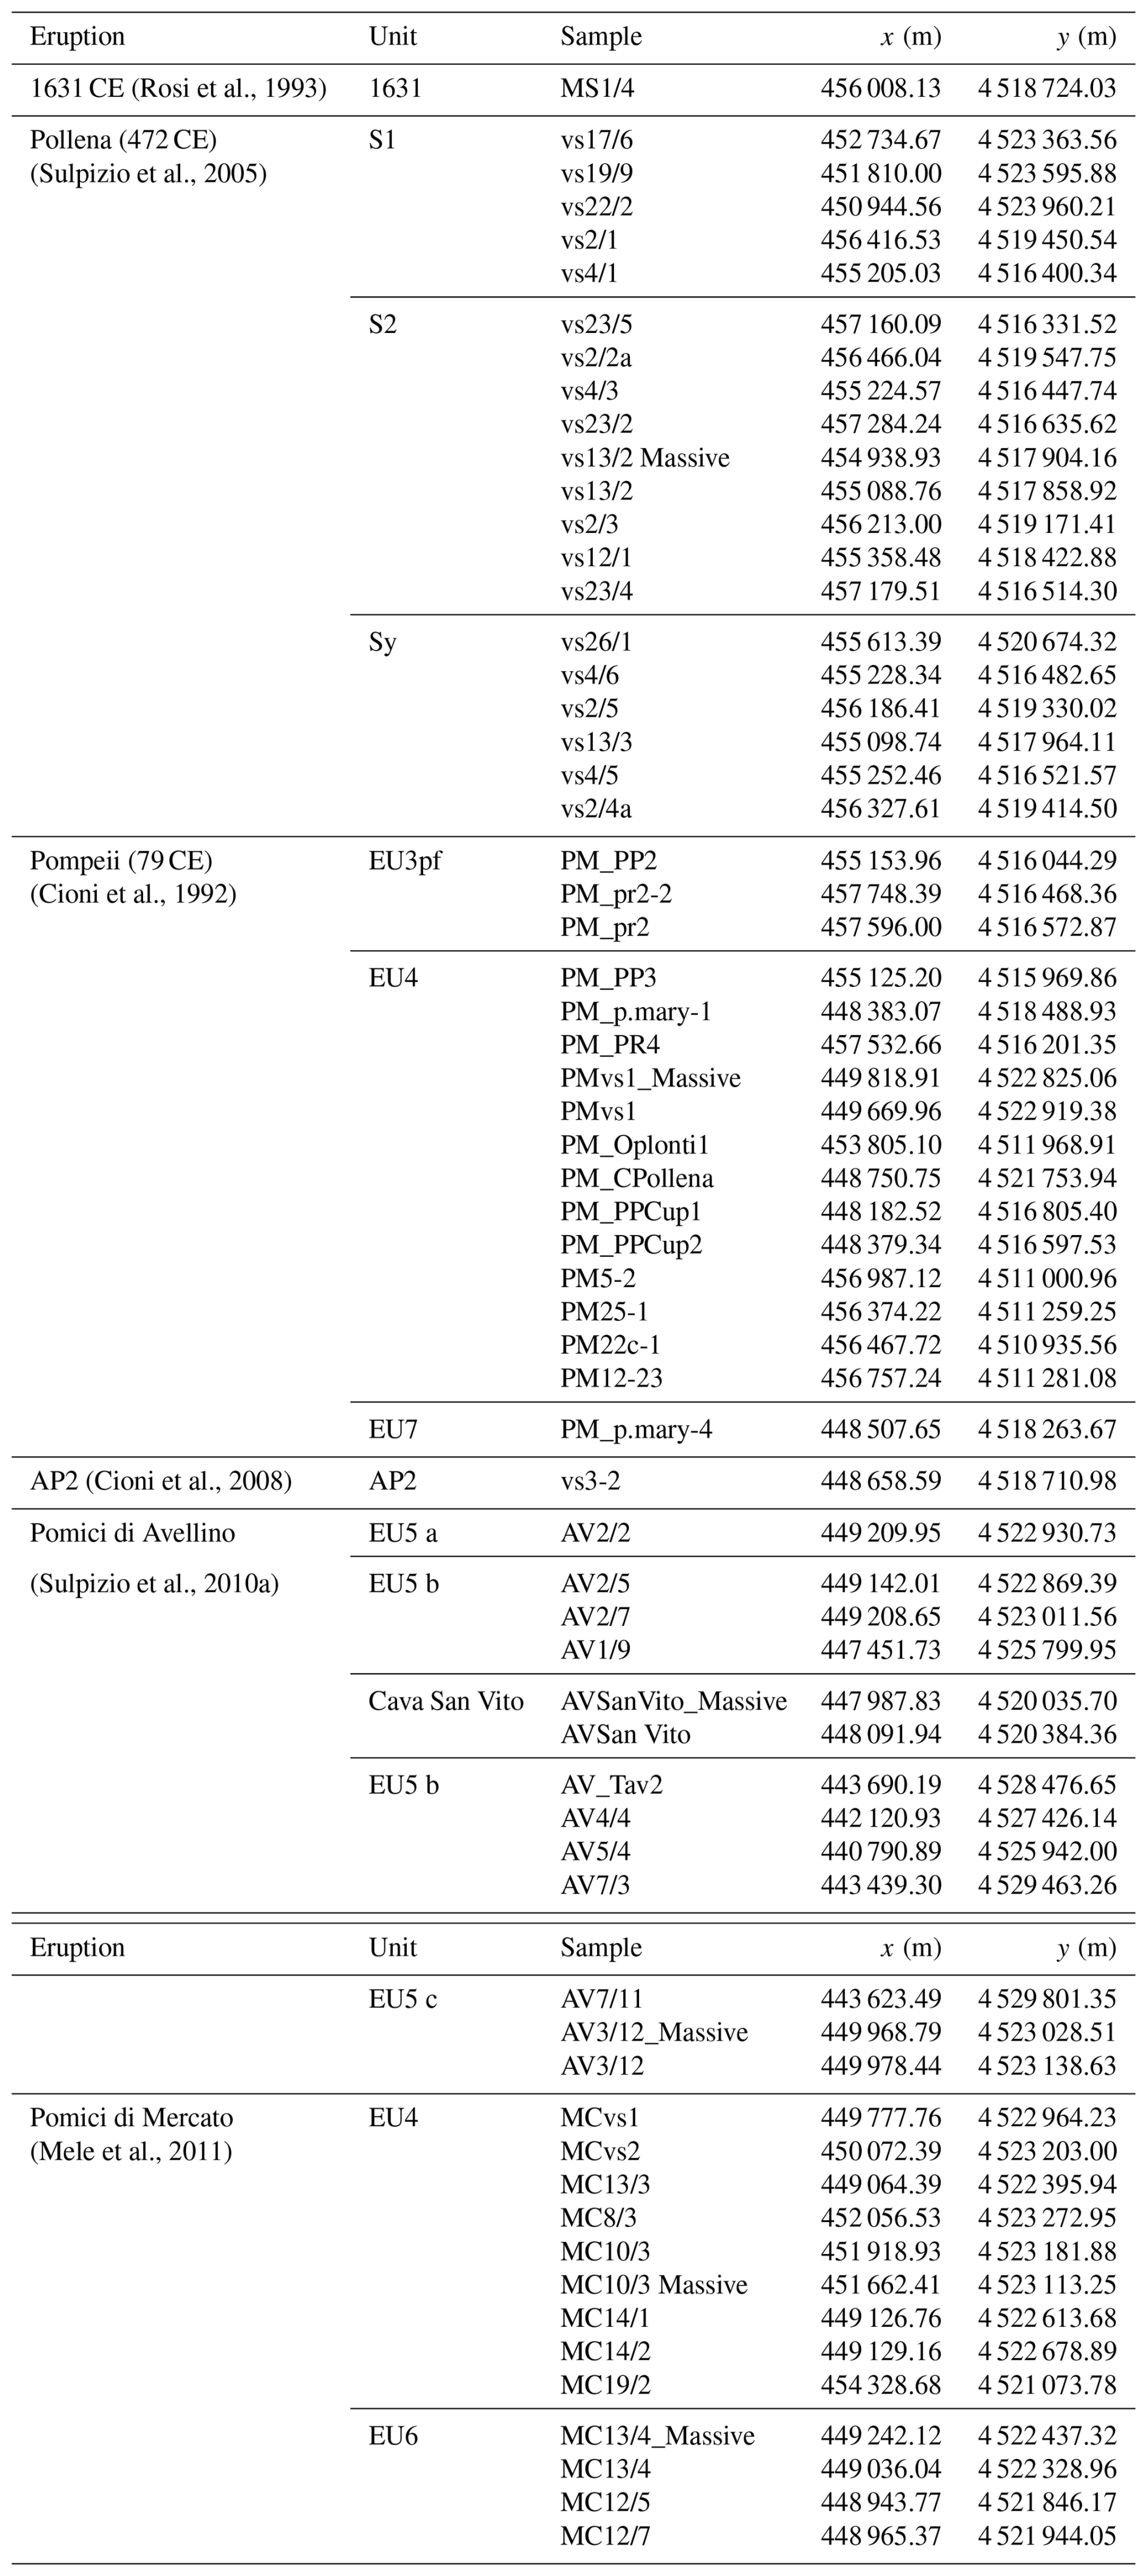
The PDFs of the impact parameters of the PDCs were reconstructed from the deposits of all eruptions that showed, in the field, a good enough exposure to both characterize the deposit structure and sample the pyroclastic material for the laboratory analyses. Multiple deposits cropping out along the dispersal area were investigated for each eruption; specifically, we took into account 65 samples of 16 PDCs' deposits. A list of the locations of the deposits used in analysis is provided in Table 2, and a map is displayed in Fig. 6. The input and output files of all the PYFLOW simulations for each deposit are provided in Mele et al. (2024). The models used in the PYFLOW code for calculating the PDF of the impact parameters are the same as those illustrated in the previous section's example of the Pomici di Mercato eruption (Appendix A).
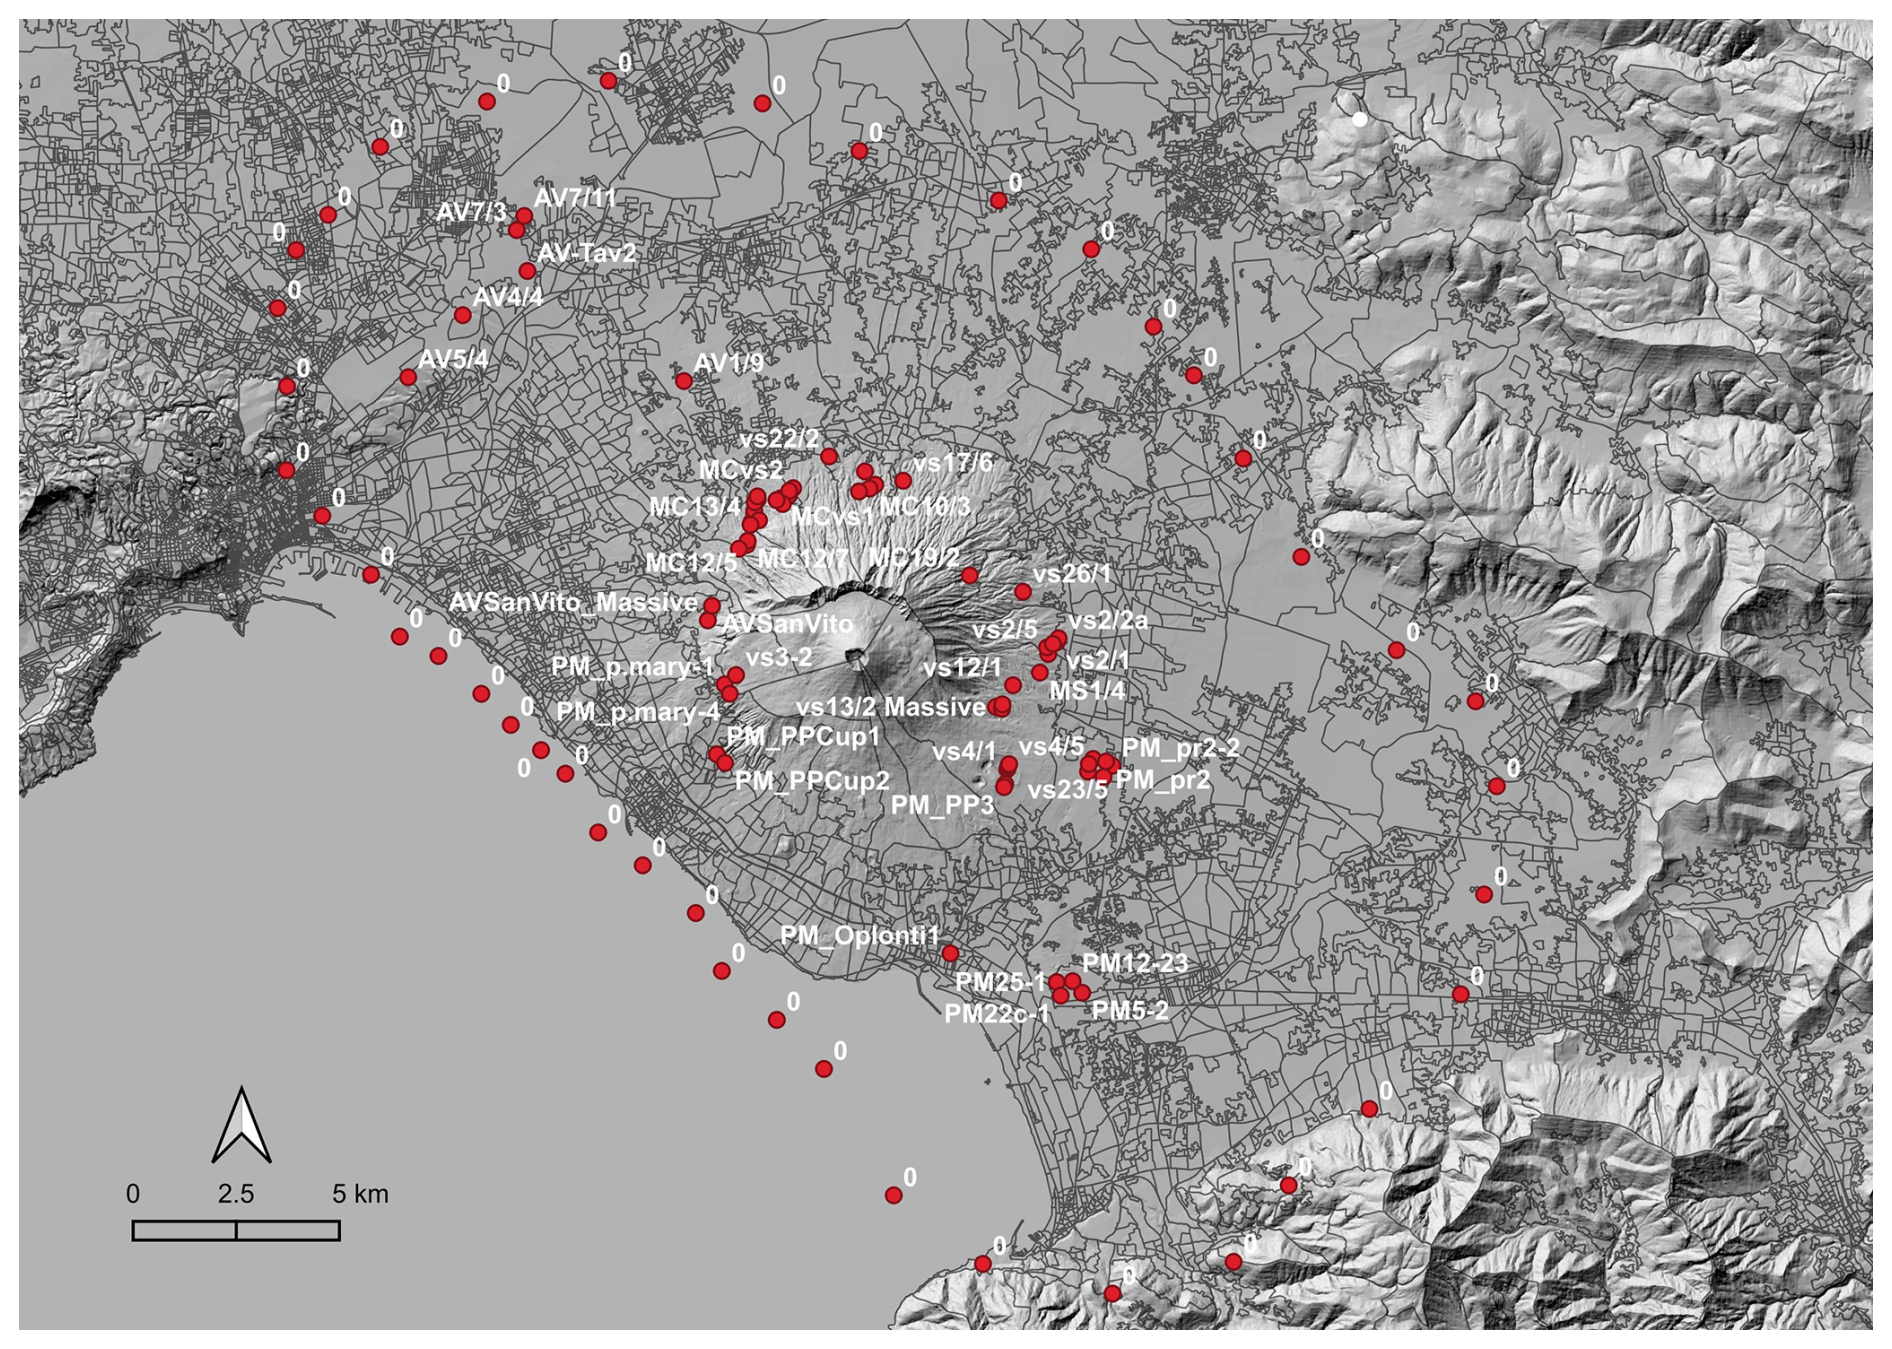
Figure 6Map of sample locations at Vesuvius (see Table 2 for more details). The digital elevation model (Tarquini et al., 2023), territorial bases, and census variables (ISTAT, 2011) are used as the topographic base for data set visualizations.
Upon processing data with the PYFLOW code, only results that were significant after a t test on grain size, at 5 % probability, were included in the final database (see PYFLOW user manual for more details). The resulting data set consists of 65 georeferenced data points distributed around the volcano, each containing values of the four impact parameters: dynamic pressure, particle volumetric concentration, temperature, and flow duration. The 84th percentile of the PDF, which we consider a safety value of the intensity of PDCs, is used for constructing the hazard intensity maps.
By the analysis of results shown in Fig. 7, which are arranged in order of eruption age, no temporal trend of PDC intensity (as expressed here by the dynamic pressure) emerges at Vesuvius. The variability inside an eruption (between different PDCs) covers a broad range as it is also the variation in parameters among eruptions. Therefore, there is no reason to choose one specific eruption as representative of the hazard of PDCs in the next 50 years. Also note that if one considers the scale of eruptions as represented by the total volume of volcanic material emitted including deposits of other origin, with respect to PDCs, such as Plinian fallout, which is an often-used metric in volcanology, there is no correlation between eruption size and PDC intensity. An example is the Pollena eruption, whose PDCs are as intense as those of the Pomici di Mercato or 79 CE eruptions but have a total volume 5 times smaller (Sulpizio et al., 2005, 2007). All data points of all eruptions calculated at an exceedance probability of 16 % (which is the complement to the 84th percentile of solution of the PDF) have been, therefore, used for drawing the hazard intensity maps, without any choice of a particular case as a specific scenario to be expected in the long term. Therefore, the maps represent the value of the impact parameters at an exceedance probability of 16 % in the event of a PDC-forming eruption at Vesuvius, without making assumptions about any scenario (e.g. eruption size). In the construction of the hazard intensity maps, all data points, referring the outcropping deposits of all the eruptions, were considered together to obtain isolines of the impact parameters.
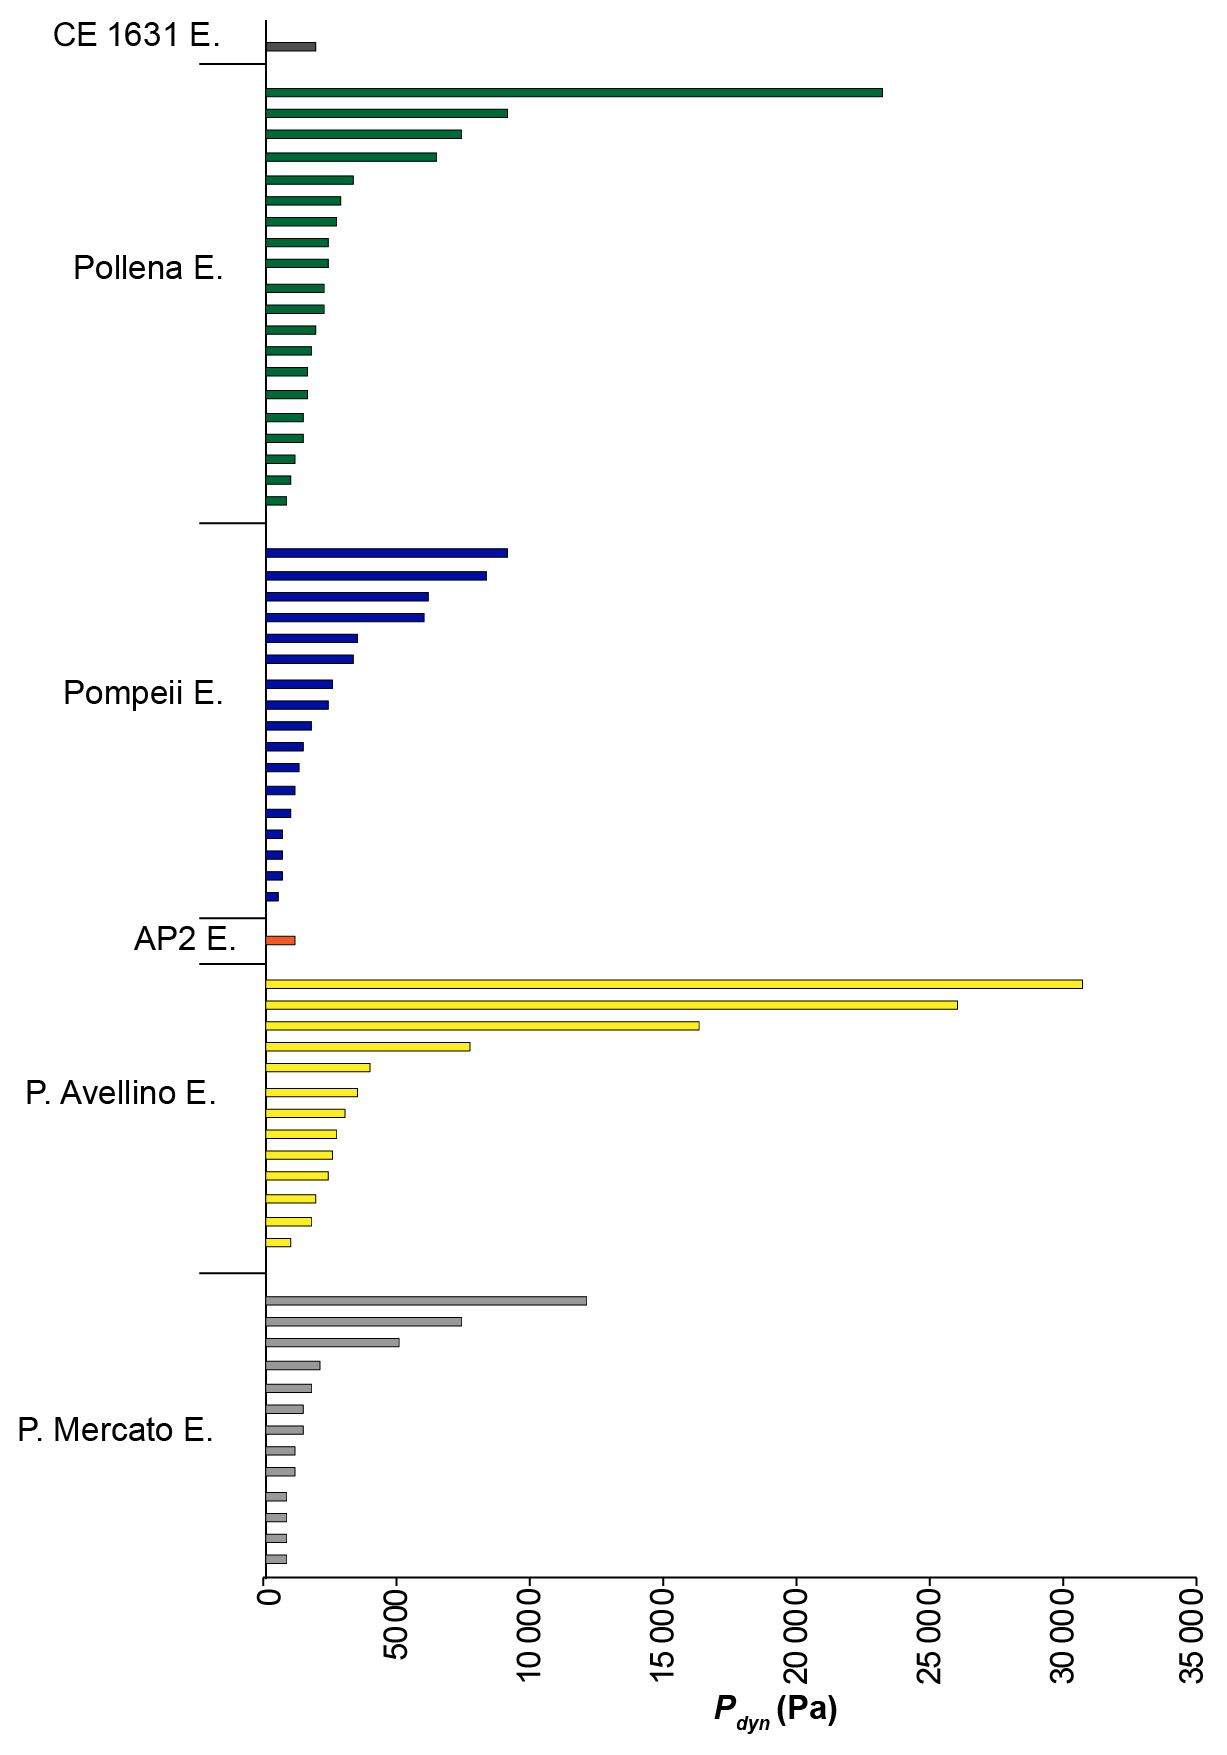
Figure 7Dynamic pressure (Pa) values (in the basal 10 m of the current), calculated from the deposits of all studied eruptions. Each bar represents a location for the given eruption.
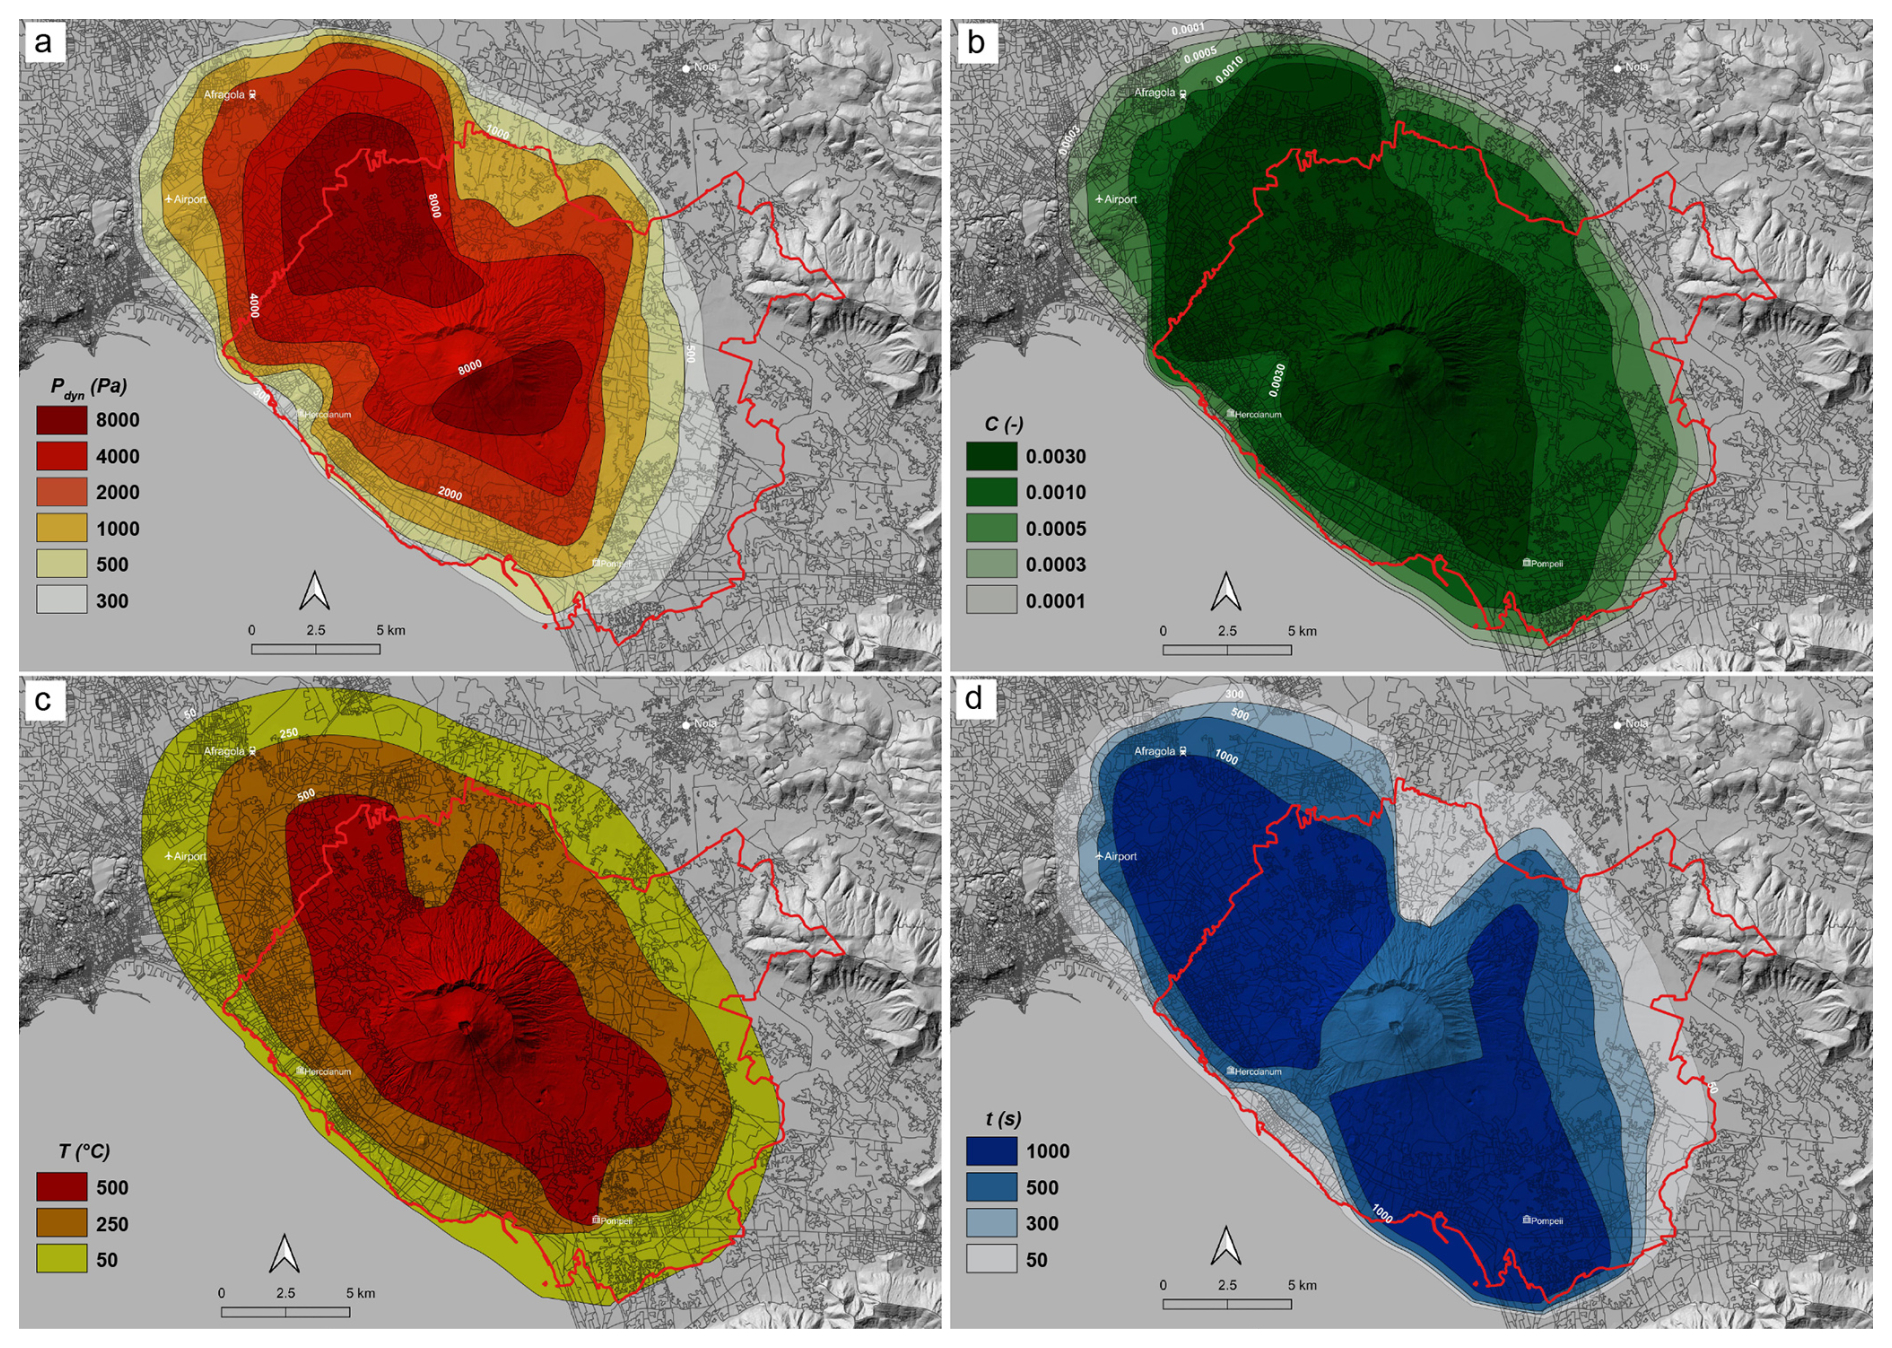
Figure 8Hazard intensity maps of pyroclastic density currents at Vesuvius calculated at the 84th percentile (16 % exceedance probability). The solid red line represents the boundary of the red zone proposed by the Italian National Civil Protection Department (2014). (a) Dynamic pressure (Pa) integrated over the basal 10 m of the current. (b) Particle volumetric concentration integrated over the basal 2 m of the current. (c) Flow temperature (°C) in the basal 2 m of the current. (d) Average flow duration (s). The digital elevation model (Tarquini et al., 2023), territorial bases, and census variables (ISTAT, 2011) are used as the topographic base for data set visualizations.
Hazard intensity maps representing the isolines of the expected safety values of the impact parameters are shown in Fig. 8. The maps were produced using the open-source QGIS software (2024). To reconstruct the maps, it was first necessary to add “zeroes” (zero values of impact parameters), representing points where PDC deposits do not crop out. While this does not completely rule out the arrival of the PDC at these locations, the potential error committed in the evaluation of the impact parameters in the areas close to the zero line is negligible since the last non-zero contour lines were set to very low values of the impact parameters. Then we applied the QGIS contour plugin in order to spatially interpolate the data (Crook and Rouberyrie, 2024). Each map of Fig. 8 represents one impact parameter. Also, data were rasterized based on a regular grid at 250 m resolution and are provided in the Zenodo repository (Mele et al., 2024), which could be useful for vulnerability analysis.
From all the maps, a decrease in PDC intensity emerges as a function of the distance from the volcano, which helps to differentiate the potential impact of PDCs over the territory from the undifferentiated red zone proposed by the National Civil Protection Department of Italy (Civil Protection Department, 2014; Fig. 8, solid red line). Our maps tend to have similar coverage to that of the red zone, the only exception being the northwest area, where the maps extend a little further than the red-zone limit. This is because our maps include the PDCs of the Pomici di Avellino eruption, which spread over the northwest but were not used in the drawing of the red-zone map because they were considered representative of a scenario that is too big.
At the centre of the maps, around the Vesuvius cone, the massive undercurrents result in high values of impact parameters, with dynamic pressures over 8 kPa (Fig. 8a) and temperature over 500 °C (Fig. 8c) due to the high particle concentration. These flows are totally destructive and exceed reasonable engineering measures to protect buildings and populations, aside from evacuation. This conclusion is supported by data at Herculaneum, where the massive flows of the Pompeii eruption left a massive deposit that caused the breaking of thick Roman walls and charred wood components of buildings (Giordano et al., 2018). Results of the calculations for the massive undercurrents in the locations, where it has been possible to apply the model of Sect. 3.2, are provided in the Zenodo repository (Mele et al., 2024). Moving away from the cone, the isolines of the impact parameters refer to the overlying dilute currents, since the massive underflow stops at the base of the volcano. Values of the impact parameters vary significantly moving away from Vesuvius, implying a different impact in the various zones around the volcano. A constraint to the flow mobility exists towards the northeast, which is represented by the remnants of Monte Somma, while towards the southwest there is the sea, which is not considered to be in the red zone.
Focusing on the impacts on buildings, dynamic pressure (Fig. 8a) shows values exceeding 8 kPa in the more proximal zones, towards both the northwest and the southwest, while they are reduced to less than 1 kPa at the margin of the red zone. This is due to the decrease in both speed and concentration. Engineering investigations (Spence et al., 2004; Zuccaro et al., 2008; Zuccaro and Leone, 2012) show that values higher than 5 kPa can significantly damage buildings, while pressure under 1 kPa has minimal to no consequence on structures or infrastructures. Different impacts can indeed be expected on buildings as one moves away from the volcano, and while in proximal areas severe damages is expected, at distal locations such as Pompeii, 10 km from the volcano, the mechanical effects of the dilute currents strongly decrease down to a value lower than 1 kPa. No damage to walls should be expected with such a flow strength (Spence et al., 2004; Zuccaro et al., 2008; Zuccaro and Leone, 2012). This is consistent with the fact that at Pompeii, after the 79 CE eruption, the walls of Roman buildings do not show evidence of damage related to the passage of the PDC (Luongo et al., 2003; Gurioli et al., 2007). While this is not the proper place to discuss in detail the engineering actions that can be used for protecting existing buildings or to propose guidelines for new constructions against the impact of PDCs, our map of Fig. 8a suggests that already a few kilometres away from the volcano, but still well inside the red zone, actions for protecting openings and walls (which are the weaker elements of buildings) against a dynamic pressure of a few kilopascals could be viable.
Concerning the effects of PDCs on the population caught unprotected, the combination of data from maps of particle volumetric concentration, temperature, and flow duration of Fig. 8b, c, and d, respectively, allows us to assess that even in distal zones, where the mechanical effect of dynamic pressure drastically decays, the effect of hot fine ash needs to be considered a primary impact on the population. The ideal protective measure, even at these locations, is evacuation. In fact, it is emerging that even in areas far from a volcano, where particle concentration, temperature, and dynamic pressure strongly decrease, people engulfed in the flow have “high probability of receiving fatal skin burns and inhalation injury of the upper and lower respiratory tract, unless the duration is very brief” (Baxter et al., 2017). The presence of fine-ash particles suspended in air for a long time, even in very small quantities, can be very harmful to human health and represents one major cause of injury (Horwell and Baxter, 2006). Our maps show that temperature decays from 500 °C in the zone characterized by the massive undercurrents around the cone, which is justified by the high particle volumetric concentration, to values lower than 200 °C at the margin of the red zone (Fig. 8b). This decrease is due to the large volume of cold air entrained in the current during runout. The low temperature of the PDCs of the 79 CE eruption calculated at Pompeii (about 115 °C) is due to the much higher content of cold atmosphere air in the current, with respect to the hot magmatic gas. Exposure to pure hot air at 200–250 °C can be survived for 2–5 min (Buettner, 1950), but the presence of inhalable hot fine ash drastically reduces survival times (Baxter et al., 2017). As expected, our map of particle concentration (Fig. 8c) shows an abrupt decay passing from the area around the cone, which is characterized by the massive undercurrent, to values much lower than 0.001, typical of the dilute overlying current in distal reaches. Even a volumetric concentration of ash in suspension this low can be unbreathable and is one of the main causes of mortality caused by PDCs. This is consistent with the observation of historical eruptions, where the flow lasted for several minutes to hours (Lube et al., 2007). At that moment, the territory surrounding the volcano was engulfed by thick, expanded, fast, and hazardous currents, loaded with unbreathable hot ash (Horwell and Baxter, 2006).
The exposure time indeed becomes a major factor in determining the impact of PDCs on population, since it quantifies the residence time of hot volcanic ash that can be inhaled by people potentially exposed to the currents (Horwell and Baxter, 2006).
Our map of Fig. 8d shows that flow duration ranges always exceed several minutes. These values refer only to the overlying dilute currents, since the massive undercurrents that freeze at the foot of the cone are much shorter-lived. In the case of the Pompeii eruption of 79 CE, a value of 17 min was calculated, which, combined with the concentration of ash particles (about 0.001), was a long enough time to cause death by asphyxia at Pompeii. There are reports of recent eruptions showing that in the marginal reaches of the current, where the flow duration was only a few minutes, people were able to survive (Baxter et al., 2017). In other cases, longer flow durations did not permit survival and death was caused by fine-ash inhalation (Baxter et al., 2017; Nakada, 2000). We agree with Baxter et al. (2017) that the emergency planning for explosive eruptions should concentrate on the distal parts of PDCs where survival could be feasible and where the primary risk to life is asphyxiation from ash inhalation, rather than thermal or mechanical injury. It is important to take note of such information when projecting for emergency plans and risk-reduction measures.
Among volcanic phenomena, PDCs are a major cause of destruction and injuries in urbanized areas. Since it is impossible to predict the exact dispersal area or the magnitude of an eruption, a probabilistic approach that accounts for the variability in the intensity of pyroclastic density currents of past eruptions is a better choice to inform structural mitigation and, in the case of an impending eruption, sustainable evacuation plans.
Here, we combined field data from deposits of previous eruptions with a physical model to develop probability density functions for impact parameters around Vesuvius. No specific eruption was chosen as representative of the hazard of PDCs because there is no correlation between eruption size and impact parameters.
By considering the 84th percentile of the distribution a safety value, hazard intensity maps have been drawn that show the intensity distribution over the territory of pyroclastic density currents in the long term. Our choice of the 84th percentile as a safety value could appear to be a particularly severe one, but it is often used in geophysics and in engineering (Bradley, 2011; Fang et al., 2020). These maps differ from the red-zone map of the Italian Civil Protection Department in two main aspects:
-
Our maps include the distribution of the PDCs' intensity (as represented by impact parameters). In contrast, the red-zone map is undifferentiated since it was constructed simply by delineating the outer margin of deposit dispersal and not the PDCs intensities. The red-zone map is used to delimit the area to be evacuated and not to project for possible mitigation actions.
-
Our hazard zones extend towards the northwest compared to the red-zone map because in our case all eruptions of Vesuvius are included, while in the construction of the red-zone map, the Avellino and Pompeii eruptions were not considered because it was assumed that eruptions that big should not occur. PDC intensity is not proportional to the volume of an entire eruption, since one single PDC is a small fraction of the total volume. An example is that the bigger eruption of Pompeii had weaker currents than the smaller eruption of Pollena.
Since our maps extend a little bit more towards the northwest with respect to the red-zone map of the Department of Civil Protection of Italy, it would be useful to consider an extension in that direction of the evacuation zone around Vesuvius.
In this study, an integrated model resolving the impact parameters of both the underlying massive part and of the overlying dilute part of the current was used, allowing us to differentiate their respective impacts. The Bingham plastic rheology used to approximate the massive underflow is similar to that proposed for other massive flows that occur both on volcanoes and on sedimentary terrains. To our knowledge this is the first time that such an integrated approach, resolving the complexity of both the concentrated and the dilute part of the flow, is used for constructing hazard intensity maps, and it deserves to also be taken into consideration for other volcanoes that show a complex stratigraphy of PDCs. Such complex stratigraphy at Vesuvius implies that during an explosive eruption, multiple currents occur, making it reasonable to assume that PDCs can continue for hours or days or more and that their multiple, cascading effects need to be considered when projecting for mitigation actions.
The maps of impact parameters make it possible to back-calculate the initial and boundary conditions of PDCs at the crater and to simulate, by 3D computational fluid dynamics, the propagation of currents over the actual morphology, including the urbanized area around the Vesuvius, which is the next step of the present research.
The precision of parameters used in the PYFLOW code needs to be tested against alternatives to assess the modelling approach's epistemic uncertainty. An extension of this work will be dedicated to such a subject, in order to assess the multi-model variability in results. We think that the method used here to probabilistically assess the hazard in the long term and to take as a safety value the 84th percentile of PDF covers an ample range of the uncertainty in results.
The reconstruction of the impact parameters of PDCs is based on a flow model that starts with the assumption that the current is steady, with velocity and density stratified (Valentine, 1987; Dellino et al., 2008; Brown and Branney, 2013), and flowing on gentle slopes. The model is implemented in the Fortran numerical code PYFLOW v2.5 (Dioguardi and Dellino, 2014; Dioguardi and Mele, 2018).
In the stratified multiphase gas–particle current, the basal part is a shear flow that moves attached to the ground and has a density higher than atmosphere. The upper part is buoyant because particle concentration decreases with height down to a value that, combined with the effect of gas temperature, makes the mixture density lower than the surrounding atmosphere.
The inputs needed, in our model, for the calculation of the impact parameters are reported in the input files of the Zenodo repository (Mele et al., 2024). Some of the input data are obtained directly in the field, such as deposit and layer thickness. Deposit density is obtained by weighing a known volume of deposit. Other data come from laboratory analyses on samples extracted from the deposit. In the laboratory, first, the grain-size distribution is determined and then from each size class a sample of particles per each component (crystal, glass, lithics) is extracted, and density data are obtained on such particle samples by means of pycnometers (Mele et al., 2015). Particle shape parameters, which are needed for the calculation of settling velocity, are obtained by image analysis methods (Mele et al., 2011).
In a dilute PDC, particles are mainly transported by turbulent suspension and sedimentation is controlled by a balance between flow shear velocity u∗, which is controlled by fluid turbulence and favours suspension, and particle settling velocity wt:
which favours sedimentation, where g is gravity acceleration, d is particle size, ρs is particle density, ρmix is bulk flow density, and Cd is the drag coefficient. The median of the grain-size distribution was used for particle size. PYFLOW allows selection from among multiple shape-dependent drag laws; in this work, the drag law of Dioguardi et al. (2018) was used. The capacity of a current to transport particles in suspension is quantified by the Rouse number (Rouse, 1939) , where k is the von Kármán constant (0.4). At the limit of transportation by turbulent suspension when Pn=2.5, from its definition, since k = 0.4, it follows that
This is the suspension–sedimentation criterion (Middleton and Southard, 1984), which means that particles stay suspended until their settling velocity is less than the flow shear velocity. In other terms, particles in the deposit that are settled from suspension (the laminae-forming bed load) give an indication of the current shear velocity, once their terminal velocity is defined. Upon combining Eqs. (A1) and (A2), it follows that
which leads to the shear stress at the base of the current:
There can also be particles that are never transported in suspension but can be moved over the substrate by the overlying current's shear stress (e.g. particles for which Pn>2.5 or that are already on the ground before the passage of the dilute PDC). The latter phenomenon can be described by the Shields or entrainment criterion (Miller et al., 1977), which compares the dilute PDC shear stress to the buoyancy force of the coarse particle in the flow:
where ρs,ent and dent are the density and diameter of the entrained particle, respectively; θ is a parameter which is equal to 0.015 for a particle Reynolds number (where μ is the fluid viscosity) larger than 1000 (Miller et al., 1977), a condition that holds for most dilute PDCs (Dellino et al., 2008).
Both methods are implemented in PYFLOW v2.5 and can be alternatively activated depending on the PDC deposit's architecture. When the typical complete stratigraphic sequence attributed to a dilute PDC (DPDC) is observed (e.g. Fig. 2c), i.e. when there is
-
a coarse layer of lapilli and bombs moved by shear at the base of the current and
-
a laminated layer of ash formed by particles settled from turbulent suspension,
it is possible to apply both the Shields and the suspension–sedimentation criteria for calculating the flow parameters. However, the layer of entrained coarse lapilli or bombs, which is typical of proximal locations around the eruptive vent, is often missing in distal outcrops, thus preventing use of the Shields criterion far away from the volcanic vent. In that case, an alternative method based on the hydraulic equivalence of particles can be used.
In both cases the parameters needed to calculate the vertical profiles of velocity, particle concentration (hence flow density), flow temperature, and dynamic pressure are obtained. Specifically, the velocity profile u(z) follows the equation of a turbulent boundary layer shear flow moving over a rough surface (Furbish, 1997):
Here ks is the roughness parameter of the substrate. The concentration profile is taken from Rouse (1939):
in which ztot is the total flow thickness and z0 is the height at which the particle concentration is known (C0). From Eq. (A7), the flow bulk density profile can be defined as
PYFLOW first estimates the shear flow height zsf by solving the system of equations composed of Eq. (A4) and
where ρatm is the atmospheric density and α is the slope of the ground, measured in the field, on which the dilute PDC was flowing.
The shear current is composed of gas and a mixture of particles, in which those with Pn=2.5 are in a settling condition. Finer particles are held in suspension by turbulent motion and contribute to the concentration profile C(z), but their average Rouse number Pn,susp, which is lower than 2.5, is unknown. In addition, the thickness of the PDC ztot and the flow gas density ρg are unknown. In order to get these three unknowns, PYFLOW solves for the following system of three equations:
The first equation (Eq. A10) states that the atmospheric density is reached at the top of the shear flow zsf; the second one (Eq. A11) defines the average flow density calculated between z0 and zsf; the third equation (Eq. A12) defines the total flow thickness as the ratio between the thickness of the laminated layer Hlam in the deposit and the average concentration in the flow C (Lajoie et al., 1998), which is defined as
This is just an approximate value used to initialize the software and does not influence the solutions much down to the first tens of metres of the current where the maximum intensity of impact parameters is found. In this work C0 is set to the maximum packing for pyroclastic particles (0.7) (Dellino et al., 2008); hence z0 is taken as the minimal sedimenting thickness.
Subsequently, PYFLOW uses ρg to calculate the flow temperature profile T(z), assuming the flow is composed of the solid particles, the magmatic gas, and entrained air, if the user provides the following input: the temperature of the magmatic gas Tm, the air temperature Ta (set by default to 293 K if not provided), the temperature of the solid particles Ts, the specific gas constant of the magmatic gas Rm and air Ra (set by default to 287 J kg−1 K−1), the specific heat at the constant pressure of the magmatic gas Cpm and of the solid particles Cps, and the average density of the solid particles ρs. First, the densities of the magmatic gas and entrained air are obtained by solving for the equation of state:
hence with the assumption that the gas phases are at constant atmospheric pressure (set to 101 325 Pa if not specified in input by the user). From these densities and the flow gas density ρg, one can calculate the relative volumetric concentration of the magmatic gas Cgm,rel and entrained air Cgm,rel:
These concentrations are still not the real magmatic gas Cg,m and entrained air Cg,a volumetric concentrations in the multiphase flow that includes the solid particle concentration C calculated via Eq. (A13); hence they need to be rescaled so that the sum of their rescaled values equals 1−C:
Finally, the flow temperature can be calculated using the following equation, which neglects the heat transfer between particles and the fluid in a mixture-model-like approach (see, for example, Cerminara et al., 2016) and attributes the change in temperature mainly to the air entrainment and flow dilution:
By combining the velocity (Eq. A6) and density (Eq. A8) profiles, the dynamic pressure profile is finally obtained:
Concerning flow duration, in a PDC, sedimentation occurs at a rate Sr that represents the mass of particles settling over a unit area in the unit time. Deposit thickness is the result of the aggradation of particles during the time-integrated passage of the current. The aggradation rate Ar, which is the rate at which deposit thickness grows, is equal to the sedimentation rate divided by deposit density ρdep. The total time of aggradation, t, which is a proxy for flow duration, is equal to deposit thickness Hdep divided by Ar:
Deposit density and thickness are measured in the field; consequently the only missing quantity for the calculation of flow duration is the sedimentation rate.
Dellino et al. (2019) recently proposed a model for the calculation of the sedimentation rate:
with the subscript i referring to the ith particle size class; n being the number of size classes of the grain-size distribution of the sediment; ϕi, , and Pni being the weight fraction, the density, and the Rouse number of the ith grain-size fraction, respectively. is the normalized Rouse number of the current, i.e. the ratio between the average Rouse number of the solid material in the current and the Rouse number at maximum suspension capacity. The model considers the contribution of each size class of particles to the sedimentation and not the average grain size because the solid load constituting a suspension current, especially in the case of PDCs, is made up of a mixture of different components (lithics, glassy fragments, and crystals) with different sizes, densities, and shapes and thus different terminal velocities. The average Rouse number of the solid material in the current is calculated as the average of the particulate mixture:
When , a current has a particle volumetric concentration in excess of its maximum capacity; i.e. it is over-saturated in term of particles and favours sedimentation. When it is lower than 1, a current has a particle volumetric concentration lower than its maximum capacity; i.e. it is under-saturated and could potentially include additional sediment in suspension by erosion from the substrate. For more details, see Dellino et al. (2019).
Finally, PYFLOW calculates probability density functions of all the parameters presented above starting from a Gaussian distribution. From these functions, it is possible to obtain the values of the impact parameters at the desired exceedance probability.
PYFLOW v2.5 is available at https://github.com/FabioDioguardi/PYFLOW/releases/tag/v_2.5 (Dioguardi and Mele, 2018).
All supporting data, which include input and output files of the DPDC simulations carried out with PYFLOW, calculations of the massive PDCs' impact parameters, and rasterized impact parameters map data, are available at https://doi.org/10.5281/zenodo.13682628 (Mele et al., 2024).
PD developed the methodology and the models and contributed to data analysis and text editing. FD developed PYFLOW v2.5 and contributed to the simulations, data analysis, and text editing. DM ran the simulations with PYFLOW, conducted data analysis, produced the graphical outputs, and contributed to text editing. RS contributed to data analysis and text editing.
The contact author has declared that none of the authors has any competing interests.
Publisher's note: Copernicus Publications remains neutral with regard to jurisdictional claims made in the text, published maps, institutional affiliations, or any other geographical representation in this paper. While Copernicus Publications makes every effort to include appropriate place names, the final responsibility lies with the authors.
The editor (Giovanni Macedonio), Greg Valentine, and the anonymous reviewer greatly helped in improving the manuscript. This study was carried out within the RETURN Extended Partnership from the European Union NextGenerationEU (National Recovery and Resilience Plan – NRRP, Mission 4, Component 2).
This research has been supported by NextGenerationEU (grant no. PE0000005).
This paper was edited by Giovanni Macedonio and reviewed by Greg Valentine and one anonymous referee.
Baxter, P. J., Jenkins, S., Rosadi, S., Komorowski, J. C., Dunn, K., Purser, D., Voight, B., and Shelley, I.: Human survival in volcanic eruptions: thermal injuries in pyroclastic surges, their causes, prognosis and emergency management, Burns, 43, 1051–1069, 2017.
Baxter, P. T., Neri, A., and Todesco, M.: Physical modeling and human survival in pyroclastic flows, Nat. Hazards, 17, 163–176, 1998.
Bertagnini, A., Landi, P., Rosi, M., and Vigliargio, A.: The Pomici di Base plinian eruption of Somma-Vesuvius, J. Volcanol. Geoth. Res., 83, 219–239, 1998.
Bradley, B. A.: Design seismic demands from seismic response analyses: a probability-based approach, Earthq. Spectra, 27, 213–224, https://doi.org/10.1193/1.3533035, 2011.
Branney, M. J. and Kokelaar, P.: Pyroclastic Density Currents and the Sedimentation of Ignimbrites, Geological Society, London, Memoirs, 27 pp.,https://doi.org/10.1144/GSL.MEM.2003.027, 2002.
Breard, E. C. P. and Lube, G.: Inside pyroclastic density currents – uncovering the enigmatic flow structure and transport behaviour in large-scale experiments, Earth Planet. Sci. Lett., 458, 22–36, 2017.
Brocchini, D., Principe, C., Castradori, D., Laurenzi, M. A., and Gorla, L.: Quaternary evolution of the southern sector of the Campanian Plain and early Somma-Vesuvius activity: insights from the Trecase 1 well, Mineral. Petrol., 73, 67–91, https://doi.org/10.1007/s007100170011, 2001.
Brown, R. J. and Branney, M. J.: Internal flow variations and diachronous sedimentation within extensive, sustained, density stratified pyroclastic density currents down gentle slopes, as revealed by the internal architectures of ignimbrites in Tenerife, B. Volcanol., 75, 1–24, 2013.
Buettner, K.: Effects of extreme heat in man, J. Am. Med. Assoc., 144, 732–738, 1950.
Cao, Z., Egashira, S., and Carling, P. A.: Role of suspended-sediment particle size in modifying velocity profiles in open channel flows, Water Resour. Res., 39, 1029, https://doi.org/10.1029/2001WR000934, 2003.
Capra, L., Sulpizio, R., Marquez-Ramirez, V. H., Coviello, V., Doronzo, D. M., Arambula-Mendoza, R., and Cruz, S.: The anatomy of a pyroclastic density current: the 10 July 2015 event at Volcan de Colima (Mexico), B. Volcanol., 80, 34, https://doi.org/10.1007/s00445-018-1206-4, 2018.
Cas, R. A. F. and Wright, J. V.: Volcanic Successions: Modern and Ancient, Allen & Unwin, https://doi.org/10.1007/978-94-009-3167-1, 1987.
Cerminara, M., Esposti Ongaro, T., and Berselli, L. C.: ASHEE-1.0: a compressible, equilibrium–Eulerian model for volcanic ash plumes, Geosci. Model Dev., 9, 697–730, https://doi.org/10.5194/gmd-9-697-2016, 2016.
Cioni, R., Marianelli, P., and Sbrana, A.: Dynamics of the AD 79 eruption: stratigraphic, sedimentological and geochemical data on the succession from the Somma-Vesuvius southern and eastern sectors, Acta Volcanol., 2, 109–123, 1992.
Cioni, R., Santacroce, R., and Sbrana, A.: Pyroclastic deposits as a guide for reconstructing the multi-stage evolution of the Somma-Vesuvius caldera, B. Volcanol., 60, 207–222, 1999.
Cioni, R., Sulpizio, R., and Garruccio, N.: Variability of the eruption dynamics during a subplinian event: the Greenish Pumice eruption of Somma-Vesuvius (Italy), J. Volcanol. Geoth. Res., 124, 89–114, 2003.
Cioni, R., Gurioli, L., Lanza, R., and Zanella, E.: Temperatures of the A. D. 79 pyroclastic density current deposits (Vesuvius, Italy), J. Geophys. Res., 109, B02207, https://doi.org/10.1029/2002JB002251, 2004.
Cioni, R., Bertagnini, A., Santacroce, R., and Andronico, D.: Explosive activity and eruption scenarios at Somma-Vesuvius (Italy): towards a new classification scheme, J. Volcanol. Geoth. Res., 178, 331–346, https://doi.org/10.1016/j.jvolgeores.2008.04.024, 2008.
Civil Protection Department: Direttiva del 14 febbraio 2014: disposizioni per l'aggiornamento della pianificazione di emergenza per il rischio vulcanico del Vesuvio, Gazzetta Ufficiale, Civil Protection Department, Presidency of the Council of Ministers, Italian Government, 108, https://www.protezionecivile.gov.it/en/normativa/direttiva-del-14-febbraio-2014/ (last access: 19 March 2025), 2014.
Cole, P. D. and Scarpati, C.: The 1944 eruption of Vesuvius, Italy: Combining contemporary accounts and field studies for a new volcanological reconstruction, Geol. Mag., 147, 391–415, 2010.
Crook, C. and Rouberyrie, L.: QGIS Countour plugin, GitHub, https://github.com/ccrook/QGIS-Contour-Plugin.git (last access: August 2024), 2024.
Dellino, F., Dioguardi F., Doronzo D. M., and Mele D.: The entrainment rate of non Boussinesq hazardous geophysical gas-particle flows: an experimental model with application to pyroclstic density currents, Geophys. Res. Lett., 46, 12851-12861, 2019.
Dellino, P., Mele, D., Sulpizio, R., La Volpe, L., and Braia, G.: A method for the calculation of the impact parameters of dilute pyroclastic density currents based on deposit particle characteristics, J. Geophys. Res., 113, B07206, https://doi.org/10.1029/2007JB005365, 2008.
Dellino, P., Büttner, R., Dioguardi, F., Doronzo, D. M., La Volpe, L., Mele, D., Sonder, I., Sulpizio, R., and Zimanowski, B.: Experimental evidence links volcanic particle characteristics to pyroclastic flow hazard, Earth Planet. Sci. Lett., 295, 314–320, 2010.
Dellino, P., Dioguardi, F., Doronzo, D. M., and Mele, D.: A discriminatory diagram of massive versus stratified deposits based on the sedimentation and bedload transportation rates. Experimental investigation and application to pyroclastic density currents, Sedimentology, 67, 2013–2039, https://doi.org/10.1111/sed.12693, 2020.
Dellino, P., Dioguardi, F., Isaia, R., Sulpizio, R., and Mele, D.: The impact of pyroclastic density currents duration on humans: the case of the AD 79 eruption of Vesuvius. Sci. Rep., 11, 4959, https://doi.org/10.1038/s41598-021-84456-7, 2021.
Dioguardi, F. and Dellino, P.: PYFLOW: a computer code for the calculation of the impact parameters of dilute pyroclastic density currents (DPDC) based on field data, Comput. Geosci., 66, 200–210, https://doi.org/10.1016/j.cageo.2014.01.013, 2014.
Dioguardi, F. and Mele, D.: PYFLOW_2.0: a computer program for calculating flow properties and impact parameters of past dilute pyroclastic density currents based on field data, Bull. Volcanol. 80, 28, https://doi.org/10.1007/s00445-017-1191-z, 2018.
Dioguardi, F. and Mele, D.: PYFLOW_2.0: a computer program for calculating flow properties and impact parameters of past dilute pyroclastic density currents based on field data,Bull Volcanol 80, 28, https://doi.org/10.1007/s00445-017-1191-z, 2018.
Dioguardi, F., Mele, D., and Dellino, P.: A New One-Equation Model of Fluid Drag for Irregularly Shaped Particles Valid Over a Wide Range of Reynolds Number, J. Geophys. Res.-Sol. Ea., 123, 144–156, https://doi.org/10.1002/2017JB014926, 2018.
Druitt, T. H.: Emplacement of the 18 May 1980 lateral blast deposit ENE of Mount St. Helens, Washington, B. Volcanol., 54, 554–572, 1992.
Druitt, T. H., Calder, E. S., Cole, P. D., Hoblitt, R. P., Loughlin, S. C., Norton, G. E., Ritchie, L. J., Sparks, R. S. J., and Voight, B.: Small-volume, highly mobile pyroclastic flows formed by rapid sedimentation from pyroclastic surges at Soufrière Hills Volcano, Montserrat: an important volcanic hazard, in: The Eruption of Soufrière Hills Volcano, Montserrat, from 1995–1999, edited by: Druitt, T. H. and Kokelaar, B. P., Geol. Soc., London, Mem., 21, 263–279, https://doi.org/10.1144/GSL.MEM.2002.021.01.12, 2002.
Esposti Ongaro, T., Neri, A., Menconi, G., de'Michieli Vitturi, M., Marianelli, P., Cavazzoni, C., Erbacci, G., and Baxter, P. J.: Transient 3Dnumerical simulations of column collapse and pyroclastic density current scenarios at Vesuvius, J. Volcanol. Geoth. Res., 178, 378–396, 2008.
Fang, C., Ping, Y., and Chen, Y.: Loading protocols for experimental seismic qualification of members in conventional and emerging steel frames, Earthquake Engng. Struct. Dyn., 49, 155–174, https://doi.org/10.1002/eqe.3231, 2020.
Fink, J. H., Malin, M. C., D'Alli, R. E., and Greeley, R.: Rheological properties of mudflows associated with the spring 1980 eruptions of Mount St. Helens Volcano Washington, Geophys. Res. Lett., 8, 43–46, 1981.
Fisher, R. V.: Models for pyroclastic surges and pyroclastic fows, J. Volcanol. Geoth. Res., 6, 305–318, 1979.
Fisher, R. V.: Transport and deposition of a pyroclastic surge across an area of high relief: the 18 May 1980 eruption of Mount St. Helens, Washington, Geol. Soc. Am. Bull., 102, 1038–1054, 1990.
Furbish, D. J.: Fluid Physics in Geology, Oxford Univ. Press, New York, 476 pp., https://doi.org/10.1093/oso/9780195077018.001.0001, 1997.
Gernon, T. M., Upton, B. G. J., and Hincks, T. K.: Eruptive history of an alkali basaltic diatreme from Elie Ness, Fife, Scotland, Bull. Volcanol., 75, 704, https://doi.org/10.1007/s00445-013-0704-7, 2013, 2013.
Giordano, G., Zanella, E., Trolese, M., Baffioni, C., Vona, A., Caricchi, C., De Benedetti, A. A., Corrado, S., Romano, C., Sulpizio, R., and Geshi, N.: Thermal interactions of the AD79 Vesuvius pyroclastic density currents and their deposits at Villa dei Papiri (Herculaneum archaeological site, Italy), Earth Plan. Sci. Lett., 490, 180–192, https://doi.org/10.1016/j.epsl.2018.03.023, 2018.
Gurioli, L., Zanella, E., Pareschi, M. T., and Lanza, R.: Influences of urban fabric on pyroclastic density currents at Pompeii (Italy): Flow direction and deposition, J. Geophys. Res., 112, B05213, https://doi.org/10.1029/2006JB004444, 2007.
Gurioli, L., Sulpizio, R., Cioni, R., Sbrana, A., Santacroce, R., Luperini, W., and Andronico D.: Pyroclastic flow hazard assessment at Somma-Vesuvius based on the geological record, B. Volcanol., 72, 1021–1038, 2010.
Horwell, C. J. and Baxter P.: The respiratory health hazards of volcanic ash: A review for volcanic risk mitigation, B. Volcanol., 69, 1–24, 2006.
ISTAT: Basi territoriali e variabili censuarie: censimento 2011, 15-Campania, ISTAT, http://www.istat.it/it/files/2013/11/R15_11_WGS84.zip (last access: August 2024), 2011.
Jenkins, S., Komorowski, J. -C., Baxter, P. J., Spence, R., Picquout, A., and Surono, F. L.: The Merapi 2010 eruption: an interdisciplinary assessment methodology for studying pyroclastic density currents, J. Volcanol. Geoth. Res., 261, 316–329, 2013.
Jones, T. J., Beckett, F., Bernard, B., Breard, E. C. P., Dioguardi, F., Dufek, J., Engwell, S., and Eychenne, J.: Physical properties of pyroclastic density currents: relevance, challenges and future directions, Front. Earth Sci., 11:1218645, https://doi.org/10.3389/feart.2023.1218645, 2023.
Kneller, B. C. and Branney, M. J.: Sustained high density turbidity currents and the deposition of thick massive sands, Sedimentology, 42, 607–616, 1995.
Lajoie, J., Boudon, G., and Bourdies, J. L.: Depositional mechanics of the 1902 pyroclastic nuée ardente deposits of Mt. Pelée, Martinique, J. Volcanol. Geoth. Res., 38, 131–142, 1998.
Lowe, D. R.: Sedimentary gravity flows: II. Depositional models with special reference to the deposits of high density turbidity currents, J. Sed. Petrol., 52, 279–297, 1982.
Lowe, D. R.: Suspended-load fallout rate an independent variable in the analysis of current structures, Sedimentology, 35, 765–776, 1988.
Lube, G., Cronin, S. J., Platz, T., Freundt, A., Procter, J. N., Henderson, C., and Sheridan, M. F.: Flow and deposition of pyroclastic granular flows: a type example from the 1975 Ngauruhoe eruption, New Zealand, J. Volcanol. Geoth. Res. 161, 165–186, 2007.
Luongo, G., Perrotta, A., Scarpati, C., De Carolis, E., Patricelli, G., and Ciarallo, A.: Impact of the AD 79 eruption on Pompeii, II. Causes of death of the inhabitants inferred by stratigraphic analysis and areal distribution of the human casualties, J. Volcanol. Geoth. Res., 126, 169–200, 2003.
Major, J. J. and Iverson, R. M.: Debris-flow deposition effects of pore-fluid pressure and friction concentrated at flow margins, Geol. Soc. Am. Bull., 111, 1424–1434, 1999.
Major, J. J. and Pierson, T. C.: Debris flow rheology: experimental analysis of fine-grained slurries, Water Resour. Res., 28, 841–857, 1992.
Mele, D., Sulpizio, R., Dellino, P., and La Volpe, L.: Stratigraphy and eruptive dynamics of a pulsating Plinian eruption of Somma-Vesuvius: the Pomici di Mercato (8900 years B.P.), B. Volcanol., 73, 257–278, 2011.
Mele, D., Dioguardi, F., Dellino, P., Isaia, R., Sulpizio, R., and Braia, G.: Hazard of pyroclastic density currents at the Campi Flegrei Caldera (Southern Italy) as deduced from the combined use of facies architecture, physical modeling and statistics of the impact parameters, J. Volcanol. Geoth. Res., 299, 35–53, 2015.
Mele, D., Dellino, P., and Dioguardi F.: Pyroclastic density currents hazard simulation data at Mt. Vesuvius, Italy, Zenodo [data set], https://doi.org/10.5281/zenodo.13682628, 2024.
Middleton, G. V. and Southard, J. B.: Mechanics of Sediment Movement, Soc. Econ. Paleont. Miner., Tulsa, 401 pp., https://doi.org/10.2110/scn.84.03, 1984.
Miller, M. C., McCave, I. N., and Komar, P. D.: Threshold of sediment motion under unidirectional currents, Sedimentology, 24, 507–527, 1977.
Nakada, S.: Hazards from Pyroclastic Flows and Surges, in: Encyclopedia of Volcanoes, edited by: Sigurdsson, H., Houghton, R., McNutt, S. R., Rymer, H., and Stix, J.: Academic Press, Cambridge, ISBN 13: 9780126431407, 2000.
Neri, A., Esposti Ongaro, T., Menconi, G., Vitturi, M., De'Michieli, M., Cavazzoni, C., Erbacci, G., and Baxter, P. J.: 4D simulation of explosive eruption dynamics at Vesuvius, Geophys. Res. Lett., 34, L04309, https://doi.org/10.1029/2006GL028597, 2007.
Palladino, D. M. and Valentine, G. A.: Coarse-tail vertical and lateral grading in pyroclastic flow deposits of the Latera Volcanic Complex (Vulsini, Central Italy): origin and implications for flow dynamics, J. Volcanol. Geoth. Res., 69, 343–364, 1995.
Pensa, A., Giordano, G., Corrado, S., and Petrone, P. P.: A new hazard scenario at Vesuvius: deadly thermal impact of detached ash cloud surges in 79 CE at Herculaneum. Sci. Rep., 13, 5622, https://doi.org/10.1038/s41598-023-32623-3, 2023.
Postma, G., Cartigny, M., and Kleverlaan, K.: Structureless, coarse-tail graded Bouma Ta formed by internal hydraulic jump of the turbidity current, Sed. Geol., 219, 1–6, 2009.
QGIS: QGIS Geographic Information System, Open Source Geospatial Foundation Project, QGIS, http://qgis.org (last access: August 2024), 2024.
Rosi, M., Principe, C., and Vecci, R.: The 1631 eruption of Vesuvius reconstructed from the review of chronicles and study of deposits, J. Volcanol. Geoth. Res., 58, 151–182, 1993.
Rouse, H.: An analysis of sediment transportation in the light of fluid turbulence, in Soil Conservation Services Report No. SCS-TP-25, USDA, Washington, D.C., ISBN 978-1-391-63813-3, 1939.
Santacroce, R., Cioni, R., Marianelli, P., Sbrana, A., Sulpizio, R., Zanchetta, G., Don-ahue, D. J., and Joron, J.-L.: Age and whole rock-glass composition of proximal pyroclastics from the major explosive eruptions of Somma–Vesuvius: a review as a tool for distal tephrostratigraphy, J. Volcanol. Geoth. Res., 177, 1–18, 2008.
Selva, J., Sandri, L., Taroni, M., Sulpizio, R., Tierz, P., and Costa, A.: A simple two-state model interprets temporal modulations in eruptive activity and enhances multivolcano hazard quantification, Sci. Adv., 8, eabq4415, https://doi.org/10.1126/sciadv.abq4415, 2022.
Sevink, J., van Bergen, M. J., van der Plicht, J., Feiken, H., Anastasia, C., and Huizinga, A.: Robust date from the Bronze Age Avellino eruption (Somma–Vesuvius): 3945 ± 10 cal BP (1995 ± 10 cal BC), Quaternary Sci. Rev., 30, 1035–1046, 2011.
Sigurdsson, H., Carey, S., Cornell, W., and Pescatore, T.: The eruption of Vesuvius in 79 AD, Nat. Geogr. Res., 1, 332–387, 1985.
Spence, R. J. S., Baxter, P. J., and Zuccaro G.: Building vulnerability and human casualty estimation for a pyroclastic flow: A model and its application to Vesuvius, J. Volcanol. Geoth. Res., 133, 321–343, 2004.
Sulpizio, R., Mele, D., Dellino, P., and LaVolpe, L.: A complex, Subplinian type eruption from low-viscosity, tephri-phonolitic magma: the Pollena eruption of Somma-Vesuvius (Italy), B. Volcanol., 67, 743–767, https://doi.org/10.1007/s00445-005-0414-x, 2005.
Sulpizio, R., Mele, D., Dellino, P., and La Volpe, L.: Deposits and physical properties of pyroclastic density currents during complex Subplinian eruptions: The AD 472 (Pollena) eruption of Somma-Vesuvius, Italy, Sedimentology, 54, 607–635,https://doi.org/10.1111/j.1365-3091.2006.00852.x, 2007.
Sulpizio, R., Bonasia, R., Dellino, P., Mele, D., Di Vito, M. A., and La Volpe, L.: The Pomici di Avellino eruption of Somma-Vesuvius (3.9 ka BP). Part II: Sedimentology and physical volcanology of pyroclastic density current deposits, B. Volcanol., 72, 559–577, 2010a.
Sulpizio, R., Cioni, R., Di Vito, M. A., Mele, D., Bonasia, R., and Dellino, P.: The Pomici di Avellino eruption of Somma–Vesuvius (3.9 ka BP) part I: stratigraphy, compositional variability and eruptive dynamics, B. Volcanol., 72, 539–558, 2010b.
Sulpizio, R., Dellino, P., Doronzo, D. M., and Sarocchi, D.: Pyroclastic density currents: state of the art and perspectives, J. Volcanol. Geoth. Res., 283, 36–65, 2014.
Sulpizio, R., Castioni, D., Rodriguez-Sedano, L. A., Sarocchi, D., and Lucchi, F.: The influence of slope-angle ratio on the dynamics of granular flows: insights from laboratory experiments, B. Volcanol., 78, 1–11, 2016.
Sweeney, M. R. and Valentine, G. A.: Impact zone dynamics of dilute mono- and polydisperse jets and their implications for the initial conditions of pyroclastic density currents, Phys. Fluids, 29, 093304, https://doi.org/10.1063/1.5004197, 2017.
Talling, P. J., Amy, L. A., Wynn, R. B., Peakall, J., and Robinson, M.: Beds comprising debrite sandwiched within co-genetic turbidite: origin and widespread occurrence in distal depositional environments, Sedimentology, 51, 163–194, 2004.
Tarquini, S., Isola, I., Favalli, M., Battistini, A., and Dotta, G.: TINITALY, a digital elevation model of Italy with a 10 meters cell size (Version 1.1), Istituto Nazionale di Geofisica e Vulcanologia (INGV). https://doi.org/10.13127/tinitaly/1.1, 2023.
Valentine, G. A.: Stratified flow in pyroclastic surges, B. Volcanol., 49, 616–630, 1987.
Valentine, G. A.: Damage to structures by pyroclastic flows and surges, inferred from nuclear weapons effects, J. Volcanol. Geoth. Res., 49, 616–630, https://doi.org/10.1016/S0377-0273(98)00094-8, 1998.
Valentine, G. A.: Initiation of dilute and concentrated pyroclastic currents from collapsing mixtures and origin of their proximal deposits, Bull. Volcanol., 82, 20, https://doi.org/10.1007/s00445-020-1366-x, 2020.
Valentine, G. A. and Sweeney, M. R.: Compressible Flow Phenomena at Inception of Lateral Density Currents Fed by Collapsing Gas-Particle Mixtures, J. Geophys. Res.-Sol. Ea., 123, 1286–1302, 2018.
Valentine, G. A., Fierstein, J., and White, J. D. L.: Pyroclastic deposits of Ubehebe Crater, Death Valley, California, USA: Ballistics, pyroclastic surges, and dry granular flows, Geosphere, 18, 1926–1957, https://doi.org/10.1130/GES02526.1, 2022.
Wilson, C. J. N.: The role of fluidization in the emplacement of pyroclastic clows: An experimental approach, J. Volcanol. Geoth. Res., 8, 231–249, https://doi.org/10.1016/0377-0273(80)90106-7, 1980.
Woods, A. W.: The dynamics of explosive volcanic eruptions, Rev. Geophys., 33, 495–530, 1995.
Woods, A. W., Sparks, R. S. J., Ritchie, L. J., Batey, J., Gladstone, C., and Bursik, M. I.: The explosive decompression of a pressurized volcanic dome: the 26 December 1997 collapse and explosion of Soufrière Hills Volcano, Montserrat, Geol. Soc. London Mem., 21, 457–465, 2002.
Zanchetta, G., Sulpizio, R., Pareschi, M. T., Leoni, F. M., and Santacroce, R.: Characteristics of May 5–6 1998 volcaniclastic debris flows in the Sarno area (Campania, Southern Italy): relationships to structural damage and hazard zonation, J. Volcanol. Geoth. Res., 133, 377–393, 2004.
Zanella, E., Gurioli, L., Lanza, R., Sulpizio, R., and Bontempi, M.: Deposition temperature of the AD 472 Pollena pyroclastic density current deposits, Somma-Vesuvius, Italy, Bull. Volcanol., 70, 1237–1248, https://doi.org/10.1007/s00445-008-0199-9, 2008.
Zanella, E., Sulpizio, R., Gurioli, L., and Lanza, R.: Temperatures of the pyroclastic density currents deposits emplaced in the last 22 kyr at Somma–Vesuvius (Italy), in: The Use of Palaeomagnetism and Rock Magnetism to Understand Volcanic Processes, edited by: Ort, M. H., Porreca, M., and Geissman, J. W., Geol. Soc. Lond., 396, 13–33, https://doi.org/10.1144/SP396.4, 2015.
Zuccaro, G. and Leone, M.: Building Technologies for the Mitigation of Volcanic Risk: Vesuvius and Campi Flegrei, Nat. Hadards Rev., 13, 221–232, 2012.
Zuccaro, G., Cacace, F., Spence, R. J. S., and Baxter, P. J.: Impact of explosive eruption scenarios at Vesuvius, J. Volcanol. Geoth. Res., 178, 416–453, 2008.
- Abstract
- Introduction
- Reconstruction of the facies architecture of PDC deposits
- Physical modelling of impact parameters: the example from the Pomici di Mercato eruption
- Hazard intensity maps and expected impact
- Conclusion
- Appendix A: The flow model and the numerical code
- Code availability
- Data availability
- Author contributions
- Competing interests
- Disclaimer
- Acknowledgements
- Financial support
- Review statement
- References