the Creative Commons Attribution 4.0 License.
the Creative Commons Attribution 4.0 License.
 | 18 Aug 2025
Seismic signal characterization of snow avalanches using distributed acoustic sensing in Grasdalen, western Norway
Franz Kleine
Charlotte Bruland
Andreas Wuestefeld
Volker Oye
Martin Landrø
We show the use of distributed acoustic sensing for analyzing seismic signals from snow avalanches. For three winter seasons, we continuously recorded seismic data using distributed acoustic sensing (DAS) on a standard telecommunication fiber along a mountain road in Grasdalen, western Norway. Multiple snow avalanches were registered, alongside various other signals such as road traffic and detonations from remote avalanche triggering. We describe the signal characteristics of natural and manually triggered avalanches and present a comparison with other observed signals in both time and frequency domain. Our frequency analysis shows that avalanche signals are most visible between 20–50 Hz.
For larger avalanches, we observe weak low-frequency precursor signals, which correspond to the avalanches approaching towards the fiber. The more prominent high-amplitude signals appear to be produced by the snow masses impacting the stopping cones or the steep terrain near the road. For a smaller, naturally released avalanche, we observe impulsive signals, interpreted as the snow mass stopping. These results agree with earlier studies that used geophone measurements.
Automatic detection, tested with simple STA/LTA thresholds in the 20–50 Hz range, presents challenges due to false positives from road traffic. Further refinement and testing are required to improve detection reliability in this complex environment. Our study represents an initial exploration into the application of distributed acoustic sensing for snow avalanche detection, showcasing its potential as an effective monitoring tool for long road networks in mountainous regions.
- Article
(12234 KB) - Full-text XML
- BibTeX
- EndNote


Snow avalanches and landslides pose a considerable risk to road safety and infrastructure in Norway (Bjordal and Larsen, 2009). According to Lunde and Njå (2019), this problem will become even more prevalent in the coming years with ongoing climate change. Avalanche monitoring systems can help improve road safety by enabling immediate and automatic road closures when necessary. By gathering real-time observational data about avalanche activity, these systems can reduce the risk of vehicles entering avalanche-prone areas. In addition, assessing whether vehicles were present near the danger zone during an avalanche helps determine whether a rescue mission is required.
Avalanche detection and monitoring have previously been done using either optical remote sensing or acoustic/seismic methods. Optical systems such as Doppler radar (Schreiber et al., 2001) or webcams (Fox et al., 2024) require direct line of sight and are limited in their spatial coverage. In the case of webcams the detection capability can be strongly decreased by bad weather conditions such as heavy snowfall. The second type of detection systems makes use of acoustic or seismic waves generated by avalanches (Suriñach et al., 2001). They offer long detection distances up to a few kilometers (Marchetti et al., 2019) and immunity to bad weather conditions. Additionally, no direct line of sight is necessary.
Seismic signals of snow avalanches were first recorded by St. Lawrence and Williams (1976). Using observations from Vallée de la Sionne in Switzerland, Suriñach et al. (2001) showed that seismic sensors can be used for studying avalanche characteristics. Analyzing seismic data from the same test site, Biescas et al. (2003) demonstrated that running frequency spectra show a gradual increase in higher-frequency signals as the avalanches approach the geophone placed in a bunker at the valley floor, resulting in a triangular shaped spectrum. This was observed for large avalanches that reached the sensor. Smaller avalanches which stopped 1000 m or further away from the sensor did not exhibit this triangular shape. Pérez-Guillén et al. (2016) studied frequency signatures of both dry and wet avalanches using geophones. For powder snow avalanches, the majority of seismic energy was found below 10 Hz, produced by the turbulent flow part at the front of the avalanche. For wet snow avalanches however, most of the seismic energy was generated by the dense flow regime, resulting in signals with a frequency content mainly above 10 Hz. Recording and locating multiple avalanche signals can be achieved by utilizing a geophone array in combination with beam-forming algorithms (Lacroix et al., 2012) or statistical models (Heck et al., 2018).
Distributed acoustic sensing (DAS) is a technology that utilizes optical fibers for measuring dynamic strain or strain rate along the cable's axial direction. This is achieved by sending laser pulses into the fiber and recording the backscattering, subsequently extracting phase differences between different backscattered light bits. The phase difference measurement can either be performed between the backscattering response from adjacent regions of fiber for the same incident pulse or between successive pulses but for the same region of fiber. Phase differences are then converted to strain rate or strain (Waagaard et al., 2021). DAS has been successfully tested and proven useful in a wide range of seismic applications, including oil and gas exploration (Liu et al., 2024) over monitoring of wells (Horst et al., 2015), urban activity (Lindsey et al., 2020), tides (Buisman et al., 2023), whales (Bouffaut et al., 2022) and microseismic events (Walter et al., 2020). It offers both high spatial and temporal resolution, with sensing distances in the meter range (Waagaard et al., 2021), and a frequency resolution between 0.01 Hz (Taweesintananon et al., 2023) and 50 kHz (Parker et al., 2014), depending on the interrogator. Since existing telecommunication fibers can be utilized, there is a great potential for monitoring applications without the immediate need of new installations. The key advantage over local installations like radar, geophones and infrasound systems is that with a single interrogator, more than 100 km of fiber can be monitored continuously (Waagaard et al., 2021), potentially enabling the observation of multiple snow avalanche sites using just one setup.
The first detection tests of triggered snow avalanches with DAS were conducted by Prokop et al. (2013). Using a fiber following an avalanche path, Fichtner et al. (2021) were able to observe snow avalanche signals and differentiate between flow regimes. Paitz et al. (2023) employed an unsupervised clustering algorithm (Bayesian Gaussian mixture model) on a set of features extracted from DAS avalanche recordings from the same test site. Amongst other findings, they could recognize seismic far field signatures before the avalanche hit the fiber. This gives hope for a realistic monitoring system where the sensor position does not necessarily lie in the avalanche path but is instead situated some distance away from it, such as a telecommunication fiber in a valley. Within this paper, we present results from a seismic avalanche test monitoring system in western Norway based on distributed acoustic sensing (DAS), utilizing a standard telecommunication fiber along a mountain road as the receiver.
During the winter seasons of 2021/2022, 2022/2023 and 2023/2024 we recorded DAS data in the mountain valley of Grasdalen in the region of Innlandet, Norway. The measurement period was approximately 4 months for each season. The DAS survey was conducted on a 2 km section of a single mode standard telecommunication fiber buried next to the road.
The environment surrounding the road changes throughout the array: at both ends, the road is going into tunnels. In the middle section it is housed in a concrete gallery that shields it from rockfall and snow avalanches.
On the part southwest of the bridge, the road runs next to 10 m high conical breaking mounds protecting it from avalanches (labeled as cones). On both sides of the gallery, steel cattle grids are embedded into the road. Due to the changing surroundings we expect to observe different noise levels throughout the array. The setup is displayed in Figs. 1 and A1 (bird's eye perspective).
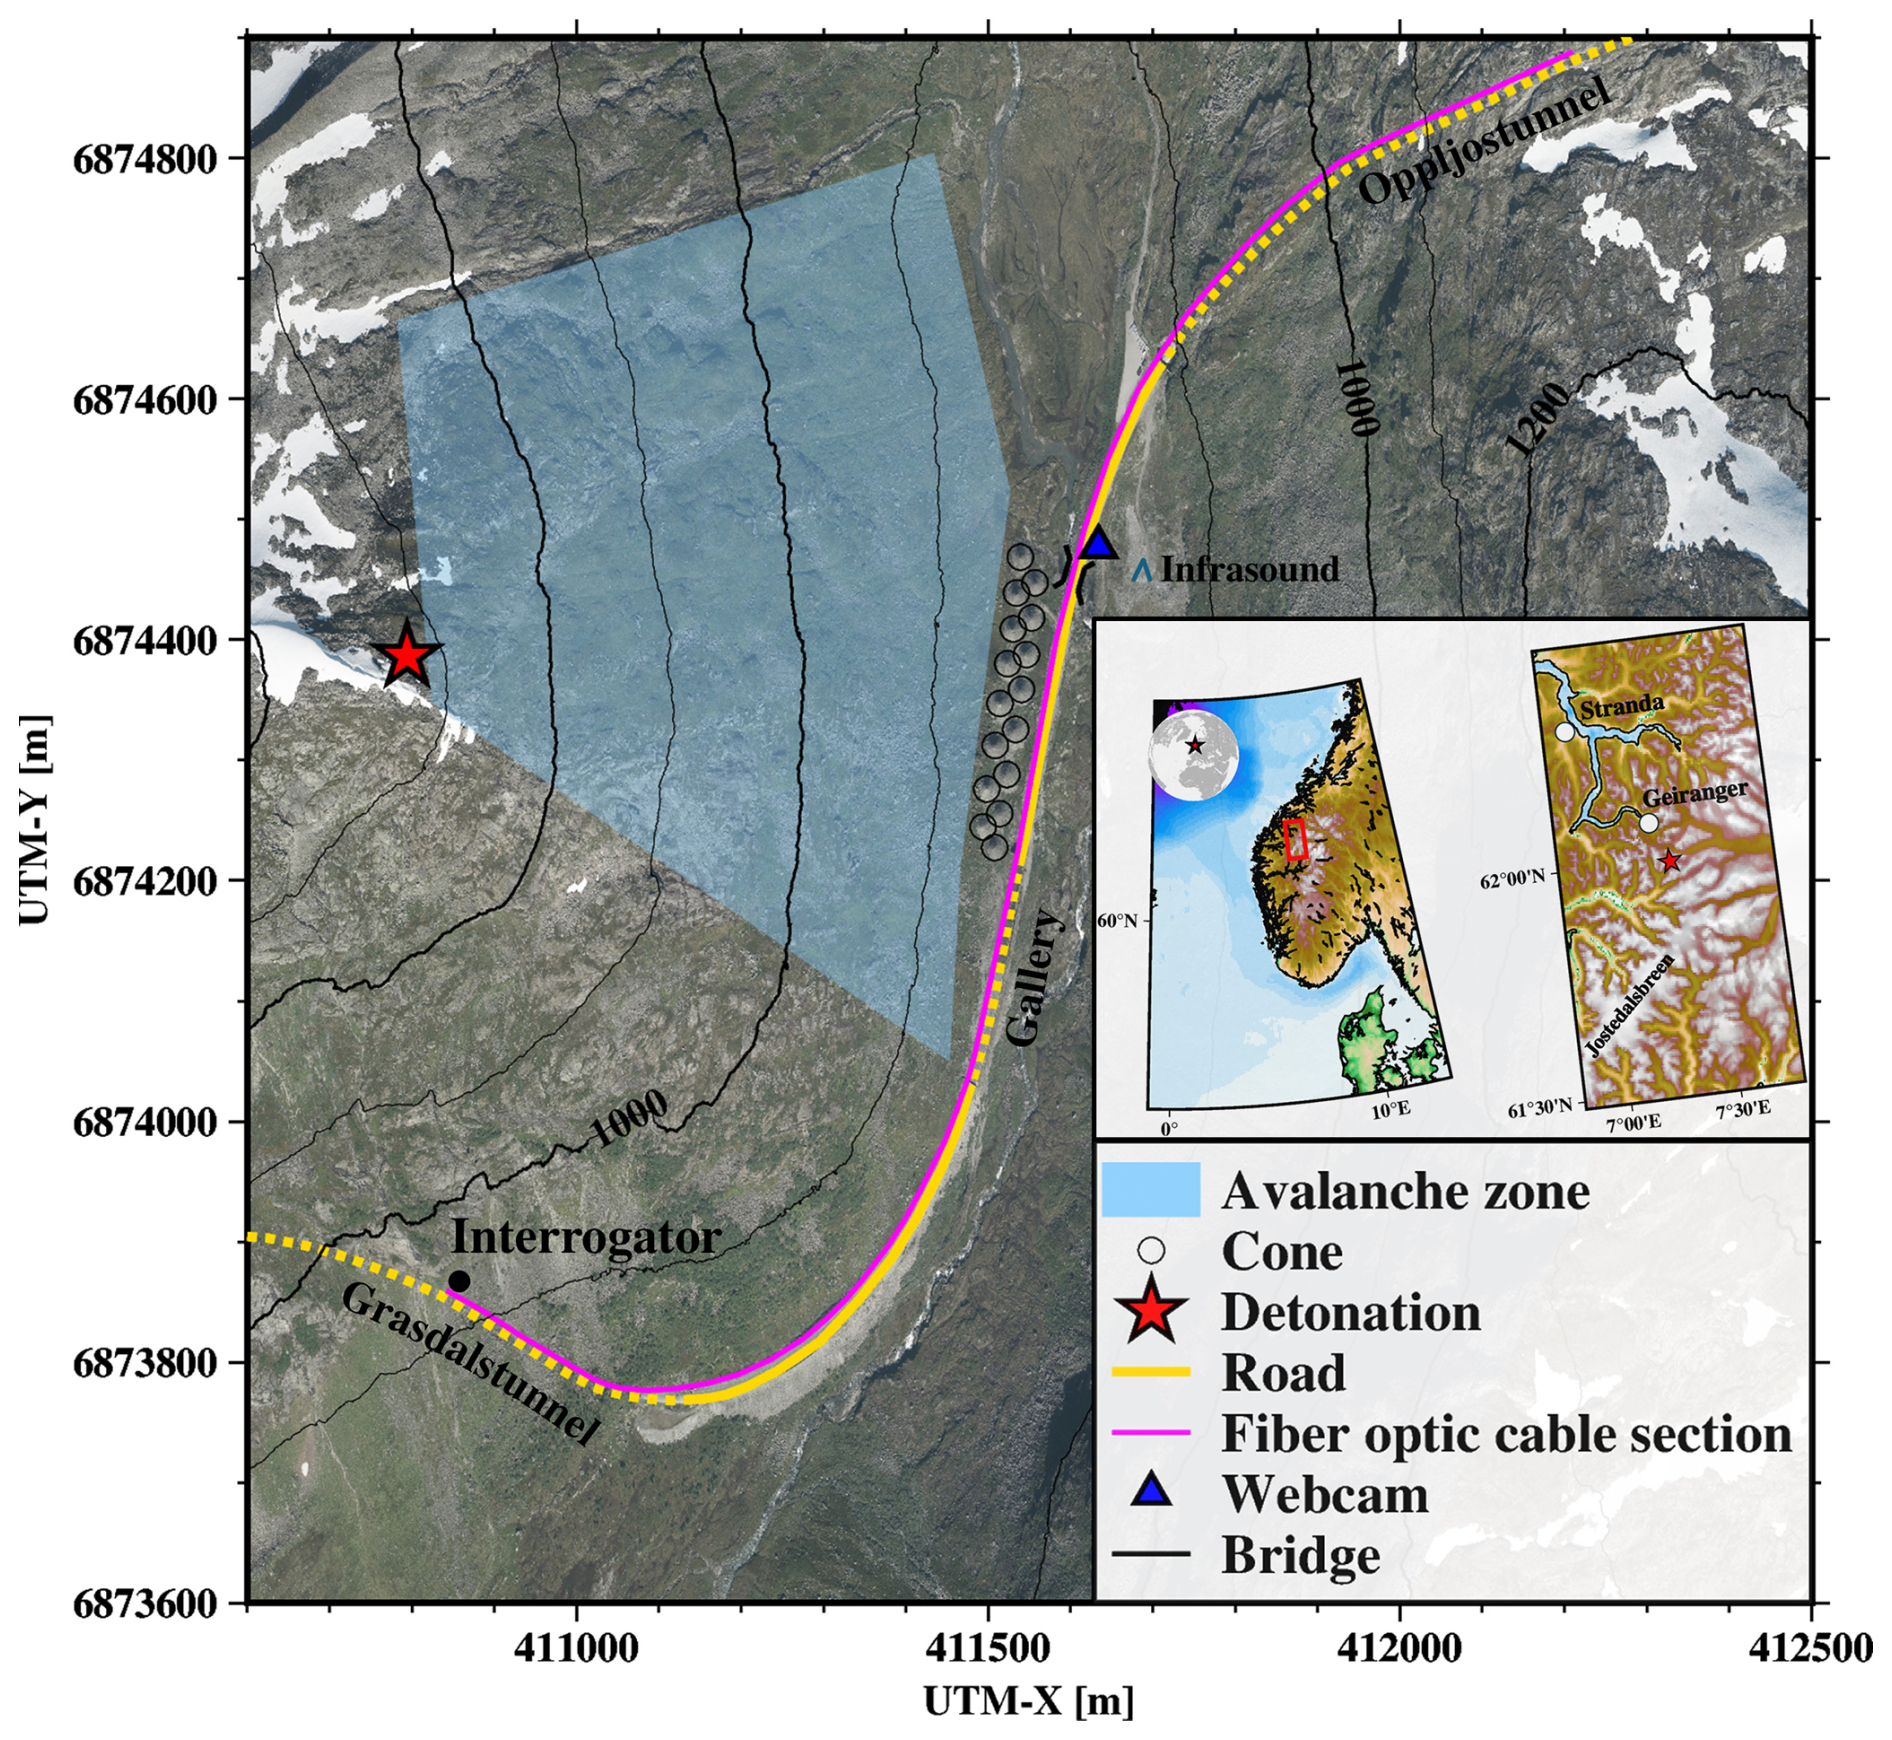
Figure 1Overview of the Grasdalen survey setup. The tunnels sections of the road (and fiber) are displayed as dashed lines. The altitude difference between neighboring contour lines is 100 m. Aerial footage by Norwegian Mapping Authority (2020).
The DAS array is monitoring the avalanche-prone east face of the mountain called Sætreskarsfjellet. It stretches from 1300 m.a.s.l. down to the valley floor at 875 m.a.s.l. Between 950 and 1250 m.a.s.l. the slope is mostly between 30 and 35° steep, with rocky bands in between that are up to 45° steep (Norges vassdrags- og energidirektorat, 2024). Avalanches can be manually triggered by setting off explosives. The detonation point is located at the top of the mountainside at 1300 m.a.s.l. (see Fig. 1).
The mountainside is simultaneously monitored with a commercial, infrasound-based avalanche detection system located 100 m east of the bridge. We do not have direct access to the infrasound data and can only use the event entries that are available on Varsom Regobs (2024). Additionally, a webcam located near the bridge was used for verification of avalanche activity and the extent of avalanche runout zones.
Based on previous avalanche reports from Grasdalen on Varsom Regobs (Norwegian web portal for registering and sharing natural hazard warnings), the altitude difference and slope, we expect avalanches of up to size 3 (size level based on European Avalanche Warning Services, 2024). This means avalanches of a length over several 100 m with a total volume of 10 000 m3, capable of crossing the road and destroying cars.
We recorded strain rate with an ANS OptoDAS interrogator with 2 m channel spacing, variable gauge lengths between 3.1 and 5.1 m and sampling rates of 250 and 500 Hz for different seasons. The gauge length in our system is defined as the length of fiber over which phase measurements of the backscattered optical signal are spatially averaged (Waagaard et al., 2021). The acquisition parameters utilized for each season can be found in Table A1. The interrogator is located at a service point inside the southern tunnel (see Fig. 1).
3.1 Types of signals
During the surveying period, the DAS array recorded distinct seismic signals originating from road traffic, avalanche-triggering explosions and snow avalanches (both natural and artificially triggered), characterized by differences in spatial patterns, amplitude distributions and frequency content. Avalanche signals are particularly dominant in the 20–50 Hz range and localized amplification of traffic signals is observed near the bridge and cattle grids.
This section provides a comparison between these signal types, followed by an in-depth analysis of selected avalanches. The avalanches were identified in the DAS data using the avalanche catalog from Varsom Regobs (2024). This catalog is based on observations from webcams, the infrasound system in the valley and reports from human observers, including personnel from the state road authority responsible for avalanche risk assessments.
An overview of four representative signals is displayed in Fig. 2. Figure 2a illustrates the signal from an artificially triggered avalanche on 10 February 2022 09:01 (UTC). The detonation occurs approximately 40 s earlier and is displayed separately (Fig. 2d).
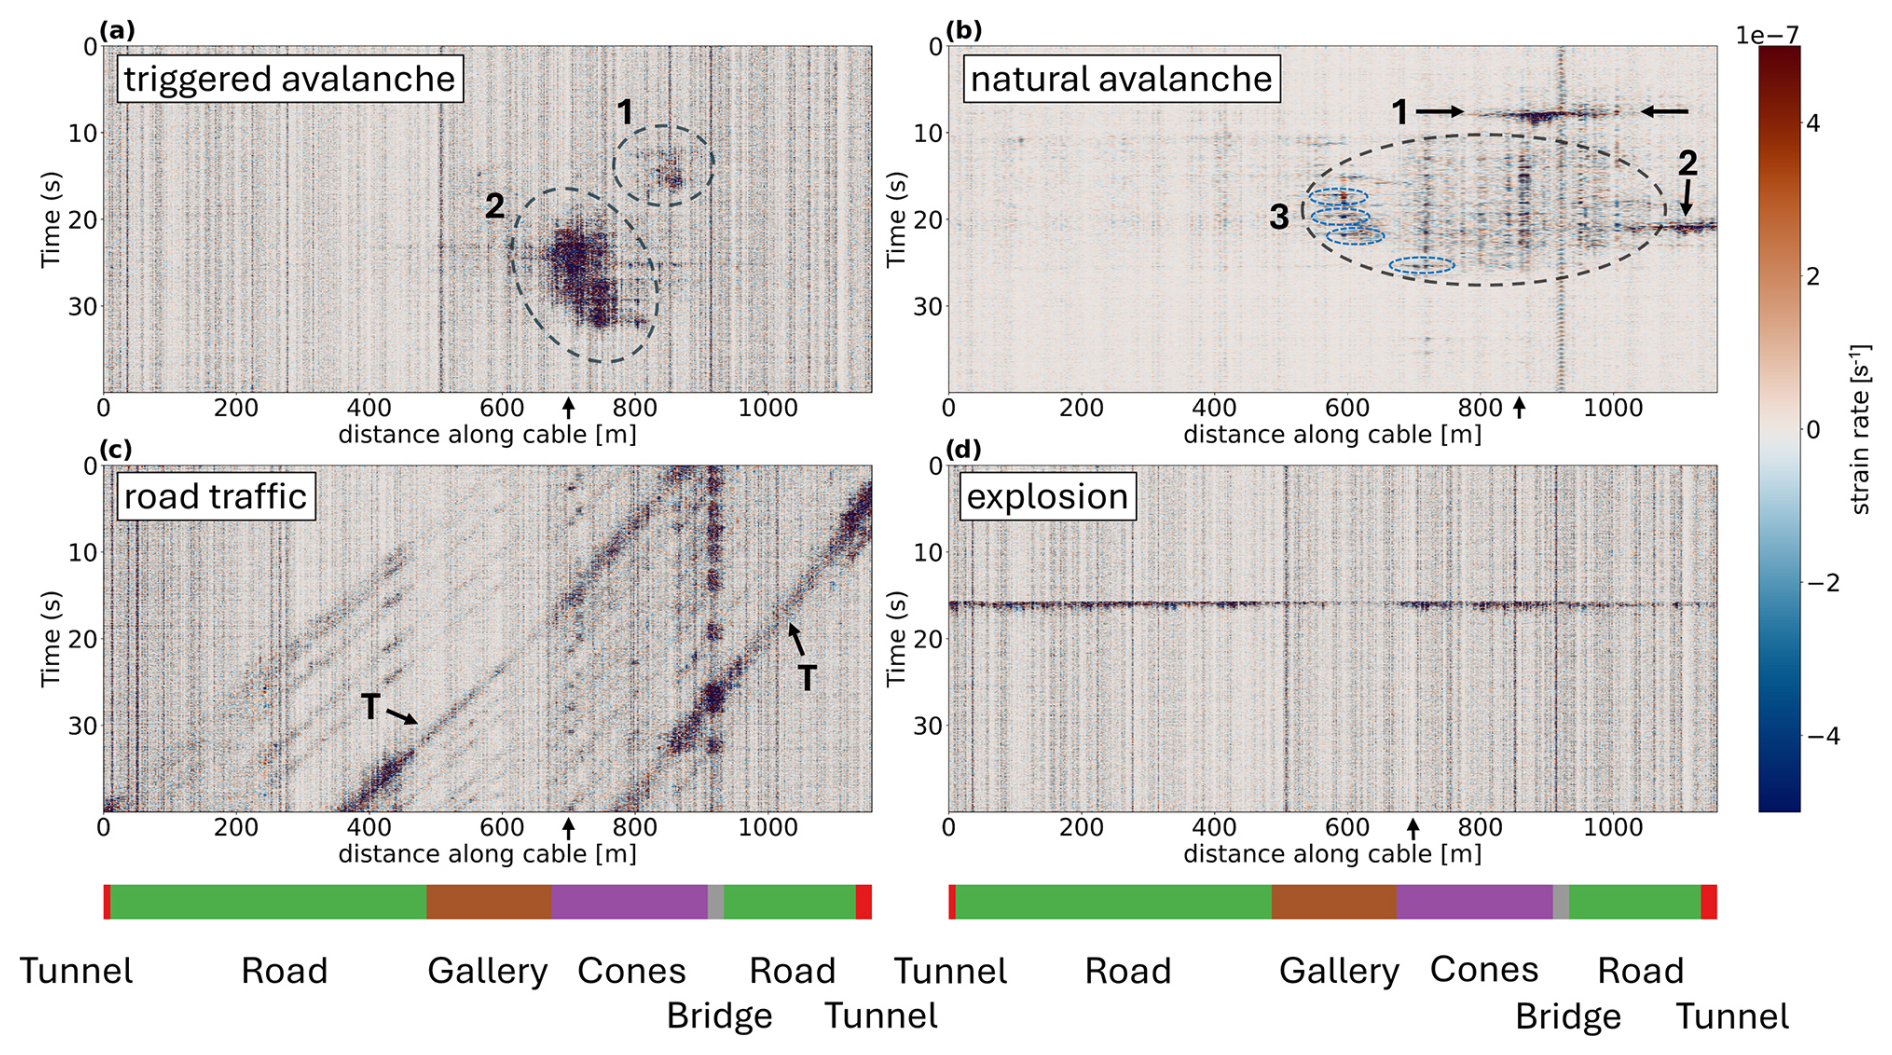
Figure 2Strain rate plots of four different signal types: (a) triggered snow avalanche from 10 February 2022 09:01 (UTC) resulting in two signals that are marked with (1) and (2); (b) natural snow avalanche from 2 February 2024 17:21 (UTC) with three distinct features (marked with 1, 2 and 3). Within the third event group, four noticeable spike events are encircled in blue. (c) Traffic signals from 10 February 2022 11:07 (UTC) including two strong signals visible across all channels, associated with heavier vehicles like trucks (marked with “T”). (d) Explosion signal from 10 February 2022 09:00 (UTC) which triggered the avalanche shown in (a). A high-pass filter (third-order Butterworth) with a cutoff frequency of 0.5 Hz was used to suppress low-frequency channel noise. Arrows mark the single channels that were used for frequency analysis (Fig. 3).
The avalanche impacted the cones and covered the road between the bridge and the gallery with a 0.5 m thick layer of snow (RegObs Avalanche Observation, 2022). The signal is divided into two distinct areas: the first starting at 10 s between 800 and 880 m (marked with 1 in Fig. 2a) and the second (marked with 2) between 650 and 775 m.
Figure 2b shows the signal of a naturally released snow avalanche from 2 February 2024 17:21 (UTC). Three distinct features are observed: the first event between 7.5 and 9 s (marked with 1) shows the highest amplitudes. Since these are observed west of the bridge near the cones, we interpret this as the slide hitting one or multiple of the cones. The second sharp event (2) occurs at the end of the open road section close to the tunnel. Since there is a steep incline from the riverbed up to a parking lot next to the tunnel entrance, this signal could be generated by the avalanche impacting the ramp of the parking lot (marked with “P” in Fig. A1). The recurring activity in the area marked with 3 is interpreted as multiple smaller slides going off after the first one. Additionally, four short events (encircled in blue) with relatively high amplitudes, each lasting approximately 0.5 s, were detected in this area. Those could be connected to parts of the avalanche coming to a stop.
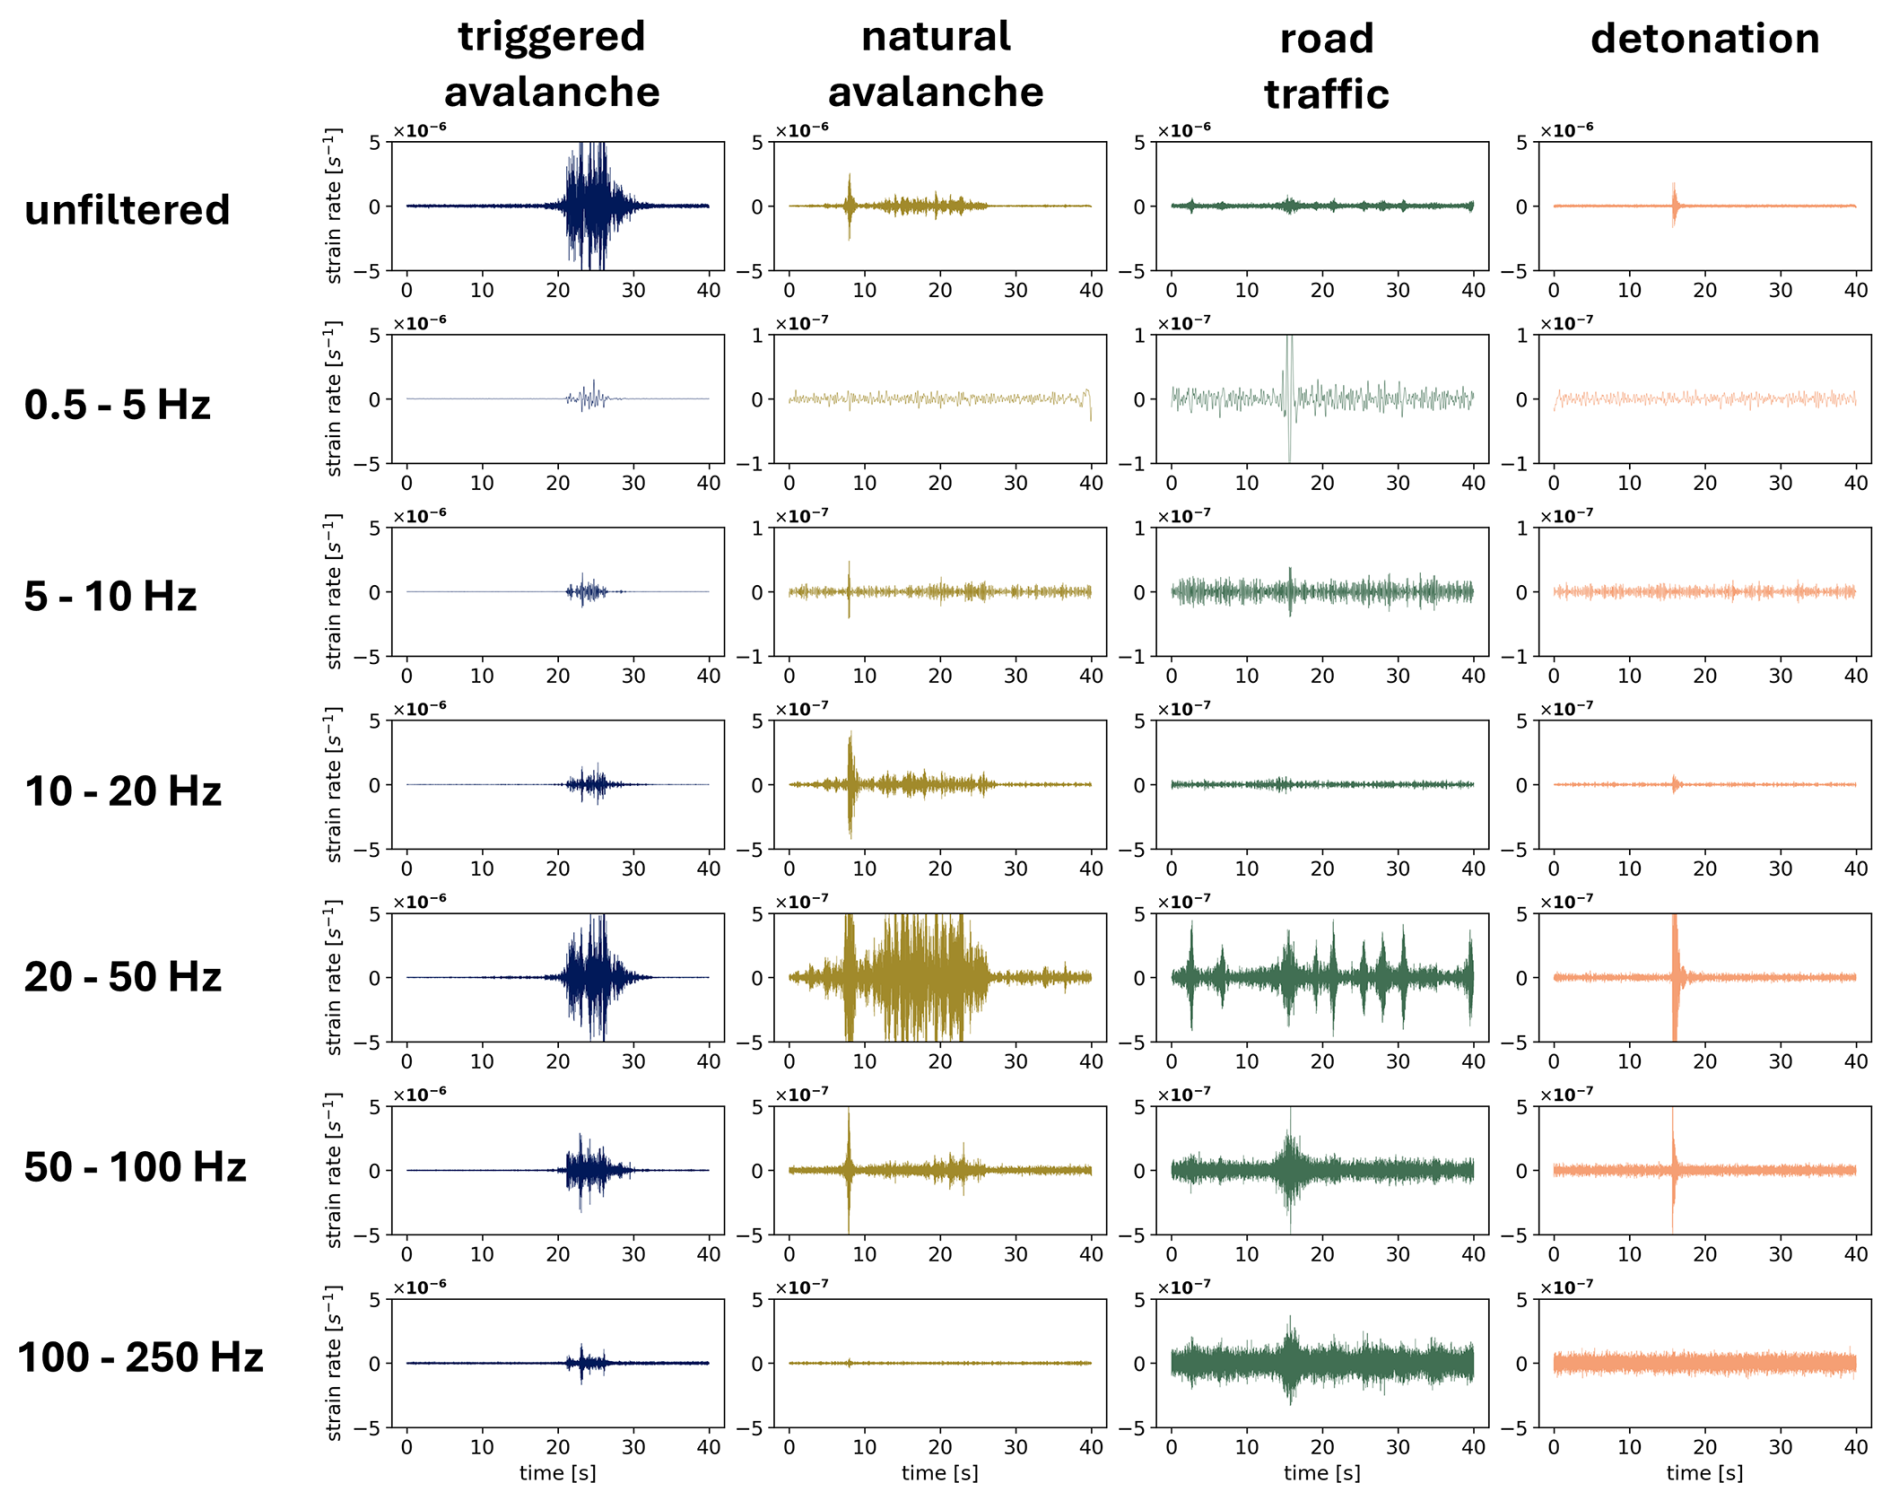
Figure 3Frequency comparison of single channel (that are indicated with arrows in Fig. 2) data for different event types in winter: (a) triggered snow avalanche from 10 February 2022 09:01 (UTC), (b) natural snow avalanche from 2 February 2024 17:21 (UTC), (c) car signals from 10 February 2022 11:07 (UTC) and (d) explosion signal from 10 February 2022 09:00 (UTC). Note that the y axis scaling varies.
Figure 2c shows signals generated by cars passing the valley from northeast to southwest on 10 February 2022 11:07 (UTC). In total, 15 individual traffic sources can be identified. By comparing these signals with webcam-confirmed traffic events, we conclude that the stronger amplitudes (marked with a “T”) likely correspond to trucks, while the other signals are attributed to passenger cars. For reference, a confirmed truck signal is added in the Appendix Fig. B1. The strength of the individual traffic signals fluctuates across the array sections, with the gallery area appearing to be less sensitive.
The bridge section, in particular, exhibits noisy signals, which are further amplified when traffic passes over it. Similarly, the cattle grids at 10, 430, 705 and 1130 m show increased signal noise under traffic conditions, as shown in Appendix B1.
In Fig. 2d, the explosion signal that triggered the avalanche shown in Fig. 2a is displayed. It is visible throughout the whole array, with smaller amplitudes in the gallery section. The maximum duration is approximately 1 s.
We filtered the seismic data into several frequency bands and then compared the signals from selected channels.
For the artificially triggered avalanches, we chose the channel from the array section next to the cones (where the amplitudes were highest). We used the same channel to analyze traffic and explosion data for consistency. For the natural avalanche, the highest amplitudes were observed closer to the bridge; therefore, a different channel located near the bridge was chosen for analysis.
In Fig. 3, the four different events from Fig. 2 are compared, showing one channel each. Figure 3a represents an artificially triggered avalanche, Fig. 3b a natural avalanche, Fig. 3c road traffic and Fig. 3d an explosion used for avalanche triggering. Note that the y axis scaling varies in Fig. 3 to improve visibility and accommodate small values.
For both the triggered and natural avalanches, most of the energy is found between 20 and 50 Hz. The triggered avalanche signal is visible across all frequency bands, with the highest amplitudes between 20 and 50 Hz. This frequency band was selected for later detection studies. We suspect that the broad frequency response stems from the impulsive impact of the snow mass hitting the cones.
The natural avalanche from 2 February 2024 17:21 (UTC) shows a spike at the beginning, likely due to the avalanche hitting the cones.
Signals from road traffic are also prominently present in the 20–50 Hz range (Fig. 3c). Notably, the signal at 16 s is visible across all frequency bands. Individual car peaks are easily identifiable, especially in the 20–50 Hz band. The detonation signal is visible in the 20–100 Hz range.
A comparison of the observed event types in the frequency–space (F-X) domain is shown in Fig. 4. To provide a comprehensive overview of the variety of signals, we included an additional triggered avalanche from 10 April 2022 and a natural avalanche from 2 February 2024. Furthermore, to illustrate both the variability and similarities in road traffic signals, we also present examples of vehicle signals: a car from 8 February 2024 and a truck from 16 April 2022.
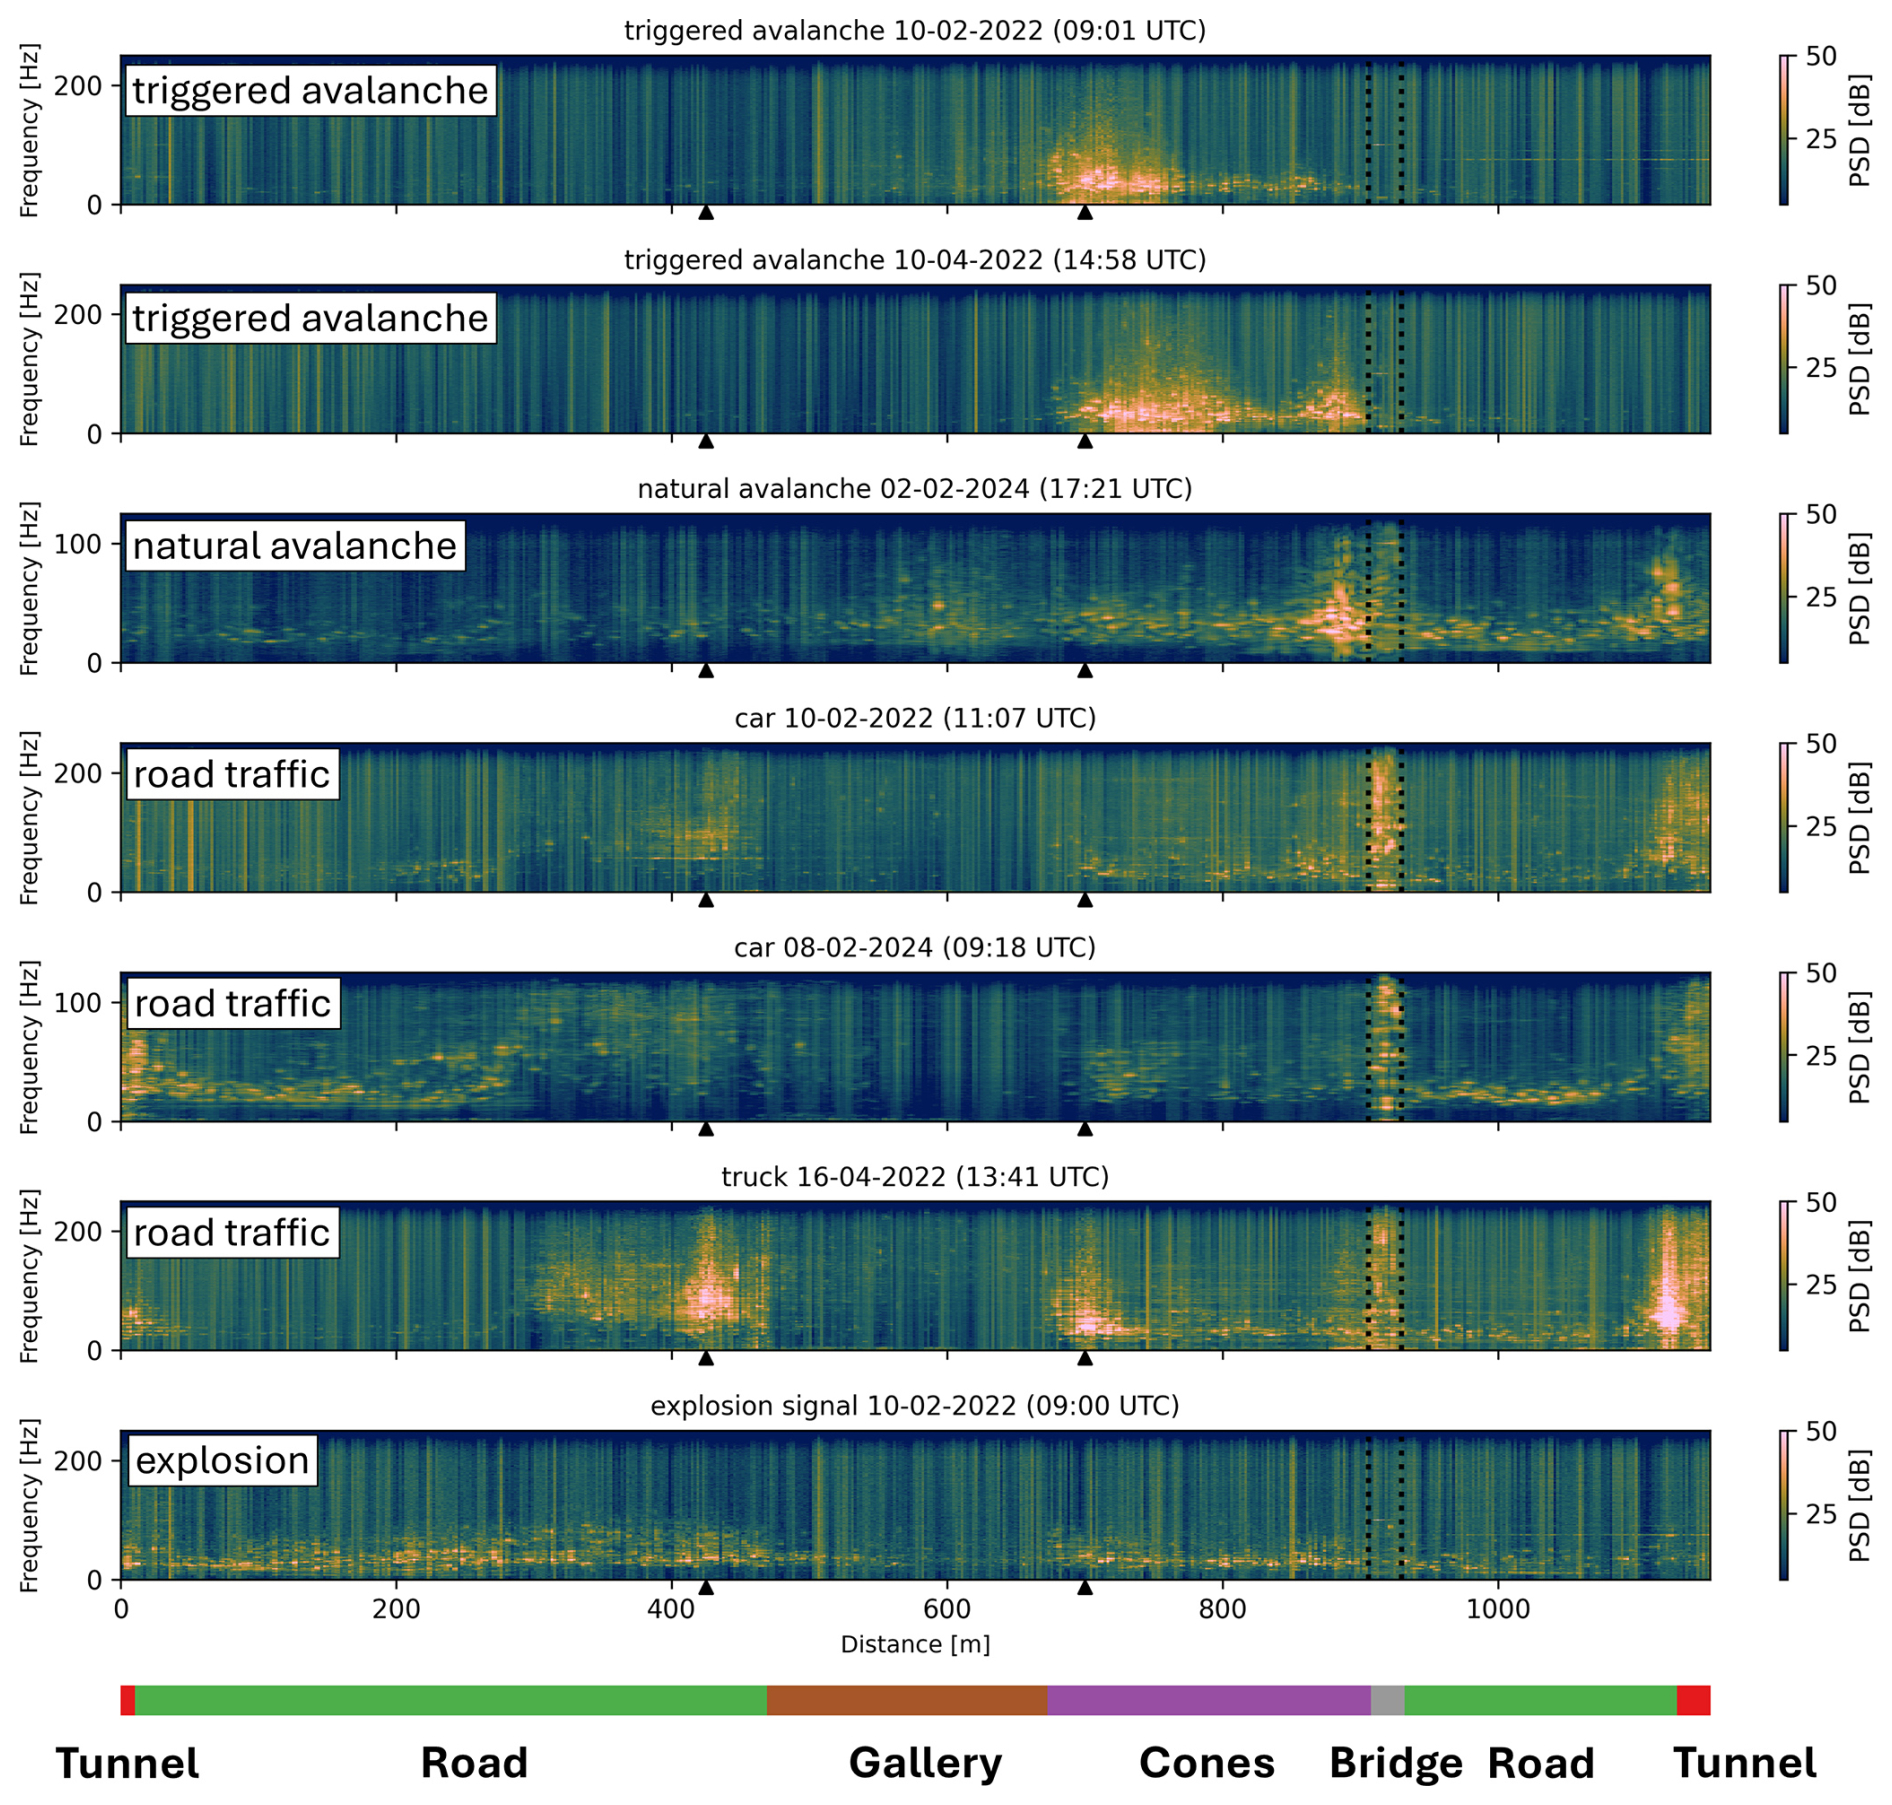
Figure 4Event comparison in the F-X domain. The arrow heads mark the positions of the cattle grids and the dotted lines the location of the bridge. The maximum observable frequency for the 2024 dataset is lower (125 Hz) since the dataset of 2024 was recorded with 250 Hz instead of 500 Hz.
The vertical stripe patterns likely result from variable coupling between the cable and the ground along the array. Similarities between triggered avalanches are evident in both their spatial extent and frequency content. Also, the triggered avalanche from 10 February 2022 and the natural avalanche from 2 February 2024 exhibit comparable spectral activity in the range between 850 and 900 m. Traffic noise is particularly pronounced near the bridge (marked with dotted lines) and the cattle grids (indicated by arrowheads). These locations exhibit high spectral intensities between approximately 20 and 220 Hz. The increased visibility of noise from the truck on 16 April 2022 is likely due to seasonal change: by this later date, the road was dry and the cattle grids were no longer filled with snow, causing increased noise generation when vehicles are crossing the exposed steel rods.
3.2 Signal evolution
In this section, we present a more detailed analysis of two avalanches (triggered and natural), focusing on their time evolution and signal characteristics.
The data are bandpass-filtered (20–50 Hz), after which the is computed using window lengths of 1 s (STA) and 10 s (LTA). In this case, the window lengths for the STA and LTA were chosen to effectively capture the onset of avalanche signals, including short, impulsive events, such as those encircled in blue in Fig. 2b.
The spectra were calculated using a windowed fast Fourier transform with Hanning windows of 0.5 s duration and 50 % overlap. The spectrogram is calculated for each channel individually, then stacked within the regions of avalanche activity and normalized by the number of stacked traces.
Figure 5 illustrates the time evolution of the avalanche triggered on 10 February 2022 09:01 (UTC).
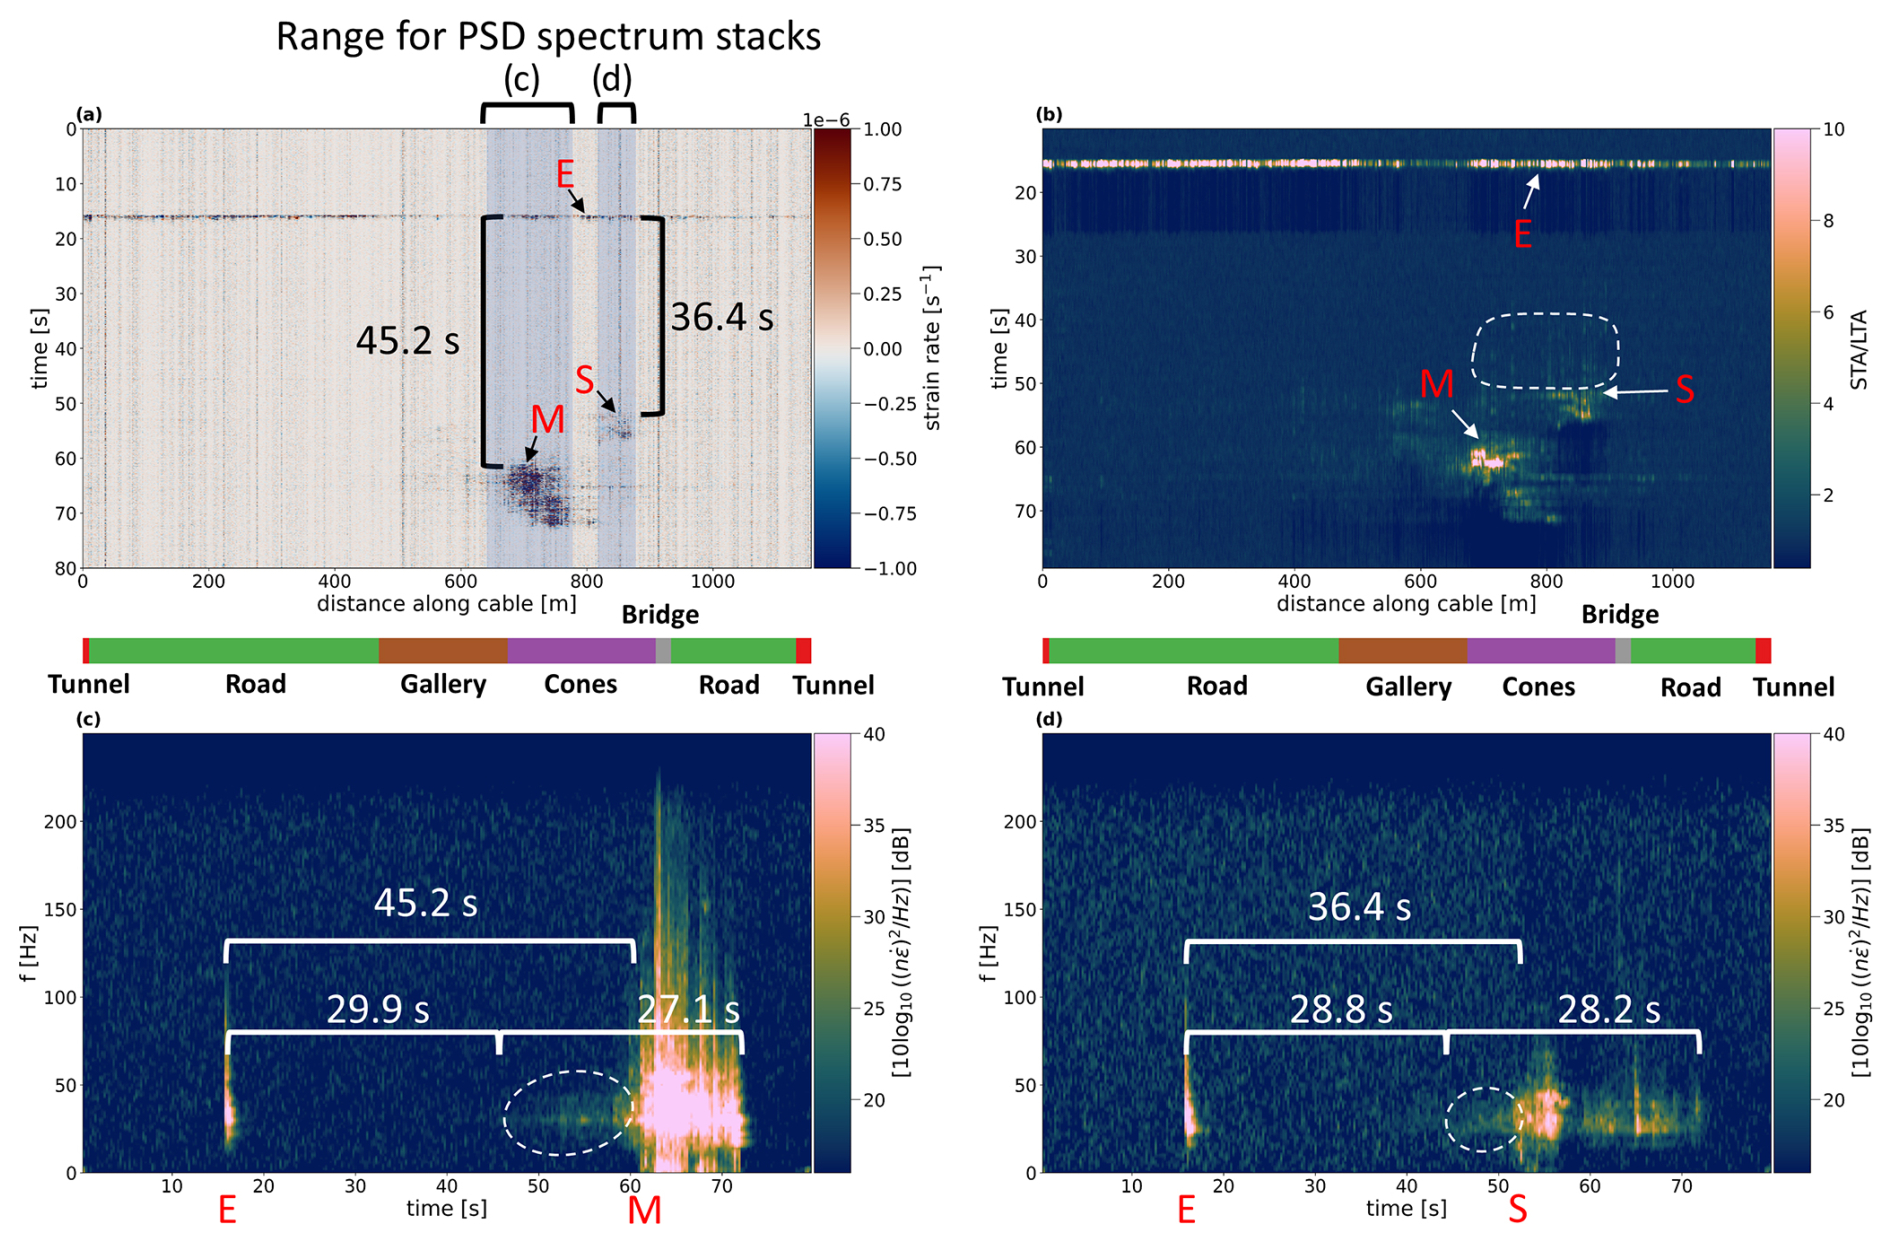
Figure 5Temporal overview of the triggered avalanche from 10 February 2022 09:01 (UTC). (a) Strain rate plot including explosion (E) and two avalanche signals (S for the small event and M for the main event). For reference, the time difference between the explosion and the two main signals is added (45.2 s for M, 36.4 s for S). Blue-shaded areas highlight the channels that are used to compute the stacked spectrum plots shown in (c) and (d). A high-pass filter (third-order Butterworth) with a cutoff frequency of 0.5 Hz was used to suppress low-frequency channel noise. (b) in 20–50 Hz band (short window: 1 s, long window: 10 s). Explosion (E) and two avalanche signals (S and M) are highlighted as in (a). Precursor activity before the strong signal onsets is encircled in white. Panels (c) and (d): stacked spectrograms for the two channel ranges indicated in (a). The time intervals between the explosion and the start of precursor activity, as well as between the explosion and the strong signal onsets (onsets are labeled with M and S, respectively), are shown with white brackets, along with the corresponding time differences. Precursor activity occurring before the strong signal onsets is encircled in white.
The strain rate plot (Fig. 5a) shows the initial explosion at 16 s, followed by a small event occurring 36 s later and the main event appearing 45 s after the explosion. While the strain rate plot does not indicate significant activity before these events, minor disturbances are observed in the STA/LTA plot between 40 and 50 s (circled in white). In the stacked spectrograms (Figs. 5c and d), a weak signal between 20 and 35 Hz emerges at 45.9 s for the first stacking window and at 44.8 s in the second. The onset of strong signals (M and S in Fig. 5a) corresponds to a broadening of frequency content in the stacked spectrograms. For both stacking windows the activity stops at 73 s, yielding total event durations of 27.1 and 28.2 s, respectively. This aligns well with the infrasound measurement of the avalanche, reporting a time of 28 s (RegObs Avalanche Observation, 2022). Given the size and impact of this avalanche, the infrasound measurement is considered reliable, consistent with previous findings on the effectiveness of infrasound in detecting large avalanches (Mayer et al., 2020).
The second analyzed event is a natural avalanche from 2 February 2024 17:21 (UTC), shown in Fig. 6. The event duration is 25 s, with a 6 s precursor signal visible in the stacked spectrogram preceding the first impulsive event (marked with “1”). Two distinct high-amplitude impulses are observed, possibly corresponding to major snow impacts, followed by lower-amplitude signals that may indicate subsequent smaller slides.
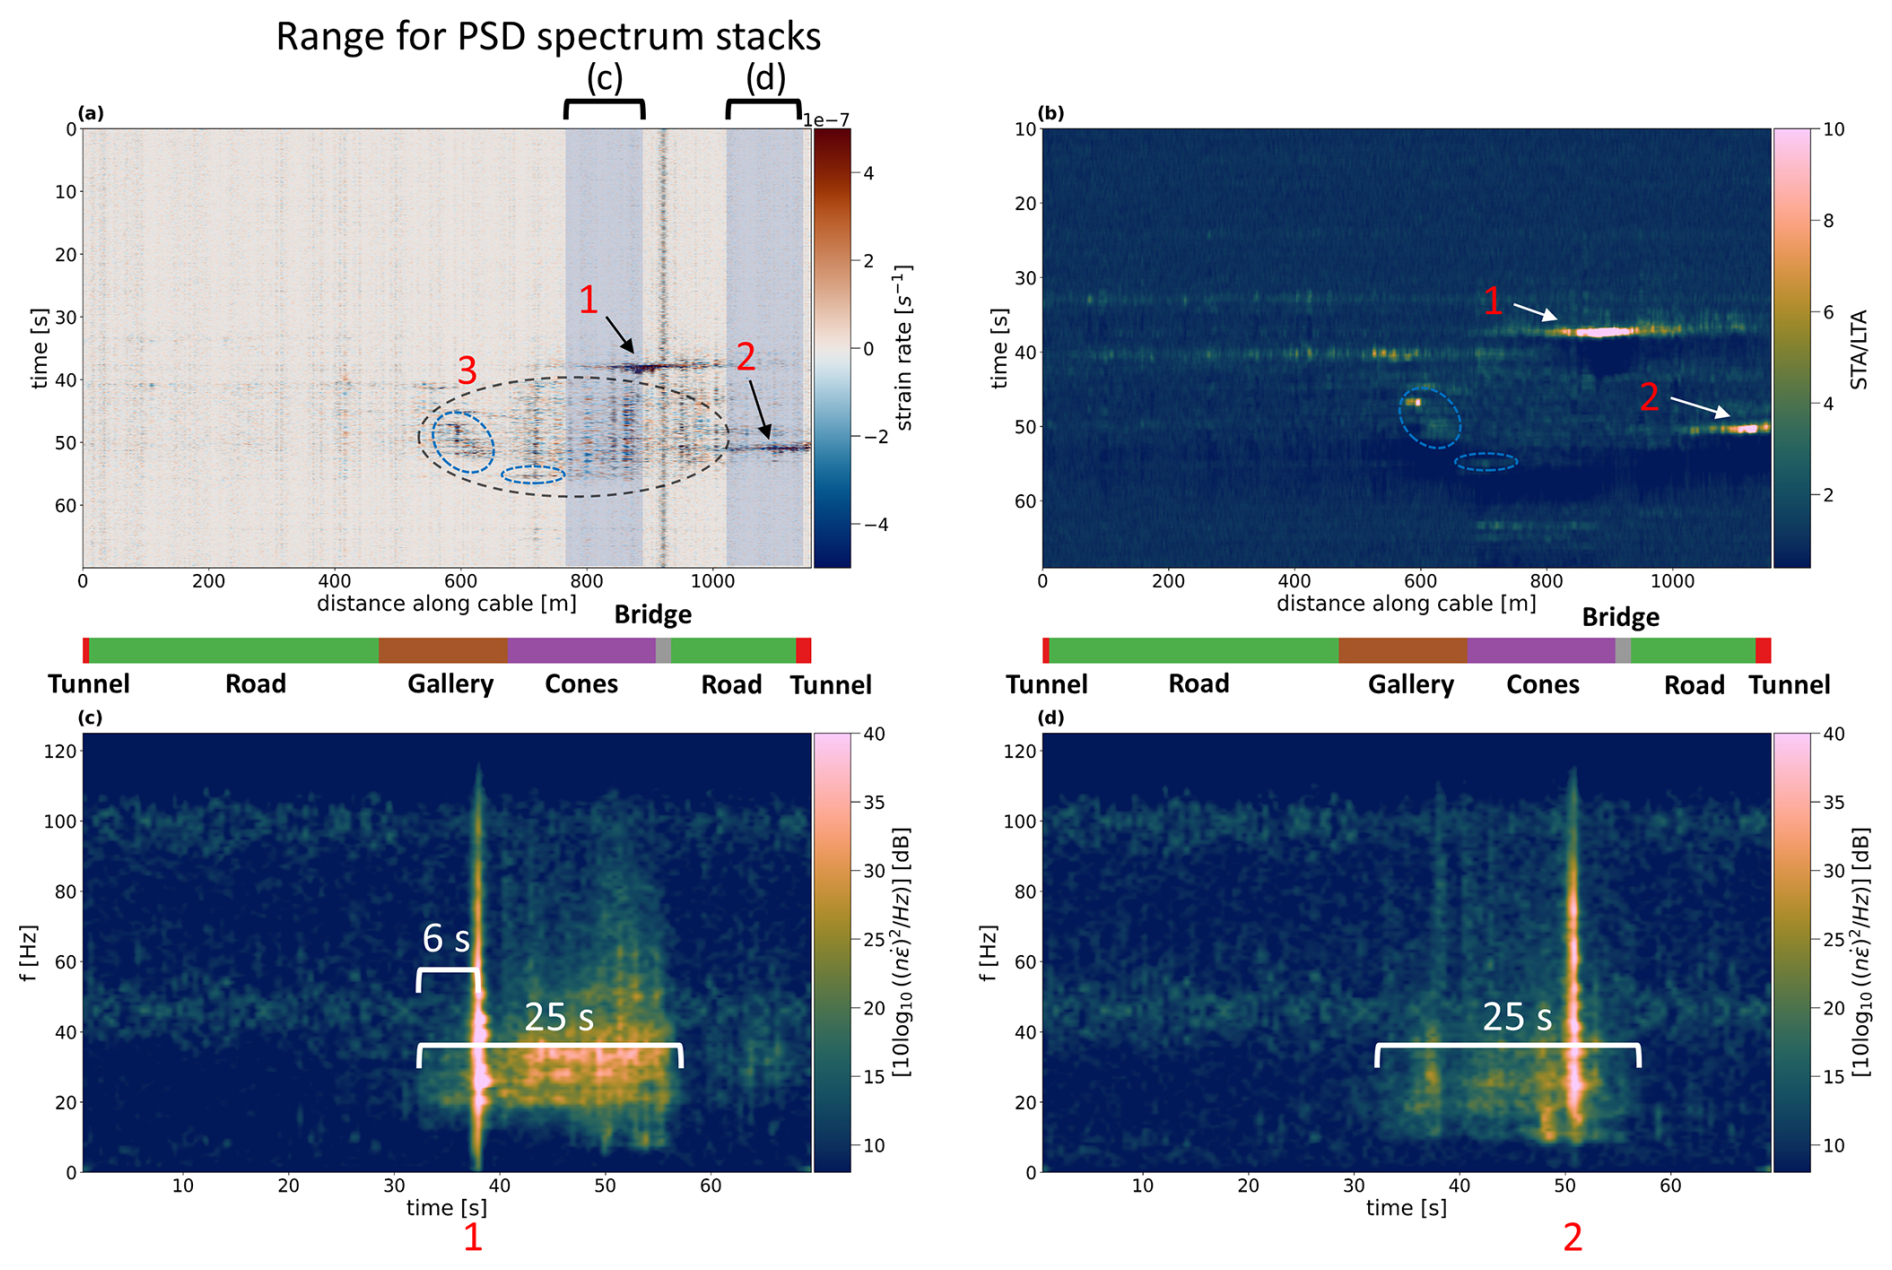
Figure 6Temporal overview of the natural avalanche from 2 February 2024 17:21 (UTC). (a) Strain rate plot including two strong avalanche signals (labeled 1 and 2) and several less strong avalanche signals (labeled with 3). Four noticeable short events within this range are encircled in blue. Blue-shaded areas highlight the channels that are used to compute the stacked PSD spectrum plots shown in (c) and (d). A high-pass filter (third-order Butterworth) with a cutoff frequency of 0.5 Hz was used to suppress low-frequency channel noise. (b) in 20–50 Hz band (short window: 1 s, long window: 10 s). The two strong avalanche signals (1 and 2) are highlighted as in (a). The short events mentioned in (a) are encircled in blue. Panels (c) and (d): stacked PSD spectra for the two channel ranges indicated in (a). The total event time is indicated with white brackets. Precursor activity occurring before the strong signal onsets is encircled in white.
At the onset of the strong signals in the strain rate plot, we observe a broadening of the frequency content. This likely corresponds to seismic waves stemming from the snow mass hitting the cones. For both stacking ranges, the activity in the spectrograms resumes at 57 s. This leads to a total event duration of 25 s.
We recorded seismic signals from snow avalanches using distributed acoustic sensing (DAS) along a mountain road. The highest amplitude signals, present over the full recordable frequency range between 0 and 250 Hz, were observed on fiber stretches adjacent to the cones and the steep terrain incline leading up to the road. We believe that this could result from the snow mass colliding with the mentioned features, producing high-amplitude surface waves. We also detected pre-impact signals using the spectrogram. Those lie in the frequency range from 20–50 Hz, likely caused by the approaching avalanche (Fig. 5).
For the natural avalanche on 2 February 2024 17:21 (UTC), several short signals were observed at different parts of the cable as described in Fig. 2 (encircled in blue). Since three of those events are detected in the section of the avalanche gallery with no obvious obstacles present, we associate them with several small parts of the slide coming to an abrupt stop. This would fit the findings of Suriñach et al. (2000), who reported short duration signals at the end of the avalanche signal trains, commonly referred to as the stopping phase. They recorded artificially triggered snow avalanches using 3C geophones 1–3 km away from the avalanche path. Similar signals were detected and analyzed in more detail by Suriñach et al. (2020), using geophones placed along the avalanche path. In one case of their recorded events, a wet snow avalanche stopped before reaching the geophone, presenting a scenario similar to the one observed in this study. The sudden stop of the snow mass produced a spike in the seismic signal over the full frequency range of 1–40 Hz. Based on these findings, we think the same explanation could also be valid for the aforementioned signals observed by our DAS system. Alternatively, the smaller, impulsive signals near the avalanche gallery could result from snow dropping off the gallery roof. However, this interpretation seems less likely, as the strongest DAS signals were recorded primarily near the cones adjacent to the bridge and the section northeast of it, close to the parking lot. Given that the avalanche did not reach the road (confirmed by the Norwegian Public Roads Administration), avalanche activity across the gallery appears improbable.
We attempted to apply frequency–wavenumber (fk) filters to remove any noise, including traffic, approaching the fiber cable at relatively low apparent velocities. However, as seen in Fig. 2c and better in Fig. B1, the traffic signal is incoherent from trace to trace. Averaging over several traces though helps to make the signal coherent. However, this also applies to the avalanche signal, and subsequent fk filters will also remove a significant part of the avalanche signal while only reducing the coherent part of the traffic signal, still leaving much traffic noise in the data. Hence, fk filters applied to this case study does not solve the problem, but more advanced transformation of the noise should be tried out in order to detect smaller slides where the thresholds for triggering would need to be lowered without too many false detections.
In the two triggered events, two spatially distinct signals suggest the presence of two different avalanche paths approximately 80 m apart. Although we detect small precursor signals for two large avalanches, they are weak and difficult to identify, making real-time detection challenging. Additional instrumentation, such as extending the fiber up the mountainside, could improve this and also be used for studying avalanche dynamics in more detail, as shown by Paitz et al. (2023).
Automated real-time avalanche detection remains challenging due to the variability in avalanche signals as well as the presence of traffic noise. As an initial attempt, we tested STA/LTA threshold triggering in the 20–50 Hz frequency band with threshold values between 5 and 10, focusing on the open road section next to the cones. While both triggered avalanches are picked up by this method, smaller, less characteristic events such as the side events displayed in Fig. 6a (labeled with 3) are not detected. As mentioned, road traffic noise along the fiber path adds to the problem, since especially large trucks exhibit strong signals present over the full recorded frequency range. This effect is amplified at the cattle grids and the bridge where the noise spreads over multiple channels as displayed in Fig. B1a. This leads to numerous false positives, which cannot be filtered out at present.
In a recent study by Kang et al. (2024) it was demonstrated that utilizing the phase information of cross-spectral density matrices can be used for detection of rock-slope failures, leveraging the presence of event-specific coherence patterns. This was achieved using a semi-supervised classification approach. This method could also be promising for snow avalanche detection. However, implementation with this dataset might be challenging due to the limited number of confirmed avalanche events available as training data. Additionally, while the authors used frequencies within the 2–8 Hz range, our results show that in this dataset avalanche signals are most prominent at higher frequencies (20–50 Hz). It is uncertain whether the method would maintain its effectiveness in this frequency band.
One other potential solution shown by Truong et al. (2024) could involve using edge detection techniques to identify the typical diagonal lines that correspond to vehicles followed by applying the Hough transform (Duda and Hart, 1972) to extract these features. Given the large quantity of available training data for traffic signals in this study, this approach could be further enhanced by integrating a convolutional neural network (CNN) to improve line detection accuracy, as demonstrated by Xie et al. (2025). The process would start with applying a conventional threshold trigger to a segment of data. If an event is detected, the resulting trigger matrix (a binary image containing only the trigger values) would be analyzed for diagonal (slanted) features, for example, using the Sobel operator (Kanopoulos et al., 1988). The Sobel-detected edges would then be processed with the Hough transform for line extraction. If no lines are detected, the event could be flagged as a potential avalanche.
Our findings demonstrate that existing telecommunication fibers can serve as seismic sensors for snow avalanche monitoring. For reliable automatic detection, improved traffic noise discrimination is needed.
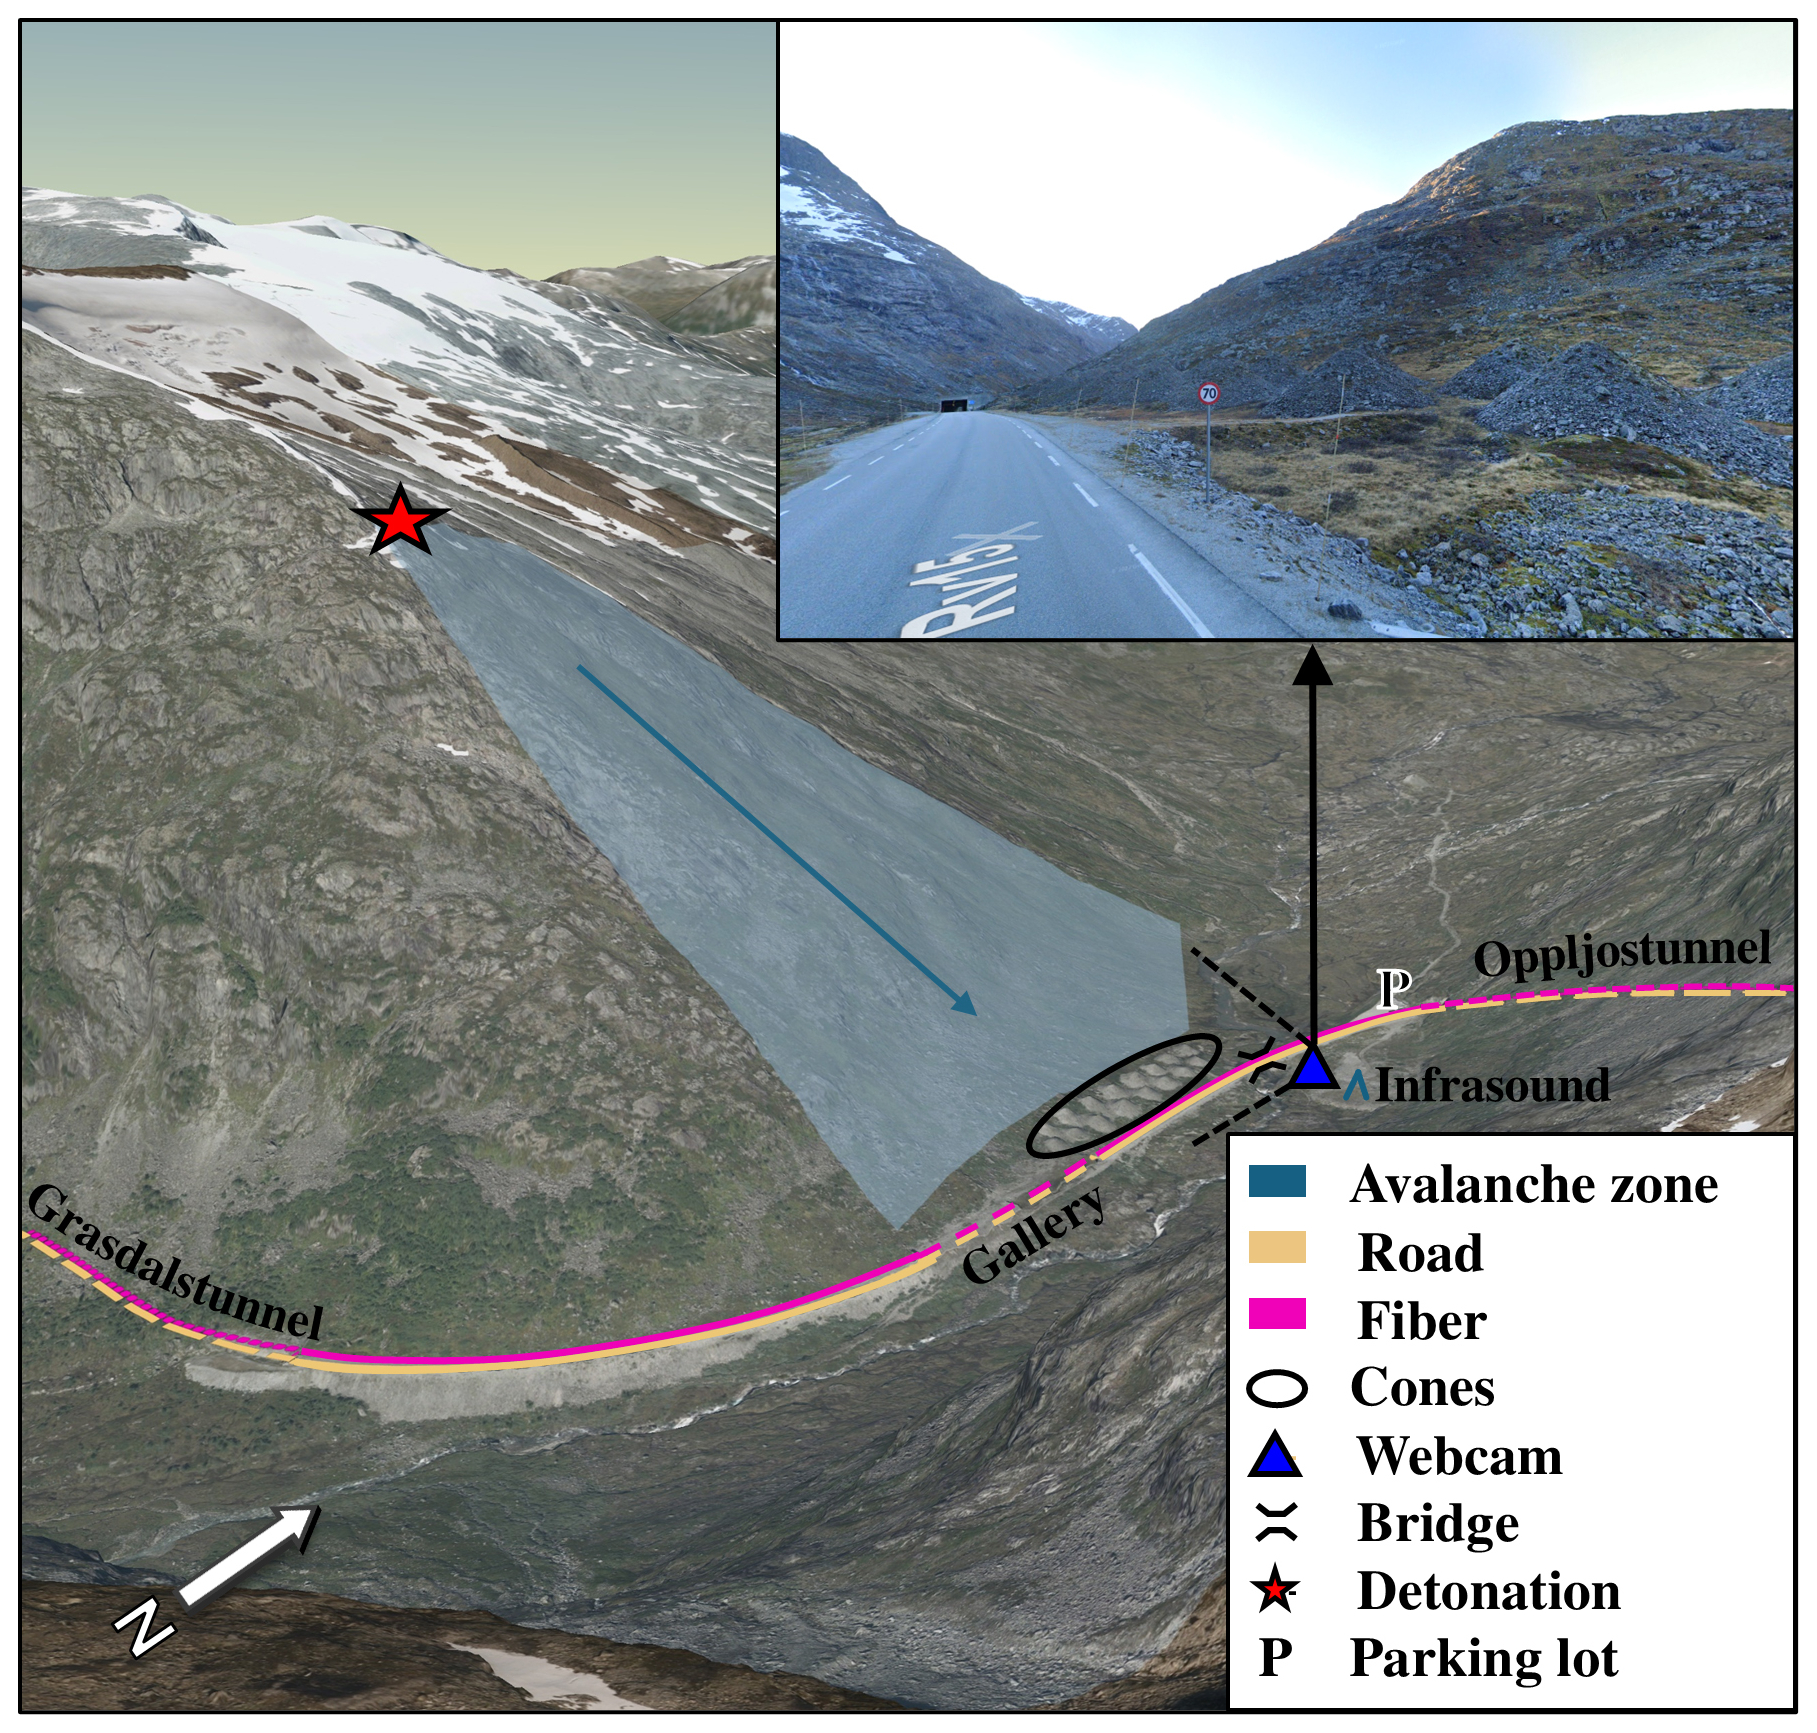
Figure A1A 3D view of the Grasdalen valley and the survey setup. The inset image shows the east face of Sætreskarsfjellet, the cones and the road as seen from the bridge. Aerial footage by Norwegian Mapping Authority (2020), inset image by ©Google (2024).
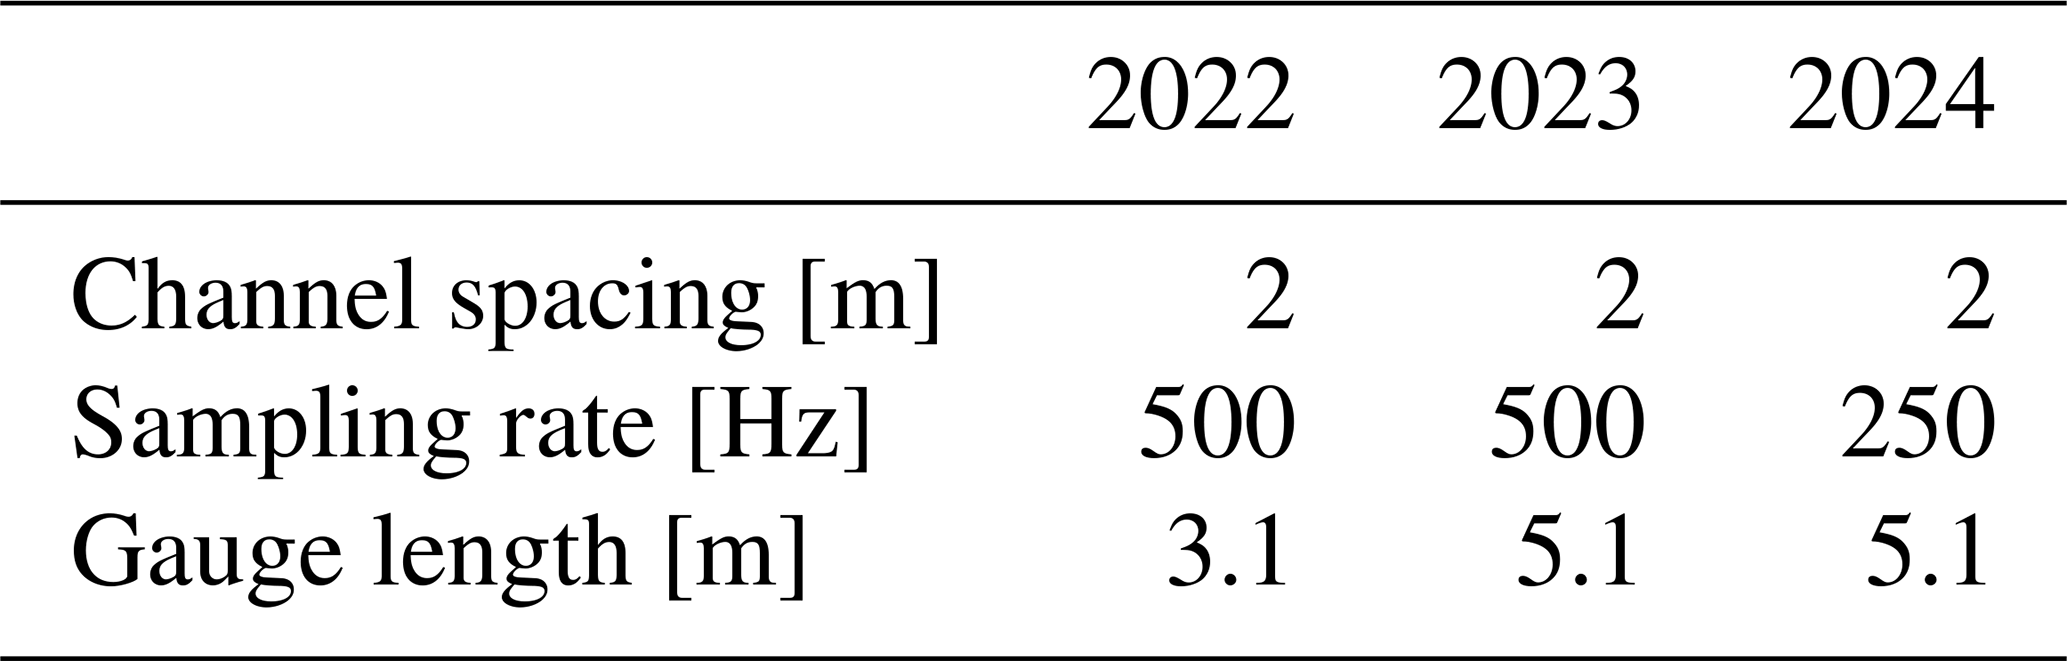
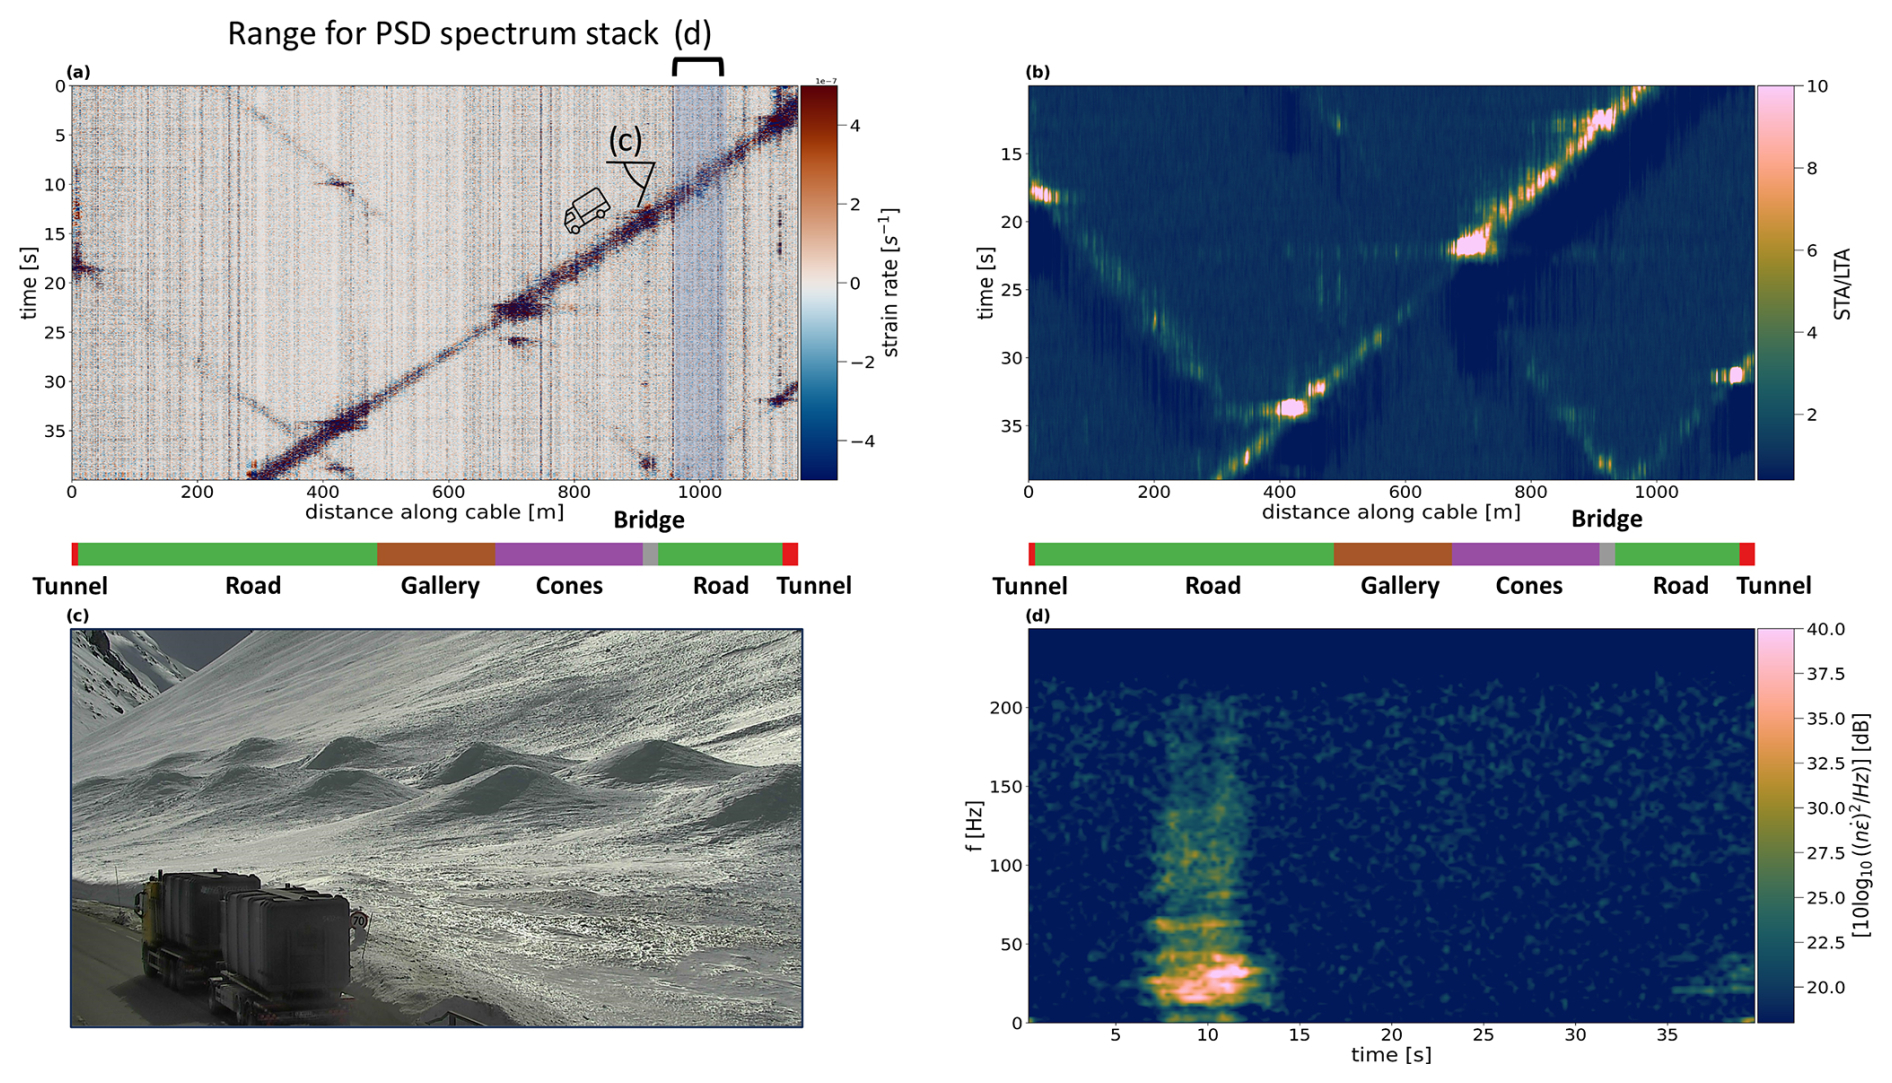
Figure B1Road traffic signals from 16 April 2022 13:41 (UTC). The strongest signal belongs to a two-axle truck passing the array from northeast to southwest. (a) Strain rate plot with signals of four individual vehicles. The strongest signal train is caused by a truck, passing the road from northeast to southwest. This was verified by the webcam footage shown in (c). Webcam and truck position from the webcam image are marked. Note the noisy signals created by the vehicles passing over the kettle grids at 10, 430, 705 and 1130 m as well as the bridge. The blue-shaded area highlights the channels that are used for the stacked PSD spectrum plot shown in (d). A high-pass filter (third-order Butterworth) with a cutoff frequency of 0.5 Hz was used to suppress low-frequency channel noise. (b) in 20–50 Hz band (short window: 1 s, long window: 10 s). (c) Webcam image showing the truck next to the cones. Webcam and truck position are sketched in (a). (d) Stacked PSD spectra for the two range of channels.
At the moment, the DAS data of this study are not publicly available. Access can be granted on individual request.
AW and VO initiated the research; AW gathered the data; FK analyzed the data, plotted graphs and maps and wrote the article; AW and CB reviewed graphs and assisted with data analysis; VO and ML reviewed and edited the article.
The contact author has declared that none of the authors has any competing interests.
Publisher's note: Copernicus Publications remains neutral with regard to jurisdictional claims made in the text, published maps, institutional affiliations, or any other geographical representation in this paper. While Copernicus Publications makes every effort to include appropriate place names, the final responsibility lies with the authors.
We thank all participants of the DAS measurement campaign and resulting discussions. Special thanks to Tore Humstad and Emil Solbakken from Statens Vegvesen for providing webcam footage and avalanche and traffic data, as well as for giving us a general overview of the site. The color maps used in this work were developed by Crameri (2023).
This research has been supported by the Research Council of Norway (grant no. 309960).
This paper was edited by Filippos Vallianatos and reviewed by Dominik Gräff, Martijn van den Ende and Fabian Walter.
Biescas, B., Dufour, F., Furdada, G., Khazaradze, G., and Suriñach, E.: Frequency Content Evolution of Snow Avalanche Seismic Signals, Surv. Geophys., 24, 447–464, https://doi.org/10.1023/B:GEOP.0000006076.38174.31, 2003. a
Bjordal, H. and Larsen, J.: Avalanche Risk in a Changing Climate Development of a Landslide and Avalanche Risk Model, https://www.semanticscholar.org/paper/Avalanche-Risk-in-a-Changing-Climate-Development-of-Bjordal (last access: 17 October 2024), 2009. a
Bouffaut, L., Taweesintananon, K., Kriesell, H. J., Rørstadbotnen, R. A., Potter, J. R., Landrø, M., Johansen, S. E., Brenne, J. K., Haukanes, A., Schjelderup, O., and Storvik, F.: Eavesdropping at the Speed of Light: Distributed Acoustic Sensing of Baleen Whales in the Arctic, Front. Mar. Sci., 9, 901348, https://doi.org/10.3389/fmars.2022.901348, 2022. a
Buisman, M., Draganov, D., and Kirichek, A.: Monitoring tidal water-column changes in ports using distributed acoustic sensing, 84th EAGE Annual Conference & Exhibition, 2023, 1–5, https://doi.org/10.3997/2214-4609.2023101115, 2023. a
Crameri, F.: Scientific colour maps, Zenodo, https://doi.org/10.5281/zenodo.8409685, 2023. a
Duda, R. O. and Hart, P. E.: Use of the Hough transformation to detect lines and curves in pictures, Commun. ACM, 15, 11–15, https://doi.org/10.1145/361237.361242, 1972. a
European Avalanche Warning Services: Avalanche Size – EAWS, https://www.avalanches.org/standards/avalanche-size/#size-3 (last access: 17 October 2024), 2024. a
Fichtner, A., Edme, P., Paitz, P., Lindner, N., Hohl, M., Huguenin, P., Sovilla, B., Roig-Lafon, P., Surinach, E., and Walter, F.: Observing avalanche dynamics with Distributed Acoustic Sensing, EGU General Assembly 2021, online, 19–30 Apr 2021, EGU21-16562, https://doi.org/10.5194/egusphere-egu21-16562, 2021. a
Fox, J., Siebenbrunner, A., Reitinger, S., Peer, D., and Rodríguez-Sánchez, A.: Automating avalanche detection in ground-based photographs with deep learning, Cold Reg. Sci. Technol., 223, 104179, https://doi.org/10.1016/j.coldregions.2024.104179, 2024. a
Google: Google Streetview, http://maps.google.com (last access: 17 October 2024), 2024. a
Heck, M., Hammer, C., van Herwijnen, A., Schweizer, J., and Fäh, D.: Automatic detection of snow avalanches in continuous seismic data using hidden Markov models, Nat. Hazards Earth Syst. Sci., 18, 383–396, https://doi.org/10.5194/nhess-18-383-2018, 2018. a
Horst, J. v., Panhuis, P. i., Al-Bulushi, N., Deitrick, G., Mustafina, D., Hemink, G., Groen, L., Potters, H., Mjeni, R., Awan, K., Rajhi, S., and Bakker, G.: Latest Developments using Fiber Optic Based Well Surveillance such as Distributed Acoustic Sensing (DAS) for Downhole Production and Injection Profiling, SPE Kuwait Oil and Gas Show and Conference, Mishref, Kuwait, 11–14 October 2015, https://doi.org/10.2118/175211-MS, 2015. a
Kang, J., Walter, F., Paitz, P., Aichele, J., Edme, P., Meier, L., and Fichtner, A.: Automatic Monitoring of Rock–Slope Failures Using Distributed Acoustic Sensing and Semi–Supervised Learning, Geophys. Res. Lett., 51, e2024GL110672, https://doi.org/10.1029/2024GL110672, 2024. a
Kanopoulos, N., Vasanthavada, N., and Baker, R. L.: Design of an image edge detection filter using the Sobel operator, IEEE J. Solid-St. Circ., 23, 358–367, https://doi.org/10.1109/4.996, 1988. a
Lacroix, P., Grasso, J.-R., Roulle, J., Giraud, G., Goetz, D., Morin, S., and Helmstetter, A.: Monitoring of snow avalanches using a seismic array: Location, speed estimation, and relationships to meteorological variables, J. Geophys. Res.-Earth Surf., 117, F01034, https://doi.org/10.1029/2011JF002106, 2012. a
Lindsey, N. J., Yuan, S., Lellouch, A., Gualtieri, L., Lecocq, T., and Biondi, B.: City-Scale Dark Fiber DAS Measurements of Infrastructure Use During the COVID-19 Pandemic, Geophys. Res. Lett., 47, e2020GL089931, https://doi.org/10.1029/2020GL089931, 2020. a
Liu, B., Jiang, W., He, X., Wen, P., and Zhang, M.: High-density offshore seismic exploration with an optical fibre towed streamer based on distributed acoustic sensing: Concept and application, Geophys. Prospect., 73, 812–823, https://doi.org/10.1111/1365-2478.13535, 2024. a
Lunde, A. and Njå, O.: Rescue performance in Norwegian road related avalanche incidents, Cold Reg. Sci. Technol., 165, 102774, https://doi.org/10.1016/j.coldregions.2019.04.011, 2019. a
Marchetti, E., Walter, F., Barfucci, G., Genco, R., Wenner, M., Ripepe, M., McArdell, B., and Price, C.: Infrasound Array Analysis of Debris Flow Activity and Implication for Early Warning, J. Geophys. Res.-Earth Surf., 124, 567–587, https://doi.org/10.1029/2018JF004785, 2019. a
Mayer, S., van Herwijnen, A., Ulivieri, G., and Schweizer, J.: Evaluating the performance of an operational infrasound avalanche detection system at three locations in the Swiss Alps during two winter seasons, Cold Reg. Sci. Technol., 173, 102962, https://doi.org/10.1016/j.coldregions.2019.102962, 2020. a
Norges vassdrags- og energidirektorat: NVE Temakart: Automatisk klassifisert skredterreng, Kartverket, https://temakart.nve.no/link/?link=kast (last access: 17 October 2024), 2024. a
Norwegian Mapping Authority: Ortofoto Stryn 2020, Kartverket, https://kartkatalog.geonorge.no/metadata/ortofoto-stryn-2020/a6696100-dc5a-4e57-a5a9-38cf2b095554 (last access: 17 October 2024), 2020. a, b
Paitz, P., Lindner, N., Edme, P., Huguenin, P., Hohl, M., Sovilla, B., Walter, F., and Fichtner, A.: Phenomenology of Avalanche Recordings From Distributed Acoustic Sensing, J. Geophys. Res.-Earth Surf., 128, e2022JF007011, e2022JF007011, https://doi.org/10.1029/2022JF007011, 2023. a, b
Parker, T., Shatalin, S., and Farhadiroushan, M.: Distributed Acoustic Sensing – a new tool for seismic applications, First Break, 32, 61–69, https://doi.org/10.3997/1365-2397.2013034, 2014. a
Pérez-Guillén, C., Sovilla, B., Suriñach, E., Tapia, M., and Köhler, A.: Deducing avalanche size and flow regimes from seismic measurements, Cold Reg. Sci. Technol., 121, 25–41, https://doi.org/10.1016/j.coldregions.2015.10.004, 2016. a
Prokop, A., Wirbel, A., and Jungmayr, M.: The “Avalanche Detector”, a new avalanche monitoring tool using distributed acoustic fibre optic sensing, International Snow Science Workshop Grenoble – Chamonix Mont-Blanc, 1027–1032, https://arc.lib.montana.edu/snow-science/objects/ISSW13_paper_P2-23.pdf (last access: 17 October 2024), 2013. a
RegObs Avalanche Observation: Avalanche Observation 290001, https://www.regobs.no/registration/290001 (last access: 17 October 2024), 2022. a, b
Schreiber, H., Randeu, W. L., Schaffhauser, H., and Rammmer, L.: Avalanche dynamics measurement by pulsed Doppler radar, Ann. Glaciol., 32, 275–280, https://doi.org/10.3189/172756401781819021, 2001. a
St. Lawrence, W. and Williams, T. R.: Seismic Signals Associated with Avalanches, J. Glaciol., 17, 521–526, https://doi.org/10.3189/S0022143000013782, 1976. a
Suriñach, E., Sabot, F., Furdada, G., and Vilaplana, J. M.: Study of seismic signals of artificially released snow avalanches for monitoring purposes, Phys. Chem. Earth B, 25, 721–727, https://doi.org/10.1016/S1464-1909(00)00092-7, 2000. a
Suriñach, E., Furdada, G., Sabot, F., Biesca, B., and Vilaplana, J. M.: On the characterization of seismic signals generated by snow avalanches for monitoring purposes, Ann. Glaciol., 32, 268–274, https://doi.org/10.3189/172756401781819634, 2001. a, b
Suriñach, E., Flores-Márquez, E. L., Roig-Lafon, P., Furdada, G., and Tapia, M.: Estimation of Avalanche Development and Frontal Velocities Based on the Spectrogram of the Seismic Signals Generated at the Vallée de la Sionne Test Site, Geosciences, 10, 113, https://doi.org/10.3390/geosciences10030113, 2020. a
Taweesintananon, K., Landrø, M., Potter, J. R., Johansen, S. E., Rørstadbotnen, R. A., Bouffaut, L., Kriesell, H. J., Brenne, J. K., Haukanes, A., Schjelderup, O., and Storvik, F.: Distributed acoustic sensing of ocean-bottom seismo-acoustics and distant storms: A case study from Svalbard, Norway, Geophysics, 88, B135–B150, https://doi.org/10.1190/geo2022-0435.1, 2023. a
Truong, K., Eidsvik, J., and Rørstadbotnen, R. A.: Edge Computing in Distributed Acoustic Sensing: An Application in Traffic Monitoring [Preprint], http://arxiv.org/pdf/2410.16278 (last access: 17 October 2024), 2024. a
Varsom Regobs: Norwegian web portal for natural hazard warnings, Norwegian Water Resources and Energy Directorate (NVE) in collaboration with the Norwegian Public Roads Administration, https://regobs.no (last access: 17 October 2024), 2024. a, b
Waagaard, O. H., Rønnekleiv, E., Haukanes, A., Stabo-Eeg, F., Thingbø, D., Forbord, S., Aasen, S. E., and Brenne, J. K.: Real-time low noise distributed acoustic sensing in 171 km low loss fiber, OSA Continuum, 4, 688–701, https://doi.org/10.1364/OSAC.408761, 2021. a, b, c, d
Walter, F., Gräff, D., Lindner, F., Paitz, P., Köpfli, M., Chmiel, M., and Fichtner, A.: Distributed acoustic sensing of microseismic sources and wave propagation in glaciated terrain, Nat. Commun., 11, 2436, https://doi.org/10.1038/s41467-020-15824-6, 2020. a
Xie, D., Wu, X., Guo, Z., Hong, H., Wang, B., and Rong, Y.: Intelligent Traffic Monitoring with Distributed Acoustic Sensing, Seismol. Res. Lett., 96, 2477–2488, https://doi.org/10.1785/0220240298, 2025. a
- Abstract
- Introduction
- Monitoring site description
- Signal classification
- Discussion and outlook
- Appendix A: Monitoring site and acquisition parameters
- Appendix B: Signal classification – truck signal
- Data availability
- Author contributions
- Competing interests
- Disclaimer
- Acknowledgements
- Financial support
- Review statement
- References