the Creative Commons Attribution 4.0 License.
the Creative Commons Attribution 4.0 License.
 | 14 Aug 2025
Modeling regional production capacity loss rates considering response bias: insights from a questionnaire survey on the Zhengzhou flood
Lijiao Yang
Yan Luo
Zilong Li
Xinyu Jiang
Flood disasters in specific regions not only cause physical damage but also disrupt the production and operations of enterprises, making economic systems more vulnerable. Assessing the production capacity loss rate (PCLR) of enterprises is crucial for quickly evaluating disaster losses. However, PCLR of enterprises is difficult to measure through physical damage. On-site investigations offer a compromise method, but inconsistencies between respondents and investigators in understanding production capacity may result in response bias. Therefore, this study employed the vulnerability curve method for categorizing damage states to divide PCLR into different damage states and constructed exceedance probability curves to mitigate response bias. Then, this study utilized distribution function fitting to calculate the expectation-of-loss rate for each damage state and finally integrated the probabilistic information with the expectation for each state to estimate PCLR. The proposed methodology is realized by the questionnaire data from the “7.20” extreme flooding event in Zhengzhou, Henan. We found that when the inundation depth is less than 80 cm, the wholesale and retail trade sector suffers the highest loss rate; however, when the inundation depth exceeds 80 cm, we should pay more attention to the manufacturing sector. Monte Carlo simulation (MCS) established the prediction intervals of PCLR, offering an alternative for PCLR. This study effectively accounts for response bias, providing input conditions for assessing ripple losses.
- Article
(5890 KB) - Full-text XML
- BibTeX
- EndNote


The impact of natural disasters has become a significant global concern. In 2023, the Emergency Event Database (EM-DAT) reported 399 natural disasters worldwide. These disasters affected 93.1 million people and resulted in approximately USD 202.7 billion of economic losses. Of these events, floods accounted for 41.10 % of the total incidents (EMDAT, 2024), significantly affecting economic growth (IPCC, 2023). Consequently, an amount of literature has emerged that employs numerous model-based and empirical methods to explore the macro- and micro-economic impacts of natural disasters (Hallegatte et al., 2013; Koks et al., 2016; Tatano and Kajitani, 2022a). At the macro-economic level, researchers commonly use several models to quantify the economic effects of natural disasters. These include input–output (I–O) models (Okuyama and Santos, 2014; Lenzen et al., 2019) and computable general equilibrium (CGE) models (Kajitani and Tatano, 2018; Gertz et al., 2019). These methods allow a comprehensive analysis of the overall impact on national and regional economies. At the micro-economic level, methods for assessing business resilience have been developed, primarily focusing on resistance and recovery (Liu et al., 2024). However, due to the different focuses of the two types of models and the difficulties in obtaining business loss data caused by confidentiality concerns, micro-level assessment methods for individual enterprises are often difficult to integrate with macro-level economic assessment methods for estimating overall regional industry losses.
Estimating regional industry losses is crucial for understanding the vulnerability of local industries and facilitating post-disaster recovery. As previously mentioned, macro-economic models such as I–O and CGE are designed to capture complex and higher-order impacts (Tatano and Kajitani, 2022b). However, these models require specific inputs to function effectively. Industry losses are commonly considered a fundamental input for macroeconomic models when modeling supply shocks. Recently, the production capacity loss rate (PCLR) has been proposed as a competing input for these models. It is based on estimated outputs derived from vulnerability curves (Kajitani and Tatano, 2014; Jiang et al., 2015). These curves can be rapidly estimated if accurate loss data are available, especially in the engineering field. However, such estimation still faces challenges due to response bias, particularly during extreme flooding events.
Response bias refers to the tendency of survey participants to provide inaccurate responses or to answer in a biased manner, resulting in skewed or misleading data (Gove and Geerken, 1977; Furnham, 1986; Michalos, 2014). This stems from multiple factors, including personal perception biases (Liu et al., 2022), memory inaccuracies (Tan et al., 2023), and emotional influences (Cai and Wei, 2020). Empirical evidence, as advocated for at the 2015 Sendai Conference, highlights the importance of collecting data directly from disaster sites (UNDRR, 2015). Borga et al. (2019) stressed that post-flood surveys should begin immediately after the event to prevent potential erasure of site evidence, which is a critical reference for government recovery efforts. According to Cabrera et al. (2024), the empirical approach is most effective for deriving realistic fragility curves as it relies on actual damage data. However, the success of these actions relies on accurate data estimations. Unlike the objectivity of physical indicators such as ground deformation (Choi et al., 2004), relative displacement between the crown of arch and the inverted arch (Andreotti and Lai, 2019), volumetric water content (Vergeynst et al., 2015), and accident events (Yang et al., 2020), estimating PCLR relies on the subjective judgment of enterprise managers, resulting in significant uncertainty. Moreover, PCLR data collected are often discrete rather than continuous, making them unsuitable for simple regression analysis (Zentner et al., 2017). This simplification may lead to overestimation or underestimation of actual loss, which can amplify or attenuate perceived risk. This highlights an urgent need for more reliable methods and data in PCLR estimation, including categorizing damage states, which is essential for understanding loss characteristics across different damage states.
Categorizing damage states based on loss rate data is a desirable approach in the existing literature on earthquakes and engineering (Baker, 2015; Nguyen et al., 2024). Prasad and Banerjee (2013) classified bridge damage into four states and established probability curves for bridge failure at specific seismic intensities using these classifications. Andreotti and Lai (2019) pointed out that the loss mechanisms vary for different damage states, and the damage index of tunnel structures after an earthquake shows high variability except in the no-damage state. The economic impact of floods is more complex, and it is worth noting that there are significant differences in loss mechanisms across different damage states. Therefore, classifying damage states is essential for better understanding loss characteristics in different situations.
Motivated by the gaps mentioned above, we propose a response-bias-tolerant framework that accounts for response bias to estimate PCLR. Framework refers to a methodological approach designed to mitigate uncertainties arising from subjective judgments in data collection, particularly when enterprise managers provide potentially biased estimates of PCLR during post-disaster surveys. First, we conduct a questionnaire survey and classify damage states. Then, we use the exceedance probability curve model to develop corresponding curves. This approach helps us to handle data affected by response bias and to determine the likelihood of different damage states at different inundation depths. Second, we fit PCLR to a probability distribution within each damage state, from which we derive the expectation-of-loss rate for further analysis. Finally, we integrate the expectation-of-loss rate with the associated probabilities for each damage state. This integration allows a more adaptable assessment of the mean PCLR for businesses after a disaster. Furthermore, based on Yang et al. (2016), we extend our analysis of PCLR by employing Monte Carlo simulation (MCS) to generate prediction intervals and by analyzing the rate of change in PCLR.
The remainder of this study is organized as follows. Section 2 illustrates the overall framework for estimating the mean PCLR. Section 3 presents a case study of the 2021 Zhengzhou flood. Section 4 offers the results and a discussion on the implementation and improvement of the proposed method, along with policy recommendations. Finally, the conclusions are summarized in Sect. 5.
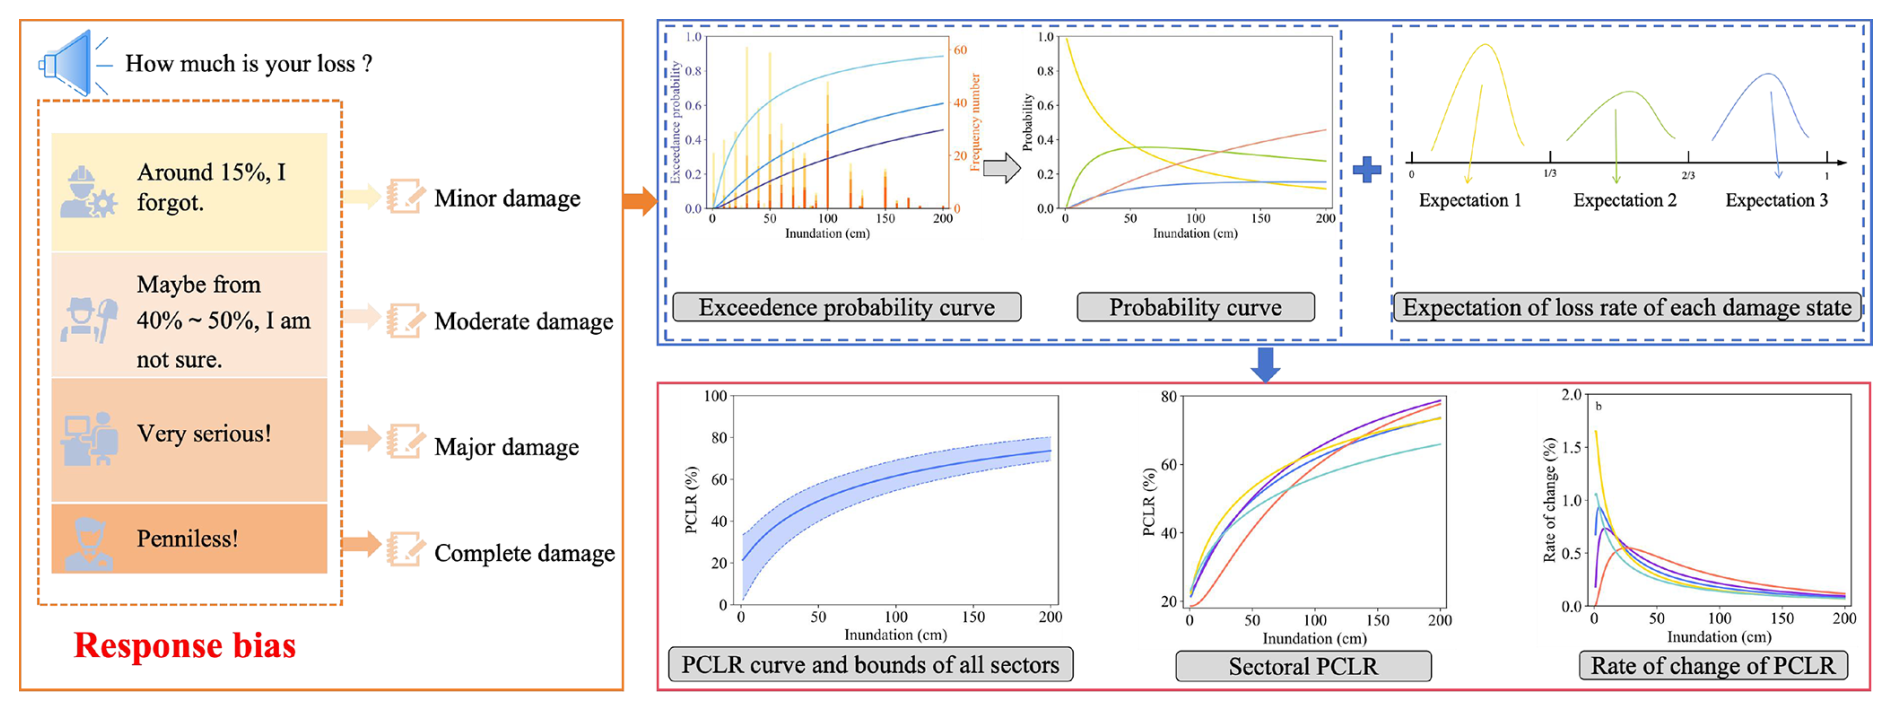
A methodological framework was proposed to estimate PCLR. Firstly, we categorize damage states based on the raw data, and then we construct exceedance probability curves. These curves form the foundation for further probability curve extrapolation. Secondly, distribution functions are introduced to fit PCLR for different damage states, facilitating the calculation of the expectation-of-loss rate for each damage state. Finally, PCLR is estimated by integrating probability with the expectation-of-loss rate for each damage state. These methodological steps provide insights that can be used when prioritizing sectors based on their risk, as shown in the framework presented in Fig. 1.
2.1 Exceedance probability curve model
The exceedance probability curve model is widely applied in civil and structural engineering for assessing structural reliability and seismic response (Burton et al., 2016; Hariri-Ardebili and Saouma, 2016). It simulates random processes to generate probability curves that gauge the likelihood of extreme structural reactions for risk assessment (Shinozuka et al., 2000; Torbol and Shinozuka, 2012). This method, traditionally used in engineering, has recently been applied to the study of functional damage, like reductions in production capacity (Nakano et al., 2013).
In this study, we assume that the probability of exceeding a damage state is a function of inundation depth h represented as a two-parameter lognormal distribution function, given in Eq. (1):
represents the probability of exceeding a certain damage state; Φ(⋅) is the cumulative distribution function (CDF) of the standard normal distribution; and μω and σ are the mean and standard deviation of the lognormal distribution, corresponding to “exceeding minor damage”, “exceeding moderate damage”, and “exceeding major damage”, differentiated by ω.
Utilizing three damage curves, we can determine four distinct damage states dj, namely minor damage (d0), moderate damage (d1), major damage (d2), and complete damage (d3). Pj(h) denotes the probability of being in damage state dj when the inundation depth is h. Subsequently, the probabilities for these four damage states, conditional upon the inundation depth h, are expressed in Eq. (2):
The parameters (μω,σ) are estimated by maximizing a likelihood function, expressed in Eq. (3):
where δij = 1 if damage states dj occur for the enterprise i subject to h = hi; otherwise δij = 0. The estimation of parameters μω and σ using the maximum likelihood method can be achieved by solving the following equation:
Furthermore, to evaluate the assumption that the inundation depth can serve as a variable of the decline in production capacity immediately following a catastrophe, the likelihood ratio test is utilized to check the alternative hypothesis. The null hypothesis is that the probabilities of occurrence of damage states occur equally in this case study.
2.2 Distribution function fitting for PCLR of each damage state
In this study, we employ distribution function fitting to model PCLR of different damage states, aiming to estimate the expectation-of-loss rate. This method involves selecting a probability distribution function that best describes the observed data (Heo et al., 2022). Common distributions include Weibull, lognormal, gamma, and logistic (Lima et al., 2021; Zhang et al., 2021). To evaluate how well the model fits the data, we use goodness-of-fit tests such as the Akaike information criterion (AIC) and Bayesian information criterion (BIC). The distribution that fits the data best will be selected for further analysis and predictions.
The Weibull distribution with shape parameter k>0 and scale parameter λ > 0 has density given by
for x > 0, and the expectation-of-loss rate is
where the gamma function is with z>0.
The lognormal distribution has density given by
where μ and σ are the mean and standard deviation of the logarithm. The expectation-of-loss rate is
The gamma distribution with shape parameter α and scale parameter β has density given by
The expectation-of-loss rate is
The logistic distribution with location parameter ν and scale parameter τ has density given by
The expectation-of-loss rate is
2.3 Sector-specific estimation of PCLR
After estimating probability and the expectation-of-loss rate for each damage state, we can estimate the mean PCLR for each sector. The estimation of the enterprise's mean PCLR can be expressed as
where Lr(h) represents the mean PCLR estimates of the enterprise. mj is chosen as the expectation of the optimal distribution of loss rate for damage state dj (one of Ewb, Eln, Egm, or Els); Pj(h) is the probability for each damage state.
2.4 Prediction intervals of PCLR using MCS
Monte Carlo simulation (MCS) can be used to address problems involving uncertainties. It has been widely applied across many fields (Christensen et al., 2024; Asche et al., 2021). By creating multiple simulated scenarios, it approximates the distribution of a specific outcome (Sun et al., 2022). The model produces iterative estimates that form a dataset of possible outcomes. When these outcomes are aggregated, they define the true outcome's range with a given probability. In this study, we employ MCS to generate prediction intervals of PCLR across different sectors. Specifically, we draw random numbers from the best-fit distribution selected in Sect. 2.2. For minor damage, random numbers are drawn from the range ; for moderate damage, they are drawn from ; and for major damage, they are drawn from . Then, these random numbers, combined with the probabilities of the damage states occurring, generate several datasets. This process is repeated 1000 times, stabilizing prediction intervals that define the upper and lower bounds of PCLR. These intervals quantify the uncertainty in the outcome in PCLR estimation and support the flexible allocation of government post-disaster recovery funds.
3.1 Overview of the “7.20” Zhengzhou flooding event
The city of Zhengzhou, located in central China (Fig. 2), is the provincial capital of Henan Province and a major hub for commerce and industry. The city hosts numerous local businesses that significantly contribute to its economic development. By the end of 2023, Zhengzhou had a permanent urban population of approximately 13 million and a substantial gross domestic product. In July 2021, Henan was struck by heavy rainfall that drew the attention of many scholars (Dong et al., 2022; Peng and Zhang, 2022). Zhengzhou's losses were CNY 40.9 billion, accounting for 34.1 % of the total loss for the province. This catastrophic flooding caused widespread disruptions including production stoppages, supply chain breakdowns, infrastructure damage, and financial losses for local enterprises, severely affecting their operations.
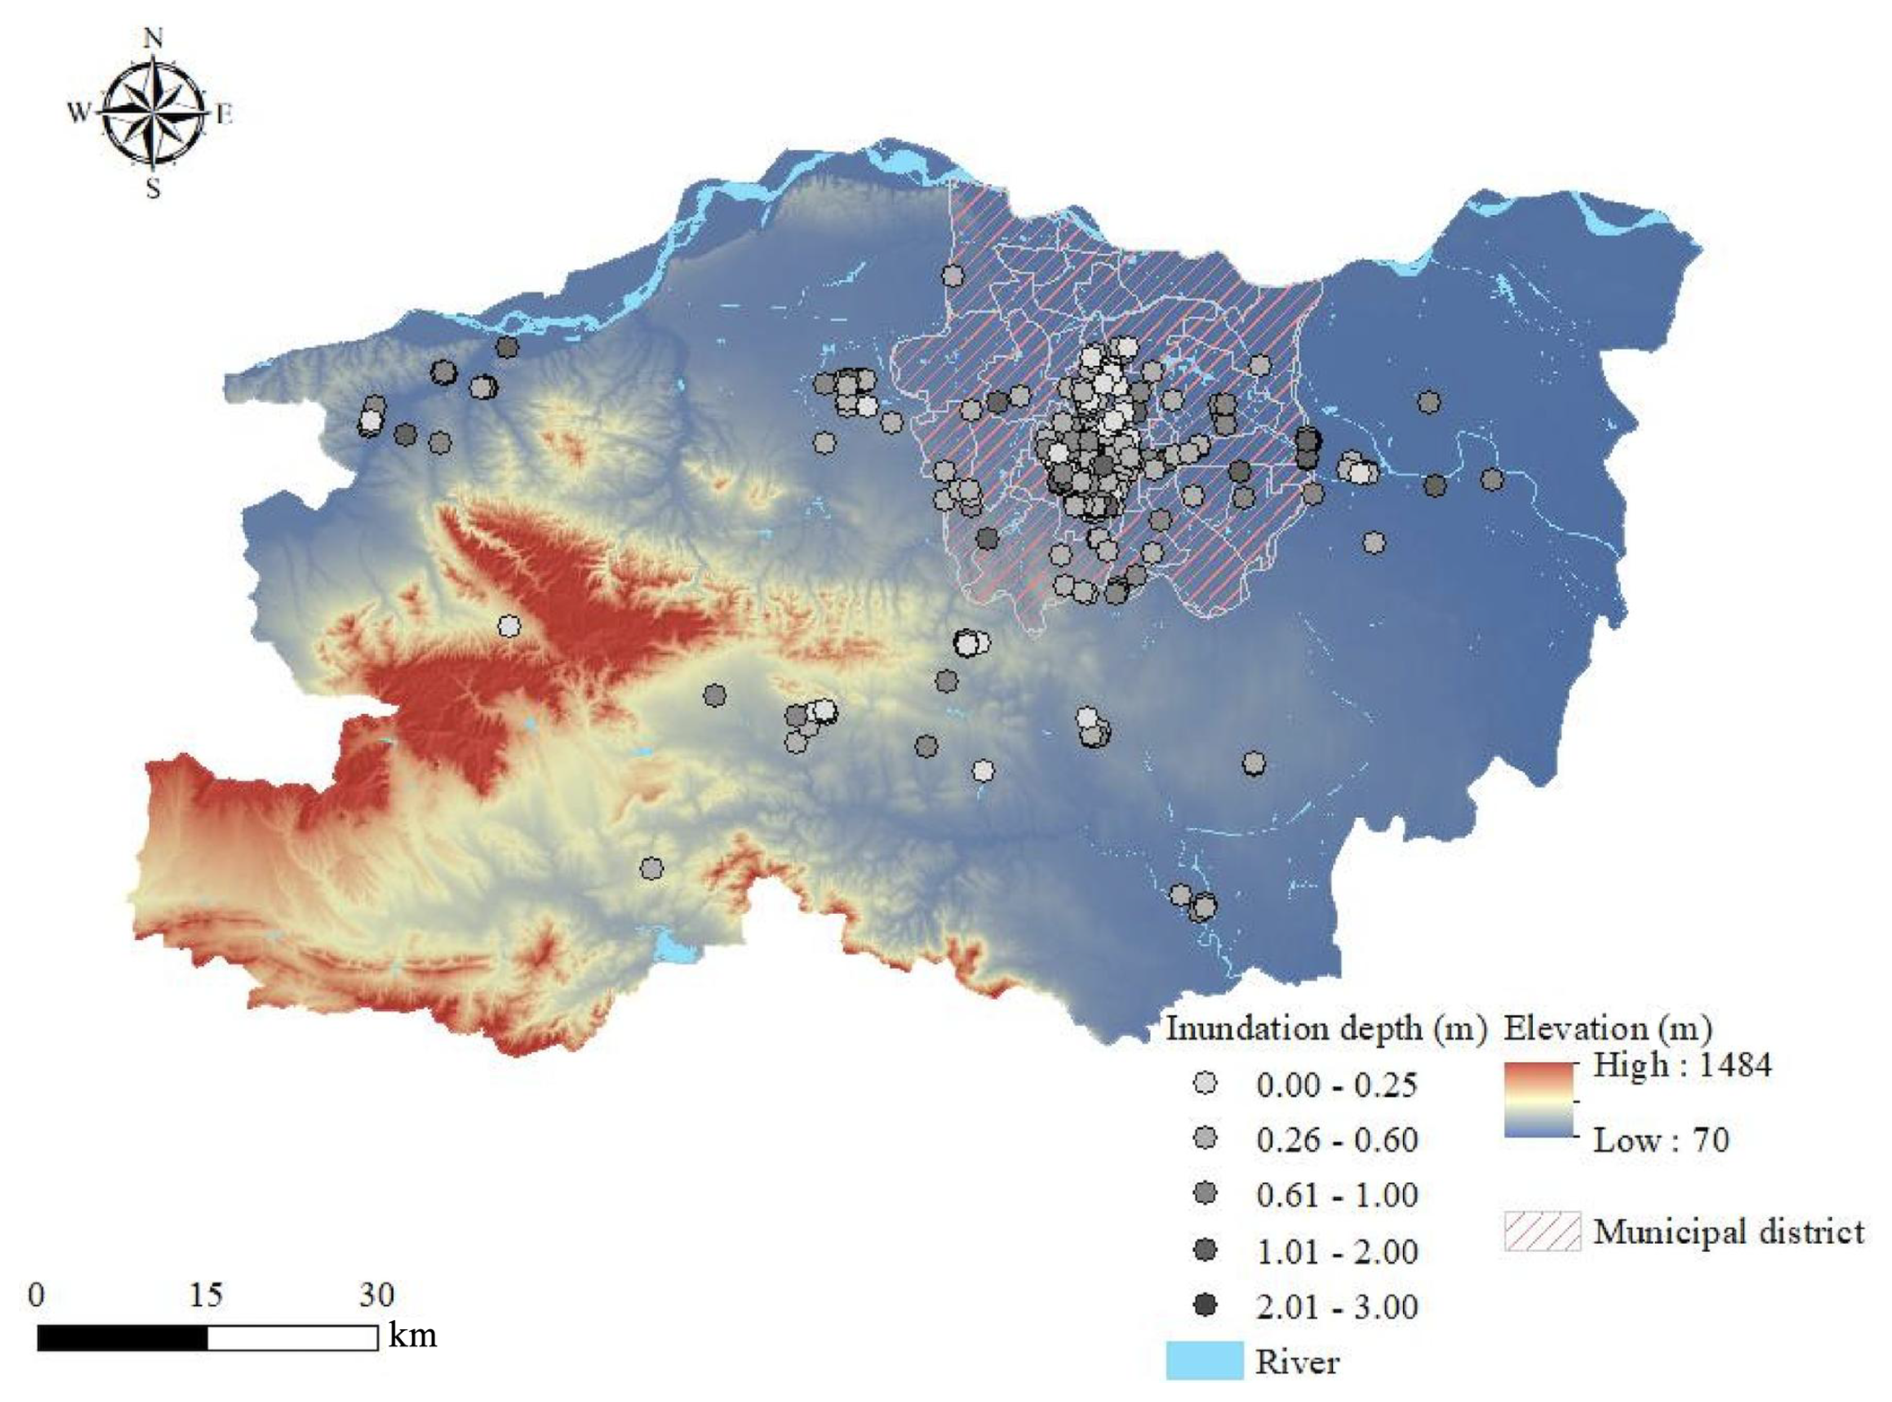
Figure 2Study area and spatial distribution of enterprise samples.
3.2 Data collection
To estimate PCLR of enterprises affected by the flood, we conducted questionnaire surveys and in-depth interviews from 19 April to 4 May 2023. We focused on disaster-stricken enterprises in Zhengzhou and collected data on PCLR, local inundation depths, the duration of flood impacts, and so on. A total of 424 valid samples were gathered. These samples were primarily distributed within the administrative districts of the city of Zhengzhou. Based on these data, this study categorized and summarized the samples, of which 148 belonged to the manufacturing sector, 68 to the accommodation and catering sector, 137 to the wholesale and retail trade sector, and 71 to other sectors.
3.3 Measurement of loss: PCLR of different sectors
PCLR refers to the direct impact on enterprises following a flood due to multiple factors, resulting in a rapid decrease in or loss of their original production capacity (Kajitani and Tatano, 2014). On one hand, there are direct losses caused by the destruction of tangible assets such as factory equipment, warehouses, and inventories of raw materials; on the other hand, there are indirect losses resulting from damage to essential infrastructure like power supply, water supply, and transportation networks; injuries to employees who are unable to work or are evacuated; and significant market demand shifts.
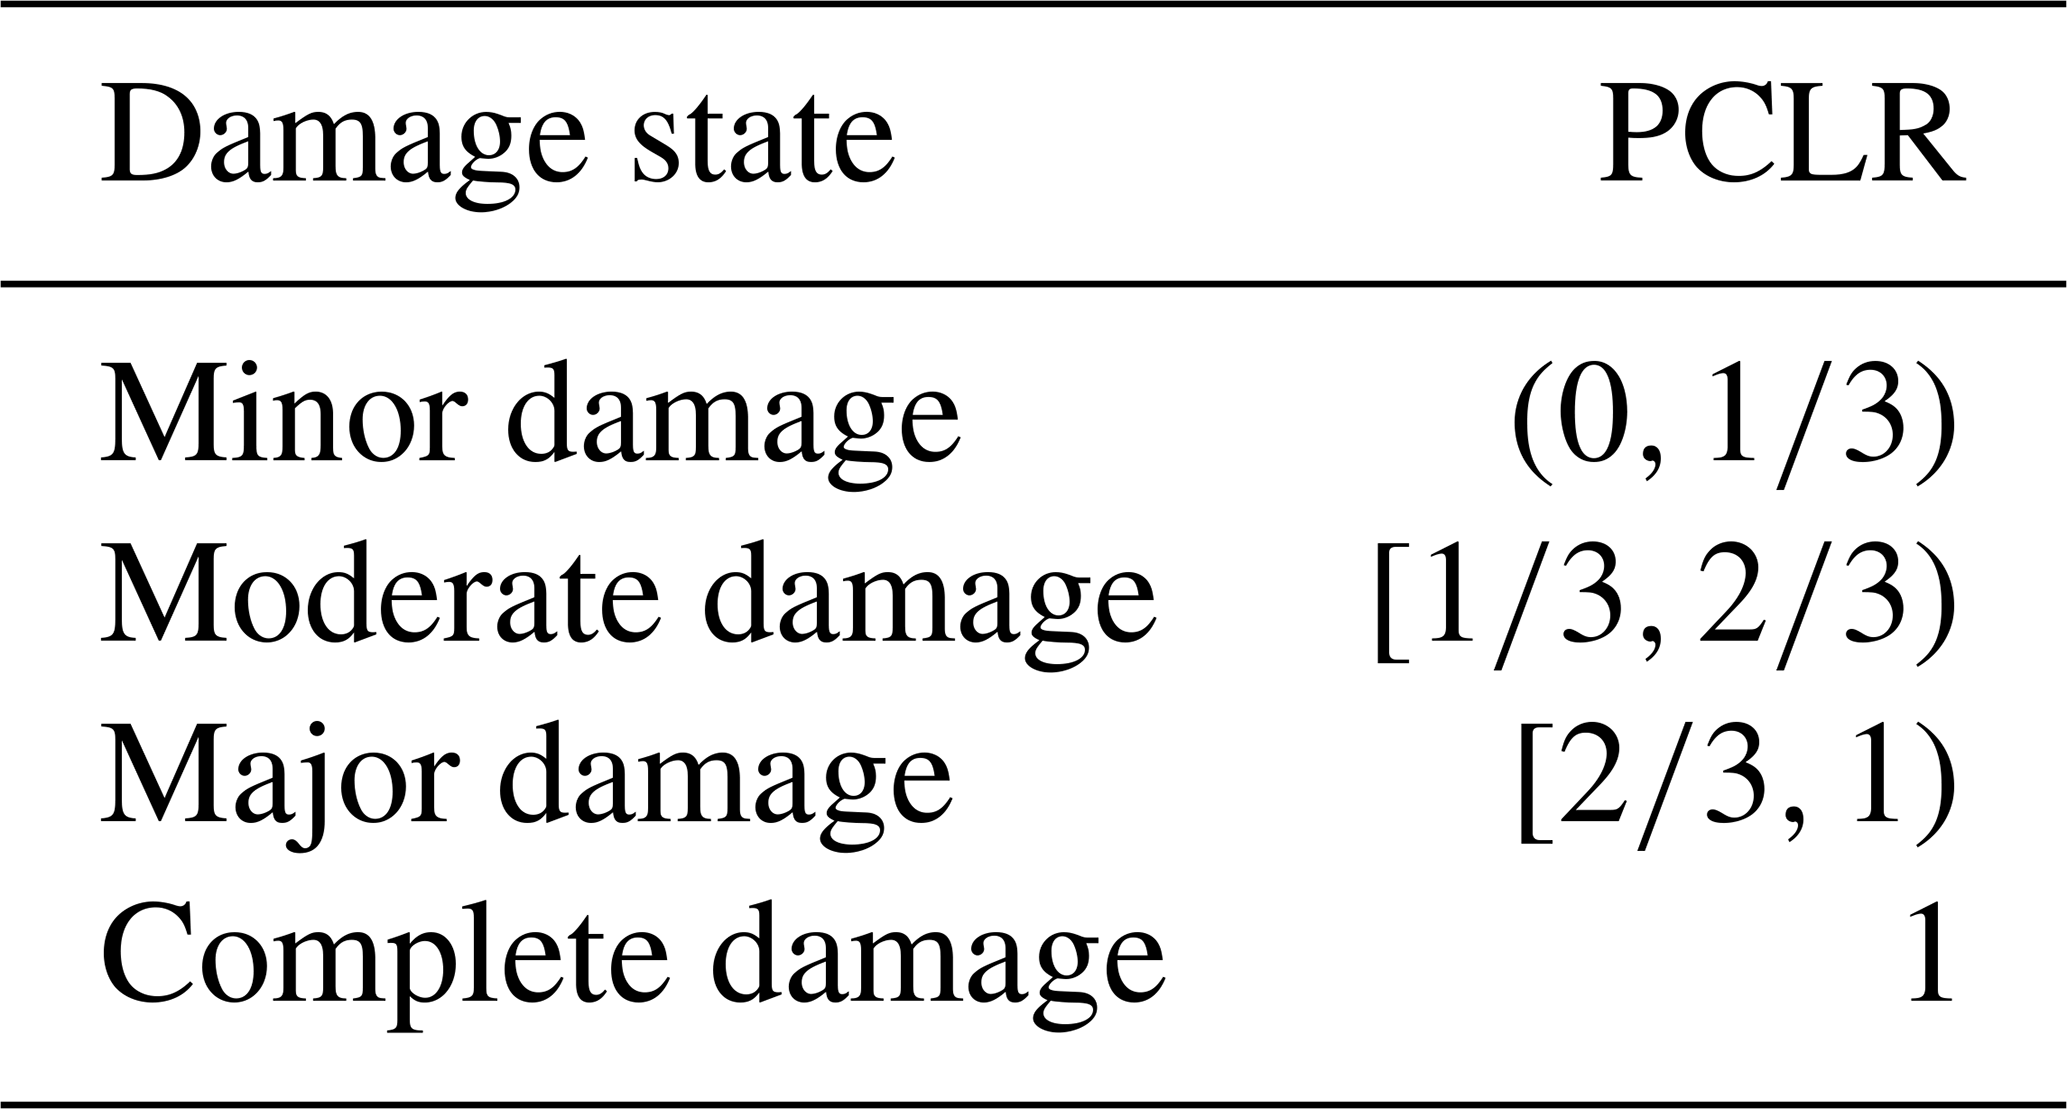
As demonstrated by the framework for estimating PCLR in Sect. 2, the collected PCLR is often inaccurate due to response bias. For instance, victims may provide only a range for PCLR or a brief description of the damage. Therefore, further data processing is required. In this paper, PCLR is categorized by different damage states. These states are minor, moderate, major, and complete damage, as illustrated in Table 1. Our classification of damage states aligns with the standardized classification system used in the engineering field to ensure interdisciplinary compatibility. Additionally, we have tested different classification thresholds and found that our approach is relatively robust. However, different classification methods are not the focus of this study, and we will not discuss them here.
The exceedance probability curve model is utilized to estimate exceedance probability of each damage state at a given inundation depth h. These estimates are first visualized as exceedance probability curves, which are then transformed into probability curves. This section presents the estimated probability conditional on the different PCLRs across sectors following the “7.20” Zhengzhou flooding event. Next, by selecting appropriate distribution functions, the expectation-of-loss rate for each damage state is calculated. Subsequently, PCLR is estimated by integrating probability with the expectation-of-loss rate. Finally, the prediction intervals of PCLR and the rate of change for PCLR are estimated.
4.1 Estimated probability across sectors
4.1.1 Estimated exceedance probability across sectors
By employing the exceedance probability curve model, we constructed exceedance probability curves for four distinct sectors. This study presents the fitting parameters for the model, as shown in Table 2. Additionally, the table presents values (χ2) of likelihood ratio tests. The critical value at a significance level of p = 0.005 with 4 degrees of freedom is 14.860. The smallest estimated value among the four sectors is 15.393. Thus, it can be inferred that the alternative hypothesis (that inundation depth can be used to estimate the decline in production capacity) is supported for all sectors at a significance level of 0.5 %. Figure 3 illustrates the exceedance probability for each sector. Varying shades of blue depict the exceedance probability for different damage states. The darkest shade represents the probability of exceeding major damage, the lightest shade represents the probability of exceeding minor damage, and the medium shade represents the probability of exceeding moderate damage. The bar charts show the sample distribution in each damage state under different inundation depth conditions.
Table 2Fitting parameters of exceedance probability curves.
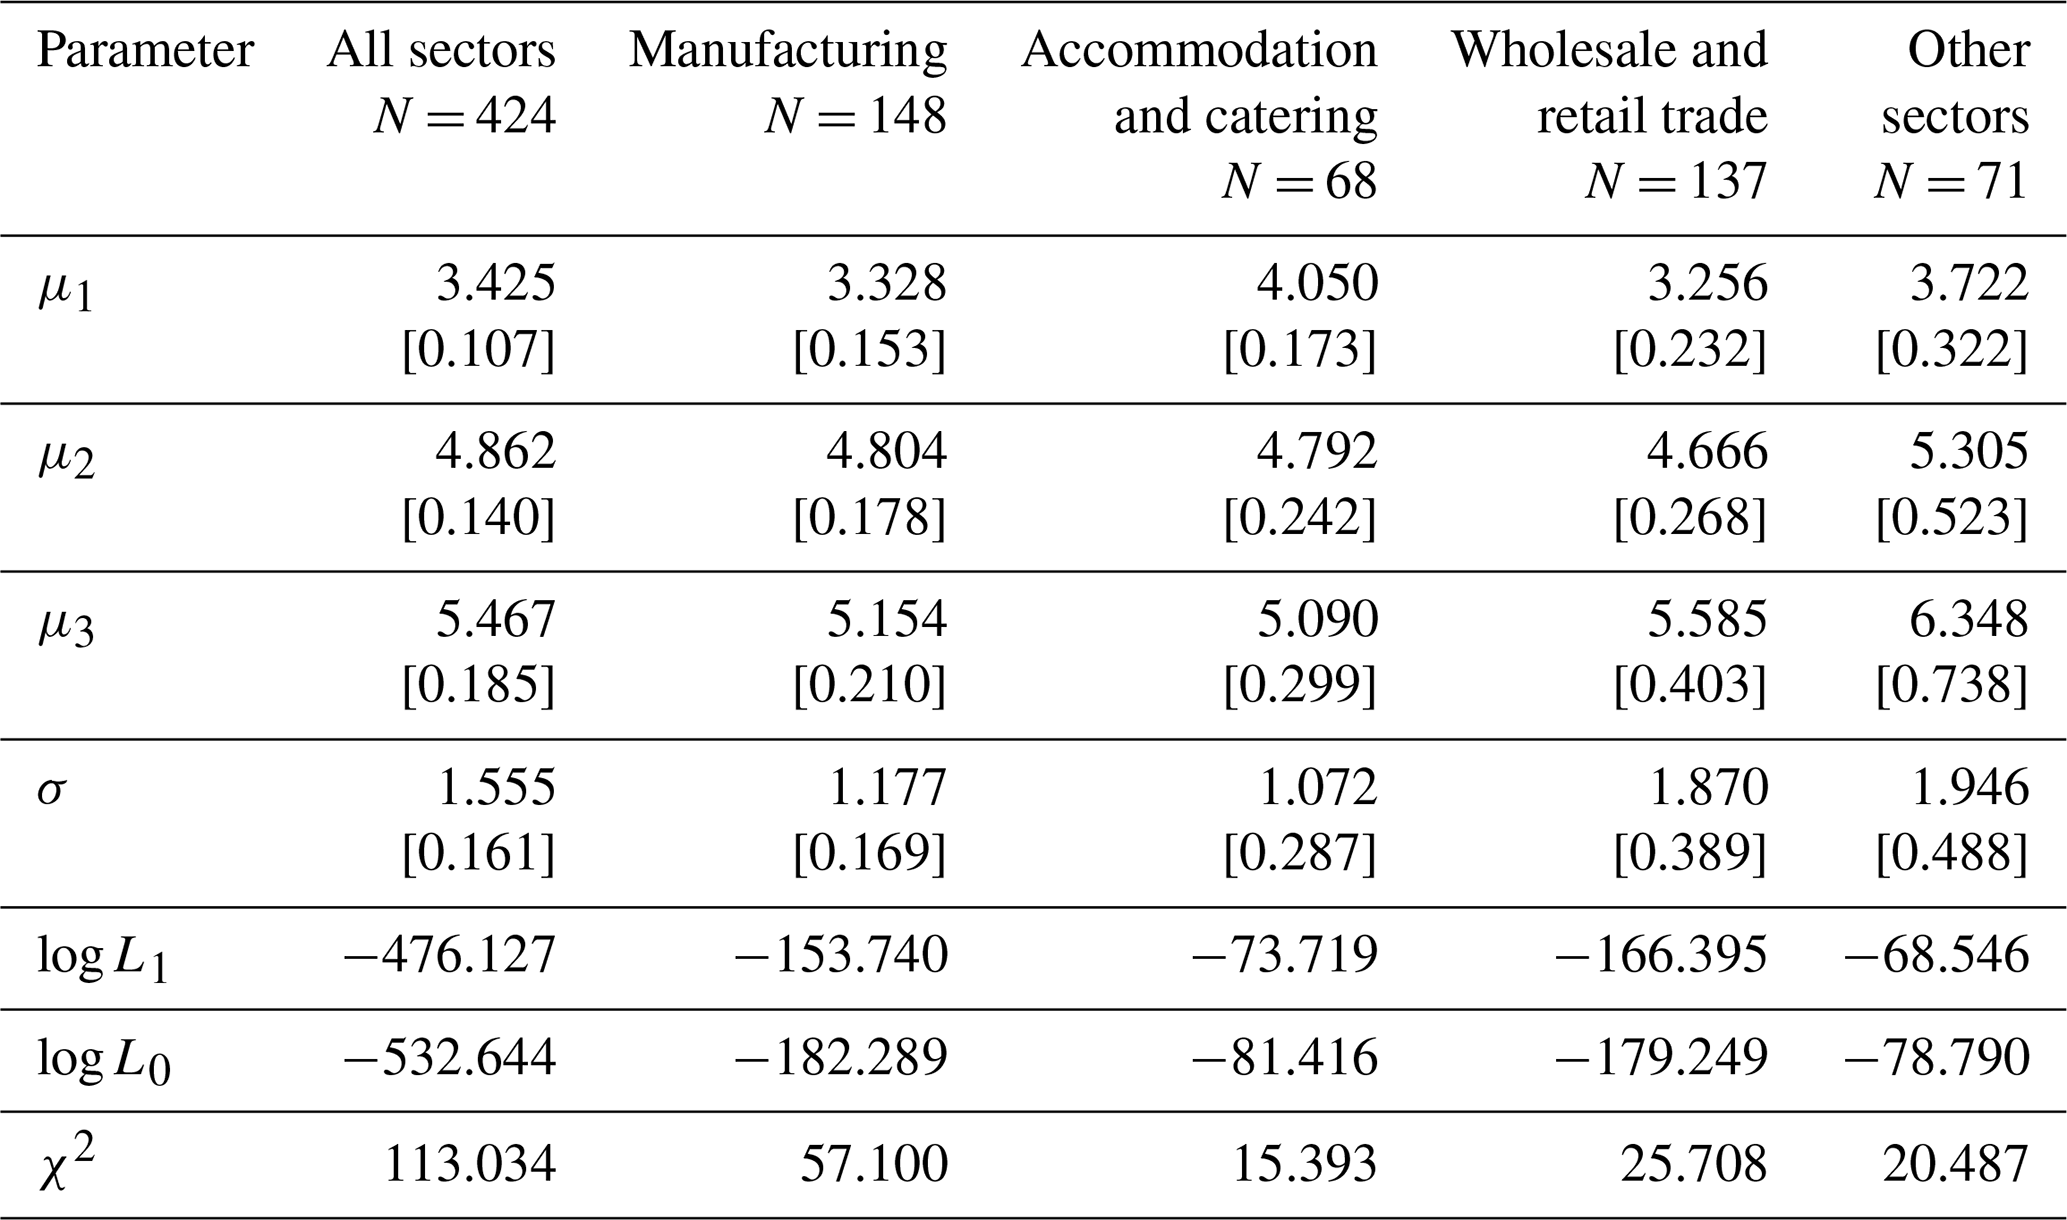
Note that numbers in square brackets are standard deviations of the estimated parameter values.
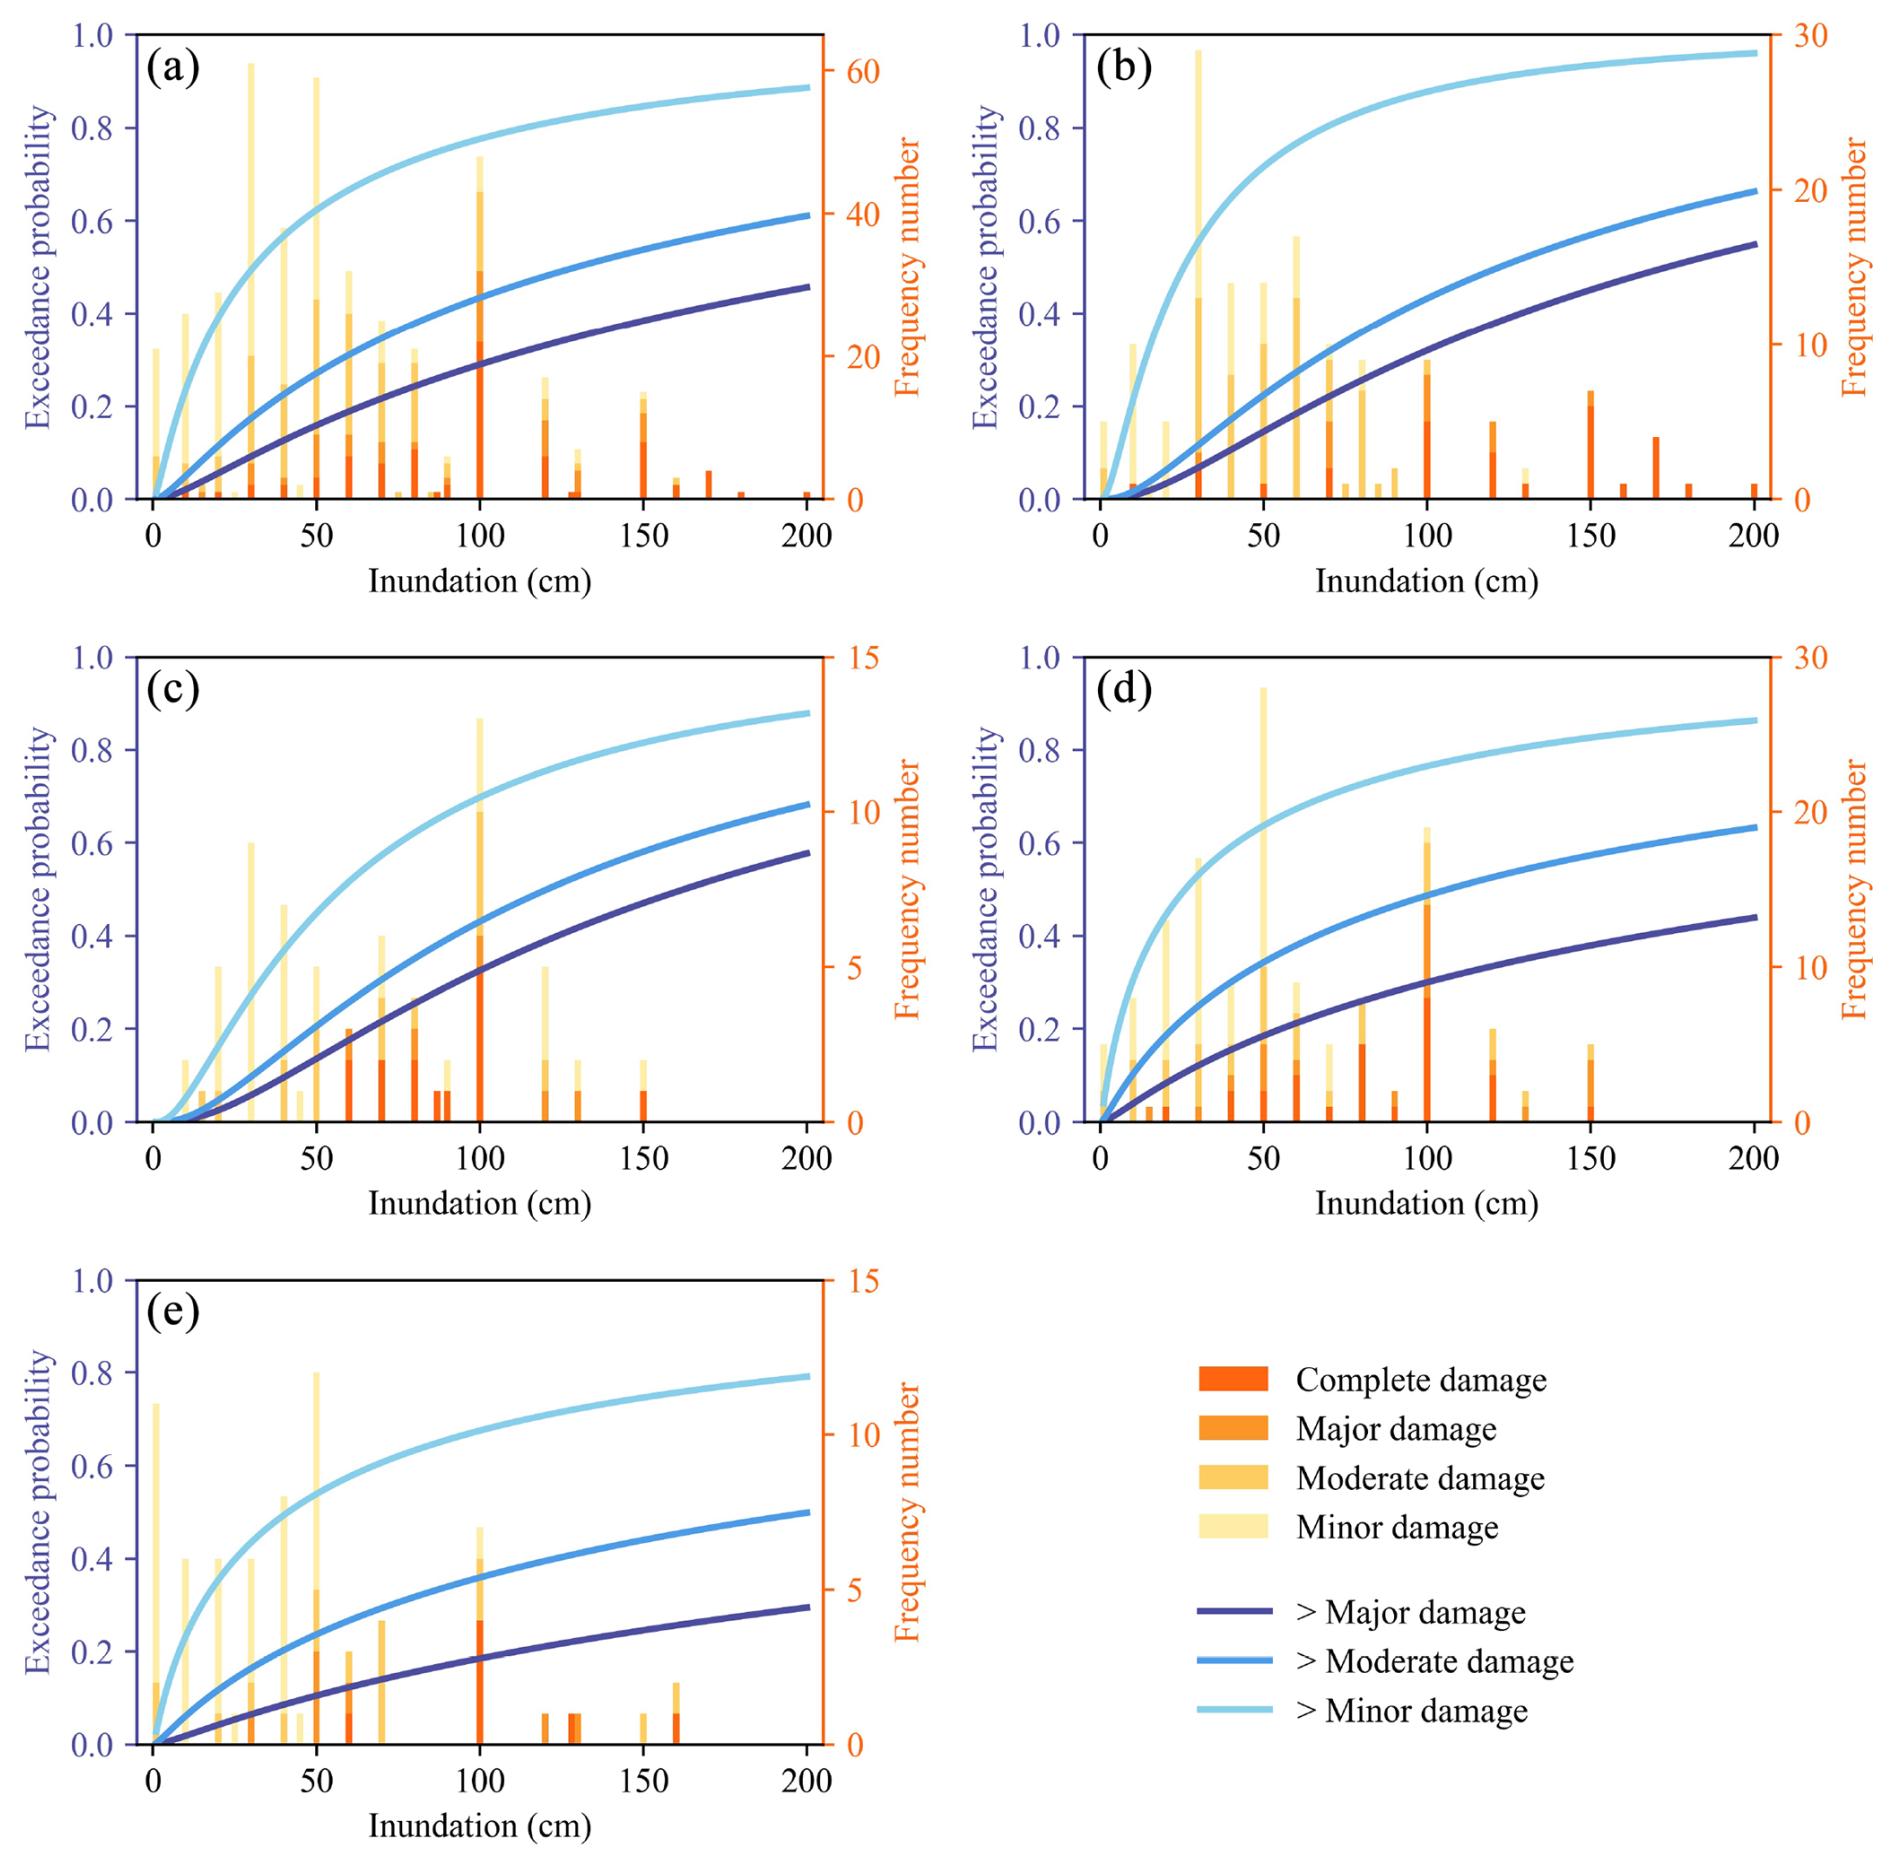
Figure 3Exceedance probability curves of different sectors for (a) all sectors, (b) manufacturing, (c) accommodation and catering, (d) wholesale and retail trade, and (e) other sectors.
Analysis of Table 2 and Fig. 3 reveals differences in the exceedance probabilities of damage states across sectors. Specifically, the exceedance probabilities of major damage (complete damage) are significantly higher in the deep water for the manufacturing and the accommodation and catering sectors, as shown in Fig. 3. In addition, the probabilities of exceeding minor damage are higher in the shallow water for the manufacturing sector. From the perspective of individual industries, the wholesale and retail sector as well as other sectors exhibits a relatively even distribution of the four damage states across most inundation depth ranges, as shown in Fig. 3d and e. This suggests that the loss patterns in these sectors are fairly dispersed and do not show significant concentration under varying flood depths. Such a distribution may reflect the diversity in their business nature and asset structure. As a result, these sectors may possess a certain level of resilience and risk-bearing capacity in relation to flood hazards.
4.1.2 Estimated probability across different sectors
For further analysis, the exceedance probabilities were transformed into probabilities for different damage states, corresponding to the areas enclosed by the various exceedance probability curves depicted in Fig. 4. The yellow, green, blue, and red lines represent the probabilities of minor, moderate, major, and complete damage, respectively. Within the inundation depth range of 1 to 200 cm, the probability of the manufacturing sector experiencing a moderate damage state is roughly equivalent to that of it experiencing a complete damage state. In other sectors, the likelihood of experiencing a minor damage state is generally comparable to that of experiencing a moderate damage state, while the accommodation and catering sector, as well as wholesale and retail trade sector, is more prone to both minor and complete damage. Due to the limited samples of major damage, the probability of a major damage state occurring under any inundation depth remains relatively low, never dominating the spectrum of damage states.
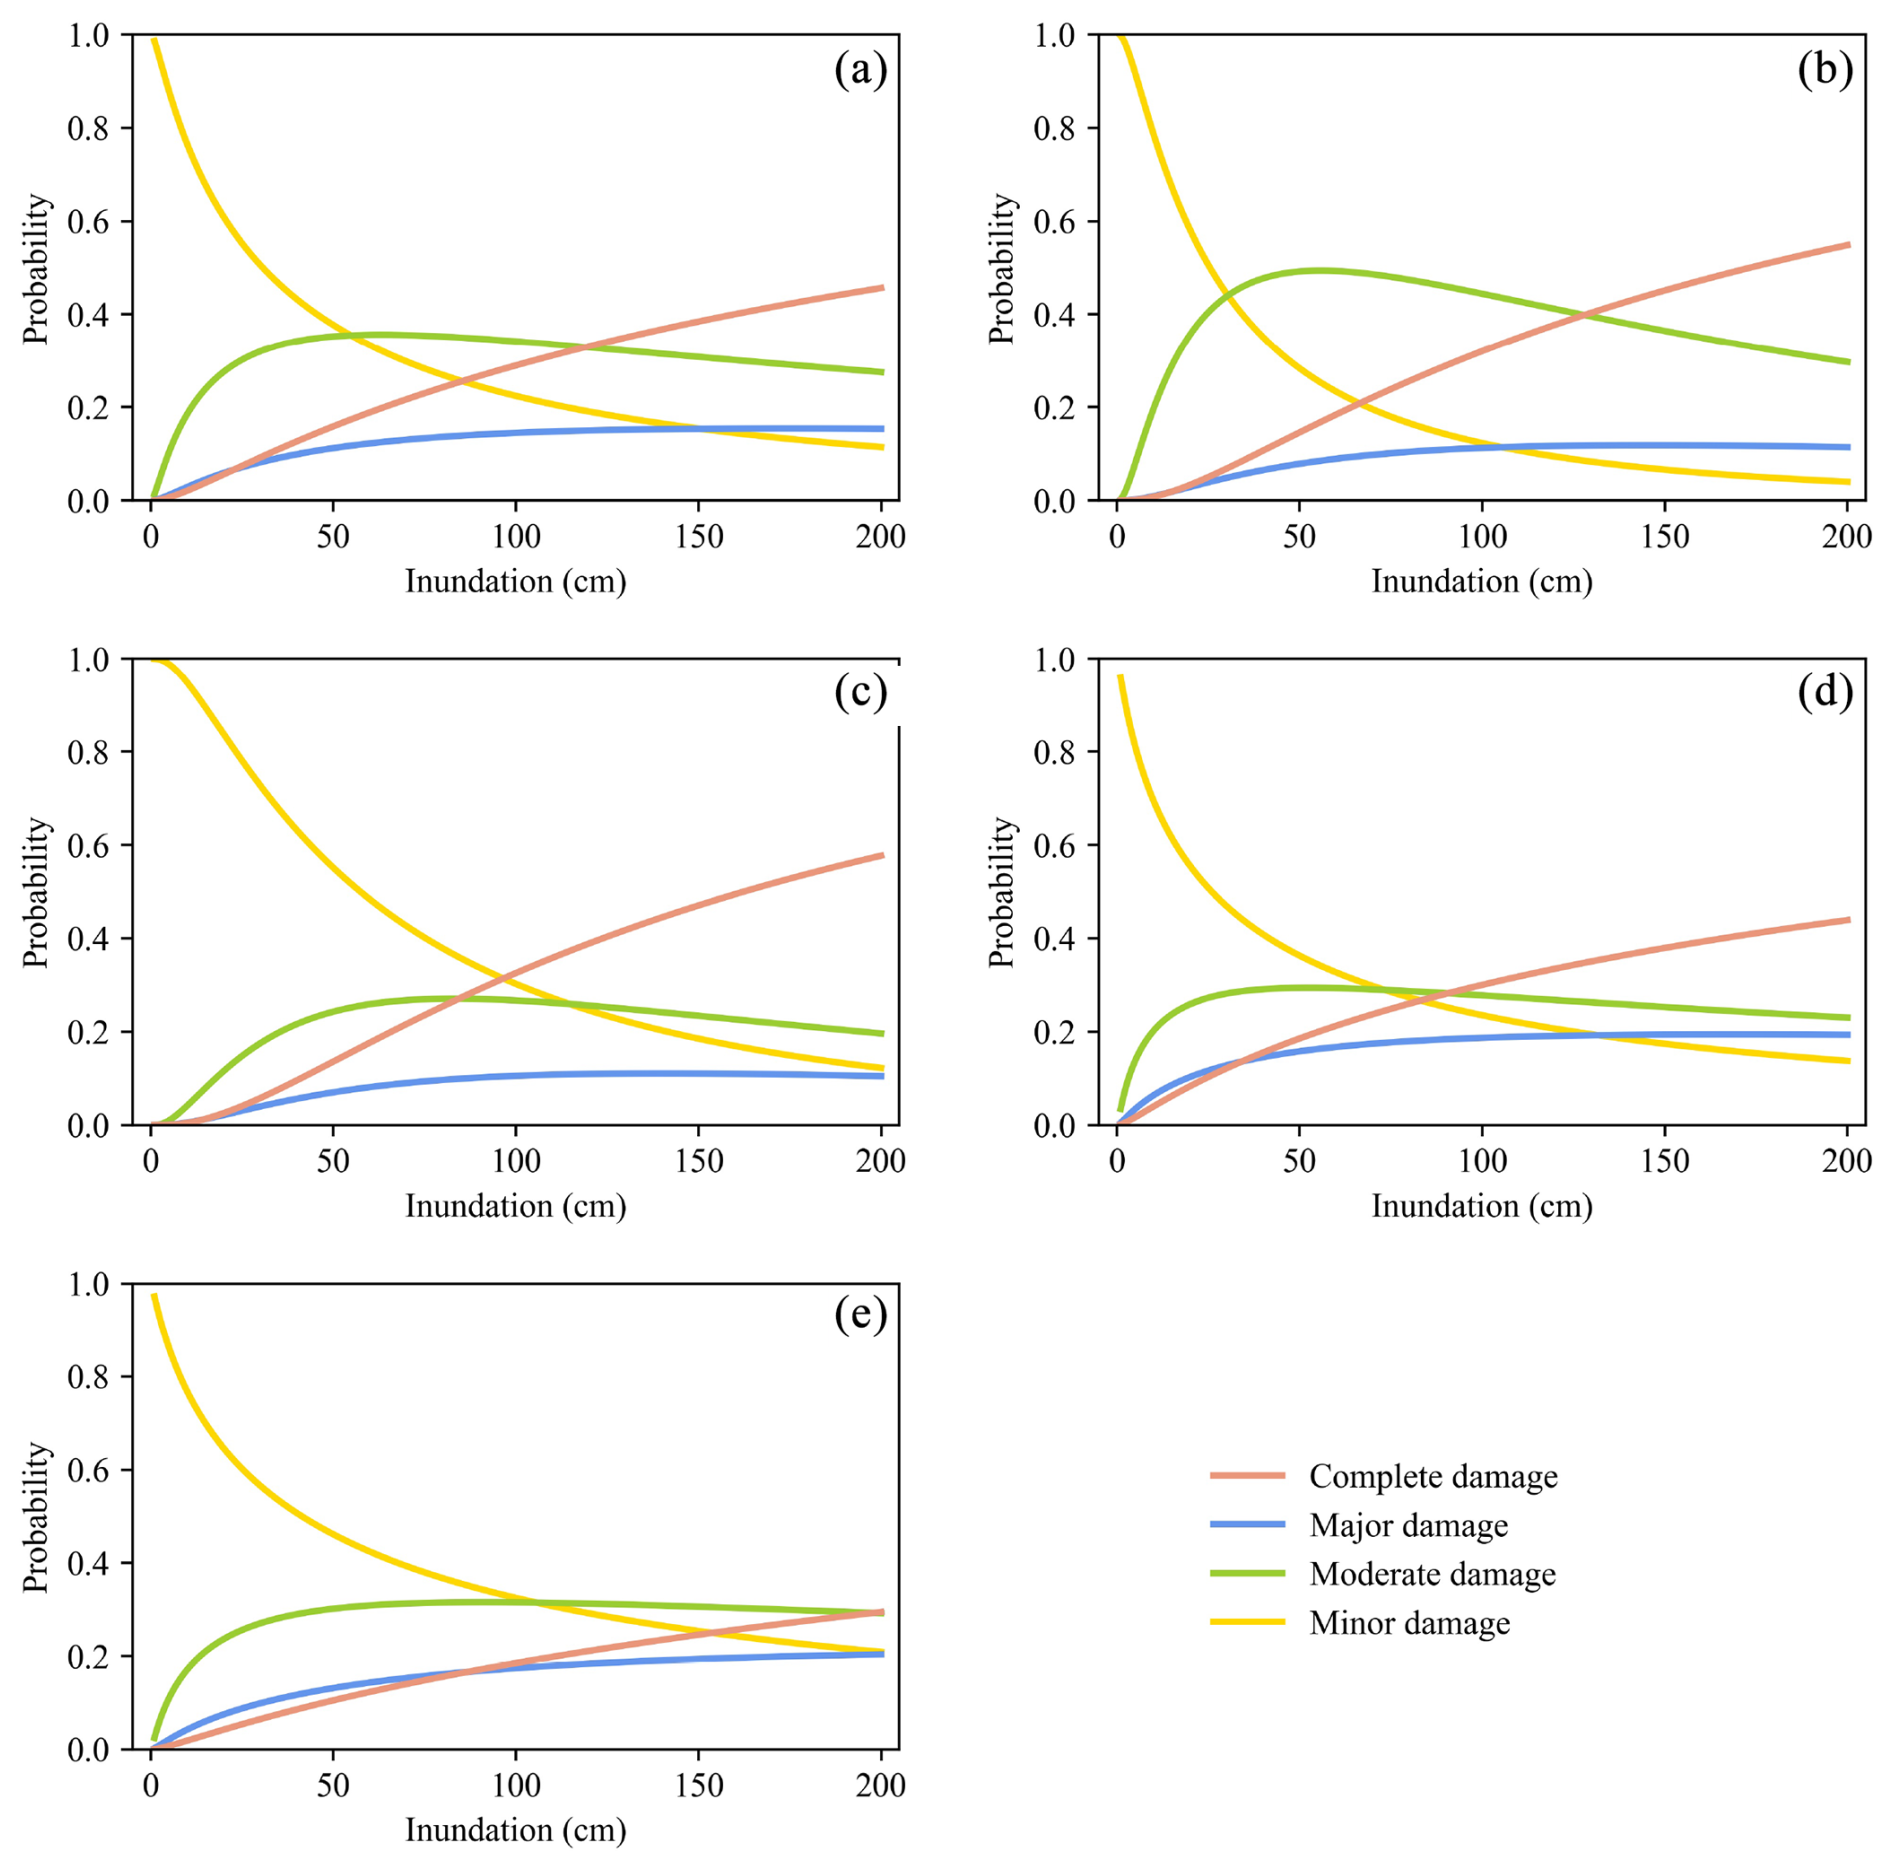
Figure 4Probability curves of different sectors for (a) all sectors, (b) manufacturing, (c) accommodation and catering, (d) wholesale and retail trade, and (e) other sectors.
4.2 Expectation-of-loss rate for each damage state
4.2.1 Distribution function fitting of PCLR
According to AIC and BIC, different functions – Weibull, lognormal, gamma, and logistic – are selected as the best fit for different damage states across sectors. These statistical criteria are utilized to evaluate the suitability and performance of each distribution function in representing the observed data. By analyzing AIC and BIC, we can identify which distribution function minimized information loss while balancing model complexity and fit. The goodness-of-fit values can be found in Table 3.
Table 3Goodness-of-fit values for various distribution functions.
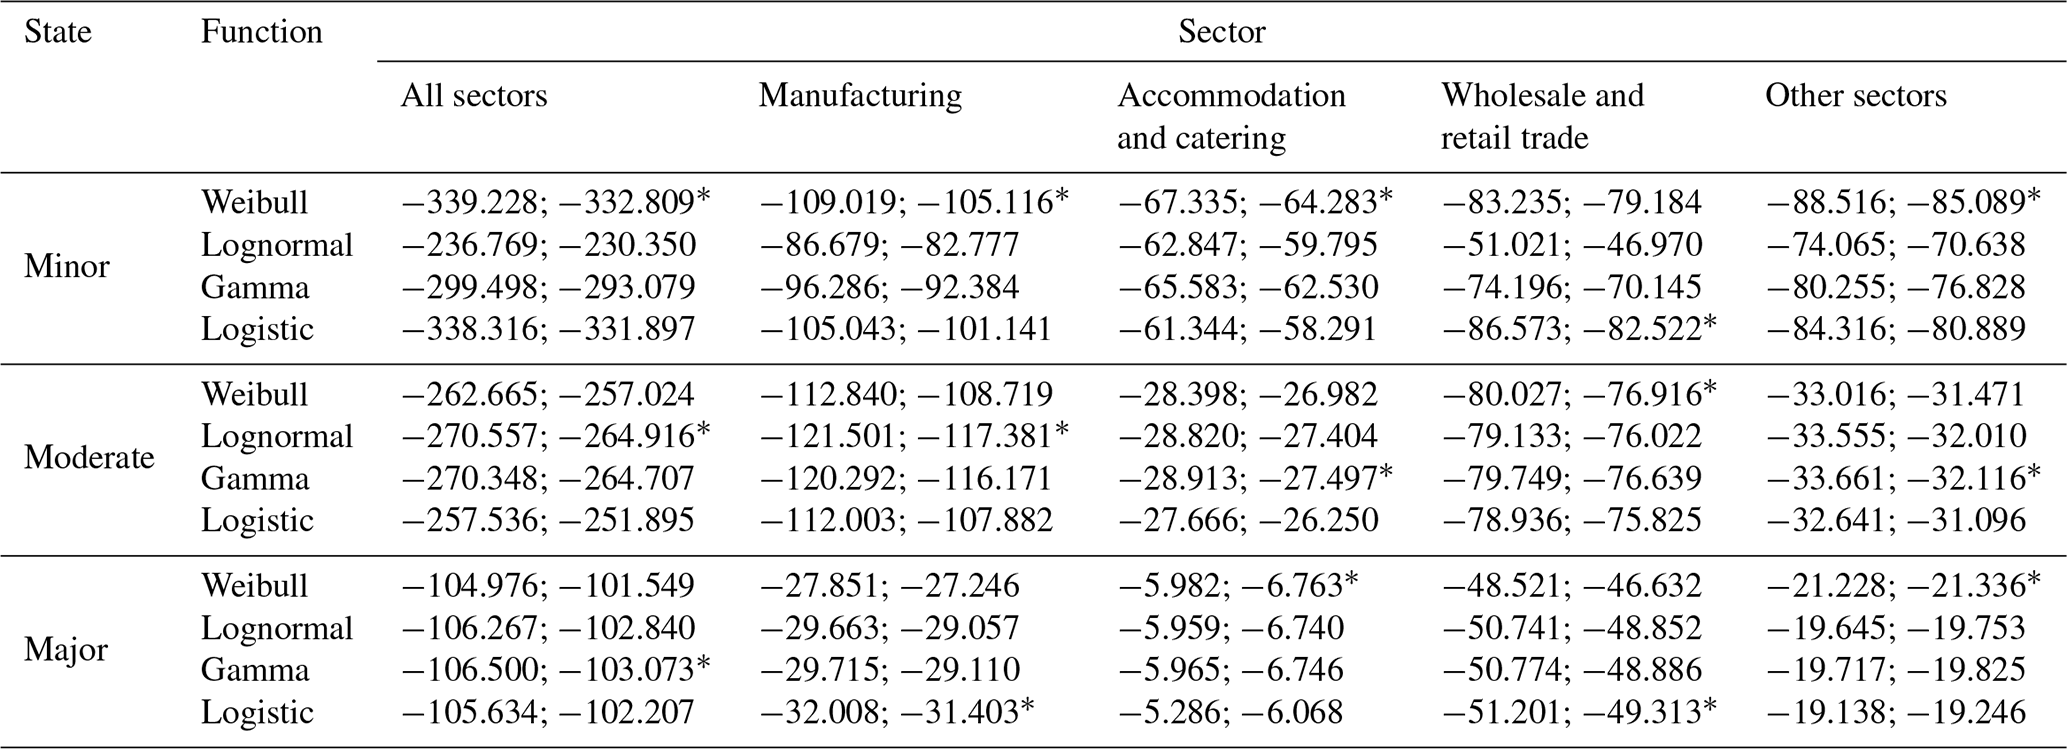
Note that the values separated by semicolons are the AIC and BIC values, respectively; the asterisk indicates the best fit.
4.2.2 Estimation of the expectation-of-loss rate for different damage states
In Sect. 4.2.1, we describe how the optimal distribution functions for PCLR for various damage states are selected. Subsequently, the expectation-of-loss rate for each damage state can be obtained. It is calculated using Eqs. (6), (8), (10), or (12) and is presented in Table 4.
Table 4Expectation-of-loss rate for various damage states.
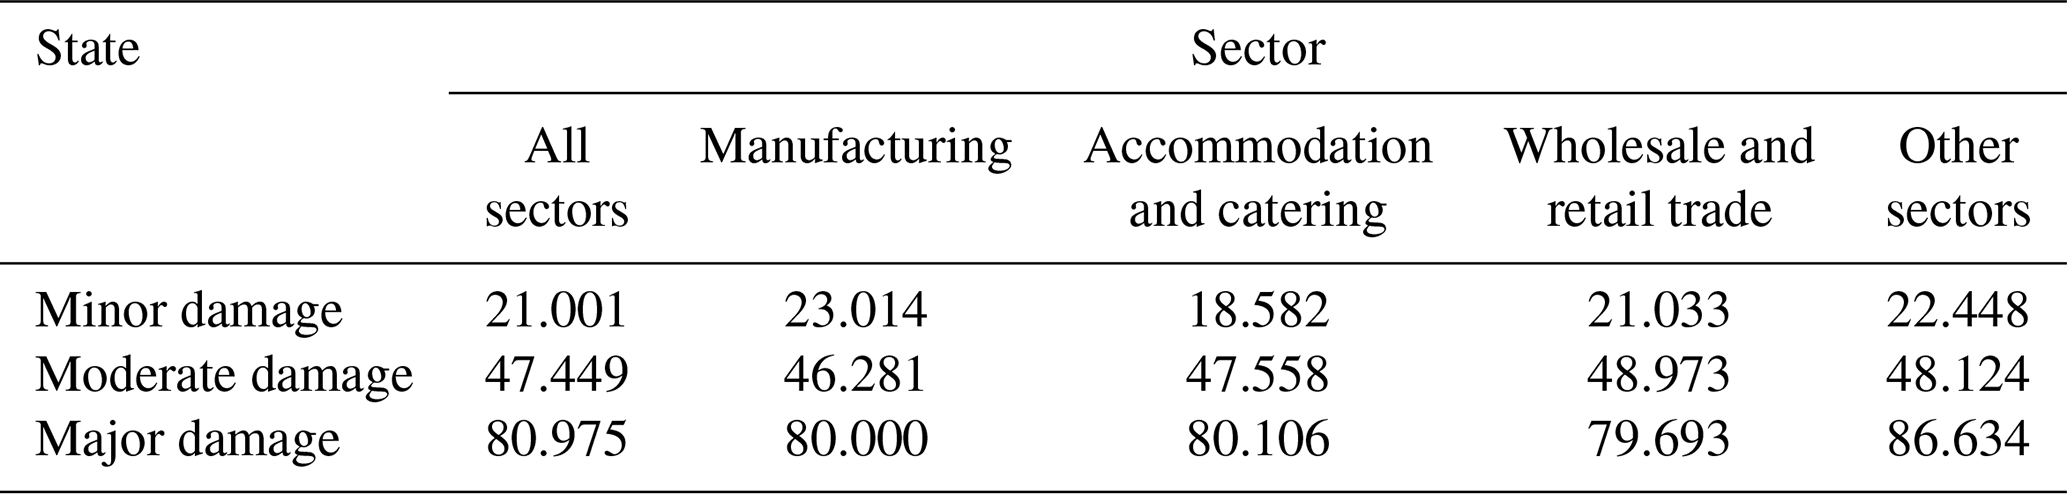
Note that the values are percentages.
4.3 Analysis of estimated PCLR across sectors
4.3.1 Prediction intervals of PCLR using MCS
Utilizing estimated probability from Sect. 4.1.2 and the expectation-of-loss rates estimated for each sector for different damage states in Sect. 4.2.2, PCLR is estimated using Eq. (13) and illustrated as solid lines in Fig. 5. Generally, PCLR values for each sector demonstrate a logarithmic increase with inundation depth. At lower inundation depths, the loss rate increases more rapidly; however, as inundation depth rises, the loss rate tends to stabilize. This highlights the nonlinear characteristics of loss rate growth across sectors at varying inundation depths.
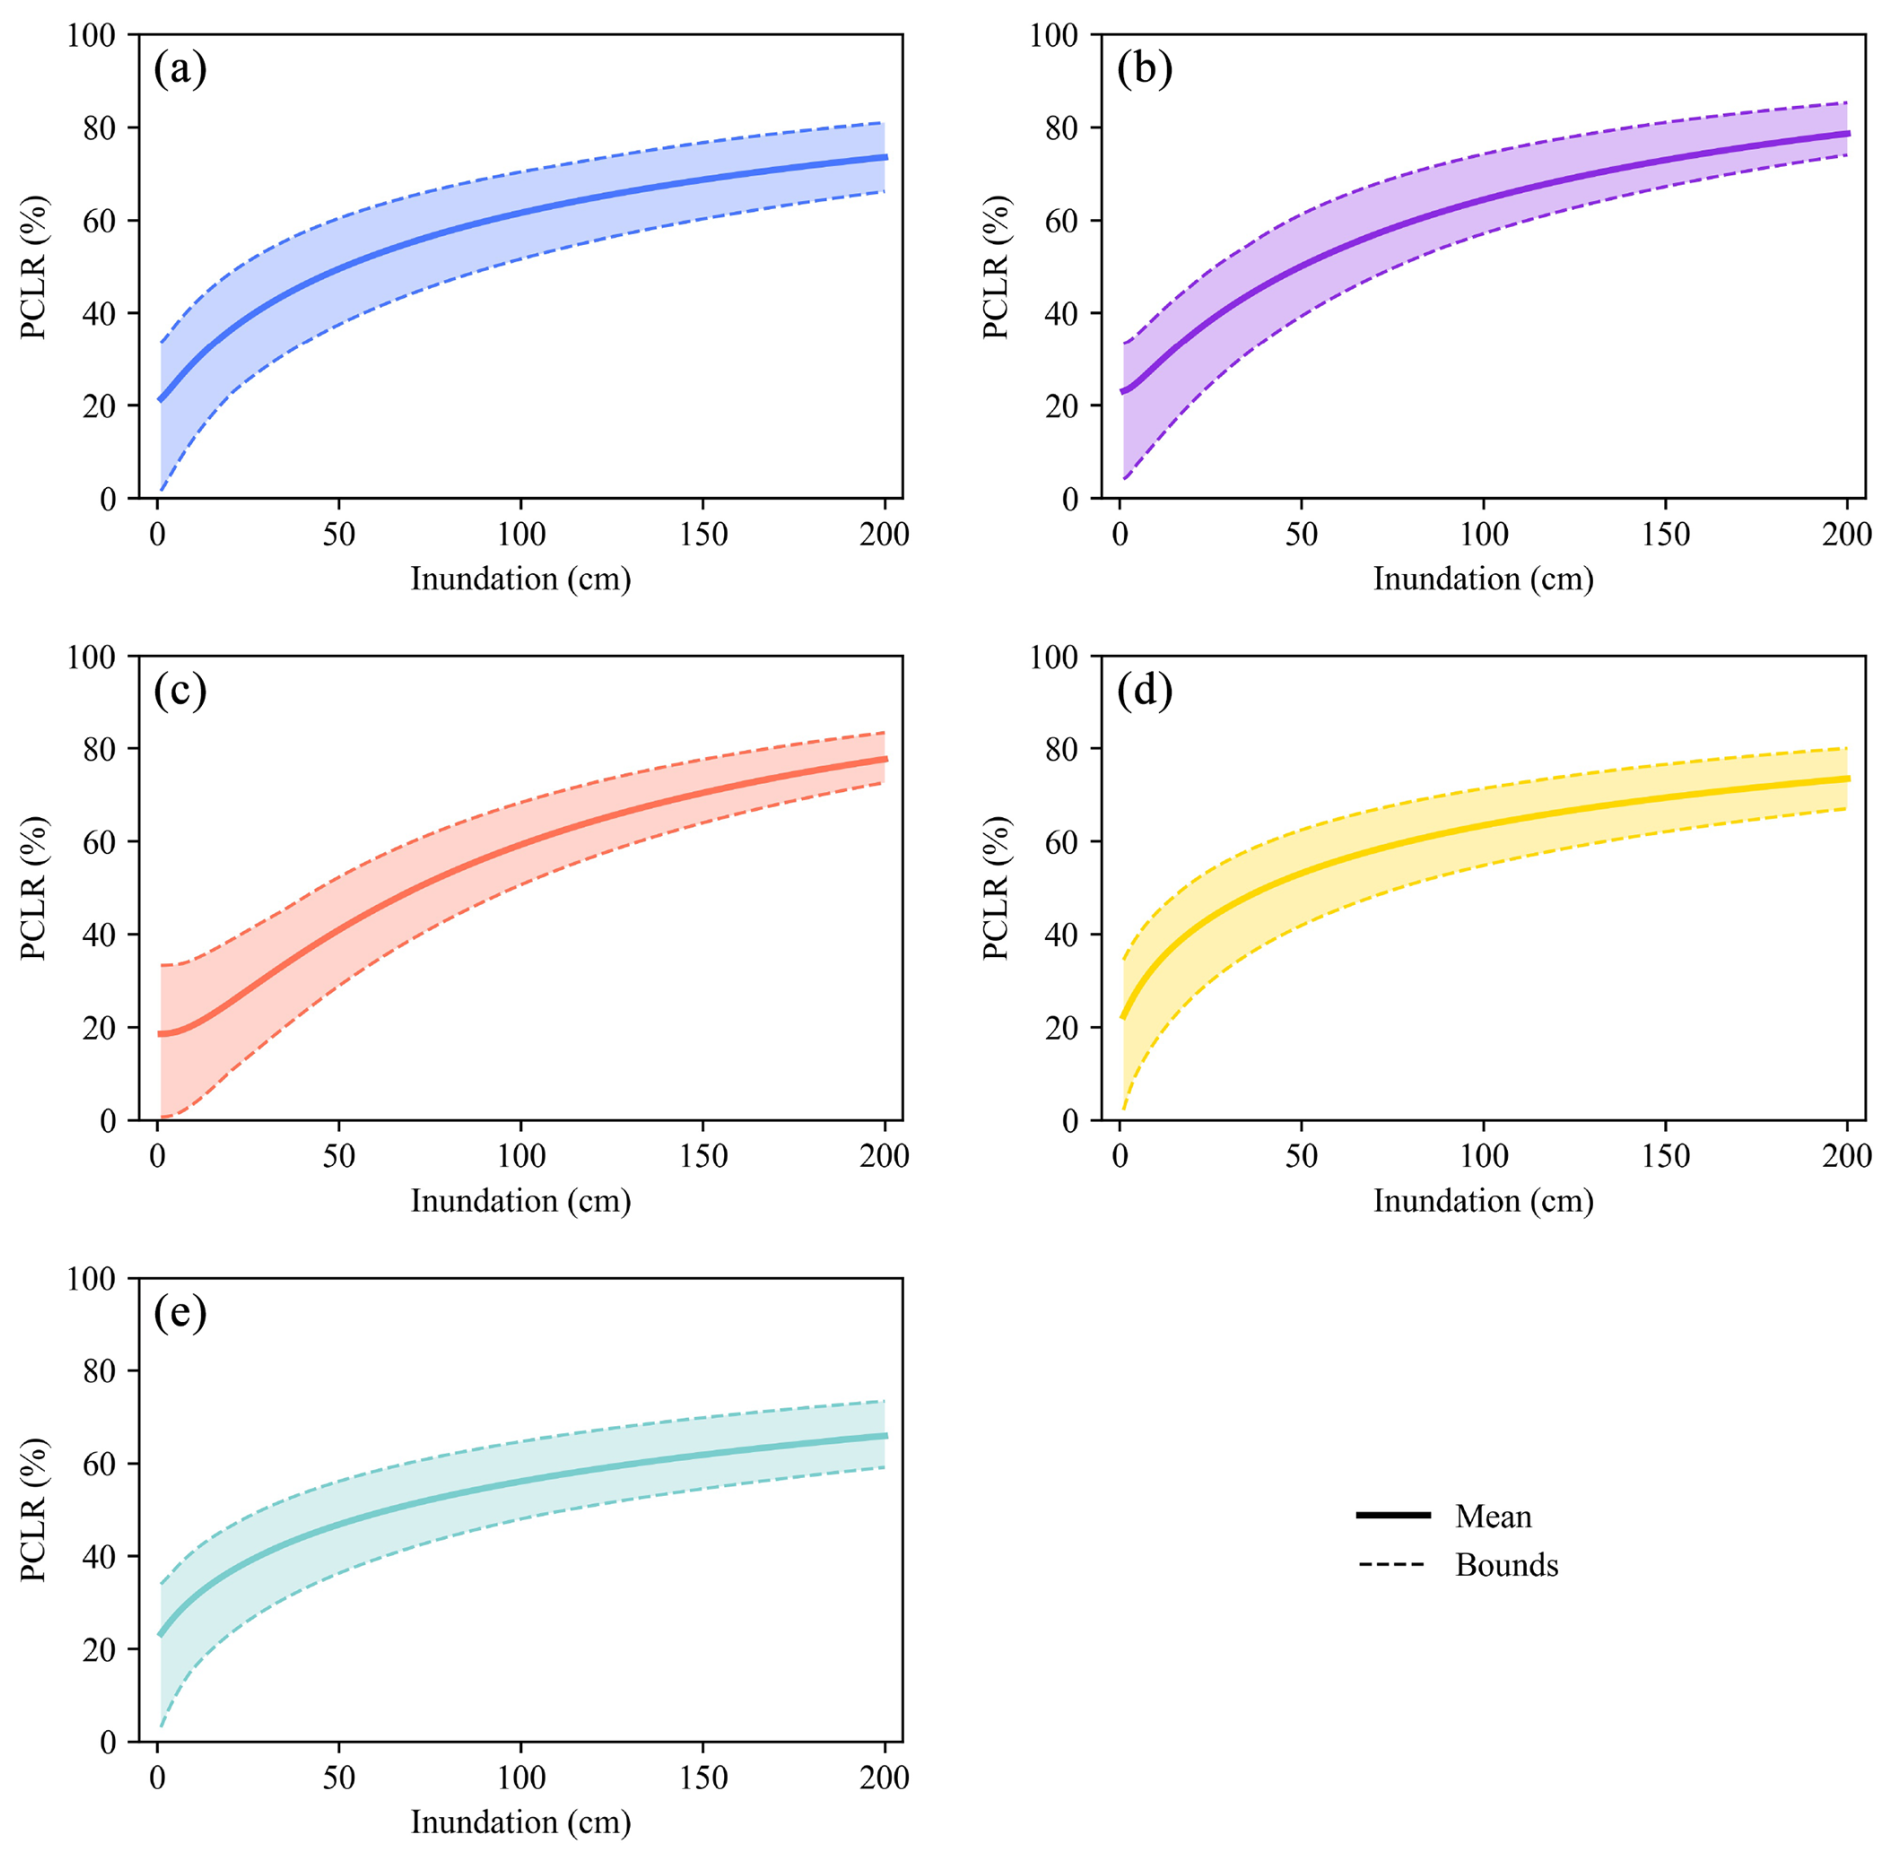
Figure 5PCLR curves of different sectors for (a) all sectors, (b) manufacturing, (c) accommodation and catering, (d) wholesale and retail trade, and (e) other sectors.
Additionally, the model indicates that losses can occur even without any inundation. PCLR can reach up to 20 % without direct floodwater damage. This primarily results from indirect factors that disrupt business operations: (1) supply chain disruption – flooding can block transportation routes (Yin et al., 2016), delaying the delivery of raw materials and finished goods; (2) workforce availability – damaged roads and public transit systems can stop employees from commuting, affecting workforce presence; (3) precautionary shutdowns – businesses may temporarily close to reduce risks, which impacts production capacity despite being short-term; (4) infrastructure interruptions – temporary disruptions of essential services, such as electricity and water (Kayaga et al., 2021), cause operational delays; and (5) customer demand – during a disaster, demand drops as people prioritize safety and essential needs, which reduces sales and affecting production.
To obtain the prediction intervals of PCLR across sectors, MCS is employed. These intervals are shown in dashed lines in Fig. 5. As inundation depth increases, these lines become tighter, indicating less variability in the PCLR estimates. This trend is crucial as it provides more reliable estimates at higher inundation depths. Narrower intervals assist decision-makers in making quicker and more informed decisions since potential losses are more predictable. Improved predictability aids in efficient resource allocation, emergency response planning, and risk mitigation. By understanding these intervals, stakeholders can prepare for different flood scenarios and implement strategies to minimize impacts on production.
4.3.2 Rate of change for PCLR across sectors
PCLR curves for each sector are presented on a single graph, illustrating loss rates under different inundation depths, as shown in Fig. 6a. Initially, the loss rate in the manufacturing sector is higher than in the wholesale and retail trade sector, but it is negligible. For inundation depths below 80 cm, the wholesale and retail trade sector incurs the highest loss rate, followed by the manufacturing sector, and the accommodation and catering sector experiences the lowest loss rate. Between 80 and 130 cm, the manufacturing sector suffers the highest loss rate, followed by the wholesale and retail trade sector, with the accommodation and catering sector still experiencing the lowest. For depths over 130 cm, the manufacturing sector continues to incur the highest loss rate, but the accommodation and catering sector surpasses the wholesale and retail trade sector. These findings show that sector vulnerability varies with flood conditions, highlighting the need for tailored flood risk management strategies.
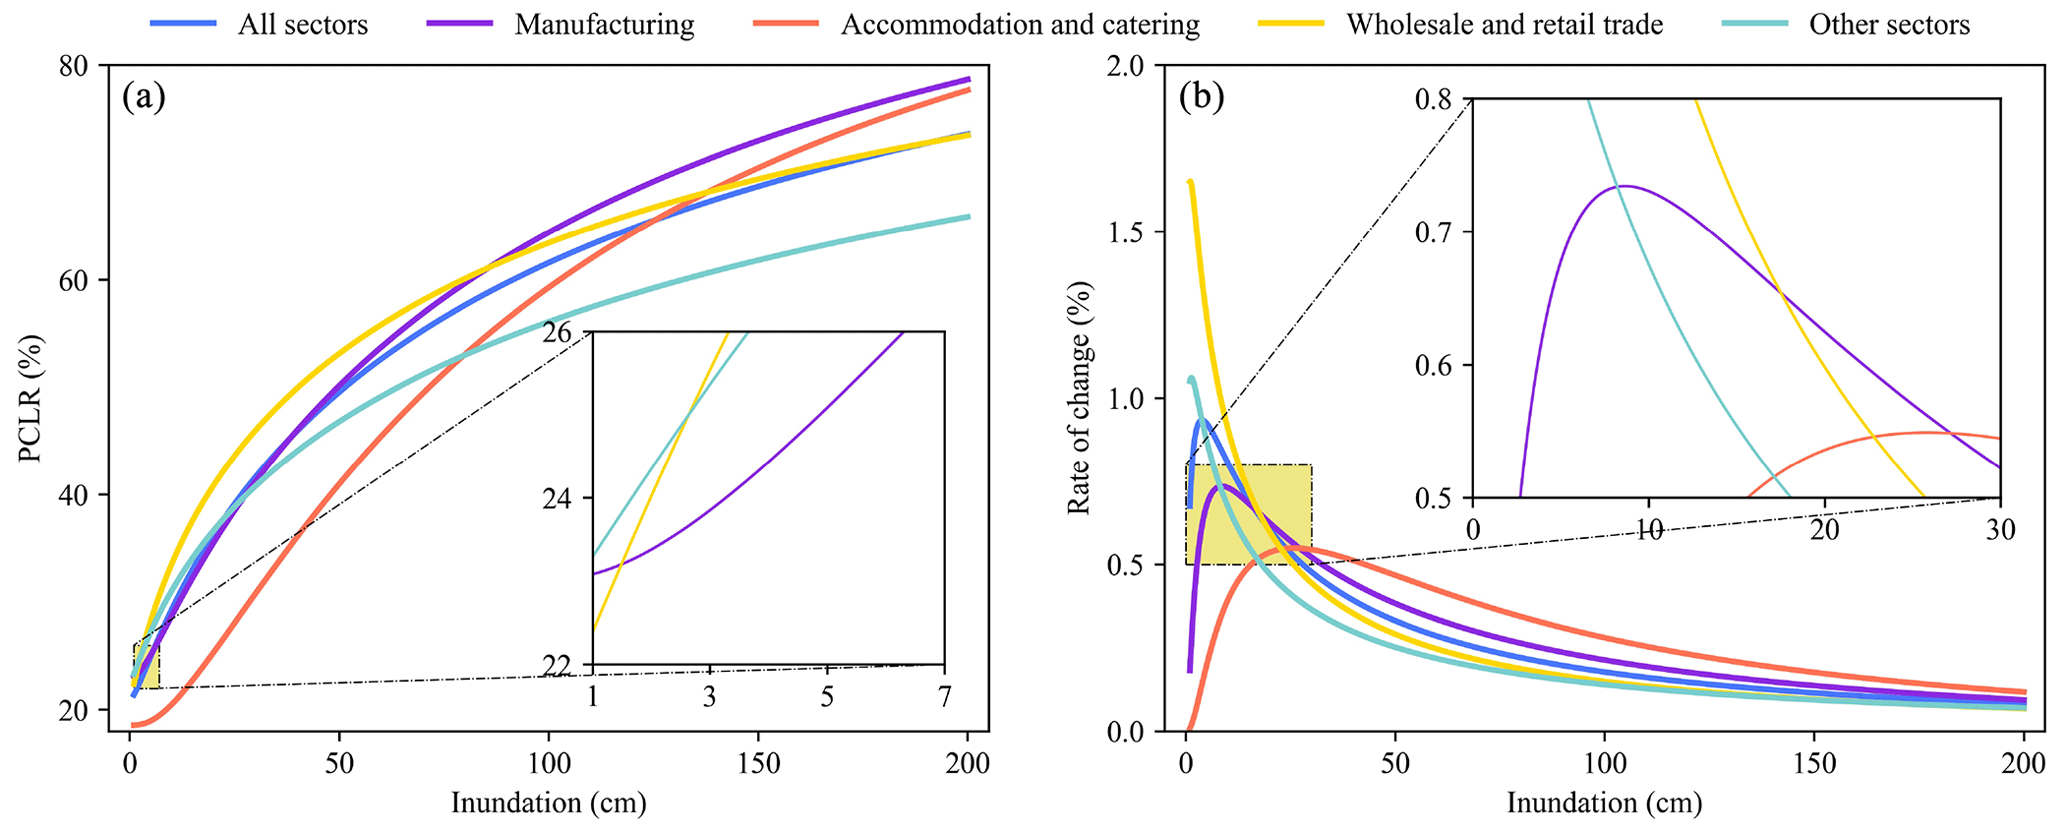
While PCLR shows the post-disaster loss rate for each sector, it is limited by its one-dimensional analysis. To improve disaster prevention strategies, this study also estimates the rate of change for PCLR across sectors. This rate reflects how quickly the loss rate changes with inundation depth under specific conditions. Understanding this rate provides deeper insight into sector-specific vulnerabilities. Figure 6b presents the rate of change in losses across sectors under varying inundation depths. We find that at depths of less than 17 cm, the wholesale and retail trade sector has a higher rate of change than the manufacturing sector and accommodation and catering sector. However, as depth increases, the dynamics shift. Between 17 and 27 cm, the manufacturing sector shows the highest rate of change, surpassing both the wholesale and retail trade sector and the accommodation and catering sector. Beyond 27 cm, the accommodation and catering sector has the highest rate of loss change, exceeding the manufacturing sector.
At shallow inundation depths, PCLR of the wholesale and retail trade sector exhibits the steepest slope. This steepness can be attributed to the sector's high reliance on physical location and customer footfall. Even minor flooding can disrupt transportation, affecting customer access and quickly reducing sales. Additionally, inventory losses can also rise rapidly, particularly for water-sensitive goods. As inundation depth increases, the manufacturing sector's vulnerability curve becomes steeper than that of the wholesale and retail trade sector. This change is related to the sector's reliance on infrastructure and production lines. Greater depths increase damage to production and storage facilities and cause interruptions to electricity and logistics, resulting in faster losses. At even higher depths, the accommodation and catering sector's vulnerability curve becomes the steepest. This sector relies heavily on immediate service and the customer experience. Flood damage to facilities, hygiene problems, and service interruptions impact operations. Furthermore, worsening floods can increase evacuations from affected areas, decreasing demand for accommodation and catering services.
4.3.3 Comparison results between estimated values and observed values
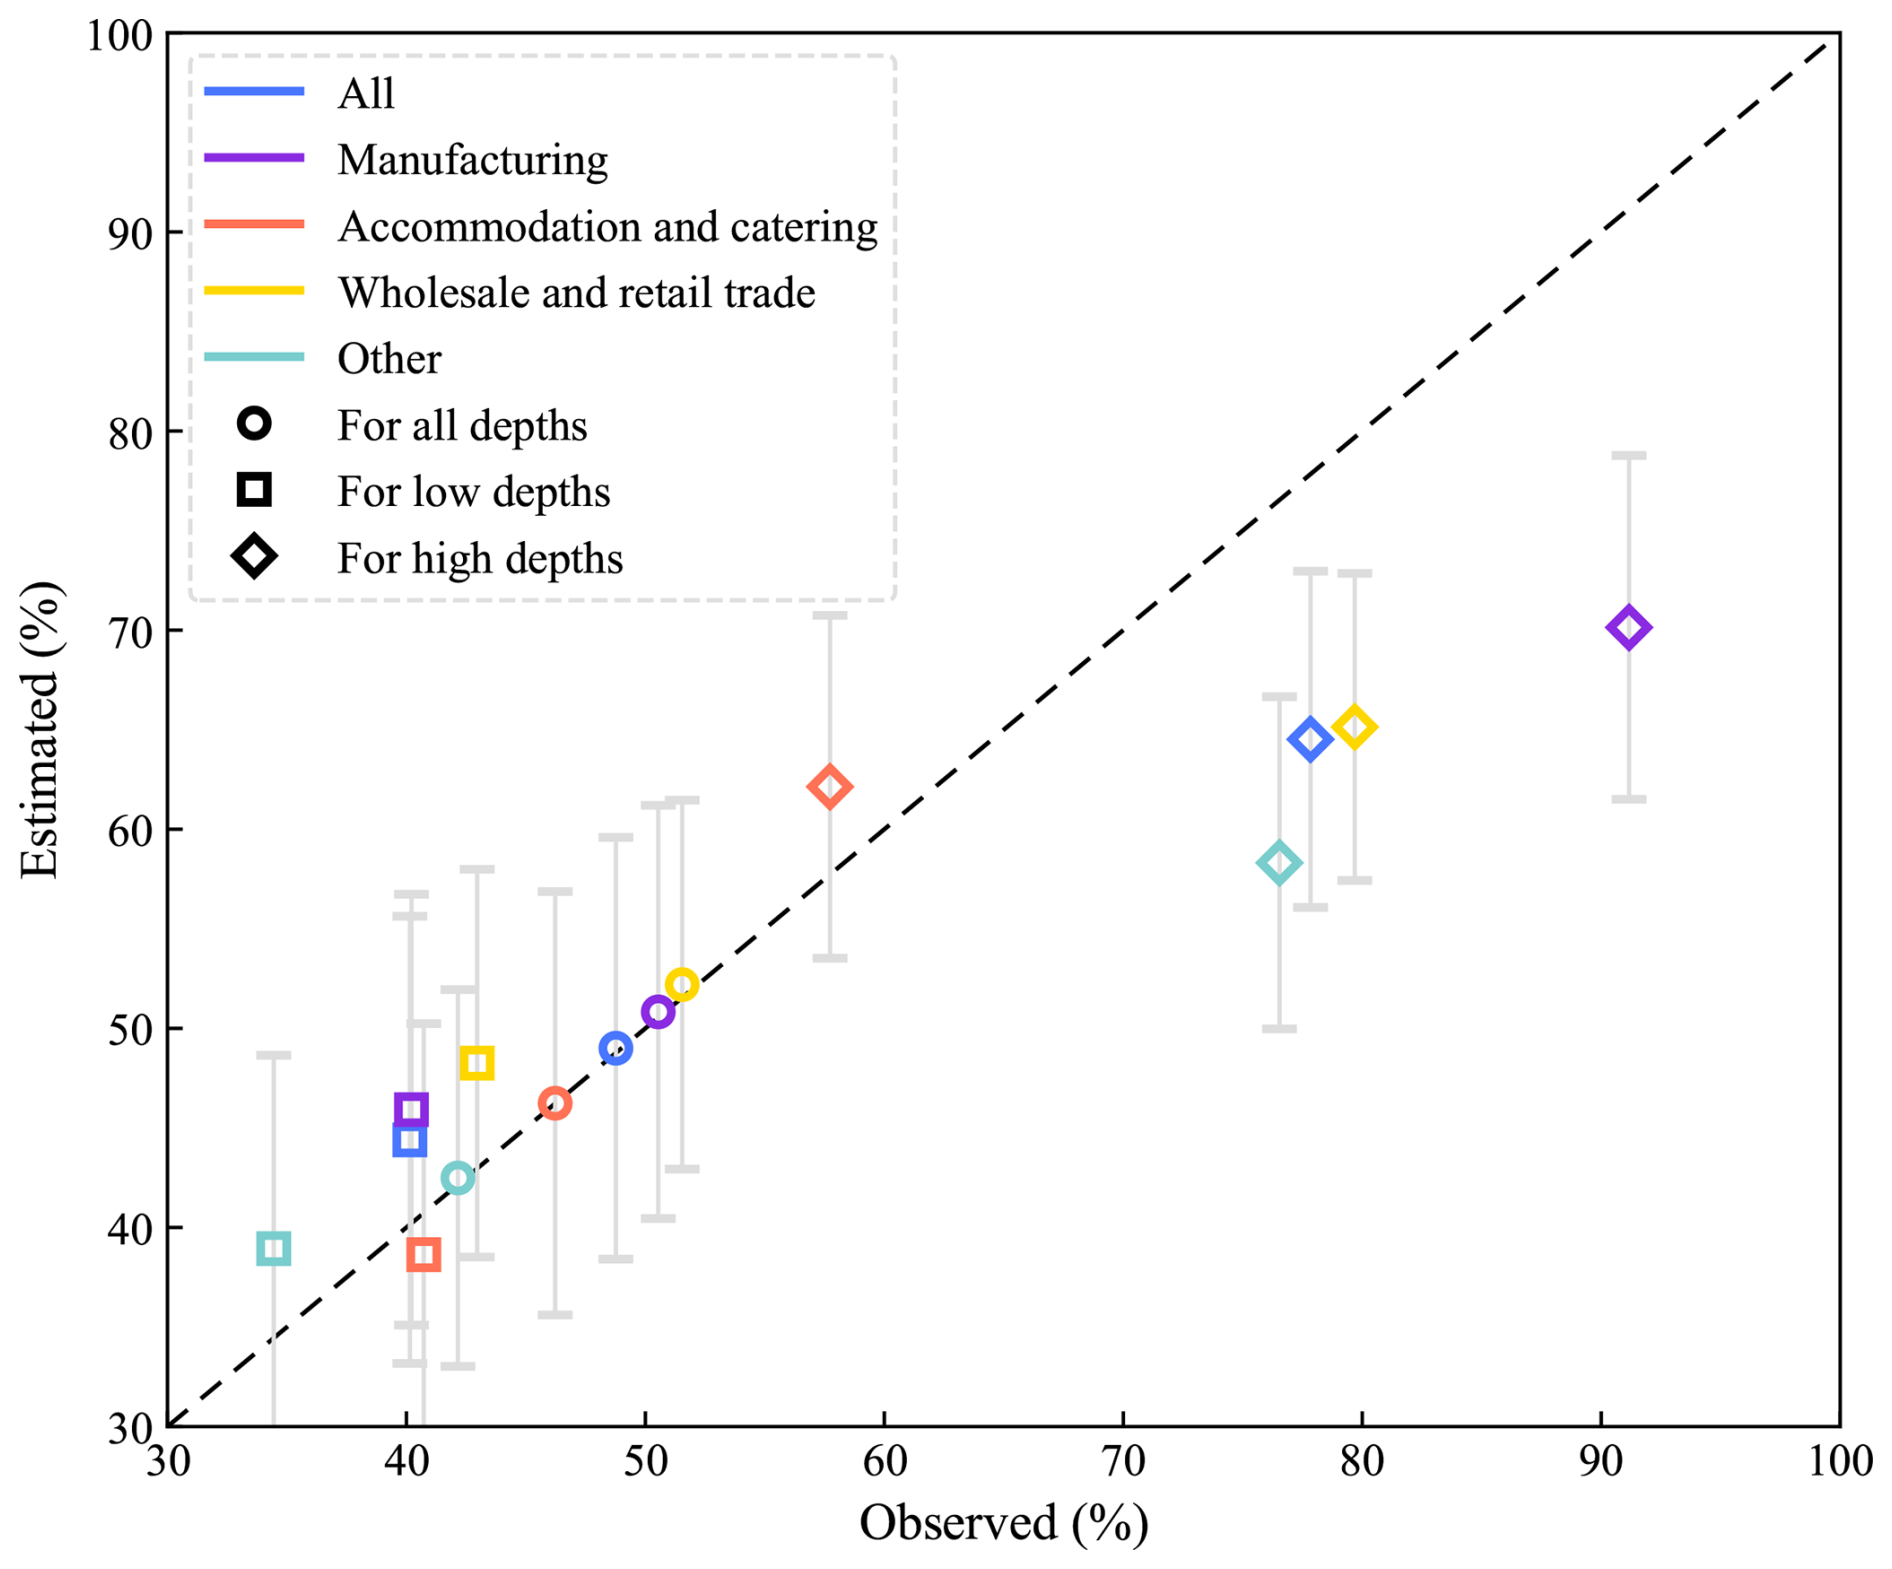
We conduct a comparative analysis using the model-predicted estimated data and the survey data, as shown in Fig. 7. We found that the model overestimated the loss rate at low water depths and underestimated the loss rate at high water depths. The model explains the observed values better at lower inundation levels, with the prediction intervals effectively encompassing the observations. Prediction intervals are ranges calculated based on the model's uncertainty; when observed values fall within these intervals, it indicates that the model's estimation of uncertainty is reasonable and the prediction results are reliable. However, for locations with deep inundation, due to fewer sample points, the model shows some bias and tends to underestimate the observed values. Nevertheless, the upper bounds of the prediction intervals are still close to the actual observations, indicating that the model can still partially capture the conditions in deeply inundated areas.
4.4 Discussion
4.4.1 Advantages and limitations
A methodological framework was proposed to address response bias in assessing PCLR of enterprises caused by flood disasters, and it was applied to the city of Zhengzhou as a case study. The methodology has the following advantages: (1) it addresses response bias in extreme flood scenarios and considers the distribution characteristics of PCLR for different damage states, allowing for more accurate assessment of direct economic losses amidst the complexity of real-world data. (2) It calculates the prediction intervals for PCLR using MCS, providing a basis for decision-makers to allocate funds based on their financial situations. (3) It calculates the rate of change in PCLR with increasing inundation depth, helping emergency managers and businesses understand PCLR sensitivity to rising inundation depth.
The core value of this study lies in the potential application of the estimated PCLR values in economic modeling. For example, based on the PCLR estimated in this study, we can determine the production capacity economic loss rates of various industrial sectors in Zhengzhou under the scenario of extremely large-scale flood disasters with a 1 m moderate flooding level. On this basis, in combination with the sectoral gross output data from Zhengzhou's multi-regional input–output (MRIO) table, we can estimate the production capacity losses of each industrial sector in this scenario. Subsequently, by inputting the obtained production capacity loss data into the mixed-MRIO model, we can estimate the ripple losses outside the disaster area caused by inter-regional industrial linkages. PCLR values provide precise supply-side inputs for I–O and CGE models. This enhances the accuracy of assessing the ripple effects of production disruptions on the economy and aids governments in formulating effective response strategies.
However, the proposed approach has some limitations. Although we try to improve model adaptability, the model's generalization ability still requires further validation. Since disasters are unique and unpredictable events, addressing their impacts necessitates specific considerations in modeling.
4.4.2 Future work
Based on this study, future research should focus on several key points.
Firstly, increasing the sample size through on-site investigations should be taken into account when modeling. A multiple dataset can provide a more comprehensive representation of the variability and uncertainty inherent in real-world scenarios (Shooraki et al., 2024). This helps ensure that the model performs consistently well with new and unseen data.
Secondly, incorporating data from diverse regions and sectors is important for enhancing the model's universality. Our framework offers a foundational paradigm for cross-sector risk assessment but requires flexible adaptation for different sectors. For instance, the agricultural sector, significantly influenced by flood inundation depth, crop growth cycles, and soil moisture, needs to integrate agricultural monitoring data to refine damage state classification (Yang et al., 2023; Zhong et al., 2018); the public service sector's productivity loss assessment should consider factors such as service network connectivity and backup facility configurations (Li and Yan, 2024), achievable by expanding survey dimensions and infrastructure vulnerability curves. Geographic extensions must account for regional climate characteristics (e.g., differences in flood patterns between monsoon and arid zones) and economic structural variations, with multi-regional data used to calibrate model parameters and enhance generalizability.
Finally, establishing a disaster emergency data collection template to build a standardized indicator system and design trigger-based questions is necessary. Through the government affairs system of emergency management departments, questionnaire templates can be pushed to high-risk enterprises, with automatic pre-filling of business registration information (such as industry type and number of employees). Additionally, a lightweight app could be developed to support voice input (e.g., equipment submerged for 8 h) and on-site photo recognition (using optical character recognition (OCR) to extract equipment numbers and damage levels).
4.4.3 Flood prevention and mitigation strategies
This study indicates differences in the severity and rate of change for PCLR across sectors due to floods. Therefore, it is crucial to adopt targeted flood risk management strategies to enhance disaster resilience within each sector.
Firstly, governments should focus on strengthening infrastructure, particularly in regions with a manufacturing sector and wholesale and retail trade sector. Since these sectors highly depend on infrastructure, investments should aim to improve and reinforce roads, power supplies, and logistics networks to mitigate the indirect impacts of flooding. Secondly, for the accommodation and catering sector, detailed emergency response plans and recovery strategies need to be developed. As this sector experiences the greatest variability in PCLR during severe flooding, policymakers should promote the establishment of a sector-specific emergency fund. This fund would provide financial support and short-term loans to assist businesses in recovering quickly after a disaster. Lastly, it is recommended that the government establish a multi-sector collaboration mechanism to ensure rapid responses and coordinated action among relevant departments when disasters occur. By creating an information-sharing platform, businesses and government agencies across sectors can access up-to-date flood information promptly, allowing for more informed decision-making in response efforts.
This study tackles the significant challenge of estimating mean PCLR following extreme disaster events, a crucial topic in disaster research. Our methodological approach demonstrates three principal advantages: first, we develop a method to estimate mean PCLR while accounting for response bias. This method involves constructing exceedance probability curves and using distribution function fitting. Second, the integration of MCS enhances the reliability of these estimates by generating prediction intervals, which are vital for informing government decisions on post-disaster resource allocation. Third, we quantify the rate of change in PCLR to assess the sensitivity of sector-specific PCLR with respect to varying inundation depths. Subsequently, we apply the proposed method to 424 data samples collected after the Zhengzhou rainstorm event in July 2021. Ultimately, the estimated PCLR values serve as critical input in I–O and CGE models, thereby enabling a more precise assessment of the ripple effects caused by flood losses.
This study identifies key patterns in sectoral loss rates in relation to inundation depths. The loss rate is the highest in the wholesale and retail trade sector at shallower depths. At moderate and greater depths, manufacturing experiences the highest loss rate. The rate of change for PCLR differs significantly between sectors. The wholesale and retail trade sector is most sensitive at minimal depths. Manufacturing is most sensitive at moderate depths, while the accommodation and catering sector shows the greatest sensitivity at greater depths. These findings highlight the importance of directing support to the most affected sectors, especially manufacturing and wholesale and retail trade, to reduce economic disruption. The varying sensitivity of sectors to inundation should guide policymaking due to its impact on economic and social resilience.
As climate changes, the frequency and severity of natural disasters such as floods, hurricanes, and rising sea levels are expected to increase. This research offers an insight for policymakers in disaster management, allowing for the strategic allocation of limited resources and accurate ripple effect estimation. Given access to primary data on hazard intensity and PCLR, the analytical model in this study can be adapted to the characteristics of different regions and sectors. It is applicable in various disaster scenarios, providing a tool for managing future economic challenges.
Data will be made available on request. Please contact corresponding author (jxy119@nju.edu.cn).
LY: conceptualization, methodology, writing (review and editing), funding acquisition, resources, supervision. YL: conceptualization, methodology, formal analysis, writing (original draft preparation, review and editing). ZL: conceptualization, methodology, formal analysis, visualization. XJ: conceptualization, methodology, formal analysis and investigation, writing (review and editing), funding acquisition, resources.
The contact author has declared that none of the authors has any competing interests.
Publisher’s note: Copernicus Publications remains neutral with regard to jurisdictional claims made in the text, published maps, institutional affiliations, or any other geographical representation in this paper. While Copernicus Publications makes every effort to include appropriate place names, the final responsibility lies with the authors.
This research has been supported by the National Natural Science Foundation of China (grant nos. 42177448 and 42477498).
This paper was edited by Olga Petrucci and reviewed by Samar Momin and one anonymous referee.
Andreotti, G. and Lai, C.: Use of fragility curves to assess the seismic vulnerability in the risk analysis of mountain tunnels, Tunn. Undergr. Sp. Tech., 91, 103008, https://doi.org/10.1016/j.tust.2019.103008, 2019. a, b
Asche, F., Anderson, J. L., Botta, R., Kumar, G., Abrahamsen, E. B., Nguyen, L. T., and Valderrama, D.: The economics of shrimp disease, J. Invertebr. Pathol., 186, 107397, https://doi.org/10.1016/j.jip.2020.107397, 2021. a
Baker, J. W.: Efficient Analytical Fragility Function Fitting Using Dynamic Structural Analysis, Earthq. Spectra, 31, 579–599, https://doi.org/10.1193/021113eqs025m, 2015. a
Borga, M., Comiti, F., Ruin, I., and Marra, F.: Forensic analysis of flash flood response, WIREs Water, 6, e1338, https://doi.org/10.1002/wat2.1338, 2019. a
Burton, H. V., Deierlein, G., Lallemant, D., and Lin, T.: Framework for Incorporating Probabilistic Building Performance in the Assessment of Community Seismic Resilience, J. Struct. Eng., 142, C4015007, https://doi.org/10.1061/(ASCE)ST.1943-541X.0001321, 2016. a
Cabrera, T., Hube, M. A., María, H. S., Silva, V., Martins, L., Yepes-Estrada, C., and Chacón, M. F.: Empirical fragility curves for houses in Chile using damage data from two earthquakes, B. Earthq. Eng., 22, 5619–5638, https://doi.org/10.1007/s10518-024-01933-w, 2024. a
Cai, M. and Wei, G.: A fuzzy social vulnerability evaluation from the perception of disaster bearers against meteorological disasters, Nat. Hazards, 103, 2355–2370, https://doi.org/10.1007/s11069-020-04088-4, 2020. a
Choi, E., DesRoches, R., and Nielson, B.: Seismic fragility of typical bridges in moderate seismic zones, Eng. Struct., 26, 187–199, https://doi.org/10.1016/j.engstruct.2003.09.006, 2004. a
Christensen, A. P., Garrido, L. E., Guerra-Peña, K., and Golino, H.: Comparing community detection algorithms in psychometric networks: A Monte Carlo simulation, Behav. Res. Methods, 56, 1485–1505, https://doi.org/10.3758/s13428-023-02106-4, 2024. a
Dong, B., Xia, J., Li, Q., and Zhou, M.: Risk assessment for people and vehicles in an extreme urban flood: Case study of the “7.20” flood event in Zhengzhou, China, Int. J. Disast. Risk Re., 80, 103205, https://doi.org/10.1016/j.ijdrr.2022.103205, 2022. a
EMDAT: 2023 Disasters in Numbers: A Significant Year of Disaster Impact, https://files.emdat.be/reports/2023_EMDAT_report.pdf (last access: 6 August 2025), 2024. a
Furnham, A.: Response bias, social desirability and dissimulation, Pers. Indiv. Differ., 7, 385–400, https://doi.org/10.1016/0191-8869(86)90014-0, 1986. a
Gertz, A. B., Davies, J. B., and Black, S. L.: A CGE Framework for Modeling the Economics of Flooding and Recovery in a Major Urban Area, Risk Anal., 39, 1314–1341, https://doi.org/10.1111/risa.13285, 2019. a
Gove, W. and Geerken, M.: Response Bias in Surveys of Mental Health: An Empirical Investigation, Am. J. Sociol., 82, 1289–1317, https://doi.org/10.1086/226466, 1977. a
Hallegatte, S., Green, C., Nicholls, R. J., and Corfee-Morlot, J.: Future flood losses in major coastal cities, Nat. Clim. Change, 3, 802–806, https://doi.org/10.1038/nclimate1979, 2013. a
Hariri-Ardebili, M. and Saouma, V.: Probabilistic seismic demand model and optimal intensity measure for concrete dams, Struct. Saf., 59, 67–85, https://doi.org/10.1016/j.strusafe.2015.12.001, 2016. a
Heo, S., Lim, J. Y., Chang, R., Shim, Y., Ifaei, P., and Yoo, C.: Non-Gaussian multivariate statistical monitoring of spatio-temporal wind speed frequencies to improve wind power quality in South Korea, J. Environ. Manage., 318, 115516, https://doi.org/10.1016/j.jenvman.2022.115516, 2022. a
IPCC: Summary for Policymakers, edited by: Lee, H. and Romero, J., IPCC, https://www.ipcc.ch/report/ar6/syr/ (last access: 6 August 2025), 2023. a
Jiang, X., Mori, N., Tatano, H., Yang, L., and Shibutani, Y.: Estimation of property loss and business interruption loss caused by storm surge inundation due to climate change: a case of Typhoon Vera revisit, Nat. Hazards, 84, 35–49, https://doi.org/10.1007/s11069-015-2085-z, 2015. a
Kajitani, Y. and Tatano, H.: ESTIMATION OF PRODUCTION CAPACITY LOSS RATE AFTER THE GREAT EAST JAPAN EARTHQUAKE AND TSUNAMI IN 2011, Econ. Syst. Res., 26, 13–38, https://doi.org/10.1080/09535314.2013.872081, 2014. a, b
Kajitani, Y. and Tatano, H.: Applicability of a spatial computable general equilibrium model to assess the short-term economic impact of natural disasters, Econ. Syst. Res., 30, 289–312, https://doi.org/10.1080/09535314.2017.1369010, 2018. a
Kayaga, S. M., Amankwaa, E. F., Gough, K. V., Wilby, R. L., Abarike, M. A., Codjoe, S. N. A., Kasei, R., Nabilse, C. K., Yankson, P. W. K., Mensah, P., Abdullah, K., and Griffiths, P.: Cities and extreme weather events: impacts of flooding and extreme heat on water and electricity services in Ghana, Environment & Urbanization, 33, 131–150, https://doi.org/10.1177/0956247820952030, 2021. a
Koks, E. E., Carrera, L., Jonkeren, O., Aerts, J. C. J. H., Husby, T. G., Thissen, M., Standardi, G., and Mysiak, J.: Regional disaster impact analysis: comparing input–output and computable general equilibrium models, Nat. Hazards Earth Syst. Sci., 16, 1911–1924, https://doi.org/10.5194/nhess-16-1911-2016, 2016. a
Lenzen, M., Malik, A., Kenway, S., Daniels, P., Lam, K. L., and Geschke, A.: Economic damage and spillovers from a tropical cyclone, Nat. Hazards Earth Syst. Sci., 19, 137–151, https://doi.org/10.5194/nhess-19-137-2019, 2019. a
Li, Z. and Yan, W.: Service flow changes in multilayer networks: A framework for measuring urban disaster resilience based on availability to critical facilities, Landscape Urban Plan., 244, 104996, https://doi.org/10.1016/j.landurbplan.2023.104996, 2024. a
Lima, A. O., Lyra, G. B., Abreu, M. C., Oliveira-Júnior, J. F., Zeri, M., and Cunha-Zeri, G.: Extreme rainfall events over Rio de Janeiro State, Brazil: Characterization using probability distribution functions and clustering analysis, Atmos. Res., 247, 105221, https://doi.org/10.1016/j.atmosres.2020.105221, 2021. a
Liu, H., Tatano, H., Kajitani, Y., and Yang, Y.: Methodology for estimating regional production capacity loss rate in industrial sectors caused by disasters: A case study of the 2016 Kumamoto earthquakes, Int. J. Disast. Risk Re., 110, 104631, https://doi.org/10.1016/j.ijdrr.2024.104631, 2024. a
Liu, X., Wu, J., Zhang, S., Wang, Z., and Garg, H.: Extended Cumulative Residual Entropy for Emergency Group Decision-Making Under Probabilistic Hesitant Fuzzy Environment, Int. J. Fuzzy Syst., 24, 159–179, https://doi.org/10.1007/s40815-021-01122-w, 2022. a
Michalos, A. C. (Ed.): Encyclopedia of Quality of Life and Well-Being Research, Springer Netherlands, ISBN-13: 978-9400707528, 2014. a
Nakano, K., Kajitani, Y., and Tatano, H.: FUNCTIONAL FRAGILITY CURVES FOR A PRODUCTION FACILITY OF INDUSTRIAL SECTORS IN CASE OF EARTHQUAKE DISASTER, Journal of Japan Society of Civil Engineers, Ser. A1 (Structural Engineering & Earthquake Engineering (SE/EE)), 69, 57–68, https://doi.org/10.2208/jscejseee.69.57, 2013. a
Nguyen, H. D., Kim, C., Lee, Y.-J., and Shin, M.: Incorporation of machine learning into multiple stripe seismic fragility analysis of reinforced concrete wall structures, Journal of Building Engineering, 97, 110772, https://doi.org/10.1016/j.jobe.2024.110772, 2024. a
Okuyama, Y. and Santos, J. R.: DISASTER IMPACT AND INPUT-OUTPUT ANALYSIS, Econ. Syst. Res., 26, 1–12, https://doi.org/10.1080/09535314.2013.871505, 2014. a
Peng, J. and Zhang, J.: Urban flooding risk assessment based on GIS- game theory combination weight: A case study of Zhengzhou City, Int. J. Disast. Risk Re., 77, 103080, https://doi.org/10.1016/j.ijdrr.2022.103080, 2022. a
Prasad, G. G. and Banerjee, S.: The Impact of Flood-Induced Scour on Seismic Fragility Characteristics of Bridges, J. Earthq. Eng., 17, 803–828, https://doi.org/10.1080/13632469.2013.771593, 2013. a
Shinozuka, M., Feng, M. Q., Lee, J., and Naganuma, T.: Statistical Analysis of Fragility Curves, J. Eng. Mech., 126, 1224–1231, https://doi.org/10.1061/(ASCE)0733-9399(2000)126:12(1224), 2000. a
Shooraki, M. K., Bastami, M., Abbasnejadfard, M., and Motamed, H.: Development of seismic fragility curves for hospital buildings using empirical damage observations, Int. J. Disast. Risk Re., 108, 104525, https://doi.org/10.1016/j.ijdrr.2024.104525, 2024. a
Sun, Y., Liu, S., Wang, P., Jian, X., Liao, X., and Chen, W.-Q.: China's roadmap to plastic waste management and associated economic costs, J. Environ. Manage., 309, 114686, https://doi.org/10.1016/j.jenvman.2022.114686, 2022. a
Tan, R., Zhang, W., and Yang, L.: Decision-making method based on set pair analysis and VIKOR under heterogeneous information environment and application to typhoon disaster assessment, Soft Comput., 27, 8289–8314, https://doi.org/10.1007/s00500-022-07750-0, 2023. a
Tatano, H. and Kajitani, Y. (Eds.): Functional Fragility Curves for Production Capacity, Springer Singapore, https://doi.org/10.1007/978-981-16-2719-4_2, 2022a. a
Tatano, H. and Kajitani, Y. (Eds.): Methodologies for Estimating the Economic Impacts of Natural Disasters, Springer Singapore, https://doi.org/10.1007/978-981-16-2719-4, 2022b. a
Torbol, M. and Shinozuka, M.: Effect of the angle of seismic incidence on the fragility curves of bridges, Earthq. Eng. Struct. Dyn., 41, 2111–2124, https://doi.org/10.1002/eqe.2197, 2012. a
UNDRR: Sendai Framework for Disaster Risk Reduction 2015–2030, https://www.undrr.org/publication/sendai-framework-disaster-risk-reduction-2015-2030 (last access: 6 August 2025), 2015. a
Vergeynst, L. L., Dierick, M., Bogaerts, J. A. N., Cnudde, V., and Steppe, K.: Cavitation: a blessing in disguise? New method to establish vulnerability curves and assess hydraulic capacitance of woody tissues, Tree Physiol., 35, 400–409, https://doi.org/10.1093/treephys/tpu056, 2015. a
Yang, H., Feng, X., Wang, H., Yan, H., Zhao, P., Gao, F., Guo, X., and Xie, B.: Long time-series variation of crop yield under drought stress and drought vulnerability curves in Songnen Plain, Northeast China, Ecol. Indic., 154, 110624, https://doi.org/10.1016/j.ecolind.2023.110624, 2023. a
Yang, L., Kajitani, Y., Tatano, H., and Jiang, X.: A methodology for estimating business interruption loss caused by flood disasters: insights from business surveys after Tokai Heavy Rain in Japan, Nat. Hazards, 84, 411–430, https://doi.org/10.1007/s11069-016-2534-3, 2016. a
Yang, Y., Chen, G., and Reniers, G.: Vulnerability assessment of atmospheric storage tanks to floods based on logistic regression, Reliab. Eng. Syst. Safe., 196, 106721, https://doi.org/10.1016/j.ress.2019.106721, 2020. a
Yin, J., Yu, D., Yin, Z., Liu, M., and He, Q.: Evaluating the impact and risk of pluvial flash flood on intra-urban road network: A case study in the city center of Shanghai, China, J. Hydrol., 537, 138–145, https://doi.org/10.1016/j.jhydrol.2016.03.037, 2016. a
Zentner, I., Gündel, M., and Bonfils, N.: Fragility analysis methods: Review of existing approaches and application, Nucl. Eng. Des., 323, 245–258, https://doi.org/10.1016/j.nucengdes.2016.12.021, 2017. a
Zhang, H., Fang, W., Zhang, H., and Yu, L.: Assessment of direct economic losses of flood disasters based on spatial valuation of land use and quantification of vulnerabilities: a case study on the 2014 flood in Lishui city of China, Nat. Hazards Earth Syst. Sci., 21, 3161–3174, https://doi.org/10.5194/nhess-21-3161-2021, 2021. a
Zhong, S., Wang, C., Yang, Y., and and, Q. H.: Risk assessment of drought in Yun-Gui-Guang of China jointly using the Standardized Precipitation Index and vulnerability curves, Geomat. Nat. Haz. Risk, 9, 892–918, https://doi.org/10.1080/19475705.2018.1480537, 2018. a