the Creative Commons Attribution 4.0 License.
the Creative Commons Attribution 4.0 License.
 | 24 Jul 2025
How does perceived heat stress differ between urban forms and human vulnerability profiles? Case study Berlin
Nimra Iqbal
Marvin Ravan
Zina Mitraka
Joern Birkmann
Sue Grimmond
Denise Hertwig
Nektarios Chrysoulakis
Giorgos Somarakis
Angela Wendnagel-Beck
Emmanouil Panagiotakis
Urban areas in all world regions are experiencing increasing heat stress and heat-related risks. While in-depth knowledge exists in terms of the urban heat island effect and increased heat stress in cities in the context of climate change, less is known about how individual heat perceptions and experiences differ between urban forms or with different vulnerability profiles of exposed people. It is crucial to identify and assess differences within cities relating to urban form and social structure, as both need to be considered when designing adaptation plans for heat-related risks. Here, we explore linkages between urban structure types (USTs), heat stress perception and different socio-economic groups' experiences in Berlin using a household survey, statistical and earth observation data. Our approach (1) quantifies perceived heat stress across USTs, considering characteristics such as, age, income, vegetation cover and shade, (2) characterises social dimensions of USTs to enhance their application in climate adaptation and (3) benefits from the synergistic disciplinary approach of the urbisphere project with rich social and physical datasets. Although heat stress exposure is higher in the inner-city ring, we find that a higher percentage of vulnerable groups in the outer city (6 to 18 km from the city centre), where 78 % of Berlin's elderly live. We underscore the need for attention in future adaptation plans based on the USTs, human vulnerability profile and adaptive capacities. For example, in densely spaced building blocks 67 % of respondents perceived high heat stress and fractions of vegetation and shade are comparatively very low. The method and findings can inform future adaptation strategies of other cities to consider different profiles of vulnerability and adaptive capacities within and between USTs.
- Article
(6670 KB) - Full-text XML
-
Supplement
(865 KB) - BibTeX
- EndNote


Globally, all regions are increasingly affected by climate change (IPCC, 2023). Heat stress is a key challenge impacting urban residents, as about 56.2 % of the global population lives in urban areas, and this is projected to increase to 68.4 % by 2050 (United Nations, 2022). While human vulnerability is highest and resilience lowest in rapidly growing urban areas in developing countries (Birkmann et al., 2016), heatwaves impact cities globally (e.g. Europe heat waves 2003; Schär et al., 2004), highlighting a general need for enhanced resilience. Global increases in near-surface air temperature are projected to be 2 °C by 2050 (Rosenzweig et al., 2018) without immediate reduction in GHG emissions (Gallardo et al., 2022). Cities are potentially subject to twice the levels of heat stress as compared to their rural surroundings under all representative concentration pathway (RCP) scenarios by 2050 (Wouters, 2017). Compound events are likely with urbanisation and frequent extreme climate events resulting in adverse consequences (Babiker et al., 2022). Heat stress impacts urban residents by adding health burdens, notably cardiovascular, respiratory (Augustin et al., 2025) and vector-borne disease (e.g. dengue fever and malaria; Song et al., 2016; Li et al., 2015) and can lead to negative impact on self-rated health (von Szombathely et al., 2019) and decreasing work productivity (Park et al., 2015). Heat-related mortality, a key climate change risk to human health (Vicedo-Cabrera et al., 2021; Lüthi et al., 2023), is exacerbated in urban areas as global and regional temperature extremes are intensified by the urban heat island effect (Gallardo et al., 2022). Heat risk for individuals depends on exposure, vulnerability and adaptive capacities (Adelekan et al., 2022). Exposure and vulnerability are framed differently (IPCC, 2018), with exposure defined as the presence of something valuable that may be adversely affected by the impacts of a hazard, whereas vulnerability is “the propensity or predisposition to be adversely affected” and encompasses the susceptibility to being negatively impacted and the inability to cope and adapt to hazards (IPCC, 2022). Exposure to hazards can be reduced through altering urban growth and managing physical hazards, while vulnerability can be reduced by promoting inclusive development and addressing inequality (Adelekan et al., 2022).
Urban and spatial planning primarily focuses on physical urban typologies and phenomena when dealing with climatic risks and adaptation issues (Turek-Hankins et al., 2021; Wendnagel-Beck et al., 2021; Marando et al., 2022), but the different levels of human vulnerability and adaptive capacities of residents are insufficiently addressed (Turek-Hankins et al., 2021). Despite susceptible groups' coping and adaptive capacities being included in some climate risk assessment frameworks (Willroth et al., 2012; Birkmann et al., 2013; Kunz-Plapp et al., 2016; Feldmeyer et al., 2017; Jamshed et al., 2017; Feldmeyer et al., 2019; Zuhra et al., 2019; Sun et al., 2021; Iqbal et al., 2022), this knowledge is often unconnected in practice (e.g. in climate adaptation plans; Hannemann et al., 2023). There are few published heat adaptation plans implemented with marginalised and vulnerable populations as targets (Eldesoky et al., 2022). Evidence of heat adaptation plans addressing populations living in lower-income neighbourhoods or being homeless is limited. Examples include planting vegetation in prioritised vulnerable areas with less access to green spaces (e.g. Aburrá Valley city's Mayor's Office, 2021), creating shady, cool places outdoors (e.g. awnings/tents) for homeless people and distributing water bottles (e.g. counselling centres and day centres; Bochum Department of Social Affairs, 2022). “Heat equity” involves, for example, planning a city-wide network of connected cool areas (parks, pools, walkways) in Paris, France (“Cities must protect people from extreme heat”, 2021). As the socio-demographic and economic aspects of exposed people determine human vulnerability, they are also key when trying to understand and respond to heat-related risk in cities. Thus, urban planning responses to climate change need to better account for dynamics and patterns of exposure, vulnerability and the adaptive capacities of people.
1.1 Urban form classification – combining urban morphology and heat characteristics
Many studies illustrate the impacts of urbanisation on heat stress (Stewart and Oke, 2012; Lemonsu et al., 2015; Narocki, 2021; Tollefson, 2021; Tuholske et al., 2021). With greater urbanisation, both urban heat island intensity (Stewart et al., 2021) and energy consumption (Voogt and Oke, 2003; Stewart et al., 2021) increase. However, urbanisation also plays a pivotal role in reducing the impacts through climate resilient development (Adelekan et al., 2022) through numerous factors (e.g. vegetation, materials, anthropogenic heat flux), with urban morphology being one of the strongest influences on urban heat island intensity (Oke, 1981; Grimmond, 2007; Oke et al., 2017; Gallardo et al., 2022). Tall dense buildings can trap and reradiate longwave radiation, slowing cooling after sunset (cf. rural areas) and reducing wind speed within the urban canopy (Grimmond, 2007; Oke et al., 2017). Building materials store large amounts of heat during the day, providing a large source of energy to be released at night (Grimmond and Oke, 1999; Oke et al., 2017). By contrast, open vegetated areas can cool more rapidly at night, facilitating thermal circulations relative to warmer areas and therefore reducing heat stress. Human activities in domestic, commercial and industrial areas or traffic-related heat sources act as a source of anthropogenic heat, contributing to local atmospheric warming (Schwingshackl et al., 2024). Understanding the impact of urban form and function are important for a wide range of applications in many sectors (e.g. Barlow et al., 2017), including infrastructure and landscape planning. Form, characterised by many parameters (e.g. sky view factor, vegetation height, floor area ratio and building aspect ratio; Yang et al., 2021; Liu et al., 2023; Hertwig et al., 2025), influences energy exchange (e.g. Zhou et al., 2011; Oke et al., 2017; Yue et al., 2019; Fenner et al., 2024). These spatial differences are fundamental to creating exposure differences, which combined with disadvantaged urban dwellers can exacerbate vulnerabilities (Adelekan et al., 2022).
To characterise neighbourhoods in a globally comparable way for urban heat island intensity, Stewart and Oke (2012) propose local climate zones (LCZs) that are described by several parameters, including building density, sky view factor and impervious fraction. Given the ease of obtaining many of the parameters from satellite data (e.g. Mitraka et al., 2015; Zhu et al., 2018; Oliveira et al., 2020) and air temperature observations via crowd-sourcing, many urban climate studies have been undertaken, e.g. in Berlin (Fenner et al., 2017) and elsewhere (Bechtel et al., 2015; Verdonck et al., 2018; Bechtel et al., 2019; Ren et al., 2019; Aslam et al., 2022). Planners are using LCZs quite widely (Klopfer, 2023) with maps for cities becoming globally available (e.g. Demuzere et al., 2022). However, using LCZ maps for climate adaptation planning still requires local expertise (Klopfer, 2023). Additionally, the LCZ classes may not be globally representative, with parts of a city being difficult to classify (Bechtel et al., 2015; Zhu et al., 2018) using the original classes.
City planning departments have combined building metrics (e.g. functional use, number of storeys, building age) to identify urban structure types (USTs) in their regions (Senatsverwaltung für Stadtentwicklung und Umwelt, 2014; Senatsverwaltung für Stadtentwicklung und Wohnen, 2021; LUBW Landesanstalt für Umwelt, Messungen und Naturschutz Baden-Württemberg, 2014). These can identify inter- and intra-urban variations in both physical and social urban structures (Wendnagel-Beck et al., 2021). In climate change studies, USTs have been linked to climate hazards such as heat stress and are used for climate adaptation planning in some cities (LUBW Landesanstalt für Umwelt, Messungen und Naturschutz Baden-Württemberg, 2014; Senatsverwaltung für Stadtentwicklung, Bauen und Wohnen, 2023). Whilst USTs require expert input and detailed data to be developed (Klopfer, 2023), LCZs are intended to provide “standard” descriptions of parts of cities so may have greater utility in multi-city large-scale applications (Bechtel et al., 2015; Zhu et al., 2018). Nevertheless, both are applicable in a particular city and region, and can be used in city planning and climate adaptation.
1.2 Urban structure types (USTs): considering physical and socio-economic factors to assess cities for climate adaptation
USTs already form an important basis of adaptation plans for heat stress in some German cities, with more being currently developed (Senatsverwaltung für Stadtentwicklung und Umwelt, 2014; LUBW Landesanstalt für Umwelt, Messungen und Naturschutz Baden-Württemberg, 2014; Downes et al., 2024). For example, Karlsruhe and Berlin consider USTs in their climate adaptation plans and strategies (Senatsverwaltung für Stadtentwicklung und Umwelt, 2014; LUBW Landesanstalt für Umwelt, Messungen und Naturschutz Baden-Württemberg, 2014). The methodology has three steps, as outlined by Wendnagel-Beck et al. (2021): (1) characterise cities through USTs, (2) identify climate hotspots that require adaptation and (3) develop adaptation measures for different USTs. Many applications have characterised USTs using only physical indicators (e.g. building age, building height, building use, building geometry and open space characteristics). In the identification of climate hotspots, sometimes demographic aspects (e.g. elderly, children and population density) are captured, for example, as done in Karlsruhe (LUBW Landesanstalt für Umwelt, Messungen und Naturschutz Baden-Württemberg, 2014). However, some key socio-economic and behavioural aspects like income, risk perception and experience and willingness to adapt are not investigated fully (Wendnagel-Beck et al., 2021).
USTs are used in urban monitoring, for instance, in the assessment of peri-urbanisation transitions (Downes et al., 2024) and amount of residential greenery (Battisti et al., 2019). Climate assessments using USTs have been undertaken to assess influential factors on land surface temperature (LST). In Berlin, both building height and plan area plus impervious area are identified (Klopfer, 2023), while in the case of Munich, the UST distance from the city centre is considered important (Heldens et al., 2013). In Leipzig, indoor and outdoor temperatures are compared using USTs (Franck et al., 2013) and Dresden's guidebook on adapting to climate change uses USTs as an indicator for settlement heat sensitivity (Wende, 2014).
However, most studies using USTs focus on physical structures and lack socio-economic and vulnerable population information (e.g. elderly, low income and/or otherwise disadvantaged groups). Impacts of heat, heat stress perception of UST dwellers (e.g. detached houses, block development, row houses, large housing estates) and their socio-economic attributes (e.g. age, income) are insufficiently explored and integrated into adaptation strategies, despite this being crucial information for effective people-centred adaptation. Berlin's Urban Development Plan Climate 2.0 (Senatsverwaltung für Stadtentwicklung, Bauen und Wohnen, 2023) identifies cold air drainage and climate function of open spaces, but less information is available on the population's socio-economic characteristics, heat stress perception, behaviour patterns and adaptation responses. To address these aspects, a household survey (Sect. 2.2) is undertaken in Berlin to explore the following.
- i.
Does perceived heat stress change from the centre of the urban region towards the periphery?
- ii.
How does measured thermal comfort correspond to perceived heat stress by residents?
- iii.
How does perceived heat stress differ within a UST and amongst various USTs?
- iv.
Are inter- or intra-UST human vulnerability characteristics and adaptive capacity differences significant?
- v.
How does perceived heat stress differ amongst various socio-economic groups and vulnerability factors?
- vi.
How can this new knowledge be applied in future climate change adaptation strategies of urban regions?
The ERC urbisphere project aims to characterise intra-city variability in a consistent manner globally. To do this, a simple ring structure is developed based on building density and other parameters (Fenner et al., 2024) for Berlin (Sect. 2.1). Here, we capture similarities and differences in perceived heat, socio-economic structure and adaptive capacities across USTs and city rings and explore the correlation between them.
2.1 Berlin study area
Deutschländer et al. (2010) found Berlin residents are experiencing increasing heat stress from rising regional temperatures, intensified by the urban heat island effect, linked to a 1 °C increase in mean annual air temperature between 1971 and 2000. Between 1967 and 2008 the average number of tropical nights (nocturnal air temperature > 20 °C) increased by five in the inner city (Deutschländer et al., 2010). By 2050, the average number of very hot days (maximum temperature > 30 °C) is expected to be 25 annually (Deutschländer et al., 2010). With Berlin's continental climate exacerbating summertime heat, city planning and environmental departments are increasingly keen to enhance their adaptability potential (Senatsverwaltung für Stadtentwicklung, Bauen und Wohnen, 2023).
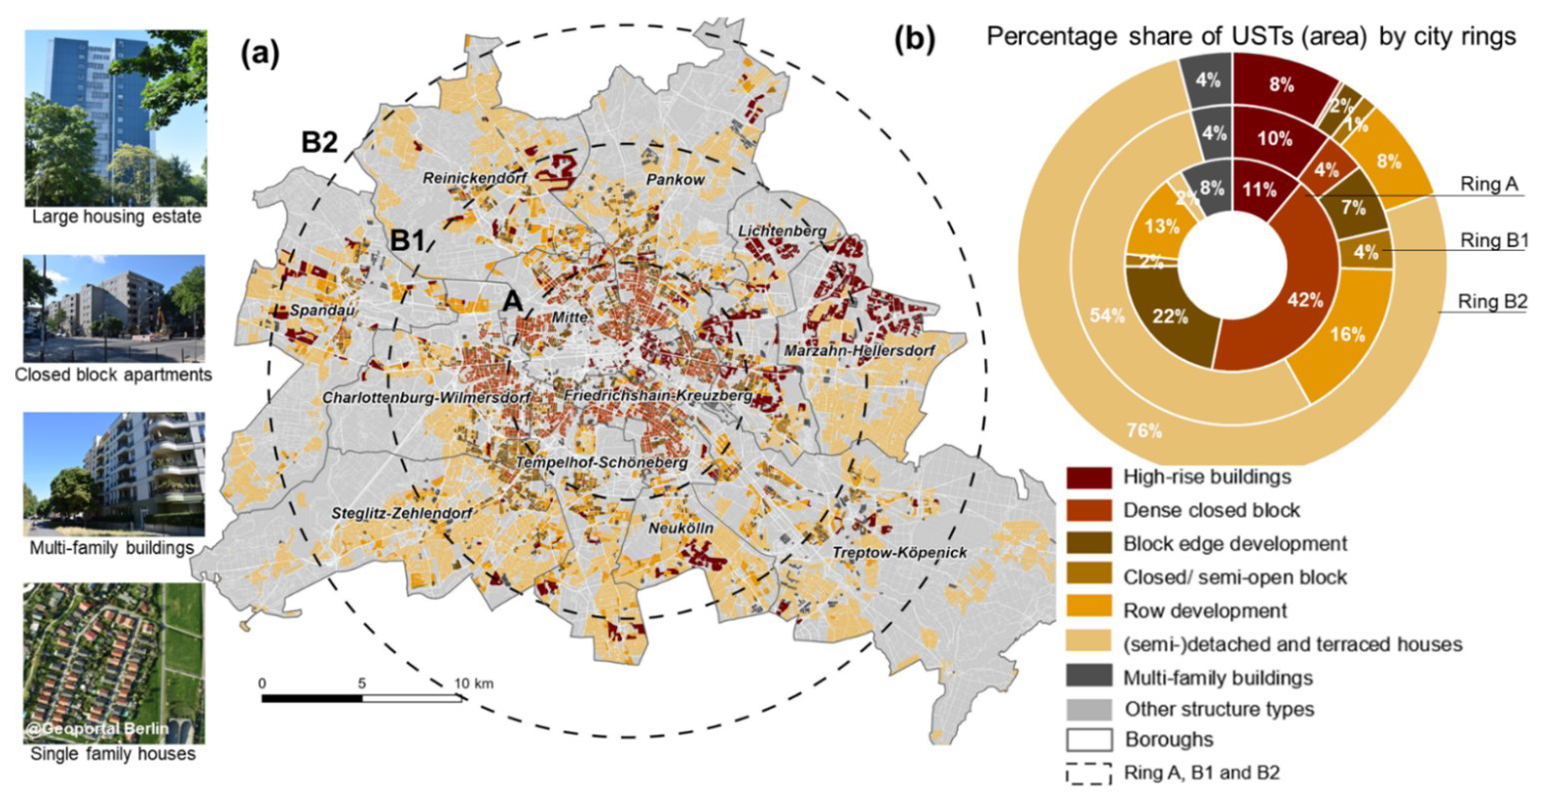
Figure 1Berlin study area: (a) inner (A) and outer (B1, B2) city rings and Senatsverwaltung für Stadtentwicklung und Wohnen (2021) urban structure types (USTs, Table 1) with example photos and boroughs labelled and (b) plan area in percent of USTs of each city ring (Photo source: Marvin Ravan).
The urbisphere-Berlin analysis of form (building area fraction, vegetation area fraction and building volume) and function data (population density, anthropogenic heat fluxes) identified an inner (radius 6 km) and outer (18 km) city ring (Fenner et al., 2024, their Fig. 2). This first-order analysis gives three zones (inner and outer city, rural) for the interdisciplinary team (meteorology, remote sensing and urban/spatial planning) to have a simplified, comparative and replicable approach between cities (Fenner et al., 2024). Central to this is providing a complementary approach between both urban climate and planning studies. In this context, classifications and analysis schemes of different research communities are applied and linked. For our analysis, we split the outer ring at 12 km, giving three urban rings (hereafter A, B1, B2) from inner to outer Berlin (Fig. 1a).
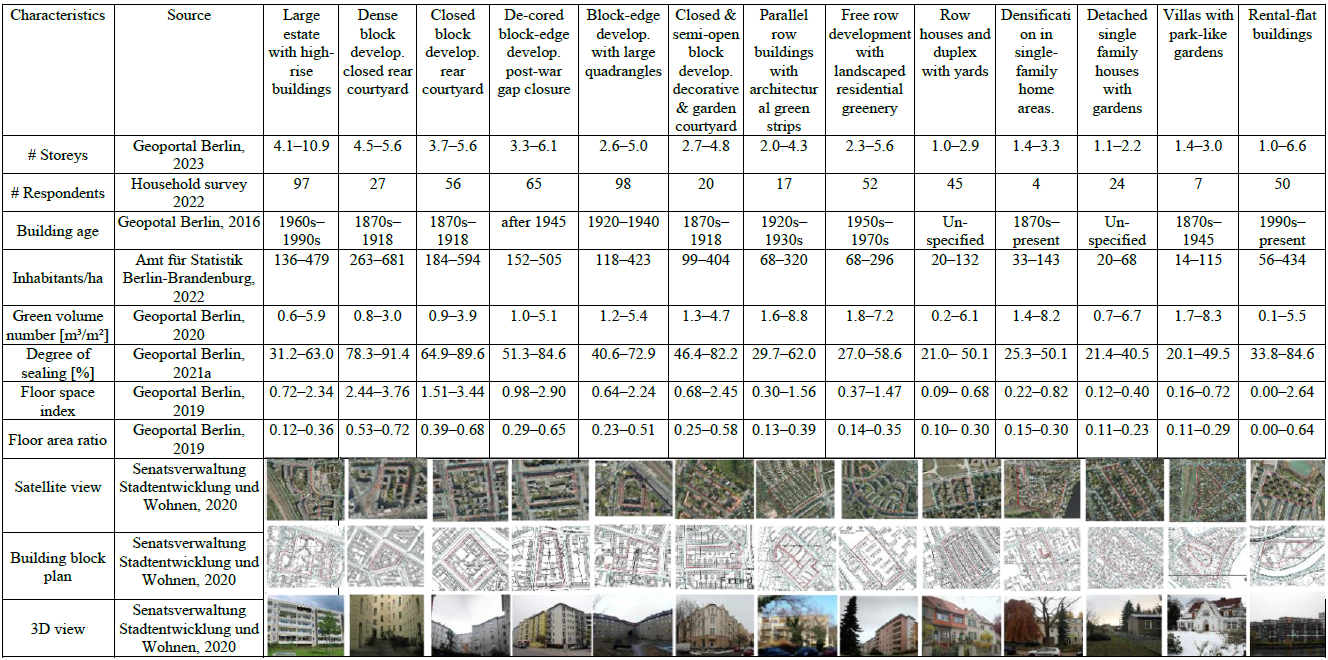
Table 1Berlin's urban structure types (USTs) (Senatsverwaltung für Stadtentwicklung und Wohnen, 2021), new UST classes and short name use. Table A1 gives basis for the new classes.
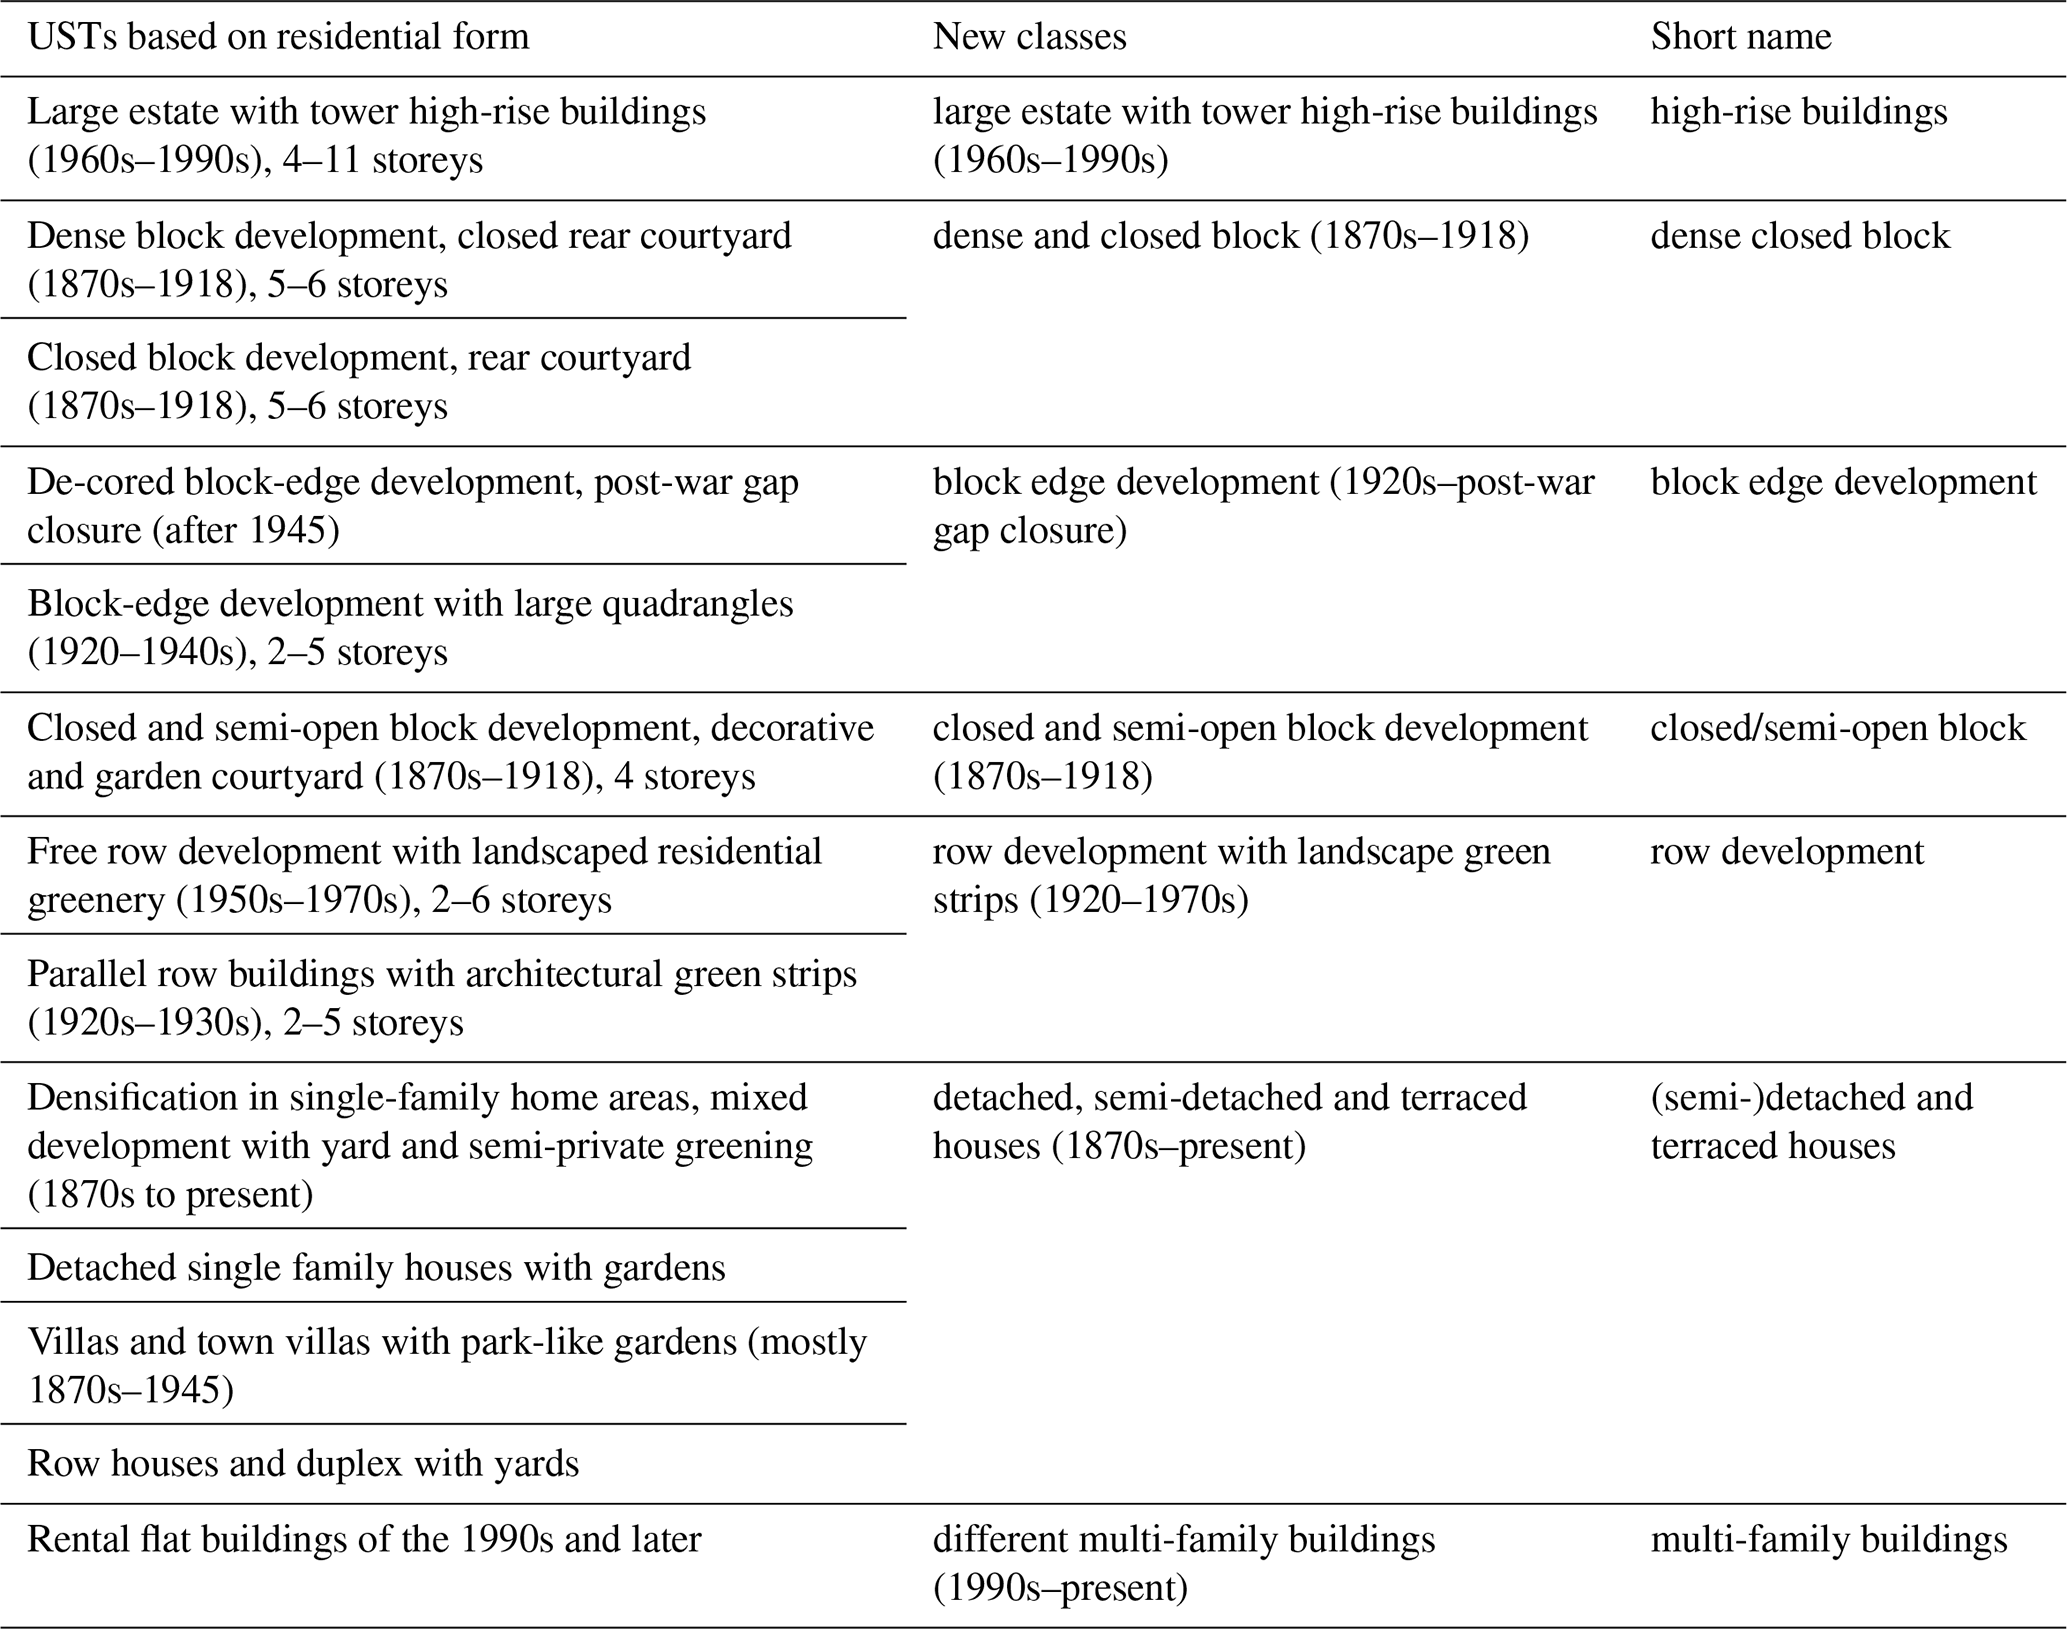
The Senatsverwaltung für Stadtentwicklung und Wohnen (2021) identified 13 residential USTs (Table 1) for Berlin, with some patterns arising from the east–west separation (post-World War II period), when Berlin had two city centres. To reduce these 13 classes to 7 (Fig. 1a, Table 1), we compare socio-demographic and physical datasets (e.g. population density, building morphology, number of storeys, building age, green volume, degree of sealing, Table A1). In ring A, there is a larger proportion (42 %) of dense and close block USTs than in either rings B1 or B2 (Fig. 1b). Block edge developments are also comparatively higher in ring A. In rings B1 and B2 (54 % and 75 %, respectively), (semi-)detached and terraced houses dominate. In rings A and B1, row developments with green landscape strips are also common (13 % and 16 %, respectively). Whilst large estate developments with high-rise buildings occur in all three rings, the proportion decreases with increasing distance from the centre (A: 11 %, B1: 10 %, B2: 8 %).
2.2 Household survey and other data sources
In October 2022, people at 10 000 residential addresses in 39 of the 542 PLRs (“Planungsräume” or planning areas) (Landesamt für Bürger- und Ordnungsangelegenheiten, 2022) were invited to participate in our household survey (Table 2). PLRs were selected by stratifying across multiple criteria like heat exposure (Senatsverwaltung für Stadtentwicklung und Umwelt, 2014), population density and representation of different age groups (Amt für Statistik Berlin-Brandenburg, 2022), unemployment levels (Senatsverwaltung für Stadtentwicklung und Wohnen Berlin, 2019) and heat mortality rate (Schuster et al., 2014) to capture a diverse group of people and their behaviour. The 10 000 posted invitations included a QR code to access the survey online (Evasys GmbH, 2021). To enhance demographic inclusiveness, the letter stated if a respondent had technological constraints, a printed questionnaire could be requested by phone, which were posted in response to received calls. Overall, around 27.2 % (N = 155) of respondents are classed as “elderly” (65 and older) (Fig. A1). With 565 responses received, only one PLR (No. 39, 3 responses) had insufficient responses for analysis.
Table 2Survey questions analysed in this study (original survey number, Q No.) with number of respondents (N); the number as a percentage of PLR respondents or USTs (Respond.). Data availability given in Iqbal et al. (2024).
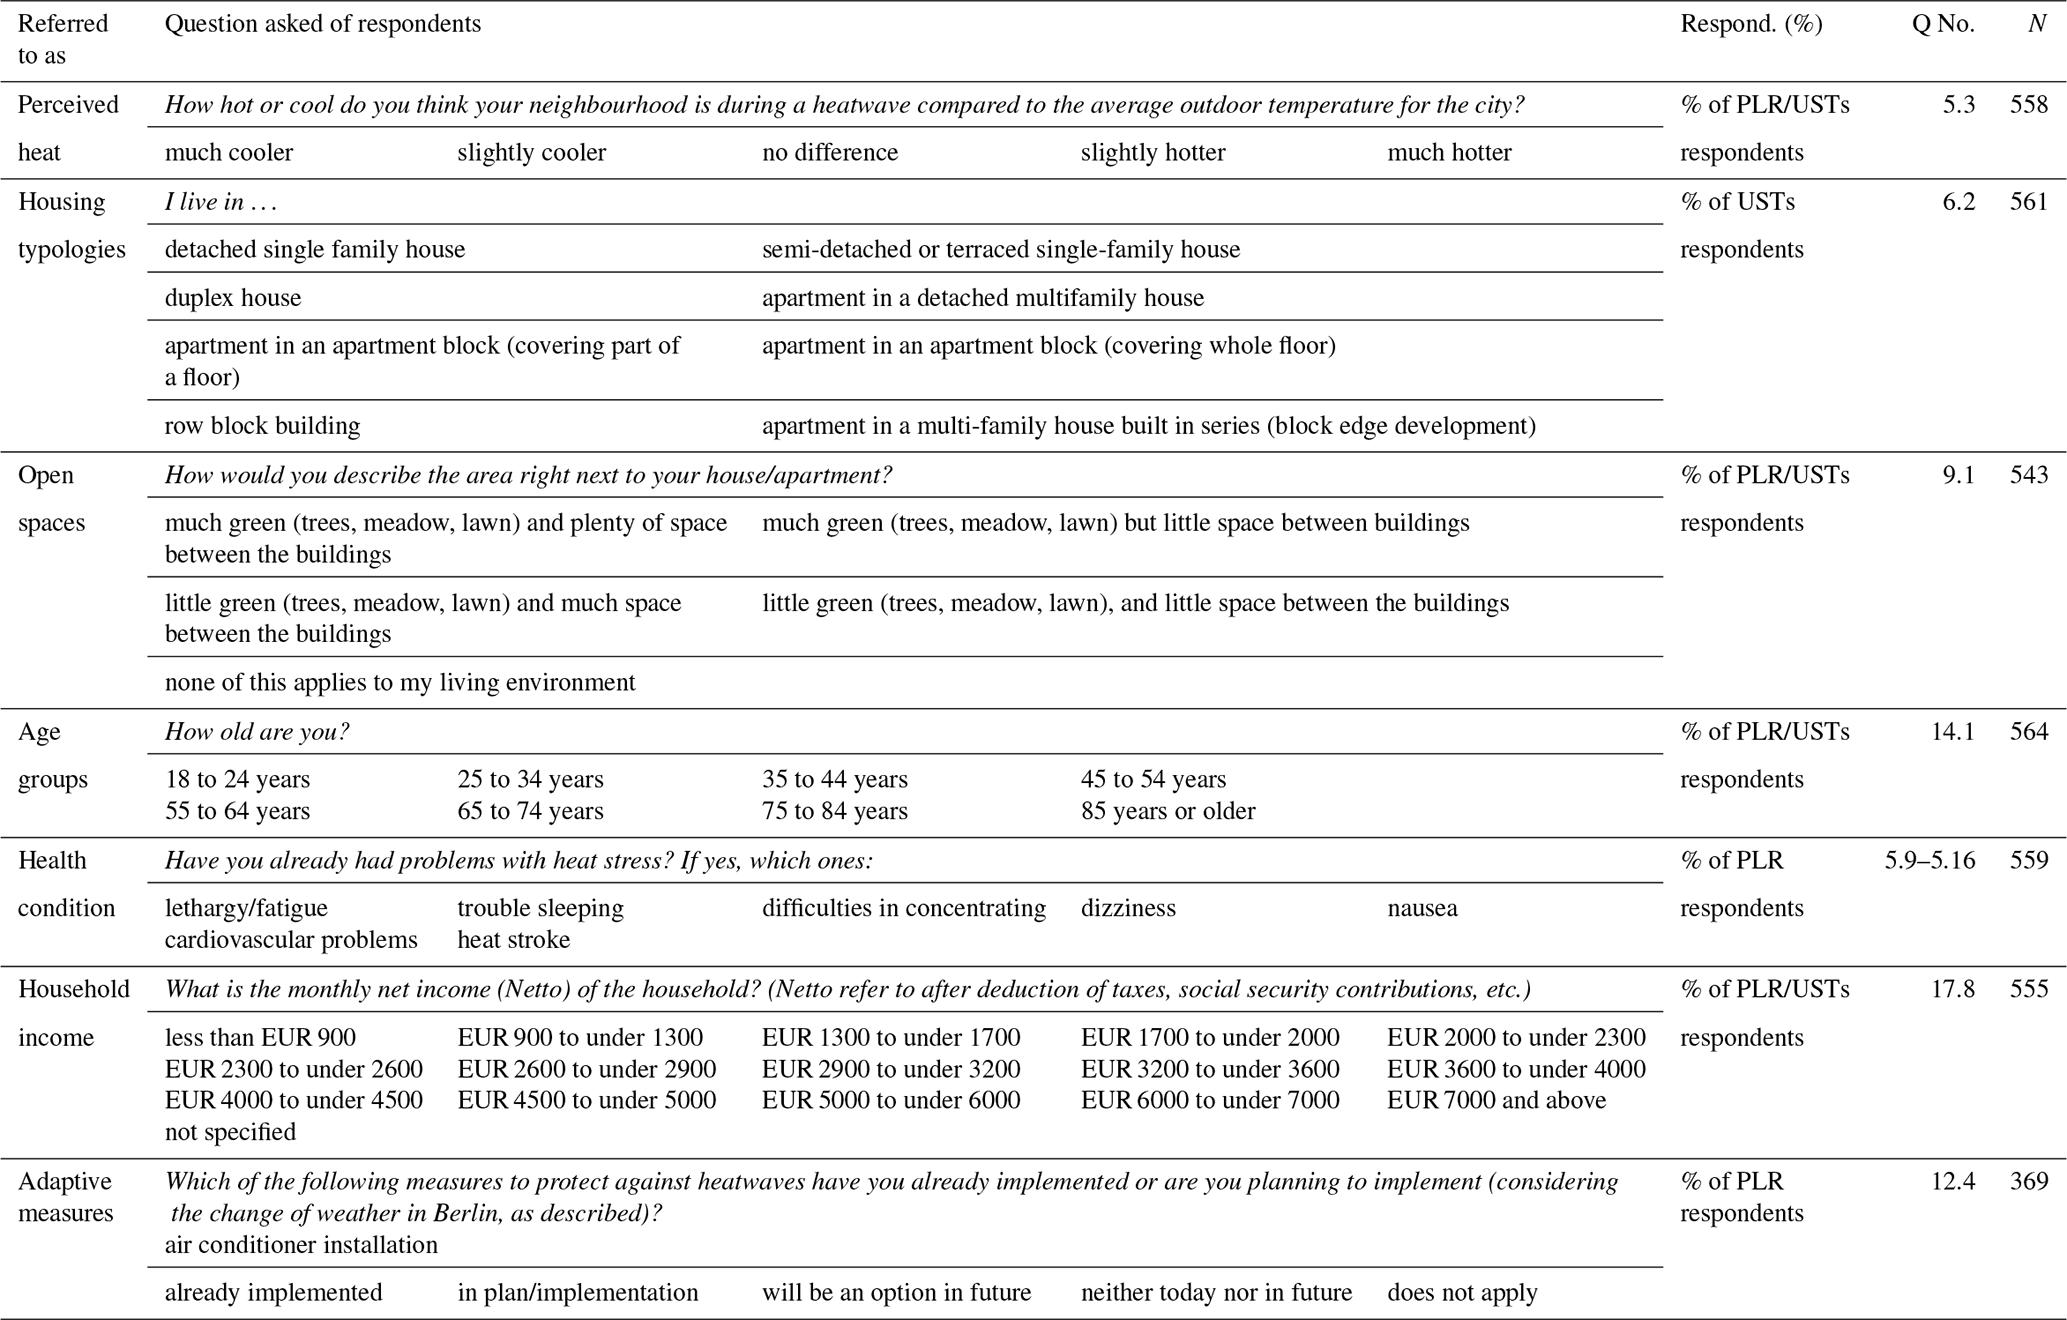
The survey has questions on household heat stress perception and experience, living conditions (e.g. building information, green space access), mobility, early warning system, coping measures, adaptation options and socio-demographic characteristics such as age, income, education and work. Given the focus of this paper, we utilise seven survey topics related to perceived heat and physical and socio-economic factors of people living in different USTs as presented in Table 2.
Table 3Data compared to survey results. The thermal discomfort index (TDI) uses physiological equivalent temperature (PET) values (Höppe, 1999) calculated for the vulnerable population the number of people by age group is considered. Summer months June, July and August (JJA). Data availability given in Iqbal et al. (2024).
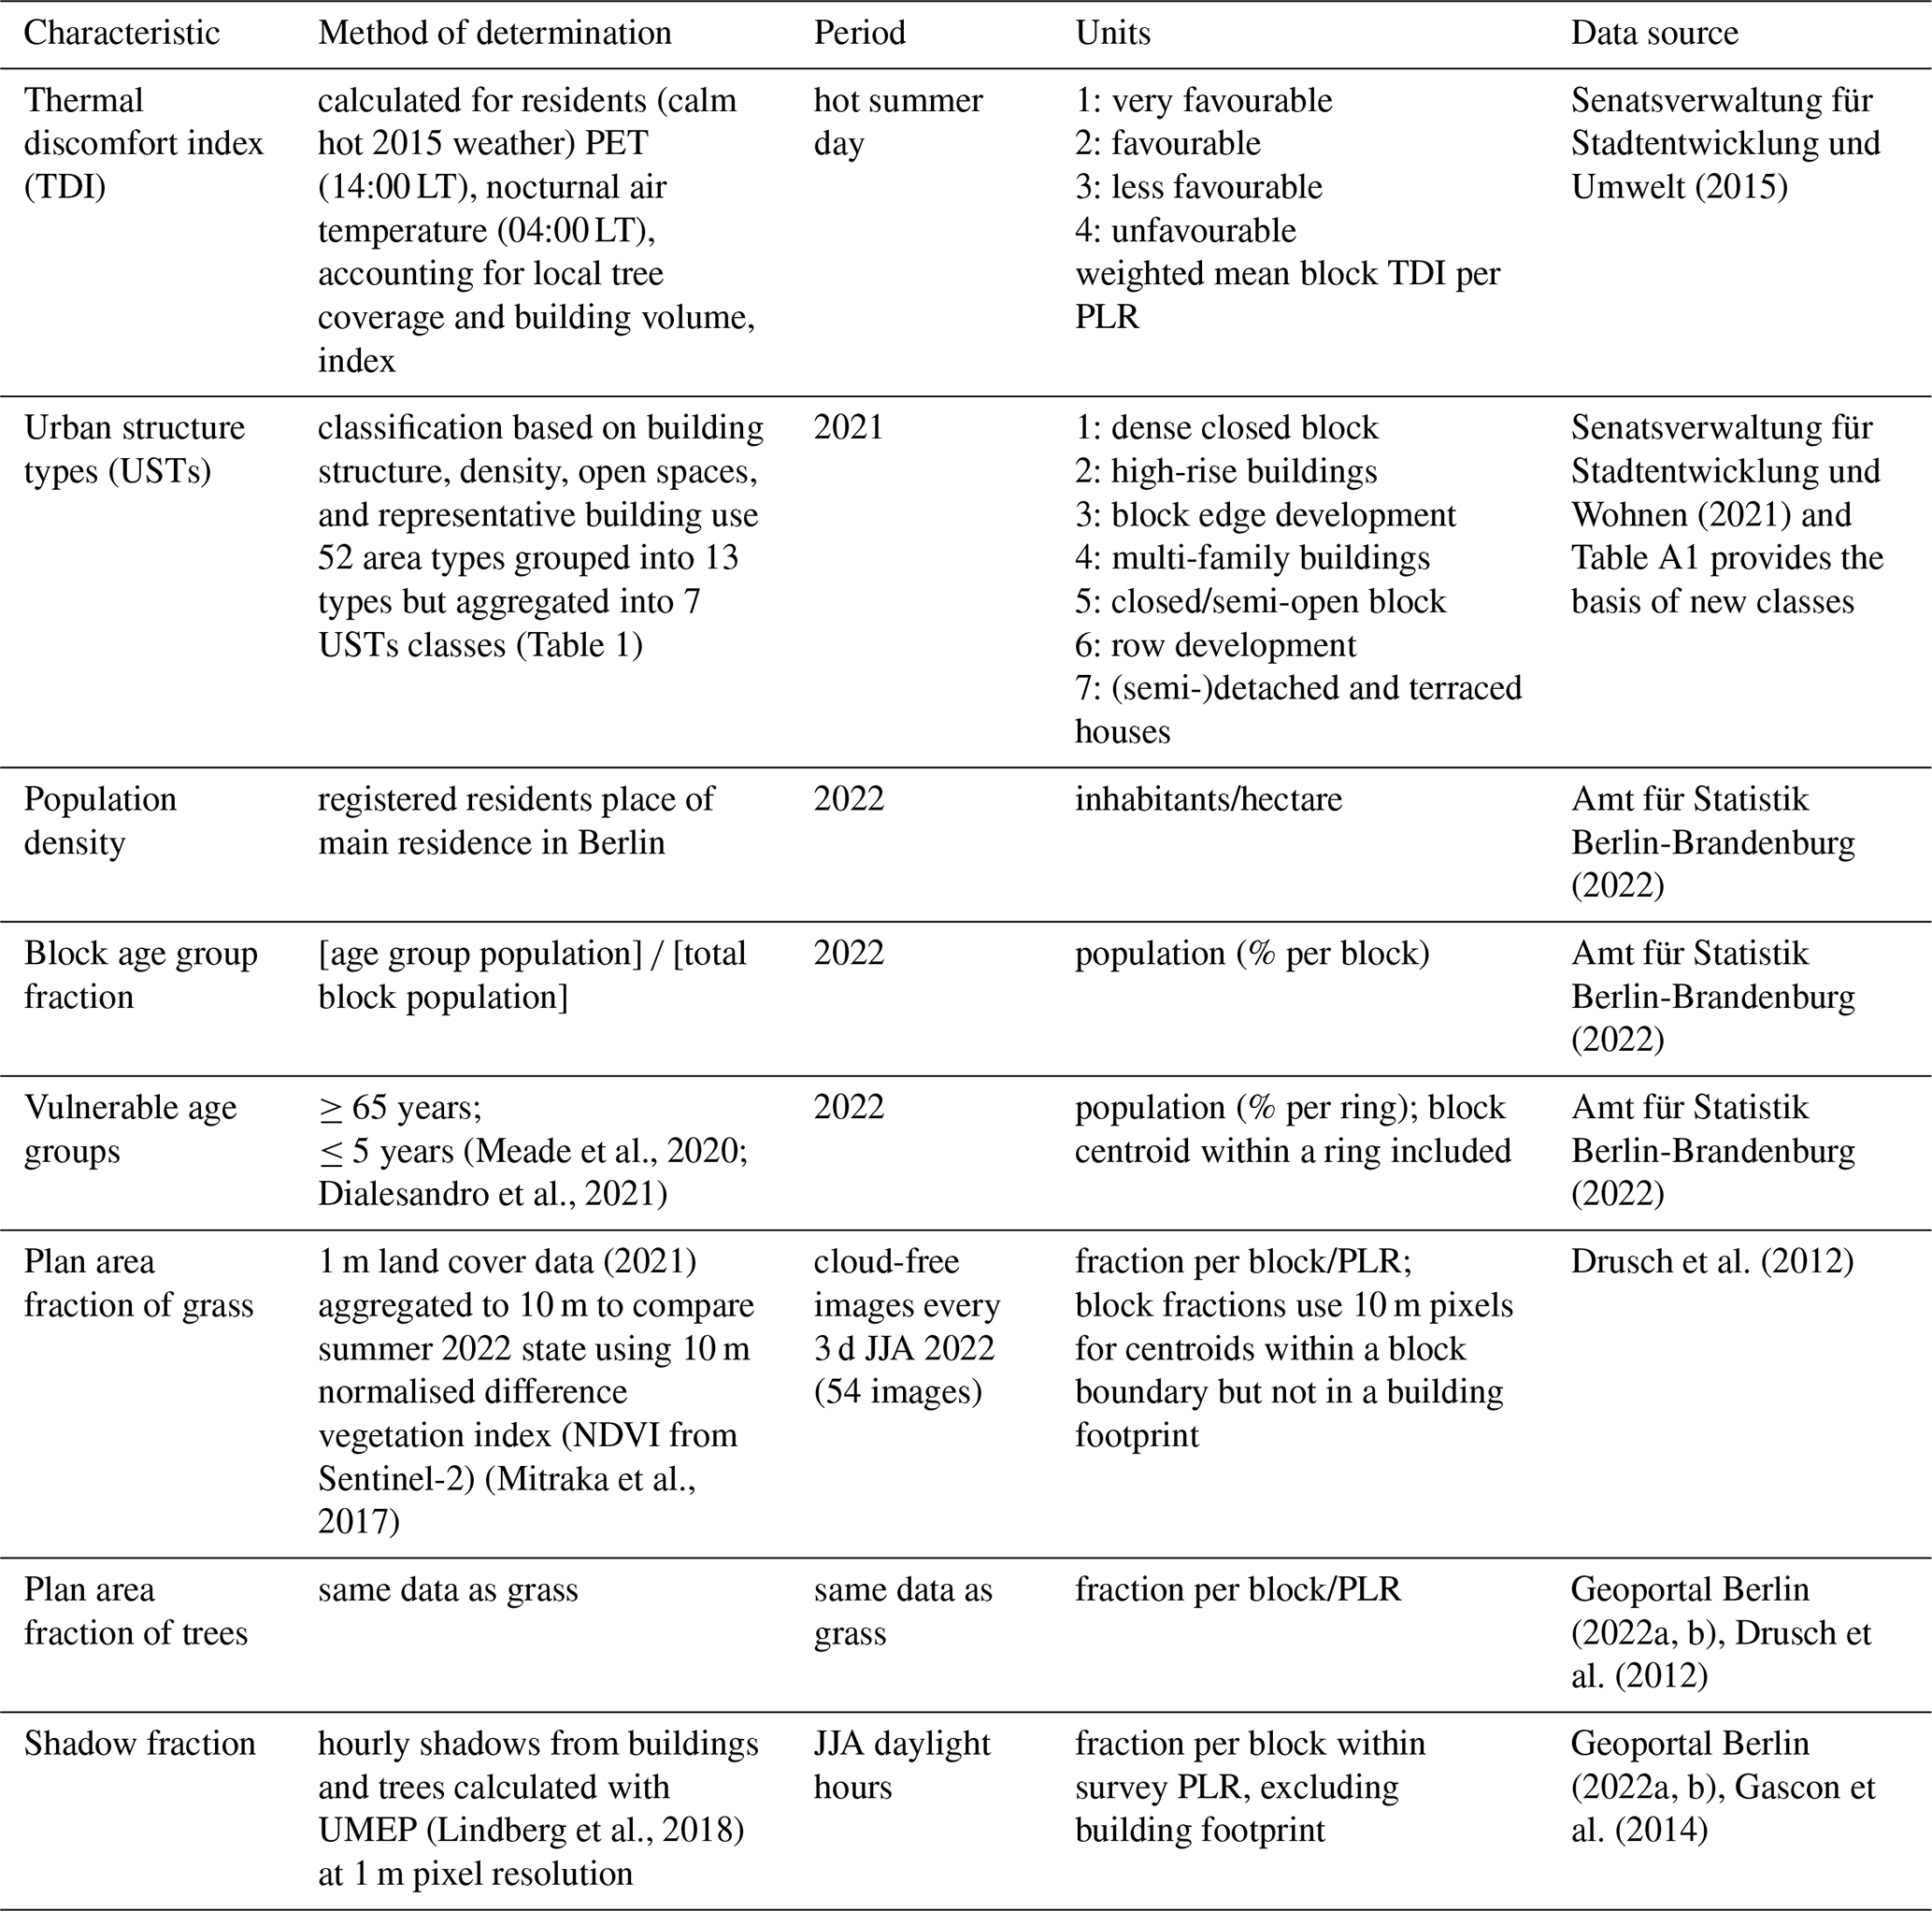
The household survey perceived heat stress (percentage of people who said slightly hotter to much hotter in their neighbourhood, Table 2) is compared to the Senate of Berlin's thermal discomfort index (TDI, Table 3). The Senate of Berlin's Urban Climate Planning Information map (Planungshinweiskarte Stadtklima (PHK)) is the TDI source and their basis for considering climate concerns in urban planning (Senatsverwaltung für Stadtentwicklung und Umwelt, 2015). The PHK assesses thermal situations for meteorological conditions (e.g. daytime (14:00 LT) physiological equivalent temperature, PET, Höppe, 1999, and nocturnal (04:00 LT) air temperature) and local characteristics (e.g. plan area of trees (%) and building volume density in units of m3 ha−1) to assign each block to one of four TDI classes (Table 3) (Senatsverwaltung für Stadtentwicklung und Umwelt, 2015). We translate the TDI class to a value (Table 3), allowing aggregation to PLR scale by an area-weighted mean. Other statistical and remote sensing data sources used in our analyses are indicated in Table 3, with all relevant dataset details.
2.3 Statistical and spatial analysis
In this study, we use overlay analysis and geospatial, descriptive and inferential statistics to answer our research questions. The weighted mean thermal discomfort index of PLRs (Table 3) is compared with perceived heat (Table 2) from the survey using Pearson correlation (Sect. 3.1). To understand what may influence perceived heat stress, we calculate Spearman correlations using human vulnerability data (e.g. age and income) from the survey (Sect. 3.3). Adaptation metrics (e.g. vegetation and shadow fractions) for PLRs are compared with perceived heat using Pearson correlation (Sect. 3.4). Primarily, differences in perceived heat stress are explained by using the respondents USTs (Sect. 3.2). Metric distributions across and within USTs are presented in violin and box plots (Sect. 3.1-3.4). Spearman correlation is used to assess the link between USTs and human vulnerability (age and income) (Sect. 3.3) and Pearson correlation is used to compute the link between USTs, vegetation and shade indicators (Sect. 3.4). These statistics are calculated using the UST TDIs with numbers assigned as indicated in Table 3.
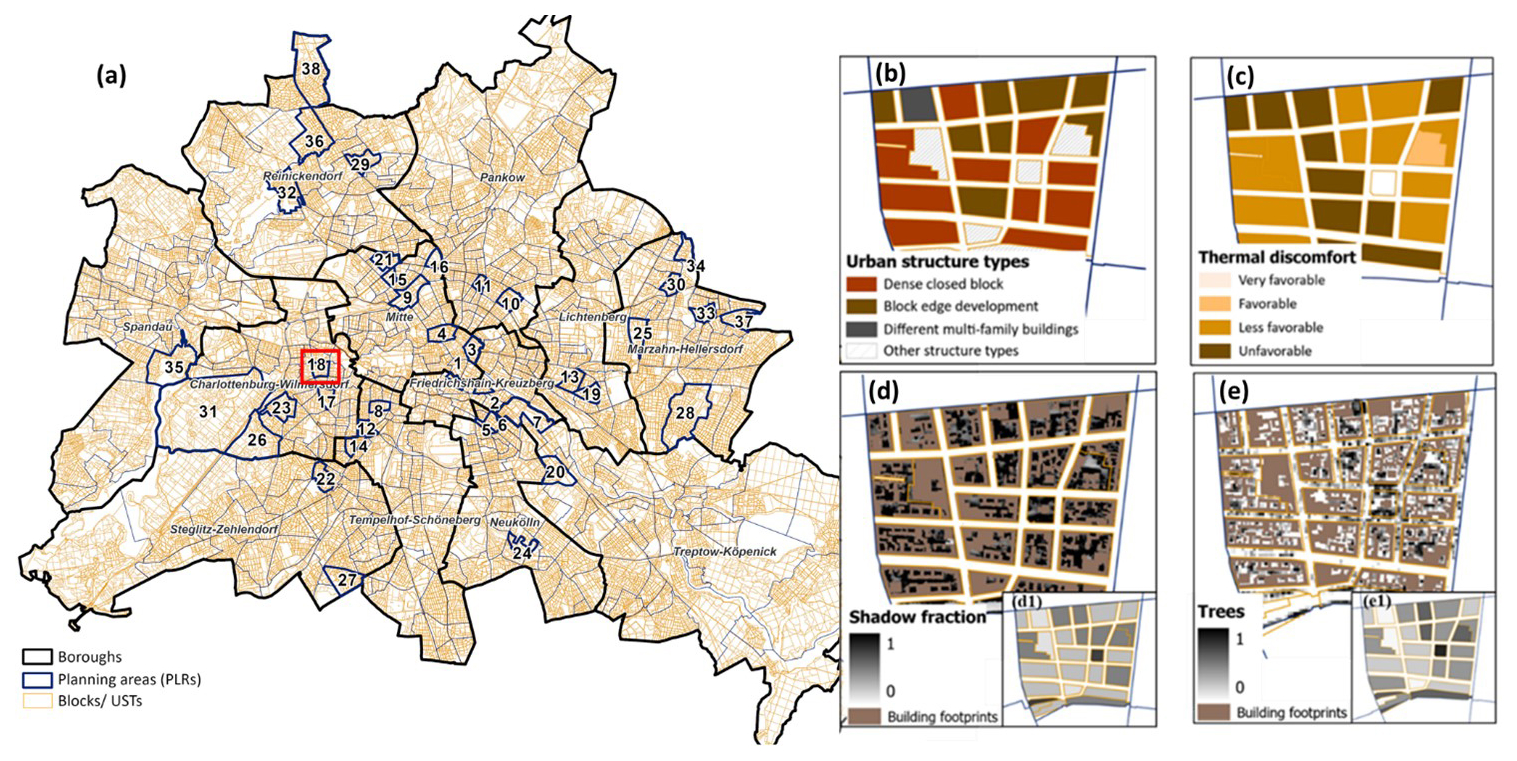
Figure 2Berlin (a) administrative boundaries showing city (outer line), boroughs (grey), PLRs (blue, planning areas) and those selected for the household survey (numbered 1 to 38), blocks (orange) and PLR 18 (red box) for which (b) blocks and urban structure types (USTs, colour) are shown in PLR (black boundary), (c) thermal discomfort index (colour) and (d) shadow fraction (0 = none, 1 = maximum) 1 m pixel values and (d1) block mean, and (e) plan area fraction of trees (0 none to 1 maximum) and (e1) block mean.
Analyses use different administrative spatial scales, namely (Fig. 2) boroughs, PLRs (planning areas) and blocks. The block-scale UST (Fig. 2b) data (e.g. grass, trees and shadow fractions, Table 3) involves aggregating the available raster data (Fig. 2). Analyses include fraction per block/PLR (grass, trees and shade) and percentage (%) per block (vulnerable age groups) and ring. A flowchart linking the data sources and analyses is presented in Fig. A2.
3.1 Perceived heat stress in the 38 PLRs and comparison with thermal conditions
To assess perceived heat stress, survey participants were asked “How hot or cool do you think your neighbourhood is during a heatwave compared to the average outdoor temperature for the city?” (Table 2, Q5.3). Across the city, a greater proportion of respondents per PLR living in the city centre (ring A, Fig. 1) perceive more heat stress in their neighbourhood than those residing further out (Fig. 3). Overall, the perceived heat (Table 2, Q5.3) and thermal discomfort index (Table 3, TDI) is higher in the ring A PLRs than those in rings B1 and B2. In ring A PLRs (e.g. the boroughs of Mitte and Friedrichshain–Kreuzberg, Fig. 3a) 54 % of residents responded that their neighbourhood is slightly hotter to much hotter compared to 47 % and 30 % in rings B1 and B2, respectively (Fig. 3b). The differences in perceived heat between rings vary with distance from the city centre (Fig. 3c). However, some PLRs differ from this pattern, like those located in the western borough of Charlottenburg–Wilmersdorf in ring B1 (Fig. 3a, e.g. PLR 17, Fig. 2) and in the eastern borough of Marzahn–Hellersdorf in ring B2 (Fig. 3a, PLR 34, 37, Fig. 2) where 83 % and 50 % of respondents (Fig. 3b), respectively, perceive their neighbourhood to be hotter than the city average temperature during a heat wave event (Table 2, Q5.3).
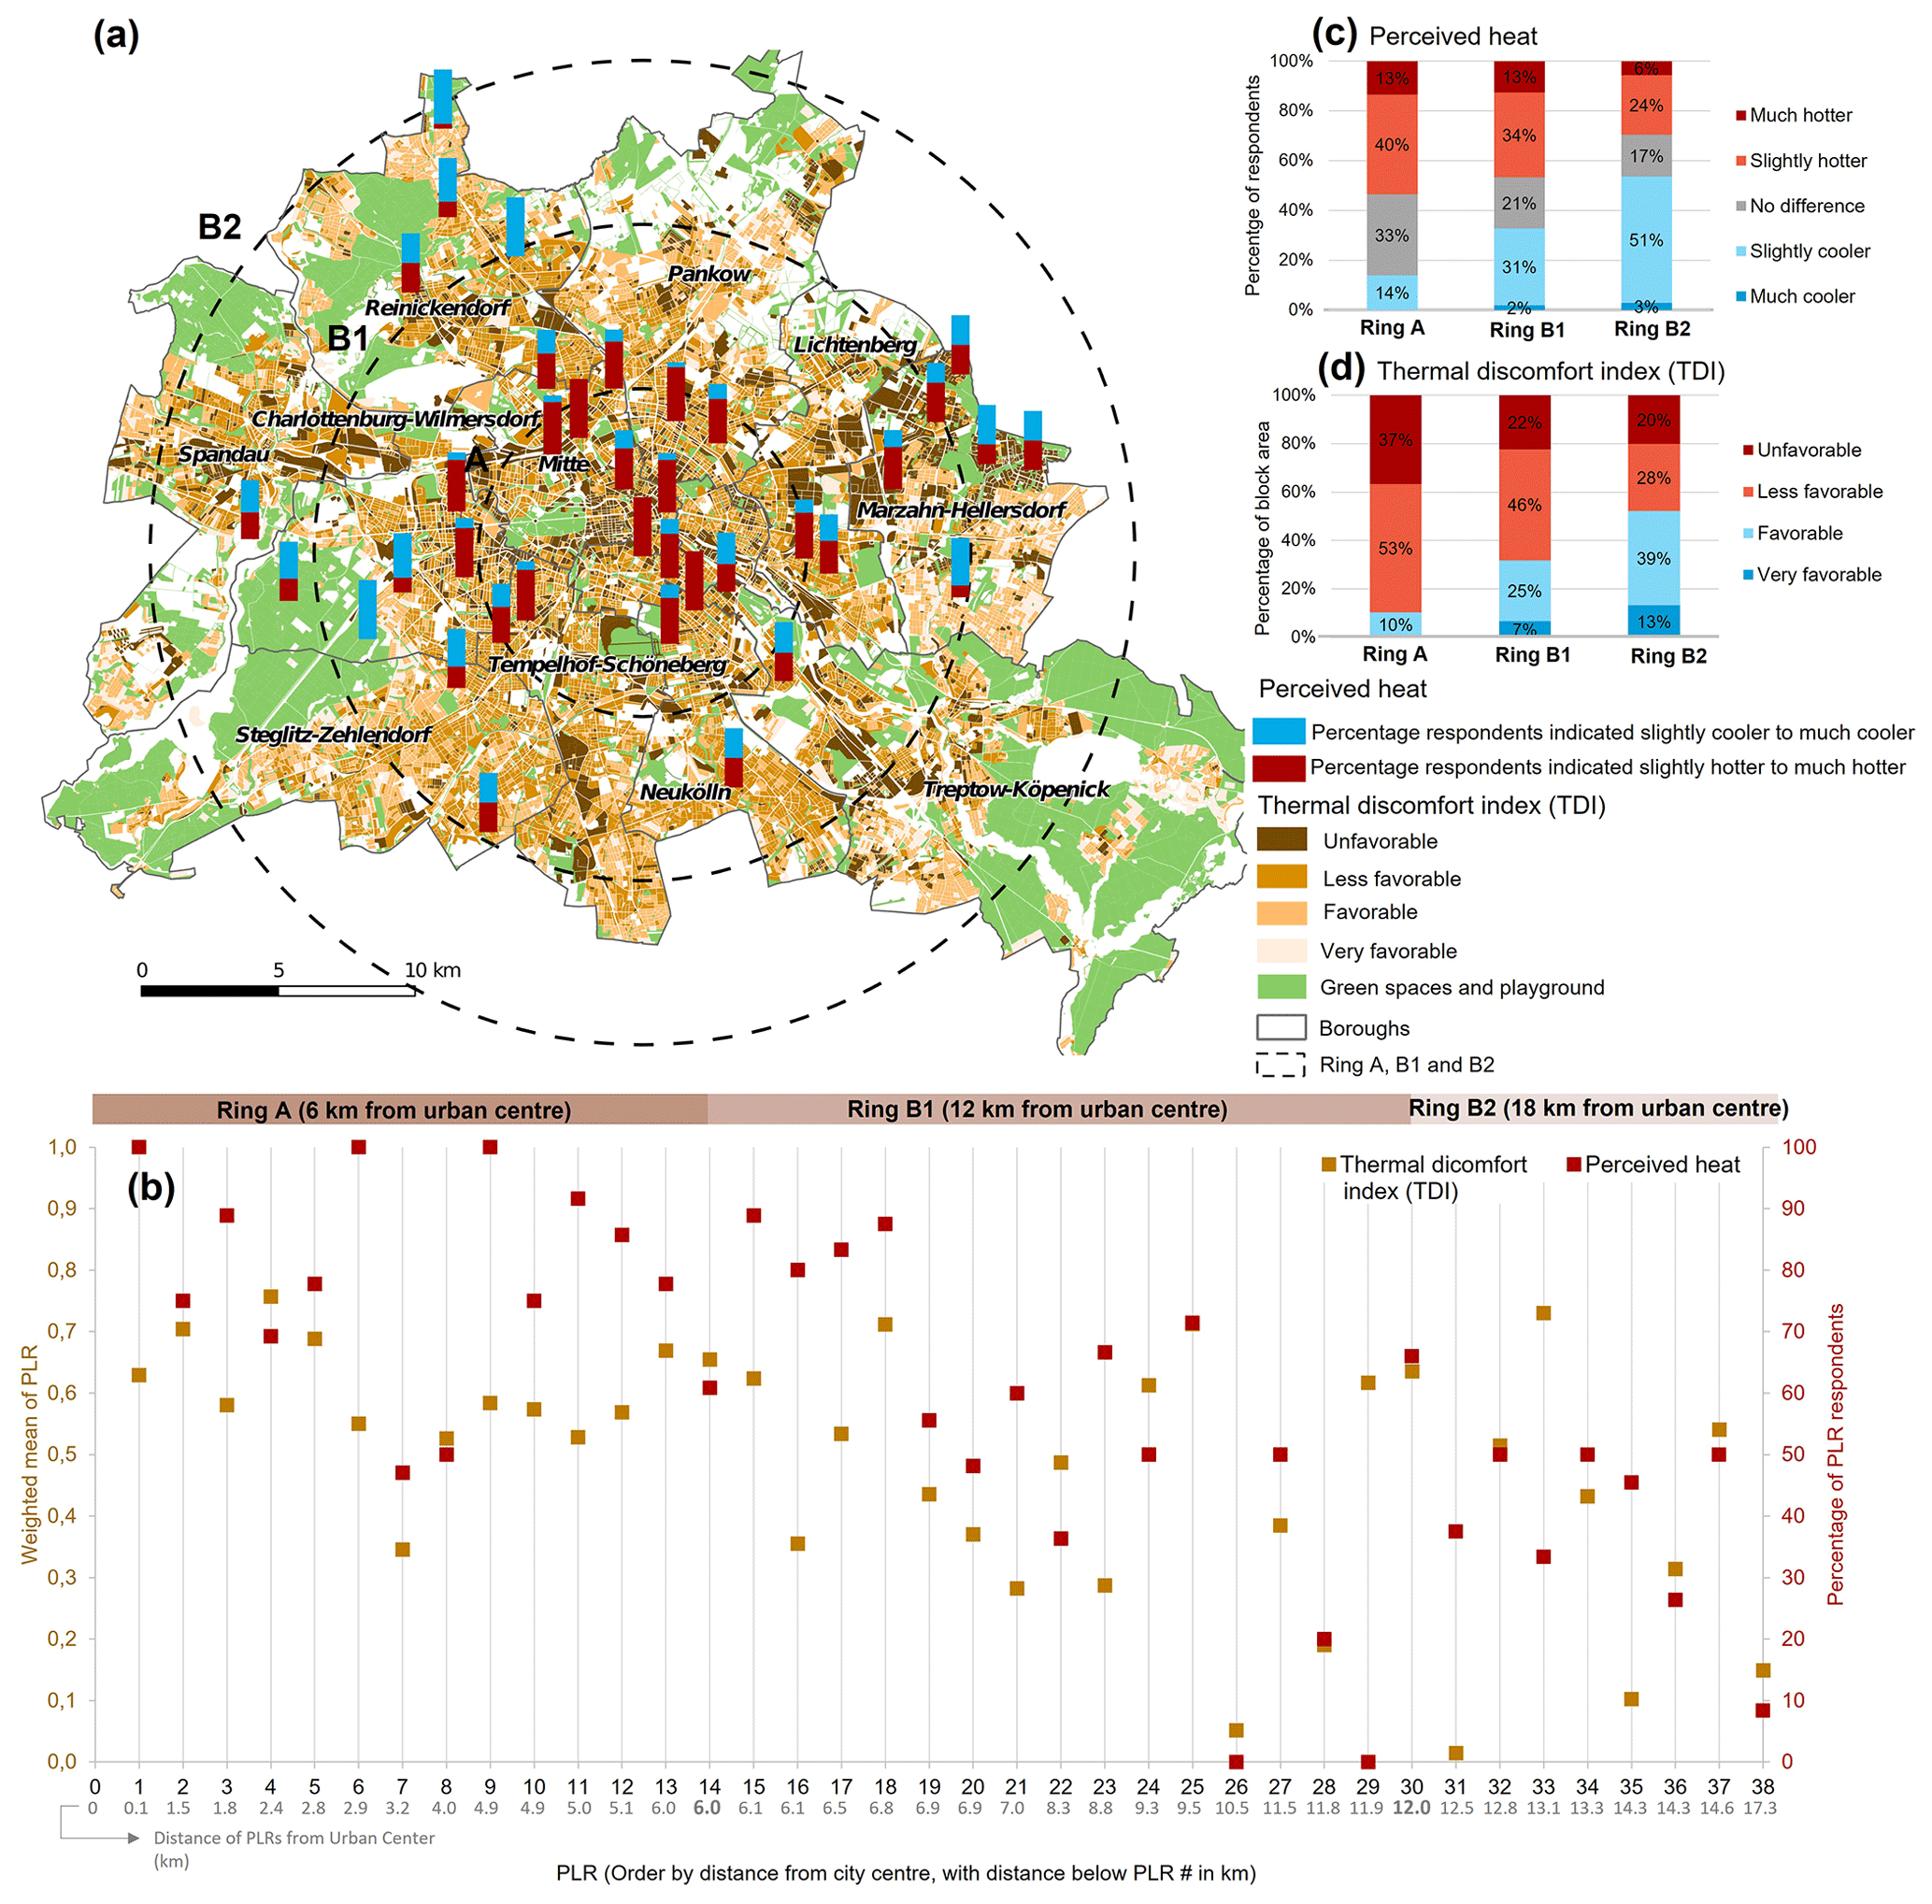
Figure 3Berlin results for 38 PLRs. (a) Responses to perceived heat Q5.3 (Table 2), thermal discomfort index (TDI, Table 3). (b) Block-weighted mean thermal discomfort index (TDI, Table 3) per PLR (brown, left axis), with 0 indicating all blocks “very favourable” and 1 all blocks “unfavourable”, and percentage of respondents indicated their perceived heat to be slightly hotter to much hotter (red, right axis, Table 2, Q5.3) PLR number (Fig. A1), with distance from the city centre. (c) Percentage respondents indicated perceived heat from “much cooler” to “much hotter” by rings (d) percentage of block area of ring rated from “very favourable” to “unfavourable”.
Respondents in other PLRs at similar distances from the centre in different parts of the city indicate different perceived heat levels (Fig. 3; e.g. PLR 30 and 35 in ring B2; and 22 and 25 in ring B1). This also occurs in the TDI (Fig. 3). PLR perceived heat (Table 2, Q5.3) and TDI (Table 3) are positively correlated (r ≥ 0.34, N = 38). A poorer correlation is found in ring B1, which may be related to larger areal extents of these PLRs and/or low participant numbers for some urban structure types (USTs). To understand this, USTs (e.g. dense block and high rise), socio-demographic profiles (e.g. age, income) and adaptive capacity (e.g. access to or availability of green spaces and shade) are explored in the following sections.
3.2 Perceived heat stress and USTs
Respondents report higher perceived heat stress (Table 2, Q5.3) when living in the denser compared to less dense USTs (Fig. 4), with median perceived heat decreasing from dense closed blocks (slightly hotter), high-rise buildings (slightly hotter), block edge developments (no difference), multi-family buildings (no difference), closed/semi-open blocks (no difference), row developments (no difference) and (semi-)detached and terraced houses (slightly cooler).
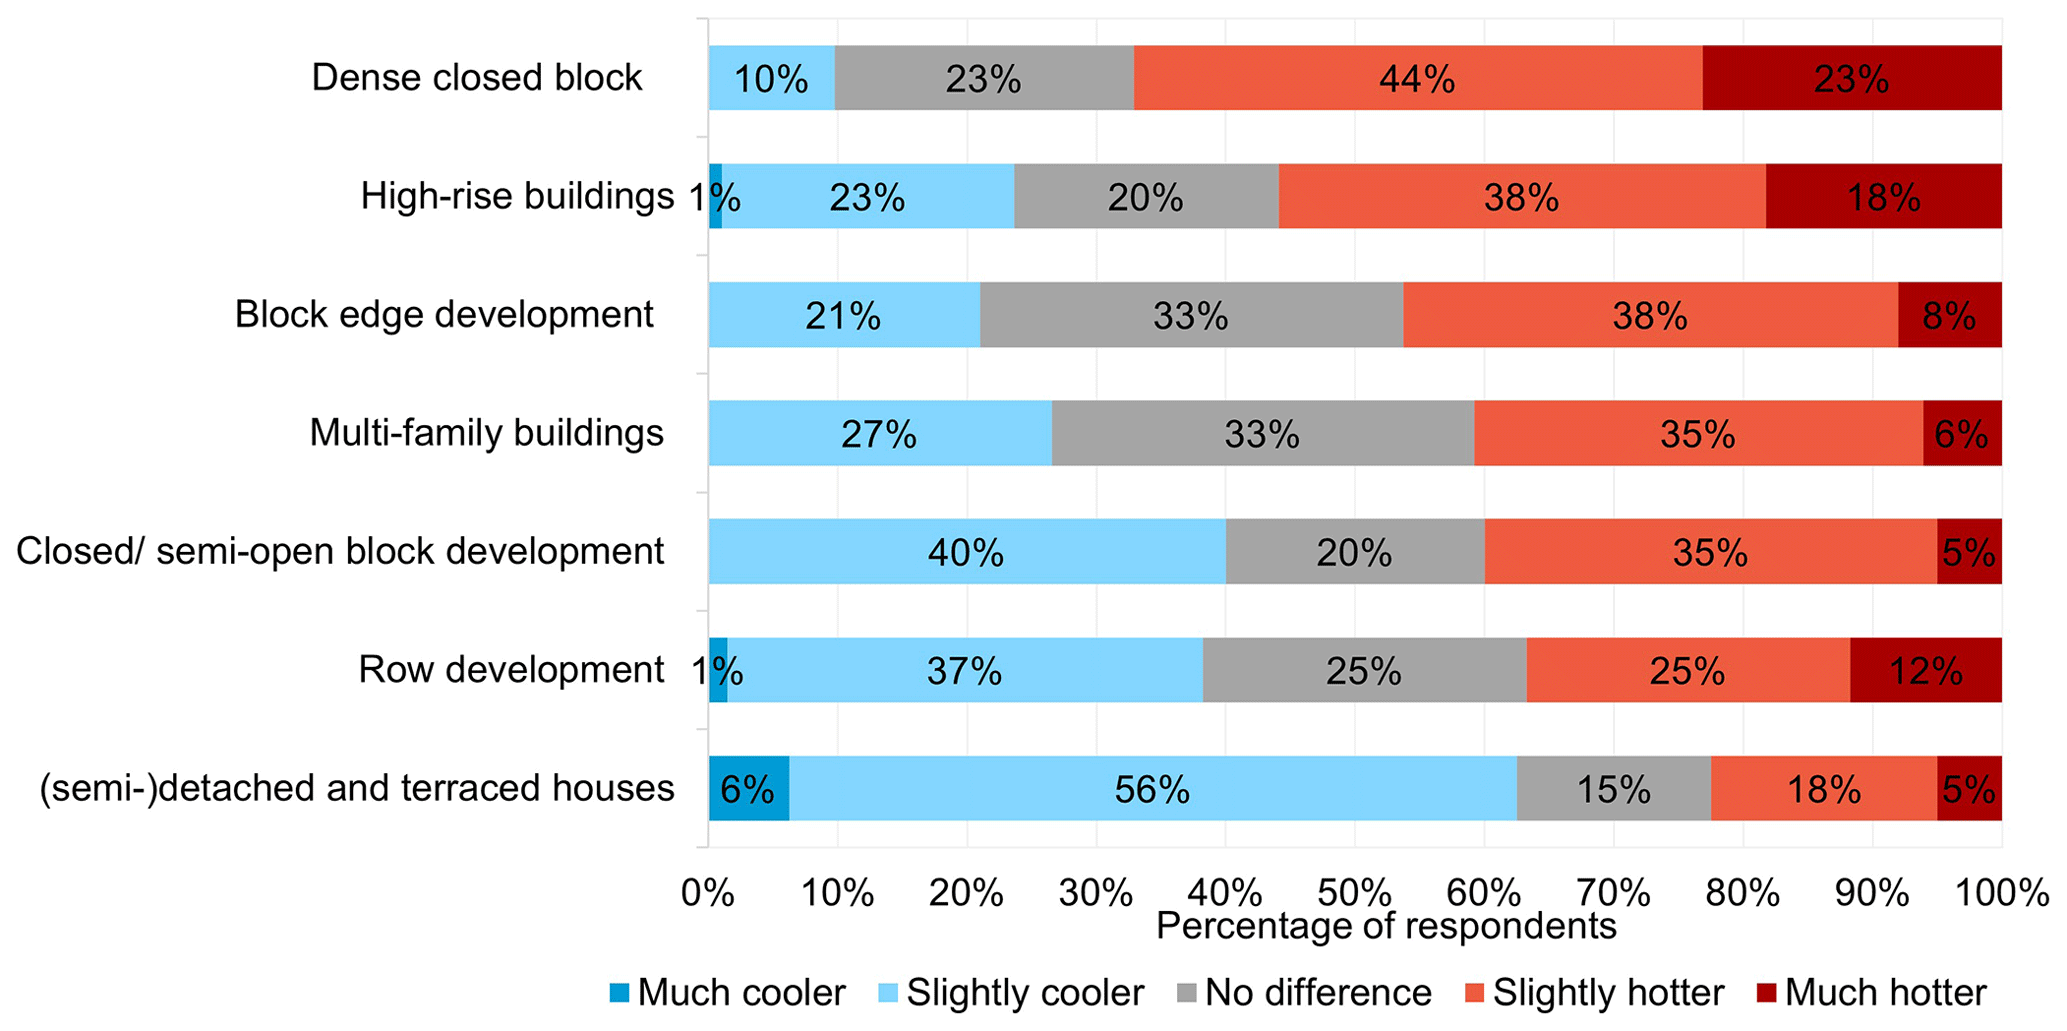
Figure 4Percentage of UST respondents indicated their relative perceived heat from much cooler to much hotter (Table 2, Q5.3).
In the dense and closed blocks 67 % of the respondents perceive they are living in slightly hotter to much hotter conditions relative to average, and 56 % of those living in high-rise buildings indicate slightly hotter to much hotter conditions than average. By contrast, respondents living in closed/semi-open blocks (95 %) and row developments with green strips (87 %) USTs perceive they are in slightly cooler to slightly hotter conditions. In (semi-)detached and terraced houses, 63 % of residents perceive their neighbourhood is slightly cooler to much cooler during a heat wave compared to the average outdoor temperature for the city. It is important to note that not only USTs but also their location influence perceived heat stress; e.g. 42 % of dense and closed block developments are in ring A (Fig. 1b), where 76 % of residents responded that their neighbourhood is slightly hotter to much hotter (Fig. 3c).
The Spearman's statistical test (N = 558) indicates significant correlation between USTs (ordered as Table 3) and heat perception (r = 0.33 and p ≤ 0.001).
3.3 Human vulnerability and adaptive capacity
3.3.1 USTs, vulnerable age groups and heat perception
Many studies (e.g. Meade et al., 2020; Dialesandro et al., 2021) identify elderly (≥ 65 years) as an age group vulnerable to heat stress due to underlying health conditions influencing heat-related risks. A higher share of those > 65 years (Table 3) live in (semi-)detached and terraced houses and high-rise buildings UST (Fig. 5a). However, across Berlin, the block-scale percentage of those ≥ 65 years differs, both within and between USTs (Fig. 5b). Overall, more live in (semi-)detached and terraced houses (median: 26 %), followed by high-rise buildings (median: 25 %) and row developments (median: 22 %). A relatively lower proportion lives in multi-family buildings and block edge developments (median is < 20 %). Dense blocks are where elderly residents are least likely to live (median: 10 %). A Spearman correlation between the percentage of elderly (≥ 65 years) and USTs (order given in Table 3) in Berlin has an r = −0.541 (p ≤0.001).
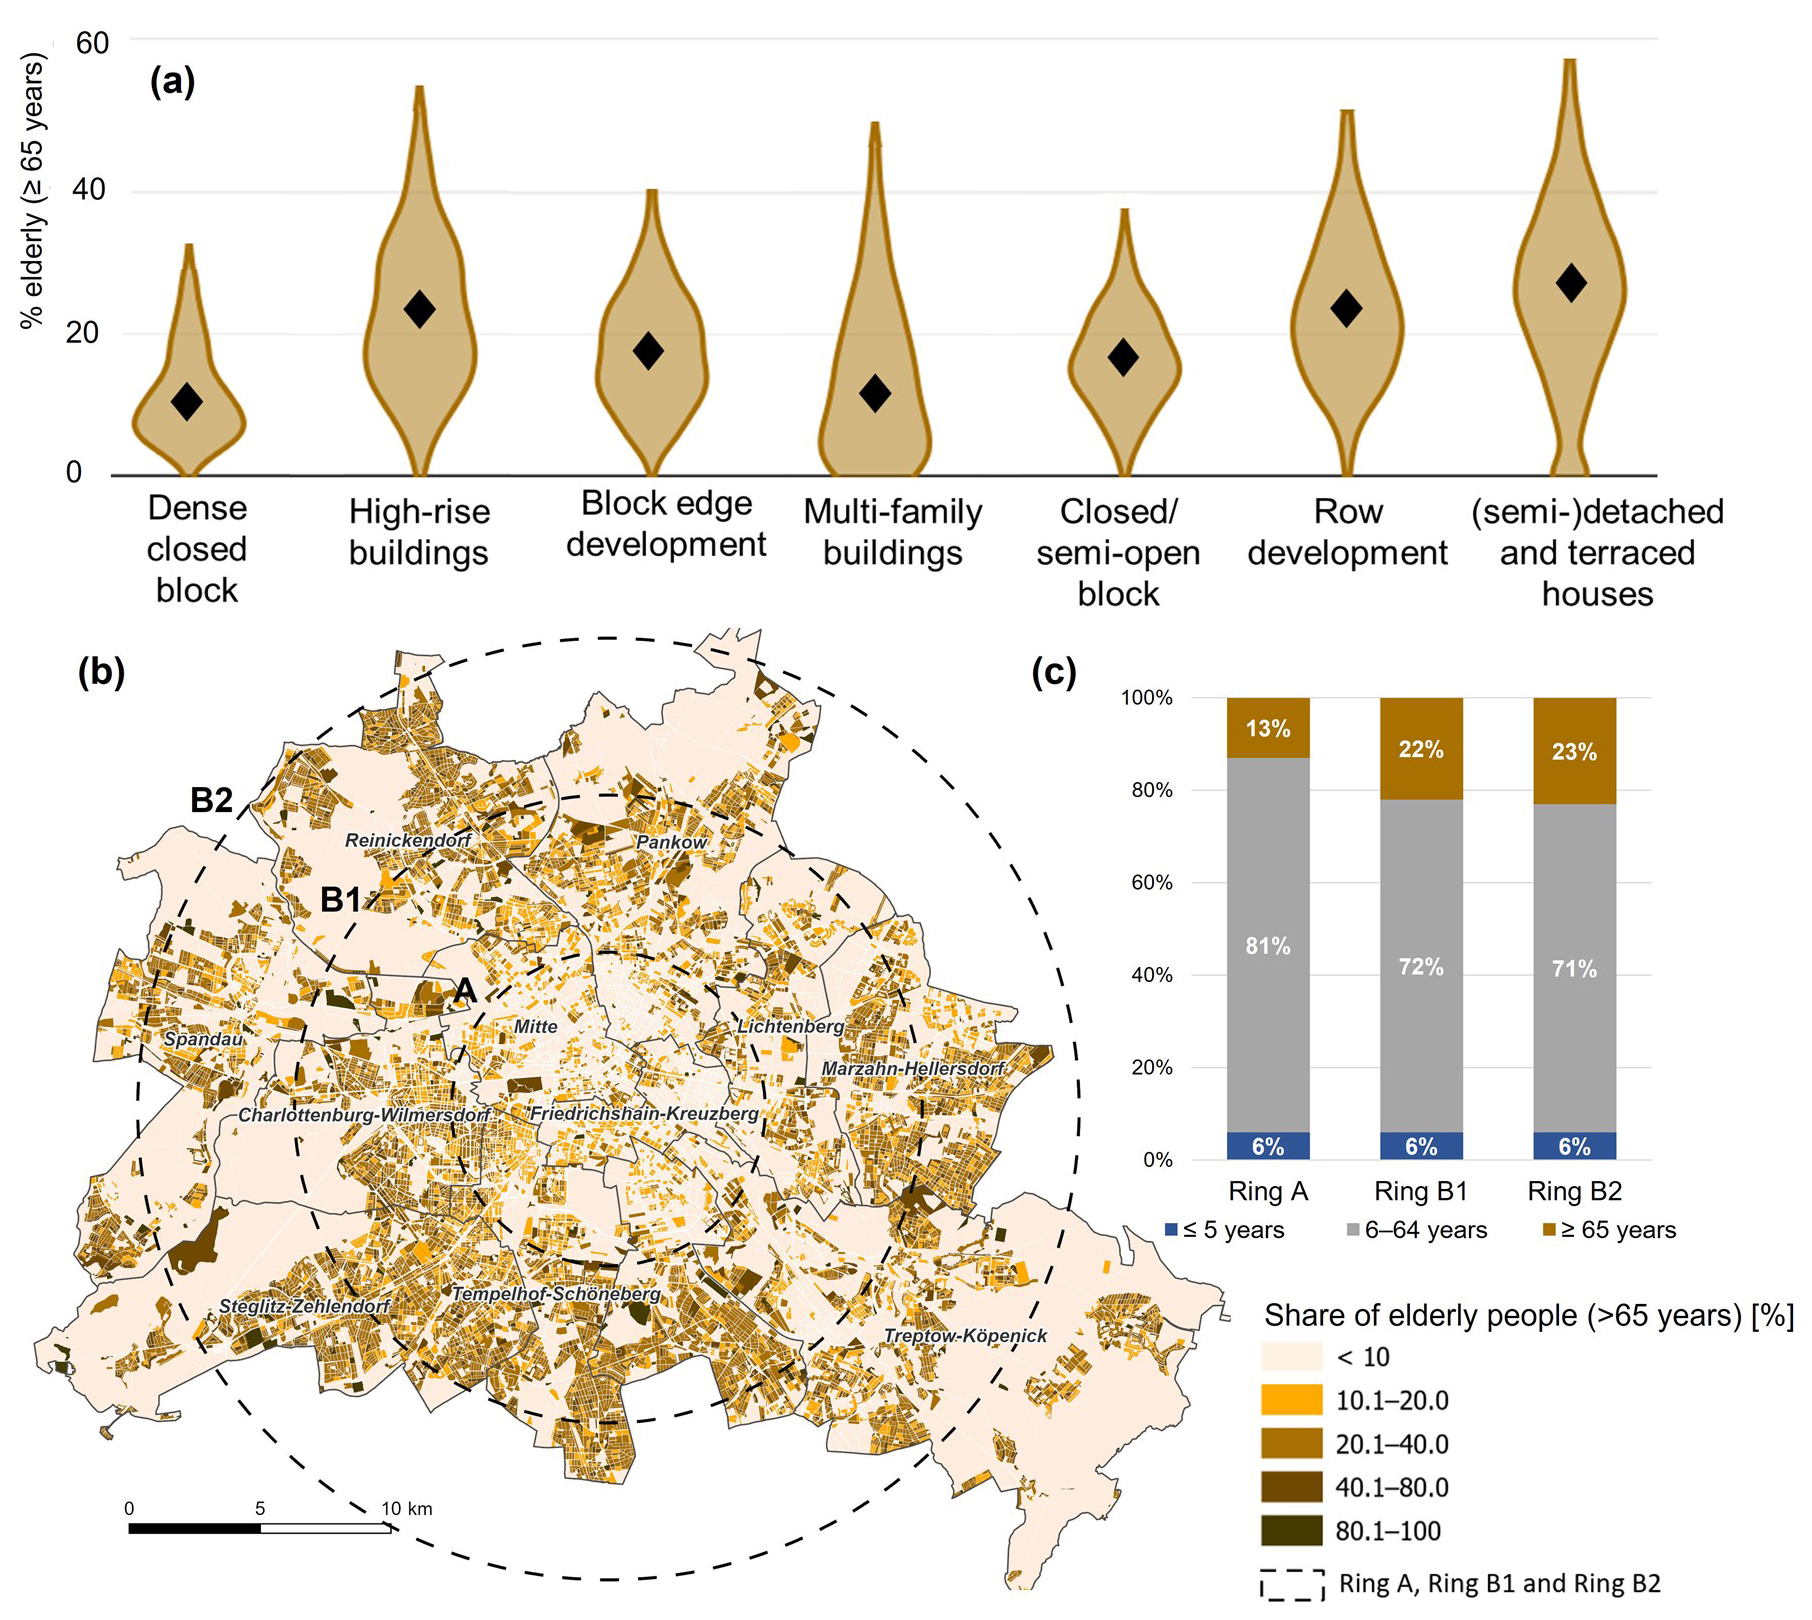
Figure 5Berlin population 65 years or older living in different (a) USTs, (b) block scale (colour, percentage) and (c) by ring for three age groups (colour). Data source and methods: Table 3.
Spatial differences are also evident between the rings by age groups (Fig. 5c). Elderly people mostly live in rings B1 and B2, between 6 and 18 km of the centre (Fig. 5c). In ring A, only 13 % of the total population are elderly; this increases to 22 % (ring B1) and 23 % (ring B2, Fig. 6b) in the outer rings. In ring A, elderly people most commonly live in high-rise buildings, whereas they more commonly live in detached and row houses in rings B1 and B2.
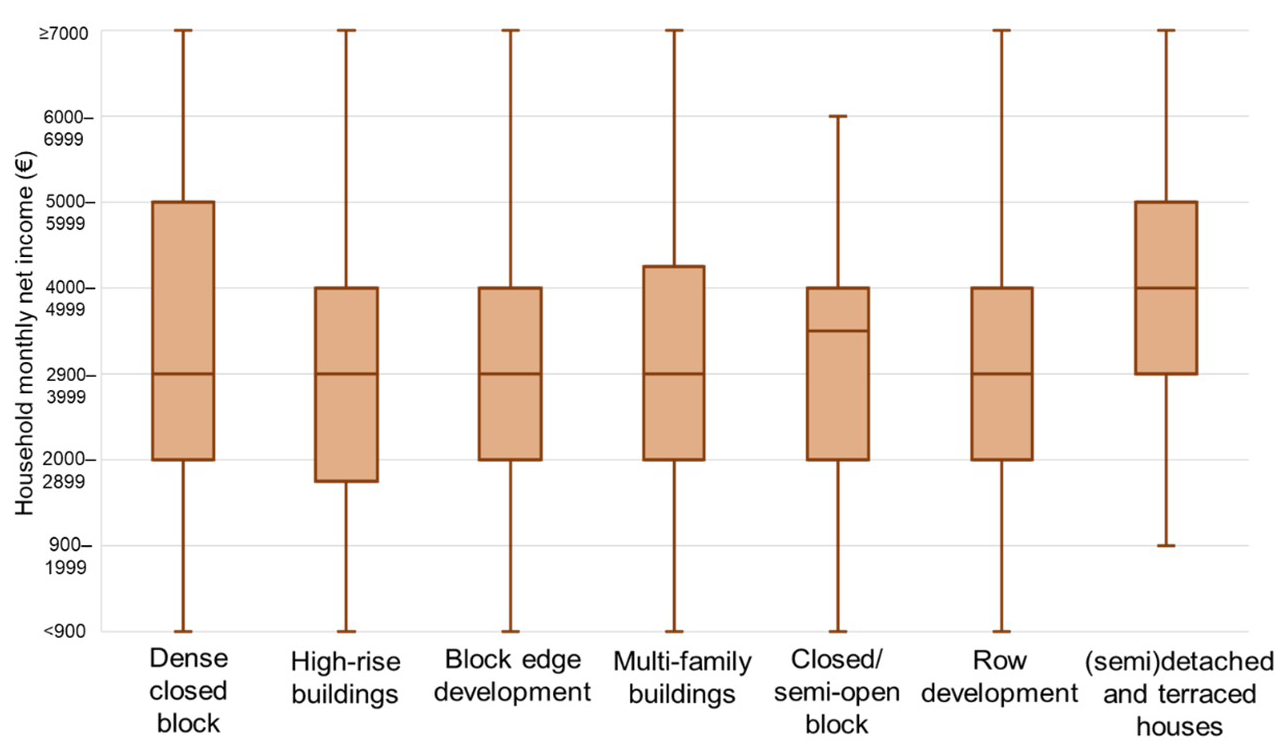
Figure 6Monthly net household income (Table 2, Q No. 17.8) by UST showing median (line), IQR (box) and minimum and maximum values (whiskers). Note that the y axis uses nonlinear classes.
There is a weak correlation (r = 0.086, p≤ 0.004, N = 564) between perceived heat and the eight age groups (Table 2, Q No. 14.1, Fig. A1). This may be linked to the 43 % of the respondents aged 25 to 64 reporting experiencing both high to very high heat due to commuting and spending relatively more time outside. This working age group tends to live in the urban centre and have high exposure to heat stress. Of the ≥ 65 years respondent group, 61 % report both a high to very high perceived heat and more heat-related health issues (Table 2, Q No. 5.9–5.16), with more (35.5 %) very often experiencing cardiovascular health issues due to heat (Table S10 in the Supplement).
3.3.2 USTs, income and heat perception
Income plays an important role in people's adaptation capacity for challenges exacerbated by climate hazards (e.g. Abrahamson et al., 2009; Hass et al., 2021). Household monthly net income (Table 2, Q No. 17.8) clustered by UST (Fig. 6) shows that most households in high-rise buildings, block developments and multi-family buildings have incomes close to the overall median (EUR 2900–3999 monthly) of those surveyed. However, 25 % of surveyed households in high-rise buildings and 24 % in dense closed blocks said their net income is less than 2000EUR monthly. Those living in (semi-)detached and terraced houses have the highest median income (EUR 4000–4999). Of respondents in this UST, 38.5 % have monthly net incomes ≥ EUR 5000. In the dense closed blocks 27 % report a monthly net income ≥ EUR 5000 and the largest interquartile range (IQR) is for EUR 2000–5999, indicating households from many different income groups live in this UST (Fig. 6).
Spearman correlation between USTs (order given in Table 3) and household income is weak (r = 0.22) but significant (p ≦ 0.001). There is a weak but statistically significant (p ≤ 0.001) negative correlation (r = −0.15) between household income and perceived heat; i.e. higher incomes are correlated with lower perceived heat stress. This appears conceptually logical as higher adaptive capacities are expected in wealthier households (Laranjeira et al., 2021). With 37 % of surveyed households with net monthly income ≥ EUR 5000 indicating they had an air conditioning system, the results indicate a relationship between adaptive capacities and available financial resources (Table S9).
3.3.3 USTs, availability of vegetation and heat perception
Urban vegetation can support heat stress adaptation by offsetting or buffering adverse heat impacts (Marando et al., 2022; Schwaab et al., 2021). The plan area fraction of grass and trees is estimated using summer 2022 Sentinel-2 10 m pixel NDVI values excluding building footprint, with both local 1 m resolution land cover and tree height (Geoportal Berlin 2022a, b) used to compute values for all USTs across Berlin (Table 3, Fig. 2).
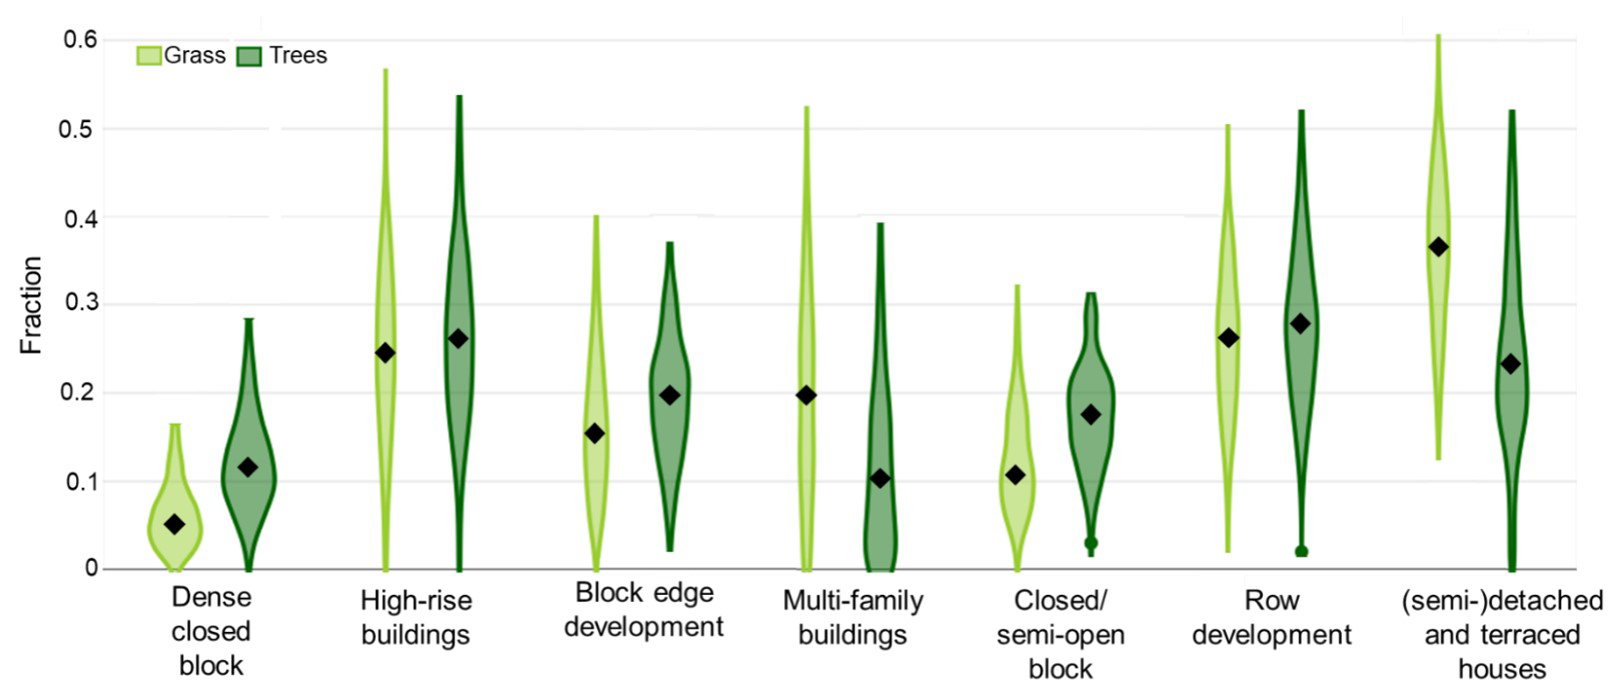
Figure 7Inter-block variation and median (diamond) in grass and tree fractions (colour) by urban structure type (UST) with (data source and method: Table 3, Fig. 2).
The grass-to-tree fraction differs between USTs (Fig. 7) from even (e.g. high-rise buildings, row developments) to lower (e.g. dense closed block, block edge development) fractions, and to the reverse of higher fractions (e.g. (semi-)detached and terraced). The overall median proportions (diamonds, Fig. 7) also vary, with (semi-)detached and terraced houses having comparatively high proportions of both grass (0.37) and trees (0.23), followed by row developments (grass: 0.27, trees: 0.28), large estate buildings (grass: 0.23, trees: 0.25) and multi-family buildings (grass: 0.20, trees median 0.10). Dense closed blocks have very low proportions of grass (0.04) and trees (0.13) relative to other USTs. The correlation between proportion of vegetation and USTs (order given in Table 3) is significant (p = 0.01), with a correlation coefficient of 0.778, which denotes greater association between USTs and vegetation fraction.
Vegetation fraction is a property assessed when delineating the analysis rings (Fenner et al., 2024), with ring A having less vegetation, where predominantly block structures exist. The outer rings have more vegetation and less building volume (Fenner et al., 2024, their Fig. 2) where the share of (semi-)detached and terraced houses are higher (Fig. 1b). A statistically significant correlation (p < 0.001) between availability of green (Q No. 9.1) and perceived stress (Q No. 5.3) survey results is found with a correlation coefficient of 0.29.
3.3.4 USTs, availability of shaded spaces and heat perception
Shading from trees and buildings is well known to create cooler areas (e.g. Lindberg and Grimmond, 2011; Bäcklin et al., 2021; Turner et al., 2023). Shadow fractions from buildings and trees are calculated during daylight hours for all summer days (June, July, August) for each block (see Supplement) in the surveyed PLRs (Table 3, Fig. 2).
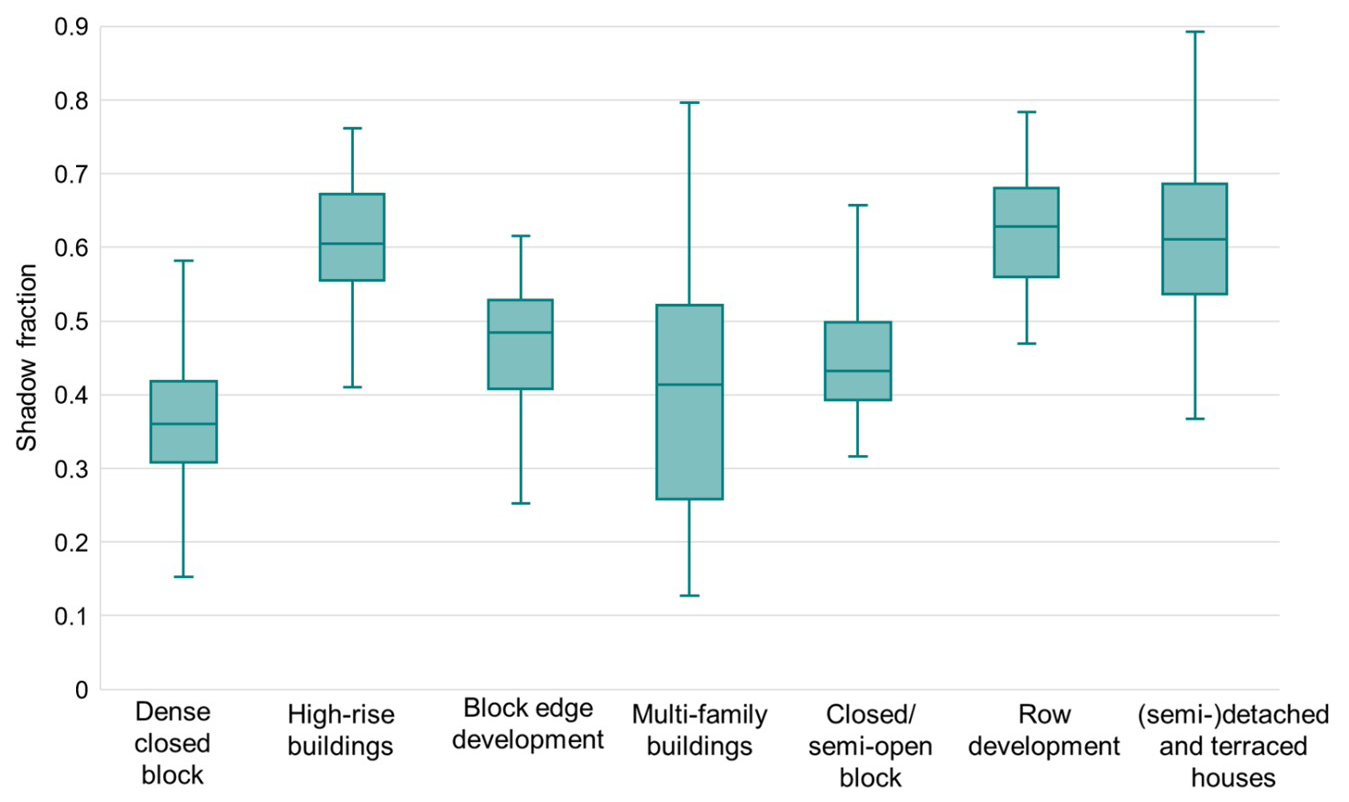
Figure 8Summer (June, July and August) shadow fraction by UST with variability between blocks showing median (line), IQR (box) and minimum and maximum values (whiskers) (data source and method: Table 3, Fig. 2).
The lowest median shadow fraction across the different USTs (Fig. 8) is for dense closed blocks (0.36), consistent with a low proportion of trees (Fig. 7). The large estate high-rise buildings have one of the highest median shadow fractions (0.61), linked to the tall buildings and the presence of trees in this UST (Fig. 7). Shadow fractions are highest in row developments with landscape green strips (median: 0.63) and (semi-)detached and terraced houses (median: 0.61).
Large variations in shadow fraction occur between and within USTs. The greatest variability occurs within the multi-family building UST (IQR = 0.26) followed by (semi-)detached and terraced houses (IQR = 0.15). Median shadow fraction by rings for the surveyed PLRs increases from 0.43 in ring A to 0.61 ring B2, which is linked to increase in trees cover. The Pearson correlation between USTs (order given in Table 3) and shadow fraction is strong and significant (r = 0.55, p ≦ 0.001), i.e. increasing with greater shaded fraction per USTs. From the survey data, a significant (p < 0.04) correlation coefficient of -0.33 is found between shadow fraction and perceived heat, indicating reduced perceived heat stress with greater shadow fraction. Again, this is conceptually consistent with the expectations.
Our assessment of perceived heat stress with urban structure types (USTs), people's age and income and neighbourhood location relative to the city core of Berlin demonstrate heat stress and adaptive capacities are perceived differently in various USTs and city rings.
Simplifying the city to three rings, we find a significant correlation between measured thermal discomfort and inhabitants' perceived heat stress with distance from the centre of the periphery of Berlin (i.e. reducing from ring A → B1 → B2). These results are consistent with those reported for Munich, Germany, across the city gradient (Heldens et al., 2013). In ring A, 76 % of respondents report slightly greater to much greater perceived heat stress, and in ring B2 nearly a third of the respondents still report high to very high heat stress. Our analysis finds the UST people reside in is correlated with their perceived heat levels. In ring B2, high perceived heat stress occurs in high-rise buildings, particularly in the borough of Marzahn–Hellersdorf and in multi-family buildings in Reinickendorf. Although high-rise buildings occur in all three rings, the inner ring (A) is generally more densely built-up with a larger building volume (Fenner et al., 2024). In ring A, a higher percentage of dense closed block structures lack the vegetation and shade needed for climate adaptation. Thus, urban renewal projects and urban development concepts need to address both the climatic conditions within the inner city and the protection and development of green space and shaded areas within districts where certain USTs, e.g. high-rise and multi-family buildings, occur.
Across USTs, differences in perceived heat stress exist, as do different age groups. Notably, the elderly population have a high tendency to live in (semi-)detached and terraced houses (26 %), high-rise buildings (22 %) and row developments (18 %), particularly in ring B1 and B2. Given age-related susceptibility and heat-related health problems (Sect. 3.3.1), this vulnerable population needs addressing in the outer city (e.g. ring B1 and B2). Although these households often live in single family homes, high-rise and multi-family buildings, with access to (shaded) green space, additional urban adaptation strategies such as inclusive public and open spaces and community centres could improve the demographic mix within these areas. With fewer elderly (16 %) in ring A, more younger population groups are exposed to heat stress in the inner city. However, their – on average – better physical condition and overall health should be better able to buffer some of the adverse health impacts. Consequently, different urban adaptation strategies are needed for the various USTs, but location (inner/outer city ring) as well as social composition also should be considered. Differential adaptive capacities between different USTs should inform the next generation of urban adaptation plans.
Overall, the integrated analysis and assessment undertaken shows that not only the exposure to heat stress matters for urban adaptation, but also socio-demographic composition, including the consideration of differential adaptive capacities in terms of access to shaded green space and economic circumstances (e.g. income) need to be adequately considered. Particularly, areas with high concentrations of elderly and/or challenging socio-economic conditions (e.g. lower income groups) require planned adaptation and support for adaptation. While elderly wealthier households in single family homes may be able to afford private adaptation measures to reduce heat stress, such as air conditioning, the elderly living in high-rise and multi-family buildings in the periphery (e.g. Marzahn–Hellersdorf and Reinickendorf) need more attention. Environmental injustice due to a lack of access to green cooling areas for vulnerable populations has been found in 14 major European urban areas by Rocha et al. (2024). Thus, firstly, urban development policies should address the ageing population process. Secondly, socio-economically disadvantaged groups and elderly living in more dense urban structures, such as high-rise buildings, typically do not have access to private green space, particularly in inner urban areas. Therefore, public planning policies need to ensure that with increasing densification, green space quality and access need to be secured for those living without a garden. This may be easier in large estate and high-rise buildings in the outer city region, but in both ring A and B1 such USTs exist which requires attention in adaptation.
Finally, understanding spatial patterns of thermal discomfort and heat stress is critical for targeted interventions to improve the liveability of urban areas in the context of climate change. The characterisation of urban form using USTs and city rings allows for a detailed understanding of the variability in perceived heat, human vulnerability and adaptive capacity across different spatial scales. This nuanced approach supports more targeted interventions in urban development and climate change adaptation. Beyond studying urban gradients across city rings, our approach allows for a detailed study on spatial variability at neighbourhood (block) scale within the rings by introducing USTs. This integrated assessment approach of urban form with social fabric provides additional information on more specific adaptation requirements. It should be noted that we analysed the human vulnerability in the USTs only connected to residential uses. The working population, especially those working outside, and their vulnerability are not addressed in this study due to a lack of data (e.g. about working conditions and perception of people about heat stress at work). Furthermore, differentiation between private and public green spaces across UST and city rings is not captured, which can influence heat stress perception (Sousa-Silva and Zanocco, 2024). Nevertheless, we suggest that linkages between USTs, vulnerable populations and their differential adaptation capacities across city rings should be tested in other cities as well, which can facilitate inter-city comparative studies. City size, physical and social composition, typography and climate cannot be ignored in terms of the transferability of the results of this study to other cities.
In this study, we take a multi-dimensional approach combining perceived heat with urban morphology and socio-economic structure that provides essential information for enhancing adaptation towards heat stress. This approach is based on (1) incorporating the social dimension, currently not sufficiently addressed in climate adaptation, (2) identifying the characteristics of USTs which support social structures and (3) employing quantitative methods to study social and physical structures across the city gradient. Together they can inform recommendations for future climate adaptation plans, considering the physical and social fabric of the city. This approach is exemplified in the city of Berlin. The findings show that perceived heat exposure decreases with distance to the urban centre, while human vulnerability and adaptive capacities depend stronger on inner variations in and differences between USTs. Therefore, USTs matter and can be linked with demographic and socio-economic information for assessing aspects of exposure, human vulnerability and adaptive capacity.
Although USTs focus on the physical structure, a deeper understanding is obtained by coupling this with socio-economic structures, human vulnerability and adaptive capacities where statistically significant correlations are found. The analysis indicates a heterogeneity in perceived heat stress and vulnerability profiles within and amongst USTs. Collectively, this approach will facilitate the identification of specific local adaptation needs to be addressed in future risk management strategies in civil protection and strategic urban planning. However, urban planning responses to climate change also require a better understanding of dynamic exposure patterns (e.g. day and night) and vulnerability. Moreover, heat-related aspects at various places (e.g. in houses/apartments, in the city centre, during work and school) and while commuting need to be captured more precisely (e.g. Hertwig et al., 2025). Combining people's behaviours through dedicated surveys needs to be investigated and integrated into climate adaptation plans. There is a need for dedicated studies to investigate demographic shifts and urbanisation processes for identifying urban transformation pathways (Kaveckis, 2017). In this respect, physical (e.g. tree growth) and social transitions (e.g. ageing population, work force changes) over time need to be accounted for in adaptation plans.
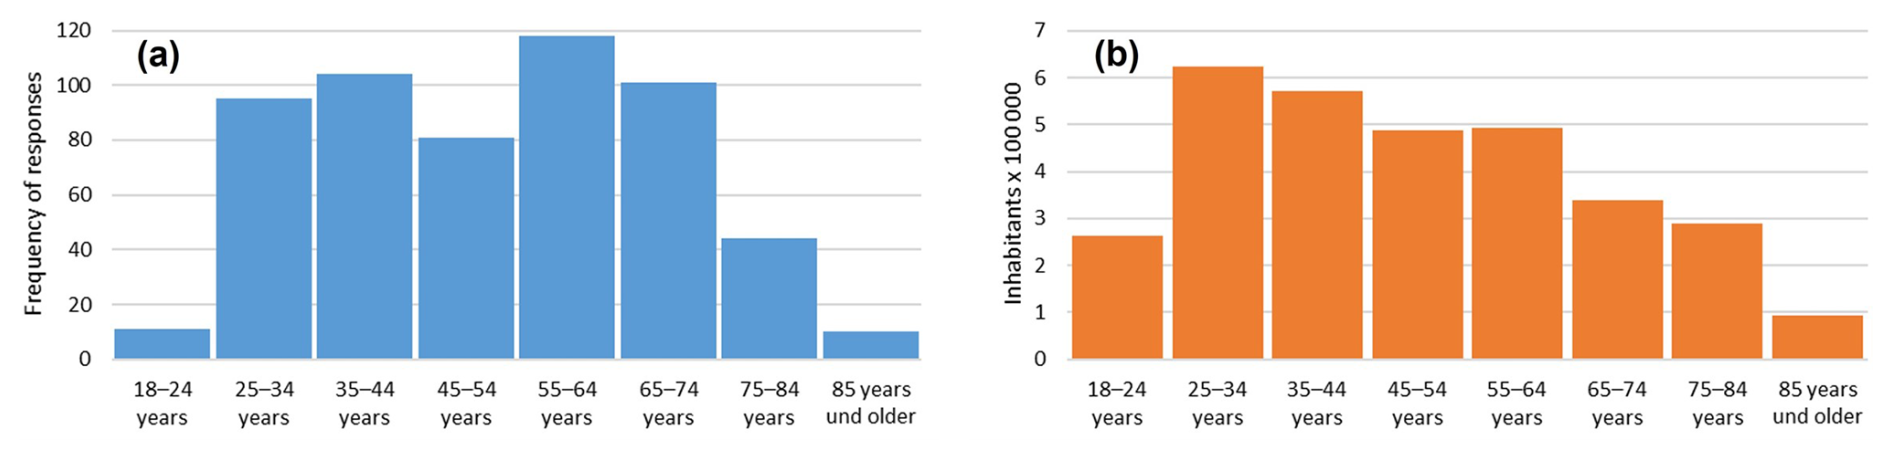
Figure A1Age-group histograms of (a) survey respondents and (b) the population of Berlin from Statistisches Bundesamt (2022).
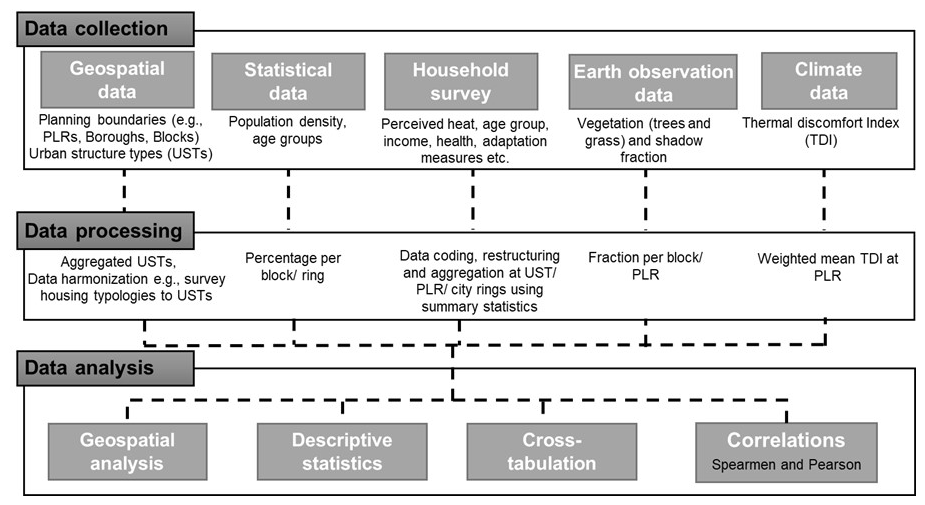
Table A1Criteria used to aggregate Berlin's UST, with the 5–95 percentile range given.
All presented data are available at https://doi.org/10.5281/zenodo.12192376 (Iqbal et al., 2024).
The supplement related to this article is available online at https://doi.org/10.5194/nhess-25-2481-2025-supplement.
NI, MR, GS, JB, SG and DH conceptualised the study. NI, MR and ZM curated the data. NI, MR, JB and SG developed analysis methodology. NI performed the analysis, with visualisations and drafted the article. NI, MR, JB, SG, DH, ZM and NC wrote and revised the manuscript.
The contact author has declared that none of the authors has any competing interests.
Publisher's note: Copernicus Publications remains neutral with regard to jurisdictional claims made in the text, published maps, institutional affiliations, or any other geographical representation in this paper. While Copernicus Publications makes every effort to include appropriate place names, the final responsibility lies with the authors.
This article is part of the special issue “Strengthening climate-resilient development through adaptation, disaster risk reduction, and reconstruction after extreme events”. It is a result of the EGU General Assembly 2023, session NH9.3 “Resilience building and risk reduction: Assessments, frameworks, tools and experiences”, Vienna, Austria, 24 April 2023.
This work is part of the urbisphere project (http://www.urbisphere.eu, last access: 14 July 2025). The authors gratefully acknowledge the support of Elke Plate from the Senate Department for Urban Development, Building and Housing (Senatsverwaltung für Stadtentwicklung, Bauen und Wohnen) as well as the Population Registration Office (Melderegister der Stadt Berlin) of the city of Berlin for providing address data for conducting the household survey. We thank urbisphere team members for their support including Andreas Christen, Daniel Fenner (ring structure) and Dimitris Tsirantonakis (curating EO vegetation data). Special thanks to all the household survey participants in Berlin who gave their time to complete the questionnaire.
This research has been supported by the European Research Council(ERC) under the European Union's Horizon 2020 research and innovation program (grant no. 855005).
This open-access publication was funded by the University of Stuttgart.
This paper was edited by Oded Katz and reviewed by three anonymous referees.
Abrahamson, V., Wolf, J., Lorenzoni, I., Fenn, B., Kovats, S., Wilkinson, P., Adger, W. N., and Raine, R.: Perceptions of heatwave risks to health: interview-based study of older people in London and Norwich, UK, J. Public Health, 31, 119–126, https://doi.org/10.1093/pubmed/fdn102, 2009.
Aburrá Valley city's Mayor's Office: Medellín Climate Action Plan 2020–2050, Municipality of Medellín, https://www.medellin.gov.co/es/wp-content/uploads/2024/03/PAC_Medellin_Libro_Digital.pdf (last access: 29 September 2024), 2021 (in Spanish).
Adelekan, I., Cartwright, A., Chow, W., Colenbrander, S., Dawson, R., Garschagen, M., Haasnoot, M., Hashizume, M., Klaus, I., Krishnaswamy, J., Ley, D., McPhearson, T., Pelling, M., Pörtner, H., Revi, A., Miranda Sara, L., P, N., Simph, S., Singh, C., Solecki, W., Thomas, A., and Trisos, C.: Climate Change in Cities and Urban Areas: Impacts, Adaptation and Vulnerability, Indian Institute for Human Settlements, https://doi.org/10.24943/SUPSV209.2022, 2022.
Amt für Statistik Berlin-Brandenburg: Einwohnerdichte, Amt für Statistik Berlin-Brandenburg, https://www.statistik-berlin-brandenburg.de/kommunalstatistik/einwohnerbestand-berlin (last access: 12 September 2022), 2022.
Aslam, A., Rana, I. A., and Bhatti, S. S.: Local climate zones and its potential for building urban resilience: a case study of Lahore, Pakistan, International Journal of Disaster Resilience in the Built Environment, 13, 248–265, https://doi.org/10.1108/IJDRBE-08-2021-0116, 2022.
Augustin, J., Hischke, S., Hoffmann, P., Castro, D., Obi, N., Czerniejewski, A., Dallner, R., and Bouwer, L. M.: Auswirkungen thermischer Belastungen auf die Gesundheit – eine bundesweite Analyse auf Grundlage von GKV-Routinedaten zwischen 2012–2021, Bundesgesundheitsbla., 68, 119–129, https://doi.org/10.1007/s00103-024-03968-5, 2025.
Babiker, M., Bazaz, A., Bertoldi, P., Creutzig, F., De Coninck, H., De Kleijne, K., Dhakal, S., Haldar, S., Jiang, K., Kılkış, Ş., Klaus, I., Krishnaswamy, J., Lwasa, S., Niamir, L., Pathak, M., Portugal Pereira, J., Revi, A., Roy, J., Seto, K., Singh, C., Some, S., Steg, L., and Ürge-Vorsatz, D.: The Summary for Urban Policymakers for IPCC AR6 Report: What the Latest Science on Climate Change Mitigation Means For Cities and Urban Areas, distilled from the IPCC Working Group III report, https://doi.org/10.24943/SUPSV310.2022, 2022.
Bäcklin, O., Lindberg, F., Thorsson, S., Rayner, D., and Wallenberg, N.: Outdoor heat stress at preschools during an extreme summer in Gothenburg, Sweden – Preschool teachers' experiences contextualized by radiation modelling, Sustain. Cities Soc., 75, 103324, https://doi.org/10.1016/j.scs.2021.103324, 2021.
Barlow, J., Best, M., Bohnenstengel, S. I., Clark, P., Grimmond, S., Lean, H., Christen, A., Emeis, S., Haeffelin, M., Harman, I. N., Lemonsu, A., Martilli, A., Pardyjak, E., Rotach, M. W., Ballard, S., Boutle, I., Brown, A., Cai, X., Carpentieri, M., Coceal O., Crawford, B., Di Sabatino, S., Dou, J., Drew, D. R., Edwards, J. M., Fallmann, J., Fortuniak, K., Gornall, J., Tobias, H, C. H., Hertwig, D., Hirano, K., Holtslag, A. A. M., Luo, Z., Mills, G., Nakayoshi, M., Pain, K., Schlünzen, K. H., Smith, S., Soulhac, L., Steeneveld, G., Sun, T., Theeuwes, N. E., Thomson, D., Voogt, J. A., Ward, H. C., Xie, Z., and Zhong, J.: Developing a Research Strategy to Better Understand, Observe, and Simulate Urban Atmospheric Processes at Kilometer to Subkilometer Scales, B. Am. Meteorol. Soc., 98, ES261–ES264, https://doi.org/10.1175/BAMS-D-17-0106.1, 2017.
Battisti, L., Pille, L., Wachtel, T., Larcher, F., and Säumel, I.: Residential Greenery: State of the Art and Health-Related Ecosystem Services and Disservices in the City of Berlin, Sustainability, 11, 1815, https://doi.org/10.3390/su11061815, 2019.
Bechtel, B., Alexander, P., Böhner, J., Ching, J., Conrad, O., Feddema, J., Mills, G., See, L., and Stewart, l.: Mapping Local Climate Zones for a Worldwide Database of the Form and Function of Cities, ISPRS Int. J. Geo-Inf., 4, 199–219, https://doi.org/10.3390/ijgi4010199, 2015.
Bechtel, B., Demuzere, M., Mills, G., Zhan, W., Sismanidis, P., Small, C., and Voogt, J.: SUHI analysis using Local Climate Zones – A comparison of 50 cities, Urban Climate, 28, 100451, https://doi.org/10.1016/j.uclim.2019.01.005, 2019.
Bertram, R.: How “green corridors” are driving sustainable policies in Medellín, Heinrich Böll Foundation, https://energytransition.org/2023/12/how-green-corridors-are-driving-sustainable-policies-in-medellin/ (last access: 20 September 2024), 2023.
Birkmann, J., Cardona, O. D., Carreño, M. L., Barbat, A. H., Pelling, M., Schneiderbauer, S., Kienberger, S., Keiler, M., Alexander, D., Zeil, P., and Welle, T.: Framing vulnerability, risk and societal responses: the MOVE framework, Nat. Hazards, 67, 193–211, https://doi.org/10.1007/s11069-013-0558-5, 2013.
Birkmann, J., Welle, T., Solecki, W., Lwasa, S., and Garschagen, M.: Boost resilience of small and mid-sized cities, Nature, 537, 605–608, https://doi.org/10.1038/537605a, 2016.
Bochum Department of Social Affairs: Hitzekonzept: Obdach- und Wohnungslose bei “Hitzewellen” schützen, Amt für Soziales, Bochum Department of Social Affairs, Germany, https://www.staedteregion-aachen.de/fileadmin/user_upload/A_53/Dateien/Hitzekonzept_Obdach-u_Wohungslose_Bochum.pdf (last access: 5 December 2023), 2022.
“Cities must protect people from extreme heat”, Nature, 595, 331–332, https://doi.org/10.1038/d41586-021-01903-1, 2021.
Demuzere, M., Kittner, J., Martilli, A., Mills, G., Moede, C., Stewart, I. D., van Vliet, J., and Bechtel, B.: A global map of local climate zones to support earth system modelling and urban-scale environmental science, Earth Syst. Sci. Data, 14, 3835–3873, https://doi.org/10.5194/essd-14-3835-2022, 2022.
Deutschländer, T., Früh, B., Koßmann, M., Roos, M., and Wienert, U.: Berlin im Klimawandel – eine Untersuchung zum Bioklima, edited by: Behrens, U. and Grätz, A., Deutscher Wetterdienst and Senatsverwaltung für Stadtentwicklung, https://digital.zlb.de/viewer//fulltext/15490747/1/ (last access: 2 September 2023), 2010.
Dialesandro, J., Brazil, N., Wheeler, S., and Abunnasr, Y.: Dimensions of Thermal Inequity: Neighborhood Social Demographics and Urban Heat in the Southwestern U.S, Int. J. Env. Res. Pub. He., 18, 941, https://doi.org/10.3390/ijerph18030941, 2021.
Downes, N. K., Storch, H., Viet, P. Q., Diem, N. K., and Le Dinh, C.: Assessing Peri-Urbanisation and Urban Transitions between 2010 and 2020 in Ho Chi Minh City using an Urban Structure Type Approach, Urban Science, 8, 11, https://doi.org/10.3390/urbansci8010011, 2024.
Drusch, M., Del Bello, U., Carlier, S., Colin, O., Fernandez, V., Gascon, F., Hoersch, B., Isola, C., Laberinti, P., Martimort, P., Meygret, A., Spoto, F., Sy, O., Marchese, F., and Bargellini, P.: Sentinel-2: ESA's Optical High-Resolution Mission for GMES Operational Services, Remote Sens. Environ., 120, 25–36, https://doi.org/10.1016/j.rse.2011.11.026, 2012.
Eldesoky, A. H., Gil, J., and Pont, M. B.: Combining environmental and social dimensions in the typomorphological study of urban resilience to heat stress, Sustain. Cities Soc., 83, 103971, https://doi.org/10.1016/j.scs.2022.103971, 2022.
Evasys GmbH: Evasys, Evasys GmbH, Lüneburg, Germany, https://evasys.de/evasys/ (last access: 15 July 2025), 2021.
Feldmeyer, D., Birkmann, J., and Welle, T.: Development of Human Vulnerability 2012–2017, J. Extr. Even., 4, 1850005, https://doi.org/10.1142/S2345737618500057, 2017.
Feldmeyer, D., Wilden, D., Kind, C., Kaiser, T., Goldschmidt, R., Diller, C., and Birkmann, J.: Indicators for Monitoring Urban Climate Change Resilience and Adaptation, Sustainability, 11, 2931, https://doi.org/10.3390/su11102931, 2019.
Fenner, D., Meier, F., Bechtel, B., Otto, M., and Scherer, D.: Intra and inter “local climate zone” variability of air temperature as observed by crowdsourced citizen weather stations in Berlin, Germany, Meteorol. Z., 26, 525–547, https://doi.org/10.1127/metz/2017/0861, 2017.
Fenner, D., Christen, A., Grimmond, S., Meier, F., Morrison, W., Zeeman, M., Barlow, J., Birkmann, J., Blunn, L., Chrysoulakis, N., Clements, M., Glazer, R., Hertwig, D., Kotthaus, S., König, K., Looschelders, D., Mitraka, Z., Poursanidis, D., Tsirantonakis, D., Bechtel, B., Benjamin, K., Beyrich, F., Briegel, F., Feigel, G., Gertsen, C., Iqbal, N., Kittner, J., Lean, H., Liu, Y., Luo, Z., McGrory, M., Metzger, S., Paskin, M., Ravan, M., Ruhtz, T., Saunders, B., Scherer, D., Smith, S. T., Stretton, M., Trachte, K., and van Hove, M.: urbisphere-Berlin Campaign: Investigating Multiscale Urban Impacts on the Atmospheric Boundary Layer, B. Am. Meteorol. Soc., 105, E1929–E1961, https://doi.org/10.1175/BAMS-D-23-0030.1, 2024.
Franck, U., Krüger, M., Schwarz, N., Grossmann, K., Röder, S., and Schlink, U.: Heat stress in urban areas: Indoor and outdoor temperatures in different urban structure types and subjectively reported well-being during a heat wave in the city of Leipzig, Meteorol. Z., 22, 167–177, https://doi.org/10.1127/0941-2948/2013/0384, 2013.
Gallardo, L., Hamdi, R., Islam, A. S., Klaus, I., Klimont, Z., Krishnaswamy, J., Pinto, I., Otto, F., Raghavan, K., Revi, A., Sörensson, A. A., and Szopa, S.: What the Latest Physical Science of Climate Change Means for Cities, Indian Institute for Human Settlements, https://doi.org/10.24943/SUPSV108.2022, 2022.
Gascon, F., Cadau, E., Colin, O., Hoersch, B., Isola, C., López Fernández, B., and Martimort, P.: Copernicus Sentinel-2 mission: products, algorithms and Cal/Val, Earth Observing Systems XIX, 9218, 92181E, https://doi.org/10.1117/12.2062260, 2014.
Geoportal Berlin: Building Age in Residential Development, Geoportal Berlin, https://www.berlin.de/umweltatlas/en/land-use/building-age/ (last access: 13 June 2023), 2016.
Geoportal Berlin: DOM – Digitales Oberflächenmodell Berlin, Geoportal Berlin, https://www.berlin.de/sen/sbw/stadtdaten/geoinformation/landesvermessung/geotopographie-atkis/bdom-digitales-bildbasiertes-oberflaechenmodell/ (last access: 13 December 2023), 2020.
Geoportal Berlin: Impervious Soil Coverage 2021 (Soil Sealing), Geoportal Berlin, https://www.berlin.de/umweltatlas/en/soil/impervious-soil-coverage/2021/summary/ (last access: 13 June 2023), 2021a.
Geoportal Berlin: Urban Structural Density – Floor Space Index (FSI) 2019, Geoportal Berlin, https://www.berlin.de/umweltatlas/en/land-use/urban-structural-density/2019/summary/ (last access: 13 June 2023), 2021b.
Geoportal Berlin: Green Volume 2020, FIS-Broker, https://fbinter.stadt-berlin.de/fb/index.jsp?Szenario=fb_en&loginkey=zoomStart&mapId=ek_05_09gruenvol2020@esenstadt&bbox=367786,5806155,418176,5831378 (last access: 13 June 2023), 2021c.
Geoportal Berlin: Amtliches Liegenschaftskatasterinformationssystem ALKIS Berlin, Geoportal Berlin, https://www.berlin.de/sen/sbw/stadtdaten/geoportal/liegenschaftskataster/ (last access: 13 December 2023), 2022a.
Geoportal Berlin: ATKIS DGM – Digitales Geländemodell Berlin, Geoportal Berlin, https://www.berlin.de/sen/sbw/stadtdaten/geoinformation/landesvermessung/geotopographie-atkis/dgm-digitale-gelaendemodelle/ (last access: 13 December 2023), 2022b.
Geoportal Berlin: Building Heights 2023, Geoportal Berlin, https://www.berlin.de/umweltatlas/en/land-use/building-heights/continually-updated/map-description (last access: 13 June 2023), 2023.
Grimmond, C. S. B. and Oke, T. R.: Heat Storage in Urban Areas: Local-Scale Observations and Evaluation of a Simple Model, J. Appl. Meteor., 38, 922–940, https://doi.org/10.1175/1520-0450(1999)038<0922:HSIUAL>2.0.CO;2, 1999.
Grimmond, S.: Urbanization and global environmental change: local effects of urban warming, Geogr. J., 173, 83–88, https://doi.org/10.1111/j.1475-4959.2007.232_3.x, 2007.
Hannemann, L., Janson, D., Grewe, H. A., Blättner, B., and Mücke, H.: Heat in German cities: a study on existing and planned measures to protect human health, J. Public Health, 32, 1733–1742, https://doi.org/10.1007/s10389-023-01932-2, 2023.
Hass, A. L., Runkle, J. D., and Sugg, M. M.: The driving influences of human perception to extreme heat: A scoping review, Environ. Res., 197, 111173, https://doi.org/10.1016/j.envres.2021.111173, 2021.
Heldens, W., Taubenböck, H., Esch, T., Heiden, U., and Wurm, M.: Analysis of Surface Thermal Patterns in Relation to Urban Structure Types: A Case Study for the City of Munich, in: Thermal Infrared Remote Sensing: Sensors, Methods, Applications, edited by: Kuenzer, C. and Dech, S., Springer Netherlands, Dordrecht, 475–493, https://doi.org/10.1007/978-94-007-6639-6_23, 2013.
Hertwig, D., McGrory, M., Paskin, M., Liu, Y., Lo Piano, S., Llanwarne, H., Smith, S. T., and Grimmond, S.: Connecting physical and socio-economic spaces for multi-scale urban modelling: a dataset for London, Geosci. Data J., 12, e289, https://doi.org/10.1002/gdj3.289, 2025.
Höppe, P.: The physiological equivalent temperature – a universal index for the biometeorological assessment of the thermal environment, Int. J. Biometeorol., 43, 71–75, https://doi.org/10.1007/s004840050118, 1999.
IPCC: Global Warming of 1.5 °C, Cambridge University Press, edited by: Masson-Delmotte, V., Zhai, P., Pörtner, H.-O., Roberts, D., Skea, J., Shukla, P. R., Pirani, A., Moufouma-Okia, W., Péan, C., Pidcock, R., Connors, S., Matthews, J. B. R., Chen, Y., Zhou, X., Gomis, M. I., Lonnoy, E., Maycock, T., Tignor, M., and Waterfield, T., Cambridge University Press, https://doi.org/10.1017/9781009157940, 2018.
IPCC: Annex II: Glossary, in: Climate Change 2022: Impacts, Adaptation and Vulnerability. Contribution of Working Group II to the Sixth Assessment Report of the Intergovernmental Panel on Climate Change, edited by: Möller, V., van Diemen, R., Matthews, J. B. R., Méndez, C., Semenov, S., Fuglestvedt, J. S., and Reisinger, A., Cambridge University Press, https://doi.org/10.1017/9781009325844, 2022.
IPCC: Climate Change 2023: Synthesis Report. Contribution of Working Groups I, II and III to the Sixth Assessment Report of the Intergovernmental Panel on Climate Change, edited by: Core Writing Team, Lee, H., and Romero, J., IPCC, Geneva, Switzerland, https://doi.org/10.59327/IPCC/AR6-9789291691647.001, 2023.
Iqbal, N., Ravan, M., Jamshed, A., Birkmann, J., Somarakis, G., Mitraka, Z., and Chrysoulakis, N.: Linkages between Typologies of Existing Urban Development Patterns and Human Vulnerability to Heat Stress in Lahore, Sustainability, 14, 10561, https://doi.org/10.3390/su141710561, 2022.
Iqbal, N., Ravan, M., Mitraka, Z., Birkmann, J., Grimmond, S., Hertwig, D., Chrysoulakis, N., Somarakis, G., Wendnagel-Beck, A., and Panagiotakis, E.: Datasets for: How does perceived heat stress differ between urban forms and human vulnerability profiles? – case study Berlin, Zenodo [data set], https://doi.org/10.5281/zenodo.12192376, 2024.
Jamshed, A., Rana, I. A., Birkmann, J., and Nadeem, O.: Changes in Vulnerability and Response Capacities of Rural Communities After Extreme Events: Case of Major Floods of 2010 and 2014 in Pakistan, J. Extr. Even., 04, 1750013, https://doi.org/10.1142/S2345737617500130, 2017.
Kaveckis, G.: Modeling future population's vulnerability to heat waves in Greater Hamburg, dissertation, Staats- und Universitätsbibliothek Hamburg Carl von Ossietzky, https://ediss.sub.uni-hamburg.de/handle/ediss/7365 (last access: 14 July 2025), 2017.
Klopfer, F.: The thermal performance of urban form – An analysis on urban structure types in Berlin, Appl. Geogr., 152, 102890, https://doi.org/10.1016/j.apgeog.2023.102890, 2023.
Kunz-Plapp, T., Hackenbruch, J., and Schipper, J. W.: Factors of subjective heat stress of urban citizens in contexts of everyday life, Nat. Hazards Earth Syst. Sci., 16, 977–994, https://doi.org/10.5194/nhess-16-977-2016, 2016.
Landesamt für Bürger- und Ordnungsangelegenheiten: Melderegister der Stadt Berlin, Landesamt für Bürger- und Ordnungsangelegenheiten, https://www.berlin.de/labo/ (last access: 15 July 2025), 2022.
Laranjeira, K., Göttsche, F., Birkmann, J., and Garschagen, M.: Heat vulnerability and adaptive capacities: findings of a household survey in Ludwigsburg, BW, Germany, Climatic Change, 166, 14, https://doi.org/10.1007/s10584-021-03103-2, 2021.
Lemonsu, A., Viguié, V., Daniel, M., and Masson, V.: Vulnerability to heat waves: Impact of urban expansion scenarios on urban heat island and heat stress in Paris (France), Urban Climate, 14, 586–605, https://doi.org/10.1016/j.uclim.2015.10.007, 2015.
Li, T., Ban, J., Horton, R. M., Bader, D. A., Huang, G., Sun, Q., and Kinney, P. L.: Heat-related mortality projections for cardiovascular and respiratory disease under the changing climate in Beijing, China, Sci. Rep., 5, 11441, https://doi.org/10.1038/srep11441, 2015.
Lindberg, F. and Grimmond, C. S. B.: Nature of vegetation and building morphology characteristics across a city: Influence on shadow patterns and mean radiant temperatures in London, Urban Ecosyst., 14, 617–634, https://doi.org/10.1007/s11252-011-0184-5, 2011.
Lindberg, F., Grimmond, C. S. B., Gabey, A., Huang, B., Kent, C. W., Sun, T., Theeuwes, N. E., Järvi, L., Ward, H. C., Capel-Timms, I., Chang, Y., Jonsson, P., Krave, N., Liu, D., Meyer, D., Olofson, K. F. G., Tan, J., Wästberg, D., Xue, L., and Zhang, Z.: Urban Multi-scale Environmental Predictor (UMEP): An integrated tool for city-based climate services, Environ. Model. Softw., 99, 70–87, https://doi.org/10.1016/j.envsoft.2017.09.020, 2018.
Liu, B., Guo, X., and Jiang, J.: How Urban Morphology Relates to the Urban Heat Island Effect: A Multi-Indicator Study, Sustainability, 15, 10787, https://doi.org/10.3390/su151410787, 2023.
LUBW Landesanstalt für Umwelt, Messungen und Naturschutz Baden-Württemberg: Städtebaulicher Rahmenplan Klimaanpassung für die Stadt Karlsruhe, LUBW Landesanstalt für Umwelt, https://www.karlsruhe.de/mobilitaet-stadtbild/stadtplanung/staedtebauliche-projekte/klimaanpassungsplan (last access: 2 February 2023), 2014.
Lüthi, S., Fairless, C., Fischer, E. M., Scovronick, N., Armstrong, B., Coelho, M. D. S. Z. S., Guo, Y. L., Guo, Y., Honda, Y., Huber, V., Kyselý, J., Lavigne, E., Royé, D., Ryti, N., Silva, S., Urban, A., Gasparrini, A., Bresch, D. N., and Vicedo-Cabrera, A. M.: Rapid increase in the risk of heat-related mortality, Nat. Commun., 14, 4894, https://doi.org/10.1038/s41467-023-40599-x, 2023.
Marando, F., Heris, M. P., Zulian, G., Udías, A., Mentaschi, L., Chrysoulakis, N., Parastatidis, D., and Maes, J.: Urban heat island mitigation by green infrastructure in European Functional Urban Areas, Sustain. Cities Soc., 77, 103564, https://doi.org/10.1016/j.scs.2021.103564, 2022.
Meade, R. D., Akerman, A. P., Notley, S. R., McGinn, R., Poirier, P., Gosselin, P., and Kenny, G. P.: Physiological factors characterizing heat-vulnerable older adults: A narrative review, Environ. Int., 144, 105909, https://doi.org/10.1016/j.envint.2020.105909, 2020.
Mitraka, Z., Del Frate, F., Chrysoulakis, N., and Gastellu-Etchegorry, J.: Exploiting Earth Observation data products for mapping Local Climate Zones, in: 2015 Joint Urban Remote Sensing Event (JURSE), Lausanne, Switzerland, 30 March–1 April 2015, 1–4, https://doi.org/10.1109/JURSE.2015.7120456, 2015.
Mitraka, Z., Stagakis, S., Lantzanakis, G., Tzelidi, D., Chrysoulakis, N., Gastellu-Etchegorry, J.-P., Lindberg, F., Feigenwinter, C., and Grimmind, S.: URBANFLUXES Deliverable D8.4 Adaptation to Sentinels methodology and evaluation report, https://cordis.europa.eu/project/id/637519/results (last access: 22 July 2025), 2017.
Narocki, C.: Heatwaves as an Occupational Hazard: The Impact of Heat and Heatwaves on Workers' Health, Safety and Wellbeing and on Social Inequalities, ETUI aisbl, Brussels, SSRN Journal, https://doi.org/10.2139/ssrn.4013353, 2021.
Oke, T. R.: Canyon geometry and the nocturnal urban heat island: Comparison of scale model and field observations, J. Climatol., 1, 237–254, https://doi.org/10.1002/joc.3370010304, 1981.
Oke, T. R., Mills, G., Christen, A., and Voogt, J. A.: Urban climates, Cambridge University Press, Cambridge, United Kingdom, New York, NY, 525 pp., https://doi.org/10.1017/9781139016476, 2017.
Oliveira, A., Lopes, A., and Niza, S.: Local climate zones in five southern European cities: An improved GIS-based classification method based on Copernicus data, Urban Climate, 33, 100631, https://doi.org/10.1016/j.uclim.2020.100631, 2020.
Park, J., Hallegatte, S., Bangalore, M., and Sandhoefner, E.: Households and Heat Stress: Estimating the Distributional Consequences of Climate Change, World Bank Policy Research Working Paper No. 7479, SSRN, https://ssrn.com/abstract=2688377 (last access: 15 July 2025), 2015.
Ren, C., Cai, M., Li, X., Zhang, L., Wang, R., Xu, Y., and Ng, E.: Assessment of Local Climate Zone Classification Maps of Cities in China and Feasible Refinements, Sci. Rep., 9, 18848, https://doi.org/10.1038/s41598-019-55444-9, 2019.
Rocha, A. D., Vulova, S., Förster, M., Gioli, B., Matthews, B., Helfter, C., Meier, F., Steeneveld, G.-J., Barlow, J. F., Järvi, L., Chrysoulakis, N., Nicolini, G., and Kleinschmit, B.: Unprivileged groups are less served by green cooling services in major European urban areas, Nat. Cities, 1, 424–435, https://doi.org/10.1038/s44284-024-00077-x, 2024.
Rosenzweig, C., Ruane, A. C., Antle, J., Elliott, J., Ashfaq, M., Chatta, A. A., Ewert, F., Folberth, C., Hathie, I., Havlik, P., Hoogenboom, G., Lotze-Campen, H., MacCarthy, D. S., Mason-D'Croz, D., Contreras, E. M., Müller, C., Perez-Dominguez, I., Phillips, M., Porter, C., Raymundo, R. M., Sands, R. D., Schleussner, C.-F., Valdivia, R. O., Valin, H., and Wiebe, K.: Coordinating AgMIP data and models across global and regional scales for 1.5 °C and 2.0 °C assessments, Phil. Trans. R. Soc. A., 376, 20160455, https://doi.org/10.1098/rsta.2016.0455, 2018.
Schär, C., Vidale, P. L., Lüthi, D., Frei, C., Häberli, C., Liniger, M. A., and Appenzeller, C.: The role of increasing temperature variability in European summer heatwaves, Nature, 427, 332–336, https://doi.org/10.1038/nature02300, 2004.
Schuster, C., Burkart, K., and Lakes, T.: Heat mortality in Berlin – Spatial variability at the neighborhood scale, Urban Climate, 10, 134–147, https://doi.org/10.1016/j.uclim.2014.10.008, 2014.
Schwaab, J., Meier, R., Mussetti, G., Seneviratne, S., Bürgi, C., and Davin, E. L.: The role of urban trees in reducing land surface temperatures in European cities, Nat. Commun., 12, 6763, https://doi.org/10.1038/s41467-021-26768-w, 2021.
Schwingshackl, C., Daloz, A. S., Iles, C., Aunan, K., and Sillmann, J.: High-resolution projections of ambient heat for major European cities using different heat metrics, Nat. Hazards Earth Syst. Sci., 24, 331–354, https://doi.org/10.5194/nhess-24-331-2024, 2024.
Senatsverwaltung für Stadtentwicklung, Bauen und Wohnen: Urban Development Plan (StEP) Climate 2.0, Senatsverwaltung für Stadtentwicklung, Bauen und Wohnen, https://www.berlin.de/sen/stadtentwicklung/planung/stadtentwicklungsplaene/step-klima-2-0/ (last access: 2 March 2023), 2023.
Senatsverwaltung für Stadtentwicklung und Umwelt: Klimamodell Berlin, Senatsverwaltung für Stadtentwicklung und Umwelt, https://www.berlin.de/umweltatlas/klima/klimaanalyse/2014/zusammenfassung/ (last access: 2 March 2023), 2014.
Senatsverwaltung für Stadtentwicklung und Umwelt: Planungshinweiskarte Stadtklima, Senatsverwaltung für Stadtentwicklung und Umwelt, https://www.berlin.de/umweltatlas/_assets/literatur/planungshinweise_stadtklimaberlin_2015.pdf?ts=1704197525 (last access: 2 March 2023), 2015.
Senatsverwaltung für Stadtentwicklung und Wohnen: Dokumentation Bodennutzung und Stadtstruktur 2020, Senatsverwaltung für Stadtentwicklung und Wohnen, https://www.berlin.de/umweltatlas/_assets/literatur/nutzungen_stadtstruktur_2020.pdf?ts=1726132803 (last access: 1 September 2024), 2020.
Senatsverwaltung für Stadtentwicklung und Wohnen: Urbane Struktur/Urbane Struktur – Flächentypen differenziert, Senatsverwaltung für Stadtentwicklung und Wohnen, https://www.berlin.de/umweltatlas/en/land-use/urban-structure/ (last access: 2 March 2023), 2021.
Senatsverwaltung für Stadtentwicklung und Wohnen Berlin: Monitoring Soziale Stadtentwicklung, Senatsverwaltung für Stadtentwicklung und Wohnen Berlin, https://www.stadtentwicklung.berlin.de/planen/basisdaten_stadtentwicklung/monitoring/index.shtml (last access: 12 September 2023), 2019.
Song, Y., Ge, Y., Wang, J., Ren, Z., Liao, Y., and Peng, J.: Spatial distribution estimation of malaria in northern China and its scenarios in 2020, 2030, 2040 and 2050, Malaria J., 15, 345, https://doi.org/10.1186/s12936-016-1395-2, 2016.
Sousa-Silva, R. and Zanocco, C.; Assessing public attitudes towards urban green spaces as a heat adaptation strategy: Insights from Germany, Landscape Urban Plan., 245, 105013, https://doi.org/10.1016/j.landurbplan.2024.105013, 2024.
Statistisches Bundesamt: Altersstruktur der Bevölkerung in Berlin, 2022 und 2070, Statistisches Bundesamt, https://www.demografie-portal.de/DE/Fakten/Daten/bevoelkerung-altersstruktur-berlin.csv?__blob=publicationFile&v=4 (last access: 3 September 2023), 2022.
Stewart, I. D. and Oke, T. R.: Local Climate Zones for Urban Temperature Studies, B. Am. Meteorol. Soc., 93, 1879–1900, https://doi.org/10.1175/BAMS-D-11-00019.1, 2012.
Stewart, I. D., Krayenhoff, E. S., Voogt, J. A., Lachapelle, J. A., Allen, M. A., and Broadbent, A. M.: Time Evolution of the Surface Urban Heat Island, Earths Future, 9, e2021EF002178, https://doi.org/10.1029/2021EF002178, 2021.
Sun, S., Wang, Z., Hu, C., and Gao, G.: Understanding Climate Hazard Patterns and Urban Adaptation Measures in China, Sustainability, 13, 13886, https://doi.org/10.3390/su132413886, 2021.
Tollefson, J.: IPCC climate report: Earth is warmer than it's been in 125 000 years, Nature, 596, 171–172, https://doi.org/10.1038/d41586-021-02179-1, 2021.
Tuholske, C., Caylor, K., Funk, C., Verdin, A., Sweeney, S., Grace, K., Peterson, P., and Evans, T.: Global urban population exposure to extreme heat, P. Natl. Acad. Sci. USA, 118, e2024792118, https://doi.org/10.1073/pnas.2024792118, 2021.
Turek-Hankins, L. L., Coughlan de Perez, E., Scarpa, G., Ruiz-Diaz, R., Schwerdtle, P. N., Joe, E. T., Galappaththi, E. K., French, E. M., Austin, S. E., Singh, C., Siña, M., S., A. R., van Aalst, M. K., Templeman, S., Nunbogu, A. M., Berrang-Ford, L., Agrawal, T., and Mach, K. J.: Climate change adaptation to extreme heat: a global systematic review of implemented action, Oxford Open Climate Change, 1, kgab005, https://doi.org/10.1093/oxfclm/kgab005, 2021.
Turner, V. K., Middel, A., and Vanos, J. K.: Shade is an essential solution for hotter cities, Nature, 619, 694–697, https://doi.org/10.1038/d41586-023-02311-3, 2023.
United Nations: World Population Prospects, Department of Economic and Social Affairs, Population Division, https://www.un.org/development/desa/pd/sites/www.un.org.development.desa.pd/files/undesa_pd_2022_wpp-data_sources.pdf (last access: 21 November 2023), 2022.
Verdonck, M., Demuzere, M., Hooyberghs, H., Beck, C., Cyrys, J., Schneider, A., Dewulf, R., and van Coillie, F.: The potential of local climate zones maps as a heat stress assessment tool, supported by simulated air temperature data, Landscape Urban Plan., 178, 183–197, https://doi.org/10.1016/j.landurbplan.2018.06.004, 2018.
Vicedo-Cabrera, A. M., Scovronick, N., Sera, F., Royé, D., Schneider, R., Tobias, A., Astrom, C., Guo, Y., Honda, Y., Hondula, D. M., Abrutzky, R., Tong, S., Coelho, M. d. S. Z. S., Saldiva, P. H. N., Lavigne, E., Correa, P. M., Ortega, N. V., Kan, H., Osorio, S., Kyselý, J., Urban, A., Orru, H., Indermitte, E., Jaakkola, J. J. K., Ryti, N., Pascal, M., Schneider, A., Katsouyanni, K., Samoli, E., Mayvaneh, F., Entezari, A., Goodman, P., Zeka, A., Michelozzi, P., de’Donato, F., Hashizume, M., Alahmad, B., Diaz, M. H., La Valencia, C. D. C., Overcenco, A., Houthuijs, D., Ameling, C., Rao, S., Di Ruscio, F., Carrasco-Escobar, G., Seposo, X., Silva, S., Madureira, J., Holobaca, I. H., Fratianni, S., Acquaotta, F., Kim, H., Lee, W., Iniguez, C., Forsberg, B., Ragettli, M. S., Guo, Y. L. L., Chen, B. Y., Li, S., Armstrong, B., Aleman, A., Zanobetti, A., Schwartz, J., Dang, T. N., Dung, D. V., Gillett, N., Haines, A., Mengel, M., Huber, V., and Gasparrini, A.: The burden of heat-related mortality attributable to recent human-induced climate change, Nat. Clim. Chang., 11, 492–500, https://doi.org/10.1038/s41558-021-01058-x, 2021.
von Szombathely, M., Bechtel, B., Lemke, B., Oßenbrügge, J., Pohl, T., and Pott, M.: Empirical Evidences for Urban Influences on Public Health in Hamburg, Appl. Sci., 9, 2303, https://doi.org/10.3390/app9112303, 2019.
Voogt, J. and Oke, T.: Thermal remote sensing of urban climates, Remote Sens. Environ., 86, 370–384, https://doi.org/10.1016/S0034-4257(03)00079-8, 2003.
Wende, W.: Publikationsreihe des BMBF-geförderten Projektes REGKLAM – regionales Klimaanpassungsprogramm für die Modellregion Dresden (Vol. 6).: Grundlagen für eine klimawandelangepasste Stadt- und Freiraumplanung, RHOMBOS-VERLAG (Rhombos Publishing House), ISBN 978-3-944101-15-6, 2014.
Wendnagel-Beck, A., Ravan, M., Iqbal, N., Birkmann, J., Somarakis, G., Hertwig, D., Chrysoulakis, N., and Grimmond, S.: Characterizing Physical and Social Compositions of Cities to Inform Climate Adaptation: Case Studies in Germany, Urban Planning, 6, 321–337, https://doi.org/10.17645/up.v6i4.4515, 2021.
Willroth, P., Massmann, F., Wehrhahn, R., and Revilla Diez, J.: Socio-economic vulnerability of coastal communities in southern Thailand: the development of adaptation strategies, Nat. Hazards Earth Syst. Sci., 12, 2647–2658, https://doi.org/10.5194/nhess-12-2647-2012, 2012.
Wouters, H.: Heat stress increase under climate change twice as large in cities as in rural areas: A study for a densely populated midlatitude maritime region, Geophys. Res. Lett., 44, 8997–9007, 2017.
Yang, J., Yang, Y., Sun, D., Jin, C., and Xiao, X.: Influence of urban morphological characteristics on thermal environment, Sustain. Cities Soc., 72, 103045, https://doi.org/10.1016/j.scs.2021.103045, 2021.
Yue, W., Liu, X., Zhou, Y., and Liu, Y.: Impacts of urban configuration on urban heat island: An empirical study in China mega-cities, Sci. Total Environ., 671, 1036–1046, https://doi.org/10.1016/j.scitotenv.2019.03.421, 2019.
Zhou, W., Huang, G., and Cadenasso, M. L.: Does spatial configuration matter? Understanding the effects of land cover pattern on land surface temperature in urban landscapes, Landscape Urban Plan., 102, 54–63, https://doi.org/10.1016/j.landurbplan.2011.03.009, 2011.
Zhu, X., Hu, J., Qiu, C., Shi, Y., Bagheri, H., Kang, J., Li, H., Mou, L., Zhang, G., Häberle, M., Han, S., Hua, Y., Huang, R., Hughes, L., Sun, Y., Schmitt, M., and Wang, Y.: So2Sat LCZ42: A Benchmark Dataset for Global Local Climate Zones Classification, University Library of the Technical University of Munich, https://doi.org/10.14459/2018MP1483140, 2018.
Zuhra, S. S., Tabinda, A. B., and Yasar, A.: Appraisal of the heat vulnerability index in Punjab: a case study of spatial pattern for exposure, sensitivity, and adaptive capacity in megacity Lahore, Pakistan, Int. J. Biometeorol., 63, 1669–1682, https://doi.org/10.1007/s00484-019-01784-0, 2019.