the Creative Commons Attribution 4.0 License.
the Creative Commons Attribution 4.0 License.
 | 21 Jul 2025
An automated approach for developing geohazard inventories using news: integrating natural language processing (NLP), machine learning, and mapping
Ogün Demir
Tolga Görüm
Spatiotemporal inventories of geohazards are essential for comprehending the building of resilient societies; yet, restricted access to global inventories hinders the advancement of mitigation strategies. Consequently, we developed an approach that enhances the potential of using online newspapers in the creation of geohazard inventories by utilizing web scraping, natural language processing (NLP), clustering, and geolocation of textual data. Here, we use online newspapers from 1997–2023 in Türkiye to employ our approach. In the first stage, we retrieved 15 569 news articles by using our tr-news-scraper tool, considering wildfire-, flood-, landslide-, and sinkhole-related geohazard news. Further, we utilized NLP preprocessing approaches to refine the raw texts obtained from newspaper sources, which were subsequently clustered into four geohazard groups, resulting in 3928 news articles. In the final stage of the approach, we developed a method that geolocates the news using the OpenStreetMap (OSM) Nominatim tool, ending up with a total of 13 940 geohazard incidents derived from news comprising multiple incidents across various locations. As a result, we mapped 9609 floods, 1834 wildfires, 1843 landslides, and 654 sinkhole formation incidents from online newspaper sources, showing a spatiotemporally consistent distribution with the existing literature. Consequently, we illustrated the potential of using online newspaper articles in the development of geohazard inventories with our approach, which draws text data from web sources to generate maps by leveraging the capabilities of web scraping, NLP, and mapping techniques.
- Article
(6205 KB) - Full-text XML
-
Supplement
(662 KB) - BibTeX
- EndNote


Geohazards are direct threats to human life, ecosystems, and societies worldwide from a socio-economic perspective, demanding ongoing innovation and development in the mapping, analysis, and monitoring of these events. The average annual economic loss due to geohazards has been 34 billion US$ since 1900 according to the Emergency Management Database (CRED, 2023). According to the Sendai Framework, over 700 000 people have lost their lives and >1.5 billion people have suffered from geohazards in the period between 2005 and 2015 (UNISDR, 2015, p. 12). However, the amount of damage and loss from different geohazards might be underestimated, as massive events such as large earthquakes and extreme wildfire events tend to trigger and cause subsequent disasters, such as landslides, debris flows, flooding, and soil erosion. For instance, the Wenchuan earthquake, Mw 7.9 (USGS, 2008), triggered more than 60 000 landslides (Görüm et al., 2011), and its prolonged impact can be felt even years after due to landslide damming, which is recognized as a hazard due to the ability to release outburst floods (Delaney and Evans, 2015; Fan et al., 2012, 2019; Peng and Zhang, 2012). Therefore, the lack of thorough evaluations and databases customized for specific hazard types causes temporal delays that hinder the understanding of the dynamics of temporal and spatial probability and the overall socio-economic and environmental losses of geohazards. This obstacle results from the differences in data collection and monitoring practices among countries, each of which is subject to different legal frameworks.
Spatiotemporal archive inventorying is crucial for a better understanding of susceptibility to and the hazard level and risk assessment of geohazards (Rana et al., 2021; Tanyaş et al., 2017, 2022; Loche et al., 2022; Gómez et al., 2023; Stein et al., 2024; Bhuyan et al., 2024). Also, these inventories can provide an objective base for resilience and preparedness for disaster risk reduction strategies (Jones et al., 2022). For instance, a well-known database, i.e., the Emergency Events Database (EM-DAT), operated under the Centre for Research on the Epidemiology of Disasters (CRED), provides a wide range of geohazard inventory (subgroups: geophysical, hydrological, meteorological, climatological, biological, and extra-terrestrial) with their corresponding casualties and economic loss (Guha-Sapir et al., 2015). However, some studies (Froude and Petley, 2018; Görüm and Fidan, 2021; Haque et al., 2016; Stein et al., 2024) highlighted that EM-DAT lacks a thorough assessment of geohazards because it includes events that resulted in the death of 10 or more people, 100 affected people, a declaration of a state of emergency, and a call for international assistance (Guha-Sapir et al., 2015). To overcome this constraint, some efforts to establish global or national spatiotemporal geohazard geo-databases have been made, particularly for fatalities, utilizing systematic metadata search techniques that obtain data from news articles, media sources, and national archives (Froude and Petley, 2018; Görüm and Fidan, 2021; Haque et al., 2016; Kirschbaum et al., 2015, 2010; Petley, 2012; Taylor et al., 2015). Beyond the value of comprehending geohazards within the spatiotemporal inventories, these geo-databases frequently necessitate and rely on a workforce for labor-intensive tasks, such as compiling, gathering, and analyzing the data, in the creation of inventories.
Over the last two decades, there has been a noticeable advancement in the integration of artificial intelligence, namely, machine learning (ML), deep learning (DL), and natural language processing (NLP), to create automated or semi-automated approaches for the detection of geohazards (Meena et al., 2022), monitoring (Restrepo-Estrada et al., 2018), early warning systems (Kitazawa and Hale, 2021), prediction (Fang et al., 2023), and the compilation and database generation pertaining to geohazards. However, the spatiotemporal data gathered by government and private databases are usually restricted or owned by private enterprises for profit (Lai et al., 2022). Internet sources, like online newspapers and social media, have been widely used to overcome this limitation by applying ML and NLP tools. For instance, Sodoge et al. (2023) proposed an approach for the automatization of drought impacts and created a spatiotemporal database based on newspaper articles in Germany between 2001 and 2021 using lasso logistic regression for impact detection and named entity recognition in location identification. The spatiotemporal distribution of historical floods and storms was extracted using online newspapers from across the United States by employing a hybrid named entity recognition model (Lai et al., 2022). On the other hand, social media, particularly X (formerly known as Twitter), enabled researchers to assess spatiotemporal patterns and to create a database of geohazards by using data crawling methods (Franceschini et al., 2024). For instance, Hickey et al. (2024) tracked variations in the social reaction of geo-tagged Twitter posts during the 2018 eruption of Kīlauea, Hawaii, and found the reflective patterns of volcanic activities in the posts using sentiment analysis and ML tools.
Despite the wide application spectrum of NLP, ML, and DL tools in the creation of inventories or databases and the assessment of geohazard research, the previous studies mainly focus on single web sources and geohazards such as drought (Madruga De Brito et al., 2020; Sodoge et al., 2024), landslides (Battistini et al., 2013), flood (Liu et al., 2020), and typhoon (Kitazawa and Hale, 2021). Therefore, we developed an integrated method that retrieves, classifies, and geolocates multiple geohazards, i.e., landslide, flood, wildfire, and sinkhole formation, using online newspaper sources in Türkiye between 1997 and 2023. We chose Türkiye as our research focus due to its proneness to geohazards leading to annual casualties (Görüm and Fidan, 2021) and socio-economic losses. Even though Türkiye highly suffers from earthquakes, we exclude earthquakes from our approach because of geo-tagging problems due to the epicenter and news reporting distance (Battistini et al., 2013) and because international and national services provide freely available near-real-time spatial data of earthquake distributions.
The key goal of this research, therefore, is to develop an automated approach for building spatiotemporal inventories and maps of geohazards in Türkiye, such as sinkhole formation, wildfires, floods, and landslides. Our research aims to develop a system capable of parsing newspaper articles regarding geohazards from online sources, automatically classifying the news by hazard type, extracting relevant spatial coordinates and dates of occurrence, and subsequently mapping and storing the gathered geohazard data.
To accomplish our goals, the general concept of the proposed approach includes five integrated main steps: (1) data collection from newspaper websites using a web scraper tool that we developed, (2) NLP preprocessing that cleans data and extracts locations with named entity recognition (NER), (3) modeling, i.e., non-negative metric factorization for topic modeling, (4) geolocating, for which we developed an algorithm using Nominatim, and (5) final inventory mapping.
2.1 Data collection
We developed a Python tool, “tr-news-scraper” (Demir and Avcioglu, 2024), to retrieve geohazard-related news from newspaper websites. However, it is a flexible library that can be used to parse any news by feeding some keywords as input. This application fetches HTML content from predefined websites of news by using the requests library. We targeted well-established national newspaper agencies that have been publishing for at least 10 years: Sabah, Milliyet, Hürriyet, CNN Türk, and Posta.
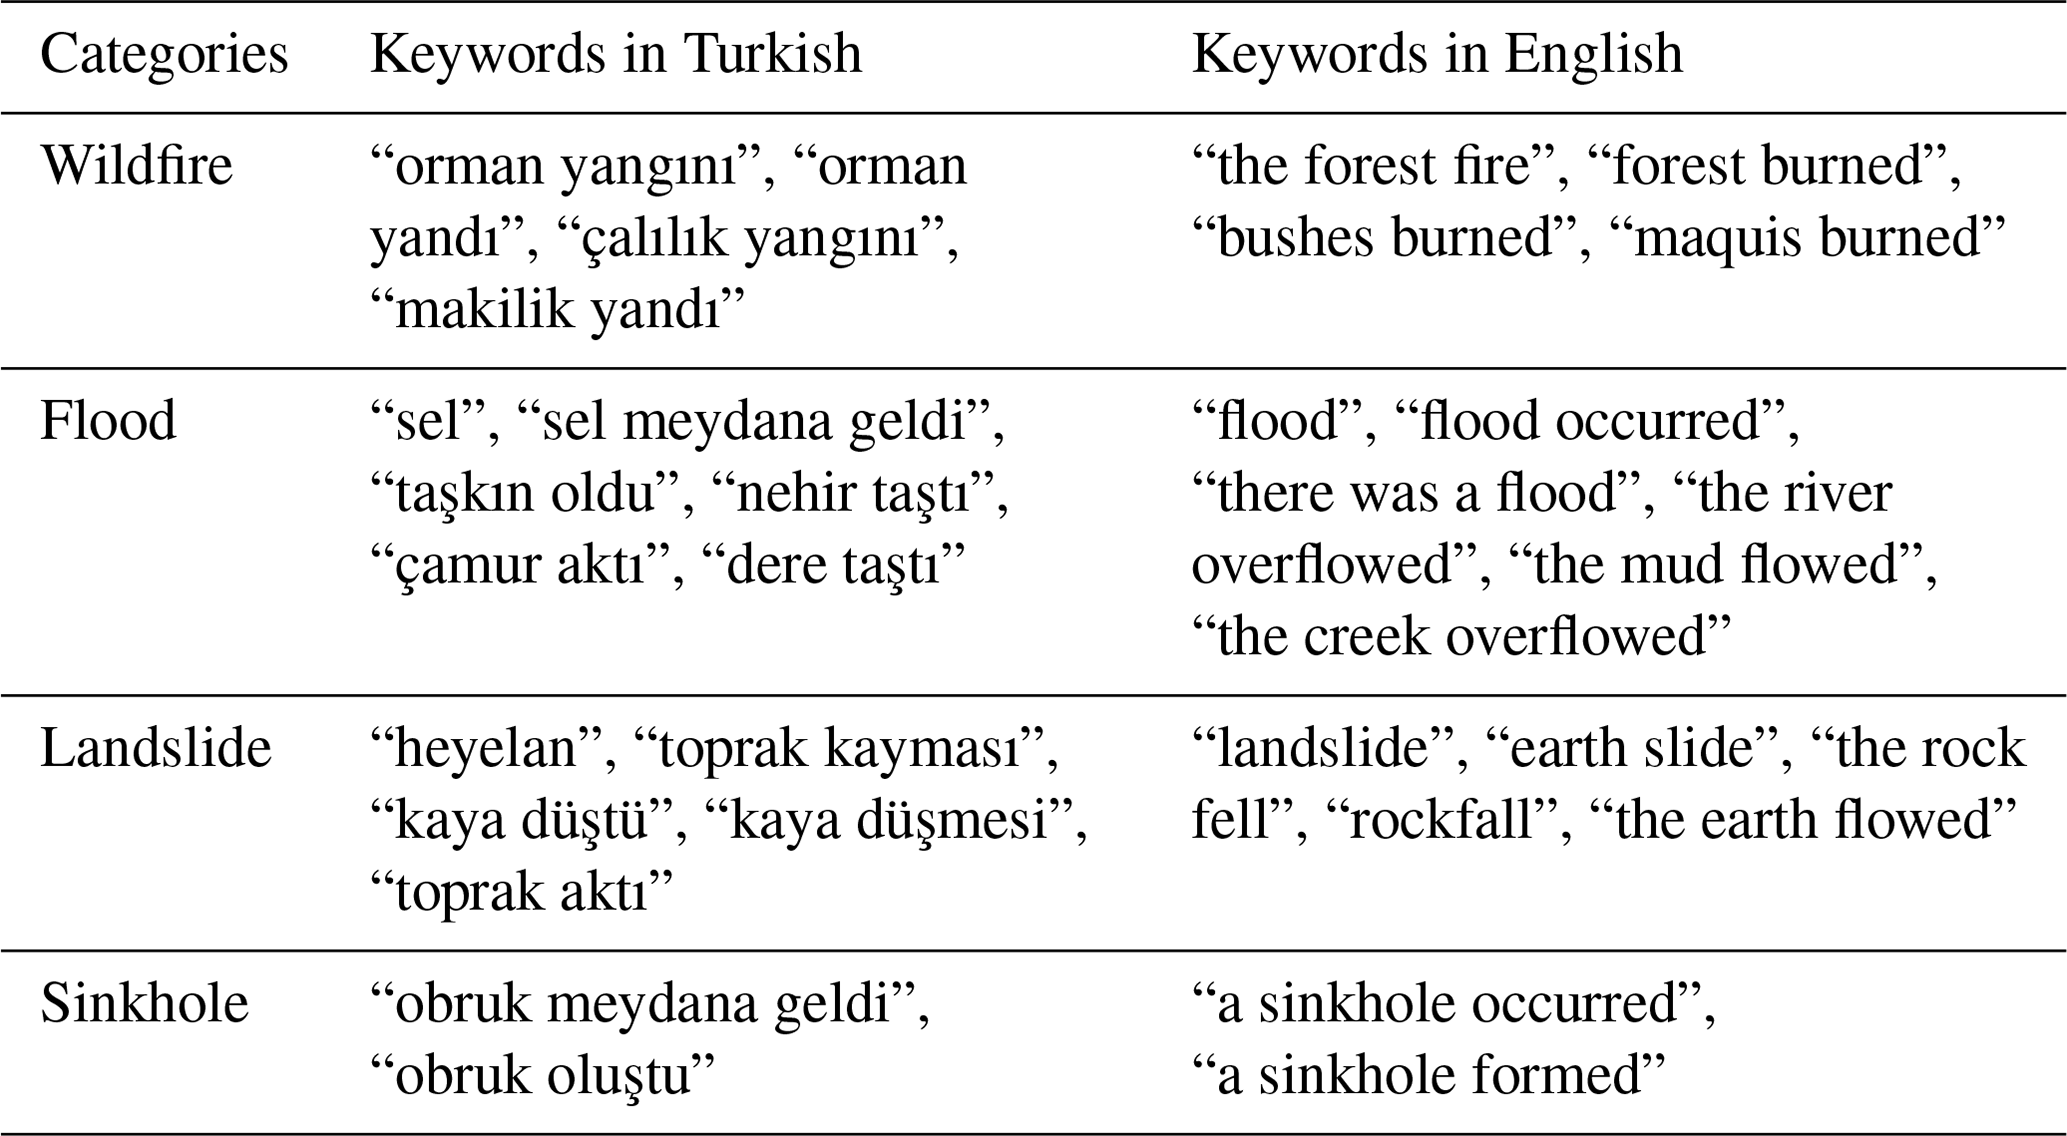
A list of keywords associated with geohazards (Table 1) has been input into the tr-news-scraper. It fetches the URLs of newspaper articles that include each term by going through many pages of each news website. The scraper adds a delay between requests to avoid flooding the servers and getting blocked. The tool records metadata for every news article URL it fetches containing the article's keywords and the publishing date of the news. It also utilizes caching techniques to prevent retrieving the same URL twice.
Table 1The keywords (in Turkish) associated with geohazards that are used to fetch newspaper articles in Türkiye.
Subsequently, the content of each news article is retrieved by the scraper tool after gathering all the URLs. It takes advantage of the newspaper library to make article extraction and processing easier. The scraper gathers relevant data for every URL, including the title of the article, the author(s), the date of publication, the primary text content, related keywords, and any images that are accessible. Following extraction, the data are structured into a Pandas DataFrame (Table S1 in the Supplement) to ensure that it can be examined further. The scraper eliminates duplicate entries based on both the textual content and URL to ensure data integrity. In essence, the tr-news-scraper tool retrieves news articles about geohazards automatically from several websites, giving a large dataset for further analysis and classification.
2.2 NLP preprocessing
The unrefined data retrieved from web sources, as stated above, typically lack spatial coordinates and are unstructured. The context of news is transformed multiple times throughout the preprocessing stage before being analyzed. NLP preprocessing requires multiple steps to get text (i.e., news) input ready for additional modeling or analysis. In advance of analysis and modeling, Hickman et al. (2022) portrayed the following common steps for text preprocessing: text identification (i.e., tokenization), content removal (i.e., stop words and non-alphabetic characters removed), agglomeration of semantically related terms to reduce data sparsity and improve predictive power (i.e., lowercase conversion, misspelling correction, contraction/abbreviation expansion, and stem/lemmatized), and capturing more semantic information (i.e., handling negation).
We followed the steps shown in Fig. 1 to complete the cleaning and preprocessing of the unrefined data parsed from web sources to get ready for further analyses. Initially, we filled in the missing contents (the main body of the news) with the meta description text, which summarizes the parsed news related to our target keywords. This step was necessary owing to the contents, as news articles contain titles but lack corresponding content during the parsing procedures. Duplicates that originate from the same media sources yet differ in keywords were removed from the retrieved dataset. We created a new column by merging the titles and contents of the individual columns we parsed, which better represented each event (such as a flood, landslide, etc.) or unrelated news concerning our target. This step was carried out because titles provide succinct, event-specific information that highlights the distinctive features, such as type, location, and date of geohazards. Subsequently, we utilized lowercase conversion, which is a standard application in NLP (Hickman et al., 2022), to new merged content, which includes titles and the main body of the news. Also, the removal of punctuation from content was a necessary step in achieving our objective of cleaning noisy text by using specific filters (noun, adjective, adverb, and verb), thus enabling the elimination of conjunctions, punctuation marks, articles, etc. After that, in order to improve the coherence and consistency of our text analysis, we lemmatized our content using the TrSpaCy pipeline (Altinok, 2023) to break words down to their most basic forms utilizing linguistic processing approaches. Lemmatization is a step that helps to standardize terminology and makes semantic analysis across the corpus more accurate.
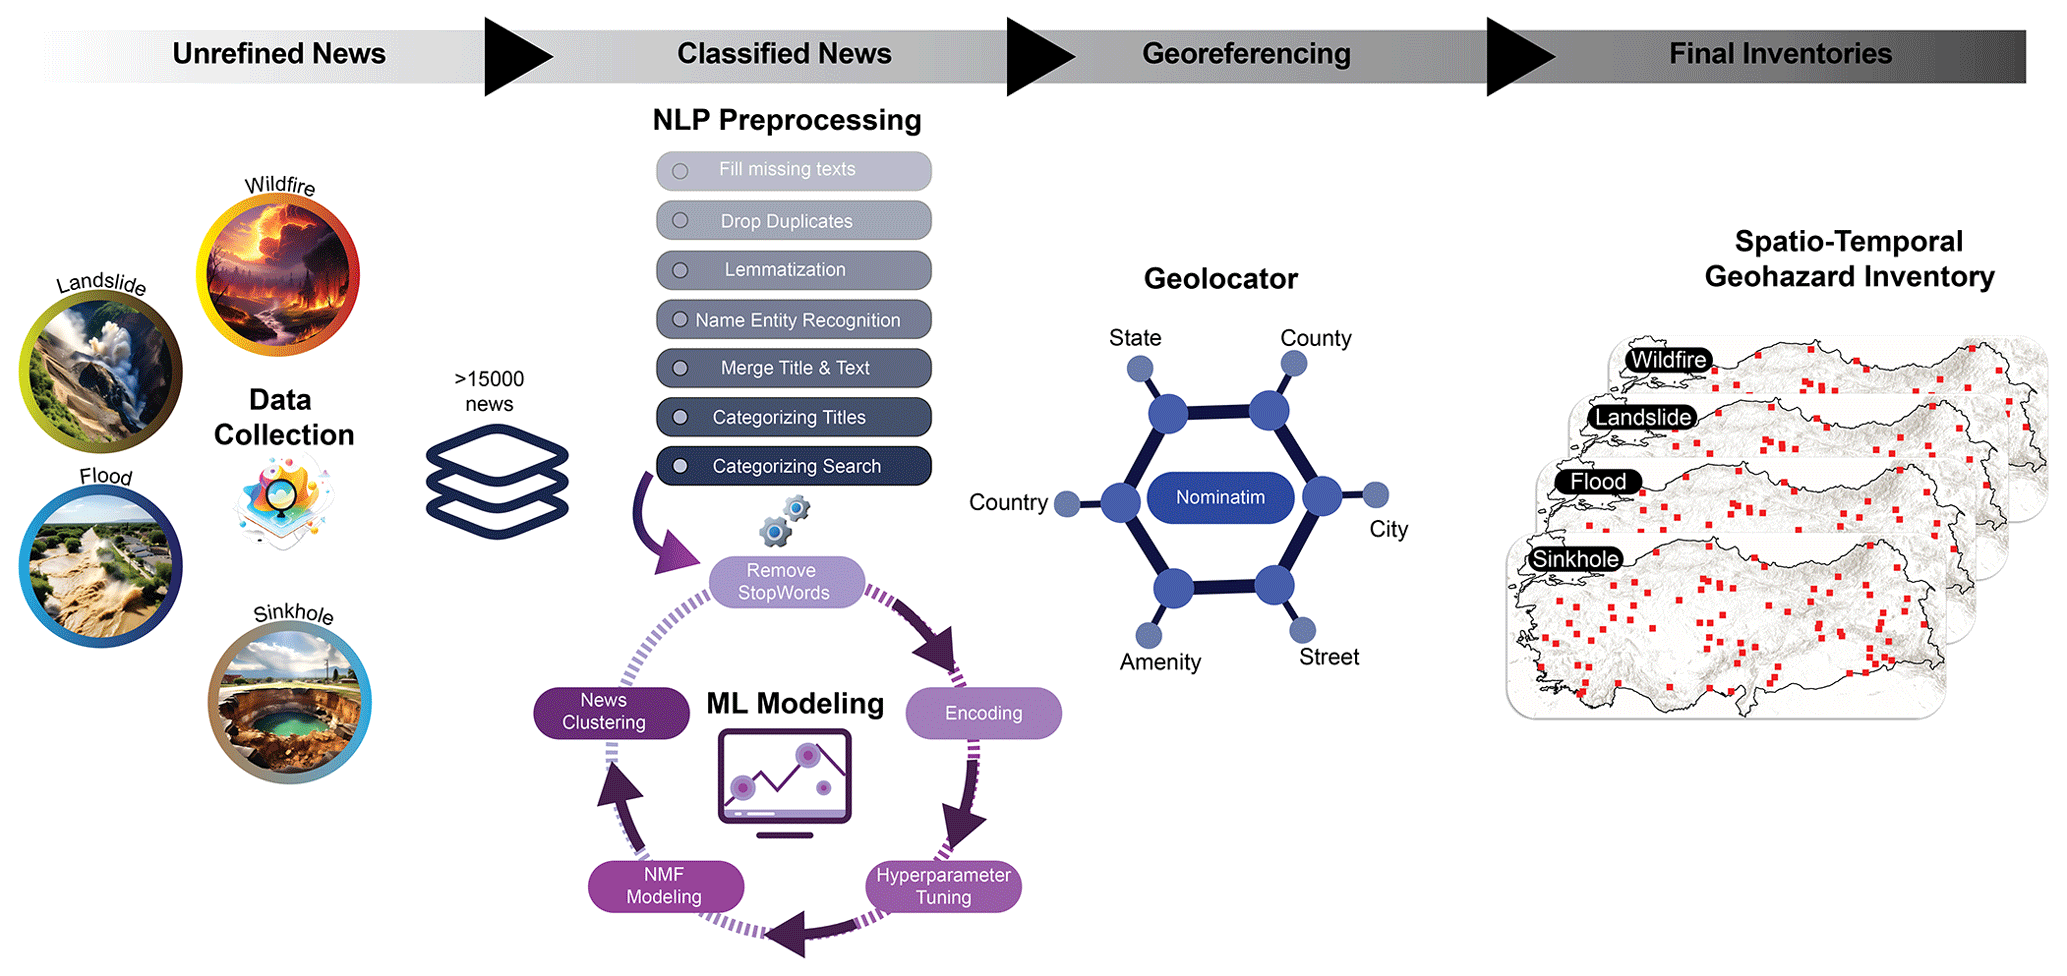
Figure 1The systematic flowchart of the methodology, which summarizes the steps employed, from the data gathering stage to the final inventory mapping stage. The illustration of geohazards with photos in the “Unrefined News” section of the figure was created with the assistance of the DALL-E model (OpenAI, 2025).
When identifying the stop words for the geohazard news articles, it is necessary to compile a detailed list of commonly used terms that are unrelated to the incident. By removing noise and unimportant information from the original stop-word compilation, content (i.e., type, date, and location of event) directly related to the disaster of interest can be identified more accurately. We may fine-tune our search criteria and improve the accuracy of our data retrieval efforts by deliberately eliminating irrelevant terms from our analysis.
Vectorization is another essential step for text classification in NLP. We utilized the term frequency (TF)–inverse document frequency (IDF) technique (TF-IDF), which is a widely used statistical method in NLP and feature extraction. We apply the TfidfVectorizer using scikit-learn (Pedregosa et al., 2011) in scaling the words. TF is the number of times a term appears in a document in relation to the total number of words in that document, as described by Eq. (1):
A term's IDF shows how many documents in the corpus contain that term. Words that are specific to a limited subset of papers (for example, technical jargon terms) are given a greater relevance value than words that are used in all publications (a, the, and), as described by Eq. (2):
It is important to note that the IDF equation continues to prioritize relevant terms such as “forest burned”, but the lack of scaling would result in an excessive focus on infrequent words such as “and, or, the, etc.”. By employing a logarithmic transformation, we mitigate the influence of excessively common words that lack utility for classification while preserving significant distinctions among pertinent terms. By making this change, the model is guaranteed to concentrate on informative terms instead of giving common ones an excessive amount of weight.
Then, TF-IDF can be calculated by multiplying the TF and IDF scores:
n-grams, a hyperparameter in the TfidfVectorizer, were applied as “ngram_range = (1,2)” for unigrams and diagrams capturing both single words and pairs of words within the specified range to better represent nuanced text data. By doing so, we benefit from more contextual meaning, for example, by maintaining word sequences, enabling models to differentiate phrases such as “sinkhole occurred” from the individual terms “sinkhole” and “occurred”, which may possess distinct meanings when analyzed apart from one another.
Named entity recognition (NER) is the process of locating specific words or phrases, so-called “entities”, in a document and categorizing them into groups like people, places, or events. It helps to grasp the context and meaning of the text, which is important for a variety of natural language processing applications, such as sentiment analysis and information extraction. We used the NER component of TrSpaCy, which is the first spaCy model trained for the Turkish language, produced by using diverse sources in the Turkish language: Wikipedia articles, crawling of e-commerce, and movie review websites for different genres (Altinok, 2023). This model essentially includes a tokenizer, trainable lemmatizer, POS tagger, dependency parser, morphologizer, and NER pipelines.
2.3 Modeling
Once the unrefined data have been successfully preprocessed, the next step is to feed these refined contents into several models for additional processing and prediction. First, the most relevant keywords related to geohazards are identified using the non-negative matrix factorization (NMF) technique, which was first pioneered by Paatero and Tapper (1994), Paatero (1997) as well as Lee and Seung (1999, 2001). We chose NMF because it is predictable and typically converges faster, and it is ideal for exploratory topic modeling, particularly where the interpretation and clarity of the analysis subject matter are of the greatest concern.
2.3.1 Non-negative matrix factorization (NMF)
NMF refers to a set of linear algebra and multivariate analysis techniques where a matrix X is divided into two matrices, W and H, each of which has only non-negative elements, by minimizing the distance d between X and the product of WH. The most widely used distance metric is the squared Frobenius norm, which is a simple matrix application adaption of the Euclidean norm (Lee and Seung, 1999), as shown in Eq. (4):
This approach, which is an unsupervised learning technique, reduces the dimensionality of data into spaces of fewer dimensions. We used the NMF model as an additional step for the filtration of data, which are initially categorized into different types of geohazard in the preprocessing section. This model identifies and finds the different clusters of geohazards efficiently, as the original dataset parsed through our tr-news-scraper method contains irrelevant and noisy information that originated from the search engine optimization (SEO) practices of the news websites. This method incorporates news information that can increase news visibility to search engines and their user base.
The NMF model suggests clusters that are either geohazards or not by using the parsed and preprocessed news content as input data. Further, we expand this division to encompass different categories of geohazards by increasing the number of natural clusters within the NMF model that we seek to autonomously detect. As mentioned above, the primary goal of the NMF model is to identify and differentiate the themes related to different geohazard and others (i.e., those not related to geohazards, e.g., health, politics, and sports) that also need to be evaluated by further validation procedures. Therefore, we utilized the coherence score and expert-based evaluation to validate the results of the NMF model. The coherence score measures the semantic similarity between high-scoring words within each topic, evaluating how interpretable and meaningful the topics are (Rehurek and Sojka, 2010; Röder et al., 2015). To assess the coherence of the news topics produced by the NMF model, we employed the Coherence Model from the Gensim library (Rehurek and Sojka, 2010). We utilized Cv as the coherence option in the Coherence Model. Cv uses a sliding window approach, grouping the top words into a single set and employing an indirect validation metric that combines normalized pointwise mutual information (NPMI) with cosine similarity (Rehurek and Sojka, 2010; Röder et al., 2015; Syed and Spruit, 2017). Furthermore, true (i.e., incident) and false (i.e., not incident) tests were determined by the authors based on the textual content, comparing with those produced by the NMF model results, to perform an expert-based evaluation. The classifications created by the authors were regarded as actual data. The accuracy of the NMF-generated categories was then evaluated, and their alignment with the human-defined categories was used to determine whether they were correct, yielding the evaluation score. For this task, we chose 2000 random news articles from 10 593 total news articles within all geohazard news, and we evaluated the final score by reading and determining their “incidents” criteria (i.e., true and false). It is essential to highlight that if the news met our criteria – that is, it provides a clear explanation of the occurrence of specific events with date and geographical attributes – we classified it as an “incident” in our inventories (Table S2 in the Supplement). Therefore, we eliminated regional or temporal reviews and repeated news.
2.4 Geolocator
In this study, we developed a geospatial data processing and localization method leveraging the locally hosted Nominatim (Clemens, 2015) geocoding service and the search engine of OpenStreetMap (OSM). The primary objective of this method is to determine geographic locations from textual locality descriptions accurately. Because information structured in the RSS or Atom format does not have a native geographical location, the news itself is not associated with any structured geolocation (Battistini et al., 2013). The process is implemented in Python. Our method processes the textual locality descriptions and retrieves geolocation information. It constructs and sends queries to the Nominatim API for each locality entry, parsing the results to identify geographic components such as states/provinces, counties, cities, amenities, and streets. The method follows a systematic approach. It begins by searching for states/provinces within the locality descriptions. Upon finding a match, it then sequentially searches for counties, cities, amenities, and streets within the remaining locality descriptions. The implemented method efficiently processes large datasets of locality descriptions, accurately identifying and organizing geographic components.
A total of 15 569 articles from 1997–2023 were fetched from newspaper websites through our web scraping tool “tr-news-scraper” by using the keywords listed in Table 1. The raw inventory includes 5510 floods, 4262 wildfires, 5255 landslides, and 542 sinkholes. Following the first filtering, which involves eliminating redundant, repeated, and unnecessary news, a total of 10 593 news articles remain for the subsequent stages of NMF modeling and geolocalization (Table 2). Geohazard news from NMF is grouped into 2236 floods, 655 wildfires, 766 landslides, and 271 sinkholes, resulting in 3928 news articles remaining, which include multiple locations. Nevertheless, following a thorough semantic analysis using TrSpaCy (Altinok, 2023), we identified 13 940 distinct locations (i.e., cities, counties, villages, etc.). As a result, we determined that these areas have at least 13 940 geohazard incidents.
Table 2The analytical processes of different classes of news at various stages of the analysis, from obtaining unrefined data to compiling geolocalized news as an inventory.
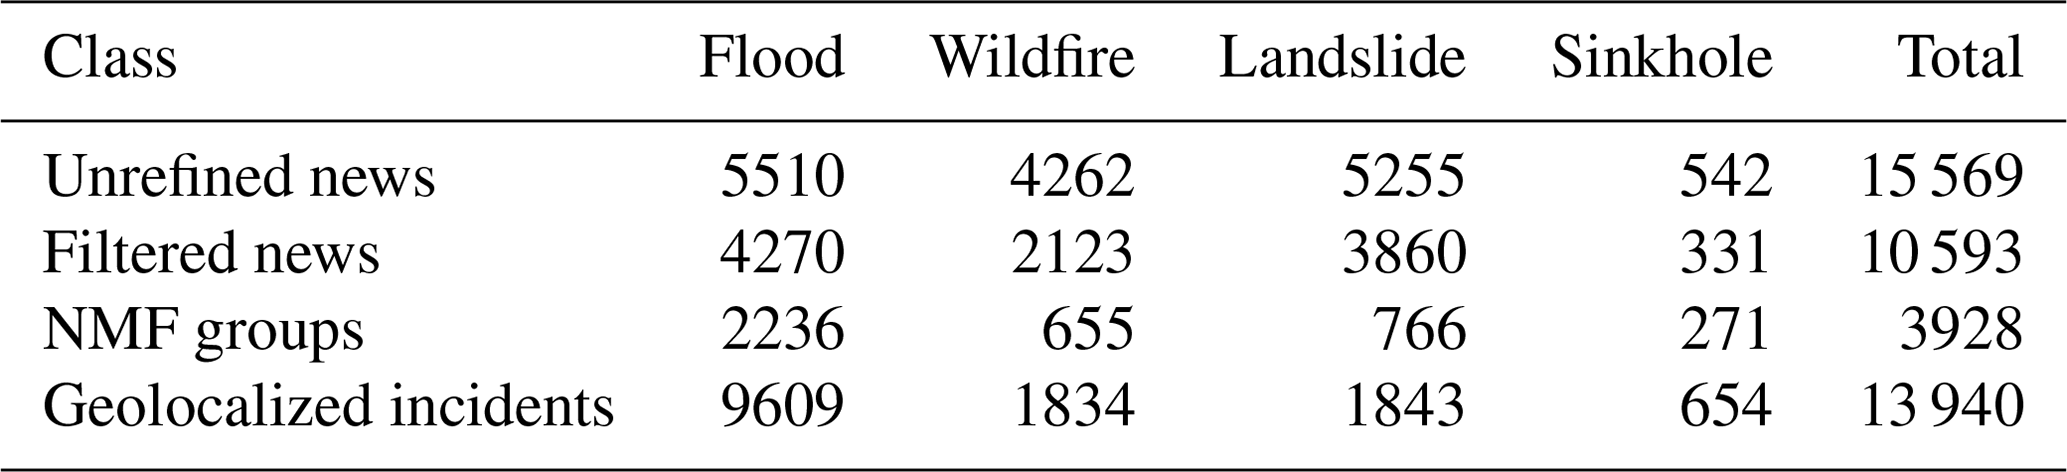
Figure 2 shows the word clouds for different geohazards, and Table S2 summarizes the 20 most important words with their frequencies related to the NMF model results. As expected, the total number of words is highest for the flood news and lowest for sinkholes, which is correlated with the number of news articles parsed. “Yangın” (fire) and “orman” (forest) are the two most commonly used terms about wildfires, with 3.28 % and 2.59 %, respectively. Given how frequently “orman” appears in the news, it implies that we have compiled the news from forested areas, which matches the wildfire criteria for this study, as we have not included news on fire occurrences involving buildings, homes, etc. Furthermore, bigram combinations of the most frequent words reveal that the term “orman yangını”, which is translated as “wildfire”, is the most frequently occurring noun group in NMF grouping analyses. This shows that urban fires – such as those that occur in buildings and homes – were eliminated from the inventories and analyses.
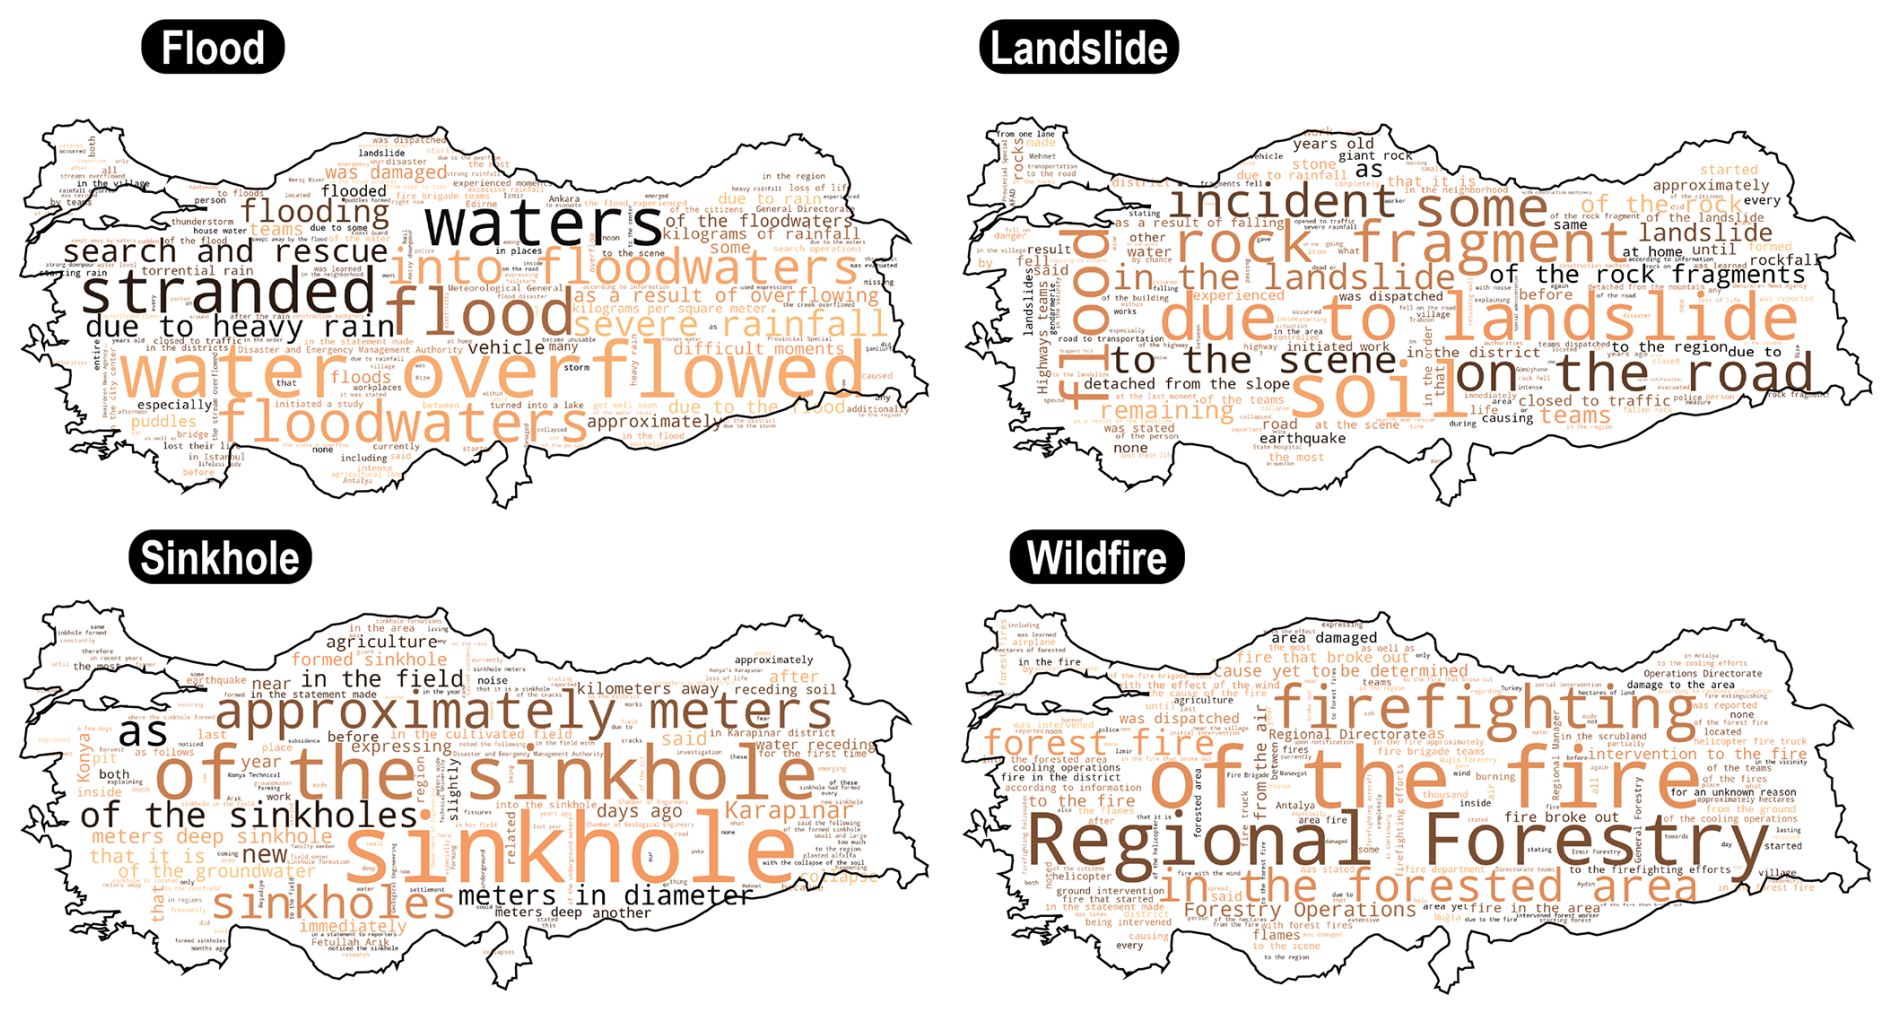
Figure 2Word clouds illustrating the most frequently seen words in the filtered data for different geohazard news. The size of each word denotes its relative frequency or significance within the dataset; larger words, such as “waters”, “of the sinkhole”, “due to landslide”, and “of the fire” signify principal themes, whereas smaller words offer supplementary context pertaining to the details of geohazards (for example, “meters”, “depth”, and “sinkhole”) within the news. The color variations serve solely to offer visual differentiation without indicating any categorical distinctions. Additionally, the spatial locations of the words were arbitrarily chosen and do not indicate a geographic relation with geohazards.
The phrases “sel” (flood), “su” (water), “yağış” (precipitation), and “sağanak” (downpour) are associated with flooding, indicating a strong correlation between heavy rainfall (the term “sağanak”) and subsequent flooding incidents, as indicated by the prominence of these phrases, which highlight the importance of water-related disasters and their direct relationship with precipitation patterns. Despite being documented as less frequent occurrences, sinkhole events can be identified by their characteristic phrases within the news. The terms “metre” (meter) and “obruk” (sinkhole) are closely associated; it is possible that understanding the significance of sinkholes depends critically on their size or depth. These terms are frequently used, which emphasizes how crucial it is to measure and monitor sinkholes because they can cause major disruption to infrastructure and public safety.
The terms connected to landslides are “kaya” (rock), “toprak” (soil), and “heyelan” (landslide). These keywords also emphasize the geological origin of the component of landslide events by indicating the roles of rock and soil. It is clear to identify the type of landslide activity from the most frequent terms from the table, as “düştü” (fell), “kopan” (broken off), and “parçala” (pieces of) point particularly to rockfall activities. These terms may also point to the selective importance of landslides, which are especially newsworthy because they directly affect people's lives, urban areas, and vital infrastructure. It is generally acknowledged that journalists often agree on exclusive matters of public relevance (Harcup and O'Neill, 2017; Pita Costa et al., 2024). Therefore, the number of landslides in our inventory may primarily reflect landslides that impact humans because most landslides occur in remote mountainous areas or away from human infrastructure, etc., and are less essential than others, causing some socio-economic losses. It is important to emphasize that certain phrases may give rise to confusion when it comes to grouping analysis. For instance, the term “yağış” (precipitation) is significant for both landslides and floods. Because most news reports highlight landslide incidents by mentioning predisposing elements like precipitation, which is also important for flood events, this could result in mis-clustering, primarily for landslide events.
Hu (2018) highlighted the significance of ambiguous connections between texts and locations, meaning that geo-text data can contain information both from and about locations (MacEachren et al., 2011). This problem implies that many location names have become prominent in the news, which can lead to georeferencing complications. With this problem in mind, after acquiring the 3928 total clustered news articles (i.e., NMF groups in Table 2), we used TrSpaCy (Altinok, 2023) – a geoparsing technique that extracts explicit place names from implicit geo-text data (Gregory et al., 2015; Hu, 2018) – to acquire place names. To further address the point raised by Hu (2018), the spatial filters also removed the names of other cities from the news, leaving only one.
It should be taken into account that the number of geohazards represents the minimum number of incidents that occurred during the period in our analyses. The geohazard events we fetched from the online newspapers are newsworthy, with several aspects that cause economic losses in many ways: damage to critical infrastructures, urban areas, and agricultural activities. Given that floods and wildfires have numerous effects on human life and are more frequently observed, there may be less variation between actual occurrences and the incidents we record compared to landslides and sinkholes, even if they cause severe loss. The reason behind this is that the online newspapers or sources do not consider landslides that occur away from metropolitan areas or vital infrastructure to be noteworthy.
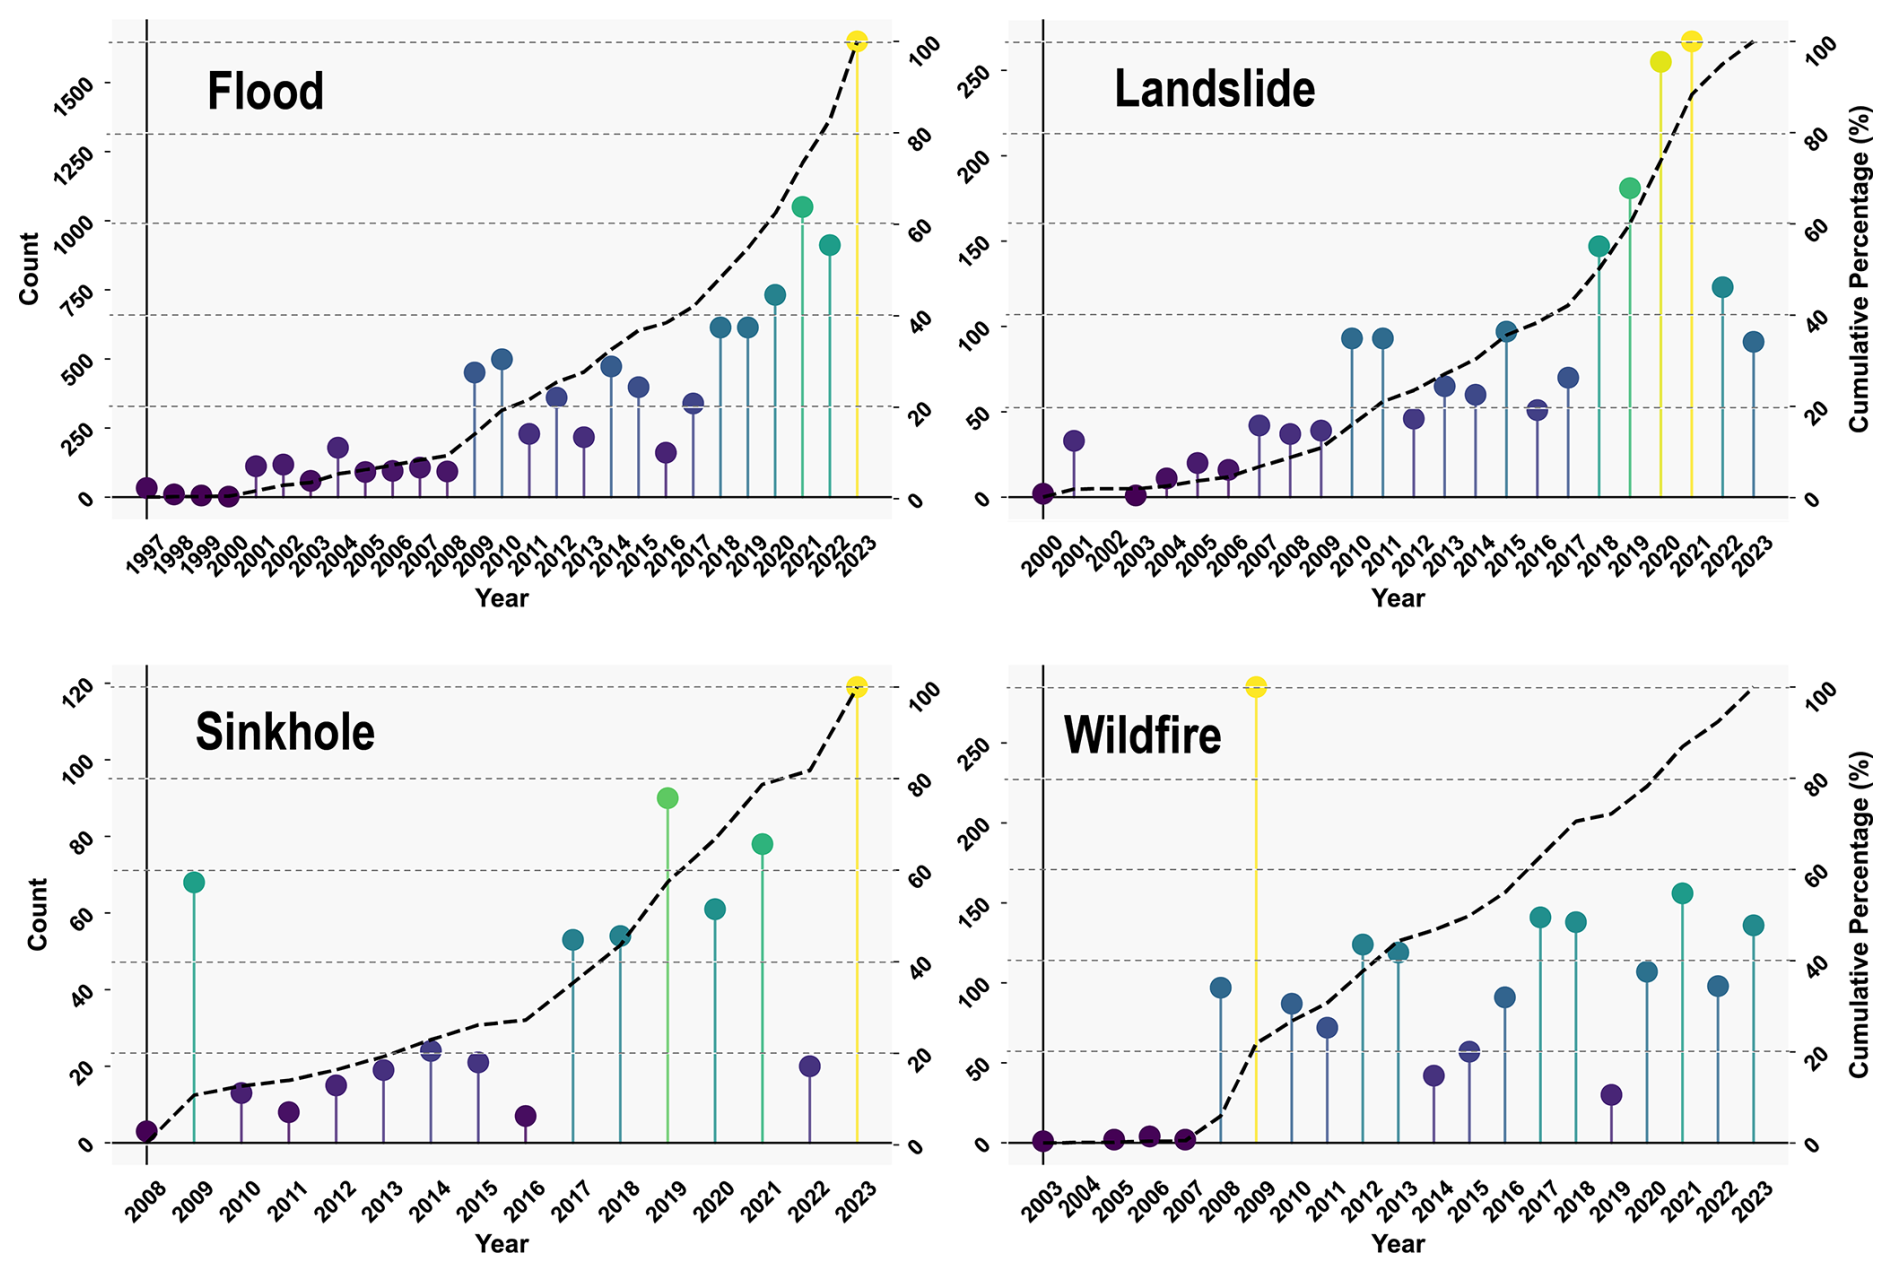
Figure 3The temporal distribution of the flood, landslide, sinkhole, and wildfire incidents that we mapped. The initial years (X axis) vary based on the earliest recorded news for distinct geohazards, and the dashed line indicates cumulative incidents over the study period as a secondary axis. “Count” refers to the number of incidents of geohazards.
3.1 Uncertainty assessment and limitations
The non-negative matrix factorization (NMF) model was applied to the news dataset using a range of topic numbers from 2 to 20 components. The coherence score was calculated for each model configuration to evaluate the coherence and interpretability of the generated topics. It is considered a metric that evaluates the clustering performances; similar approaches are also highly applied in earth science applications (Türkeş and Tatli, 2011; Röder et al., 2015; Syed and Spruit, 2017; Avcioglu et al., 2022). Figure S1 in the Supplement shows that the coherence score generally increased with the number of topics, reaching its plateau at four components with a coherence score of 0.80. This suggests that the four-topic model provides the most meaningful and coherent topics for the given news dataset. Beyond the four components, the coherence scores vary or decrease slightly, indicating that additional topics do not contribute significantly to the model's overall interpretability. The selected four-topic model thus strikes an optimal balance between topic coherence and topic interpretability, providing a robust representation of the underlying thematic structure of the news dataset. Also, our expert-based evaluation score, which we performed by using 2000 randomly selected news articles from over 10 593 total articles, showed overall good consistency, with a coherence score of 0.81. On the other hand, when it comes to evaluating each type of geohazard, flood, wildfire, landslide, and sinkhole each resulted in different scores – 0.84, 0.7, 0.85, and 0.74, respectively. This evaluation is mainly based on the incident identification criteria. For instance, we determined four major categories, leading to misclassification in our incident identification. These are the news articles categorized as “not incident”, as shown by the 0 values in Table S3 in the Supplement. The first category is “common words”, with incidents like “a person lost her/his balance and fell while rock climbing” (in Turkish: “kaya tırmanışıyaptığısırada dengesini yitirerek düşen”). The second category is “review news”, which essentially compiles multiple incidents over the course of time. The third category is “warning alerts”, such as “AFAD issues forest fire warning for 6 provinces …” (in Turkish: “AFAD'dan 6 il için orman yangınıuyarısı …”). The last category is “misinterpretation”, as given in the example: “… They encountered a sinkhole that was 7 m wide and 10 m deep due to a meteorite that fell...” (in Turkish: “… Meteorite düşmesinden kaynaklı7 metre genişliğinde ve 10 metre derinliğindeki obruk ile karşılaştılar …”).
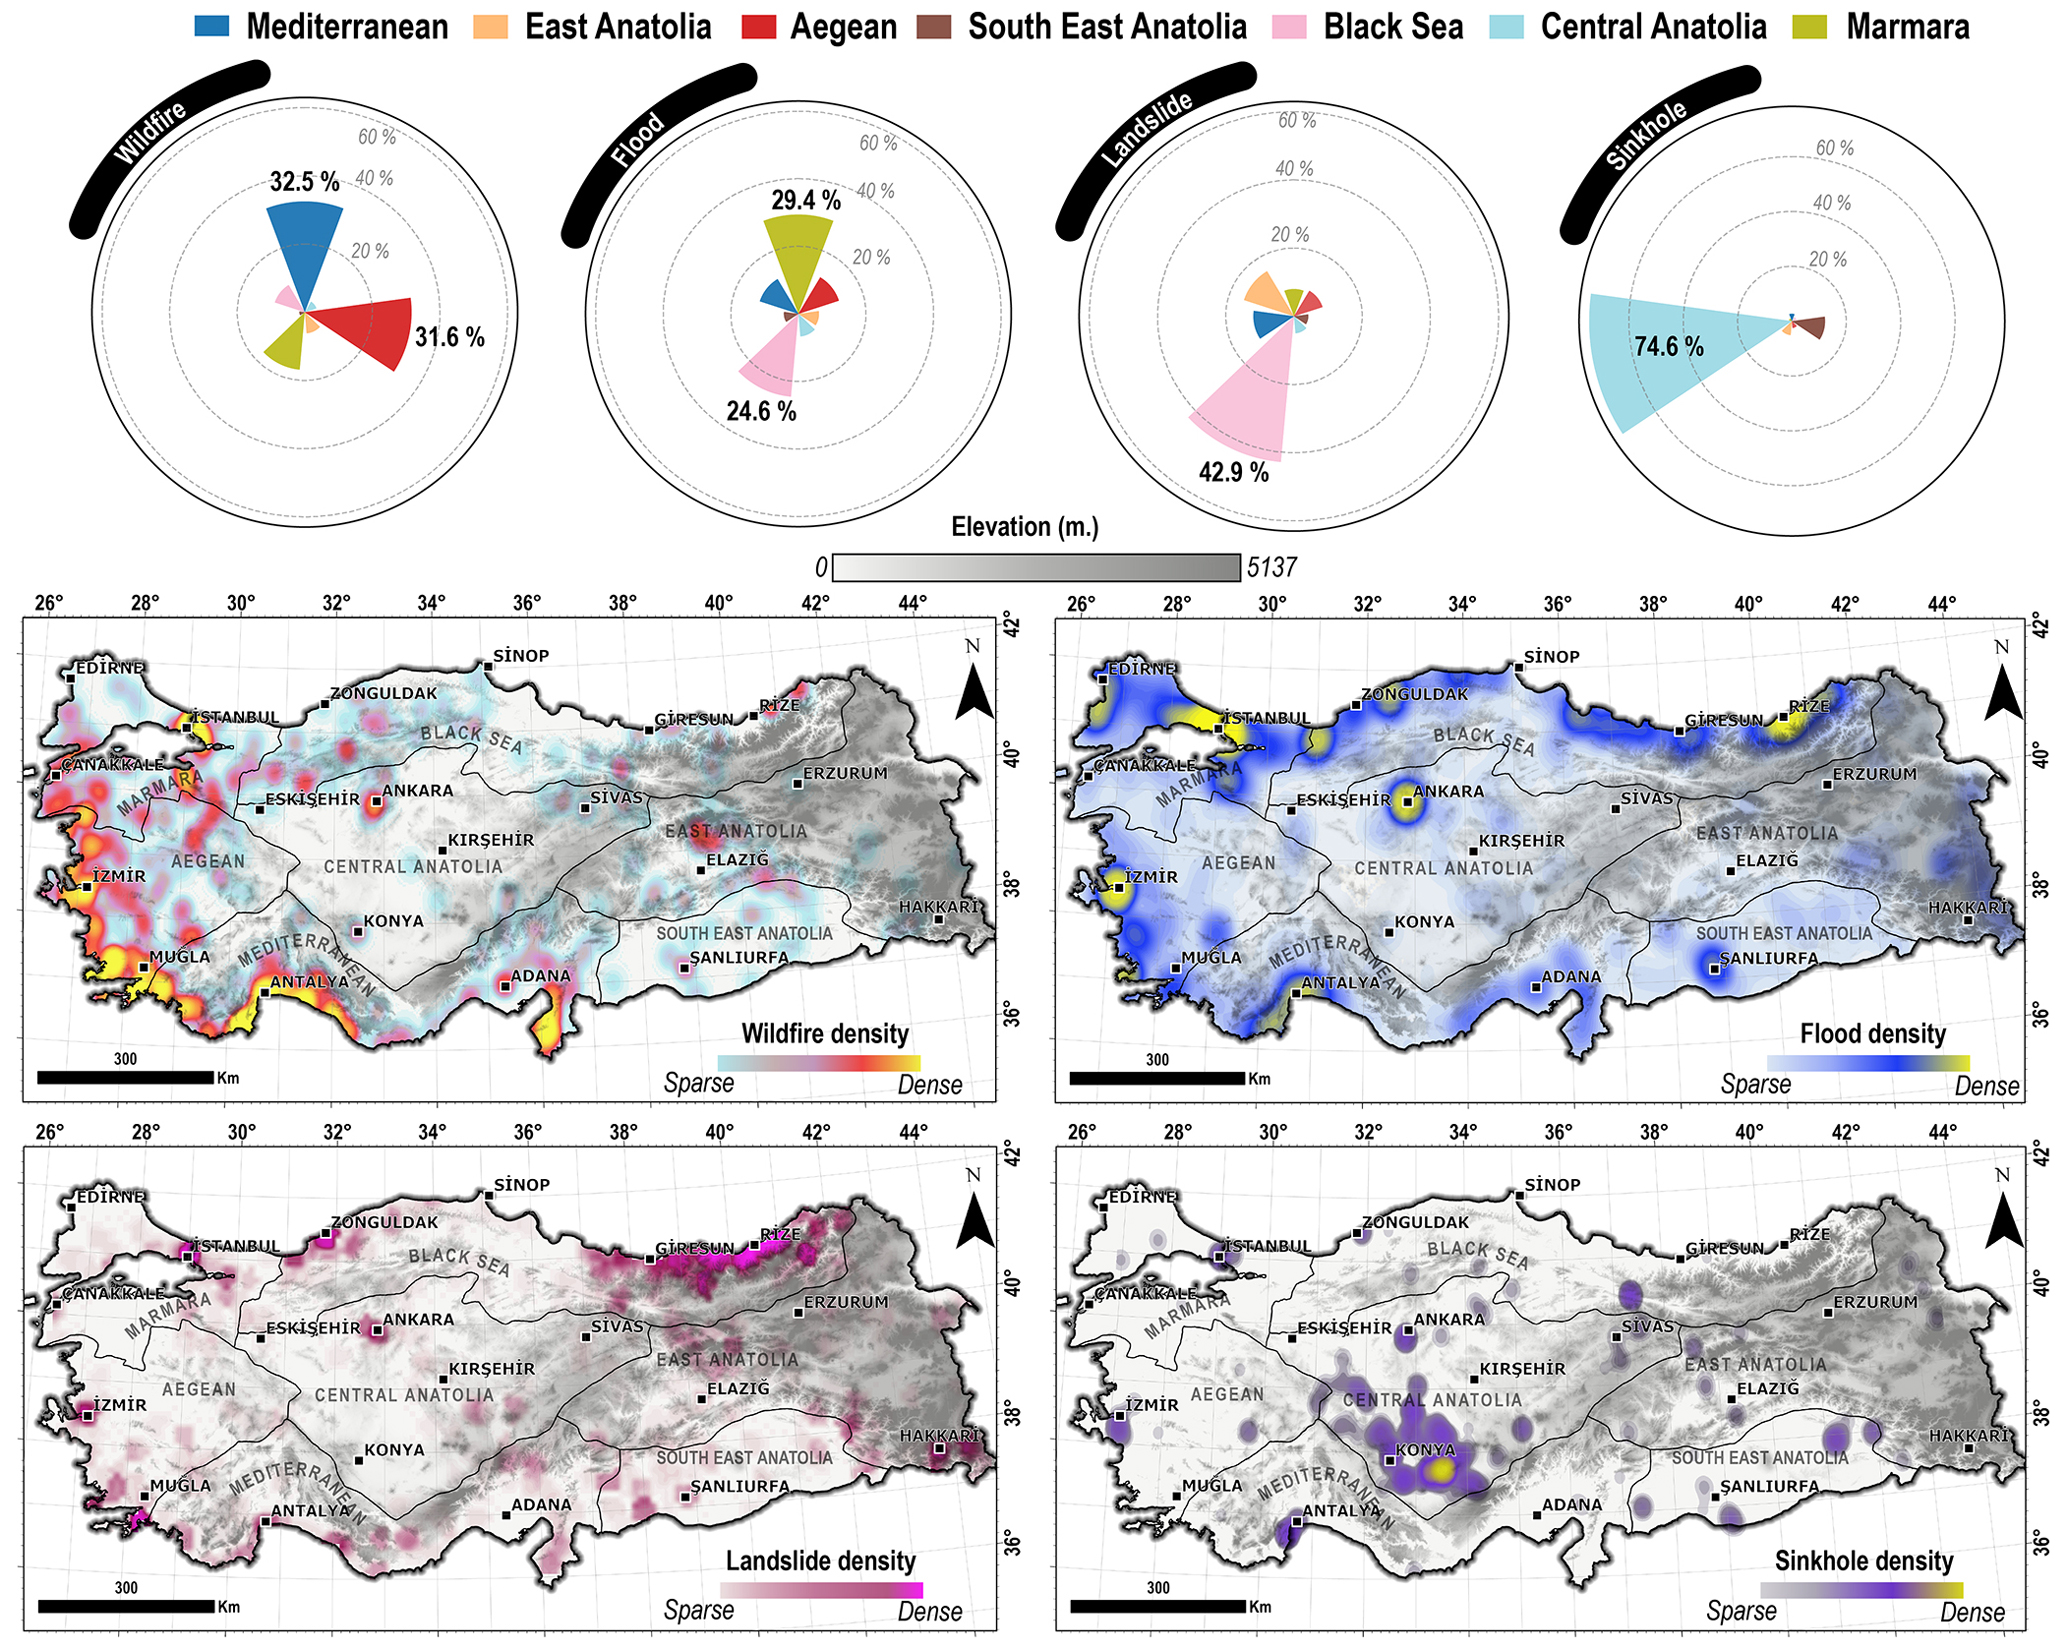
Figure 4The spatial distribution of geohazards over different administrative regions of Türkiye. The circular bar plots depict the percentages of events across various regions, accompanied by density maps illustrating spatial hotspots of geohazards across different regions in Türkiye.
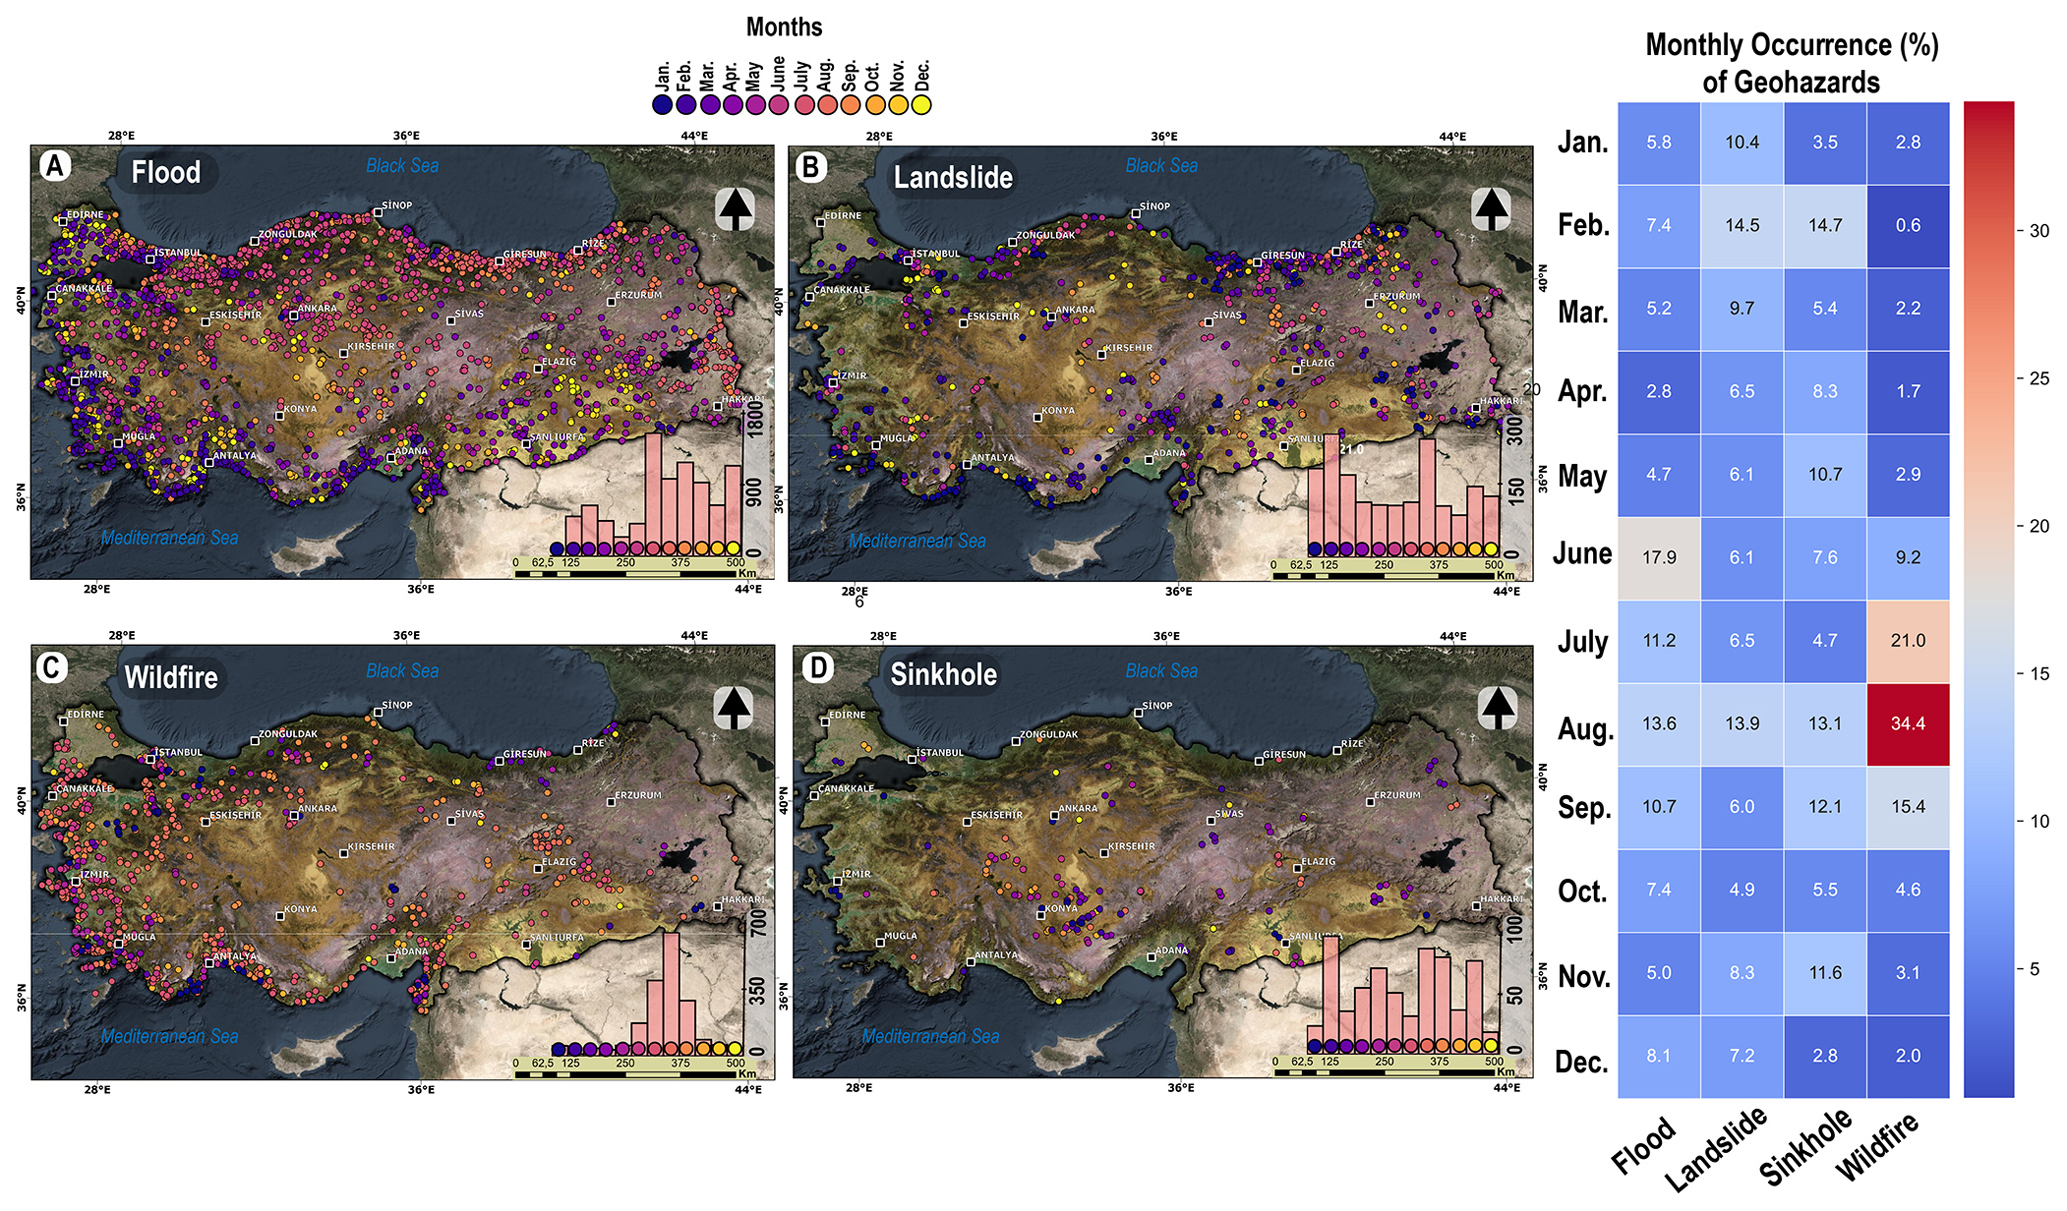
Figure 5The spatiotemporal distribution (monthly) maps of geohazards, which are aligned with bar plots showing the total number of months over the study period from January to December with a color gradient from blue to yellow, respectively. The heat map chart demonstrates the monthly occurrence (in %) for each geohazard group. The baseline map shown was sourced from Esri, TomTom, FAO, Garmin, NOAA, and USGS.
On the one hand, to enhance the reliability of our study, we incorporated a ground-truth evaluation step, a manual verification method utilized in the literature (Madruga de Brito et al., 2025; Stein et al., 2024). We employed random sampling for this evaluation, selecting 500 geohazard incidents to assess mapping performance. This sampling yielded 284, 97, 76, and 43 incidents of flood, landslide, wildfire, and sinkhole, respectively. We manually verified these incidents by cross-checking the locations of mapped geohazards with contextual news information from which we extracted location data. The uncertainty assessment for mapping performance overall resulted in good performance, with 82.4 % of geohazards accurately mapped. On the other hand, an important limitation of our approach is the enhancement of spatial accuracy to achieve a level pertinent to streets, roads, and topographical features. This challenge arises from the heterogeneous writing style prevalent in journalism, which hampers our access to consistently uniform “administrative-level” information (city, county, and village) and the associated specifics, such as streets, neighborhoods, and roads. Consequently, our primary objective for this study was to map geohazards within these administrative levels by geolocating incidents to the centers of these locations, as represented in OpenStreetMap. We adhere to this methodology because the subsequent refinement of these inventories necessitates precise delineation of the targeted geohazards through the integration of geomorphological interpretation, particularly for landslides, and inundation area extraction for flood inventories utilizing high-resolution satellite imagery.
3.2 Spatiotemporal implications for geohazard inventories
Here, we demonstrate the spatiotemporal distribution of geohazard inventories that have been gathered using web scraping, natural language processing (NLP), clustering, and mapping techniques at the national level in Türkiye, and we compare the spatiotemporal consistencies of our inventories with the existing literature.
The temporal distribution of the hazards shows an increase after 2005 (Fig. 3). This result implies that internet sources became more widely available after 2005, which is in line with the increase reported by Gorum and Fidan (2021) for fatal landslide cases in Türkiye. Throughout the study period (1997–2023; Fig. 3), sinkholes and wildfires fluctuated, but the frequency of floods increased, particularly after 2016, when the annual number of events increased approximately from 400 to 1600 by 2023. Similarly, even though the landslide numbers showed an increase after 2016, the frequency of landslides (Fig. 3) remarkably decreased (−60 % and −36 % for the last two years, respectively). The European Forest Fire Information System (EFFIS) (San-Miguel-Ayanz et al., 2012) database, which records the largest burned area in Europe at 27 848.33 ha (https://forest-fire.emergency.copernicus.eu/reports-and-publications/annual-fire-reports, last access: August 2024), suggests that although wildfire occurrences exhibited a sporadic pattern, their peak occurrence in 2008 was consistent with our database (Fig. 3).
Given the primary concentration of geohazard occurrences (Fig. 4), Türkiye displays a particular spatiotemporal tendency to geohazards (Fig. 5). The spatial distribution of geohazards reveals that flood events are relatively well distributed over the country compared to others. However, the majority (54 %) of the events happened in the Marmara (29.4 %) and Black Sea (24.6 %) regions and were less common in the Central Anatolia Plateau (Fig. 4), the driest region in Türkiye, especially around the Konya province (average precipitation of ). Some hotspots for flood events appear near big cities like Istanbul, Ankara (the capital city), and İzmir (Fig. 4). This may suggest that large cities can readily get the attention of the media, even for minor incidents. Ankara, for instance, may appear as a hotspot, yet the Central Anatolia region, where Ankara is located, has had 6.7 % of all floods. On the other hand, Istanbul is not only the biggest city in Türkiye, receiving major attention from journalists, but also, particularly in north-facing basins, geographically part of the Black Sea region, resulting in higher rainfall, which potentially impacts the number of floods. Therefore, attention should be given to these inventories for the real number and accuracy of events. It is important to note that our inventory primarily captures the urban floods that mainly occur where there is a construction area in flood-prone areas (Brown et al., 2007; Mason et al., 2007) and poorly engineered flood control infrastructure (Gallegos et al., 2009; Ozdemir et al., 2013). Our findings on the spatial distribution of flood incidents align with the results of a recent study on flood inventories – which also considered news as source data (Akbaş et al., 2025, under review) – further supporting the accuracy of our inventory.
The temporal distribution of the flood events also shows different patterns by region (Fig. 5). The summer season accounts for 42.7 % of all floods in Türkiye, and this temporal pattern shifts to the winter season in cities along the Mediterranean coastline (Fig. 5). Additionally, the spatial distribution of flood events is consistent with the findings of earlier research (Haltas et al., 2021). For example, Koç et al. (2020) showed fatalities and economic losses due to flood events in the Marmara and Black Sea regions, where we identified the majority of the events (54 %).
The spatial distribution of landslides in our inventory shows that the Black Sea region is the most susceptible area to landslides, having the majority (42.9 %) of all events over Türkiye. The current literature indicates a comparable spatial distribution, with fatal landslides (Görüm and Fidan, 2021) and the Turkish landslide inventory (Duman et al., 2011) predominantly concentrated in the Black Sea region, especially in the eastern section. As indicated in the first section regarding the flood and landslide events being wrongly classified due to the common keywords (e.g., “yağış”), Fig. 4 also portrays a supportive spatial relationship in the East Black Sea region, where the higher slope and rainfall and the higher flood and landslide events occur. This misclassification mainly affects landslide incidents, as most of the news highlights meteorological conditions, such as “landslide occurred as a result of prolonged precipitation.” (in Turkish: “uzun süren yağış sonucu heyelan meydana geldi.”). On the other hand, while this study does not concentrate on triggering or predisposing factors of geohazards, it is important to note that the landslides in places where we obtained fewer occurrences, i.e., the Marmara, Central Anatolia, and Southeast Anatolia regions, are more likely to be associated with activities of anthropogenic origin, such as mining, road cutting, and other related activities (Fidan and Görüm, 2020; Görüm and Fidan, 2021).
There is a spatial accumulation of wildfire incidents in our inventory, mainly along the Mediterranean coast from Adana to Çanakkale (Figs. 4 and 5). Conversely, the vicinity of Istanbul appears to be a concentrated region for wildfire occurrences (Fig. 4), indicating increased frequency; these wildfires are notably characterized by a smaller magnitude (i.e., areal coverage) compared to those on the Mediterranean coast. It is noteworthy to highlight that the Mediterranean and Aegean regions show a distinct tendency with their topography (Avcioglu et al., 2024), climatology (Tatli and Türkeş, 2014; Akbas, 2023), and predominant vegetation cover: Pinus brutia Ten. (kızılçam) (also known as Turkish pine) and P. halepensis Mill. (halep çamı) (Ekberzade et al., 2022) account for the majority of wildfire cases (∼65 %). Türkiye exhibits an evident seasonal pattern throughout the summer months, especially along the coastline that stretches from Marmara to the Mediterranean (Fig. 5). A recent study by Öztürk et al. (2024) identified significant wildfire areas attributed to lightning, demonstrating spatial consistency with our inventory mapping, namely, hotspots of wildfires over the Mediterranean and Aegean regions of Türkiye. On the other hand, an interesting finding points out that wildfire incidents occur during the winter and spring in the Eastern Black Sea region (one of the regions of less frequency). This might suggest the influence of the natural phenomenon “foehn winds”, a type of dry, relatively warm downslope wind that occurs in the lee (downwind side) of a mountain range, which elevates wildfire risk as a potential driver and predisposing factor. This phenomenon has also been shown in other studies (Yetmen and Aytaç, 2017; Arslan et al., 2024), highlighting the importance of foehn winds in the wildfire case in the Eastern Black Sea region.
Sinkhole formation is the least common geohazard in Türkiye compared to others in our inventory. In fact, the literature has demonstrated that sinkholes are among the most significant geohazards (Waltham and Fookes, 2003; Parise et al., 2008) because of their rapid and unexpected occurrences, which restrict the certainty of their spatiotemporal forecast (Newton, 1987). Consistent with the literature (Doğan and Yılmaz, 2011; Gökkaya et al., 2021; Orhan et al., 2023), Fig. 4 clearly shows that sinkholes predominantly occur in the Central Anatolia region, with no particular temporal tendency (Fig. 5) – specifically the Obruk Plateau (subregion) that surrounds the Konya province. In addition to this region, sinkholes have also been reported in the news as incidents in other regions. Although geological settings have made it less likely for sinkholes to occur in other regions, we maintained all incidents because our approach primarily depends on context truth (i.e., articles within news) rather than geological or geomorphological accuracy. For example, piping phenomena are predominantly characterized by journalists as sinkhole formation due to their insufficient scientific background in geoscience. This may imply that, despite the significant potential and benefits of the news for comprehending geohazards, it is also necessary to carefully consider the news' scientific underpinnings.
It is essential to have a comprehensive and long-term understanding of how, when, and where geohazards have affected societies in recent years to inform policymakers about how to overcome and mitigate multiple hazards. Therefore, in this study, we developed an automated approach to build spatiotemporal inventories from online newspapers for multiple hazards – flood, landslide, wildfire, and sinkhole formation – by combining web-scraping, semantic analysis, clustering, and geolocating algorithms on a national scale in Türkiye. The news parsing tool “tr-news-scraper” has been developed, and 15 569 news articles have been fetched through this tool from selected newspapers in Türkiye by employing the keywords associated with geohazards. After NLP processing, a total of 13 940 incidents of geohazards were recorded and geolocated. Consequently, we mapped 9609 floods, 1834 wildfires, 1843 landslides, and 654 sinkhole formation incidents that occurred during the period between 1997 and 2023 in Türkiye. Our inventories show spatiotemporally distinct patterns in flood, landslide, wildfire, and sinkhole events, consistent with previous studies. The ground-truth validation revealed 82.5 % incident mapping accuracy from 500 randomly selected incidents. Although the clustering and incident identification findings show 0.80 confidence scores, the contextual similarities (e.g., “yağış” term for flood and landslide), review news, and misinterpretations of the news may give rise to confusion either in fetching or clustering appropriate categories of geohazards. Consequently, our study demonstrated the necessity for standardizing context writing related to geohazard news to more effectively capture information regarding location and incident specifics.
The approach provided in this study can be expanded to existing inventories by investigating the potential and limitations of using web scraping, NLP, and machine learning methods, as well as providing an open alternative to creating inventories where others are inaccessible owing to national restrictions. Furthermore, we can more accurately portray geohazard events with these inventories because local news is less prevalent than global news but covers more events. Hence, further research is required to expand the spatial scale to generalize this study worldwide and across multiple languages by integrating advanced large language models.
The code is available for tr-news-scraper here: https://github.com/demirogun/tr-news-scraper (Demir and Avcıoğlu, 2024). The data that support the findings of this study are available from the corresponding author upon reasonable request.
The supplement related to this article is available online at https://doi.org/10.5194/nhess-25-2421-2025-supplement.
AA and OD designed the study together with contributions from TG. OD and AA performed data analyses, data visualization, and interpretations. AA prepared the paper with contributions from all co-authors.
The contact author has declared that none of the authors has any competing interests.
Publisher's note: Copernicus Publications remains neutral with regard to jurisdictional claims made in the text, published maps, institutional affiliations, or any other geographical representation in this paper. While Copernicus Publications makes every effort to include appropriate place names, the final responsibility lies with the authors.
This research has been supported by the Türkiye Bilimsel ve Teknolojik Araştırma Kurumu (grant no. 123C512).
This paper was edited by Vassiliki Kotroni and reviewed by three anonymous referees.
Akbas, A.: Seasonality, persistency, regionalization, and control mechanism of extreme rainfall over complex terrain, Theor. Appl. Climatol., 152, 981–997, https://doi.org/10.1007/s00704-023-04440-1, 2023.
Akbas, A., Gorum, T., and Ozdemir, H.: FlooDOT (FlooD inventory Of Türkiye): A comprehensive flood inventory and its spatio-temporal analyses, J. Flood Risk Manag., under review, 2025.
Altinok, D.: A diverse set of freely available linguistic resources for Turkish, P. Annu. Meet. Assoc. Comput. Linguist., 1, 13739–13750, 2023.
Arslan, H., Baltaci, H., Demir, G., and Ozcan, H. K.: Spatiotemporal changes and background atmospheric factors associated with forest fires in Türkiye, Environ. Monit. Assess., 196, 10, https://doi.org/10.1007/s10661-024-13027-w, 2024.
Avcıoğlu, A., Görüm, T., Akbaş, A., Moreno-de las Heras, M., Yıldırım, C., and Yetemen, Ö.: Regional distribution and characteristics of major badland landscapes in Turkey, Catena, 218, 106562, https://doi.org/10.1016/j.catena.2022.106562, 2022.
Avcıoğlu, A., Akbaş, A., Görüm, T., and Yetemen, Ö.: The compound effect of topography, weather, and fuel type on the spread and severity of the largest wildfire in NW of Turkey, Nat. Hazards, 121, 3219–3237, https://doi.org/10.1007/s11069-024-06885-7, 2024.
Battistini, A., Segoni, S., Manzo, G., Catani, F., and Casagli, N.: Web data mining for automatic inventory of geohazards at national scale, Appl. Geogr., 43, 147–158, https://doi.org/10.1016/j.apgeog.2013.06.012, 2013.
Bhuyan, K., Rana, K., Ferrer, J. V., Cotton, F., Ozturk, U., Catani, F., and Malik, N.: Landslide topology uncovers failure movements, Nat. Commun., 15, 2633, https://doi.org/10.1038/s41467-024-46741-7, 2024.
Brown, J. D., Spencer, T., and Moeller, I.: Modelling storm surge flooding of an urban area with particular reference to modelling uncertainties: a case study of Canvey Island, United Kingdom, Water Resour. Res., 43, W06402, https://doi.org/10.1029/2005WR004597, 2007.
Clemens, K.: Geocoding with OpenStreetMap data, in: Proceedings of GEOProcessing 2015, 22–27 February 2015 Lisbon, Portugal, ISBN 978-1-61208-383-4, 2015.
CRED: EM-DAT [Dataset], CRED/UCLouvain, Brussels, Belgium, (version 2023.12) https://www.emdat.be (last access: 22 December 2023), 2023.
Delaney, K. B. and Evans, S. G.: The 2000 Yigong landslide (Tibetan Plateau), rockslide-dammed lake and outburst flood: review, remote sensing analysis, and process modelling, Geomorphology, 246, 377–393, https://doi.org/10.1016/j.geomorph.2015.06.020, 2015.
Demir, O. and Avcıoğlu, A.: tr-news-scraper: Turkish news articles scraper based on specified keywords, software version 0.1.0, Zenodo, https://doi.org/10.5281/zenodo.10509650, 2024 (data available at: https://github.com/demirogun/tr-news-scraper, last access: 20 January 2025).
Doğan, U. and Yılmaz, M.: Natural and induced sinkholes of the Obruk Plateau and Karapınar-Hotamış Plain, Turkey, J. Asian Earth Sci., 40, 496–508, https://doi.org/10.1016/j.jseaes.2010.09.014, 2011.
Duman, T. Y., Can, T., and Emre, O.: 1:1 500 000 scaled Turkish landslide inventory map, Gen. Dir. Miner. Res. Explor., Spec. Publ., 27, Ankara, ISBN 978-605-4075-84-3, 2011.
Ekberzade, B., Yetemen, O., Sen, O. L., and Dalfes, H. N.: Simulating the potential forest ranges in an old land: the case for Turkey's forests, Biodivers. Conserv., 31, 3217–3236, https://doi.org/10.1007/s10531-022-02485-8, 2022.
Fan, X., Scaringi, G., Korup, O., West, A. J., van Westen, C. J., Tanyas, H., Hovius, N., Hales, T. C., Jibson, R. W., Allstadt, K. E., Zhang, L., Evans, S. G., Xu, C., Li, G., Pei, X., Xu, Q., and Huang, R.: Earthquake-induced chains of geologic hazards: patterns, mechanisms, and impacts, Rev. Geophys., 57, 421–503, https://doi.org/10.1029/2018RG000626, 2019.
Fan, X., van Westen, C. J., Xu, Q., Gorum, T., and Dai, F.: Analysis of landslide dams induced by the 2008 Wenchuan earthquake, J. Asian Earth Sci., 57, 25–37, https://doi.org/10.1016/j.jseaes.2012.06.002, 2012.
Fang, Z., Tanyas, H., Gorum, T., Dahal, A., Wang, Y., and Lombardo, L.: Speech-recognition in landslide predictive modelling: a case for a next generation early warning system, Environ. Model. Softw., 170, 105833, https://doi.org/10.1016/j.envsoft.2023.105833, 2023.
Fidan, S. and Görüm, T.: Türkiye'de ölümcül heyelanların dağılım karakteristikleri ve ulusal ölçekte öncelikli alanların belirlenmesi, Turk. Geogr. J., 123–134, https://doi.org/10.17211/tcd.731596, 2020.
Franceschini, R., Rosi, A., Catani, F., and Casagli, N.: Detecting information from Twitter on landslide hazards in Italy using deep learning models, Geoenviron. Disasters, 11, 22, https://doi.org/10.1186/s40677-024-00279-4, 2024.
Froude, M. J. and Petley, D. N.: Global fatal landslide occurrence from 2004 to 2016, Nat. Hazards Earth Syst. Sci., 18, 2161–2181, https://doi.org/10.5194/nhess-18-2161-2018, 2018.
Gallegos, H. A., Schubert, J. E., and Sanders, B. F.: Two-dimensional, high-resolution modeling of urban dam-break flooding: a case study of Baldwin Hills California, Adv. Water Resour., 32, 1323–1335, 2009.
Gökkaya, E., Gutiérrez, F., Ferk, M., and Görüm, T.: Sinkhole development in the Sivas gypsum karst, Turkey, Geomorphology, 386, 107746, https://doi.org/10.1016/j.geomorph.2021.107746, 2021.
Gómez, D., García, E. F., and Aristizábal, E.: Spatial and temporal landslide distributions using global and open landslide databases, Nat. Hazards, 117, 25–55, https://doi.org/10.1007/s11069-023-05848-8, 2023.
Görüm, T. and Fidan, S.: Spatiotemporal variations of fatal landslides in Turkey, Landslides, 18, 1691–1705, https://doi.org/10.1007/s10346-020-01580-7, 2021.
Görüm, T., Fan, X., van Westen, C. J., Huang, R. Q., Xu, Q., Tang, C., and Wang, G.: Distribution pattern of earthquake-induced landslides triggered by the 12 May 2008 Wenchuan earthquake, Geomorphology, 133, 152–167, https://doi.org/10.1016/j.geomorph.2010.12.030, 2011.
Gregory, I., Donaldson, C., Murrieta-Flores, P., and Rayson, P.: Geoparsing, GIS, and textual analysis: current developments in spatial humanities research, Int. J. Humanit. Arts Comput., 9, 1–14, 2015.
Guha-Sapir, D., Below, R., and Hoyois, P.: EM-DAT: International Disaster Database, Université Catholique de Louvain, Brussels, Belgium, 2015.
Haltas, I., Yildirim, E., Oztas, F., and Demir, I.: A comprehensive flood event specification and inventory: 1930–2020 Turkey case study, Int. J. Disast. Risk Re., 56, 102086, https://doi.org/10.1016/j.ijdrr.2021.102086, 2021.
Haque, U., Blum, P., Da Silva, P. F., Andersen, P., Pilz, J., Chalov, S. R., Malet, J. P., Auflič, M. J., Andres, N., Poyiadji, E., and Lamas, P. C.: Fatal landslides in Europe, Landslides, 13, 1545–1554, https://doi.org/10.1007/s10346-016-0689-3, 2016.
Harcup, T. and O'Neill, D.: What is news?, Journal. Stud., 18, 1470–1488, https://doi.org/10.1080/1461670X.2016.1150193, 2017.
Hickey, J., Young, J., Spruce, M., Pandit, R., Williams, H., Arthur, R., Stovall, W., and Head, M.: Social sensing a volcanic eruption: application to Kīlauea, 2018, Nat. Hazards Earth Syst. Sci., 25, 1681–1696, https://doi.org/10.5194/nhess-25-1681-2025, 2025.
Hickman, L., Thapa, S., Tay, L., Cao, M., and Srinivasan, P.: Text preprocessing for text mining in organizational research: review and recommendations, Organ. Res. Methods, 25, 114–146, https://doi.org/10.1177/1094428120971683, 2022.
Hu, Y.: Geo-text data and data-driven geospatial semantics, Geogr. Compass, 12, 1–19, https://doi.org/10.1111/gec3.12404, 2018.
Jones, R. L., Guha-Sapir, D., and Tubeuf, S.: Human and economic impacts of natural disasters: can we trust the global data?, Sci. Data, 9, 1–7, https://doi.org/10.1038/s41597-022-01667-x, 2022.
Kirschbaum, D. B., Adler, R., Hong, Y., Hill, S., and Lerner-Lam, A.: A global landslide catalog for hazard applications: method, results, and limitations, Nat. Hazards, 52, 561–575, https://doi.org/10.1007/s11069-009-9401-4, 2010.
Kirschbaum, D., Stanley, T., and Zhou, Y. P.: Spatial and temporal analysis of a global landslide catalog, Geomorphology, 249, 4–15, https://doi.org/10.1016/j.geomorph.2015.03.016, 2015.
Kitazawa, K. and Hale, S. A.: Social media and early warning systems for natural disasters: a case study of Typhoon Etau in Japan, Int. J. Disaster Risk Re., 52, 101926, https://doi.org/10.1016/j.ijdrr.2020.101926, 2021.
Koç, G., Petrow, T., and Thieken, A.: Analysis of the most severe flood events in Turkey (1960–2014): which triggering mechanisms and aggravating pathways can be identified?, Water, 12, 1562, https://doi.org/10.3390/w12061562, 2020.
Lai, K., Porter, J. R., Amodeo, M., Miller, D., Marston, M., and Armal, S.: A natural language processing approach to understanding context in the extraction and geocoding of historical floods, storms, and adaptation measures, Inf. Process. Manag., 59, 102735, https://doi.org/10.1016/j.ipm.2021.102735, 2022.
Lee, D. and Seung, H.: Learning the parts of objects by non-negative matrix factorization, Nature, 401, 788–791, https://doi.org/10.1038/44565, 1999.
Lee, D. and Seung, H.: Algorithms for non-negative matrix factorization, Adv. Neur. In., 13, 556–562, 2001.
Liu, X., Kar, B., Montiel Ishino, F. A., Zhang, C., and Williams, F.: Assessing the reliability of relevant tweets and validation using manual and automatic approaches for flood risk communication, ISPRS international J. Geo-Info., 9, 532, 2020.
Loche, M., Alvioli, M., Marchesini, I., Bakka, H., and Lombardo, L.: Landslide susceptibility maps of Italy: lesson learnt from dealing with multiple landslide types and the uneven spatial distribution of the national inventory, Earth-Sci. Rev., 232, 104125, https://doi.org/10.1016/j.earscirev.2022.104125, 2022.
MacEachren, A. M., Jaiswal, A., Robinson, A. C., Pezanowski, S., Savelyev, A., Mitra, P., and Blanford, J.: SensePlace2: GeoTwitter analytics support for situational awareness, in: 2011 IEEE Conference on Visual Analytics Science and Technology (VAST), Providence, Rhode Island, USA 23–28 October, 2011, https://doi.org/10.1109/VAST.2011.6102456, 181–190, IEEE, 2011.
Madruga de Brito, M., Kuhlicke, C., and Marx, A.: Near-real-time drought impact assessment: a text mining approach on the 2018/2019 drought in Germany, Environ. Res. Lett., 15, 104035, https://doi.org/10.1088/1748-9326/aba4ca, 2020.
Madruga de Brito, M., Sodoge, J., Kreibich, H., and Kuhlicke, C.: Comprehensive assessment of flood socioeconomic impacts through text-mining, Water Resour. Res., 61, 1, https://doi.org/10.1029/2024WR037813, 2025.
Mason, D. C., Horritt, M. S., Hunter, N. M., and Bates, P. D.: Use of fused airborne scanning laser altimetry and digital map data for urban flood modelling, Hydrol. Process., 21, 1436–1447, 2007.
Meena, S. R., Soares, L. P., Grohmann, C. H., van Westen, C., Bhuyan, K., Singh, R. P., Floris, M., and Catani, F.: Landslide detection in the Himalayas using machine learning algorithms and U-Net, Landslides, 19, 1209–1229, https://doi.org/10.1007/s10346-022-01861-3, 2022.
Newton, J. G.: Development of sinkholes resulting from man's activities in the Eastern United States, U. S. Geol. Surv. Circular, https://doi.org/10.3133/cir968, Vol. 968, 1987.
OpenAI: DALL⋅E: AI image generation model, https://openai.com/dall-e (last access: 5 January 2025), 2025.
Orhan, O., Haghshenas Haghighi, M., Demir, V., Gökkaya, E., Gutiérrez, F., and Al-Halbouni, D.: Spatial and temporal patterns of land subsidence and sinkhole occurrence in the Konya Endorheic Basin, Turkey, Geosciences, 14, 5, https://doi.org/10.3390/geosciences14010005, 2023.
Ozdemir, H., Sampson, C. C., de Almeida, G. A. M., and Bates, P. D.: Evaluating scale and roughness effects in urban flood modelling using terrestrial LIDAR data, Hydrol. Earth Syst. Sci., 17, 4015–4030, https://doi.org/10.5194/hess-17-4015-2013, 2013.
Öztürk, M. G., Bekar, İ., and Tavşanoğlu, Ç.: Rethinking lightning-induced fires: spatial variability and implications for management policies, Forest Ecol. Manag., 572, 122262, https://doi.org/10.1016/j.foreco.2024.122262, 2024.
Paatero, P.: Least squares formulation of robust non-negative factor analysis, Chemometr. Intell. Lab., 37, 23–35, 1997.
Paatero, P. and Tapper, U.: Positive matrix factorization: a nonnegative factor model with optimal utilization of error estimates of data values, Environmetrics, 5, 111–126, 1994.
Parise, M., De Waele, J., and Gutierrez, F.: Engineering and environmental problems in karst – an introduction, Eng. Geol., 99, 91–94, https://doi.org/10.1016/j.enggeo.2007.11.009, 2008.
Pedregosa, F., Varoquaux, G., Gramfort, A., Michel, V., Thirion, B., Grisel, O., Blondel, M., Prettenhofer, P., Weiss, R., Dubourg, V., Vanderplas, J., Passos, A., Cournapeau, D., Brucher, M., Perrot, M., and Duchesnay, E.: Scikit-learn: Machine learning in Python, J. Mach. Learn. Res., 12, 2825–2830, 2011.
Peng, M. and Zhang, L.: Analysis of human risks due to dam break floods – Part 2: Application to Tangjiashan landslide dam failure, Nat. Hazards, 64, 1899–1923, https://doi.org/10.1007/s11069-012-0336-9, 2012.
Petley, D.: Global patterns of loss of life from landslides, Geology, 40, 927–930, https://doi.org/10.1130/G33217.1, 2012.
Pita Costa, J., Rei, L., Bezak, N., Mikoš, M., Massri, M. B., Novalija, I., and Leban, G.: Towards improved knowledge about water-related extremes based on news media information captured using artificial intelligence, Int. J. Disaster Risk Re., 100, 104172, https://doi.org/10.1016/j.ijdrr.2023.104172, 2024.
Rana, K., Ozturk, U., and Malik, N.: Landslide geometry reveals its trigger, Geophys. Res. Lett., 48, e2020GL090848, https://doi.org/10.1029/2020GL090848, 2021.
Rehurek, R. and Sojka, P.: Software framework for topic modelling with large corpora, in: Proc. LREC 2010 Workshop on New Challenges for NLP Frameworks, Valletta, Malta, 22 May, University of Malta, 46–50, https://doi.org/10.13140/2.1.2393.1847, 2010.
Restrepo-Estrada, C., de Andrade, S. C., Abe, N., Fava, M. C., Mendiondo, E. M., and de Albuquerque, J. P.: Geo-social media as a proxy for hydrometeorological data for streamflow estimation and to improve flood monitoring, Comput. Geosci., 111, 148–158, https://doi.org/10.1016/j.cageo.2017.10.010, 2018.
Röder, M., Both, A., and Hinneburg, A.: Exploring the space of topic coherence measures, in: Proc. 8th ACM Int. Conf. Web Search Data Min., Shanghai China, 2–6 February 2015, 399–408, https://doi.org/10.1145/2684822.2685324, 2015.
San-Miguel-Ayanz, J., Schulte, E., Schmuck, G., Camia, A., Strobl, P., Liberta, G., Giovando, C., Boca, R., Sedano, F., Kempeneers, P., McInerney, D., Whitmore, C., Santos de Oliveira, S., Rodrigues, M., Durrant, T., Corti, P., Oehler, F., Vilar, L., and Amatulli, G.: Comprehensive monitoring of wildfires in Europe: The European Forest Fire Information System (EFFIS), in: Approaches to Managing Disaster – Assessing Hazards, Emergencies and Disaster Impacts, edited by: Tiefenbacher, J., InTech, 87–105, ISBN 978-953-51-0294-6, 2012.
Sodoge, J., Kuhlicke, C., and Madruga de Brito, M.: Automatized spatio-temporal detection of drought impacts from newspaper articles using natural language processing and machine learning, Weather Clim. Extremes, 41, 100574, https://doi.org/10.1016/j.wace.2023.100574, 2023.
Sodoge, J., Kuhlicke, C., Mahecha, M. D., and de Brito, M. M.: Text mining uncovers the unique dynamics of socio-economic impacts of the 2018–2022 multi-year drought in Germany, Nat. Hazards Earth Syst. Sci., 24, 1757–1777, https://doi.org/10.5194/nhess-24-1757-2024, 2024.
Stein, L., Mukkavilli, S. K., Pfitzmann, B. M., Staar, P. W. J., Ozturk, U., Berrospi, C., Brunschwiler, T., and Wagener, T.: Wealth over woe: global biases in hydro-hazard research, Earths Future, 12, e2024EF004590, https://doi.org/10.1029/2024EF004590, 2024.
Syed, S. and Spruit, M.: Full-text or abstract? Examining topic coherence scores using latent Dirichlet allocation, in: 2017 IEEE Int. Conf. Data Sci. Adv. Anal. (DSAA), Tokyo, Japanm 19–21 October 2017, 165–174 pp., IEEE, https://doi.org/10.1109/DSAA.2017.61, 2017.
Tanyaş, H., van Westen, C. J., Allstadt, K. E., Nowicki Jessee, M. A., Görüm, T., Jibson, R. W., Godt, J. W., Sato, H. P., Schmitt, R. G., Marc, O., and Hovius, N.: Presentation and analysis of a worldwide database of earthquake-induced landslide inventories, J. Geophys. Res. Earth, 122, 1991–2015, https://doi.org/10.1002/2017JF004236, 2017.
Tanyaş, H., Görüm, T., Fadel, I., Yıldırım, C., and Lombardo, L.: An open dataset for landslides triggered by the 2016 Mw 7.8 Kaikōura earthquake, New Zealand, Landslides, 19, 1405–1420, https://doi.org/10.1007/s10346-022-01869-9, 2022.
Tatli, H. and Türkeş, M.: Climatological evaluation of Haines Forest Fire Weather Index over the Mediterranean Basin, Meteorol. Appl., 21, 545–552, https://doi.org/10.1002/met.1367, 2014.
Taylor, F. E., Malamud, B. D., Freeborough, K., and Demeritt, D.: Enriching Great Britain's national landslide database by searching newspaper archives, Geomorphology, 249, 52–68, 2015.
Türkeş, M. and Tatli, H.: Use of the spectral clustering to determine coherent precipitation regions in Turkey for the period 1929–2007, Int. J. Climatol., 31, 2055–2067, https://doi.org/10.1002/joc.2212, 2011.
Yetmen, H. and Aytaç, A. S.: Influence of the meteorological conditions on forest fires in winter and spring in Eastern Black Sea Region: case study on Çamburnu (Sürmene) forest fire, J. Curr. Res. Soc. Sci., 7, 1–15, https://doi.org/10.26579/jocress-7.2.26, 2017.
UNISDR: Sendai Framework for Disaster Risk Reduction 2015–2030, United Nations Office for Disaster Risk Reduction, Geneva, 2015.
U.S. Geological Survey: Magnitude 7.9 – Eastern Sichuan, China, 12 May 2008 06:28:01 UTC, https://earthquake.usgs.gov/earthquakes/eventpage/usp000g650 (last access: 10 May 2024), 2008.
Waltham, A. C. and Fookes, P. G.: Engineering classification of karst ground conditions, Q. J. Eng. Geol. Hydroge., 36, 101–118, 2003.