the Creative Commons Attribution 4.0 License.
the Creative Commons Attribution 4.0 License.
 | 16 Jun 2025
Assessing future impacts of tropical cyclones on global banana production
Sophie Kaashoek
Žiga Malek
Nadia Bloemendaal
Tropical cyclones (TCs) are projected to increase in intensity globally, impacting human lives; infrastructure; and important agricultural activities, such as banana production. Banana production is already impacted by TCs in several parts of the world, leading to price volatility and impacted livelihoods of banana producers. While many potential impacts on banana production have already been quantified on a local scale, it remains unclear how bananas could be impacted by TCs across the globe under present and future climate conditions. To address this, we first looked at the documented impacts of TCs on banana production from different places all around the world. Using spatially explicit data on banana-producing regions and future TC occurrence and magnitude, we then identified the spatial distribution and extent of areas where TCs could impact banana production. Our results suggest that considerable portions of global banana production are at risk of being impacted by TCs under present and future climate conditions, and we show this for different return periods.
Globally, 24.3 % of all banana-producing areas are projected to suffer major or complete (>84 %) damage under current climate conditions, increasing to 26.5 % under future climate scenarios at the 100-year wind speed return period. The regions experiencing the most notable increases in majorly damaged area under future conditions are the Caribbean (9.3 %), the Middle East and North Africa (36 %), and Southeast Asia (21.9 %). The most profound decreases in majorly damaged area are found in Central America (−35.8 %) and East Asia (−7.6 %). The most substantial change in completely damaged area is observed in East Asia, Southeast Asia and Oceania.
Additionally, we estimate that 30.1 % of global production under current conditions and 31.1 % under future conditions will be majorly or completely damaged at the 100-year return period. The regions predominantly affected in the future are Asia and the Caribbean, potentially experiencing substantial disruption in banana production. Our results therefore indicate that considerable efforts in climate adaptation are essential to ensure the stability of global banana supply chains.
- Article
(1327 KB) - Full-text XML
-
Supplement
(503 KB) - BibTeX
- EndNote


Currently, average global surface temperatures have already increased by 1.1 °C above pre-industrial levels (IPCC, 2023). These increasing temperatures can trigger fast-changing weather patterns potentially causing more frequent and intense extremes affecting water and food security with high confidence (IPCC, 2021). In particular, tropical cyclones (TCs) are projected to increase in intensity (Knutson et al., 2020). This is predominantly driven by increasing sea-surface temperatures (SSTs), which serve as fuel for an intensifying TC. This is an alarming projection, since TCs can substantially impact coastal communities, causing potentially large agricultural and financial losses and human casualties. One of the agricultural activities with high socioeconomic significance that is under threat of TCs is banana production. Globally, bananas are the most consumed fruit (FAO, 2024a). In countries all over the world bananas provide a large part of nutritional diversity in the diet of the average consumer. A widespread benefit of bananas is its nutritional value; they are rich in calories, are perfectly suitable for dietary diversity and contain a variety of vitamins and fibres (Petsakos et al., 2019). Sustainable production of the fruit provides an important source of nutrition, maintaining food security and sustaining incomes (Petsakos et al., 2019; Varma and Bebber, 2019). In Latin American, Caribbean and Asian countries, bananas remain a significant contributor to the economy and provide a livelihood for millions (FAO, 2023a).
To many rural households, bananas generate an important part of their income (Mohan, 2017). In addition, bananas, together with plantains, are an important source of nutrition for millions of people. The reduced availability of bananas leads to higher prices for consumers and can cause a sudden and drastic decrease in income and economic prosperity for tens of thousands of producers in exporting countries (FAO, 2023c). Due to our globalized economic system and its strong interdependencies, the potential negative impact on the production system not only will be harmful on a local scale but can escalate to the global scale (Lesk et al., 2016). Consequently, the partial or full destruction of banana plantations across larger areas would have a large influence on the currently stable and reliable global value chain of bananas (Varma et al., 2020). In addition, a disruption in banana production will negatively impact the United Nations Sustainable Development Goals, including the first (no poverty), second (zero hunger) and third (good health and well-being) goals (UN, 2015). Banana production is already expected to be more impacted by numerous extreme weather events in the coming decades such as drought, heavy precipitation and heatwaves (Malek et al., 2022). Yet so far, studies on the impact of extreme weather on agricultural areas have mainly focused on the influence of extreme heat or a precipitation deficit on production, thereby lacking a perspective on high-impact, low-probability events like TCs (Calberto et al., 2015; Lesk et al., 2016; Varma and Bebber, 2019; Malek et al., 2022). This is remarkable, since the direct impact of TCs on the agricultural sector can be substantial (Kunze, 2021). Research has shown that there is a clear negative direct impact of TCs on banana-producing areas (Huigen and Jens, 2006; Robinson and Saúco, 2010; Mohan, 2017). TCs can completely disrupt banana cultivation, and it can take up to a year to recover depending on farmers' access to facilities and finance (Mamuye, 2016). For example, hurricanes Eta and Iota of 2021 caused a 51 % decrease in banana yields in Honduras (FAO, 2024a, p. 2). Due to production disruption, there was less supply increasing the average price of the fruit (Beer et al., 2014). However, due to a lack of available data on TCs, the spatial impact of this hazard for bananas can not be identified on a global scale (Malek et al., 2022). Several indirect risk assessments have been performed since the occurrence of a TC event on the macro- or mesoscale (Huigen and Jens, 2006; Beer et al., 2014; Mohan, 2017). It is expected that in the coming decades banana producers in Southeast Asia, Oceania and the Caribbean will likely be impacted even more by TCs, but there is no evidence of where impacts are expected to occur on a supra-national scale (Varma and Bebber, 2019; Malek et al., 2022). This is problematic, as banana cultivators have no reliable projections of the probability of being affected by a TC. When banana producers are provided with better estimates of the likelihood of TC impacts, they will be able to implement adaptation strategies, thereby increasing their resilience (Chavez et al., 2015).
In this paper, we therefore assess how future TCs could impact banana production on a global scale. We first synthesize the documented impacts of TCs on banana production by reviewing recent studies. Using data on the global distribution of current and future TCs, we identify where banana-producing areas will be exposed to TCs. Finally, we quantify and map the extent to which banana production that will experience more frequent and damaging TCs. This way, we contribute to the ongoing efforts to better understand the potential impacts of TCs on agriculture.
2.1 Overview of methods
We perform a risk assessment by mapping the global TC risk to banana-producing areas under baseline (1980–2017) and future (2015–2050 under the SSP585 forcing scenario) climate conditions. We follow the risk framework of the UNDRR (2017) that is based on the understanding that risk is the product of hazard (Sect. 2.2), exposure (Sect. 2.3) and vulnerability (Sect. 2.4). We refer to hazard as the probability of occurrence of a certain TC wind speed, exposure as the banana-producing area at risk and vulnerability as the fraction of banana plants that will be damaged by a natural hazard (UNDRR, 2017).
2.2 Tropical-cyclone hazard mapping
To represent the hazard component of our risk framework, we use the Synthetic Tropical cyclOne geneRation Model (STORM) baseline and near-future climate TC wind speed return period (RP) maps (Bloemendaal et al., 2020b, 2022). STORM is the first model that captures future global-scale TC wind speed probability trends derived at high (10 km) spatial resolution. STORM is created using a synthetic, fully statistical modelling approach that simulates new TCs using statistical information on TC characteristics (frequency, track and intensity) derived from historical observations. STORM then simulates 10 000 years of synthetic TCs based on baseline climate conditions (representing 1980–2017), thereby providing the necessary data for the calculation of wind speed RPs (in m s−1). To analyse changes in TC risk under climate change, we use the STORM future climate dataset (Bloemendaal et al., 2022). This dataset extracts future climate TC statistics using four high-resolution global climate models based on baseline and SSP585 (Shared Socioeconomic Pathway) 2015–2050 climate conditions and the STORM algorithm. SSP585 is a high-emission scenario and assumes that there will be no mitigation policies on greenhouse gas emissions, leading to high radiative forcing (O'Neill et al., 2016). There is little deviation in terms of TC activity between lower-forcing scenarios and the high-emission SSP585 scenario (IPCC, 2021; Bloemendaal et al., 2022). TC statistics (frequency, intensity) are extracted from both the baseline and near-future runs, and changes in these statistics (the so-called “delta”) are calculated. Subsequently, these deltas are added to the historical dataset which was used as input to create the STORM historical dataset. This creates a “future climate version” of this historical dataset, without the biases often present in general circulation models. For more information on this method, we direct readers to Bloemendaal et al. (2022).
The STORM datasets are generated on a global scale, with the datasets split up over six basins (eastern Pacific, North Atlantic, northern Indian, southern Indian, South Pacific, western Pacific). The STORM present and future wind speed RP datasets provide 10 m 10 min maximum wind speeds at various RP levels and at 10 km×10 km grid cell resolution. From these datasets, we extract the 10-, 100- and 200-year wind speed RP maps to account for both events with higher probabilities but lower intensities and events with lower probabilities but higher intensities. Note that a high RP corresponds to a low probability of occurrence and thereby a higher risk probability (Ward et al., 2011; Bevacqua et al., 2019).
2.3 Exposure
2.3.1 Banana production and impacts of tropical cyclones
In 2023, the global banana export volume was 19.2×10⁶ t, 15×106 t of which were exported from Latin America and the Caribbean (FAO, 2024b). The five largest exporting countries are Ecuador, the Philippines, Costa Rica, Guatemala, Colombia and the Dominican Republic (FAO, 2023). The most consumed and traded bananas can be divided in two large groups: the “dessert” banana types which are sweet and can be consumed raw and “cooking” banana types which need to be treated before use (FAO, 2019). Cooking bananas are mainly found in Asia and East Africa. The dessert banana is concentrated in Latin America and Asia, including the Cavendish type also found in the Caribbean. The harvest of the plantain is found primarily in Africa, Latin America and Asia. The estimated size of the global total banana plantation is 5.6×10⁶ ha (Machovina and Feeley, 2013; Coltro and Karaski, 2019; FAO, 2019). In this study, we assume all banana types exhibit the same vulnerability to TC wind speeds. A distinction will not be drawn between the types, as the scope of this study is primarily centred on highly destructive events such TCs, wherein the resultant damage is anticipated to be equivalent across both types. Furthermore, the absence of systemic data necessitates an equal consideration of cultivator types in evaluating the impacts of such destructive events.
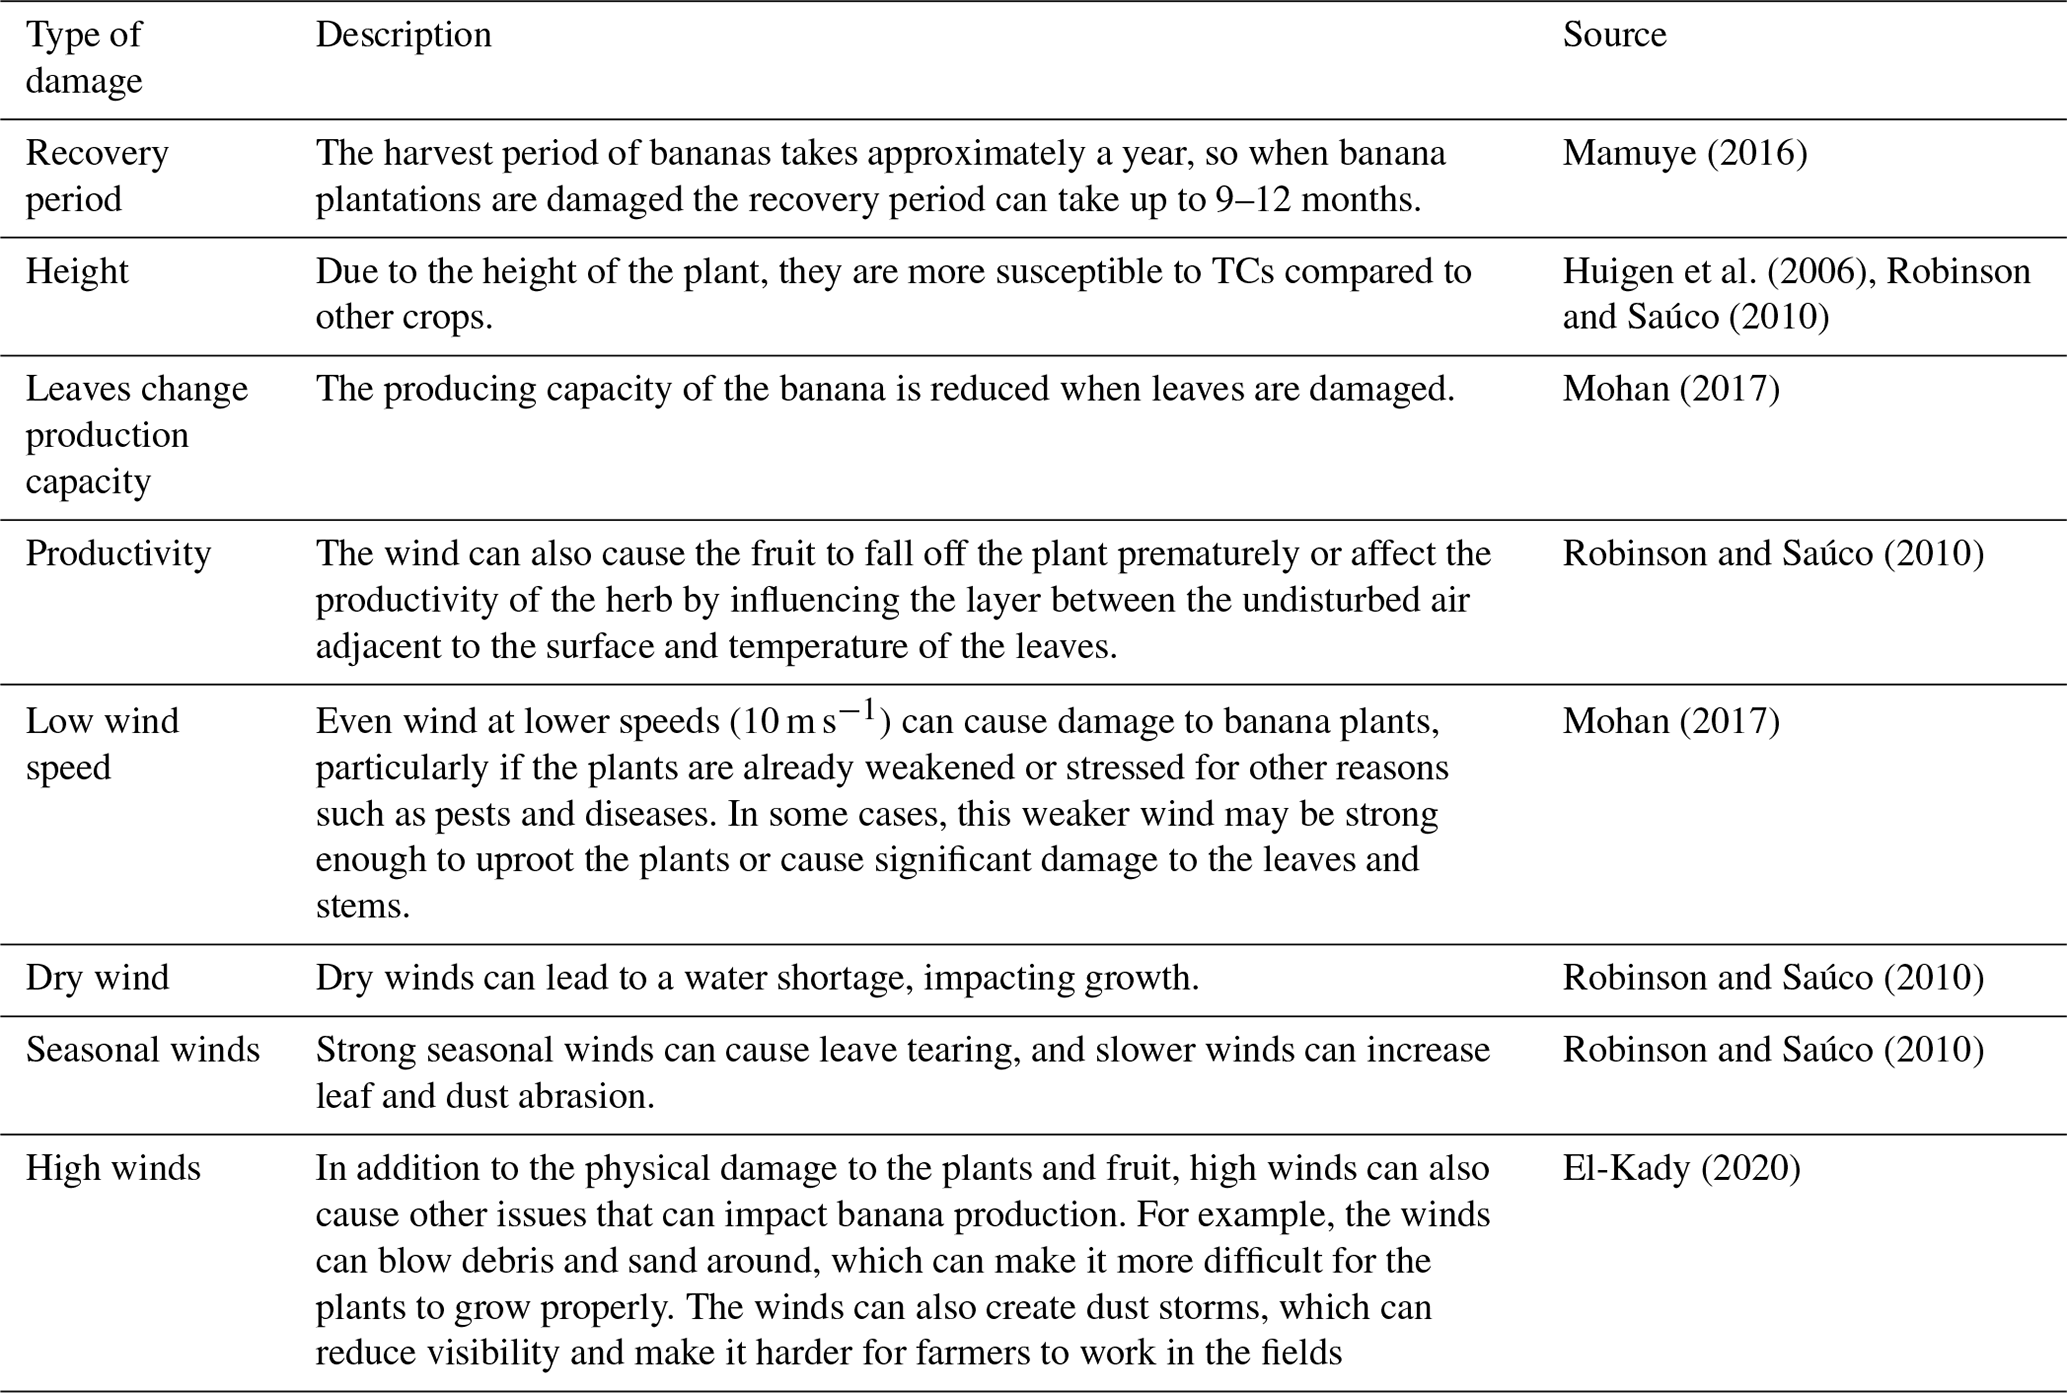
TCs can cause significant damage to banana-producing areas in different ways (Table 1). Despite the diverse impacts on banana production, TCs particularly lead to loss through wind speeds and less so by the amount of rainfall (Lin et al., 2020). This is mostly because the fruit is easily blown off the plant by strong winds, directly leading to crop losses. Humid winds can have a positive influence by helping to pollinate banana flowers, disperse pests and attract beneficial insects. On the other hand, strong winds can cause physical damage to the fruit itself, either destroying it or reducing the quality of production, potentially limiting direct human consumption (Robinson and Saúco, 2010).
2.3.2 Mapping banana-producing areas
To map the banana-producing areas susceptible to a TC, we used MapSPAM (Spatial Production Allocation Model) data on the global spatial distribution of major crops, including bananas (IFPRI, 2024). These data present recent systematically developed data on banana distribution by combining a set of statistical and remote sensing data. The spatial resolution of the data is roughly 10 km×10 km at the Equator. To exclude outlier areas in countries where bananas are generally not produced or are produced in protected environments such as greenhouses (such as the European Union), we applied a threshold of 5 ha within the 10 km×10 km grid cell. Grid cells are considered relevant only when containing banana-producing areas that surpass the specified 5 ha threshold (and where banana cultivation covers more than 0.05 % of the total grid). We then looked at banana production in tonnes in these areas, using the same data, as MapSPAM provides data on not only the spatial distribution of harvested areas but also production.
2.4 Vulnerability
2.4.1 Vulnerability curve
Vulnerability ascribes the characteristics of the exposed asset that makes it susceptible to the effects of a certain hazard (here a TC) (UNDRR, 2017). The vulnerability curve assesses the damage state against the hazard intensity showing the wind speed (m s−1) interval and the mean damage ratio (MDR) (Mo et al., 2016; Yum et al., 2021). Vulnerability curves can be based on empirical, analytical, and expert opinion or judgement methods (Merz et al., 2010). Yet so far, most academically developed vulnerability curves for TCs quantify wind speed damage focusing on the built environment (Sun et al., 2021; Yum et al., 2021). To the best of our knowledge, there is currently no evidence on the vulnerability curves of wind-induced damage for bananas. To quantify the level of damage to banana plantations caused by a certain wind speed, we therefore have to develop vulnerability curves. This is done by executing a systemic review of reported past TC events which damaged banana plantations. To construct the curves, we use an approach similar to the research by Yum et al. (2021), where the authors use existing white and grey literature reporting on historic TC events, their maximum wind speed and damage. While we acknowledge that TC impacts are often caused by an interplay of wind, precipitation and storm surge, we use wind speed as a proxy for all three hazards as information on the latter two hazards is often lacking or incomplete (see for instance Eberenz et al., 2021, and Yum et al., 2021, for a similar approach for building vulnerability curves). Such an approach based on empirical data allows for higher accuracy of the damage curve (Merz et al., 2010). To retrieve reports of past events of damaged banana plantation by wind speed, peer-reviewed articles and news reports about destroyed banana plantations by TC wind were explored using Google Search and the Google Scholar and WorldCat academic databases (published anytime using the search terms of bananas and storms, hurricanes, (tropical) cyclones and typhoons, excluding studies that did not include wind damage). The events were categorized by time, location, wind speed and the percentage of the destroyed plantation. We identified 22 cases where impacts of TCs on banana production were quantified from all around the globe (see Table S1 in the Supplement). The wind speeds near the location that were mentioned in the events were taken. When an event had no mention of maximum wind speeds, we used the historical TC database of NOAA National Hurricane Center (2024) and retrieved the wind speeds and trajectories for the affected region. The wind speed closest to the affected region was taken. This way we were able to identify the wind speed and trajectory of the TC at all locations. The 22 cases were categorized by time, location, wind speed and the percentage of the destroyed plantation. It is important to point out that Yum et al. (2021) had access to insurance data for damage to buildings for different wind speeds. The high-quality input data significantly reduced the epistemic uncertainty in their vulnerability curve. Since this does not exist for banana damage, we had to use grey literature which is likely to impact the quality of our input data (as shown in Table S1) and subsequently is very likely to affect the uncertainty. This is most notably shown for the widespread of damage points for lower wind speeds (10–25 m s−1).
2.4.2 Mean damage ratio
A damage function is a common tool used to present the vulnerability of assets, in this case banana-producing areas, to hazard, in this case a TC (de Ruiter et al., 2017). All 22 events found were used to calculate the damage ratio of the TC-induced damaged banana plantation against the corresponding wind speed intensity, similarly to the method discussed by Yum et al. (2021). The damage ratio indicates the likelihood of a banana plant surpassing a certain damage level threshold (vmin) as the wind speed increases up to a certain critical point. Above the threshold, the exceedance probability increases before it reaches a 100 % destroyed plantation level (vmax), showing the plantation is fully destroyed (Yum et al., 2021). Yum et al. (2021) quantify the damage ratio based on insurance data (using monetary values). In our study, we only assess the physical vulnerability due to the TC wind speed. The equation used is described in Eq. (1):
where Xdestroyed represents the destroyed plantation area (in ha) and Xtotal represents the total plantation area (in ha). From Eq. (1), it follows that higher damage ratios relate to higher vulnerability. The formula is used for the events lacking a damage ratio. To quantify the damage ratio, the spatial destruction (destroyed area in hectares) and the entire scope (plantation in hectares) need to be identified. Some events referred to banana plantation losses based on the total banana production area in a country. Given that countries have significantly different sizes and spatial distributions of production areas, it is necessary to assess the exact location where an individual TC struck the plantation. Hence, to obtain a robust and reliable database, events are removed when the location could not be determined. A total of 22 damage ratios (d1, d2, …, d22) were identified with the corresponding MDR wind speeds (v1, v2, …, v22) (see Table S1). The datasets were categorized from lowest to highest wind speed and grouped into three wind speed intervals, namely 0–25, 26–43 and above 44 (see Table 2). The wind speed intervals were established based on expert judgement (see Table 1) and the Simpson and Saffir (1974) scale (see Table 2). According to Robinson and Saúco (2010) and Mohan (2017), evidence of damage to banana plantations was already observed at wind speeds of 10 m s−1, hence why we set the lower limit of the curve (vmin) at 10 m s−1. The resulting vulnerability curve is shown in Fig. 1. Similar to other studies (e.g. Yum et al., 2021; Shinozuka et al., 2000), the curve has been smoothed.
Besides deriving the vulnerability curve, we can also use our database to define three different types of damage: moderate damage to a banana plantation occurs up to 25 m s−1, between 26 and 43 m s−1 they experience major damage, and above 44 m s−1 they are completely damaged. Next, we calculate the mean damage ratio (MDR) for each of these intervals. As such, MDR1 corresponds to the MDR over the moderate (first) damage interval, MDR2 corresponds to the MDR for the major (second) damage interval and MDR3 corresponds to the complete (third) damage interval (see Table 2). The MDR is calculated using damage ratio (d) and is defined in Eq. (2):
Table 2Mean damage ratio per wind speed interval with a corresponding damage level.
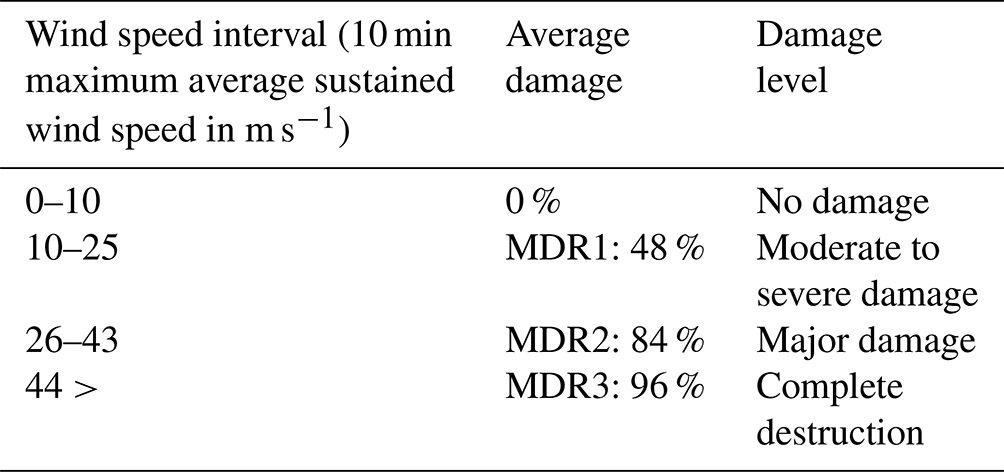
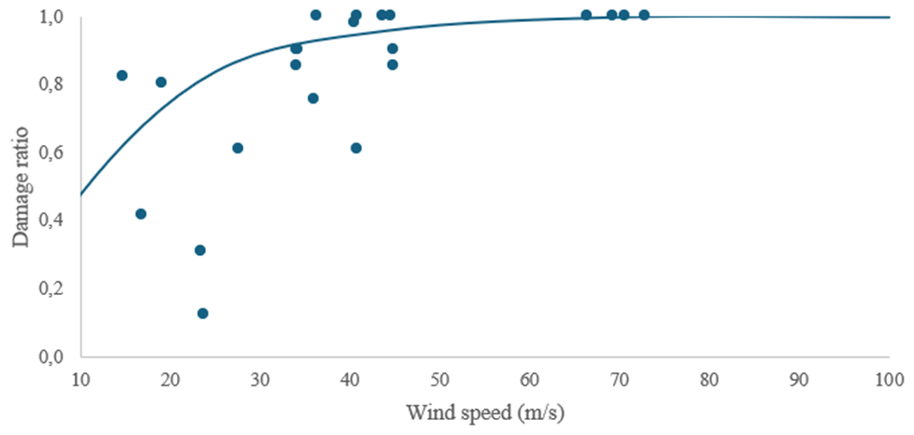
Figure 1Constructed vulnerability curve of tropical-cyclone wind damage to bananas based on a meta-analysis of 22 studies, similar to Yum et al. (2021).
3.1 Banana-producing areas
We observe an increase in the share of areas at risk and a corresponding increase in damage levels for the three distinct return periods: 10- (RP10), 100- (RP100) and 200-year return period (RP200). Globally, under RP10, 16.5 % of all banana-producing areas will potentially be moderately or majorly damaged under baseline climate conditions. Under RP100, 34.5 % will be moderately, majorly or completely damaged, and 39.1 % will be under RP200. Furthermore, it is evident that there will be a change in the extent of areas susceptible to damage from future TCs under the SSP585 scenario for major banana-producing regions (Table 4). Under RP10, 11 % of banana-producing areas globally will be subject to increase moderately and 9.5 % will be subject to major destruction in the future, presenting an 8 % and 51 % increase compared to the baseline climate, respectively (Tables 3 and 4, Fig. 2). For SSP585 under RP100 21.7 % of areas will be subject to major damage and 4.8 % will be subject to complete destruction, presenting a 3 % and 50 % increase compared to baseline climate conditions (Tables 3 and 4, Fig. 2).
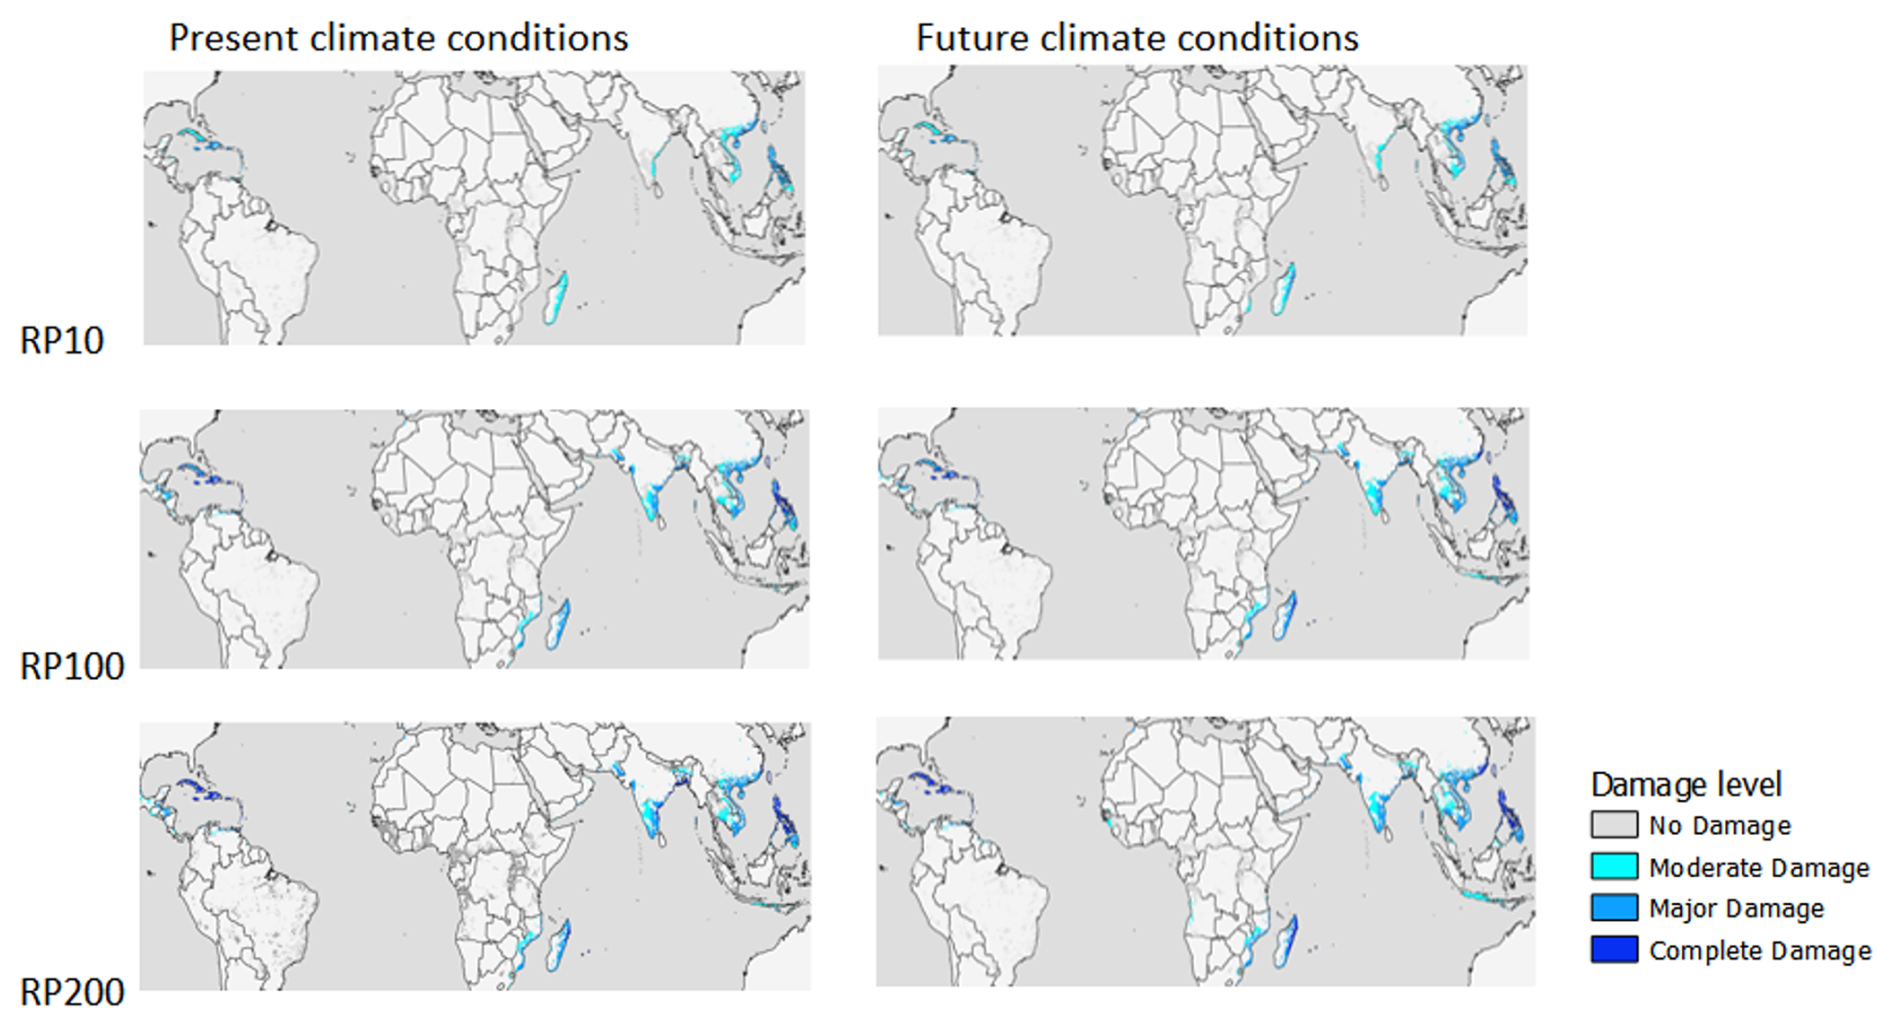
Figure 2Global distribution of impacted banana-producing areas across different damage levels under various return periods for both baseline (1980–2017) and future climates (2015–2050). High-resolution images for individual return periods are provided in S4.
Table 3Global distribution of impacted banana-producing areas across different damage levels under various return periods for both baseline (1980–2017) and future climates (2015–2050) (in %).
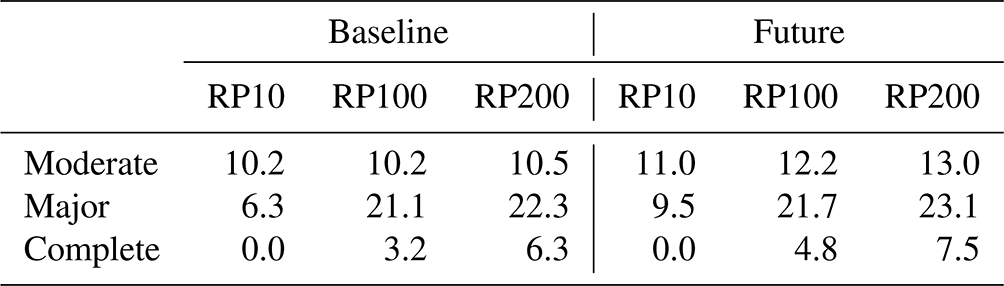
Table 4Increase in the damaged banana-producing area on a worldwide basis comparing baseline (1980–2017) and future climates (2015–2050) across different damage levels under various return periods (in %).
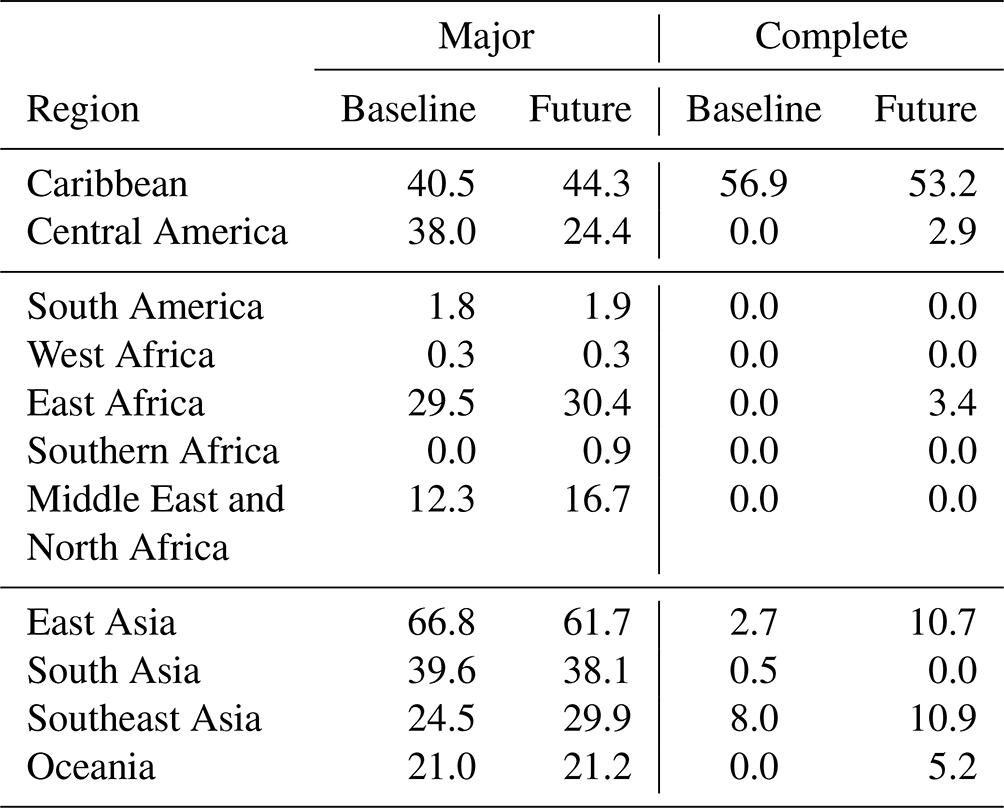
There are large disparities across the globe when it comes to banana-producing areas being affected by TCs (Table 5). Under RP100, the regions experiencing the most notable increase in majorly damaged area under future conditions are the Caribbean (9.3 %), the Middle East and North Africa (36 %), and Southeast Asia (21.9 %). Most profound decreases in majorly damaged area are found in Central America (−35.8 %) and East Asia (−7.6 %). The most substantial change in completely damaged area is observed in East Asia, Southeast Asia and Oceania. South America and West and Southern Africa will experience minimal impact as TCs are rarely observed in these regions (Table 5).
Table 5Impacted banana-producing area in different regions across major and complete damage levels under RP100 for both baseline (1980–2017) and future climates (2015–2050) (in %). This table focuses on selected banana regions. However, not all regions are affected by tropical cyclones. The presented numbers in the table represent shares or proportions rather than absolute values. To provide a more comprehensive overview, absolute numbers in hectares can be found in Table S2 as well as the percentage of the damaged banana-producing area per country.
3.2 Banana production
There is a shift in impacted banana production under the SSP585 scenario for the time period 2015–2050. We observe an increase in the share of damaged areas and a change in the damage level for the three different RPs, namely RP10, RP100 and RP200. Under RP200 the global share of major damage to banana production increases by 6.1 % of total global production but the total amount of banana production completely destroyed decreases by 1.9 % to 5.1 % of total global production.
Table 6Global distribution of impacted banana production across different damage levels under various return periods for both baseline (1980–2017) and future climates (2015–2050) (in %).
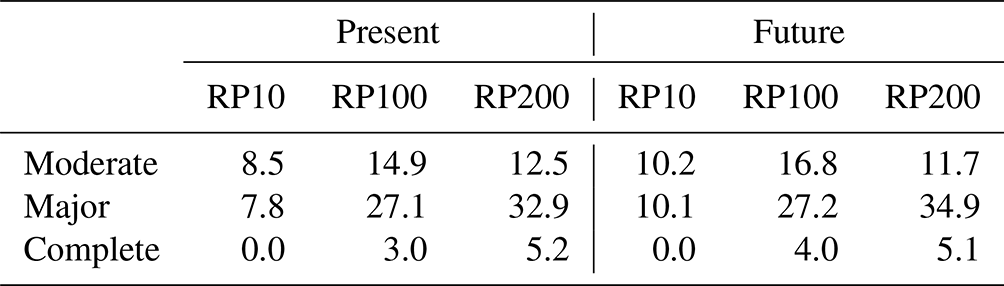
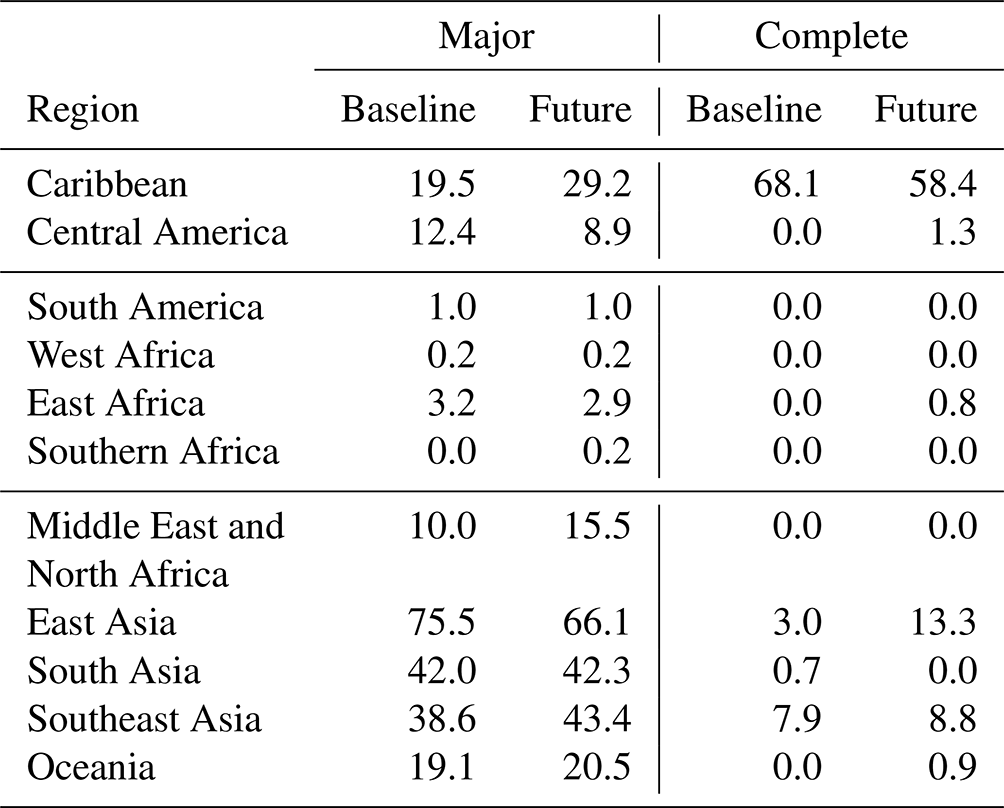
Under RP100, our results show that the regions predominantly affected by TCs are Asia and the Caribbean, experiencing substantial disruption in banana production. Banana production will be subject to complete damage in many parts of the Caribbean, amounting to a total of 58.4 % of production under the future climate. While this number represents a decrease compared to the baseline climate (68.1 % complete damage), our results indicate that the Caribbean will still be most impacted across all regions. East and Southeast Asia, hosting considerable shares of global banana production, are projected to experience 13.3 % and 8.8 % complete damage in the future, respectively. Despite other areas experiencing minor shares of production being impacted by complete damage, many areas are projected to experience major damage from more than 20 % of banana production under the future climate: East, South and Southeast Asia; the Caribbean; and Oceania. Our findings indicate a reduction in majorly affected area in Central America, East Africa and East Asia, while, simultaneously, previously unobserved complete damage has been identified. South Asia indicates the most notable change in decreased completely damaged area under future conditions (Table 7). Such large shares indicate that the stability of the current banana supply chains is under threat without considerable efforts in climate change adaptation.
Table 7Impacted banana production in different regions across major and complete damage levels under RP100 for both baseline (1980–2017) and future climates (2015–2050) (in %). This table focuses on selected banana-producing regions and acknowledges that not all regions are affected by tropical cyclones. The presented numbers in the table represent shares or proportions rather than absolute values. To provide a more comprehensive overview, absolute numbers in tonnes can be found in S3 as well as the percentage of the damaged banana-producing area per country.
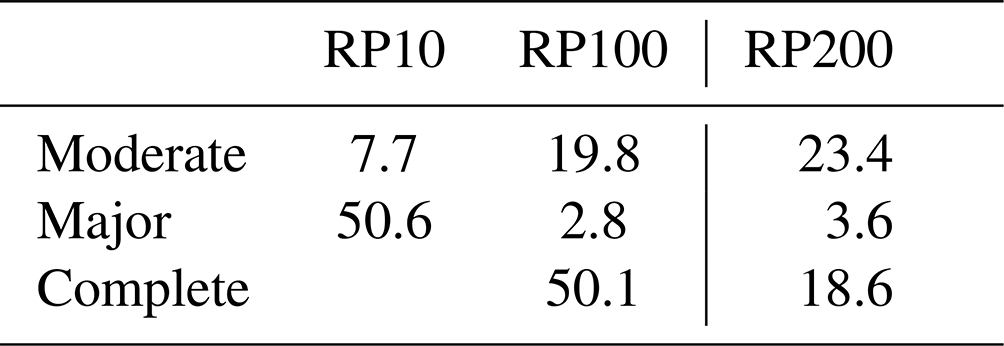
Notably, under RP100 and RP200, a substantial increase is observed in completely damaged area, while significant increments are evident in moderately and majorly damaged area for RP10 (Table 8). Conversely, a decline in production is seen for RP200. These changes can be attributed to the intensification of TCs in a warming climate, leading to alterations in their trajectories and a higher likelihood of targeting different areas for impact.
Table 8Increase in globally damaged banana production between baseline (1980–2017) and future (2015–2050) climate conditions (in %) across different damage levels and return periods.
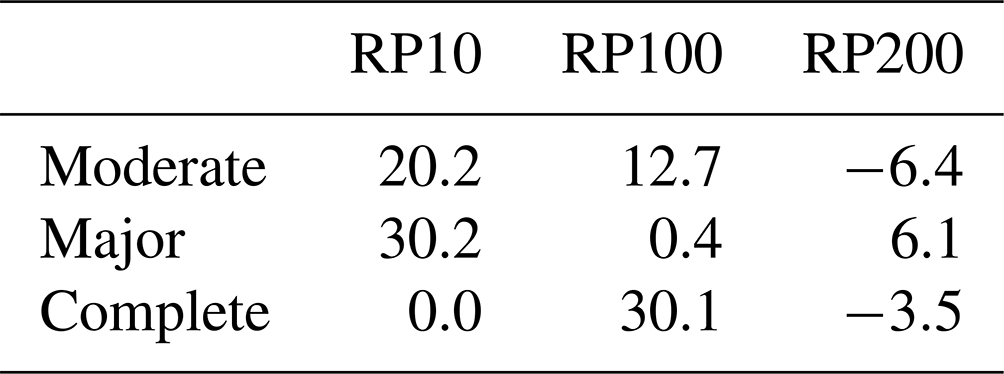
Interestingly, we observe a slight decrease in damage under RP100 and R200 for the moderate and complete damage classes in some regions (Table 8). This is predominantly due to a decrease in damage in South Asia (India), which, in turn, is driven by a decrease in TC wind speeds under RP200. This decrease is caused by a projected landward shift in the TC genesis region in the Bay of Bengal. Consequently, TCs are projected to form closer to the coast, meaning there is less time for a TC to intensify to higher wind speeds before it makes landfall and weakens again (see also Fig. 4 in Bloemendaal et al., 2022). This results in a decrease in wind speed at higher RPs, leading to lower banana plantation damage in this region.
4.1 Hazard modelling and impacts on banana production
This study presents the first attempt to map the spatial extent of potential current and future tropical-cyclone impacts on banana-producing areas and production globally. However, it potentially underestimates impacts on banana production by not considering indirect impacts of TCs on banana production. Waterlogging could lead to root rot, and excessive water could lead to favourable conditions for pests and diseases which are a major limitation to banana production (Aguilar et al., 2003). However, whether TCs would lead to such indirect impacts is very context specific, meaning that even within the same grid cell of our study we can expect different indirect impacts, depending on the slope, the soil, the terrain orientation and previously drained wetlands, to name a few. To account for such indirect impacts, both more detailed TC data and data on soil drainage are necessary. In addition, TCs can impact electricity, refrigeration and road infrastructure, furthermore leading to disruptions in supply chains and the potential inability to harvest and store the crops (Koks et al., 2019).
The STORM future climate datasets were generated based on the high-end SSP585 scenario. While one can discuss the likelihood of this emission scenario, as current developments are steering away from this scenario, the average climate conditions over the 2015–2050 time period do not differ substantially between the different forcing scenarios. We therefore believe that the SSP585 input dataset as was used for Bloemendaal et al. (2022) can be seen as a good proxy for changes in TC characteristics over the aforementioned time period. While this study does not consider TC impacts beyond 2050, we alert readers that the average climate conditions past 2050 do start to deviate and that the approach as used in Bloemendaal et al. (2022) does not hold then.
There are also limitations in the STORM model itself that could affect the outcomes of this study. First of all, TC intensity in STORM is solely modelled as having a direct relationship with sea-surface temperatures. In reality TC intensity is also largely influenced by vertical wind shear, an effect absent in STORM. While in general STORM validates well against observations (Bloemendaal et al., 2020c), there are regions where vertical wind shear in reality plays a critical role in governing TC intensity. One of these regions is the Bay of Bengal; for this region, TC intensity and associated RPs tend to be over- and underestimated, respectively. As a consequence, our impact assessment for this region can be overestimated. Secondly, STORM uses the parametric wind field model from Holland (1980) to translate point data to a 2-dimensional wind field. This model assumes asymmetry in the wind field arises from background flow; in reality, these asymmetries can also be induced by enhanced wind shear or interaction with land. This may result in slightly altered wind speed RPs. Lastly, TC decay after landfall is modelled through an empirical inland decay function (Kaplan and DeMaria, 1995). This decay function was derived based on landfalls in the USA and hence may perform less well elsewhere.
Next, the authors acknowledge that the considered STORM wind module does not take elevation effects into account. This means that TCs wind speeds can be over- or underestimated over land, as wind speeds can increase or decrease depending on the orientation of for instance a mountain ridge (Bloemendaal et al., 2020a). Second, STORM uses a lower bound at a wind speed of 18 m s−1 (Bloemendaal et al., 2022). However, it was found that banana plants can already be damaged by speeds above 10 m s−1, meaning we cannot assess damage up to a wind speed of 18 m s−1. Our results therefore potentially underestimate damage to banana production. Third, STORM models TCs on a basin scale, meaning that there is no transition of TCs across basins. This can be problematic in regions that can be affected by TCs originating from multiple basins, such as Central America. Lastly, TCs can also cause damage to banana plantations through excessive rainfall, runoff and landslides. These factors are, however, not modelled in STORM. The inclusion of such factors can potentially alter the risk estimates that were presented in this study.
Lastly, the outcomes of this study are inherent to the choice of the hazard model and the shape of the vulnerability curve. It is also beyond the scope of this study to assess model sensitivity using different synthetic models as input hazard datasets. However, such a study has been conducted regarding hazard data sensitivities and projected losses (Meiler et al., 2022). STORM was one of the hazard datasets used in the intercomparison. The authors showed that modelled impacts from STORM generally lie within the range imposed by the other models. In the northern Indian Ocean, modelled impacts from STORM exceed other synthetic models for rarer (>1-in-100-year) events, but impacts are still within 1 order of magnitude from the other datasets. However, monetary losses (to assets) do not directly translate into banana crop losses. But the hazard–exposure–vulnerability model framework used in this study is similar in nature to the one used in Meiler et al. (2022), with the same hazard dataset as input but different exposure and vulnerability data. As such, we hypothesize that a similar intercomparison study would yield the result that the STORM-simulated banana crop losses would lie either within the range imposed by other synthetic models or within 1 order of magnitude from such other models, similar to the outcomes of the monetary-loss study done by Meiler et al. (2022).
4.2 Vulnerability of banana production systems
We used an empirical approach to construct the vulnerability curve using a meta-analysis of 22 studies to increase accuracy of the curve. However, limited data availability can impact the results, and in turn the results can be difficult to transfer in space and time. While the vulnerability curve was developed using an existing and proven method (Yum et al., 2021), uncertainty in curve shape is strongly influenced by the lack of high-quality data linking hazard intensity to damage.
Damage assessments rely on numerous assumptions and require more thorough validation. According to Merz et al. (2010) hazard evaluation often overshadows damage assessment. Consequently, many damage levels can be considered inconsistent and subject to bias. The vulnerability curve we developed is based on 22 TC events that damaged banana plantations and expert knowledge. When no wind speed was named in the article, we used the NOAA database (NOAA National Hurricane Center, 2024). In two events, the trajectory did not exactly cross the affected location. In this case, we took the closest measurement. We hereby acknowledge that this is an overestimate for those affected hurricanes. Furthermore, the vulnerability curve is based on the understanding that all banana-producing areas have the same features irrespective of the location or country's political or economic situation. We did not include assumptions on the type of banana or plantation characteristics such as soil, slope and elevation. We acknowledge that this influences the damage level and suggest using these components for future studies. Furthermore, the type of the plantation identified in the grid cell can vary (Coltro and Karaski, 2019). Bananas that are produced in a mixed crop system have a larger resilience to TC damage than those produced on a monoculture farm and should therefore be evaluated separately (Huigen et al., 2006; Robinson and Saúco, 2010; Mohan, 2017). Next, it should be noted that because the constructed vulnerability curve was based on a meta-analysis of reported damage in academic and grey literature, there can be a bias towards the more damaging events as these could have been covered more in literature.
We only included physical-damage parameters in the development of the vulnerability curve, meaning that future research should also focus on socioeconomic and cultural aspects of banana producers. To achieve this, future research should focus on local scales, thereby increasing the accuracy of the vulnerability curves by including more input parameters, among others, local terrain and soil characteristics, the production system, and the implemented adaptation strategies. Such case studies can consider the climatic conditions and reliance on banana production at the specific location, as well as the socioeconomic situation of the countries involved. For instance, future studies could also assess low-probability events as they often show higher damage levels. Even though we already indicate high damage levels under high-probability RPs, the effects of low-probability events will be even larger and should be identified (Ward et al., 2011).
Identifying the locations and spatial extent of potential impacts of tropical cyclones on banana production is necessary for adaptation and more resilient banana supply chains. We find that banana-producing areas are at greater risk of being affected by future TCs, which is especially valid for some of the major banana-producing regions (Caribbean and South, East and Southeast Asia). We identified the most impacted banana production area per TC-prone region for the baseline and for future climate at different return period levels. Our findings indicate that significant portions of global banana production are at risk from tropical cyclones (TCs) under future climate conditions, and we demonstrate this for various return periods. Globally, 24.3 % of all banana-producing areas are projected to suffer major or complete (>84 %) damage under current climate conditions, increasing to 26.5 % under future climate scenarios at the 100-year wind speed return period. The regions experiencing the most notable increase in majorly damaged area under future conditions are the Caribbean (9.3 %), the Middle East and North Africa (36 %), and Southeast Asia (21.9 %). The most profound decreases in majorly damaged area are found in Central America (−35.8 %) and East Asia (−7.6 %). The most substantial change in completely damaged area is observed in East Asia, Southeast Asia and Oceania. Additionally, we project that 30.1 % of global production under current conditions and 31.1 % under future conditions will be majorly or completely damaged at the 100-year return period. The regions that are most likely to be affected in the future include Asia and the Caribbean, with substantial disruptions in banana production expected. Consequently, our results underscore the urgent need for significant climate adaptation efforts to maintain the stability of global banana supply chains.
The findings of this study are inherently tied to the choice of hazard model, specifically the use of STORM, and the shape of the vulnerability curve, which in turn was influenced by the lack of high-quality data linking hazard intensity and damage to banana crops. While this study did not assess the sensitivity of results to different synthetic models, previous research on hazard data sensitivities and projected losses indicates that STORM-simulated impacts generally fall within the range of other models or deviate by no more than 1 order of magnitude for rarer events. Building on this, we hypothesize that a similar intercomparison focused on banana crop losses would produce comparable outcomes, with STORM-based results aligning closely with those of other synthetic models. This highlights the robustness of the hazard–exposure–vulnerability framework employed in this study. Future research into wind damage of specific crops such as bananas could support more robust findings.
Our results can support the identification of vulnerable areas and can therefore be used as a starting point to target and implement adaptation measures, such as efforts to raise awareness and early warning systems. This will hopefully contribute to a reduction in the impacts of future TCs to banana plantations.
STORM data are openly accessible and available at https://doi.org/10.4121/12705164.v3 (Bloemendaal et al., 2020b) and STORM future climate data at https://doi.org/10.4121/14237678.v2 (Bloemendaal et al., 2023). FAO crop data are openly accessible and available at https://www.fao.org/faostat/en/#data/QCL (FAO, 2024a) and http://www.fao.org/faostat/en/#data/QC (FAO-STAT, 2019). The Global Spatially-Disaggregated Crop Production Statistics Data for 2020 dataset is openly accessible and available here: https://doi.org/10.7910/DVN/SWPENT (IFPRI, 2024).
The supplement related to this article is available online at https://doi.org/10.5194/nhess-25-1963-2025-supplement.
MCdR and ZM conceived the study. SK and MCdR prepared the manuscript with contributions from all co-authors. SK conducted the data analysis.
The contact author has declared that none of the authors has any competing interests.
Publisher’s note: Copernicus Publications remains neutral with regard to jurisdictional claims made in the text, published maps, institutional affiliations, or any other geographical representation in this paper. While Copernicus Publications makes every effort to include appropriate place names, the final responsibility lies with the authors.
This research has been supported by the EU Horizon 2020 research and innovation programme (grant no. 101003276) and the Nederlandse Organisatie voor Wetenschappelijk Onderzoek (grant no. VI.Veni.222.169).
This paper was edited by Ira Didenkulova and reviewed by two anonymous referees.
Aguilar, E. A., Turner, D. W., Gibbs, D. J., Armstrong, W., and Sivasithamparam, K.: Oxygen distribution and movement, respiration and nutrient loading in banana roots (Musa spp. L.) subjected to aerated and oxygen-depleted environments, Plant Soil, 253, 91–102, https://doi.org/10.1023/A:1024598319404, 2003.
Beer, T., Abbs, D., and Alves, O.: Concatenated hazards: tsunamis, climate change, tropical cyclones and floods, In Tsunami Events and Lessons Learned 255–270, Springer, https://doi.org/10.1007/978-94-007-7269-4_14, 2014.
Bevacqua, E., Maraun, D., Vousdoukas, M. I., Voukouvalas, E., Vrac, M., Mentaschi, L., and Widmann, M.: Higher probability of compound flooding from precipitation and storm surge in Europe under anthropogenic climate change, Sci. Adv., 5, eaaw5531, https://doi.org/10.1126/sciadv.aaw5531, 2019.
Bloemendaal, N., De Moel, H., Muis, S., Haigh, I. D., and Aerts, J. C.: Estimation of global tropical cyclone wind speed probabilities using the STORM dataset, Sci. Data, 7, 1–11, 2020a.
Bloemendaal, N., De Moel, H., Muis, S., Haigh, I. D., and Aerts, J. C. J. H.: STORM tropical cyclone wind speed return periods, ResearchData [data set], https://doi.org/10.4121/12705164.v3, 2020b.
Bloemendaal, N., Haigh, I. D., de Moel, H., Muis, S., Haarsma, R. J., and Aerts, J. C.: Generation of a global synthetic tropical cyclone hazard dataset using STORM, Sci. Data, 7, 1–12, 2020c.
Bloemendaal, N., de Moel, H., Martinez, A. B., Muis, S., Haigh, I. D., van der Wiel, K., Haarsma, R. J., Ward, P. J., Roberts, M. J., Dullaart, J. C., and Aerts, J. C.: A globally consistent local-scale assessment of future tropical cyclone risk, Sci. Adv., 8, eabm8438, https://doi.org/10.1126/sciadv.abm8438, 2022.
Bloemendaal, N., de Moel, H., Martinez, A. B., Muis, S., Haigh, I. D. et. al.: STORM Climate Change synthetic tropical cyclone tracks, Version 2, 4TU, ResearchData [data set], https://doi.org/10.4121/14237678.v2, 2023.
Calberto, G., Staver, C., and Siles, P.: An assessment of global banana production and suitability under climate change scenarios, Climate change and food systems: global assessments and implications for food security and trade, Rome, Food Agriculture Organization of the United Nations (FAO), ISBN 978-92-5-108699-5, 2015.
Chavez, E., Conway, G., Ghil, M., and Sadler, M.: An end-to-end assessment of extreme weather impacts on food security, Nat. Clim. Change, 5, 997–1001, 2015.
Coltro, L. and Karaski, T. U.: Environmental indicators of banana production in Brazil: Cavendish and Prata varieties, J. Clean. Prod., 207, 363–378, 2019.
de Ruiter, M. C., Ward, P. J., Daniell, J. E., and Aerts, J. C. J. H.: Review Article: A comparison of flood and earthquake vulnerability assessment indicators, Nat. Hazards Earth Syst. Sci., 17, 1231–1251, https://doi.org/10.5194/nhess-17-1231-2017, 2017.
Eberenz, S., Lüthi, S., and Bresch, D. N.: Regional tropical cyclone impact functions for globally consistent risk assessments, Nat. Hazards Earth Syst. Sci., 21, 393–415, https://doi.org/10.5194/nhess-21-393-2021, 2021.
El-Kady, A. E.: The impact of dust storms on crop production in arid regions: A review, J. Arid Land, 22, 29–37, 2020.
FAO: Banana facts and figures, https://www.fao.org/economic/est/est-commodities/oilcrops/bananas/bananafacts/en/#.Y7K8BXbMJD8, last access: 30 January 2023.
FAO: FAOSTAT, Crops and livestock products statistics, https://www.fao.org/faostat/en/#data/QCL (last access: January 2025), 2024a.
FAO: Banana market review 2023, Rome, https://openknowledge.fao.org/handle/20.500.14283/cd1721en (last access: January 2025), 2024b.
FAO-STAT: Crop statistics, http://www.fao.org/faostat/en/#data/QC (last access: 12 June 2025), 2019.
Huigen, M. G. and Jens, I. C.: Socio-economic impact of super typhoon Harurot in San Mariano, Isabela, the Philippines, World Dev., 34, 2116–2136, 2006.
Holland, G. J.: An Analytic Model of the Wind and Pressure Profiles in Hurricanes, Mon. Weather Rev., 108, 1212–1218, https://doi.org/10.1175/1520-0493(1980)108<1212:aamotw>2.0.co;2, 1980.
International Food Policy Research Institute (IFPRI): Global Spatially-Disaggregated Crop Production Statistics Data for 2020 Version 1.0.0, Version 3, Harvard Dataverse [data set], https://doi.org/10.7910/DVN/SWPENT, 2024.
IPCC: The Physical Science Basis, Contribution of Working Group I to the Sixth Assessment Report of the Intergovernmental Panel on Climate Change, Cambridge University Press, Cambridge, United Kingdom and New York, NY, USA, 1513–1766, https://doi.org/10.1017/9781009157896, 2021.
IPCC: Climate Change 2023: Synthesis Report, Contribution of Working Groups I, II and III to the Sixth Assessment Report of the Intergovernmental Panel on Climate Change, edited by: Core Writing Team, Lee, H., and Romero, J., IPCC, Geneva, Switzerland, 35–115, https://doi.org/10.59327/IPCC/AR6-9789291691647, 2023.
Kaplan, J. and DeMaria, M. A.: Simple Empirical Model for Predicting the Decay of Tropical Cyclone Winds after Landfall, J. Appl. Meteorol., 34, 2499–2512, https://doi.org/10.1175/1520-0450(1995)034<2499:ASEMFP>2.0.CO;2, 1995.
Knutson, T., Camargo, S. J., Chan, J. C., Emanuel, K., Ho, C. H., Kossin, J., and Wu, L.: Tropical cyclones and climate change assessment: Part II: Projected response to anthropogenic warming, B. Am. Meteor. Soc., 101, E303–E322, 2020.
Koks, E. E., Rozenberg, J., Zorn, C., Tariverdi, M., Vousdoukas, M., Fraser, S. A., Hall, J. W., and Hallegatte, S.: A global multi-hazard risk analysis of road and railway infrastructure assets, Nat. Commun., 10, 2677, https://doi.org/10.1038/s41467-019-10442-3, 2019.
Kunze, S.: Unraveling the effects of tropical cyclones on economic sectors worldwide: direct and indirect impacts, Environ. Resour. Econ., 78, 545–569, 2021.
Lesk, C., Rowhani, P., and Ramankutty, N.: Influence of extreme weather disasters on global crop production, Nature, 529, 84–87, 2016.
Lin, Y. C., Wang, W. H., Lai, C. Y., and Lin, Y. Q.: Typhoon type index: A New index for understanding the rain or wind characteristics of typhoons and its application to agricultural losses and crop vulnerability, J. Appl. Meteorol. Clim., 59, 973–989, 2020.
Machovina, B. and Feeley, K. J.: Climate change driven shifts in the extent and location of areas suitable for export banana production, Ecol. Econ., 95, 83–95, 2013.
Malek, Ž., Loeffen, M., Feurer, M., and Verburg, P. H.: Regional disparities in impacts of climate extremes require targeted adaptation of Fairtrade supply chains, One Earth, 5, 917–931, 2022.
Mamuye, N.: Statistical Analysis of Factor Affecting Banana Production in GamoGofa District, Southern Ethiopia, Engineering and Applied Sciences, 1, 5–12, 2016.
Meiler, S., Vogt, T., Bloemendaal, N., Ciullo, A., Lee, C. Y., Camargo, S. J., Emanuel, K., and Bresch, D. N: Intercomparison of regional loss estimates from global synthetic tropical cyclone models, Nat. Commun., 13, 6156, https://doi.org/10.1038/s41467-022-33918-1, 2022.
Merz, B., Kreibich, H., Schwarze, R., and Thieken, A.: Review article ”Assessment of economic flood damage”, Nat. Hazards Earth Syst. Sci., 10, 1697–1724, https://doi.org/10.5194/nhess-10-1697-2010, 2010.
Mo, W., Fang, W., Wu, P., and Tong, X.: Development of vulnerability curves to typhoon hazards based on insurance policy and claim dataset, EGU General Assembly 2016, Vienna, 17–22 April 2016, https://meetingorganizer.copernicus.org/EGU2016/EGU2016-3360-1.pdf, 2016.
Mohan, P.: The economic impact of hurricanes on bananas: a case study of Dominica using synthetic control methods, Food Policy, 68, 21–30, 2017.
NOAA National Hurricane Center: Historical Hurricane Tracks, NOAA, https://coast.noaa.gov/hurricanes/#map=4/32/-80 (last access: 30 January 2023), 2024.
O'Neill, B. C., Tebaldi, C., van Vuuren, D. P., Eyring, V., Friedlingstein, P., Hurtt, G., Knutti, R., Kriegler, E., Lamarque, J.-F., Lowe, J., Meehl, G. A., Moss, R., Riahi, K., and Sanderson, B. M.: The Scenario Model Intercomparison Project (ScenarioMIP) for CMIP6, Geosci. Model Dev., 9, 3461–3482, https://doi.org/10.5194/gmd-9-3461-2016, 2016.
Petsakos, A., Prager, S. D., Gonzalez, C. E., Gama, A. C., Sulser, T. B., Gbegbelegbe, S., and Hareau, G.: Understanding the consequences of changes in the production frontiers for roots, tubers and bananas, Glob. Food Secur.-Agr., 20, 180–188, 2019.
Robinson, J. C. and Saúco, V. G.: Bananas and plantains, Vol. 19, Cabi, Reading, UK, ISBN 9781845936587, 2010.
Shinozuka, M., Feng, M. Q., Lee, J., and Naganuma, T.: Statistical analysis of fragility curves, J. Eng. Mech., 126(, 1224–1231, 2000.
Simpson, R. H. and Saffir, H.: The hurricane disaster – Potential scale, Weatherwise, 27, 169–186, 1974.
Sun, Y., Wu, T., and Cao, Z.: Wind vulnerability analysis of standing seam roof system with consideration of multistage performance levels, Thin Wall. Struct., 165, 107942, https://doi.org/10.1016/j.tws.2021.107942, 2021.
UN: Transforming Our World: The 2030 Agenda for Sustainable Development, Resolution Adopted by the General Assembly on 25 September 2015, 42809, 1–13, 2015.
UNDRR: Terminology for Disaster Risk Reduction, UNDRR, Geneva, Switzerland, https://www.undrr.org/terminology (last access: 13 April 2024), 2017.
Varma, V. and Bebber, D. P.: Climate change impacts on banana yields around the world, Nat. Clim. Change, 9, 752–757, 2019.
Varma, V., Thompson, W., Duarte, S. B., Krütli, P., Six, J., and Bebber, D. P.: Mapping the impacts of hurricanes Maria and Irma on banana production area in the Dominican Republic, bioRxiv [preprint], https://doi.org/10.1101/2020.09.20.304899, 2020.
Ward, P. J., de Moel, H., and Aerts, J. C. J. H.: How are flood risk estimates affected by the choice of return-periods?, Nat. Hazards Earth Syst. Sci., 11, 3181–3195, https://doi.org/10.5194/nhess-11-3181-2011, 2011.
Yum, S. G., Kim, J. M., and Wei, H. H.: Development of vulnerability curves of buildings to windstorms using insurance data: An empirical study in South Korea, J. Build Eng., 34, 101932, https://doi.org/10.1016/j.jobe.2020.101932, 2021.